Embed Size (px)
Citation preview

ACID ROCK DRAINAGE PREDICTION MANUAL
MEND Project 1.16.1b
March 1991 Electronic revision: June 2008
�
�
�
�
�
�
�
�
�
�����������������
������ ���������
�
�
�������������������������� ��������������
���� ��������� ��������������� ���
���� �� ���� �� ���
�
�
�
�������������
�
���� ��������������
����� �� ����������� ������������������������
�
�
�
�����������
�
�������������������
� ��������������
�������������������������� �!�
�
�
���"�#����$�%�"�&��&���'�%����(��'��)�&����'�'��*��
���#�����'���#��+�,��-��������.�./�.�0�1���
�
�
���#��������������2���3� 455 6!6!.5!7 .6�8������
9�$����2���3� !�8� 455 6!6!.5!�
�
�
,�����'�#���������,��"�'����
�����'�:��;�%������������,��"�'�������������$
Acid Rock Drainage Prediction Manual
i
EXECUTIVE SUMMARY
Waste rock materials from mining, mineral processing and related operations, which contain sulphide minerals such as pyrite, have the potential to be the source of acidic contamination in the environment. Such contamination is termed acid rock drainage (ARD). The testing of waste materials can be carried out to provide data so that ARD can be predicted and controlled and to facilitate the implementation of cost effective waste management practices. Numerous laboratory and field test procedures to assess or predict generation of ARD are in use, or have been proposed. This Manual gives background information on ARD generation and its prediction and provides a guide to the components necessary for carrying out and implementing a prediction program. Detailed descriptions of recommended prediction procedures are provided. Alternative procedures are also presented. For each prediction method, the objectives, test principles, equipment and reagent requirements, test procedure, interpretation and reporting of results, advantages and disadvantages, are described. A selected bibliography and list of references is included. The development of new test procedures and revisions to existing procedures is ongoing. The Manual is designed to allow the inclusion of revisions and updates to registered subscribers.

Acid Rock Drainage Prediction Manual
ii
SOMMAIRE
Les stériles résultants de l’exploitation minière, du traitement des minéraux et d’autres opérations connexes, qui contiennent des minéraux sulfurés telle la pyrite, constituent une source potentielle de contamination environnementale par le drainage minier acide (DMA). Il est possible d’effectuer un contrôler des stériles afin d’obtenir des données permettant de prévoir et de contrôler le drainage minier acide et ainsi, de faciliter la mise en œuvre de méthodes rentables de gestion des déchets de roche. De nombreuses techniques sont actuellement utilisées en laboratoire et sur le terrain pour évaluer ou prévoir la formation du drainage minier acide et d’autres méthodes de contrôle ont également été proposées. Le manuel contient de la documentation de base sur la formation et la prévision du DMA et présente un guide des composantes requises pour mettre en œuvre et réaliser un programme de prévision. Il comprend une description détaillée de chaque méthode de prévision recommandée et présente des méthodes de rechange. Les objectifs, les principes sous-jacents les essais, le matériel, les exigences en ce qui concerne les réactifs, la méthode d’essai, l’interprétation et le compte rendu des résultats, les avantages et les inconvénients de chacune des méthodes font l’objet de descriptions. Une bibliographie et une liste de références sont incluses. Le développement de nouvelles méthodes d’essai et la révision des méthodes en usage à l’heure actuelle sont en cours. Le manuel est conçu de façon à permettre aux abonné(e)s d’inclure les révisions et les mises à jour.
Acid Rock Drainage Prediction Manual
iii
DISCLAIMER
The user of this report should assume full responsibility for any action taken as a result of the information contained in this manual. The authors, Natural Resources Canada (through the Mine Environment Neutral Drainage (MEND) program), and members of the MEND Steering Committee and their organizations, make no warranty of any kind with respect to the content and accept no liability, either incidental, consequential, financial or otherwise arising from the use of this publication.

Acid Rock Drainage Prediction Manual
iv
TABLE OF CONTENTS EXECUTIVE SUMMARY ............................................................................................................. i SOMMAIRE .................................................................................................................................... ii DISCLAIMER ................................................................................................................................. iii 1. HOW TO USE THIS MANUAL........................................................................................1 2. THE PROBLEM OF ACID ROCK DRAINAGE............................................................2 3. THE PREDICTION OF ACID ROCK DRAINAGE.......................................................3 4. AN INTEGRATED APPROACH TO PREDICTION.....................................................4 5. METHODOLOGY FOR EXAMINATION......................................................................6
5.1. The Approach to ARD Prediction..........................................................................7 5.2. Sampling...................................................................................................................10 5.3. Preliminary Sample Handling and Examination .................................................12 5.4. An Introduction to Static Prediction Tests ...........................................................13 5.5. An Introduction to Kinetic Prediction Tests.........................................................16 5.6. Field Tests.................................................................................................................19 5.7. Supplemental Prediction Procedures ....................................................................20 5.8. Other Supporting Tests and Examinations...........................................................21 5.9. Use and Maintenance of Bacteria ..........................................................................23 5.10. Analytical Requirements.........................................................................................24
6. THE METHODS FOR ARD PREDICTION....................................................................25
6.1. Selection Criteria and Guidelines ..........................................................................26 6.2. Principal Static Prediction Methods......................................................................27
6.2.1. Paste pH.........................................................................................................28 6.2.2. Standard Acid Base Accounting....................................................................30 6.2.3. Modified Acid Base Accounting ...................................................................34 6.2.4. B.C. Research Initial Test..............................................................................38
6.3. Other Static Prediction Procedures .......................................................................41 6.3.1. Net Acid Production ......................................................................................42 6.3.2. Alkaline Production Potential/Sulphur Ratio Test ........................................44
6.4. Principal Kinetic Prediction Methods ...................................................................47 6.4.1. Humidity Cells...............................................................................................48 6.4.2. Columns and Lysimeters ...............................................................................55 6.4.3. B.C. Research Confirmation Test..................................................................61
6.5. Other Kinetic Prediction Procedures ....................................................................65 6.5.1. Shake Flasks ..................................................................................................66 6.5.2. Soxhlet Extraction .........................................................................................70
7. REFERENCES AND BIBLIOGRAPHY ..........................................................................73

Acid Rock Drainage Prediction Manual
1
1. HOW TO USE THIS MANUAL
This manual is a guide for the application of chemical evaluation procedures for the prediction of acid generation from mining wastes and related materials. The manual provides detailed individual descriptions of current laboratory procedures used for prediction. Development of procedures as the understanding of acid generation increases is ongoing. Thus the description of procedures supplied in the manual can be replaced or supplemented as new methods or revisions to existing methods are developed. Registered subscribers to the manual will be informed of updates on procedures as they become available and can then purchase such updates. The manual also provides background information on acid generation from mine wastes; outlines the requirements for and summary methods of supplementary laboratory tests and procedures; discussion of sampling procedures and considerations; and summary discussions of analytical requirements and procedures. Updates and revisions to these sections of the manual will also be made available to registered subscribers. The details provided in the test procedure descriptions assume that:
a. the tests are to be conducted in a chemical, analytical, or similar laboratory, equipped with standard chemical reagents, glassware, equipment and instrumentation;
b. laboratory technicians or technologists, experienced in routine, and preferably Acid Rock Drainage (ARD) prediction, laboratory procedures, will perform the tests; and
c. standard laboratory procedures and protocol for assuring cleanliness of glassware and equipment, standardization of chemical reagents, correct sampling and sub-sampling of test materials, correct weighing practices, testing and analysis of blanks in test series, testing in duplicate when necessary, and other procedures and precautions required for precision and accuracy of test methods and results, will be carried out.
For some test and analytical methods, equipment and procedures will be required which may not be available in all laboratories. These will be noted and recommendations made for selecting suppliers of equipment and services. This manual does not provide complete detail on every aspect of acid generation from mining wastes. Where applicable, references to published technical reports and articles are given. A bibliography is provided so that users of the manual can obtain background information and specific details as required. Of particular note are (1) the EPA publication "Field and Laboratory Methods Applicable to Overburdens and Minesoils", and (2) the BC Acid Mine Drainage Task Force 1989 publication "Draft Acid Rock Drainage Technical Guide, Volume 1", both of which have been used to provide information for several of the sections of this manual. A comprehensive study of prediction procedures for the evaluation of 12 waste rock and tailings samples from Canadian base metal and gold mining operations was completed in 1989 (Coastech Research, MEND Project 1.16.1 (a), CANMET Contract 23440-79178/01-SO) and can be used to compare the results of procedures described in this manual.

Acid Rock Drainage Prediction Manual
2
2. THE PROBLEM OF ACID ROCK DRAINAGE
Acid rock drainage (ARD), often referred to as acid mine drainage (ARD), can be defined as the drainage that occurs as a result of natural oxidation of sulphide minerals contained in rock which is exposed to air and water. Although the phenomenon is usually associated with mining activity, it can happen wherever sulphide minerals are exposed to natural weathering. For mining operations, the exposure of sulphide minerals such as pyrite and pyrrhotite, and the absence of significant acid neutralizing capacity in the form of rock constituents such as limestone and dolomite, can result in the generation of acidic drainage from a number of different sources including:
• drainage from underground workings;
• surface run-off from open pit mine walls;
• seepage and run-off from waste rock dumps at metal mines and spoil heaps at coal mines;
• tailings impoundments;
• ore stockpiles and abandoned heap leach piles. In all cases, the events leading to the appearance of ARD are essentially the same. Sulphide minerals in the presence of oxygen (air), water and naturally occurring soil microorganisms, can be oxidized to produce low-pH water capable of mobilizing heavy metals and other soluble constituents contained in the waste. Once ARD formation has been initiated, the reactions can accelerate and are extremely difficult to arrest. The formation of ARD is a common problem to mining operations throughout the world. Acidic drainage causes severe corrosion problems to mining and ancillary equipment, and if uncontrolled, can cause a significant environmental impact due to metal toxicity to fauna and flora. In severe cases, ARD has caused significant loss of fisheries resources. Treatment of ARD and remediation measures cost the industry millions of dollars each year. In most cases, costs are much higher if the appearance of ARD is unexpected. Often, ARD does not develop for several years or decades after the start of mining operations, so that in some cases the problem appears long after the abandonment of operations. Attempts to implement remediation measures such as revegetation to alleviate ARD problems and enable mining companies to meet regulatory requirements upon closure have not been successful. Such companies are faced with the prospect of ongoing monitoring and treatment for indeterminate time periods.
Acid Rock Drainage Prediction Manual
3
3. THE PREDICTION OF ACID ROCK DRAINAGE
The management of acid rock drainage can be approached in essentially two ways; by control, collection and treatment of the problem once it has arisen, or by advanced planning and preventative management of the potential problem at an early stage of the mine project development. In the former case, effective control of acid formation by inhibition of the chemical and biological reactions contributing to the oxidation of sulphides has yet to be proven for the long term. Control of ARD through containment or prevention of drainage migration by the use of covers and seals is often difficult to implement successfully once ARD has been initiated. Collection and treatment of ARD is usually the only and, in the long run, the most costly solution. The second approach depends on the ability to anticipate the formation, extent, and impact of ARD before mining and milling begins. Accurate prediction potentially offers the most cost-effective means of reducing the impact of ARD on the environment and associated costs by allowing advance planning of sound waste management practices and maximum containment and effective treatment if ARD cannot be avoided. In either case, demonstration of the extent to which waste materials will potentially affect the environment is now a prerequisite for the permitting of new, or expansions of, mining and milling operations. Failure to appreciate or plan for the potential impact of mining and milling activities will delay the approval process and lead to high costs due to environmental problems during operation and after closure. The most reliable method of determining the weathering behaviour of a waste would be to perform an operational scale test on waste, as produced, in the actual environment at the mine site for a number of years, perhaps decades. Clearly, this would be impractical, so that smaller scale, shorter duration tests are used to predict the long term effects. Several laboratory ARD prediction test procedures are in use or have been proposed. These differ in their complexity, cost, and time required to achieve a predictive result. However, whichever method is used, characterization of waste materials and prediction of their long term behaviour in a realistic time scale is not a simple task. This is due to the complexity of weathering processes and their dependence on a large number of factors. In many cases these factors are only poorly understood. This is particularly true for the formation of ARD which is dependent on a large number of physical, chemical, biochemical, mineralogical, and hydrogeological phenomena. Full discussion of these phenomena is beyond the scope of this manual and the reader is referred to more detailed discussions of ARD and factors affecting its formation as provided in the bibliography. The success of prediction methods depends on the ability to determine the potential for sulphides contained in the rock to generate acid compared with the potential of the rock to neutralize acid. Furthermore, success also depends on the ability to determine the relative rates of these reactions. The rate of release of acidity from sulphide oxidation, the rate of release of alkalinity from carbonate dissolution, and the rate of acid neutralization by carbonate, may be quite different and affect the overall net outcome. An understanding of these reactions and the role of biochemical reactions, and consideration of the site specific conditions are important in developing an appropriate prediction test program.

Acid Rock Drainage Prediction Manual
4
4. AN INTEGRATED APPROACH TO PREDICTION
To ensure the highest chance of success, the prediction of the weathering behaviour of a material from a new mine development should be considered at as early a stage as possible and form part of an overall strategy including exploration activities, metallurgical process development, the permitting and approval process, the selection of disposal sites and methods, mine development, and the design of water management and treatment systems. Adequate time should be allocated to allow advance planning and a fully iterative approach to prediction and the formulation of the waste management plan. A typical prediction strategy is summarized schematically in Figure 4.l.
Figure 4.1 Summary of an ARD Prediction Strategy
EXPLORATIONMINE DEVELOPMENT
METALLURGICAL TESTING
SAMPLINGPROGRAM
ARD PREDICTIONTEST PROGRAM
SELECTION ANDVERIFICATION OF
DISPOSAL AND TREATMENT SCHEMES
SATISFACTORYSCHEME ?
APPROVAL, OPERATIONAND MONITORING
PERMITTING PROCESS
SITE DATABASE PROCESS DESIGN
NO
YES
Acid Rock Drainage Prediction Manual
5
In this scheme, samples of waste rock from exploration core or mine development, selected in a properly designed sampling program, or tailings and other products produced in a metallurgical test program, are subjected to an ARD prediction test program. Although shown as a single box in the schematic, several iterative and interdependent test and analytical procedures can be performed to fully characterize the sample with respect to its potential environmental impact. These procedures will be discussed and their interdependence shown schematically in detail in the Section 5: Methodology for Examination. The data derived from the prediction testing program can be used in the selection of a disposal scheme and in the overall waste management plan. If required, the chosen scheme of disposal can be further evaluated in larger scale laboratory or field trials. The suitability of the scheme both from a technical and permitting viewpoint can then be assessed and alternative schemes devised and verified if necessary. Further details and recommendations on the timing and sequence of events in an integrated prediction strategy can be found in the BC Acid Mine Drainage Task Force 1989 publication “Draft Acid Rock Drainage Technical Guide, Volume 1”

Acid Rock Drainage Prediction Manual
6
5. METHODOLOGY FOR EXAMINATION
The scope of a program to obtain information on the weathering characteristics of a sample, specifically the potential for the generation of ARD, might comprise only a few simple tests requiring a short period of time and a modest budget, or could involve extensive testing and analysis in a more complex program lasting several months and with much higher costs. The degree of work required for an evaluation will depend on the particular stage of the mine project development and approval process, and on a number of site-specific factors. This section of the manual provides guidelines to the application of the individual prediction tests, and details of procedures and considerations which comprise the overall methodology for examination. As already stated, not all tests and procedures will be required in every evaluation. The topics discussed in the following sub-sections are as follows: Section 5.1 The approach to ARD prediction 5.2 A discussion of sampling and sample handling 5.3 Preliminary sample examination and testing 5.4 An introduction to static prediction tests 5.5 An introduction to kinetic prediction tests 5.6 The use of field prediction tests 5.7 Supplemental prediction procedures 5.8 Other supporting tests and examinations 5.9 A discussion on the use and maintenance of bacteria 5.10 Analytical requirements and procedures Detailed descriptions of the prediction methods are presented in Section 6.

Acid Rock Drainage Prediction Manual
7
5.1.THE APPROACH TO ARD PREDICTION
The purpose of ARD prediction testing is to provide sufficient data to satisfy the mine operator/owner and the regulatory authorities that the potential for ARD generation can be predicted and controlled. The level of effort required to achieve this objective will be appropriate to the stage of project development. This has been discussed in detail in the BC Acid Mine Drainage Task Force 1989 publication "Draft Acid Rock Drainage Technical Guide, Volume 1". The terminology used to describe the stages of a mine project development from the perspective of environmental evaluation and development review differs from province to province in Canada. In general terms, they can be listed as follows:
• Exploration; • Disclosure or Prospectus; • Preliminary and Detailed Environmental Impact Evaluation; • Permitting. The overall procedure for ARD prediction for each stage is outlined in Figure 5.1.1. The scope of testing increases for each stage of the process.
The primary components of a mine from the perspective of ARD generation are:
• the mine itself (pit walls, underground workings); • waste rock/spoils/overburden dumps; • ore stockpiles; • the mill site, including roadways, berms and embankments; and • tailings impoundments. These mine components have differing potentials to generate ARD as a consequence of differences in physical conditions, geochemical characteristics, and exposure to climatic conditions. As a result, the environmental impact of the mine must be determined on the basis of the potential impact of each component evaluated in terms of the anticipated site conditions. The prediction of ARD can be based on or achieved through one or more of the following routes:
• previous experience with the mine waste, or by geographical mining comparisons; • paleoenvironmental and geological models; • chemical, mineralogical, and physical analyses of the waste; • tests to determine the readily extractable metals; • static prediction tests designed to quantify the balance between the acid producing and acid consuming components of the waste; • laboratory and field kinetic prediction tests designed to determine the rates of mineral dissolution, acid generation and metal release; and • mathematical models.

Acid Rock Drainage Prediction Manual
8
Figure 5.1.1 Procedure for Evaluating ARD Potential
(Adapted from BC AMD Task Force Draft Technical Guide, 1989)
Acid Rock Drainage Prediction Manual
9
The route or routes chosen for ARD prediction can depend on the particular stage of the mine project development. At the Exploration or Disclosure stages, comparison with similar projects combined with simple analysis and static testing will usually suffice. At the Preliminary or Detailed Environmental Assessment Stage, increasingly comprehensive analysis, including static and kinetic testing on a larger number of samples is required. Modelling can be used at this stage to extrapolate data to longer periods of time. Use of previous experience or geographical comparisons involves the examination of prediction test records and/or the sampling of drainage from abandoned or operating mines near to the project under study. Extrapolations can also be made from similar mining operations in related geological environments. Paleoenvironmental models can be used to examine the regional depositional environment of the sulphide minerals contained in the component under study. It is known that not only do different sulphide minerals exhibit different reactivities in weathering, but that the rate and extent of weathering of samples of the same mineral formed in different depositional environments can vary widely. Geological models are valuable in estimating the location and size of potentially acid generating zones. Chemical, mineralogical, and physical analysis of waste components are carried out usually as part of preliminary characterization of the material, often in combination with the above two routes. These analyses can also provide a useful and important means of extending the scope of detailed static and kinetic prediction test programs. Although not usually included in ARD testing protocol, tests to determine readily extractable metals are often advised to provide data on the short term leaching characteristics of waste components and as base case data prior to kinetic testing. Static prediction tests are simple tests to compare the balance between the acid generating components (sulphides) and the acid consuming components (principally carbonates) of the waste. Kinetic prediction tests attempt to model over time the acid producing and consuming processes, including a prediction of drainage quality, in the laboratory or field. The use of models for predicting the formation of ARD is a recent development. The objective of models is to quantitatively predict mine drainage quality that will occur beyond the time framework of the laboratory or field kinetic test. These models are complex, have not been used extensively to date and require verification. This manual is primarily concerned with the empirical prediction routes which are described in detail in Section 6.
Acid Rock Drainage Prediction Manual
10
5.2. SAMPLING
Sampling has been defined in Taggart's Handbook of Mineral Dressing as "the operation of removing a part convenient in size for testing, from a whole which is much greater in bulk, in such a way that the proportion and distribution of the quality to be tested are the same in both the whole and the part (sample) to be tested". Thus the goal of a sampling program should be to provide samples that are completely representative of the whole as regards all aspects except bulk. One fundamental aspect of mineral deposits is the inherent variability of the mineral assemblages and composition, so that satisfying the definition and goals stated above for the sampling of a mineral deposit for the purposes of ARD testing is often difficult to achieve with a high degree of certainty. Every property presents its own particular set of circumstances and many factors must be considered, a full discussion of which is beyond the scope of this manual. It is recommended that anyone involved in the collection of samples or otherwise involved in an ARD prediction study give due consideration to this important aspect of the program and, if necessary, do some background reading on the subject. Discussion and presentation of views on sampling pertaining to ARD prediction programs can be found in the EPA manual "Field and Laboratory Methods Applicable to Overburdens and Minesoils" and the BC Acid Mine Drainage Task Force "Draft Acid Rock Drainage Technical Guide, Volume 1". The following comments and brief guidelines on sampling are offered here: • Samples from the primary components of the mine (see Section 5.1) for ARD prediction
testwork can be selected on the basis of the best judgement of the exploration geologist or mining engineer;
• The sampling method used (channelling, chip, grab, diamond drilling, reverse circulation drilling, etc) should be appropriate to the local geology and mineralogy. Sampling errors can be strongly affected by the method employed;
• Samples should be fresh with no signs of oxidation. For reactive (sulphide) samples, minimal crushing should be applied until ready for testing. Such samples should be sealed in plastic bags and, if necessary, refrigerated to minimize oxidation. In some cases, it is useful to know the degree of oxidation that a sample has undergone prior to testing. This can be evaluated in preliminary testing and might provide useful predictive data. (See also Section 5.3);
• Sampling should ideally be carried out to provide samples representative of all lithological units related to the mine development plan and which also represent the different areas in the mine plan. This will identify not only the different geological units likely to provide a potential ARD problem, but also the results will be related to the timing, destination and placement of waste rock;
Acid Rock Drainage Prediction Manual
11
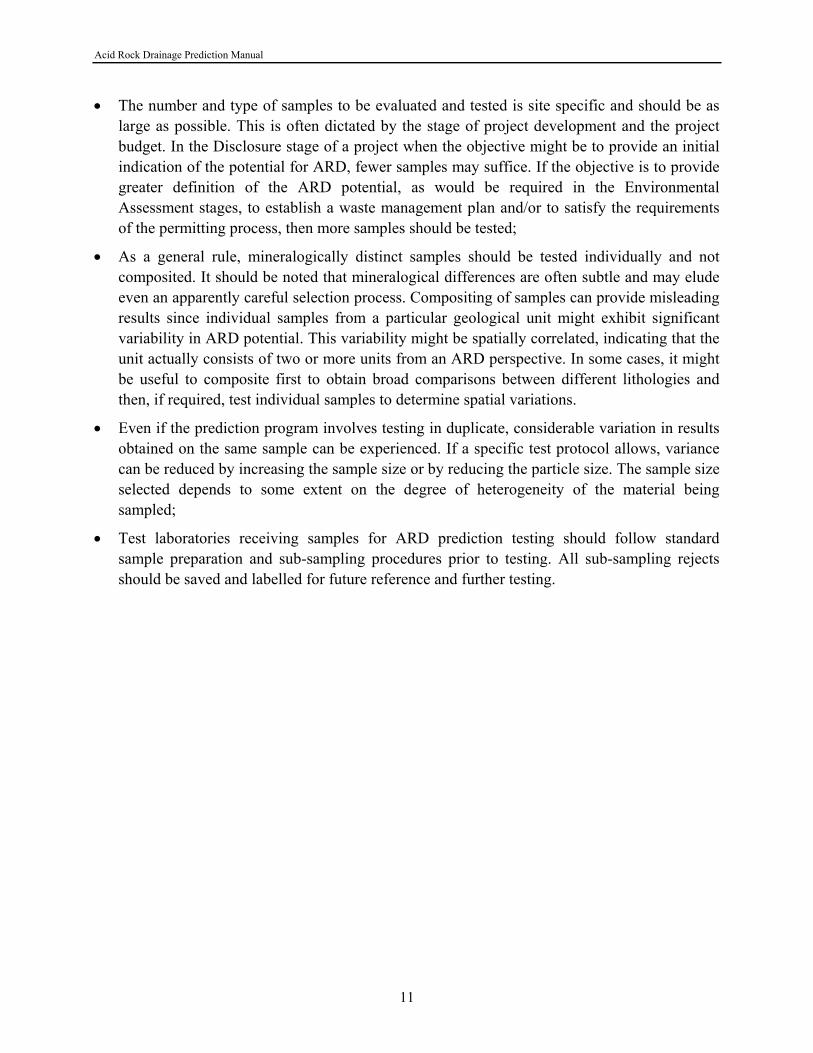
• The number and type of samples to be evaluated and tested is site specific and should be as large as possible. This is often dictated by the stage of project development and the project budget. In the Disclosure stage of a project when the objective might be to provide an initial indication of the potential for ARD, fewer samples may suffice. If the objective is to provide greater definition of the ARD potential, as would be required in the Environmental Assessment stages, to establish a waste management plan and/or to satisfy the requirements of the permitting process, then more samples should be tested;
• As a general rule, mineralogically distinct samples should be tested individually and not composited. It should be noted that mineralogical differences are often subtle and may elude even an apparently careful selection process. Compositing of samples can provide misleading results since individual samples from a particular geological unit might exhibit significant variability in ARD potential. This variability might be spatially correlated, indicating that the unit actually consists of two or more units from an ARD perspective. In some cases, it might be useful to composite first to obtain broad comparisons between different lithologies and then, if required, test individual samples to determine spatial variations.
• Even if the prediction program involves testing in duplicate, considerable variation in results obtained on the same sample can be experienced. If a specific test protocol allows, variance can be reduced by increasing the sample size or by reducing the particle size. The sample size selected depends to some extent on the degree of heterogeneity of the material being sampled;
• Test laboratories receiving samples for ARD prediction testing should follow standard sample preparation and sub-sampling procedures prior to testing. All sub-sampling rejects should be saved and labelled for future reference and further testing.

Acid Rock Drainage Prediction Manual
12
5.3. PRELIMINARY SAMPLE HANDLING AND EXAMINATION
Samples received at the laboratory for ARD prediction testing should be examined as soon as possible after receipt so that appropriate handling and storage procedures can be practised if required, particularly if the test program cannot be started right away. This can be very important, for example, for samples which should be maintained in a refrigerated state due to the presence of reactive sulphides as discussed in Section 5.2. Organization, accurate labelling of samples, and cross-checking with sample designations supplied with the sample shipment should be carefully done to avoid confusion when results of tests are reported. Samples, as-received, should be inspected and observations pertinent to the ARD evaluation should be noted. This can include the noting of obvious signs of oxidation of sulphides and other weathering. Some samples, particularly mill tailings, might be received with a high water content. This should be noted and, if necessary, a water sample taken for possible analysis. Large samples should be sub-sampled using standard laboratory procedures and precautions, and the rejects stored for possible future testing. Sub-samples should then be prepared for testing and analysis according to the specific requirements of the test or analytical procedure. Wet samples are usually filtered and dried prior to preparation. To avoid oxidation and other alteration of the sample which might affect the predictive result, high temperatures should not be used to dry samples. Air drying or drying at temperatures < 60ºC is recommended. Drying in an inert (e.g. nitrogen) atmosphere should be considered for very reactive samples. Size reduction can be carried out using crushers (jaw and cone) followed by pulverizers. Equipment must be kept clean to avoid cross-contamination of samples. Size reduction should not be carried out until the predictive test can be performed.

Acid Rock Drainage Prediction Manual
13
5.4. AN INTRODUCTION TO STATIC PREDICTION TESTS
Several ARD prediction tests and methods are in use or have been proposed and they differ in: a) complexity of procedure and data interpretation; b) time required to achieve a predictive result; and c) cost of carrying out the test. Several studies have been carried out to compare the different methods, the most recent of which was the Coastech Research study "Investigation of Prediction Techniques for Acid Mine Drainage", performed for Energy Mines and Resources under the auspices of the MEND program. A principal conclusion from this study was that it is unlikely that any one test can produce all the information necessary to evaluate all mine wastes. It is more likely that a combination of two or more tests will provide a more reliable assessment. Procedures can be broadly divided into two categories, static and kinetic tests, although numerous other tests are available for specific purposes of characterization. In this section, static prediction tests are introduced. Detailed descriptions of the tests, including a discussion of their advantages and disadvantages are provided in Section 6. Kinetic prediction tests are introduced in Section 5.5. _____________________________________________________________________________ Static tests are designed primarily to examine the balance between the acid producing components (sulphide minerals such as pyrite) and the acid consuming components (predominately carbonate minerals) of the mine waste sample. The term static is used since the tests do not consider the relative rates of acid production and consumption. Several static tests are in use. The most employed is the acid base accounting procedure in which excess hydrochloric acid is added to a known weight of the sample to react with the carbonate and other acid consuming minerals. Once reaction is complete, the quantity of excess acid remaining is determined by titration with alkali, so that the acid that was consumed can be calculated. This value can then be compared with, or balanced against, the theoretical amount of acid that could be produced from the same weight of sample if all the contained sulphur, determined by analysis, was converted to sulphuric acid by oxidation. At the static testing stage, detailed analysis of the sample is not usually required, although in addition to the total sulphur (or sulphur species) analysis required for the AP calculation, an assessment of the dominant forms of neutralizing minerals (carbonates, hydroxides) might also be important. A paste pH determination of the sample is also usually carried out.
Acid Rock Drainage Prediction Manual
14
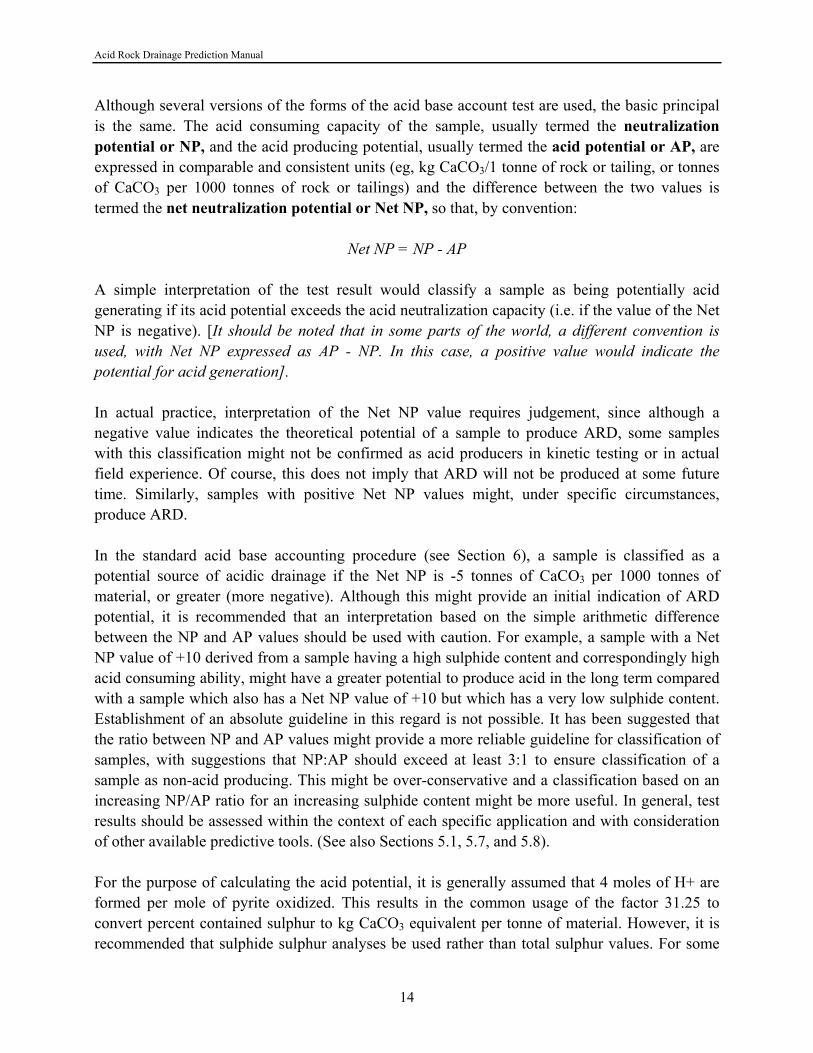
Although several versions of the forms of the acid base account test are used, the basic principal is the same. The acid consuming capacity of the sample, usually termed the neutralization potential or NP, and the acid producing potential, usually termed the acid potential or AP, are expressed in comparable and consistent units (eg, kg CaCO3/1 tonne of rock or tailing, or tonnes of CaCO3 per 1000 tonnes of rock or tailings) and the difference between the two values is termed the net neutralization potential or Net NP, so that, by convention:
Net NP = NP - AP A simple interpretation of the test result would classify a sample as being potentially acid generating if its acid potential exceeds the acid neutralization capacity (i.e. if the value of the Net NP is negative). [It should be noted that in some parts of the world, a different convention is used, with Net NP expressed as AP - NP. In this case, a positive value would indicate the potential for acid generation]. In actual practice, interpretation of the Net NP value requires judgement, since although a negative value indicates the theoretical potential of a sample to produce ARD, some samples with this classification might not be confirmed as acid producers in kinetic testing or in actual field experience. Of course, this does not imply that ARD will not be produced at some future time. Similarly, samples with positive Net NP values might, under specific circumstances, produce ARD. In the standard acid base accounting procedure (see Section 6), a sample is classified as a potential source of acidic drainage if the Net NP is -5 tonnes of CaCO3 per 1000 tonnes of material, or greater (more negative). Although this might provide an initial indication of ARD potential, it is recommended that an interpretation based on the simple arithmetic difference between the NP and AP values should be used with caution. For example, a sample with a Net NP value of +10 derived from a sample having a high sulphide content and correspondingly high acid consuming ability, might have a greater potential to produce acid in the long term compared with a sample which also has a Net NP value of +10 but which has a very low sulphide content. Establishment of an absolute guideline in this regard is not possible. It has been suggested that the ratio between NP and AP values might provide a more reliable guideline for classification of samples, with suggestions that NP:AP should exceed at least 3:1 to ensure classification of a sample as non-acid producing. This might be over-conservative and a classification based on an increasing NP/AP ratio for an increasing sulphide content might be more useful. In general, test results should be assessed within the context of each specific application and with consideration of other available predictive tools. (See also Sections 5.1, 5.7, and 5.8). For the purpose of calculating the acid potential, it is generally assumed that 4 moles of H+ are formed per mole of pyrite oxidized. This results in the common usage of the factor 31.25 to convert percent contained sulphur to kg CaCO3 equivalent per tonne of material. However, it is recommended that sulphide sulphur analyses be used rather than total sulphur values. For some

Acid Rock Drainage Prediction Manual
15
samples, the use of total sulphur gives erroneously high results due to the presence of sulphur species, notably sulphate, which does not contribute to ARD formation. As a reasonable approximation, sulphide sulphur contents can be calculated as the difference between total sulphur and sulphate sulphur analyses. For some samples, the sulphate sulphur analysis might provide an indication of the degree of weathering undergone by the sample. The presence of sulphate resulting from prior oxidation of sulphides might exacerbate the ARD problem in the short term due to solubilization and hydrolysis reactions upon further weathering. For some samples, it might be necessary to correct for the contribution of other forms of sulphur, for example organic and sulphur associated with the mineral barite. The latter form of sulphur does not usually report as sulphate in analyses in which the sample is digested in hydrochloric acid under non-oxidizing conditions. A significant barium value in ICP-AES (Inductively Coupled Plasma Atomic Emission Spectrometry) or AAS (Atomic Absorption Spectrophotometry) analysis would highlight this potential problem. Another static test similar to acid base accounting is the B.C. Research Initial Test which utilizes sulphuric acid in the NP determination. Less widely used is the so-called APP/S Ratio test. A recent development is a test known as the Net Acid Production test which does not require sulphur assays to assess the balance between acid consuming and acid producing reactions. These and other static tests are described in Sections 6.2 and 6.3 Despite their simplicity, interpretation of static test data can, as discussed above, require considerable judgement and experience and have site-specific conclusions. Complete reaction of both the sulphides and carbonates is assumed with no consideration given to kinetics or chemical equilibria. In this regard, the assumptions made concerning the stoichiometry of the acid producing reactions are currently under review. Similarly, increasing understanding of the complexity of the acid consuming reactions is resulting in the need to examine the interpretation of neutralization potential data. Static tests also do not provide any prediction of drainage quality. However, they do allow simple, rapid and low cost screening of samples to give a preliminary yes/no predictor for acceptable or unacceptable water quality. Samples which are judged on the basis of static testing to be potential sources of ARD, and samples for which ARD potential is uncertain, can be further evaluated in kinetic prediction tests.

Acid Rock Drainage Prediction Manual
16
5.5. AN INTRODUCTION TO KINETIC PREDICTION TESTS
The objective of kinetic tests is to predict the long term weathering characteristics of a mine waste material as a function of time. Specifically, objectives might include: • provide confirmation of ARD potential; • assess the rates of sulphur oxidation and acid generation; • assess the rate of depletion of neutralization potential; • determine the relationship, if any, between the onset of ARD and the depletion of neutralization potential; • determine the effect of bacteria; • estimate the degree of metals leachability and provide an indication of cation/anion concentrations that might be expected in the drainage emerging from the waste; and • select a particular test strategy to evaluate different waste management plans and control strategies. Kinetic tests are usually carried out only if static test evaluation indicates the potential for ARD generation or if the result is uncertain (see Section 5.4). As previously discussed in Section 3, the most reliable prediction test would be one which replicates exactly the actual field conditions. In practice, however, this is not possible because of the time factor, so that prediction testing is always a short term assessment of a longer term phenomenon. The difficulty in designing a kinetic prediction test, therefore, is either to have a test which attempts to model actual field conditions, in which case the test will often be of too short a duration, or to provide accelerated conditions, in which case the test might be unrealistic. In the former case, kinetic tests can fail to demonstrate the onset of ARD generation due to the inability to deplete, in a reasonable experimental time frame, the neutralization capacity down to levels at which the effects of oxidative (ARD producing) activity can be observed and measured. This can occur for a sample with a relatively low NP value, say 30 tonnes CaCO3 per 1000 tonnes or lower, even though static testing might indicate that the sample has a significantly negative Net NP value. Accelerated weathering conditions can be promoted to expedite the test through, for example, fine crushing or grinding, temperature control, addition of bacteria, and/or pre-acidification of the sample. Judgement must be exercised to decide whether such conditions are justified and that results can be interpreted clearly. In either case, it is important to provide consistent test conditions so that results from test to test can be compared. Consistency and standardization of procedure might also allow good correlation of laboratory test results with actual field behaviour so that whatever test procedure is adopted, there will be greater confidence in the ARD prediction for unknown samples.

Acid Rock Drainage Prediction Manual
17
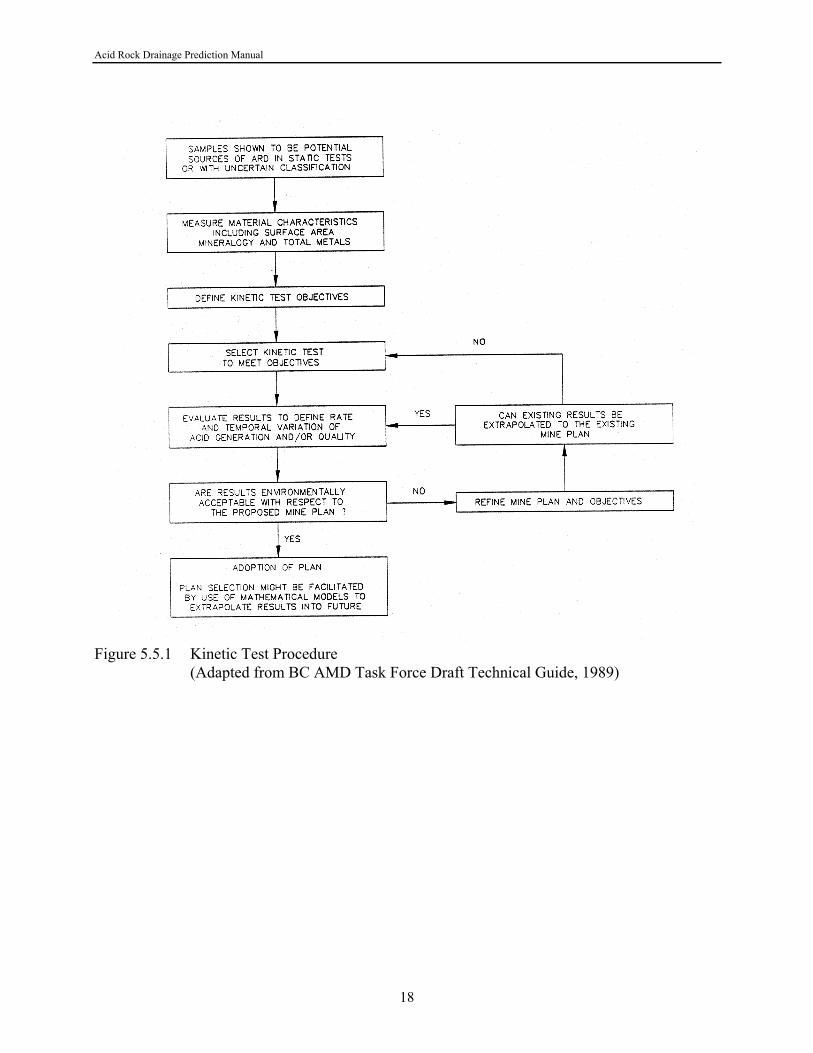
An approach to a kinetic test program is shown schematically in Figure 5.5.1. Detailed descriptions of kinetic test procedures are provided in Section 6. Comparison of Figures 4.1 and 5.5.1 will indicate how kinetic testing fits in with the overall prediction strategy. Further sample characterization is usually desirable before carrying out a kinetic test program to aid in the interpretation of results. In addition to the analyses carried out during prior static testing, a detailed head analysis, usually by ICP-AES (on a suitably dissolved sample), is normally required to highlight elements that might be of concern so that the mobility of metals during testing can be quantified. Since, the rates of acid generation and neutralization depletion are also an objective in many kinetic tests, the determination of specific surface area should be considered so that rates can be calculated on a common basis to allow comparison between different sets of data. Mineralogical information is often useful as an indicator of potential weathering behaviour. Ancillary tests and examinations are described in Section 5. 8. There are several tests of different types that can be used to meet the objectives of kinetic testing. These vary considerably in complexity, duration, cost, and the kind of data that can be derived. The most popular kinetic test is probably the humidity cell test which aims to simulate geochemical weathering by subjecting a sample to alternating cycles of dry air flow, moist air flow, and leaching to remove products of oxidation and dissolution for analysis. Another kinetic test which has been popular in Canada is the B.C. Research Confirmation test which is a bacterial oxidation test designed to determine if sulphide-oxidizing bacteria can produce more acid from oxidation of pyrite in a sample than can be consumed by an equal quantity of the sample. Another popular kinetic test procedure is to use columns, sometimes called lysimeters, to simulate weathering of rock or tailings in flooded or percolation leach conditions. Column tests are generally of a larger scale than other kinetic tests and are therefore suited to the observation of the effects of control strategies such as covers and blending. Other tests include the so-called shake flask test and the Soxhlet extraction test.
Acid Rock Drainage Prediction Manual
18
Figure 5.5.1 Kinetic Test Procedure (Adapted from BC AMD Task Force Draft Technical Guide, 1989)
Acid Rock Drainage Prediction Manual
19
5.6. FIELD TESTS
Prediction tests performed in the field are of two types: 1) simple tests and procedures which do not require sophisticated laboratory apparatus,
analytical equipment, or non-portable instrumentation to be able to achieve an initial screening of samples, either directly at the point of sampling or a central remote location; and
2) large scale kinetic tests performed at the specific site at which the various geologic units will be produced and deposited.
In the first category of tests, investigation is limited to the observation and measurement of sample characteristics such as: • apparent mineralogy (presence of sulphides and other identifiable minerals); • visible signs of oxidation and other weathering; • measurement of paste pH; • pH measurement of drainages; and • fizz testing to estimate quantity of carbonate minerals (Section 6.2) Such testing and observations provide generalized field predictions that can facilitate decisions regarding the need for laboratory analyses and testing. Reference can be made to the EPA publication "Field and Laboratory Methods Applicable to Overburdens and Minesoils" for further reading on field observations. Several of the static type tests (see Section 5.4) can be performed in the field with a simple laboratory set-up, although the ability to perform analyses (sulphur species, carbonate) is likely to be limited. The Net Acid Production test under development (see Section 6.3) is a static procedure that promises to provide the balance between acid producing and acid consuming components of a sample without the need for sulphur analysis. Kinetic tests performed in the field offer the advantage over laboratory tests of determining the rates of acid generation and neutralization reactions under actual on-site climatic conditions. Tests can be set-up to evaluate the drainage quality emerging from either relatively small, contained piles of a few tonnes of rock, or from larger open piles of rock containing many tonnes. By placing the test rock on an impervious base, with control over the collection of drainage, the volume and quality of drainage resulting from either solely natural or supplemented precipitation events can be periodically determined. The larger scale of the test potentially allows a more realistic assessment of the ARD generation process and a better evaluation of control options such as limestone blending or covers than can be achieved in laboratory kinetic tests. The potential disadvantages of kinetic tests conducted in the field are higher costs, a long time period required to meet the test objectives due to the lack of control possible in laboratory tests, and variations in results due to changing climatic conditions leading to complex data interpretation. However, field tests will usually be conducted in combination with, or following, laboratory kinetic testing, so that the extrapolation of data from laboratory/field testing to actual field conditions is less uncertain.
Acid Rock Drainage Prediction Manual
20
5.7. SUPPLEMENTAL PREDICTION PROCEDURES
Other test procedures which are used for ARD prediction purposes are available but, due to their specialist, non-routine nature, a detailed description is not included in Section 6. However, in some detailed evaluations, certain of these tests might be valuable in providing useful supplemental information to data obtained in the more routine test programs. Discussion of two supplemental test procedures follows. A test developed by V.P. Evangelou at the University of Kentucky, termed Manometric Carbonate Pressure Analysis, attempts to determine the rates of reaction of carbonate species in order to predict the effectiveness of the neutralizing components contained in a sample. As discussed in Section 5.4, the speciation of the neutralization components might, in specific circumstances, be important since the presence of carbonates, as might be determined in total by static testing, does not necessarily mean that these carbonates will be completely available to neutralize acidity generated from pyrite oxidation. The method claims to be able to differentiate and quantify the three carbonate minerals calcite, dolomite and siderite to allow the prediction of the effectiveness of a waste in controlling ARD. Published data by the University of Kentucky group indicates that the method has application, although the Coastech Research 1989 prediction test comparison study produced inconclusive results in establishing the reliability of the method for the samples evaluated for metal mines. A test which attempts to provide a similar differentiation between the reactivities of sulphides, particularly pyrite, has been developed by R.W. Hammack of the United States Bureau of Mines. The objective of this test, termed Evolved Gas Analysis, is to assess and compare the behaviour of the sulphide components of waste samples by determining the temperature of ignition of the minerals through the use of an infrared analyzer to measure the evolution of sulphur dioxide. The technique is claimed to provide a better prediction of ARD potential when used in conjunction with static testing, than does static testing alone.

Acid Rock Drainage Prediction Manual
21
5.8. OTHER SUPPORTING TESTS AND EXAMINATIONS
In addition to the static, kinetic and other prediction procedures themselves, other tests and sample examinations can be useful to supplement data, aid in interpretation, and reduce uncertainties where they exist in the predictive result. These tests can be chemical, physical, meteorological, biological and/or mineralogical in nature. Detailed descriptions of many useful supporting tests are contained in the EPA publication “Field and Laboratory Methods Applicable to Overburdens and Minesoils”. Supporting chemical/analytical tests include determination of the following parameters:
• sulphate and non-oxidizable forms of sulphur. (See also Section 5.4);
• metals analysis of sample and associated pore water (ICP-AES analysis);
• specific conductance of sample pore water;
• lime requirement;
• cation exchange capacity;
• CO2 determination (carbonate analysis); and
• chemistry of groundwater and receiving waters. Physical parameters which may be useful indicators in ARD prediction programs include:
• particle size/surface area;
• bulk and particle density;
• porosity and permeability of a rock mass; and
• physical weathering such as slaking under field conditions, including freeze/thaw behaviour Meteorological factors are important in determining the extent and rate of ARD generating reactions. Meteorological data (precipitation frequency and quantities, mean monthly temperatures) should be collected for the mine site and used to assist in the design of kinetic test procedures and, particularly, in the interpretation of results. It is important to note that deposition of waste in cold, northern locations does not preclude the onset of ARD. Oxidation of pyrite is strongly exothermic and since acid formation can initiate in a microenvironment protected from the cold, once initiated, ARD generating reactions can proliferate to create a favourable macroenvironment. In cold, northern climates, the extent of the zone of oxidation within a waste rock pile or tailings deposit will then be a function of factors including the physical configuration of the pile/deposit (shape, size) and the external meteorological influence (cold penetration/ temperature profile). Biological influences on ARD formation are substantial so that in some circumstances, a total microbial count, determination of the most probable number of sulphur-oxidizing bacteria in deposited solids, waste, tailings and drainages, and/or evaluation of bacterial activity by conducting a ferrous-iron oxidation test, might aid in identifying areas of high ARD potential. Biological factors are discussed in more detail in Section 5.9.
Acid Rock Drainage Prediction Manual
22
Mineralogical factors play a dominant role in the reaction and interaction of acid generating (oxidizable) and acid consuming components of mine waste and other materials (see also Section 5.4). With respect to acid producing potential, reactivity is known to vary widely between samples taken from different locations on the same mine site and between samples of the same mineral from different sources. A large number of mineralogical factors are responsible for these differences in ARD potential and weathering behaviour including:
• type and quantity of sulphide mineral (pyrite, pyrrhotite, marcasite, or non-ferrous sulphides);
• semi-conductor properties;
• crystal size;
• texture and morphology;
• anisotropy;
• degree of rock fracture;
• spatial relationship with host rock, particularly acid consuming minerals; and
• type and quantity of acid-consuming minerals. Many mineral species can consume acid, although the kinetics and extent of reaction can vary widely. Carbonate minerals offer the highest neutralization capacity although values can vary considerably, with calcium carbonate (calcite, limestone) generally having a greater capacity than dolomite (calcium-magnesium carbonate), which in turn is more effective than siderite (iron carbonate). (See also Section 5.7). Other acid consuming minerals such as aged oxides and feldspars are generally slower to react but might represent a significant source of long term neutralization in relatively stagnant flow systems. In static testing, the distinction between the various acid consuming minerals and their neutralization capacity is not made and can lead to significant over or underestimation of neutralization potential. (See also Sections 5.4 and 5.7).
Acid Rock Drainage Prediction Manual
23
5.9. USE AND MAINTENANCE OF BACTERIA
Reactions involving the action of bacteria and other microorganisms can exert a major influence on the weathering characteristics of a material deposited in the environment, particularly on the formation of ARD. Sulphide minerals in the presence of water and oxygen (air) will undergo oxidation in the presence of bacteria to form sulphuric acid and cause the mobilization of associated metals into solution. The most widely studied microorganism from an ARD perspective is the bacterium Thiobacillus ferrooxidans which can be found wherever sulphide minerals are exposed to air and water. This organism has a remarkable ability to oxidize sulphides such as pyrite at high rates, particularly once the pH of the micro or macro-environment in which it is living is below around 3.5. Its action of direct oxidation of sulphides and in the regeneration of ferric iron, itself a powerful oxidant of sulphide minerals, is in fact exploited by the mining industry in copper and uranium heap, dump, and in-situ leaching operations. In mining wastes, bacterial action, once started, is very difficult to arrest, and once the pH has reached lower values (<3.5), ARD generation rates can accelerate. In kinetic testing, a culture of T. ferrooxidans is sometimes added to determine the effect of bacterial action. In some cases, the test protocol calls for bacterial addition in combination with acidification of the sample to bring the pH into a range in which this particular bacterium can function (see also Section 5.5). However, a large number of different microorganisms are known to thrive in the varying hydrogeological, geochemical, and mineralogical conditions that exist not only at the oxidation site at the sulphide mineral surface within the waste itself, but also beyond in the soils and drainages of the downstream environment. Their action can influence the oxidation of sulphides in higher pH ranges (>3.5) and within different temperature zones (> 45ºC), and can modify effluent quality substantially due to oxidation, reduction, solubilization, precipitation, absorption, and other mechanisms. Laboratory kinetic tests largely ignore these other biological phenomenon. In field tests, the use of minesite water and other local drainages containing indigenous microorganisms could be an advantage in this regard. The use of bacteria in kinetic testing requires special knowledge and experience. Several studies reported in the literature give conflicting evidence of the role and extent of bacterial action. This is likely due in many cases to poor culture adaptation, and to inexperience in growing bacteria and maintaining cultures in a suitable metabolic state for testing purposes. Such inconsistencies make comparison of data from different laboratories very uncertain. A large number of factors affect the performance of bacteria in a specific test environment, including the following:
• type of microorganisms; • previous culture history and conditions of culture maintenance;

Acid Rock Drainage Prediction Manual
24
• degree of adaptation to the test material; • the number of bacteria added to the test; • growth (test) conditions including, pH, temperature, and degree of aeration, length and duration of leach cycles (if applied), overall length of test; • availability and concentration of oxidizable substrate (sulphide minerals); • availability and concentration of essential growth nutrients; and • presence of potentially toxic or inhibiting factors in the test material or in the leach solutions It is strongly recommended that tests to determine the effects of bacterial action on ARD generation are carried out by a properly equipped laboratory under the guidance of personnel experienced in the growth, maintenance, and application of sulphide-oxidizing bacteria. 5.10. ANALYTICAL REQUIREMENTS
Detailed descriptions of the many and varied analytical requirements and options that accompany specific prediction test methodologies is beyond the scope of this manual. Reference should be made to standard analytical method texts for instructions and guidance in performing analyses in your own laboratory. Alternatively, the services of commercial analytical laboratories experienced in the analytical procedures of interest should be retained. Many of the analytical procedures recommended for use with specific prediction tests in Section 6 are to be found in "Standard Methods for the Examination of Water and Wastewater" published by the American Public Health Association. The EPA publication "Field and Laboratory Methods Applicable to Overburdens and Minesoils" also contains detailed descriptions of analytical methods particular to evaluations of ARD potential. The following list of analytical requirements is not exhaustive but contains most of the requirements that could be associated with the prediction tests described in Section 6:
Analysis of Solids Analysis of Solutions total sulphur pH sulphate sulphur redox potential (ORP) sulphide sulphur ferrous/ferric ion elemental sulphur acidity (total) organic sulphur acidity (free) barytic sulphur alkalinity carbonate (CO2) conductance metals by AAS sulphate metals by ICP-AES metals by ICP-AES metals by other methods metals by AAS metals by other methods
Acid Rock Drainage Prediction Manual
25
6. THE METHODS FOR ARD PREDICTION
This section of the manual contains detailed descriptions and supporting information for the ARD prediction tests and procedures as follows: Section 6.1 Selection criteria and guidelines
6.2 Principal static prediction methods • Paste pH • Standard acid base accounting • Modified acid base accounting • B.C. Research Initial test
6.3 Other static prediction methods
• Net acid production • APP/S ratio
6.4 Principal kinetic prediction methods
• Humidity cells • Columns and lysimeters • B.C. Research confirmation test
6.5 Other kinetic prediction tests
• Shake flasks • Soxhlet extraction
Acid Rock Drainage Prediction Manual
26
6.1. SELECTION CRITERIA AND GUIDELINES
Criteria governing the selection of an ARD prediction test method have been discussed in detail in Section 5. In summary, a particular test is selected with consideration of the following: • Stage of mine project development; • Objectives of test program; • Disposal methods selected or feasible for mine wastes; • Time available to complete program objectives; • Program budget; and • Availability of laboratory expertise for test program. Further guidance to the appropriate selection of a prediction test method is given in the detailed method descriptions which follow. The test descriptions have been grouped to give details of the most widely used and recommended static and kinetic prediction tests. In addition, other less widely used or experimental static and kinetic prediction test procedures are presented. Comparative studies of various prediction methods have been carried out and are listed below for reference. Ferguson, K.D., 1986. Static and kinetic methods to predict acid mine drainage. Proceedings:
Fundamental and Applied Biohydrometallurgy, Eds. R.W. Lawrence, R.M.R. Branion and H. G. Ebner, Elsevier Science Publishers, Amsterdam
Ferguson, K.D. and Erikson, P.M., 1987. Will it generate AMD? An overview of methods to
predict acid mine drainage. Proceedings Acid Mine Drainage Workshop, Halifax, Nova Scotia, March 23-26, Environment Canada.
Lawrence, R.W., Poling, G.P. and Marchant, P.B., 1989. Investigation of predictive techniques
for acid mine drainage. Report on DSS Contract No. 23440-79178/01-SQ, Energy Mines and Resources, Canada, MEND Report 1.16.1 (a).

Acid Rock Drainage Prediction Manual
27
6.2. PRINCIPAL STATIC PREDICTION METHODS
The principal static tests and associated procedures described in this section are as follows:
• Paste pH
• Standard acid base accounting
• Modified acid base accounting
• B.C. Research Initial test

Acid Rock Drainage Prediction Manual
28
6.2.1. Paste pH
Objectives
• to determine the pH of a paste made from mixing the finely ground sample with water • to indicate whether acid generation has occurred in the material prior to analysis Principles of Test
Paste pH is measured by a pH electrode in combination with a pH meter. Water is added to the sample to form a paste of a specific consistency. The electrode is placed into the paste and the pH value is directly read from the meter. Equipment
1. pH meter equipped with a combination pH electrode 2. 50 mL beakers, or equivalent 3. Spatula or stirring rod Reagents
1. standard buffer solution, pH 4.00 and pH 7.00 2. distilled (or deionized) water Procedure 1. Calibrate pH meter for test temperature using pH buffer solutions and standard procedures
according to meter instructions.
2. Weigh out approximately 10 g of sample at minus 60 mesh into beaker. Add approximately 5 mL of distilled water to sample without stirring. Allow sample to wet by capillary action. Add more water or sample as required to saturate sample (no puddling of water or dry appearance of solid).
3. Stir sample with spatula to form thin paste, adding more water or sample to keep sample at
saturation point. Paste should just slide off spatula easily.
4. Carefully place pH electrode into paste and move about to ensure contact between paste and electrode. Care must be exercised to avoid impact and scratching of electrode.
5. Record pH of paste. Calculations
None

Acid Rock Drainage Prediction Manual
29
Interpretation of Results
The paste pH value indicates whether the sample contains readily available acidity or alkalinity. A paste pH above 7 suggests the presence of reactive carbonate. A paste pH below 5 suggests that the material contains acidity from prior acid generation. Advantages of Test
• Simple and rapid method of determining the readily available acidity and alkalinity.
• Can be used in the field for initial screening of samples to assist in selection of samples for further laboratory evaluation. Disadvantages of Test
• Rates of acid and alkalinity generation are not predicted. References
Sobek, A.A., Schuller, W.A., Freeman, J.R. and Smith, R.M., 1978, Field and Laboratory Methods Applicable to Overburdens and Minesoils, EPA 600/278-054, 203pp.
British Columbia AMD Task Force, 1989, Draft Acid Rock Drainage Technical Guide, Vol. 1,
Crown Publications, Victoria, B.C.

Acid Rock Drainage Prediction Manual
30
6.2.2. Standard Acid Base Accounting
Objectives
• to determine the balance between acid producing and acid consuming components of a mine waste Principles of Test
Acid base accounting comprises two distinct measurements:
1. determination of the neutralization potential (NP) of a sample
2. calculation of the acid potential (AP) of the sample. The difference between the two values, the net neutralization potential (Net NP), allows classification of the sample as potentially acid consuming or producing. As a first evaluation, a positive value for the Net NP indicates that the sample is a net consumer of acid. To facilitate comparison of values, NP, AP, and Net NP are all expressed in units of tonnes CaCO3 equivalent per 1000 tonnes. The neutralization potential is determined by treating a sample with excess standardized hydrochloric acid, heating to ensure complete reaction. A fizz test is employed to ensure that the amount of acid added is sufficient to react all of the acid consuming minerals present. The unconsumed acid is titrated with standardized base to pH 7 to allow calculation of the calcium carbonate equivalent of the acid consumed. The acid potential is determined by analyzing for total sulphur and calculating AP by assuming (1) total conversion of sulphur to sulphate, and (2) 4 moles H+ are produced per mole pyrite oxidized. Equipment
1. Aluminum foil 2. 250 mL Erlenmeyer flask 3. Hot plate 4. Buret, 50 or 100 mL (0.1 mL graduation), one for each acid and one for each base 5. pH meter, equipped with a combination pH electrode Reagents
1. Distilled (or deionized) water, preferably CO2-free (store in container equipped with an ascarite tube) 2. Certified grade, 0.1 N hydrochloric acid, for standardization of bases 3. Approximately 0.1 N sodium hydroxide, standardized 4. Approximately 0.5 N sodium hydroxide, standardized 5. Approximately 0.1 N hydrochloric acid, standardized 6. Approximately 0.5 N hydrochloric acid, standardized 7. Approximately 25 percent hydrochloric acid, for fizz test

Acid Rock Drainage Prediction Manual
31
Procedure 1. Submit a sample of the test material for total sulphur analysis.
2. Determine paste pH as described in this manual.
3. Use certified 0.1 N hydrochloric acid to standardize the 0.1 N and 0.5 N sodium hydroxide solutions, and then use the sodium hydroxide solutions to standardize the 0.1 N and 0.5 N hydrochloric acid solutions.
4. Place approximately 0.5 g of sample (minus 60 mesh) on a piece of aluminum foil or in a small shallow dish. Add one or two drops of 25 percent HCl to the sample. The presence of carbonate will be indicated by a bubbling or an audible "fizz". Rate the "fizz" as indicated in Table 1.
5. Weigh 2.00 g of the sample (minus 60 mesh) into a 250 mL Erlenmeyer flask and add the volume and normality of HCl as indicated by the "fizz" rating in Table 1.
Table 1. Volume and Normality of HCl for Use in NP Determination on Basis of Fizz Rating (2g Sample)
HCl HCl Fizz Rating (mL) (Normality)
None 20 0.1 Slight 40 0.1
Moderate 40 0.5 Strong 80 0.5
6. Heat the pulp nearly to boiling, swirling the flask frequently until reaction is complete,
indicated when no further gas evolution is visible and particles settle evenly over the bottom of the flask.
7. Add distilled water to make a total volume of 125 mL and boil contents of flask for 1 minute. Cool to slightly above room temperature. Cover tightly and cool to room temperature.
8. Titrate the contents of the flask using 0.1 N or 0.5 N NaOH (corresponding to the normality of HCl used in step 5) to pH 7.0. Titrate with NaOH until a constant reading of 7.0 remains for at least 30 seconds.
9. If less than 3 mL of NaOH is required to obtain a pH of 7.0 in step 8, it is likely that insufficient acid was added in step 5 to neutralize all the acid consuming minerals in the sample. Repeat the test using the next higher volume or strength of HCl as indicated in Table 1.

Acid Rock Drainage Prediction Manual
32
Calculations 1. The neutralization potential, NP, of the sample is given by:
NPa x b a y
c=
−50 [ ( / ) ]
where: NP = neutralization potential in tonnes CaCO3 equivalent per 1000 tonnes of material
a = normality of HCl b = normality of NaOH c = sample weight in grams x = volume of HCl added in mL y = volume of NaOH added to pH 7.0 in mL
2. The acid potential, AP, of the sample in tonnes CaCO3 equivalent per 1000 tonnes, is given by:
AP = Percent sulphur x 31.25 3. The net neutralization potential, Net NP, in tonnes CaCO3 equivalent per 1000 tonnes of material is given by:
Net NP = NP - AP Interpretation of Results
As shown in the calculations, the Net NP of a sample is given as the difference between the NP and AP values. According to the standard method, a sample is defined as a potential source of ARD (potentially toxic) if it has a net potential deficiency of 5.0 tonnes of calcium carbonate equivalent per 1000 tonnes of material, i.e. Net NP values of -5 or greater (more negative). Regardless of the acid base account, materials which have a pH of less than 4.0 in a pulverized rock slurry in distilled water are defined as being acid-toxic. Reporting of Results
The results of the test should be tabulated to provide the following information:
Sample description, paste pH, total sulphur analysis (% S), NP (tonnes CaCO3 equivalent per 1000 tonnes), AP (tonnes CaCO3 equivalent per 1000 tonnes), Net NP (tonnes CaCO3 equivalent per 1000 tonnes)
Advantages of Test
• Widely used and accepted method.
• Rapid and easy to perform.
• Low cost; can be used to screen a large number of samples for further selective and more detailed evaluation.
• Determines the maximum amount of neutralization potential and acid potential available in a sample.

Acid Rock Drainage Prediction Manual
33
Disadvantages of Test
• Rates and extent of acid producing and neutralizing reactions are not determined
• In using total sulphur analysis for calculation of AP, acid generating and none generating sulphur species are not differentiated; AP might be overestimated.
• Calculation of AP is based on one stoichiometry of reaction. In practice, the actual stoichiometry might vary significantly.
• Method does not indicate the pH to which the sample can neutralize during extended contact with acidic water.
• Method does not distinguish between reactive, readily available acid consuming minerals and less reactive species which might be important in the long term.
• The boiling procedure might give overestimation of neutralization potential.
• For some samples, reproducibility of the NP determination is poor. In such cases, NP is often found to be affected by the quantity of acid added in the digestion stage.
References
Sobek, A.A., Schuller, W.A., Freeman, J.R. and Smith, R.M., 1978. Field and Laboratory Methods Applicable to Overburdens and Minesoils, EPA 600/2-78-054, 203pp.

Acid Rock Drainage Prediction Manual
34
6.2.3. Modified Acid Base Accounting
Objectives
• to determine the balance between acid producing and acid consuming components of a mine waste Principles of Test
The fundamental principals of acid base accounting comprise two distinct measurements:
1. determination of the neutralization potential (NP) of a sample; and
2. calculation of the Acid Potential (AP) of the sample. The difference between the two values, the net neutralization potential (Net NP), allows classification of the sample as potentially acid consuming or producing. As a first evaluation, a positive value for the Net NP indicates that the sample is a net consumer of acid. To facilitate comparison of values, NP, AP, and Net NP are all expressed in units of tonnes CaCO3 equivalent per 1000 tonnes.
In the modified method, the neutralization potential is determined by treating a sample with excess standardized hydrochloric acid at ambient, or slightly above (25-30oC) ambient, temperatures for 24 hours. A fizz test is employed to provide a guide to the amount of acid to be initially added to the test. Acid is added as required during the acid-treatment stage to maintain sufficient acidity for reaction. After treatment, the unconsumed acid is titrated with standardized base to pH 8.3 to allow calculation of the calcium carbonate equivalent of the acid consumed.
For the calculation of the acid potential, the sample is analyzed for total sulphur and sulphate sulphur, and sulphide sulphur is calculated by difference. AP is determined from the calculated sulphide sulphur analysis, assuming (1) total conversion of sulphide to sulphate, and (2) production of 4 moles H+ per mole of pyrite oxidized. In some cases, other sulphur species such as that associated with the mineral barite (not distinguished in a typical sulphate analysis) which do not contribute to the acid potential might be determined and correction made to the sulphide sulphur calculation. Equipment
1. Aluminum foil 2. 250 mL Erlenmeyer flask 3. Reciprocating shaking apparatus or other suitable agitation device 4. Buret, 50 or 100 mL (0.1 mL graduation), one for each acid and one for each base 5. pH meter, equipped with a combination pH electrode Reagents
1. Distilled (or deionized) water, preferably CO2-free (store in container equipped with an ascarite tube)
2. Certified grade, 0.1 N hydrochloric acid, for standardization of bases 3. Approximately 0.1 N sodium hydroxide, standardized

Acid Rock Drainage Prediction Manual
35
4. Approximately 0.5 N sodium hydroxide, standardized 5. Approximately 0.1 N hydrochloric acid, standardized 6. Approximately 0.5 N hydrochloric acid, standardized 7. Approximately 25 percent strength hydrochloric acid, for fizz test Procedure 1. Crush and pulverize the sample to a target size of 80 percent minus 200 mesh (Tyler).
Tailings samples should be tested at the received particle size.
2. Submit a sample of the test material for total sulphur and sulphate sulphur analyses.
3. Use certified 0.1 N hydrochloric acid to standardize the 0.1 N and 0.5 N sodium hydroxide solutions, and then use the sodium hydroxide solutions to standardize the 0.1 N and 0.5 N hydrochloric acid solutions.
4. Place approximately 0.5 g of pulverized sample on a piece of aluminum foil or in a small shallow dish. Add one or two drops of 25 percent HCl to the sample. The presence of carbonate will be indicated by a bubbling or an audible "fizz". Rate the "fizz" as indicated in Table 1.
Table 1. Volume and Normality of HCl for Use in NP Determination on Basis of
Fizz Rating (2g Sample)
Fizz Rating (mL) (Normality)None 20 0.1 Slight 40 0.1
Moderate 40 0.5 Strong 80 0.5
5. Weigh 2.00 g of the pulverized sample into a 250 mL Erlenmeyer flask and, as a first
approximation, add the volume and normality of HCl as indicated by the "fizz" rating in Table 1.
6. Agitate the contents of the flask for 24 hours by placing on a shaking apparatus. At least once in the treatment periods and preferably after approximately 6 hours of reaction, check the pH of the pulp. If the pH is above 2.0, add an appropriate volume of hydrochloric acid of the same strength as originally added.
7. At the end of the shaking period, check the pulp pH. If the total volume and strength of acid was appropriate, the end pH will be in the range 1.5-2.0. If the pH is above this range, the amount of acid added is judged to be insufficient for reaction. If the pH is below the range, the amount of acid added is judged to be too high, causing over-reaction. In either case, repeat the test using the next higher or lower volume or strength of HC1 as required.
8. Titrate the contents of the flask using 0.1 N or 0.5 N NaOH (corresponding to the normality of HCl used in step 5) to pH 8.3. Titrate with NaOH until a constant reading of 8.3 remains for at least 30 seconds.
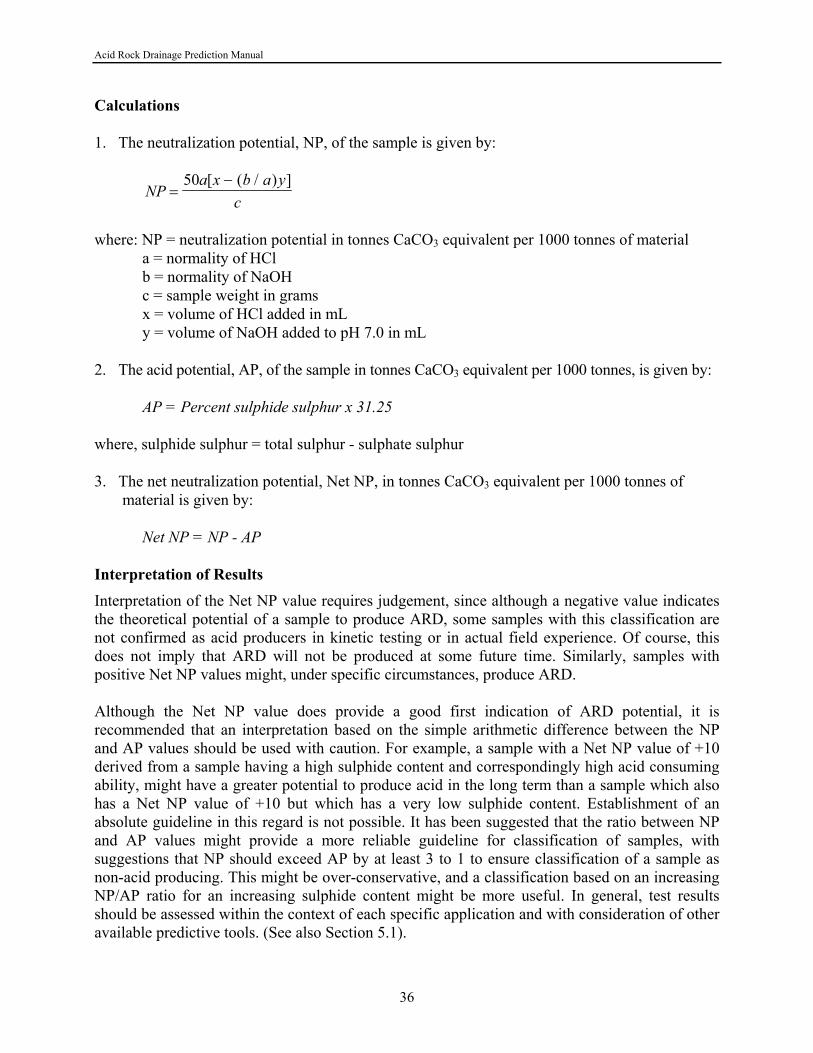
Acid Rock Drainage Prediction Manual
36
Calculations 1. The neutralization potential, NP, of the sample is given by:
NPa x b a y
c=
−50 [ ( / ) ]
where: NP = neutralization potential in tonnes CaCO3 equivalent per 1000 tonnes of material a = normality of HCl
b = normality of NaOH c = sample weight in grams x = volume of HCl added in mL y = volume of NaOH added to pH 7.0 in mL
2. The acid potential, AP, of the sample in tonnes CaCO3 equivalent per 1000 tonnes, is given by: AP = Percent sulphide sulphur x 31.25 where, sulphide sulphur = total sulphur - sulphate sulphur 3. The net neutralization potential, Net NP, in tonnes CaCO3 equivalent per 1000 tonnes of material is given by: Net NP = NP - AP Interpretation of Results
Interpretation of the Net NP value requires judgement, since although a negative value indicates the theoretical potential of a sample to produce ARD, some samples with this classification are not confirmed as acid producers in kinetic testing or in actual field experience. Of course, this does not imply that ARD will not be produced at some future time. Similarly, samples with positive Net NP values might, under specific circumstances, produce ARD. Although the Net NP value does provide a good first indication of ARD potential, it is recommended that an interpretation based on the simple arithmetic difference between the NP and AP values should be used with caution. For example, a sample with a Net NP value of +10 derived from a sample having a high sulphide content and correspondingly high acid consuming ability, might have a greater potential to produce acid in the long term than a sample which also has a Net NP value of +10 but which has a very low sulphide content. Establishment of an absolute guideline in this regard is not possible. It has been suggested that the ratio between NP and AP values might provide a more reliable guideline for classification of samples, with suggestions that NP should exceed AP by at least 3 to 1 to ensure classification of a sample as non-acid producing. This might be over-conservative, and a classification based on an increasing NP/AP ratio for an increasing sulphide content might be more useful. In general, test results should be assessed within the context of each specific application and with consideration of other available predictive tools. (See also Section 5.1).
Acid Rock Drainage Prediction Manual
37
Reporting of Results The results of the test should be tabulated to provide the following information: Sample description, paste pH, total sulphur analysis (% ST), sulphate sulphur analysis (% S(SO4), NP (tonnes CaCO3 equivalent per 1000 tonnes), AP (tonnes CaCO3 equivalent per 1000 tonnes), Net NP (tonnes CaCO3 equivalent per 1000 tonnes) Advantages of Test
• Rapid and easy to perform.
• Low cost; can be used to screen a large number of samples for possible further selective and more detailed evaluation.
• Analysis of sulphur species allows a more realistic assessment of AP by using sulphide sulphur as the basis for calculation.
• Assessment of NP is performed in a procedure, which can provide greater consistency of result and prevent overestimation of the value compared with the standard procedure.
Disadvantages of Test
• Rates and extent of acid producing and neutralizing reactions are not determined.
• Calculation of AP is based on one stoichiometry of reaction. In practice, the actual stoichiometry might vary significantly.
• Method does not indicate the pH to which the sample can neutralize during extended contact with acidic water.
References
Lawrence, R.W., Poling, G.P. and Marchant, P.B., 1989. Investigation of predictive techniques for acid mine drainage. Report on DSS Contract No. 23440-7-9178/01-SQ. Energy Mines and Resources, Canada, MEND Report 1.16.1(a).
Acid Rock Drainage Prediction Manual
38
6.2.4. B.C. Research Initial Test
Objectives
• to determine the balance between acid producing and acid consuming components of a mine waste
Principles of Test
The B.C. Research Initial Test comprises two distinct measurements:
1) determination of the neutralization capacity of a sample
2) calculation of the acid producing potential of the sample Comparison of the two values allows classification of the sample as potentially acid consuming or producing. If the acid potential exceeds the acid consumption the sample is classified as a potential acid producer and confirmation testing is recommended. The neutralization capacity is determined by titrating a pulverized rock slurry with standardized sulphuric acid to a stable pH of 3.5 using an automatic pH controller/titrator. The acid production potential is determined by analyzing for total sulphur and calculating AP by assuming total conversion of sulphur to sulphate (sulphuric acid) and a production of 4 moles of H+ per mole of pyrite oxidized. The choice of end point of pH 3.5 is based on an assumption that this represents the limit above which iron and sulphide oxidizing bacteria such as Thiobacillus ferrooxidans are not active. Therefore, if the theoretical acid production is not sufficient to lower the pH to below pH 3.5, then biochemical oxidation of the material will not occur, and the formation of ARD is unlikely. Equipment
1. Beaker, 250 mL 2. Magnetic stirrer and stir bar 3. Buret, 100 mL (0.1 mL graduation) 4. pH meter, equipped with a combination pH electrode. (A convenient set-up is to use a pH
meter/controller equipped with a multi-channel switching device and several pH electrodes to allow automatic and simultaneous testing of more than one sample)
Reagents
1. Distilled (or deionized) water 2. Certified grade, 1.0 N sulphuric acid (1.0 N sulphuric acid can be prepared from concentrated
acid and standardized using certified grade or standardized base)

Acid Rock Drainage Prediction Manual
39
Procedure
1. Crush and pulverize (ball mill) the sample to pass a 400 mesh (Tyler) screen.
2. Submit a sample of the test material for total sulphur analysis (in duplicate).
3. Weigh 10.00 g of sample into a 250 mL beaker and add 100 mL of distilled water. Stir for approximately 15 minutes and record the pH (natural pH).
4. While stirring, titrate the sample slurry with 1.0 N sulphuric acid to an end point of pH 3.5. Continue adding acid until the acid addition over a 4 hour period is 0.1 mL or less. Record the total volume of acid added.
Calculations 1. The acid consumption in kg H2SO4 per tonne of material is given by:
Acid ConsumptionmL N H SO x x
SampleWeight in g=
10 0 049 10002 4. .
2. The acid production potential of the sample in kg H2SO4 per tonne of material is given by: Acid Production Potential = Percent sulphur x 30.6 Interpretation of Results
The acid consumption and acid production potential values are compared. If the acid production potential exceeds the acid consumption, the sample is classified as being a potential source of acid mine drainage. Confirmatory testing, using the B.C. Research Confirmation test or other kinetic test is recommended. If the acid consumption value is greater than the acid production potential, the sample is classified as being a non-acid producer and no additional work is necessary. Presentation of Results
The results of the test should be tabulated to provide the following information:
Sample description, natural pH, sulphur analysis (% S), acid production potential (kg H2SO4//tt), acid consumption (kg H2SO4/t), acid producing classification (yes or no) Advantages of Test
• Rapid and relatively easy to perform.
• Can be used to screen a large number of samples for further selective and more detailed evaluation
• H2SO4 titration of sample down to pH 3.5 might provide a more realistic assessment of readily available neutralization capacity than the excess HCl addition method used in acid base accounting.
Acid Rock Drainage Prediction Manual
40
Disadvantages of Test
• Rates and extent of acid producing and neutralizing reactions are not determined
• Calculation of acid production potential based on total sulphur analysis can lead to overestimation of values.
• Method does not indicate the pH to which the sample can neutralize during extended contact with acidic water.
• More time consuming and costly than acid base accounting. References Bruynesteyn, A. and Hackl, R.P., 1984. Evaluation of acid production potential of mining waste
materials. Minerals and the Environment, 4(1), 5-8.

Acid Rock Drainage Prediction Manual
41
6.3. OTHER STATIC PREDICTION PROCEDURES
In Section 6.2, the principal static prediction procedures used in Canada and the U.S were described. Several other procedures are, however, in use or are in the process of being developed, including the following tests and procedures which are described in this section:
• Net Acid Production
• Alkaline Production Potential/Sulphur Ratio
Acid Rock Drainage Prediction Manual
42
6.3.1. Net Acid Production
Objectives
• to determine the balance between the acid producing and acid consuming components of a mine waste without the need for sulphur analyses
Principles of Test
This method uses hydrogen peroxide to react with the sulphides contained in a finely ground sample of the waste material. Acid that is produced by oxidation is simultaneously consumed by carbonates and/or other acid consuming components of the material. The acid remaining after reaction is titrated with standardized base to pH 7.0 and the net acid produced by the reaction calculated and expressed in units of kg CaCO3 equivalent per tonne. Equipment
1. Beaker, 250 mL 2. Magnetic stirrer and stir bar 3. Buret, 100 mL (0.1 mL graduation) 4. pH meter equipped with a combination pH electrode Reagents
1. Hydrogen peroxide (H2O2), 30-50% (standardize by iodometric or permanganate method) 2. Standardized or certified sodium hydroxide solution, 0.1 N Procedure
1. Crush and pulverize the sample to a target size of 80 percent minus 200 mesh (Tyler). Tailings samples should be tested at the received particle size.
2. In duplicate, weigh 5.00 g of sample into a 250 mL beaker and add 100 mL of 30-50 % H2O2 (standardized).
3. Place beakers on magnetic stirrer for 1 hour. Reaction should be complete as evidenced by cessation of bubbling. If bubbling is evident, stir pulp for extra time. Caution: if sample contains high sulphur content, reaction might be vigorous.
4. After reaction, measure and record pH and titrate pulps to pH 7.0 using standardized NaOH solution.
Calculations The Net Acid Production of the sample is given by:
cabAPNet 50
=
where: Net AP = Net acid potential in kg CaCO3 equivalent per tonne

Acid Rock Drainage Prediction Manual
43
a = normality of NaOH b = volume of NaOH added to pH 7.0, mL c = weight of sample, g Interpretation of Results The Net Acid Production method is still in the development stage to verify procedures and correlation with other static test methods and field data. The Net AP values obtained will range from zero to positive values, the magnitude of which will depend on the potential of the sample to produce acid upon oxidation. In general, Net NP values provide a much lower indication of the potential for the production of ARD than does acid base accounting, although results obtained in several studies of different waste rock and tailings samples indicate good correlation with the more accepted static procedures. Samples with positive or close to zero Net NP values from acid base accounting will provide very low or zero Net AP values. Presentation of Results
The results of the test should be tabulated to provide the following information:
Sample description, pH after reaction, Net AP (kg CaCO3 equivalent per tonne) Advantages of Test
• Provides rapid and low cost assessment of the potential for acid generation.
• Can be used to screen a large number of samples for further selective and more detailed evaluation.
• Sulphur analyses not required; method suitable for field use.
• Procedure might provide assessment of the readily oxidizable sulphur species. Disadvantage of Test
• In development stage and not proven as a reliable method.
• Rates of acid generation not predicted.
• Alkaline components of the sample might interfere with the efficiency of pyrite oxidation by H2O2.
References
Lawrence, R.W., Jaffe, S., and Broughton, L.M., 1988. Referenced in: Lawrence, R.W., Poling, G.P. and Marchant, P.B., 1989. Investigation of predictive techniques for acid mine drainage. Report on DSS Contract No. 23440-7-9178/01-SQ, Energy Mines and Resources, Canada, MEND Report 1.16. 1 (a).

Acid Rock Drainage Prediction Manual
44
6.3.2. Alkaline Production Potential/Sulphur Ratio Test
Objectives
• to provide a rapid indication of the potential of a sample of mine waste to produce ARD without the need for kinetic testing
Principles of Test
The Alkaline Production Potential/Sulphur Ratio test (APP/S Ratio) comprises two measurements: (1) determination of the acid consumption of the sample (APP), and (2) analysis of the sample for total sulphur content (ST). The APP values obtained for a number of samples from related geologic units, or primary mine components (see Section 5.1), are then plotted against the corresponding ST values to provide an APP/S Ratio plot. By comparing the plot with the results of simulated weathering (kinetic) tests such as humidity cells on the same samples, the relationship between weathering characteristics and the APP/S ratio can be established. Future prediction of the behaviour of samples from the same geological units or mine components can then be made without the need for kinetic testing. In the determination of APP, finely ground sample is treated with hydrochloric acid under milder conditions than employed for acid base accounting. The volume of base required to titrate the acid remaining after reaction to pH 7.0 is measured and compared with a calibration curve prepared by performing the acid treatment procedure on CaCO3 standards. Equipment
1. 100 mL beaker or 100 mL Erlenmeyer flask 2. Magnetic stirrer or reciprocating shaking apparatus 3. 10 mL or 20 mL pipet 4. Buret, 50 or 100 mL (0.1 mL graduation) 5. pH meter, equipped with a combination pH electrode Reagents
1. Reagent grade CaCO3 2. Certified grade or standardized hydrochloric acid, 0. 1 N 3. Certified grade or standardized sodium hydroxide, 0. 1 N 4. Distilled (or deionized) water, preferably CO2-free (store in container equipped with an
ascarite tube) Procedure
1. Crush and finely pulverize the sample to a target size of minus 23 µm.
2. Submit a sample of the test material for total sulphur analysis.
3. Weigh out 500 mg of sample into a 100 mL beaker or a 100 mL Erlenmeyer flask.
Acid Rock Drainage Prediction Manual
45
4. Weigh out reagent grade CaCO3 standards equalling 1.5, 3.0, 5.0, 10.0, 15.0, and 25.0 mg into 100 mL beakers or 100 mL Erlenmeyer flasks. Use one beaker or flask with no CaCO3 to serve as a blank.
5. Pipet 20.0 mL of 0.1 N (standardized) HCl into all flasks/beakers and agitate with reciprocating shaker/magnetic stirrer (as appropriate) for 2 hours.
6. After 2 hours, add 20 mL of distilled water and titrate the pulps to pH 5.0 using the standardized 0.1 N NaOH solution.
Calculation and Presentation of Results
1. Prepare a calibration curve by plotting mg CaCO3 versus mL NaOH consumed during titration.
2. From the calibration curve determine the alkaline production potential (APP) in units of mg CaCO3 equivalent per 500 mg for each test sample.
3. For each group of samples from related geologic units, or primary mine components, plot APP against the corresponding ST values to provide an APP/S Ratio plot.
4. In addition to the APP/S plots, results should be tabulated to provide the following information:
Sample description, alkaline production potential (mg CaCO3 per 500 mg), total sulphur analysis (ST), APP/S ratio. Interpretation of Results
APP/S Ratio plots can be used in conjunction with weathering (kinetic) test data to establish a criterion for the subsequent prediction of the ARD potential of samples from the same geological units or mine components. This is accomplished by performing weathering tests such as humidity cell testing on a sufficient number of samples for which the APP/S ratios are known. The behaviour of unknown samples can then be predicted by relating the APP/S ratio to the empirically derived data base of the kinetic tests without having to perform a lengthy weathering test on the new sample. Advantages of Test
• The APP determination might provide a more realistic assessment of the available alkalinity in a sample by avoiding the digestion of minerals other than calcareous alkaline producing ones in the more extreme conditions of the NP determination in acid base accounting.
• The APP/S ratio plots in combination with corresponding weathering test data can be used to predict the ARsD potential of new rock samples without performing additional lengthy weathering tests.
• Low cost; can be used for the screening of a large number of samples.
Acid Rock Drainage Prediction Manual
46
Disadvantages of Test
• Method developed to rank sedimentary horizons in coal deposits. Not widely used or proven for base metal and precious metal mine applications.
• Rates and extent of acid producing and consuming reactions not directly determined, although correlation of the APP/S ratio with the weathering data base might provide some guidance.
• Use of total sulphur analyses may provide overestimation of acid potential and distort the APP/S ratio for some samples. The use of sulphide sulphur in the ratio might be preferred.
References Capriccio, F.T., Geidel, G., and Pelletier, M., 1981. Occurrence and prediction of acid drainages.
J. Energy Div. Amer. Soc. Civil Engineers, 107, No. EY1, May. 167-178.
Acid Rock Drainage Prediction Manual
47
6.4. PRINCIPAL KINETIC PREDICTION METHODS
The principal kinetic prediction tests and associated procedures described in this section are as follows: • Humidity cells • Columns and lysimeters • B. C. Research Confirmation test
Acid Rock Drainage Prediction Manual
48
6.4.1. Humidity Cells
Objectives
• to model in the laboratory the geochemical processes of weathering
• to confirm or reduce uncertainty in the results of static prediction tests
• to determine the rate of and temporal variation in acid generation and leachate water quality
• to provide preliminary assessment of ARD control options
Principles of Test
A humidity cell is a weathering chamber designed to provide simple control over air, temperature and moisture, while allowing for the removal of weathering, principally oxidation, products in solution which can be analyzed to determine the onset of ARD, to calculate mass loads, to determine the rate of acid generation, and to determine the concentration of metals and other species as a function of time. Various humidity cell designs have been used, ranging from simple plastic boxes to more elaborate designs which might provide enhanced oxidation rates. In any case, the operation of the cell typically involves 3 stages, usually over a 7 day cycle: (1) dry air passed over or through the sample placed in the cell for 3 days, (2) humid air passed over or through the sample for 3 days, (3) leaching of the sample in the cell on the last day of the cycle. The leachate recovered can then be analyzed for a number of parameters including pH, sulphate, acidity, alkalinity, conductivity, redox potential, and metals. Options in the operating protocol include the addition of bacteria, saturation (flooding) of sample, temperature cycling, use of humid air only between leaching stages, variable duration of the air/leach cycle and evaluation of control measures such as blending and covers. Equipment
1. Humidity cell. A suggested design is made from plexiglass pipe, with height and diameter appropriate for the sample size. An 8 inch height and 4 inch diameter is suitable for a 1 kg sample. Figure 1 shows a schematic of a humidity cell suitable for waste rock. This cell has a fixed base plate with a leachate drainage hole fitted with a tubing nipple. Approximately one inch above the base, a perforated plexiglass plate is fitted to support the sample. This plate can be covered with screen cloth or other suitable material to prevent fine sample falling through the support, while allowing upward flow of air and downward flow of leachate. A hose nipple is fitted to the side wall below the support plate for the dry and humid air inlet. The cell is equipped with a removable lid with a central hose nipple for an air outlet. The air inlet and leachate drain are equipped with suitable pinch valves.
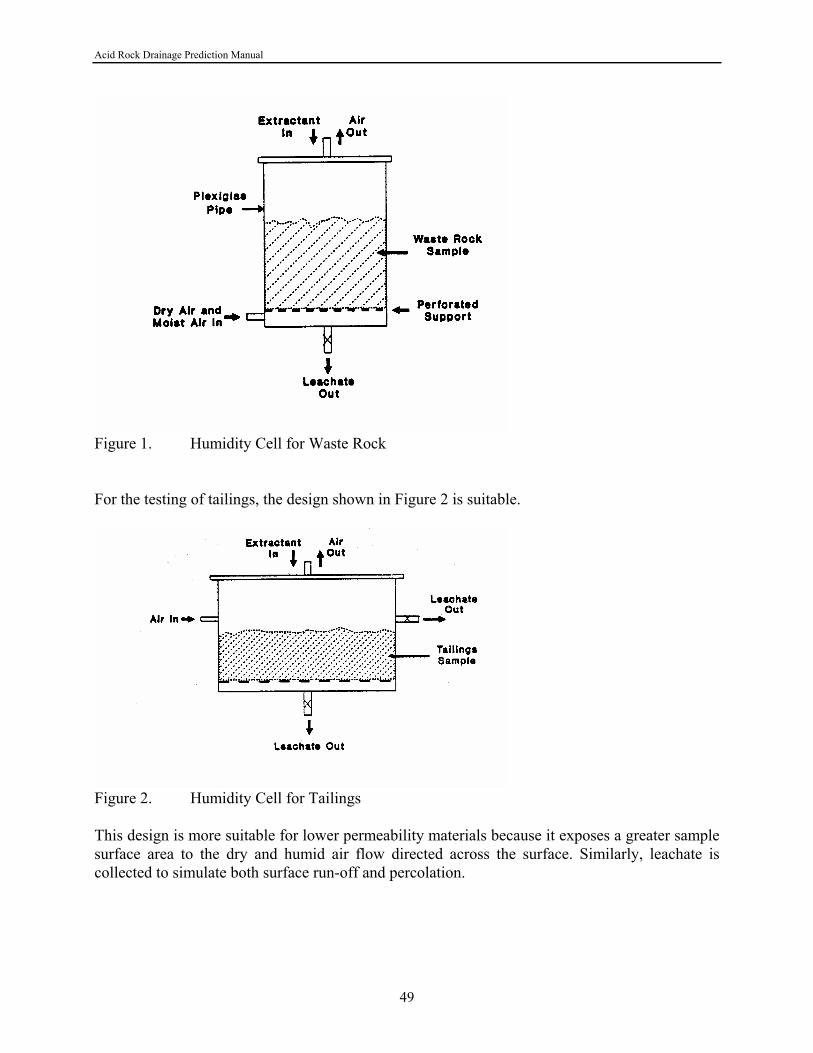
Acid Rock Drainage Prediction Manual
49
Figure 1. Humidity Cell for Waste Rock For the testing of tailings, the design shown in Figure 2 is suitable.
Figure 2. Humidity Cell for Tailings This design is more suitable for lower permeability materials because it exposes a greater sample surface area to the dry and humid air flow directed across the surface. Similarly, leachate is collected to simulate both surface run-off and percolation.

Acid Rock Drainage Prediction Manual
50
2. Humidifier. A humidifier to provide humid air to the humidity cell can be constructed in a number of ways. To facilitate the simultaneous aeration of a number of humidity cells, a suggested humidifier design is to use a horizontal length of plexiglass piping, sealed at each end, of sufficient diameter to accommodate aeration stones and a submersible aquarium-type heater. The tubing is fitted with a number of tubing nipple outlets for connection to each humidity cell air inlet. Each line to each humidity cell must be equipped with appropriate flow monitors and controls to ensure that air flows to each cell at the desired rate and that no cell is inadvertently bypassed. The humidifier is filled partially with water which should be heated to a few degrees above ambient to optimize the generation of humid air. The humidifier is also supplied with an inlet tubing nipple for connection to an external air source. 3. Flexible plastic tubing and tubing clamps 4. Compressed air source 5. Graduated cylinders, 100 mL and 500 mL 6. Beakers, 250 mL 7. Plastic sample bottles, 100 mL and 500 mL 8. Burettes, 100 mL (0.1 mL graduation) 9. Pipettes, 10 mL, 25 mL, 50 mL 10. Magnetic stirrer 11. pH meter equipped with a combination electrode 12. Redox potential meter, equipped with a redox probe 13. Conductivity meter 14. Millipore filter apparatus and 0.45 µm membrane filters Reagents
1. Distilled (or deionized) water 2. Certified grade, 0.1 N hydrochloric acid, for standardization of bases 3. Approximately 0.1 N sodium hydroxide, standardized 4. Approximately 0.1 N hydrochloric acid, standardized 5. Approximately 0.01 N sodium hydroxide, standardized 6. Approximately 0.01 N hydrochloric acid, standardized 7. Sulphuric and nitric acid for preparing simulated acid rain (if required) Procedure 1. Crush sample to a target size of 80 percent minus 1/4 inch. Tailings are tested at the received
particle size. 2. Split out sub-samples and prepare for analysis for sulphur species, metals, mineralogy, and
surface area and/or as otherwise required for the test program. 3. If using the cell designs described above, place 1000 g of sample in the cell and add sufficient
distilled water to moisten sample well without producing drainage. If the experimental design calls for the addition of bacteria, this can be done at this time.

Acid Rock Drainage Prediction Manual
51
4. Typically, the cell is operated in a 7 day cycle. For the first 3 days, pass dry air into the cell.
For the next 3 days, switch the air flow to humid air from the humidifier. 5. On the last day of the cycle, disconnect the airflow and add 500 mL of distilled water and
allow to soak for 1 hour (leachate drain closed). Drain the cell and record the volume of leachate collected.
6. On the next day, restart the cycle. Humidity cell tests may last from 6 to 50 weeks/cycles or
more. 7. Filter or centrifuge the leachate to remove solids. Any solids recovered should be returned to
the cell. Filter aliquots of the leachate through a membrane filter as required for analytical procedures.
8. Measure leachate pH and other parameters as required by the experimental design. These
could include conductivity, redox potential, acidity, alkalinity, sulphate, dissolved metals and other species.
9. pH is measured using the pH meter and combination electrode; redox is measured using the
redox meter and probe; conductivity is determined using the conductivity meter; acidity is determined by titration with base to an end point of either pH 4.5 (free acidity) or pH 8.3 (total acidity); alkalinity is determined by titration with acid to an end point of pH 4.5; sulphate is determined using standard analytical procedures which could include the use of a field-type sulphate analyzer such as a HACH DR-EL kit; dissolved metals can be analyzed by ICP-AES, AAS or other accepted methods.
Interpretation of Results The extent of weathering and generation of ARD can be deduced from the results of the analysis of the leachate from each cycle. For example, sulphate ion originates primarily from the oxidation of sulphide; conductivity is a measure of the ionic strength of the leachate and reflects the reactivity of the sample; the acidity and alkalinity values provide a measure of the balance between the acid and alkaline producing components of the sample. In general, indication of the potential for ARD generation is associated with the following conditions and changes in parameters:
• Decrease in pH; above pH 5-5.5, the sample is not generating significant acid and/or the system is dominated by alkalinity from calcareous material; at or below pH 5-5.5, the potential role of iron-oxidizing bacteria becomes significant; from pH 3 to 5, sample is acid generating and acid toxic conditions exist; below pH 3.5, the role of the bacterium T. ferrooxidans can be very significant, and strongly acid generating conditions exist.
• Increase in specific conductivity.
• Increase in redox potential; in early stages of ARD generation, redox values might be relatively low (< 400 mV SCE); higher values of redox (> 450 mV) indicate a more vigorous

Acid Rock Drainage Prediction Manual
52
oxidation environment and influence of iron-oxidizing bacteria. Above 500 mV, ferric iron oxidation of the sulphide minerals can become significant.
• Absence or low concentrations of alkalinity.
• Increase in acidity; provides a cumulative measure of several aqueous species including Fe2+, Fe3+, Al3+, HSO4
-
• Increase in sulphate [It should be noted that (1) release of sulphate in the initial test cycles might originate from the dissolution of sulphate salts or the release of accumulated acid products, and (2) neutral, but high-sulphate drainages can be formed when highly alkaline leachate contacts ARD].
• Increase in dissolved metals. A ''first approach" guide to the relationships between leachate quality and the reactions responsible for the ionic species is shown in Table 1. Table 1. Guide to the Interpretation of Humidity Cell Data (after Capriccio et al., 1981)
LEACHATE QUALITY CHEMICAL REACTIONS Conductivity Sulphate Acidity Alkalinity
low absent absent absent Sample is inert high absent absent high Ca, Mg carbonate dissolution high high high absent Pyrite oxidation in absence of carbonate high high absent absent Pyrite oxidation to produce acid and
subsequently neutralized by alkalinity Temporal changes in leachate chemistry and evidence for the onset of ARD generation can be more easily discerned by plotting values against time. In the case of sulphate, acidity, alkalinity, and metals, cumulative plots are useful in addition to plots of actual values. Where applicable, values should be reduced to a common base (e.g. mg per kg of sample) to allow valid comparison of data. Rates of acid, alkaline or sulphate generation, and of metal release can be determined from the graphed data. These rates can be expressed as specific rates, on a unit weight, unit surface, and /or unit sulphur content basis. In general, the values of the parameters and the relationship between them should also be considered on a site-specific basis, and in relationship to other parameters and factors (see also Section 5.1). Presentation of Results
The results of humidity cell testing should be tabulated for each individual sample tested and include some or all of the following data:
Cycle number, duration (days), leachate volume (mL), pH, redox potential (mV), acidity (mg/L CaCO3 equivalent), cumulative acidity (mg CaCO3/kg or mg/kg/m2), alkalinity (mg/L CaCO3
Acid Rock Drainage Prediction Manual
53
equivalent), cumulative alkalinity (mg CaCO3/kg or mg/kg/m2), specific conductivity (µS/cm), sulphate (mg/L SO4), cumulative sulphate (mg SO4/kg or mg SO4/kg/m2 or mg SO4/kg/% S/m2, metals (mg/L) and cumulative metals extracted (mg/kg or mg/kg/m2) Graphical presentation of results can include any or all of the above parameters, usually as a function of time, although the relationship between other parameters can also be presented graphically. Rates of acid generation, sulphide oxidation expressed on a weight, surface area, and/or unit sulphur basis can be determined from the graphical plots (e.g. mg SO4/m2/week). Advantages of Test
• Accepted method in Canada and the U.S.A.
• Compares favourably with other prediction tests and field data for reliability; can be used to calibrate other laboratory test procedures.
• Relatively simple to set up and operate.
• Models the wet/dry cycles of the environment.
• Rates of acid generation and sulphide oxidation can be determined.
• Temporal variations in acid generation rates can be determined.
• Effect of bacteria can be assessed (see also Section 5.9).
• Provides an assessment of leachate water quality and dissolved metal flux that could be expected from a waste unit.
• Preliminary evaluation of the effect of ARD control options such as blending of waste rock can be made.
• Fully saturated or submerged environment conditions can be evaluated. Disadvantages
• Interpretation of results is sometimes complex.
• Test might require long time for completion and with relatively high costs.
• Confirmation of ARD potential or the determination of sulphide oxidation rates is often inconclusive due to the time required to deplete NP to levels at which acid generation becomes measurable, even for samples where the NP content is relatively low (e.g. >20 tonnes CaCO3/l000 tonnes). However, humidity cells do permit tests to be carried out over extended periods of time. Pre-acidification of the sample can accelerate the NP depletion process but conditions created might not be realistic.
• Rates of acidity and alkalinity release might not be comparable or readily interpreted due to the differences in the kinetics and equilibria of the acid generating, acid consuming, and alkalinity generating reactions under laboratory and field conditions.

Acid Rock Drainage Prediction Manual
54
References Capriccio, F.T., Geidel, G., and Pelletier, M., 1981. Occurrence and prediction of acid drainages.
J. Energy Div. Amer. Soc. Civil Engineers, 107, No. EY1, May, 167-178. Lawrence, R.W., 1990. Prediction of the behaviour of mining and processing wastes in the
environment. Proceedings, Western Regional Symposium on Mining and Mineral Processing Wastes, Ed. F.M. Doyle, May 30-June 1, Berkeley, CA, AIME/SME Publication, Littleton, CO, 115-121.
Sobek, A.A., Schuller, W.A., Freeman, J.R. and Smith, R.M., 1978. Field and Laboratory
Methods Applicable to Overburdens and Minesoils, EPA 600/278-054, 203pp. British Columbia AMD Task Force, 1989. Draft Acid Rock Drainage Technical Guide, Vol. 1,
Crown Publications, Victoria, B.C.
Acid Rock Drainage Prediction Manual
55
6.4.2. Columns and Lysimeters
Objectives
• to model, in the laboratory, the geochemical processes of weathering
• to confirm or reduce uncertainty in the results of static prediction tests
• to determine the rate of and temporal variation in acid generation and leachate water quality
• to evaluate the effect of different disposal techniques on ARD generation to provide assessment of ARD control options
Principles of Test
Columns, or lysimeters, can facilitate larger scale weathering testing of mine wastes. Columns are typically of glass, PVC, plexiglass, or other suitable inert plastic material and can range in size from, for example, 5 cm diameter by 60 cm high up to 60 cm diameter by 600 cm high, or larger for laboratory investigations, although intermediate sizes are more usual, such as 25 cm diameter by 120 cm high. Lysimeter is a term often used synonymously with columns but has been defined (Ritcey, 1989) as "a structure containing a mass of soil and designed to permit the measurement of water draining through the soil. It consists of a basin, having closed sides and a bottom fitted with a drain. Quantities of material and/or artificial precipitation are measured, the seep percolate is measured and analyzed, water of evaporation is measured, water taken up to plants is weighed, etc." Lysimeters can be constructed to permit the testing of material weighing from a few hundreds of grams up to several tonnes. In the basic test protocol, columns or lysimeters are filled with the test material and leached with a single pass of distilled water. The leachate emerging from the system is collected and analyzed for parameters of interest. Numerous other test procedures alone and in combination are possible depending on the program objectives, including the following variations:
• Continuous single pass leaching with distilled water;
• Continuous single pass leaching with an extractant other than distilled water (e.g. simulated acid rain, simulated or actual ARD);
• Recirculation of leachate;
• Intermittent extractant addition with either single pass or recirculation flow (use of rest cycles);
• Maintenance of a water table;
• Assessment of flooded disposal conditions;
• Upward flow of water through sample;
• Assessment of bacterial effects;
• Assessment of rock blending; and
• Assessment of covers (rock, soil, plants).

Acid Rock Drainage Prediction Manual
56
Equipment
1. Columns or lysimeters of suitable material, size and dimensions for the test program. (See Ritcey, 1989 for lysimeter construction details). To maintain a water table or flooded conditions, columns are fitted with a sealed base plate equipped with a drainage hole fitted with a tubing nipple. The outflow tube incorporates a “T” or “Y” three-way connector. One leg of the connector, open to the atmosphere, acts as a siphon break. The water table is controlled by the level of the three-way connector. For non-saturated conditions, a perforated base plate can be fitted into the lower section of the column to support the test sample. Other drainage ports can be fitted in the column side walls as required by the program objectives.
2. Peristaltic pumps and tubing to provide solution flows appropriate to the column or lysimeter size
3. Plastic buckets or other suitable containers for collection of leachate draining from columns 4. Flexible plastic tubing and tubing clamps 5. Graduated cylinders, 100 mL and 500 mL 6. Beakers, 250 mL 7. Plastic sample bottles, 100 mL and 500 mL 8. Burettes, 100 mL (0.1 mL graduation) 9. Pipettes, 10 mL, 25 mL, 50 mL 10. Magnetic stirrer 11. pH meter equipped with a combination electrode 12. Redox potential meter, equipped with a redox probe 13. Conductivity meter 14. Millipore filter apparatus and 0.45 µm membrane filters Reagents
1. Distilled (or deionized) water 2. Certified grade, 0.1 N hydrochloric acid, for standardization of bases 3. Approximately 0.1 N sodium hydroxide, standardized 4. Approximately 0.1 N hydrochloric acid, standardized 5. Approximately 0.01 N sodium hydroxide, standardized 6. Approximately 0.01 N hydrochloric acid, standardized 7. Sulphuric and nitric acid for preparing simulated acid rain (if required) Procedure
1. Crush sample to a target size specified by the program objectives. In general, the larger the particle size the better. As a guide, the largest particle should not be greater than 1/6 of the column diameter. Tailings are tested at the received particle size.
2. Split out sub-samples and prepare for analysis for sulphur species, metals, mineralogy, and surface area as required for the test program.
3. Set up the column or lysimeter with pumps and tubing according to the test design selected. (see above).
4. Fill the column or lysimeter with the test material. The material can be well moistened with water at this stage and bacteria added if required.

Acid Rock Drainage Prediction Manual
57
5. Introduce water or other extractant onto the material at a rate and in the manner required by the test protocol. This could involve the use of peristaltic pumps or controlled gravity flow from a reservoir. The rate of flow might be based on (1) a specified solution to solid ratio, (2) rainfall data for the mine site, (3) hydrogeological data, and (4) different rates to observe the effect of this variable.
6. Periodically sample the leachate emerging from the column or lysimeter or pending on the top of the solids and analyze for parameters specified by the experimental design. These might include pH, conductivity, redox potential, acidity, alkalinity, sulphate, dissolved metals and other species. In the early stages of a test program, a weekly sampling schedule might be appropriate. As the rates of the reactions become apparent, the ongoing sampling schedule can be developed.
7. pH is measured using the pH meter and combination electrode; redox is measured using the redox meter and probe; conductivity is determined using the conductivity meter; acidity is determined by titration with base to an end point of either pH 4.5 (free acidity) or pH 8.3 (total acidity); alkalinity is determined by titration with acid to an end point of pH 4.5; sulphate is determined using standard analytical procedures which could include the use of a field-type sulphate analyzer such as a HACH DR-EL kit; dissolved metals can be analyzed by ICP-AES, AAS or other accepted methods.
8. If the column or lysimeter test is large enough and the equipment design permits, samples of the test material can be taken (e.g. by coring) at various times throughout the test to observe, evaluate and analyze the effects of weathering.
Interpretation of Results
The extent of weathering and generation of ARD, and the effectiveness of control measures or disposal options, can be deduced from the results of the analysis of the leachate obtained from the column or lysimeter. For example, sulphate ion originates primarily from the oxidation of sulphide; conductivity is a measure of the ionic strength of the leachate and reflects the reactivity of the sample; the acidity and alkalinity values provide a measure of the balance between the acid and alkaline producing components of the sample. In general, indication of the potential for ARD generation is associated with the following conditions and changes in parameters:
• Decrease in pH; above pH 5-5.5, the sample is not generating significant acid and/or the system is dominated by alkalinity from calcareous material; at or below pH 5-5.5, the potential role of iron-oxidizing bacteria becomes significant; from pH 3 to 5, sample is acid generating and acid toxic conditions exist; below pH 3.5, the role of the bacterium T. ferrooxidans can be very significant, and strongly acid generating conditions exist.
• Increase in specific conductivity
• Increase in redox potential; in early stages of ARD generation, redox values might be relatively low (< 400 mV SCE); higher values of redox (> 450 mV) indicate a more vigorous oxidation environment and influence of iron-oxidizing bacteria. Above 500 mV, ferric iron oxidation of the sulphide minerals can be significant.
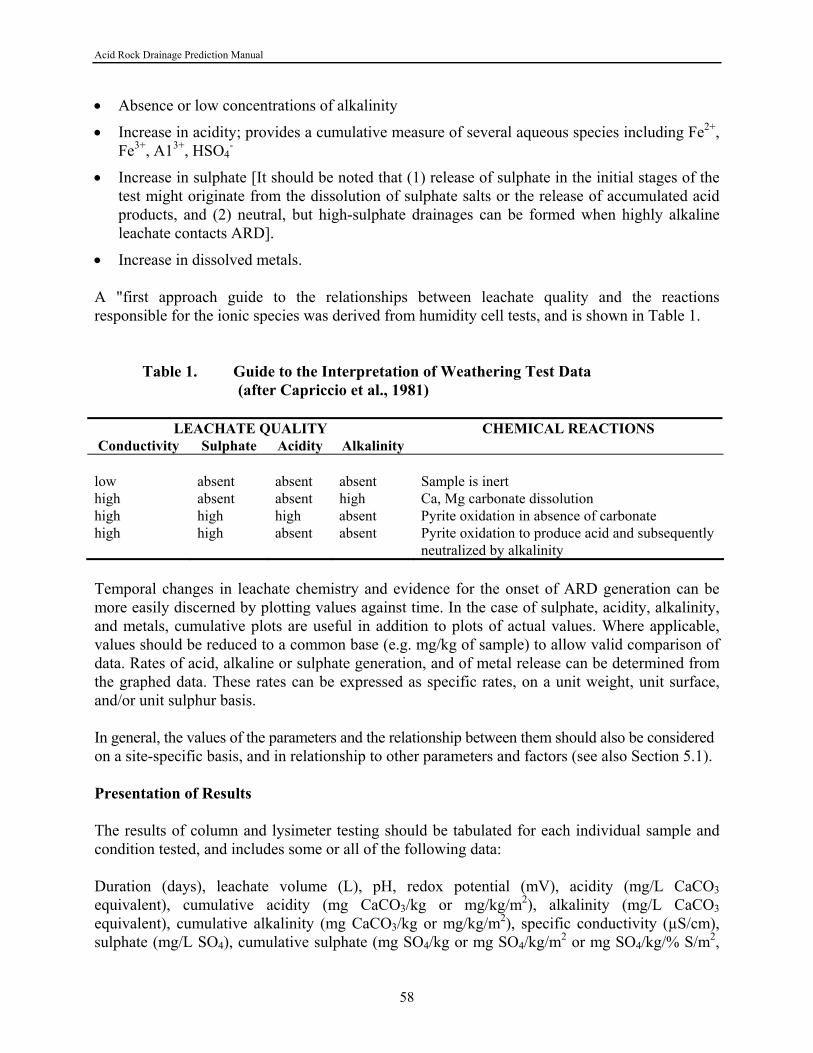
Acid Rock Drainage Prediction Manual
58
• Absence or low concentrations of alkalinity
• Increase in acidity; provides a cumulative measure of several aqueous species including Fe2+, Fe3+, A13+, HSO4
-
• Increase in sulphate [It should be noted that (1) release of sulphate in the initial stages of the test might originate from the dissolution of sulphate salts or the release of accumulated acid products, and (2) neutral, but high-sulphate drainages can be formed when highly alkaline leachate contacts ARD].
• Increase in dissolved metals. A "first approach guide to the relationships between leachate quality and the reactions responsible for the ionic species was derived from humidity cell tests, and is shown in Table 1.
Table 1. Guide to the Interpretation of Weathering Test Data (after Capriccio et al., 1981)
LEACHATE QUALITY CHEMICAL REACTIONS Conductivity Sulphate Acidity Alkalinity low absent absent absent Sample is inert high absent absent high Ca, Mg carbonate dissolution high high high absent Pyrite oxidation in absence of carbonate high high absent absent Pyrite oxidation to produce acid and subsequently
neutralized by alkalinity Temporal changes in leachate chemistry and evidence for the onset of ARD generation can be more easily discerned by plotting values against time. In the case of sulphate, acidity, alkalinity, and metals, cumulative plots are useful in addition to plots of actual values. Where applicable, values should be reduced to a common base (e.g. mg/kg of sample) to allow valid comparison of data. Rates of acid, alkaline or sulphate generation, and of metal release can be determined from the graphed data. These rates can be expressed as specific rates, on a unit weight, unit surface, and/or unit sulphur basis. In general, the values of the parameters and the relationship between them should also be considered on a site-specific basis, and in relationship to other parameters and factors (see also Section 5.1). Presentation of Results The results of column and lysimeter testing should be tabulated for each individual sample and condition tested, and includes some or all of the following data: Duration (days), leachate volume (L), pH, redox potential (mV), acidity (mg/L CaCO3 equivalent), cumulative acidity (mg CaCO3/kg or mg/kg/m2), alkalinity (mg/L CaCO3 equivalent), cumulative alkalinity (mg CaCO3/kg or mg/kg/m2), specific conductivity (µS/cm), sulphate (mg/L SO4), cumulative sulphate (mg SO4/kg or mg SO4/kg/m2 or mg SO4/kg/% S/m2,

Acid Rock Drainage Prediction Manual
59
metals (mg/L) and cumulative metals extracted (mg/kg or mg/kg/m2) Graphical presentation of results can include any or all of the above parameters, usually as a function of time, although the relationship between other parameters can also be presented graphically. Rates of acid generation, sulphide oxidation expressed on a weight, surface area, and/or unit sulphur basis, can be determined from the graphical plots (e.g. mg SO4/m2/week). Advantages of Test
• Accepted method in Canada and the U.S.A.
• Compares favourably with other prediction tests and field data for reliability.
• Relatively simple to set up and operate.
• Larger scale of test allows larger particle sizes of waste to be evaluated.
• Can be used to model saturated and unsaturated waste deposition.
• Rates of acid generation and sulphide oxidation can be determined.
• Temporal variations in acid generation rates can be determined.
• Effect of bacteria can be assessed. (See also Section 5.9).
• Provides assessment of leachate water quality and dissolved metal flux that could be expected from a waste unit.
• ARD control options such as blending of waste rock can be evaluated.
• For larger columns and lysimeters, the evaluation of changes in mineralogy and other effects of weathering with depth, and the determination of effluent quality profiles, can be made.
Disadvantages
• Interpretation of results is sometimes complex.
• Test might require long time for completion (compared with humidity cells) and with relatively high costs.
• Confirmation of ARD potential or the determination of sulphide oxidation rates is often inconclusive due to the time required to deplete NP to levels at which acid generation becomes measurable, even for samples where the NP content is relatively low (e.g. >20 tonnes CaCO3/1000 tonnes). However, columns and lysimeters do permit tests to be carried out over extended periods of time. Pre-acidification of the sample can accelerate the NP depletion process but conditions created might not be realistic.
• Rates of acidity and alkalinity release might not be comparable due to the differences in the kinetics and equilibria of the acid generating, acid consuming, and alkalinity generating reactions.
• Problems might be experienced with uneven solution application and channelling.
• Not practical for a large number of samples.

Acid Rock Drainage Prediction Manual
60
References
Ritcey, G.M., 1989. Tailings Management, Elsevier Science Publishers, Amsterdam
Capriccio, F.T., Geidel, G., and Pelletier, M., 1981. Occurrence and prediction of acid drainages. J. Energy Div. Amer. Soc. Civil Engineers, 107, No. EY1, May, 167-178.
British Columbia AMD Task Force, 1989. Draft Acid Rock Drainage Technical Guide, Vol. 1, Crown Publications, Victoria, B.C.

Acid Rock Drainage Prediction Manual
61
6.4.3. B.C. Research Confirmation Test
Objectives
• to confirm the results of static prediction testing
• to determine if sulphide oxidizing bacteria can generate more acid from a sample than can be consumed
Principles of Test
The acid potential derived by assuming total oxidation of sulphur (sulphides) in static prediction testing may not, under field conditions, be realised. To determine the degree to which the sulphur content of a sample might be oxidized, and to assess if this amount of acid is sufficient to overcome the neutralizing capacity of the sample, a biological oxidation test can be carried out. The test is usually only carried out if the sample is shown to be potentially acid producing in static testing. A pre-acidified pulp containing the finely ground test sample is inoculated with an active culture of sulphide-oxidizing bacteria such as T. ferrooxidans and agitated under ideal conditions for bacterial oxidation. The pulp pH is monitored until stable indicating the end of oxidation. An equivalent weight to the original sample is then added in two increments after 24 and 48 hours and the pH is measured 24 hours after each addition. If the pH is above 3.5 at these times, the sample is classified as a non-acid producer, since the pH is out of the range considered essential for the growth and oxidative activity of the bacteria. If the pH remains below 3.5, a potential for acid generation is indicated. See Section 5.9 for comments on the use of bacteria in prediction testing. Equipment
1 250 mL Erlenmeyer flasks, preferably with a baffled base to facilitate oxygen mass transfer during agitation
2 Temperature controlled gyratory or reciprocating shaker/incubator equipped with clamps for Erlenmeyer flasks (provision for CO2 enrichment of the air is desirable)
3 pH meter equipped with a combination pH electrode 4 Pipet, 5 mL Reagents
1. Sulphuric acid, 6 N or 12 N 2. Distilled or deionized water 3. Reagent grade nutrient salts, typically (NH4)2SO4, KCl, K2HPO4, MgSO4.7H2O, and
Ca(NO3)2 4. Bacterial culture containing T. ferrooxidans [Cultures should be selected based on their
known ability to be able to oxidize ores, waste rock or tailings of similar mineralogy to the test sample. See Section 5.9 for further discussion].
Acid Rock Drainage Prediction Manual
62
Procedure
1. Crush and pulverize the sample to pass a 400 mesh (Tyler) screen.
2. Prepare bacterial cultures for use as inocula using standard laboratory techniques. The cultures should have been previously grown on and adapted to ore or waste rock containing pyrite with a sulphur content at least as high as the test sample. Whole pulp inocula are preferred to cells recovered from solution only. If solids free inocula containing very low soluble metal concentrations are required, these should be prepared by differential centrifugation techniques.
3. In duplicate, weigh out 15-30 g (low weight for high sulphur contents) of sample into an Erlenmeyer flask with 70 mL of a nutrient medium containing (typically) 3 g/L (NH4)2SO4, 0.1 g/L KCl, 0.5 g/L K2HPO4, 0.5 g/L MgSO4.7H2O, and 0.01 g/L Ca(NO3)2.
4. Place flask on shaker and periodically add sulphuric acid (6 or 12 N) as required to bring pH to a stable value between pH 2.5 and 2.8. Do not proceed until pH is stable.
5. Inoculate flasks with 5 mL of an active T. ferrooxidans culture. Record weight of flask, cap flask with a cotton or foam plug, and place on shaker at 35oC.
6. Monitor flask regularly for pH. Before each measurement, add distilled water to bring flask to original weight to allow for evaporation. In some cases, the sampling of flasks for a soluble species (e.g. Fe, Cu, Zn) might assist in determining progress of the oxidation process.
7. When oxidative activity has ceased, as evidenced by a stable pH (or metal concentration), add half the weight of sample originally used and continue shaking for 24 hours.
8. Record the pH and if above 3.5 terminate the test. If not, again add half the weight of sample and agitate for up to an additional 72 hours and record the final pH.
Typically, about 3 to 4 weeks following inoculation are required to complete this test. Interpretation of Results
A decreasing pH following inoculation of the test pulp with bacteria indicates the biochemical oxidation of sulphides contained in the sample. Once a stable pH or soluble metal concentration has been achieved it is assumed that all sulphide available for oxidation has reacted and the maximum of acidity has been generated. By adding more sample equal to the original weight after reaction and observing the pH change, the ability of the sample to generate acid in excess of its neutralizing capacity can be assessed. Specifically, the sample is confirmed to be an acid producer if the pH remains below 3.5. Above this pH, biochemical oxidation is considered to be unlikely, and the sample is classified as a non-acid producer. Reporting of Results
The results of the test should be tabulated to provide the following information:
Sample description, test duration (days after inoculation), initial pH, pH after biological oxidation, pH after 1st increment of sample addition, pH after 2nd increment of sample addition (final pH), confirmation of acid production potential (yes/no).
Acid Rock Drainage Prediction Manual
63
Advantages of Test
• Relatively low cost and rapid kinetic test.
• Has been widely used in Canada.
• Provides an assessment for the potential of biochemical oxidation. Disadvantages of Test
• Although the procedure is apparently simple, tests involving the use of bacteria require experience and can have the problems of (1) non-optimum use of cultures, (2) use of non-adapted cultures, and (3) difficulties of comparing results between different laboratories. (See also Section 5.9).
• Acidification procedure creates an unrealistic condition in that the inhibitory effects of the alkaline components of the waste on oxidation reactions are not evaluated, and the method does not allow evaluation or modelling of the initial ARD production stages in the upper pH ranges.
• The amount of acid generated in the test is not corrected for the initial acid added to bring pH into the range suitable for inoculation. This can bias the result towards an acid classification.
• For samples with high sulphur contents, the amount of sample required by the test procedure might be too large leading to incomplete oxidation of the available sulphur due to inhibition of reaction by reaction products and low pH.
References Bruynesteyn, A. and Hackl, R.P., 1984. Evaluation of acid production potential of mining waste
materials. Minerals and the Environment, 4(1), 5-8.
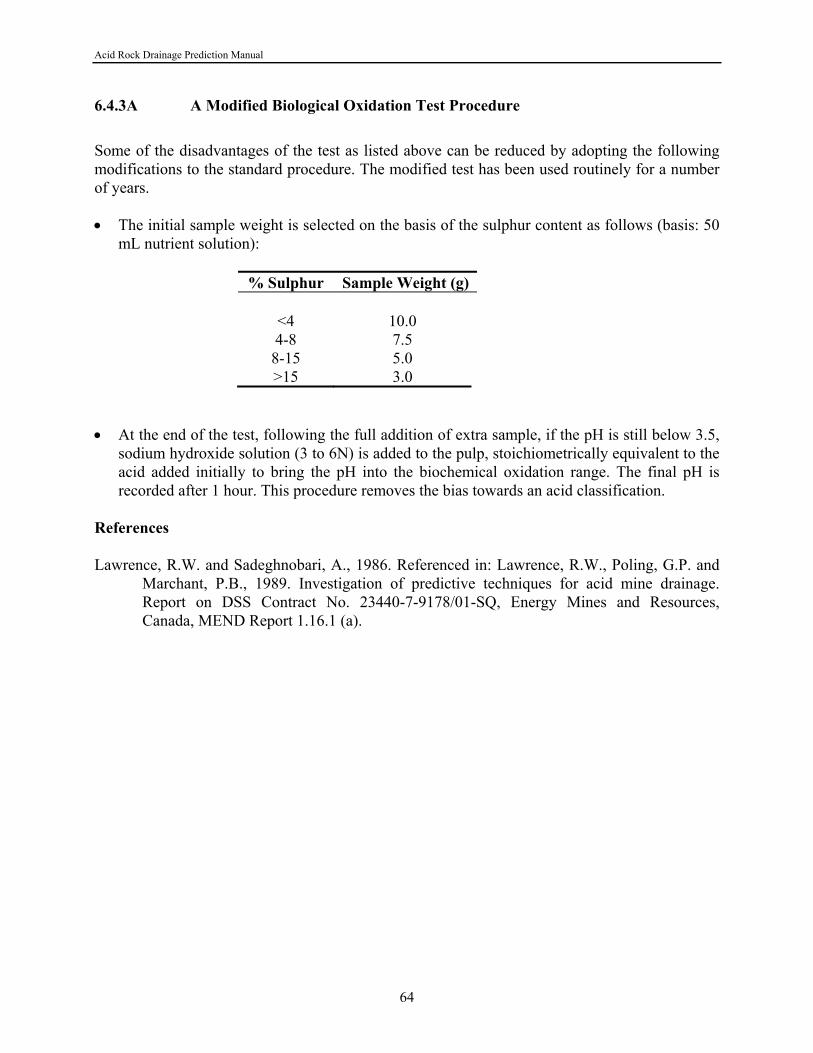
Acid Rock Drainage Prediction Manual
64
6.4.3A A Modified Biological Oxidation Test Procedure
Some of the disadvantages of the test as listed above can be reduced by adopting the following modifications to the standard procedure. The modified test has been used routinely for a number of years. • The initial sample weight is selected on the basis of the sulphur content as follows (basis: 50
mL nutrient solution):
% Sulphur Sample Weight (g)
<4 10.0 4-8 7.5 8-15 5.0 >15 3.0
• At the end of the test, following the full addition of extra sample, if the pH is still below 3.5,
sodium hydroxide solution (3 to 6N) is added to the pulp, stoichiometrically equivalent to the acid added initially to bring the pH into the biochemical oxidation range. The final pH is recorded after 1 hour. This procedure removes the bias towards an acid classification.
References Lawrence, R.W. and Sadeghnobari, A., 1986. Referenced in: Lawrence, R.W., Poling, G.P. and
Marchant, P.B., 1989. Investigation of predictive techniques for acid mine drainage. Report on DSS Contract No. 23440-7-9178/01-SQ, Energy Mines and Resources, Canada, MEND Report 1.16.1 (a).

Acid Rock Drainage Prediction Manual
65
6.5. OTHER KINETIC PREDICTION PROCEDURES
In Section 6.4, the principal kinetic prediction procedures used in Canada and the U.S.A. were described. Other kinetic tests and procedures are, however, in use or in the development stage, including the following tests and procedures which are described in this section:
• Shake Flasks
• Soxhlet Extraction
Acid Rock Drainage Prediction Manual
66
6.5.1. Shake Flasks
Objectives
• to confirm the results of static prediction tests • to determine the rate of and temporal variation in acid generation and leachate water quality Principles of Test
The shake flask test is a laboratory oxidation procedure utilizing agitated Erlenmeyer flasks containing a rock sample pulp to determine the temporal variation in weathering characteristics of the sample. The test can be performed in a number of different ways depending on the program objectives, but could include determination of the effects of time, temperature, pH, and the addition of bacteria. The technique lends itself to the use of factorial experimental designs (e.g. 3 factors at 2 levels).
The test sample is placed in an Erlenmeyer flask together with water or other extractant and/or bacterial cultures. The flask is placed on a shaking apparatus and the leachate sampled periodically for analysis of parameters that could include, pH, sulphate, acidity, alkalinity, conductivity, redox potential, and metals. An alternative, and more reliable, procedure is to set up several duplicate flasks for each set of conditions and to remove one flask for total analysis at each selected time interval. Equipment
1. Erlenmeyer flasks, 250, 500 or 1000 mL 2. Gyratory or reciprocating shaker equipped with flask clamps 3. Burettes, 100 mL (0.1 mL graduation) 4. Pipettes, 10 mL, 25 mL, 50 mL 5. Magnetic stirrer 6. pH meter equipped with a combination electrode 7. Redox potential meter, equipped with a redox probe 8. Conductivity meter 9. Millipore filter apparatus and 0.45 µm membrane filters 10. Plastic sample bottles Reagents
1. Distilled (or deionized) water 2. Certified grade, 0.1 N hydrochloric acid, for standardization of bases 3. Approximately 0.1 N sodium hydroxide, standardized 4. Approximately 0.1 N hydrochloric acid, standardized 5. Approximately 0.01 N sodium hydroxide, standardized 6. Approximately 0.01 N hydrochloric acid, standardized 7. Sulphuric and nitric acid for preparing simulated acid rain (if required)

Acid Rock Drainage Prediction Manual
67
Procedure
1. Crush and pulverize sample to a target size of 80 percent minus 200 mesh (Tyler) or as required by the program objectives. Tailings should be tested at the received particle size.
2. Split out sub-samples and prepare for analysis for sulphur species, metals, mineralogy, and surface area as required for the test program.
3. Weigh out sample into Erlenmeyer flasks and add distilled water or other extractant. For a 250 mL flask, 50 g of sample and 150 mL of extractant might be suitable. If shaker space is available, a recommended procedure is to set up several identical flasks for each proposed experimental condition to allow analysis of entire flask contents at different times.
4. Add, as and if required, acid for pH adjustment or other reagents (acid rain components, bacterial nutrients). Bacteria may be added at this time.
5. Place flasks on shaker (at different temperatures if required). At different times (weekly, bi-weekly, or as required), either (a) sample each flask by removing a solution aliquot by pipet for analysis, or (b) remove one flask for analysis of the total leachate if multiple flasks have been set up.
6. Filter leachates as required for each analytical procedure and analyze for parameters specified by the experimental design. These might include pH, conductivity, redox potential, acidity, alkalinity, sulphate, dissolved metals and other species.
7. pH is measured using the pH meter and combination electrode; redox potential is measured using the redox meter and probe; specific conductivity is determined using the conductivity meter; acidity is determined by titration with base to an end point of either pH 4.5 (free acidity) or pH 8.3 (total acidity); alkalinity is determined by titration with acid to an end point of pH 4.5; sulphate is determined using standard analytical procedures which could include the use of a field-type sulphate analyzer such as a HACH DR-EL kit; dissolved metals can be analyzed by ICP-AES, AAS or other accepted methods.
Interpretation of Results
The extent of weathering and generation of ARD can be deduced from the results of the analysis of the leachates. For example, sulphate ion originates primarily from the oxidation of sulphide; conductivity is a measure of the ionic strength of the leachate and reflects the reactivity of the sample; the acidity and alkalinity values provide a measure of the balance between the acid and alkaline producing components of the sample. In general, indication of the potential for ARD generation is associated with the following conditions and changes in parameters:
• Decrease in pH; above pH 5-5.5, the sample is not generating significant acid and/or the system is dominated by alkalinity from calcareous material; at or below pH 5-5.5, the potential role of iron-oxidizing bacteria becomes significant; from pH 3 to 5, sample is acid generating and acid toxic conditions exist; below pH 3.5, the role of the bacterium T. ferrooxidans can be very significant, and strongly acid generating conditions exist.
• Increase in specific conductivity.

Acid Rock Drainage Prediction Manual
68
• Increase in redox potential; in early stages of ARD generation, redox values might be relatively low (< 400 mV SCE); higher values of redox (> 450 mV) indicate a more vigorous oxidation environment and influence of iron-oxidizing bacteria. Above 500 mV, ferric iron oxidation of the sulphide minerals can become significant.
• Absence or low concentrations of alkalinity.
• Increase in acidity; provides a cumulative measure of several aqueous species including Fe2+, Fe3+, A13+, HSO4
-.
• Increase in sulphate [It should be noted that release of sulphate originating from the dissolution of sulphate salts or the release of accumulated acid products might occur very early in the test and should be accounted for].
• Increase in dissolved metals. A "first approach” guide to the relationships between leachate quality and the reactions responsible for the ionic species was derived for humidity cell tests and is shown in Table 1. Table 1. Guide to the Interpretation of Humidity Cell Data (after Capriccio et al., 1981)
LEACHATE QUALITY CHEMICAL REACTIONS Conductivity Sulphate Acidity Alkalinity low absent absent absent Sample is inert high absent absent high Ca, Mg carbonate dissolution high high high absent Pyrite oxidation in absence of carbonate high high absent absent Pyrite oxidation to produce acid and subsequently
neutralized by alkalinity Temporal changes in leachate chemistry and evidence for the onset of ARD generation can be more easily discerned by plotting values against time. In the case of sulphate, acidity, alkalinity, and metals, cumulative plots are useful in addition to plots of actual values. Where applicable, values should be reduced to a common base (e.g. mg/kg of sample) to allow valid comparison of data. Rates of acid, alkaline or sulphate generation, and of metal release can be determined from the graphed data. These rates can be expressed as specific rates, on a unit weight, unit surface, and/or unit sulphur basis. In a factorial design experiment, the rates of sulphate or acid generation obtained at different factor levels can be determined by statistical regression analysis and examined for significance. In general, the values of the parameters and the relationship between them should also be considered on a site-specific basis, and in relationship to other parameters and factors (see also Section 5.1). It should be noted that experimental conditions for the shake flask test can vary widely. Indicators of ARD may therefore exhibit a corresponding variability and the above discussion should be used only as a general guide. Presentation of Results

Acid Rock Drainage Prediction Manual
69
The results of shake flask testing should be tabulated for each individual sample tested and include some or all of the following data:
Duration (days), leachate volume (mL), pH, redox potential (mV), acidity (mg/L CaCO3 equivalent), cumulative acidity (mg CaCO3/kg or mg/kg/m2), alkalinity (mg/L CaCO3 equivalent), cumulative alkalinity (mg CaCO3/kg or mg/kg/m2), specific conductivity (μS/cm), sulphate (mg/L SO4), cumulative sulphate (mg SO4/kg or mg SO4/kg/m2 or mg SO4/kg/%/m2, metals (mg/L) and cumulative metals extracted (mg/kg or mg/kg/m2)
Graphical presentation of results can include any or all of the above parameters, usually as a function of time, although the relationship between other parameters can also be presented graphically. Rates of acid generation, sulphide oxidation expressed on a weight or surface area basis can be determined from the graphical plots (e.g. mg SO4/m2/week). Advantages of Test
• Simple to set up and operate.
• Models acid production and consumption reactions kinetically. Rates of acid generation and sulphide oxidation can be determined.
• Provides some assessment of leachate water quality and dissolved metal flux that could be expected from a waste unit.
• Effects of parameters such as pH, temperature and bacteria can be assessed. Disadvantages
• Procedure not standardized.
• Test not widely used.
• Interpretation of results can be complex.
• Tests might require a long time for completion and with relatively high costs.
• A large number of flasks might be required for a modest sized test program.
• In the closed system of this procedure, the limited solubility of the alkaline components compared with the much higher solubility of the oxidation products (sulphate, metals), does not allow comparison of the acidity and alkalinity release rates.
References
Halbert, B.E., Schaver, J.M., Knapp, R.A., and Gorber, D.M., 1983. Determination of acid generation rates in pyritic mine tailings. 56th Annual Conference of the Water Pollution Control Federation, October 2-7, Atlanta, GA.
Lawrence, R.W., Poling, G.P. and Marchant, P.B., 1989. Investigation of predictive techniques
for acid mine drainage. Report on DSS Contract No. 23440-79178/01-SQ, Energy Mines and Resources, Canada, MEND Report 1.16.1 (a).

Acid Rock Drainage Prediction Manual
70
6.5.2. Soxhlet Extraction
Objectives
• to provide a rapid confirmation of static prediction test results • to model geochemical weathering reactions Principles of Test
A Soxhlet extraction apparatus provides a chamber (the thimble) in which a sample is placed and subjected to leaching with condensate produced by the boiling of the leachate in a reservoir. In the standard extractor, the condensate is at high temperature and creates a highly reactive and aggressive reaction environment in the thimble, providing an assessment of the ultimate leachability of the sample. Modified extractors can be used in which the condensate cools to around 30ºC before contacting the sample in the thimble. This modification is claimed to simulate more accurately the conditions encountered in the natural weathering environment. Equipment
1. Standard or modified (preferred) Soxhlet extraction apparatus 2. pH meter, equipped with a combination pH electrode 3. Burettes, 100 mL (0.1 mL graduation) 4. Pipettes, 10 mL, 25 mL, 50 mL 5. Magnetic stirrer 6. Redox potential meter, equipped with a redox probe 7. Conductivity meter 8. Millipore filter apparatus and 0.45 µm membrane filters 9. Plastic sample bottles Reagents
1. Distilled (or deionized) water 2. Certified grade, 0.1 N hydrochloric acid, for standardization of bases 3. Approximately 0.1 N sodium hydroxide, standardized 4. Approximately 0.1 N hydrochloric acid, standardized 5. Approximately 0.01 N sodium hydroxide, standardized 6. Approximately 0.01 N hydrochloric acid, standardized Procedure
1. Crush and pulverize sample to a target size of 80 percent minus 200 mesh (Tyler) or as required by the program objectives. Tailings should be tested at the received particle size.
2. Split out sub-samples and prepare for analysis for sulphur species, metals, mineralogy, and surface area as required for the test program.
3. Weigh out the appropriate amount of sample and place in the extraction thimble. Place thimble in the Soxhlet apparatus. Place a known volume of distilled water in the reservoir.
4. Operate the Soxhlet apparatus in the standard manner for up to 3 weeks, typically 1 to 2 weeks.
Acid Rock Drainage Prediction Manual
71
5. Sample the leachate periodically, filter as required for each analytical procedure, and analyze for parameters specified by the experimental design. These might include pH, conductivity, acidity, alkalinity, sulphate, and dissolved metals of interest. Precipitates forming in the reservoir, particularly on the walls, can be removed, if required, by acid digestion, to complete the metals balance.
6. pH is measured using the pH meter and combination electrode; conductivity is determined using the conductivity meter; acidity is determined by titration with base to an end point of either pH 4.5 (free acidity) or pH 8.3 (total acidity); alkalinity is determined by titration with acid to an end point of pH 4.5; sulphate is determined using standard analytical procedures which could include the use of a field-type sulphate analyzer such as a HACH DR-EL kit; dissolved metals can be analyzed by ICP-AES, AAS or other accepted methods
Interpretation of Results
The reactions in a Soxhlet extraction test can be rapid. The extent of weathering and generation of ARD can be deduced from the results of the analysis of the leachates. For example, sulphate ion originates primarily from the oxidation of sulphide; pH provides an indication of the acidity generated; acidity and alkalinity values can provide a measure of the balance between the acid and alkaline producing components of the sample. In general, indication of the potential for ARD generation is associated with the following conditions and changes in parameters:
• Decrease in pH; above pH 5-5.5, the sample is not generating significant acid and/or the system is dominated by alkalinity from calcareous material; at or below pH 5-5.5, the potential role of iron-oxidizing bacteria becomes significant; from pH 3 to 5, sample is acid generating and acid toxic conditions exist; below pH 3.5, the role of the bacterium T. ferrooxidans in the field can be very significant, and strongly acid generating conditions exist.
• Increase in conductivity.
• Absence or low concentrations of alkalinity.
• Increase in acidity; provides a cumulative measure of several aqueous species including Fe2+, Fe3+, Al3+, HSO4
-
• Increase in sulphate [It should be noted that release of sulphate originating from the dissolution of sulphate salts or the release of accumulated acid products might occur very early in the test and could be accounted for. However, distinction between oxidation products resulting from prior reaction and those produced in this aggressive procedure might not be possible].
• Increase in dissolved metals. In general, Soxhlet extraction tests produce less data than are generated in humidity cells, columns, and other long term kinetic prediction tests. However, plotting the changes in various parameters as a function of time can still provide useful visual representation of the temporal changes in leachate chemistry and evidence for the onset of ARD generation. Where applicable, values should be reduced to a common base (e.g. mg/kg of sample) to allow valid comparison of data. Rates of acid, alkaline or sulphate generation, and of metal release can be determined from

Acid Rock Drainage Prediction Manual
72
the graphed data. These rates can be expressed as specific rates, on a unit weight, unit surface, and/or unit sulphur basis. In general, the values of the parameters and the relationship between them should also be considered on a site-specific basis, and in relationship to other parameters and factors (see also Section 5.1). Presentation of Results
The results of Soxhlet extraction tests should be tabulated for each individual sample tested and include some or all of the following data:
Duration (days), pH, acidity (mg/L CaCO3 equivalent), alkalinity (mg/L CaCO3 equivalent), conductivity (µS/cm), sulphate (mg/L SO4), cumulative sulphate (mg SO4/kg or mg SO4/kg/m2 or mg SO4/kg/% S/m2), metals (mg/L or mg/kg) Graphical presentation of results can include any or all of the above parameters, usually as a function of time. Advantages of Test
• Relatively simple to perform.
• Rapid generation of results.
• Might provide confirmation of the results of static prediction testing.
• Provides an assessment of the interaction between acid producing and acid consuming reactions. Disadvantages
• Test not widely used and not proven for ARD prediction. Method still in development stage.
• Test results difficult to interpret.
• The relationship to natural weathering processes is uncertain.
• The refluxing action of the apparatus can change the leachate chemistry significantly (particularly when refluxed condensate is above ambient temperature). May be unsuitable method to properly assess reaction rates and leachate quality.
• Oxidation might be too rapid to provide indication of the sulphide oxidation rate.
• The Soxhlet apparatus is not part of typical laboratory inventory. The modified Soxhlet apparatus is not standard and requires custom manufacture.
References Singleton, G.A. and Lavkulich, L.M., 1978. Adaption of the Soxhlet extractor for pedalogic
studies. Soil Sci. Soc. Am. J., 42, 984-6. Sullivan, P.J. and Sobek, A.A., 1982. Laboratory weathering studies of coal refuse. Minerals and
the Environment. 4(1), 9-16.

Acid Rock Drainage Prediction Manual
73
7. REFERENCES AND BIBLIOGRAPHY
References are listed alphabetically by author. To facilitate searches for information on particular topics, references have been classified according to the following topic numbers:
1. General References 2. Prediction Procedures 3. Comparative Studies 4. Field Studies 5. Sampling 6. Modelling and Kinetics 7. Regulations
The numbers in the column to the right of the reference entries denote the topic classification according to the list above. Topic Albright, R., 1987. Prediction of acid drainage in Meguma slates. Proc. Acid Mine Drainage Workshop, Environment Canada, Transport Canada, 146-62.
4
Bradham, W.S. and Capriccio, F.T., 1990. A comparative study of tailings analysis using acid/base accounting cells, columns and soxhlets. 1990 Mining and Reclamation Conference and Exhibition, Charleston, West Virginia, April 23-26.
4
Brady, K.B.C., Shaulis, J.R., and Skema, V.W., 1988. A study of mine drainage quality and prediction using overburden analysis and paleoenvironmental reconstructions, Fayette County, Pennsylvania. In: Mine Drainage and Surface Mine Reclamation, Vol. 1, Mine Water and Mine Waste, USBM IC 9183, 33-43.
3
British Columbia AMD Task Force, 1989. Draft Acid Rock Drainage Technical Guide. Vol. 1. Crown Publications, Victoria, B.C.
1
Bruynesteyn, A. and Hackl, R.P., 1984. Evaluation of acid production potential of mining waste materials. Minerals and the Environment, 4(1), 5-8.
2
Canect Environmental Technologies, 1990. Field sampling manual for reactive tailings. MEND Report 4.1.1.
5
Capriccio, F.T. and Geidel, G., 1981. Estimating the minimum acid load that can be expected from a coal strip mine. Proc. Symposium on Surface Mining, Hydrology, Sedimentology, and Reclamation, D.H. Graves, Ed., December 7-11, Lexington, Kentucky, 117-122.
4
Capriccio, F.T., Geidel, G., and Pelletier, M., 1981. Occurrence and prediction of acid drainages. J. Energy Div. Arner. Soc. Civil Engineers, 107, No. EY1, May, 167-178.
2,3

Acid Rock Drainage Prediction Manual
74
Capriccio, F.T., Ferm, J.C., Horne, J., Geidel, G., and Baganz, B., 1977. Paleoenvironment of coal and its relation to drainage quality. EPA 600/7/7-77-067. pp.118.
1
Cherry, J.A., Gillham, R.W. and Nicholson, R.V., 1984. The study of kinetic controls on pyrite oxidation with application to abandonment of pyritic uranium tailings. National Uranium Tailings Program, Energy Mines and Resources Canada, DSS Report No. 20ST.23241-3-1664
6
Davis, G.B. and Ritchie, A.I.M., 1982. A mathematical model of pyritic oxidation in waste rock dumps. Proc. 5th Conf. of Simulation Soc. of Australia. May, 137-141.
6
Davis, G.B. and Ritchie, A.I.M., 1986. A model of oxidation in pyritic mine wastes: Part 1, equations and approximate solutions. Appl. Math. Modelling, Vol. 10, 314-322.
6
Davis, G.B., Doherty, G. and Ritchie, A.I.M., 1986. A model of oxidation in pyritic mine wastes: Part 2, comparison of numerical and approximate solutions. Appl. Math. Modelling, Vol. 10, 323-329.
6
di Pretorio, R.S. and Rauch, H.W., 1988. Use of acid base accounting in preliminary prediction of acid drainage potential: a new approach from northern West Virginia. In: Mine Drainage and Surface Mine Reclamation, Vol. 1, Mine Water and Mine Waste, USBM IC 9183, 2 -10.
2
Doyle, F.M. and Mirza, A.H., 1990. Understanding the mechanisms and kinetics of acid and heavy metals release from pyritic wastes. Proc. Western Regional Symposium on Mining and Mineral Processing Wastes, Ed. F.M. Doyle, May 30-June 1, Berkeley, CA, AIME/SME Publication, Littleton, CO., 43-51.
6
Duncan, D.W. and Bruynesteyn, A., 1979. Determination of the Acid Production Potential of Waste Materials, Metallurgical Society of AIME Annual Meeting, New Orleans, Paper A-79-29, 10pp.
2
Environmental Protection Agency, 1989. Federal Register, Vol. 54, No. 109, Sept. 1, 1989, 40 CFR, Part 261, Section IIB5.
2,7
Erickson, P.M., Hammack, R.W., and Kleinmann, R.L.P., 1985. Prediction of acid drainage potential in advance of mining. In: Control of Acid Mine Drainage, USBM IC 9027, 3-11.
2
Evangelou, V.P., Roberts, K. and Szekeres, G.W., 1985. The Use of an Automated Apparatus for Determining Coal Spoil Carbonate Types, Content, and Reactivity. Proceedings Symposium on Surface Mining, Hydrology, Sedimentology and Reclamation, December 9-13, Lexington, Kentucky.
2
Acid Rock Drainage Prediction Manual
75
Ferguson, K.D., 1986. Static and kinetic methods to predict acid mine drainage. In: Fundamental and Applied Biohydrometallurgy, Eds. R.W. Lawrence, R.M.R. Branion and H.G. Ebner, Elsevier Science Publishers. Amsterdam.
3
Ferguson, K.D. and Erickson, P.M., 1987. Will it generate AMD? An overview of methods to predict acid mine drainage. Proceedings Acid Mine Drainage Workshop, Halifax, Nova Scotia, March 23-26, Environment Canada.
3
Garrels, R.M. and Christ, C.L., 1965. Solutions, Minerals, and Equilibria. Harper and Row, New York.
1
Geidel. G., 1979. Alkaline and acid production potentials of overburden material: the rate of release. Reclamation Review, Vol. 2, 101-107.
6
Halbert, B.E., Schaver, J.M., Knapp, R.A., and Gorber, D.M., 1983. Determination of acid generation rates in pyritic mine tailings. 56th Annual Conference of the Water Pollution Control Federation, October 2-7. Atlanta, GA.
2
Hammack, R.W., 1985. The relationship between the thermal activity of pyrite and the rate of acid generation. Symposium on Surface Mining, Hydrology, Sedimentology, and Reclamation, December 9-13, Lexington, Kentucky.
2,6
Harries, J.R. and Ritchie, A.I.M., 1981. The use of temperature profiles to estimate the pyritic oxidation rate in a waste rock dump from an opencut mine. Water, Air and Soil Pollution, Vol. 15, 405-423.
4
Henderson, R.M. and Norton, P.J., 1984. A method of predicting the pollution potential of surface mining backfill. Int. J. Mine Water, 3(1), 41-55.
2
Kleinmann, R.P.L, Crerar, D.A., and Pacelli, R.R., 1981. Biogeochemistry of Acid Mine Drainage and a Method to Control Formation, Mining Engineering, Mar., pp. 300-305.
1
Lapakko, K., 1987. Prediction of AMD from Duluth complex mining waste in North Eastern Minnesota. Acid Mine Drainage Workshop. DSS Cat. No. EN 40-11-711987E 187-221.
4
Lapakko, K. 1990. Solid phase characterization in conjunction with dissolution experiments for prediction of drainage quality. Proc. Western Regional Symposium on Mining and Mineral Processing Wastes, Ed. F.M. Doyle, May 30-June 1, Berkeley, CA, AIME/SME Publication, Littleton, CO.
2
Lawrence, R.W., 1990. Prediction of the behaviour of mining and processing wastes in the environment. Proc. Western Regional Symposium on Mining and Mineral Processing Wastes, Ed. F.M. Doyle, May 30-June 1, Berkeley, CA, AIME/SME Publication, Littleton, CO., 115-121.
2

Acid Rock Drainage Prediction Manual
76
Lawrence, R.W., Poling, G.P. and Marchant, P.B., 1989. Investigation of predictive techniques for acid mine drainage. Report on DSS Contract No. 23440-7-9178/01-SQ, Energy Mines and Resources, Canada, MEND Report 1.16.1 (a).
3
Lawrence, R.W., Poling, G.W., Ritcey, G.M., and Marchant, P.B., 1989. Assessment of Predictive Methods for the Determination of AMD Potential of Mine Tailings and Waste Rock. Proc. Symposium on Tailings and Effluent Management, Eds. M.E Chalkley et al., Pergamon Press, New York, 317-331.
3
Miller, S.D., Jeffrey, J.J. and Murray, G.S.C., 1990. Identification and management of acid generating mine wastes - procedures and practices in South East Asia and the Pacific regions. Proc. Lisboa 90: Acid Mine Water in Pyritic Environments, Lisboa, Portugal, September 16-19, 57-70.
2
Morin, K.A. 1990. Problems and Potential Solutions in Predicting Acid Drainage With Acid Base Accounting. Proceedings, Conference on Acid Mine Drainage - Designing for Closure, Annual Meeting of Geological Association and Mineralogical Association of Canada, May 16-18, Vancouver, BC.
1,2
Morin, K.A., Ott, C.L., Day, S.J., and Hawes, R.A., 1989. A practical approach to testing for acid mine drainage in the mine planning and approval process. Proc.13th B.C. Mine Reclamation Symposium, Vernon, B.C., June 7-9, 69-79.
2
Ritcey, G.M., 1989. Tailings Management, Elsevier Science Publishers, Amsterdam 1,2 Ritcey, G.M. and Chomyn, B.A. 1984. Development of methodology for prediction of migration of contaminants and radionuclides from uranium tailings based on lysimeter experimentation, CANMET, Energy Mines and Resources Canada, Report MRP/MSL 84-ll(OP).
2
Ritcey, G.M. and Silver, M., 1982. Lysimeter Investigations on Uranium Tailings at CANMET, The Canadian Mining and Metallurgical Bulletin. Vol. 75. No. 846. pp. 134-143.
2
Singleton, G.A. and Lavkulich, L.M., 1978. Adaption of the Soxhlet extractor for pedalogic studies. Soil Sci. Soc. Am. J., 42, 984-6.
2
Sobek, A.A., Schuller, W.A., Freeman, J.R. and Smith, R.M., 1978. Field and Laboratory Methods Applicable to Overburdens and Minesoils, EPA 600/2-78-054, 203pp.
1,2
Standard Methods, 1981. Standard Methods for the Examination of Water and Wastewater, 15th Edition, American Public Health Association, Washington, DC.
1
Acid Rock Drainage Prediction Manual
77
Sturey, C.S., Freeman, J.R., Sturm, J.W. and Keeney, T.A., 1982. Overburden Analyses by acid base accounting and simulated weathering studies as a means of determining the probable hydrological consequences of mining and reclamation. Proc. Symposium on Surface Mining, Hydrology, Sedimentology, and Reclamation, December 6-10, Lexington, Kentucky, 163-179.
2
Sullivan, P.J. and Sobek, A.A., 1982. Laboratory weathering studies of coal refuse. Minerals and the Environment, 4(1), 9-16.
4
Taggart, A.F. 1927. Handbook of Ore Dressing, John Wiley and Sons, New York, pp.499.
5