Embed Size (px)
Citation preview
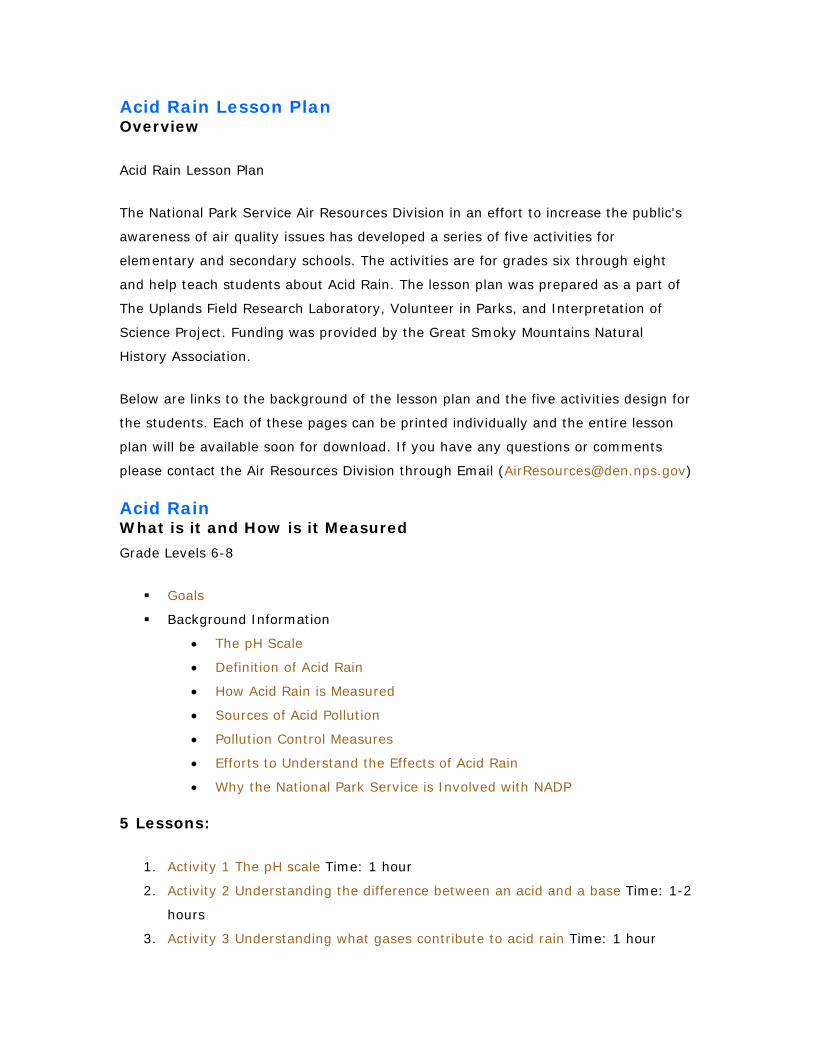
Acid Rain Lesson Plan Overview
Acid Rain Lesson Plan
The National Park Service Air Resources Division in an effort to increase the public's
awareness of air quality issues has developed a series of five activities for
elementary and secondary schools. The activities are for grades six through eight
and help teach students about Acid Rain. The lesson plan was prepared as a part of
The Uplands Field Research Laboratory, Volunteer in Parks, and Interpretation of
Science Project. Funding was provided by the Great Smoky Mountains Natural
History Association.
Below are links to the background of the lesson plan and the five activities design for
the students. Each of these pages can be printed individually and the entire lesson
plan will be available soon for download. If you have any questions or comments
please contact the Air Resources Division through Email ([email protected])
Acid Rain What is it and How is it Measured
Grade Levels 6-8
Goals
Background Information
• The pH Scale
• Definition of Acid Rain
• How Acid Rain is Measured
• Sources of Acid Pollution
• Pollution Control Measures
• Efforts to Understand the Effects of Acid Rain
• Why the National Park Service is Involved with NADP
5 Lessons:
1. Activity 1 The pH scale Time: 1 hour
2. Activity 2 Understanding the difference between an acid and a base Time: 1-2
hours
3. Activity 3 Understanding what gases contribute to acid rain Time: 1 hour
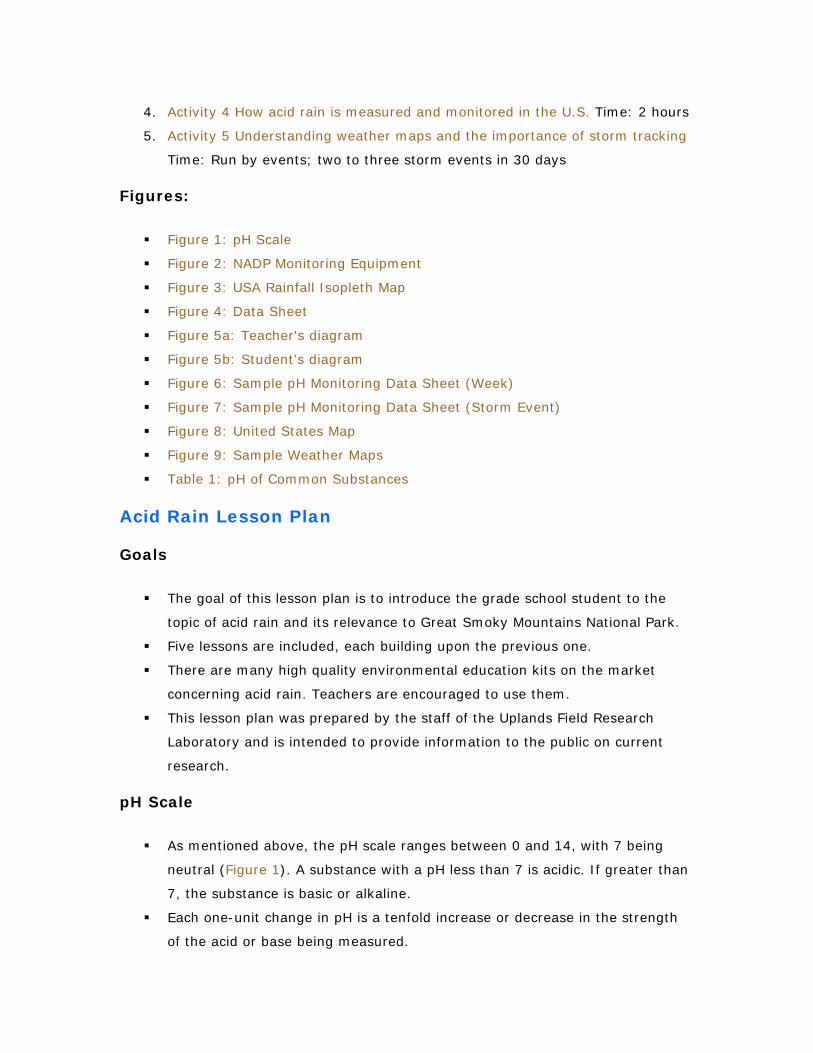
4. Activity 4 How acid rain is measured and monitored in the U.S. Time: 2 hours
5. Activity 5 Understanding weather maps and the importance of storm tracking
Time: Run by events; two to three storm events in 30 days
Figures:
Figure 1: pH Scale
Figure 2: NADP Monitoring Equipment
Figure 3: USA Rainfall Isopleth Map
Figure 4: Data Sheet
Figure 5a: Teacher's diagram
Figure 5b: Student's diagram
Figure 6: Sample pH Monitoring Data Sheet (Week)
Figure 7: Sample pH Monitoring Data Sheet (Storm Event)
Figure 8: United States Map
Figure 9: Sample Weather Maps
Table 1: pH of Common Substances
Acid Rain Lesson Plan Goals
The goal of this lesson plan is to introduce the grade school student to the
topic of acid rain and its relevance to Great Smoky Mountains National Park.
Five lessons are included, each building upon the previous one.
There are many high quality environmental education kits on the market
concerning acid rain. Teachers are encouraged to use them.
This lesson plan was prepared by the staff of the Uplands Field Research
Laboratory and is intended to provide information to the public on current
research.
pH Scale
As mentioned above, the pH scale ranges between 0 and 14, with 7 being
neutral (Figure 1). A substance with a pH less than 7 is acidic. If greater than
7, the substance is basic or alkaline.
Each one-unit change in pH is a tenfold increase or decrease in the strength
of the acid or base being measured.
A unit change from pH 5 to pH 3 would be a hundred times (10 x 10) increase
in acidity.
Definition of Acid Rain
Robert Angus Smith, an English chemist, first used the phrase "acid rain" in
1852 when he noted the connection between London's polluted skies and the
acidity of its rainfall.
Most Scientists agree that "normal" rainfall has a pH of 5.6. Rain in the
atmosphere reacts with carbon dioxide (CO2) to form a weak carbonic acid,
altering the rain pH to 5.6.
Acid rain is defined as any form of wet precipitation which has a pH less than
5.6 (on a scale of 0 to 14, with 7 being neutral). The "rain" becomes acidic
when water molecules (H2O) react with gases in the air.
These gases are primarily sulfur dioxide (SO2) and various nitrogen oxides
(NOx). This combination of gases and water molecules takes place when the
water captures (attracts) hydrogen ions (H+) from the gases (ions are
electrically charged particles in molecules).
How Acid Rain is Measured
The pH test can be done in different ways. Two common methods use either a
pH meter or a pH comparator kit.
A pH meter is a piece of equipment which measures the concentration of
hydrogen ions in a solution. The pH meter uses a probe called an electrode,
and a dial with a pH scale. The electrode and the ion meter sample a solution,
"calculate" the H+ concentration, and record it on the dial. These pH meters
are very expensive if highly accurate readings are required.
A pH comparator kit is designed to calculate pH using indicator chemicals.
One type of pH comparator uses acid-base titrations (a titration is a method
of measuring the amount of something in a solution; in this case, the amount
of acid in rain). With titrations, an indicator chemical (e.g., phenolphthalein)
is added drop-by-drop to the sample. The number of drops needed to change
the color of the sample is used to calculate the pH of the rain.
Litmus paper uses indicator chemicals, which are combined with a special
absorbent paper. When this paper comes into contact with anything acid, it
will change to a certain color which, when compared to a chart of standard
colors, indicates the pH. This litmus paper is made for both acids and bases
and is inexpensive (The results will not be as accurate as using a pH meter,
however).
The final type of comparator kit uses chemicals, which are added to the rain
sample. The indicator will change the color of the sample, which is then
compared with the appropriate standard color and pH.
Sources of Acid Pollution
From information gathered in the 1930's and 1950's, it appears that the
acidity of rainfall in the eastern United States has increased significantly (in
Great Smoky Mountains National Park: 1956 - 5.6; 1980 - 4.27). Some
scientists dispute this theory, however.
The gases sulfur dioxide (SO2) and various nitrogen oxides (NOx) are mainly
responsible for the increase in acidity.
These gases are primarily created by industrial factories, coal-fired power
plants, and car emissions.
It has been estimated that approximately 26 million tons of SO2 and 22
million tons of NOx were put into the atmosphere in the United States in
1980. (If 1 ton = 20 students each weighing 100 lbs., how many students =
48 million tons of pollutants? Answer: 960 million or approximately 1 billion
students).
Some scientists believe that natural sources of SO2 and NOx (forest fires,
lightning, volcanoes, etc.) have an equally important effect on acid rain (pH
levels) as manmade sources.
Areas where the soil has been disturbed (mines, forest fires, landslides,
construction sites) may be making water in streams and lakes more acidic.
Many soils are already acidic or contain minerals which react with rainwater,
snow melt, etc., to form acids. These acidic waters are carried into stream
and lakes.
The gases SO2 and NOx are thought to be carried long distances by air
currents. Storm systems also move long distances, carrying with them any
pollutants they may pick up. The interaction of airborne pollutants and clouds
is not well understood.
Understanding the movement of prevailing air currents and storm systems
can greatly aid scientists in discovering where acid rain is coming from and,
just as importantly, where the rain is returning to earth.
Scientists hope to learn more about the movements of acid rain by studying
storm events, high and low pressure movements (high pressure usually is an
indication of good, clear weather, whereas low pressure fronts are associated
with storms), and occluded fronts. Occluded fronts normally precede storm
events, thus making them a good indicator for tracking storm events.
Researchers are attempting to track where the pollution (gases, fly-ash, soot,
and dust particles) goes when it leaves the heavy industrial and populated
areas by making projections of storm event and air current movements.
Pollution Control Measures
Currently, there are two primary methods being used by industries and power
plants to reduce the amount of pollutants released into the atmosphere.
These two methods consist of installing cleansing devices in exhaust or
"smoke" stacks. The two types currently available are called "scrubbers" and
electrostatic precipitators.
Scrubbers are designed to remove the various gases (SO2) from the plant
emissions. These are considered to be very effective, and many states and
EPA (Environmental Protection Agency) require that these be installed.
Electrostatic precipitators are less effective than scrubbers. They are designed
to remove the visible soot from the emissions. This makes the emissions look
clean but does not remove the real culprits of acid rain, SO2 and NOx.
Cleaner vehicles are produced in the United States which recirculate
automobile exhaust back to the engine in order to burn extra NOx. Many
people think that catalytic converters do this job, but this is not true.
Converters are designed to remove hydrocarbons (benzene, for instance)
which are thought to cause cancer.
By increasing the number of electric vehicles on the road we can decrease the
total amount of NOx emissions from automobiles. California is currently
requiring that 10% of all new cars sold in the state be zero emission vehicles
(electric).
Efforts to Understand the Effects of Acid Rain
The United States government is concerned about the possible problems with
acid rain. There are many indications that acid rain is beginning to take its toll
of the streams, lakes, forests, and wildlife of the United States.
Many Federal and State agencies began a national acid rain monitoring
network called the National Atmospheric Deposition Program (NADP) in 1978.
The NADP headquarters is located at the Illinois State Water Survey in
Champaign. Its purpose is to gather data on atmospheric deposition in this
country.
There are 200 NADP collecting stations across the country. These sites are set
up to collect precipitation (snow, rain, ice, etc.). Figure 2 shows the
equipment used by the NADP to collect these samples.
In order to have data which can be compared in different parts of the country,
NADP collects the samples from every site on the same day each week. These
samples are then shipped to the headquarters in Illinois for analysis.
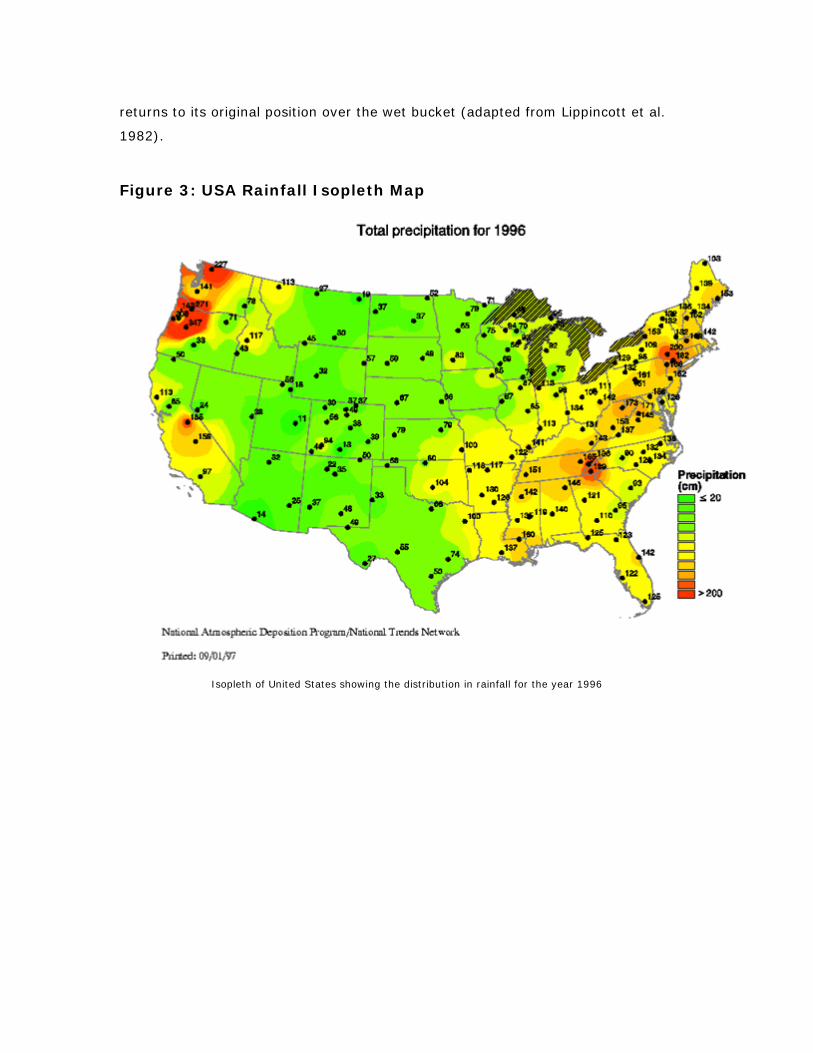
Figure 3 is an isopleth map of the United States (an isopleth is a group of
similar numbers connected by a line. In this case, the isopleths define rainfall
and pH figures). The black dots mark active collecting stations.
At GRSM, the Uplands Field Research Laboratory is collecting these samples.
Before they are sent to Illinois, the Laboratory is testing a portion of the
sample for pH and conductivity.
Why the National Park Service is involved with NADP
The National Park Service is charged with protection of the unique natural
resources of our national parks. There is much evidence suggesting damage
by acid rain to many of these unique features.
The National Park Service would like to understand more fully the effects of
acid rain and ways to minimize these effects.
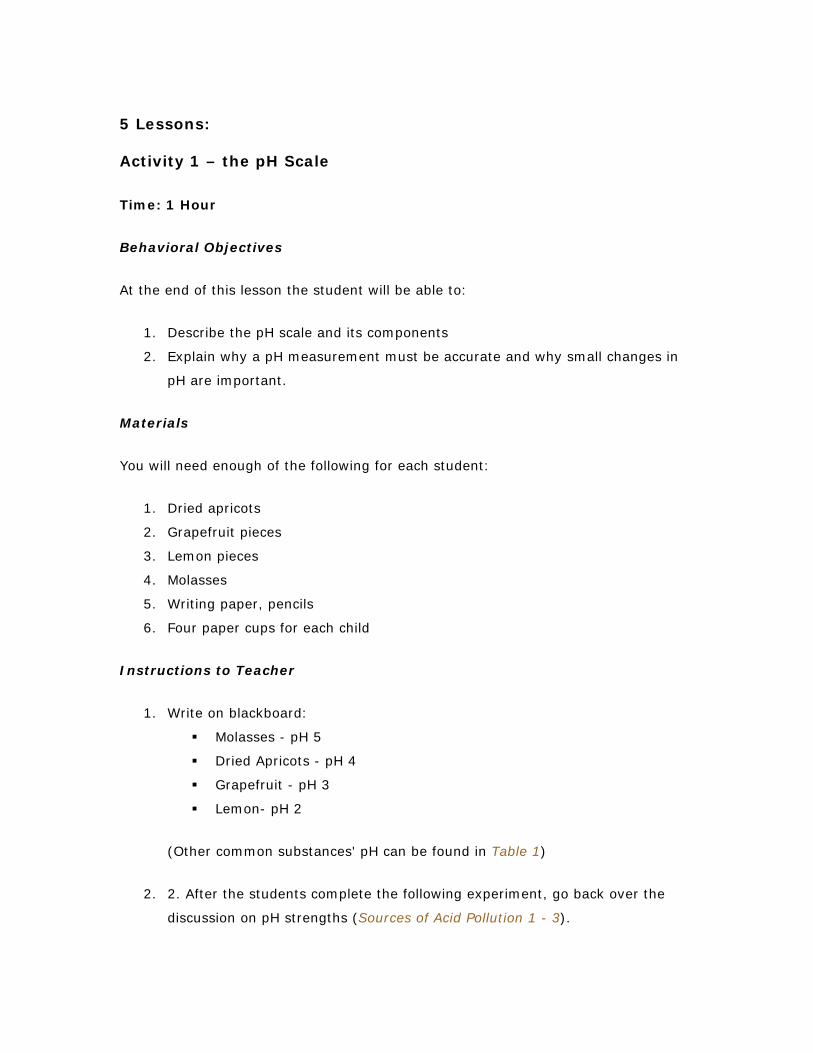
5 Lessons: Activity 1 – the pH Scale
Time: 1 Hour
Behavioral Objectives
At the end of this lesson the student will be able to:
1. Describe the pH scale and its components
2. Explain why a pH measurement must be accurate and why small changes in
pH are important.
Materials
You will need enough of the following for each student:
1. Dried apricots
2. Grapefruit pieces
3. Lemon pieces
4. Molasses
5. Writing paper, pencils
6. Four paper cups for each child
Instructions to Teacher
1. Write on blackboard:
Molasses - pH 5
Dried Apricots - pH 4
Grapefruit - pH 3
Lemon- pH 2
(Other common substances' pH can be found in Table 1)
2. 2. After the students complete the following experiment, go back over the
discussion on pH strengths (Sources of Acid Pollution 1 - 3).
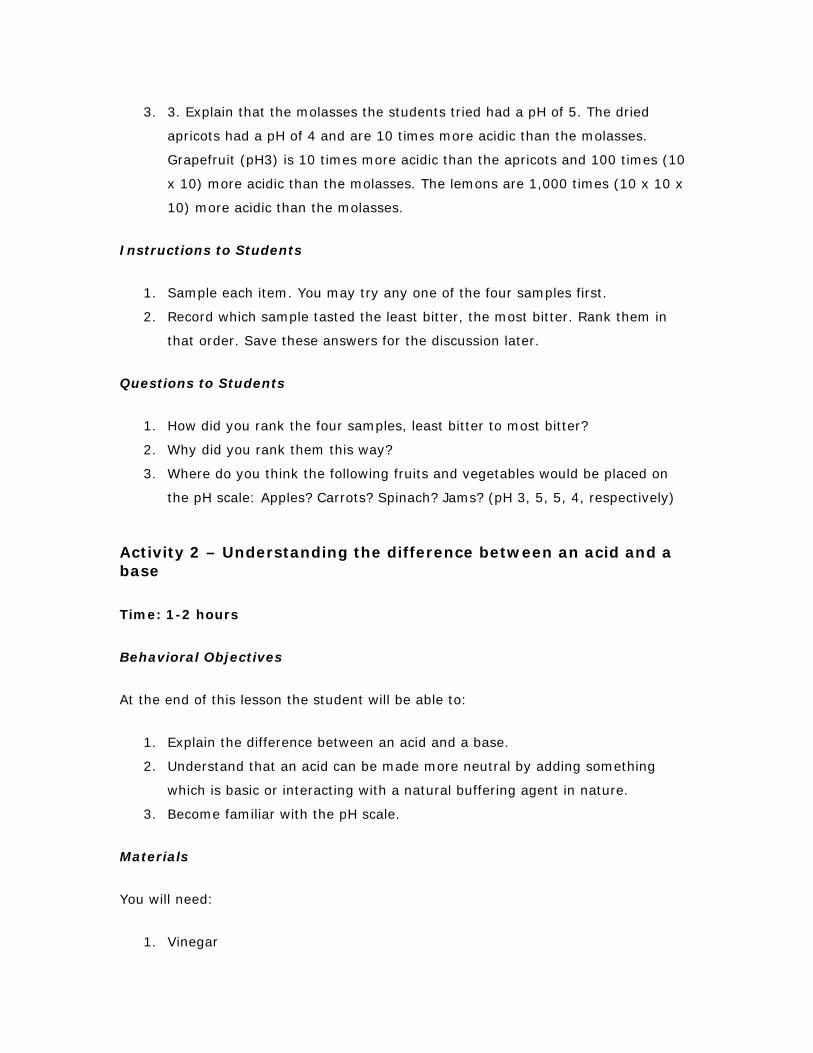
3. 3. Explain that the molasses the students tried had a pH of 5. The dried
apricots had a pH of 4 and are 10 times more acidic than the molasses.
Grapefruit (pH3) is 10 times more acidic than the apricots and 100 times (10
x 10) more acidic than the molasses. The lemons are 1,000 times (10 x 10 x
10) more acidic than the molasses.
Instructions to Students
1. Sample each item. You may try any one of the four samples first.
2. Record which sample tasted the least bitter, the most bitter. Rank them in
that order. Save these answers for the discussion later.
Questions to Students
1. How did you rank the four samples, least bitter to most bitter?
2. Why did you rank them this way?
3. Where do you think the following fruits and vegetables would be placed on
the pH scale: Apples? Carrots? Spinach? Jams? (pH 3, 5, 5, 4, respectively)
Activity 2 – Understanding the difference between an acid and a base
Time: 1-2 hours
Behavioral Objectives
At the end of this lesson the student will be able to:
1. Explain the difference between an acid and a base.
2. Understand that an acid can be made more neutral by adding something
which is basic or interacting with a natural buffering agent in nature.
3. Become familiar with the pH scale.
Materials
You will need:
1. Vinegar
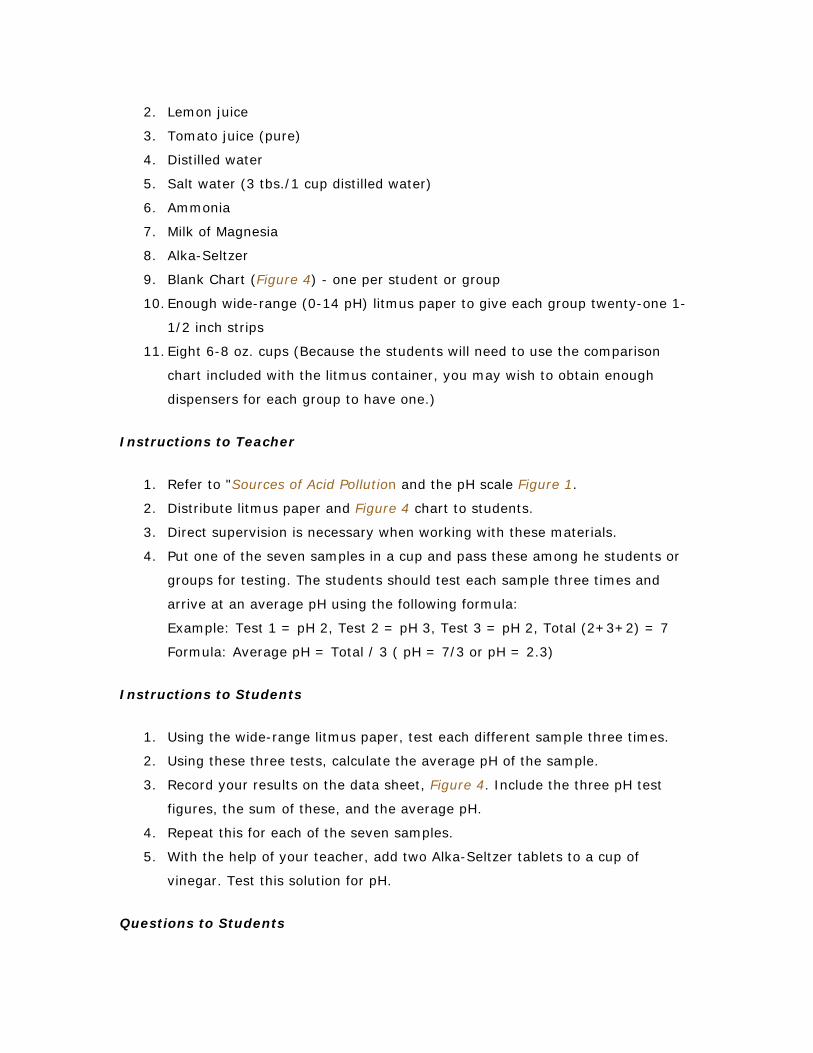
2. Lemon juice
3. Tomato juice (pure)
4. Distilled water
5. Salt water (3 tbs./1 cup distilled water)
6. Ammonia
7. Milk of Magnesia
8. Alka-Seltzer
9. Blank Chart (Figure 4) - one per student or group
10. Enough wide-range (0-14 pH) litmus paper to give each group twenty-one 1-
1/2 inch strips
11. Eight 6-8 oz. cups (Because the students will need to use the comparison
chart included with the litmus container, you may wish to obtain enough
dispensers for each group to have one.)
Instructions to Teacher
1. Refer to "Sources of Acid Pollution and the pH scale Figure 1.
2. Distribute litmus paper and Figure 4 chart to students.
3. Direct supervision is necessary when working with these materials.
4. Put one of the seven samples in a cup and pass these among he students or
groups for testing. The students should test each sample three times and
arrive at an average pH using the following formula:
Example: Test 1 = pH 2, Test 2 = pH 3, Test 3 = pH 2, Total (2+3+2) = 7
Formula: Average pH = Total / 3 ( pH = 7/3 or pH = 2.3)
Instructions to Students
1. Using the wide-range litmus paper, test each different sample three times.
2. Using these three tests, calculate the average pH of the sample.
3. Record your results on the data sheet, Figure 4. Include the three pH test
figures, the sum of these, and the average pH.
4. Repeat this for each of the seven samples.
5. With the help of your teacher, add two Alka-Seltzer tablets to a cup of
vinegar. Test this solution for pH.
Questions to Students
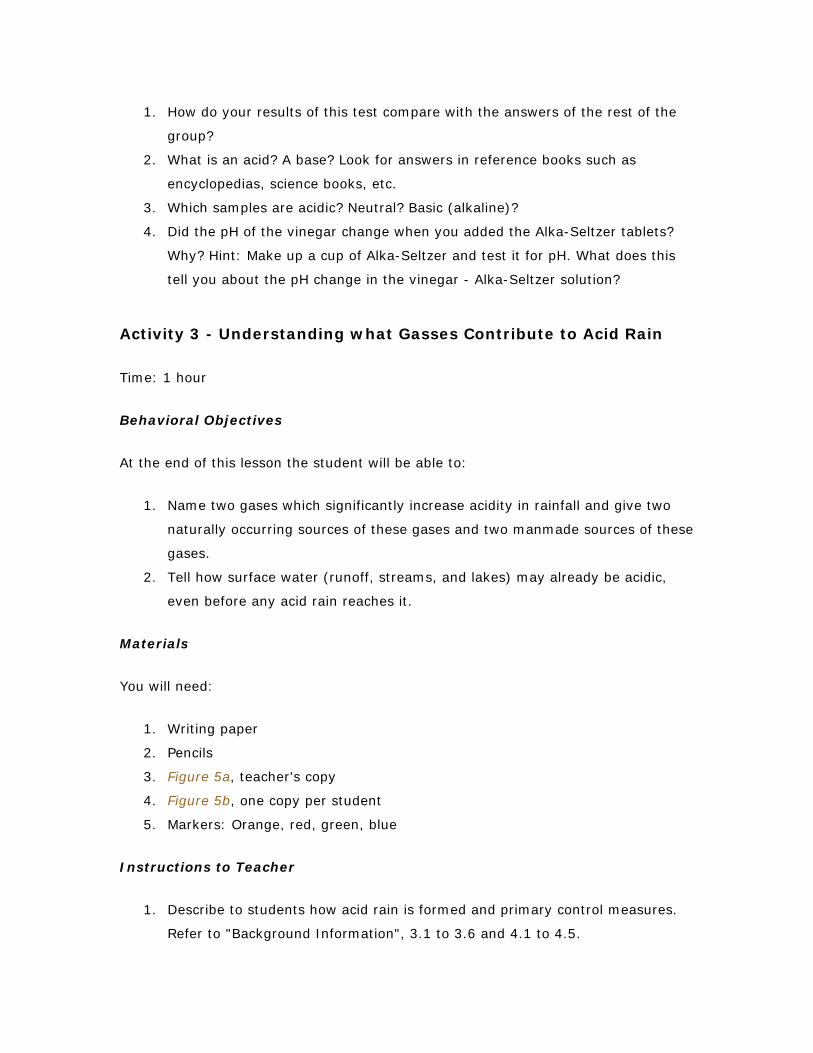
1. How do your results of this test compare with the answers of the rest of the
group?
2. What is an acid? A base? Look for answers in reference books such as
encyclopedias, science books, etc.
3. Which samples are acidic? Neutral? Basic (alkaline)?
4. Did the pH of the vinegar change when you added the Alka-Seltzer tablets?
Why? Hint: Make up a cup of Alka-Seltzer and test it for pH. What does this
tell you about the pH change in the vinegar - Alka-Seltzer solution?
Activity 3 - Understanding what Gasses Contribute to Acid Rain
Time: 1 hour
Behavioral Objectives
At the end of this lesson the student will be able to:
1. Name two gases which significantly increase acidity in rainfall and give two
naturally occurring sources of these gases and two manmade sources of these
gases.
2. Tell how surface water (runoff, streams, and lakes) may already be acidic,
even before any acid rain reaches it.
Materials
You will need:
1. Writing paper
2. Pencils
3. Figure 5a, teacher's copy
4. Figure 5b, one copy per student
5. Markers: Orange, red, green, blue
Instructions to Teacher
1. Describe to students how acid rain is formed and primary control measures.
Refer to "Background Information", 3.1 to 3.6 and 4.1 to 4.5.
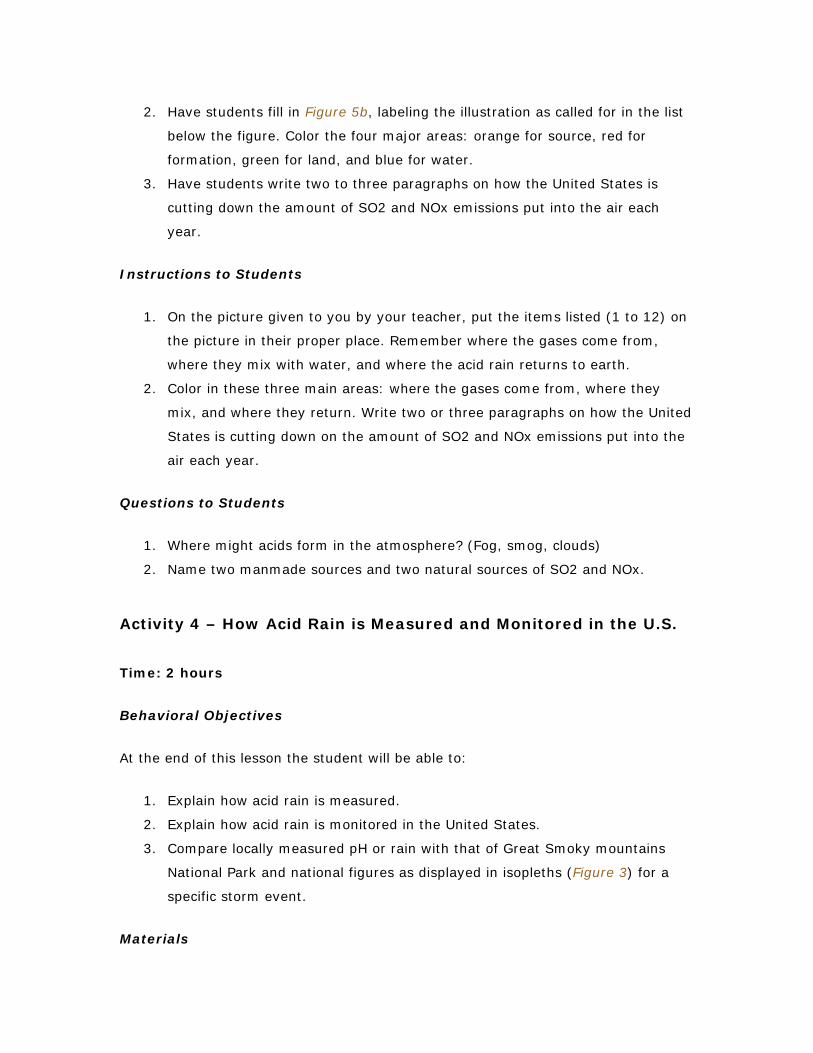
2. Have students fill in Figure 5b, labeling the illustration as called for in the list
below the figure. Color the four major areas: orange for source, red for
formation, green for land, and blue for water.
3. Have students write two to three paragraphs on how the United States is
cutting down the amount of SO2 and NOx emissions put into the air each
year.
Instructions to Students
1. On the picture given to you by your teacher, put the items listed (1 to 12) on
the picture in their proper place. Remember where the gases come from,
where they mix with water, and where the acid rain returns to earth.
2. Color in these three main areas: where the gases come from, where they
mix, and where they return. Write two or three paragraphs on how the United
States is cutting down on the amount of SO2 and NOx emissions put into the
air each year.
Questions to Students
1. Where might acids form in the atmosphere? (Fog, smog, clouds)
2. Name two manmade sources and two natural sources of SO2 and NOx.
Activity 4 – How Acid Rain is Measured and Monitored in the U.S.
Time: 2 hours
Behavioral Objectives
At the end of this lesson the student will be able to:
1. Explain how acid rain is measured.
2. Explain how acid rain is monitored in the United States.
3. Compare locally measured pH or rain with that of Great Smoky mountains
National Park and national figures as displayed in isopleths (Figure 3) for a
specific storm event.
Materials
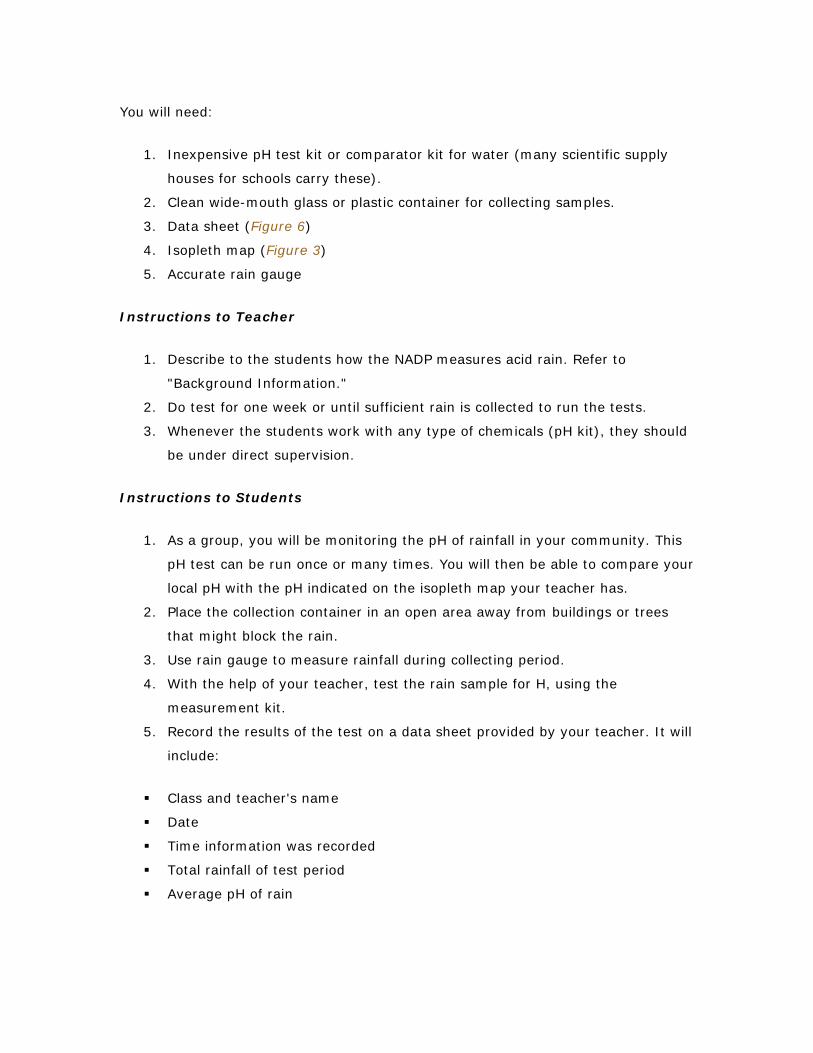
You will need:
1. Inexpensive pH test kit or comparator kit for water (many scientific supply
houses for schools carry these).
2. Clean wide-mouth glass or plastic container for collecting samples.
3. Data sheet (Figure 6)
4. Isopleth map (Figure 3)
5. Accurate rain gauge
Instructions to Teacher
1. Describe to the students how the NADP measures acid rain. Refer to
"Background Information."
2. Do test for one week or until sufficient rain is collected to run the tests.
3. Whenever the students work with any type of chemicals (pH kit), they should
be under direct supervision.
Instructions to Students
1. As a group, you will be monitoring the pH of rainfall in your community. This
pH test can be run once or many times. You will then be able to compare your
local pH with the pH indicated on the isopleth map your teacher has.
2. Place the collection container in an open area away from buildings or trees
that might block the rain.
3. Use rain gauge to measure rainfall during collecting period.
4. With the help of your teacher, test the rain sample for H, using the
measurement kit.
5. Record the results of the test on a data sheet provided by your teacher. It will
include:
Class and teacher's name
Date
Time information was recorded
Total rainfall of test period
Average pH of rain
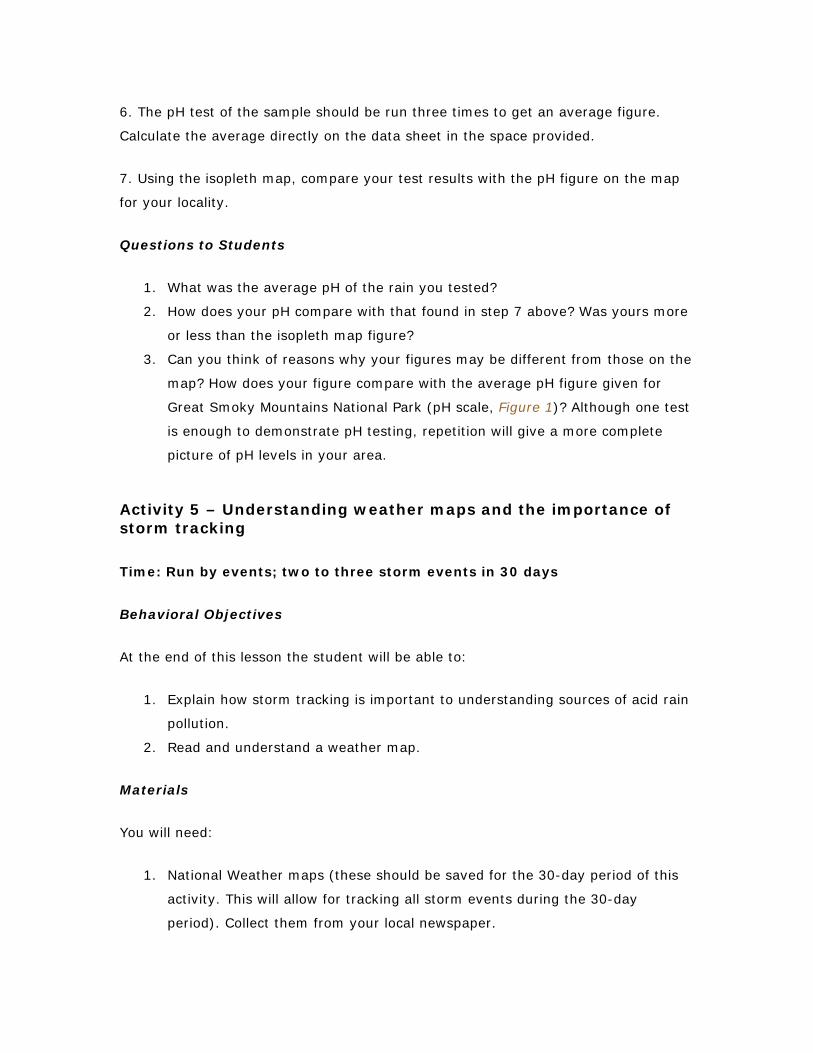
6. The pH test of the sample should be run three times to get an average figure.
Calculate the average directly on the data sheet in the space provided.
7. Using the isopleth map, compare your test results with the pH figure on the map
for your locality.
Questions to Students
1. What was the average pH of the rain you tested?
2. How does your pH compare with that found in step 7 above? Was yours more
or less than the isopleth map figure?
3. Can you think of reasons why your figures may be different from those on the
map? How does your figure compare with the average pH figure given for
Great Smoky Mountains National Park (pH scale, Figure 1)? Although one test
is enough to demonstrate pH testing, repetition will give a more complete
picture of pH levels in your area.
Activity 5 – Understanding weather maps and the importance of storm tracking
Time: Run by events; two to three storm events in 30 days
Behavioral Objectives
At the end of this lesson the student will be able to:
1. Explain how storm tracking is important to understanding sources of acid rain
pollution.
2. Read and understand a weather map.
Materials
You will need:
1. National Weather maps (these should be saved for the 30-day period of this
activity. This will allow for tracking all storm events during the 30-day
period). Collect them from your local newspaper.
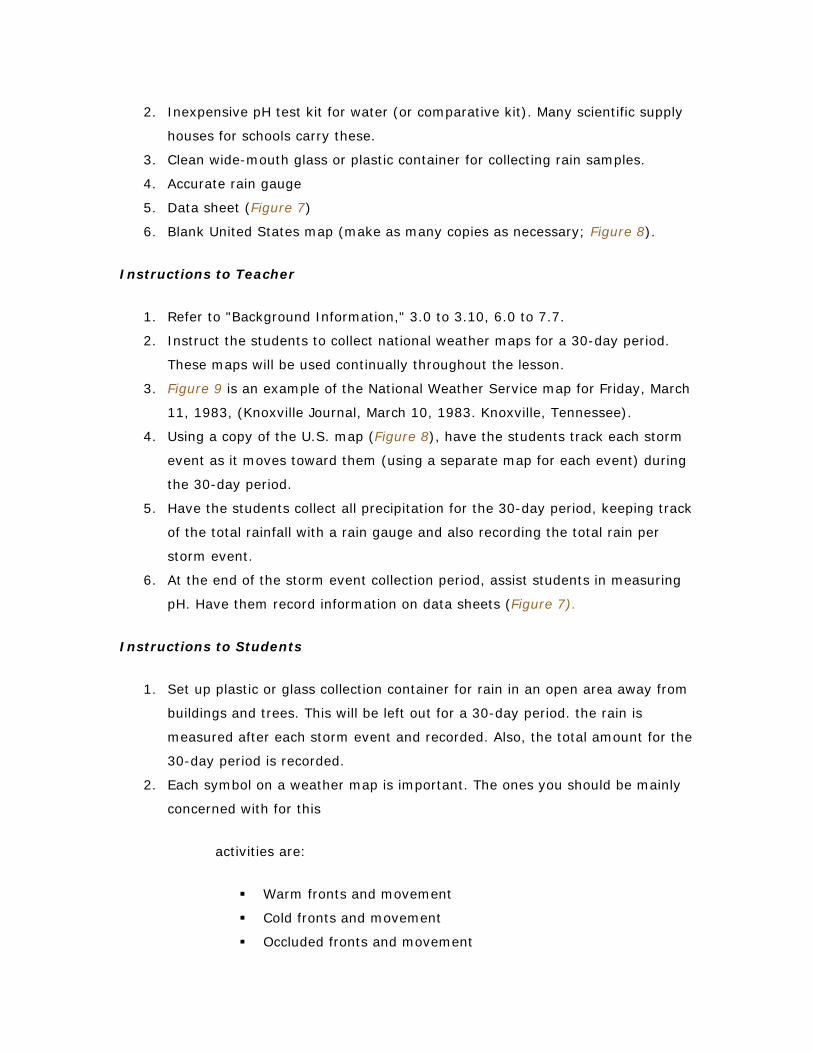
2. Inexpensive pH test kit for water (or comparative kit). Many scientific supply
houses for schools carry these.
3. Clean wide-mouth glass or plastic container for collecting rain samples.
4. Accurate rain gauge
5. Data sheet (Figure 7)
6. Blank United States map (make as many copies as necessary; Figure 8).
Instructions to Teacher
1. Refer to "Background Information," 3.0 to 3.10, 6.0 to 7.7.
2. Instruct the students to collect national weather maps for a 30-day period.
These maps will be used continually throughout the lesson.
3. Figure 9 is an example of the National Weather Service map for Friday, March
11, 1983, (Knoxville Journal, March 10, 1983. Knoxville, Tennessee).
4. Using a copy of the U.S. map (Figure 8), have the students track each storm
event as it moves toward them (using a separate map for each event) during
the 30-day period.
5. Have the students collect all precipitation for the 30-day period, keeping track
of the total rainfall with a rain gauge and also recording the total rain per
storm event.
6. At the end of the storm event collection period, assist students in measuring
pH. Have them record information on data sheets (Figure 7).
Instructions to Students
1. Set up plastic or glass collection container for rain in an open area away from
buildings and trees. This will be left out for a 30-day period. the rain is
measured after each storm event and recorded. Also, the total amount for the
30-day period is recorded.
2. Each symbol on a weather map is important. The ones you should be mainly
concerned with for this
activities are:
Warm fronts and movement
Cold fronts and movement
Occluded fronts and movement
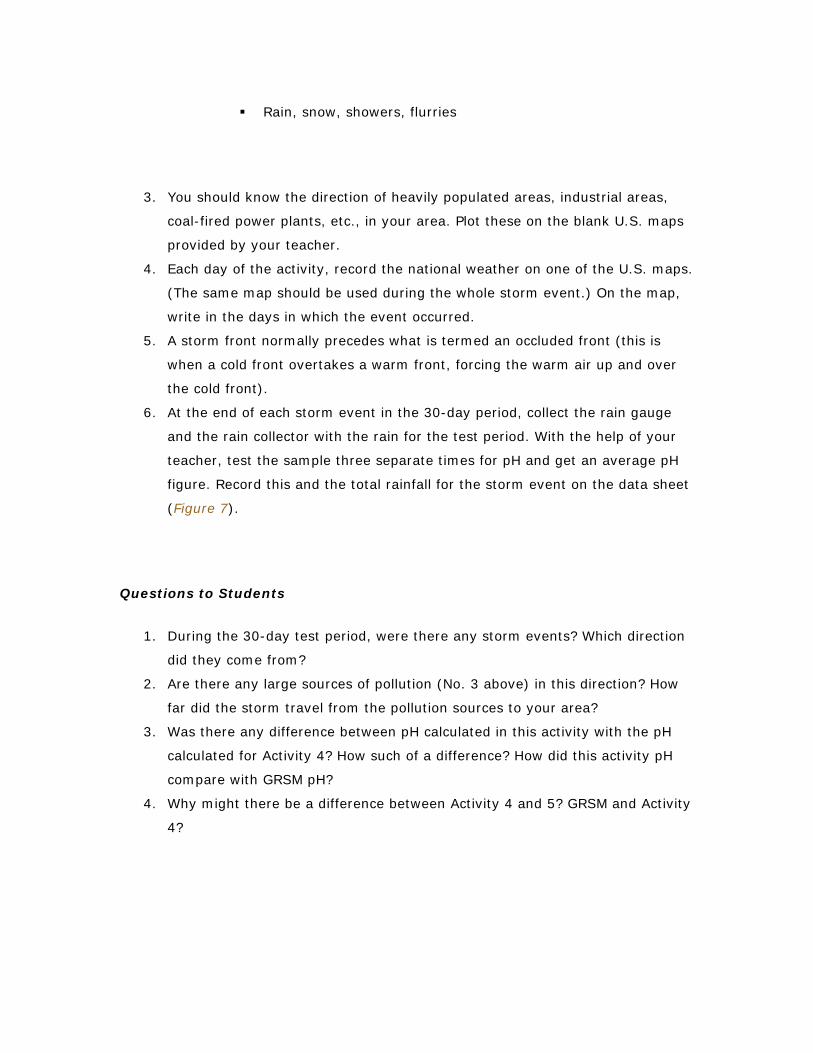
Rain, snow, showers, flurries
3. You should know the direction of heavily populated areas, industrial areas,
coal-fired power plants, etc., in your area. Plot these on the blank U.S. maps
provided by your teacher.
4. Each day of the activity, record the national weather on one of the U.S. maps.
(The same map should be used during the whole storm event.) On the map,
write in the days in which the event occurred.
5. A storm front normally precedes what is termed an occluded front (this is
when a cold front overtakes a warm front, forcing the warm air up and over
the cold front).
6. At the end of each storm event in the 30-day period, collect the rain gauge
and the rain collector with the rain for the test period. With the help of your
teacher, test the sample three separate times for pH and get an average pH
figure. Record this and the total rainfall for the storm event on the data sheet
(Figure 7).
Questions to Students
1. During the 30-day test period, were there any storm events? Which direction
did they come from?
2. Are there any large sources of pollution (No. 3 above) in this direction? How
far did the storm travel from the pollution sources to your area?
3. Was there any difference between pH calculated in this activity with the pH
calculated for Activity 4? How such of a difference? How did this activity pH
compare with GRSM pH?
4. Why might there be a difference between Activity 4 and 5? GRSM and Activity
4?
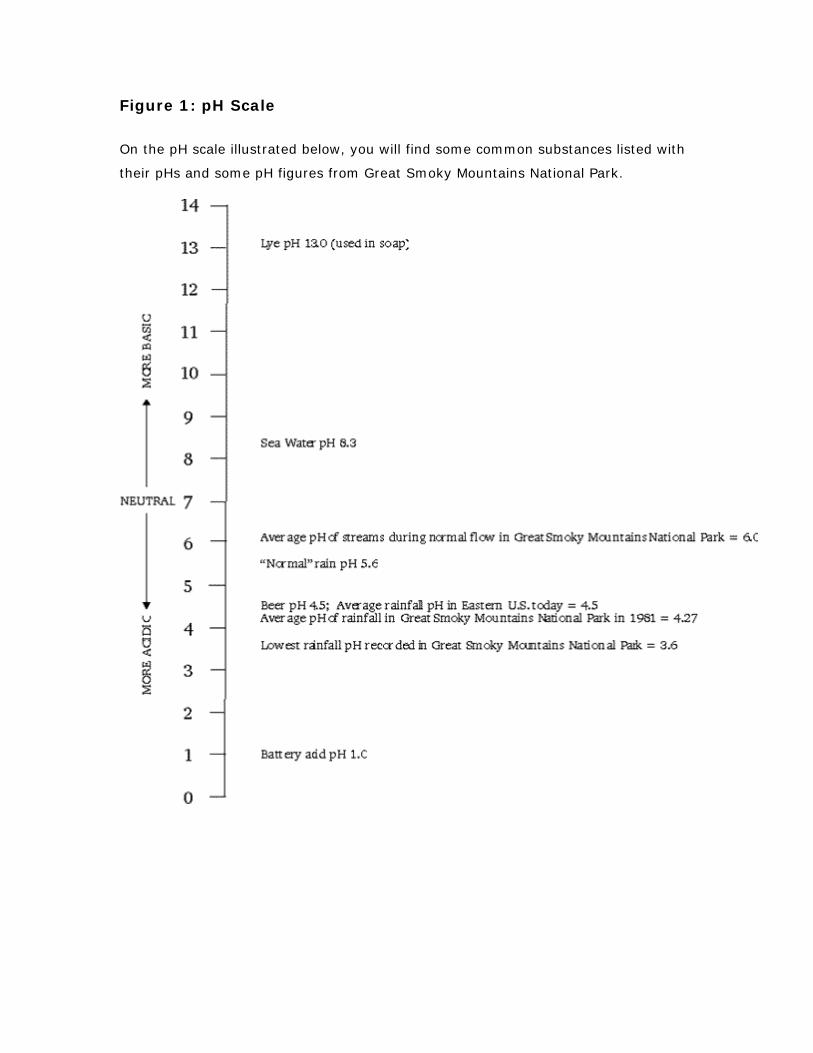
Figure 1: pH Scale
On the pH scale illustrated below, you will find some common substances listed with
their pHs and some pH figures from Great Smoky Mountains National Park.
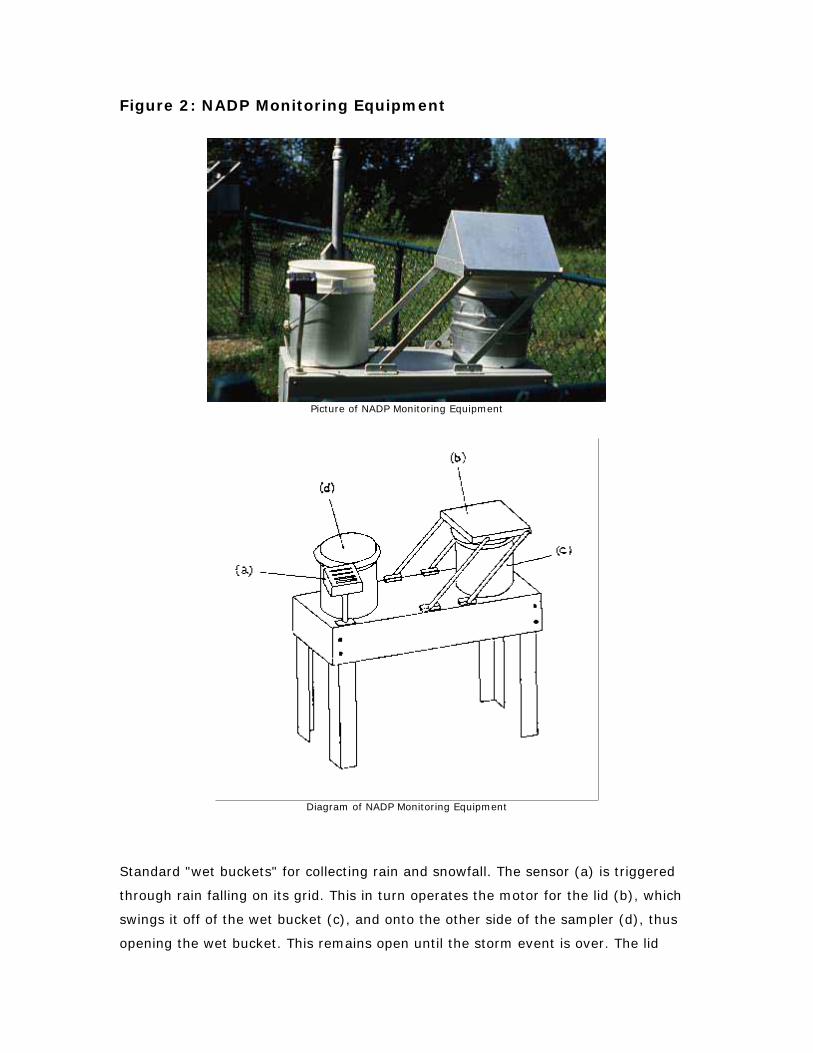
Figure 2: NADP Monitoring Equipment
Picture of NADP Monitoring Equipment
Diagram of NADP Monitoring Equipment
Standard "wet buckets" for collecting rain and snowfall. The sensor (a) is triggered
through rain falling on its grid. This in turn operates the motor for the lid (b), which
swings it off of the wet bucket (c), and onto the other side of the sampler (d), thus
opening the wet bucket. This remains open until the storm event is over. The lid
returns to its original position over the wet bucket (adapted from Lippincott et al.
1982).
Figure 3: USA Rainfall Isopleth Map
Isopleth of United States showing the distribution in rainfall for the year 1996
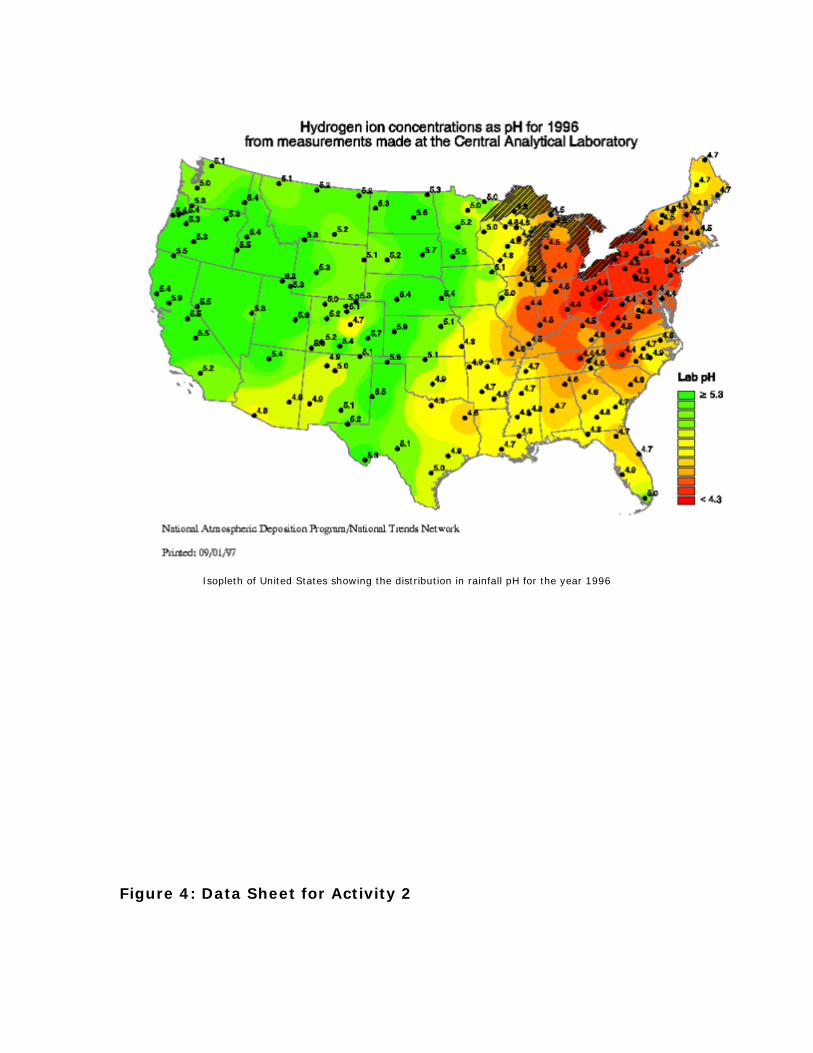
Isopleth of United States showing the distribution in rainfall pH for the year 1996
Figure 4: Data Sheet for Activity 2
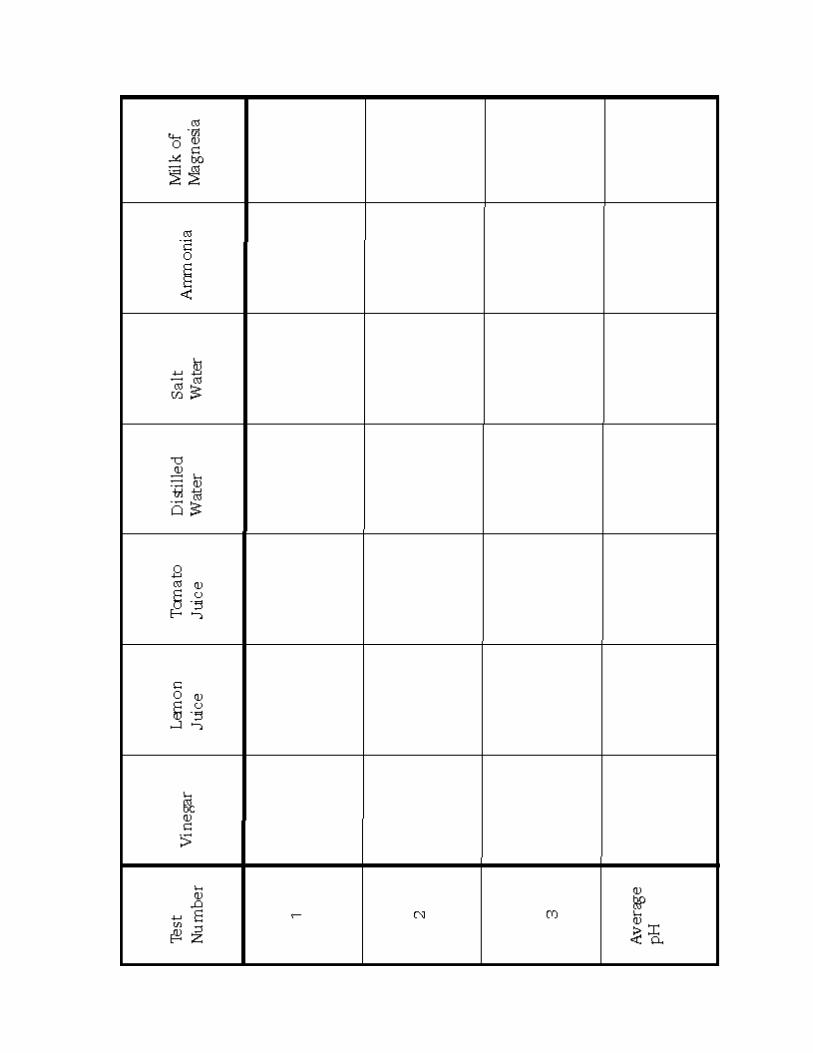
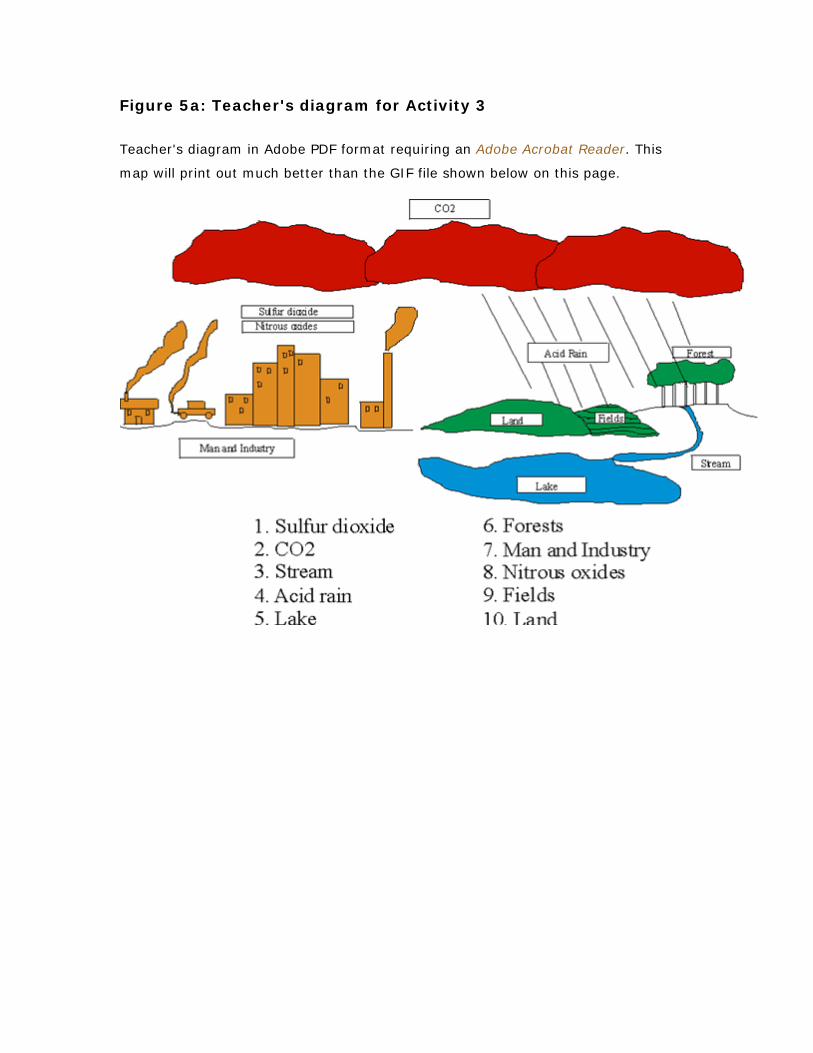
Figure 5a: Teacher's diagram for Activity 3
Teacher's diagram in Adobe PDF format requiring an Adobe Acrobat Reader. This
map will print out much better than the GIF file shown below on this page.
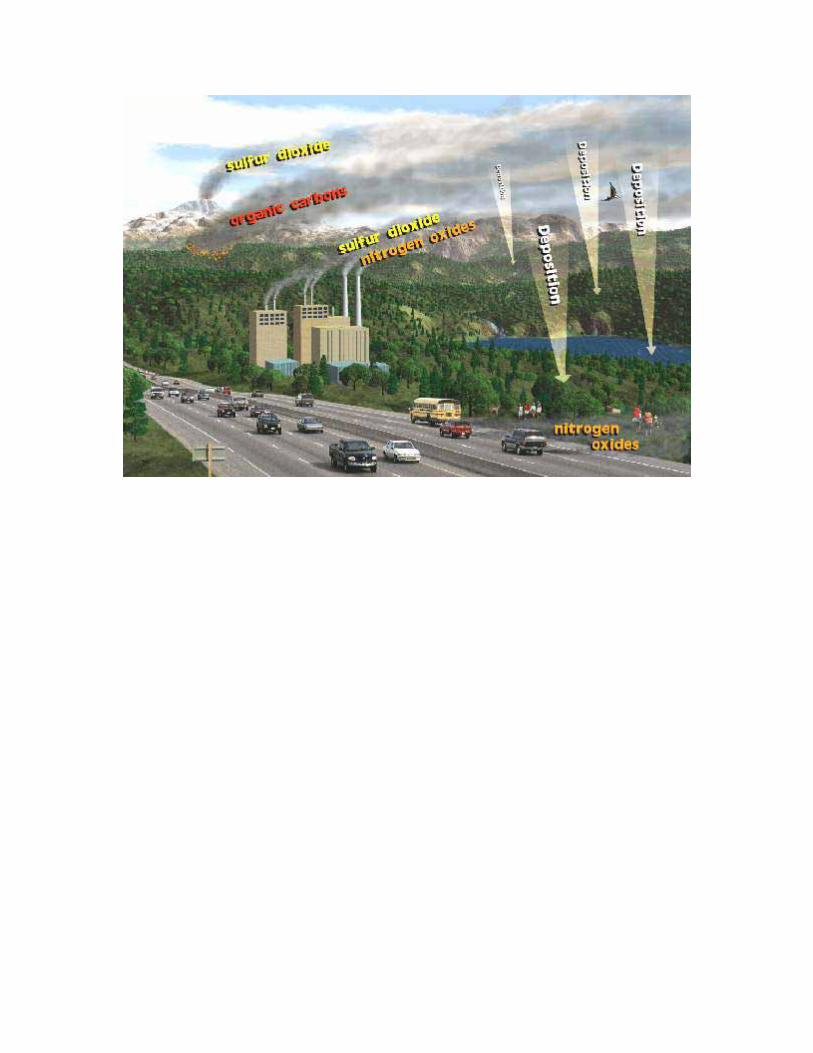
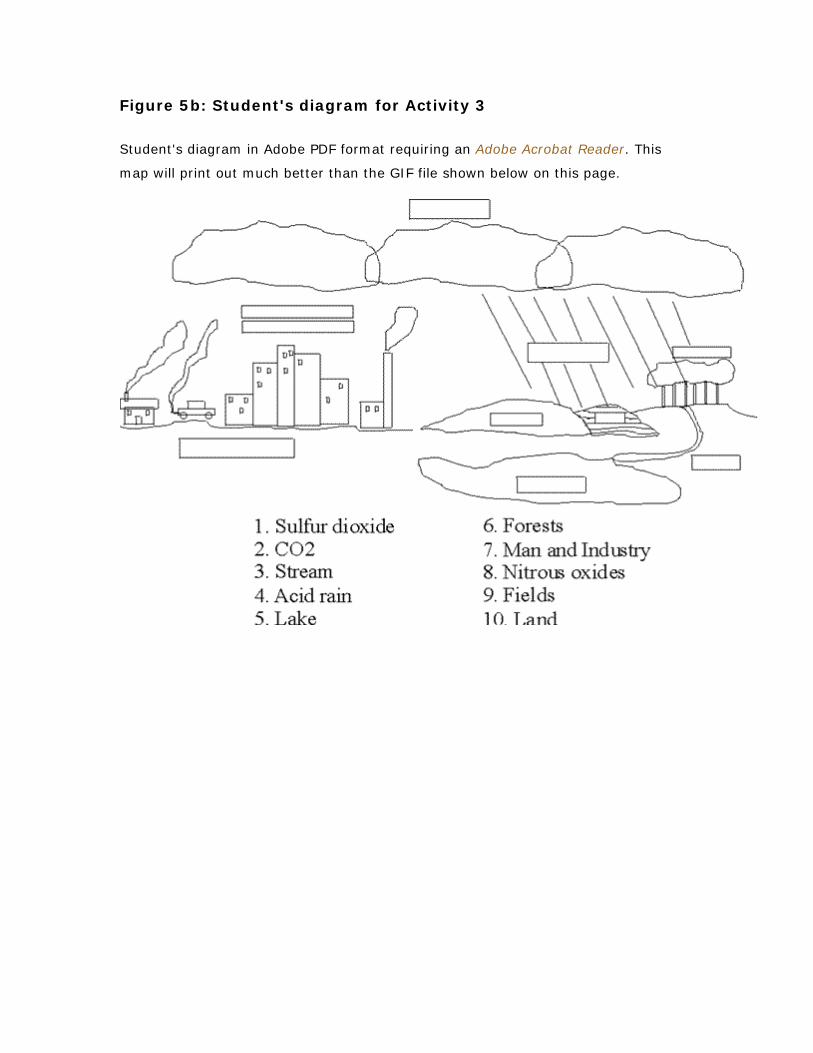
Figure 5b: Student's diagram for Activity 3
Student's diagram in Adobe PDF format requiring an Adobe Acrobat Reader. This
map will print out much better than the GIF file shown below on this page.
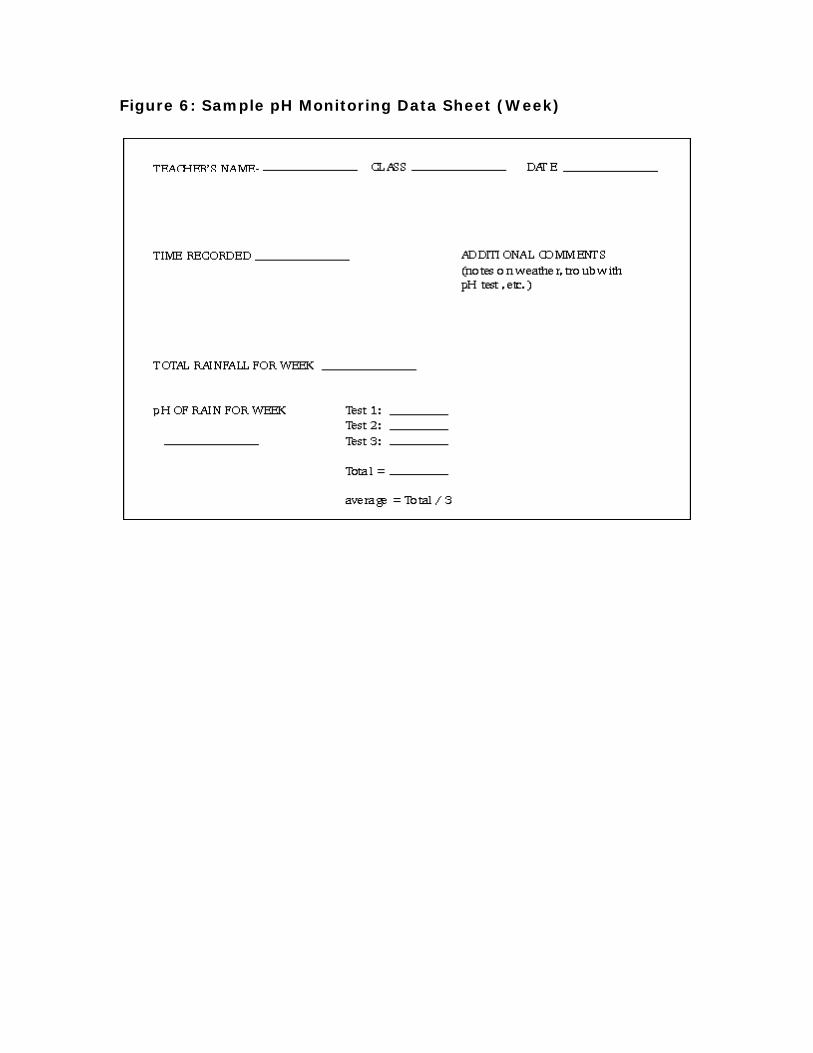
Figure 6: Sample pH Monitoring Data Sheet (Week)
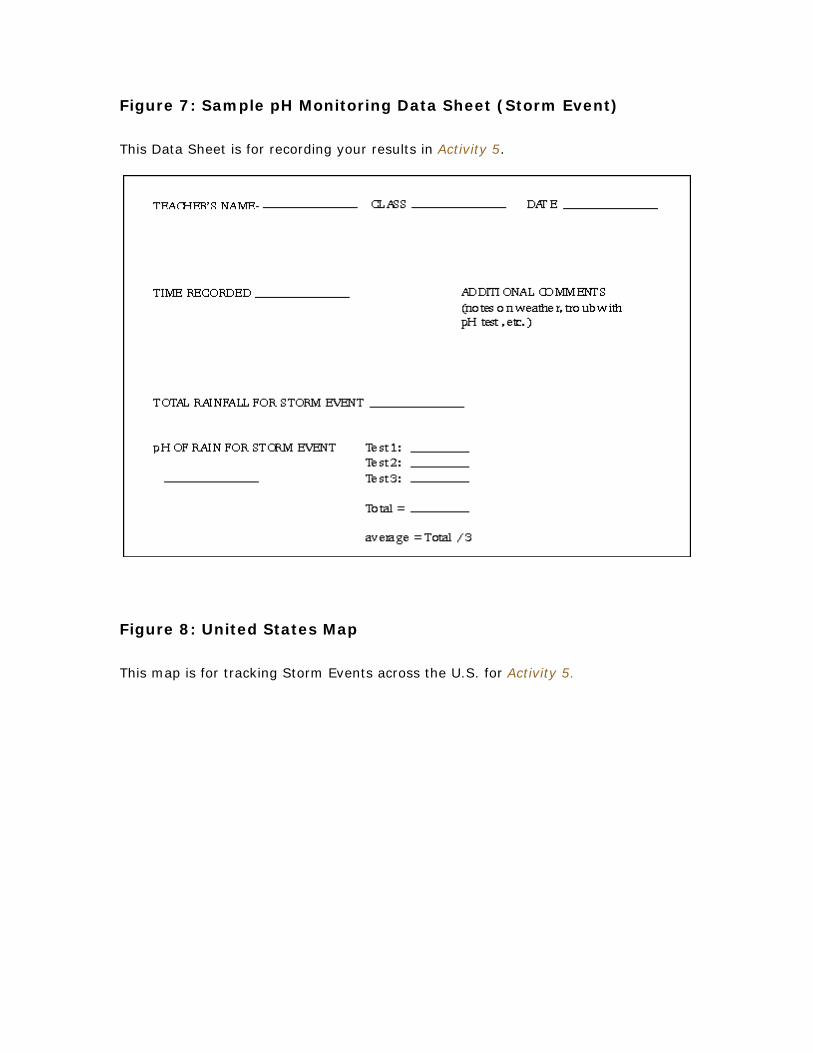
Figure 7: Sample pH Monitoring Data Sheet (Storm Event)
This Data Sheet is for recording your results in Activity 5.
Figure 8: United States Map
This map is for tracking Storm Events across the U.S. for Activity 5.
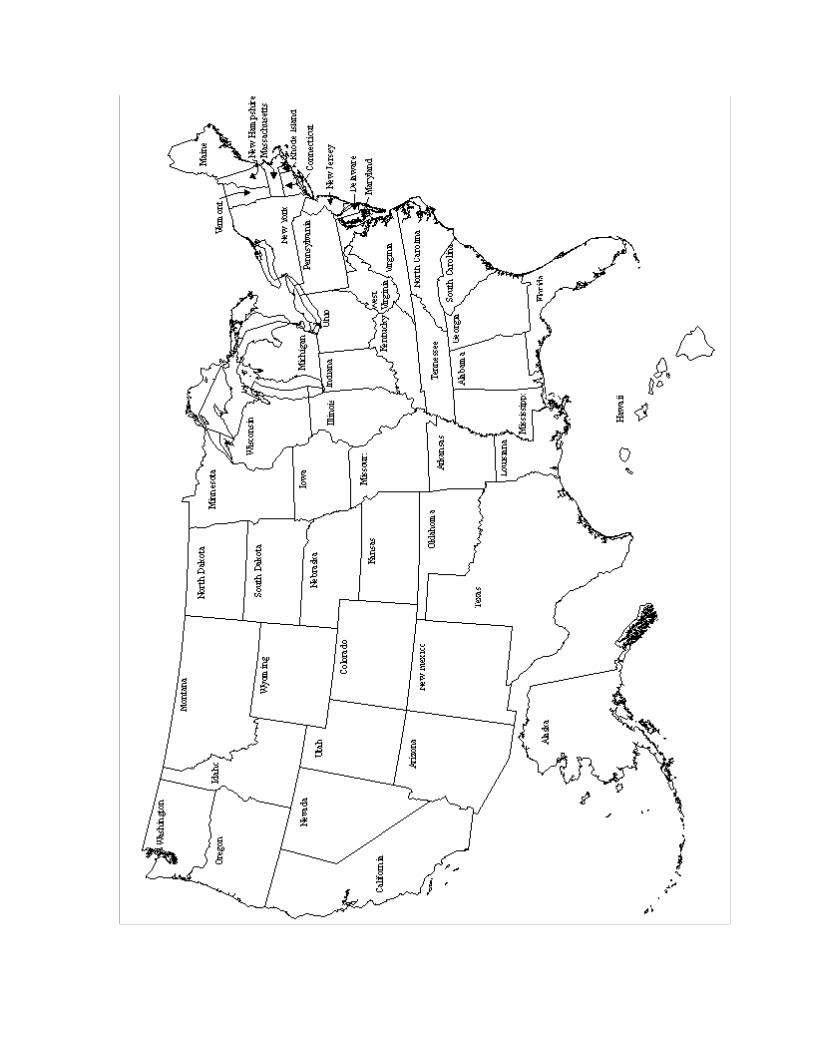
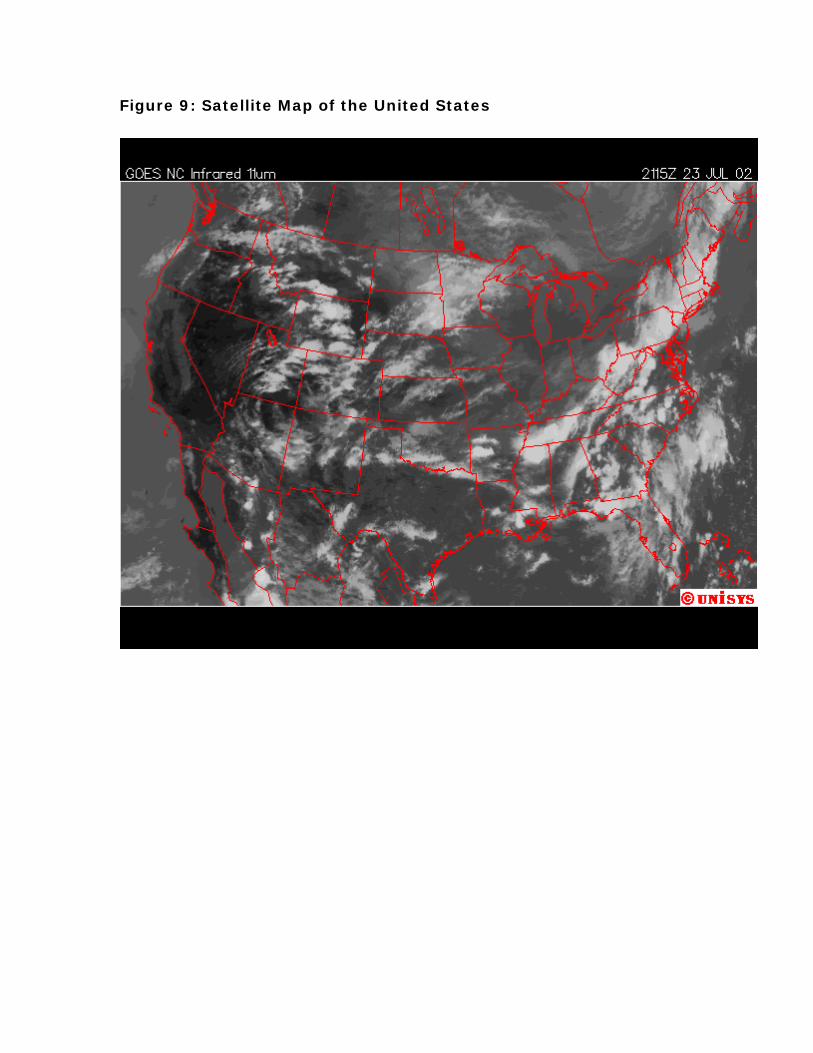
Figure 9: Satellite Map of the United States
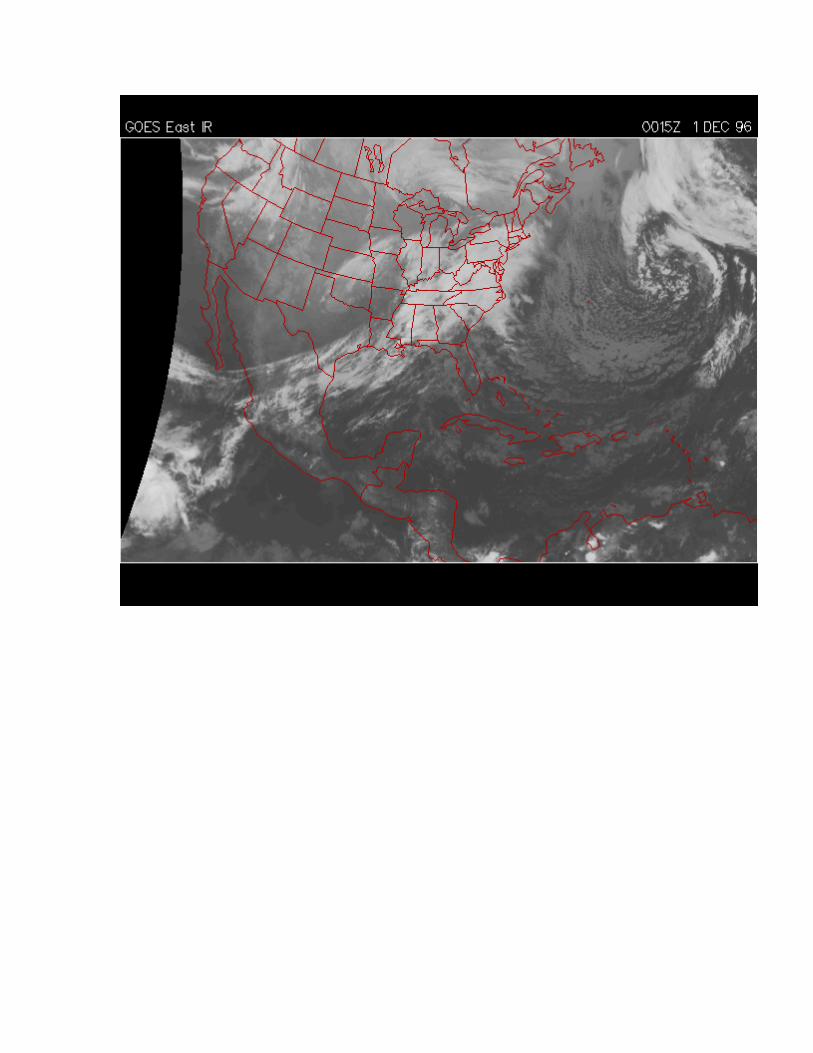
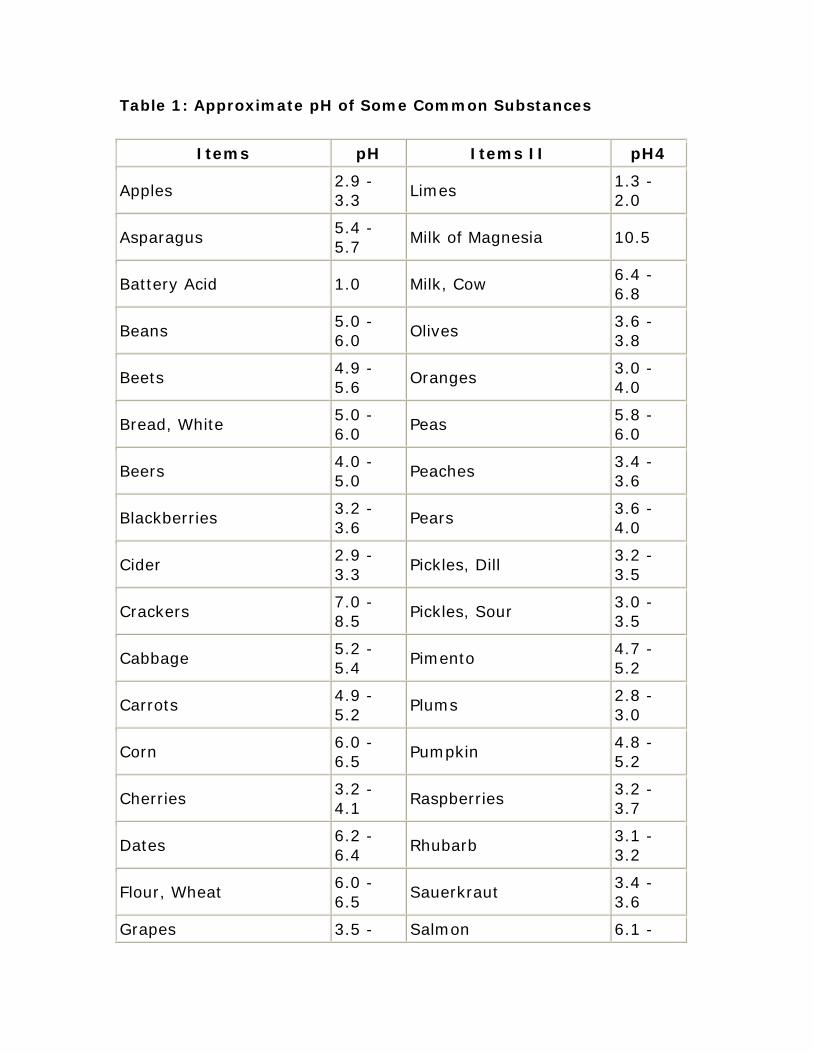
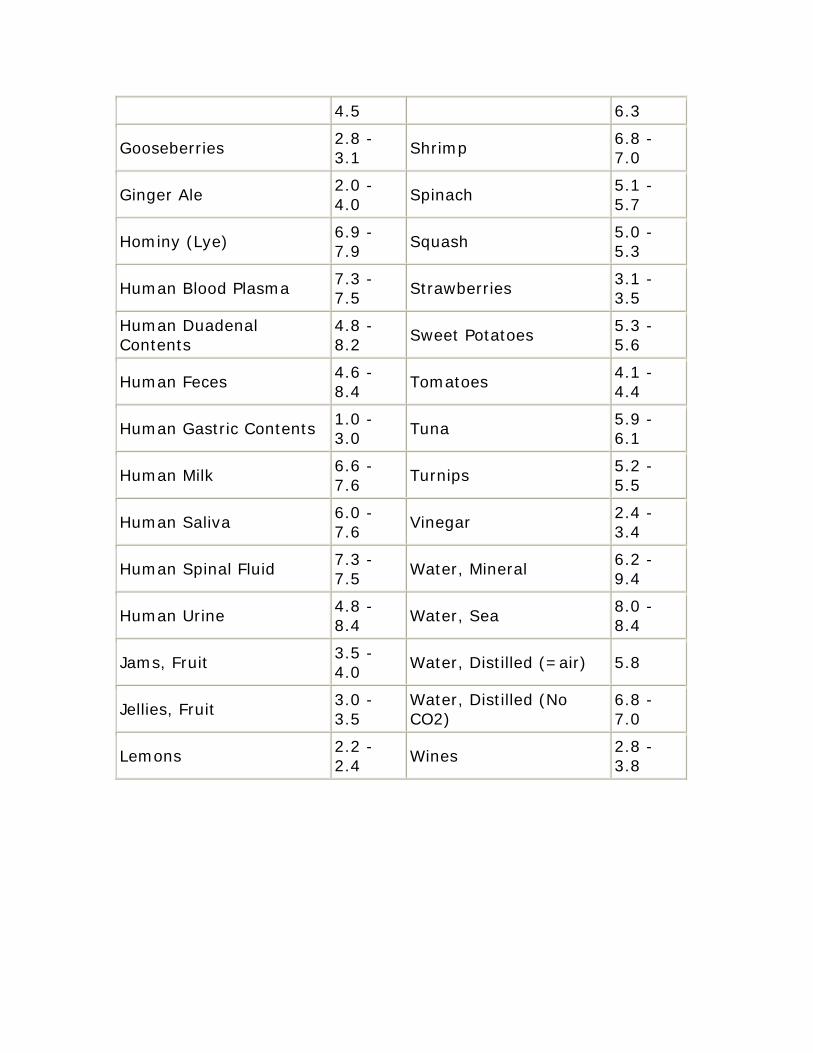
Table 1: Approximate pH of Some Common Substances
Items pH Items II pH4
Apples 2.9 - 3.3
Limes 1.3 - 2.0
Asparagus 5.4 - 5.7
Milk of Magnesia 10.5
Battery Acid 1.0 Milk, Cow 6.4 - 6.8
Beans 5.0 - 6.0
Olives 3.6 - 3.8
Beets 4.9 - 5.6
Oranges 3.0 - 4.0
Bread, White 5.0 - 6.0
Peas 5.8 - 6.0
Beers 4.0 - 5.0
Peaches 3.4 - 3.6
Blackberries 3.2 - 3.6
Pears 3.6 - 4.0
Cider 2.9 - 3.3
Pickles, Dill 3.2 - 3.5
Crackers 7.0 - 8.5
Pickles, Sour 3.0 - 3.5
Cabbage 5.2 - 5.4
Pimento 4.7 - 5.2
Carrots 4.9 - 5.2
Plums 2.8 - 3.0
Corn 6.0 - 6.5
Pumpkin 4.8 - 5.2
Cherries 3.2 - 4.1
Raspberries 3.2 - 3.7
Dates 6.2 - 6.4
Rhubarb 3.1 - 3.2
Flour, Wheat 6.0 - 6.5
Sauerkraut 3.4 - 3.6
Grapes 3.5 - Salmon 6.1 -
4.5 6.3
Gooseberries 2.8 - 3.1
Shrimp 6.8 - 7.0
Ginger Ale 2.0 - 4.0
Spinach 5.1 - 5.7
Hominy (Lye) 6.9 - 7.9
Squash 5.0 - 5.3
Human Blood Plasma 7.3 - 7.5
Strawberries 3.1 - 3.5
Human Duadenal Contents
4.8 - 8.2
Sweet Potatoes 5.3 - 5.6
Human Feces 4.6 - 8.4
Tomatoes 4.1 - 4.4
Human Gastric Contents 1.0 - 3.0
Tuna 5.9 - 6.1
Human Milk 6.6 - 7.6
Turnips 5.2 - 5.5
Human Saliva 6.0 - 7.6
Vinegar 2.4 - 3.4
Human Spinal Fluid 7.3 - 7.5
Water, Mineral 6.2 - 9.4
Human Urine 4.8 - 8.4
Water, Sea 8.0 - 8.4
Jams, Fruit 3.5 - 4.0
Water, Distilled (=air) 5.8
Jellies, Fruit 3.0 - 3.5
Water, Distilled (No CO2)
6.8 - 7.0
Lemons 2.2 - 2.4
Wines 2.8 - 3.8