Embed Size (px)
Citation preview
ACID GAS INJECTION: A STUDY OF EXISTING OPERATIONS (PHASE I: INTERIM REPORT)
Report Number PH4/15 January 2003
This document has been prepared for the Executive Committee of the Programme. It is not a publication of the Operating Agent, International Energy Agency or its Secretariat.
ACID GAS INJECTION: A STUDY OF EXISTING OPERATIONS (PHASE I: INTERIM REPORT)
Background to the Study
There are the 31 acid gas injection projects currently operating in Alberta, Canada. These provide an opportunity to learn about the injection and fate of CO2 underground. The Alberta Research Council (ARC), the Alberta Geological Survey (AGS) and the Alberta Energy Utilities Board (AEUB), through Climate Change Central of Canada, proposed a 3-phase project to improve the geological and engineering knowledge about the injection and storage of CO2 as a part of these acid gas injection schemes. The IEA Greenhouse Gas R&D Programme was offered the opportunity to participate in this work. IEA GHG is currently participating in Phases I and II of the project:
• Phase I - a geological and engineering review of the 31 acid gas injection projects currently operating in Alberta, Canada.
• Phase II - a due diligence exercise on a selected site, which will help highlight any outstanding issues and develop an effective monitoring programme.
The two Phases would aim to quantify the volumes of CO2 stored permanently in geological formations as a result of acid gas re-injection schemes. Phase III would be a monitoring project to assist in verifying the storage, safety and long-term fate of the injected acid gas. Subsequently, because additional funding had become available from industrial sources, it was agreed by the Project Management Board (of which IEA GHG is a member) that Phase I will be expanded to include 7 additional operational acid gas injection sites in British Columbia, and 5 new sites (3 in Alberta and 2 in British Columbia), thus bringing the total number of acid gas injection sites to be studied in Canada to 43. Each Phase of the proposed study will be reported separately. The Phase I report will summarize the geological characterization and technical operation of the 43 acid gas re-injection projects in Alberta and British Columbia. This interim report on Phase I provides details of the 31 original acid gas injection projects. The final report will provide details on all 43; this will be provided to IEA GHG in March 2003. The report will identify; what is common and what is specific to these acid gas injection operations. The findings will be useful for setting the criteria for selecting sites suitable for future acid gas re-injection and CO2 storage and for developing the Phase III Monitoring project. The Phase II report will contain site specific confidential information; IEA GHG will receive only a summary of this Phase of the study, excluding any confidential data. The study has been carried out by the Alberta Geological Survey and the Alberta Research Council.
Technical Background
A significant proportion of the raw natural gas production in the Alberta basin, Canada, contains varying percentages of acid gas components, specifically hydrogen sulphide (H2S) and carbon dioxide (CO2). The gas containing these components is normally referred to as “sour” gas. To meet pipeline and specifications for industrial and domestic sale, the sour gas must pass through gas processing facilities to separate out the acid gas components. Prior to 1988, if sulphur-recovery technology could not economically remove the sulphur from the acid gas, the alternative was to burn the acid gas in flare stacks or incinerators. Each flaring source was permitted to emit up to 10 t/day of sulphur. Since 1989, to reduce the waste and pollution resulting from sour-gas flaring, regulatory agencies in Alberta and British Columbia have required gas plants with a sulphur throughput of more than 1 t/day to recover the sulphur from the vent gas stream. The amount of sulphur to be recovered increases from 70% for plants producing between 1 and 5 t/day and to 96% for plants producing more than 10 t/day. Because of the
i
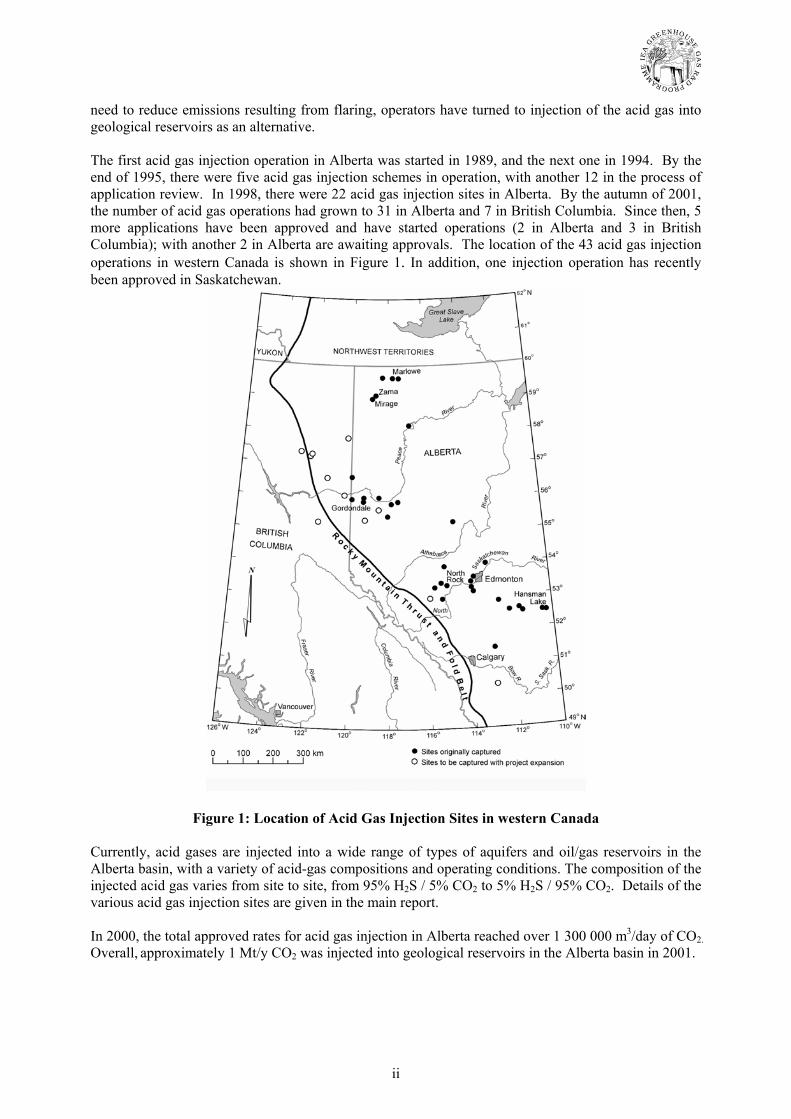
need to reduce emissions resulting from flaring, operators have turned to injection of the acid gas into geological reservoirs as an alternative. The first acid gas injection operation in Alberta was started in 1989, and the next one in 1994. By the end of 1995, there were five acid gas injection schemes in operation, with another 12 in the process of application review. In 1998, there were 22 acid gas injection sites in Alberta. By the autumn of 2001, the number of acid gas operations had grown to 31 in Alberta and 7 in British Columbia. Since then, 5 more applications have been approved and have started operations (2 in Alberta and 3 in British Columbia); with another 2 in Alberta are awaiting approvals. The location of the 43 acid gas injection operations in western Canada is shown in Figure 1. In addition, one injection operation has recently been approved in Saskatchewan.
Figure 1: Location of Acid Gas Injection Sites in western Canada Currently, acid gases are injected into a wide range of types of aquifers and oil/gas reservoirs in the Alberta basin, with a variety of acid-gas compositions and operating conditions. The composition of the injected acid gas varies from site to site, from 95% H2S / 5% CO2 to 5% H2S / 95% CO2. Details of the various acid gas injection sites are given in the main report. In 2000, the total approved rates for acid gas injection in Alberta reached over 1 300 000 m3/day of CO2. Overall, approximately 1 Mt/y CO2 was injected into geological reservoirs in the Alberta basin in 2001.
ii
Results and Discussion The following areas are discussed in the report: • • • • •
• •
Regulation of acid gas injection sites in Canada. Operational knowledge base. Subsurface issues. Comparisons with other geological storage practices. Extrapolation of acid gas experience to CO2 storage.
Regulation of acid gas injection sites in Canada
In both Alberta and British Columbia, there is a developed regulatory process for the approval of acid gas injection sites. The regulatory bodies concerned are: the Alberta Energy and Utilities Board (AEUB) and the British Columbia Ministry of Energy and Mines. In both cases, prospective operators are required to apply for and obtain approval before acid gas injection operations can commence. Before approving any operation, the regulatory agencies review the application to maximize conservation of hydrocarbon resources, minimize environmental impact and ensure public safety. To adequately address these matters, the regulators require that the applicants submit detailed information regarding surface facilities, injection well configurations, characteristics of the injection reservoir or aquifer, and injection operations. After approval for acid gas injection is granted, the operators have to submit biannual progress reports to the regulatory agencies on their operations. Details of the information requirements for the approval process and progress reporting are given in the main report. It is understood, from discussion with the contractor, that the approval stage is in essence be regarded as a negotiation process, as generally all applications are approved following detailed discussions between the regulator and the operator. When approval is granted a set of licensed operating parameters are established by the regulators, typically these include the following:
Maximum well head and bottom-hole injection pressures Maximum daily injection rates and maximum injection volumes.
The setting of the injection pressures, in particular the bottom-hole injection pressure, is a key feature protecting the integrity of the reservoir. The bottom-hole injection pressure is set at 90% of the fracture pressure to ensure that fracturing of the cap rock does not occur. Typically, the fracture pressures are defined from pressure depth-correlation data for the Alberta basin if site specific tests have not been carried out. The regulatory bodies concerned will exercise powers to close down operations if they feel that safety procedures required by the approval schedule have been breached. To date, there have been two cases where operations have been shut down by the regulatory bodies because injection pressures were higher than scheduled in the approval. In one case an injection well blow out occurred. Injection wells are typically considered as Class III wells under AEUB guidelines1 which covers wells injecting hydrocarbon, inert and sour gases2. It is noted that the same well classification for acid gas injection applies to CO2 injected for enhanced oil recovery in Canada. Testing and cementing requirements for Class Ib, II and III wells are somewhat less stringent than for Class 1a wells that are designated for the injection of oil field and industrial waste fluids3. However, Class Ib, II and III wells have to be designed to ensure that useable water bearing zones are isolated.
1 Alberta Energy Utilities Board, Guide 51, Injection and Disposal Wells – well classifications, completion, logging and testing, March 1994. 2 It is noted in several operations the acid gas is dissolved in the produced water and hence when injected the well classification becomes IB or II 3 Fluids to be injected in Class 1a wells include: phenolic waste waters, acid or caustic solutions, aqueous solutions of halogenated organic compounds, solutions containing heavy metals.
iii
The regulatory bodies also require that an Emergency Planning zone is established around the injection well in the case of an accidental release of acid gas. The operators are required to have a detailed emergency response plan (ERP) for use in the event of a leak. To have an effective ERP, the area surrounding the injection site should be equipped with H2S detection and alarm systems, windsocks, self-contained breathing apparatus, and remote unit and plant shutdown stations. Operational knowledge base Considerable experience in the operation of these acid gas injection facilities has now been built up. The knowledge base relates principally to surface and injection well operations. One of the key design features is the injection well, which has to be designed and operated to prevent accidental release of the acid gas. The injection well typically consists of a central steel tubing “string” (i.e. series of connected tubes) with an outer annulus bounded by a steel casing, which is cemented to the subsurface formations. Several safety features are incorporated in the injection well to prevent leakage. The casing is isolated from the tubing string and the acid gas by installing a “packer” in the annulus between the casing and the tubing string just above the subsurface storage formation. This is pressure tested for integrity once a year. A down-hole safety valve or check valve can be incorporated in the tubing string so that if something fails at the surface, the flow of acid gas from the formation will be prevented. The well head of the injection well is similarly protected with valves. Usually the pipelines carrying acid gases are short (up to 1500m, but generally 100 to 200m)4 and typically are constructed of mild steel. Only the short distance pipelines are constructed from stainless steel, typically they are constructed of carbon steel.. Corrosion is avoided by dehydrating5 the acid gas, which also prevents hydrate formation and thus assists in preventing compressor breakdown and plugging. Subsurface issues The location of the injection well is another key design feature of any acid gas injection project. Its location is based on a detailed assessment of the regional geology and hydrogeology, designed to evaluate the potential for leakage. Knowledge of the geological setting and characteristics is critical to assess the integrity of the host formation or reservoir, and the short-and long-term fate of the injected acid gas. Of particular importance are potential migration pathways from the injection zone to other formations, shallow groundwater and/or the surface. However, it is noted that although migration pathways are an issue in the choice of location of the injection well, no subsequent subsurface monitoring is required by the regulatory bodies to study whether migration is occurring. Considering the toxic nature of the acid gas and the fact that much of Canada’s water supplies come from underground reservoirs this issue is worth considering further. Reaction of the acid gas within the reservoirs is a potentially significant issue. Work by the Alberta Research Council has indicated that, depending on the mineralogy of the reservoir, both the CO2 and H2S will dissolve in the formation water within reservoir. If dissolution does occur, then there is the potential that some mineral fixation might occur. Generally for CO2, the degree of mineral fixation that occurs is limited (only a few percent of total injection volume within hundreds of years) in both carbonate and sandstone reservoirs. The extent to which the injected H2S might be trapped by mineral fixation is an important question to be resolved. Reaction of the acid gas with the cap rock (which in most cases are shales) and with the cements in the injection wells (both in existing and old abandoned wells that are punctuating the reservoir) are both important issues that could lead to migration of the injected gas out of the reservoir. The degree of reaction of the acid gas with the cap rock and injection well cements needs to be fully understood.
4 There are several cases with pipeline distances of 2500 to 5500 m 5 Moisture contents of less than 0.5 mole % are maintained by removing the water condensed after each compression stage rather than using a separate dehydration stage.
iv
Comparisons with other geological storage practices There are some interesting comparisons that can be drawn with other gas storage operations that can that warrant discussion principally relating to monitoring requirements. Despite the fact that acid gas is both strongly acidic (and because of its H2S content toxic) the regulations in place in Canada for acid gas injection do not include monitoring of overlying aquifers, particularly where the injection is made into deep saline aquifers. This contrasts with natural gas regulations in Europe which call for the monitoring of vertical leakage by gas migration (if any) towards the aquifers located above the reservoir to ensure that leakage remains minimal and acceptable. Also, any lateral gas spread is to be monitored using a set of wells6. The European gas storage regulations require much less extensive monitoring for oil and gas fields, the inference that can be drawn is that it is considered that these reservoirs are less likely to leak than aquifers. In a study undertaken by Battelle for the USDOE7 it was suggested that an injection well for CO2 into an aquifer would be Class I under the provisions of the Underground Injection Control (UIC) programme of the Federal Safe Drinking Water Act. Class I wells are wells that inject hazardous or non-hazardous wastes into geological formations and require a permit. Much of the information required in the permit applications for Class I wells in the USA appear to be similar to those for acid gas injection in Canada. One area where the regulations differ is that in the USA detailed groundwater modelling studies are required to study plume migration and monitoring will be required of surface water and overlying aquifer used for water abstraction. There are a number of operational acid gas injection operations in the USA, comparison of their regulatory requirements and monitoring requirements with those in Canada might provide additional information and insight into practises that might be adopted for CO2 storage. Extrapolation of acid gas injection experience to CO2 storage Acid gas injection operations can be regarded as more hazardous operations than for CO2 injection alone. The primary reason for this is the presence of H2S which is a highly toxic chemical species. Regulations framed for acid gas injection, therefore, should be more stringent than those for CO2 injection alone and could be deemed as not directly relevant. However, the regulations will provide a useful bench mark for CO2 storage8, particularly if one assumes that to gain public acceptance for widespread CO2 storage in geological reservoirs, some over-design and regulation might be necessary in the early years of implementation of the technology. Any operation where gases are injected into geological reservoirs will provide information that will help develop confidence in geological storage of CO2. In the case of acid gas injection if it can be demonstrated that the injected acid gases have been contained within the geological reservoirs, that cement integrity in the injection wells has not been compromised and there are no associated environmental problems, then this should build confidence that CO2 alone will be stored effectively as well. However, at present it might be difficult to demonstrate credible evidence for acid gas containment within a geological reservoir without a detailed monitoring programme being undertaken at an acid gas injection site.
6 IEA Greenhouse Gas R&D Programme File Note on Geological Storage of CO2 - Conflicts with and experience to be gained from natural gas storage, 4th January 2001. 7 Project No. DE-RAC26-98FT40418, Carbon Dioxide Sequestration in Saline Formations – Engineering and Economic Assessment – Final Technical Report, July 9, 2001 8 Regulations on acid gas operations in Canada have been included in the study currently underway that will develop a discussion document on Guidelines for CO2 Storage in Geological Media. A draft report on this study is expected in early 2003.
v
vi
Expert Group Comments The draft of this report was sent to a panel of expert reviewers and to a number of the IEA GHG Programme’s members who had expressed interest in reviewing it. Generally the comments received focused on editorial issues. However, a number asked for additional information to be supplied including: adding the Alberta and British Columbia guidelines as appendices, including details on whether any applications been rejected (if so why), listing completed or abandoned projects, and any lessons to be learnt, as well as information on monitoring and if there were any reportable incidents. These comments have now been discussed with the contractor and will be dealt with in the final report for Phase I of the project.
Major Conclusions
Currently over 1 Mt/y of acid gases (H2S) and CO2 are being injected into deep saline aquifers and depleted oil and gas fields in Alberta, Canada. Whilst the quantities of gas injected are modest compared to the amount of CO2 injected in CO2-EOR operations in the USA and Canada, nevertheless there is a considerable body of knowledge that can be drawn upon for reference in connection with wide scale implementation of CO2 storage in the future. Information and experience exists on the regulation of acid gas injection sites and the design and operation of compressors, pipelines and injection wells that are relevant to larger CO2 storage operations. The regulatory procedures in place for acid gas injections focus principally on the surface and injection well activities, with close attention paid to preventing leakage from the injection well above and underground and the prevention of loss of containment through reservoir fracturing. Monitoring of the acid gas injection projects is currently limited to surface installations and injection well operations. The experience that could be gained from these projects could be broadened considerably if sub-surface monitoring was included at a specific site or at several sites reflecting the range of reservoirs that are being used for acid gas storage purposes. Such monitoring activities could provide detailed knowledge of the impacts of impurities, as well as the behaviour of CO2’ in geological reservoirs which would help build our understanding of the impacts of injection of CO2 and other gases in geological reservoirs.
Recommendations In addition, to the acid gas injection operations in Canada there are a further 10 sites in the USA, mostly in Wyoming. It would be useful to collate details of the regulatory procedures in the USA for these sites to see if they are comparable or contrast in any way. Also if similar details as those in the Canadian data set could be compiled on the acid gas operations in the USA, then this would provide a single comprehensive overview of acid gas operations in North America. Such an overview could be done as an extension to this project or as a separate study. Consideration should be given to developing a monitoring project at a new acid gas injection facility (or at several facilities reflecting the range of reservoirs that are being utilized) to assist in the development of the knowledge of injection of CO2 and other gaseous species. Such a project should consider both surface and sub–surface monitoring to provide confidence on containment of the injected gas in the reservoir and to discount any surface migration.
Characteristics of Acid Gas Injection Operations in Western Canada
Interim Report to
International Energy Agency – Greenhouse Gas R&D Programme
Dr. Stefan Bachu Dr. William D. GunterAlberta Geological Survey Alberta Research CouncilAlberta Energy and Utilities Board
August 2002
ContentsIntroduction ..................................................................................................................................3
Acid gas injection operations ............................................................................................4Compilation project............................................................................................................4
Historical background ....................................................................................................................6Site selection and operations..........................................................................................................9
Acid gas properties ............................................................................................................9Surface operations ............................................................................................................10Subsurface considerations ................................................................................................12
Review of operations in Alberta ..................................................................................................13Subsurface characteristics ................................................................................................14Licensed operations..........................................................................................................15Surface characteristics......................................................................................................15
Issues ..........................................................................................................................................16Conclusions ..................................................................................................................................17References ....................................................................................................................................19Appendix ......................................................................................................................................21
Figures
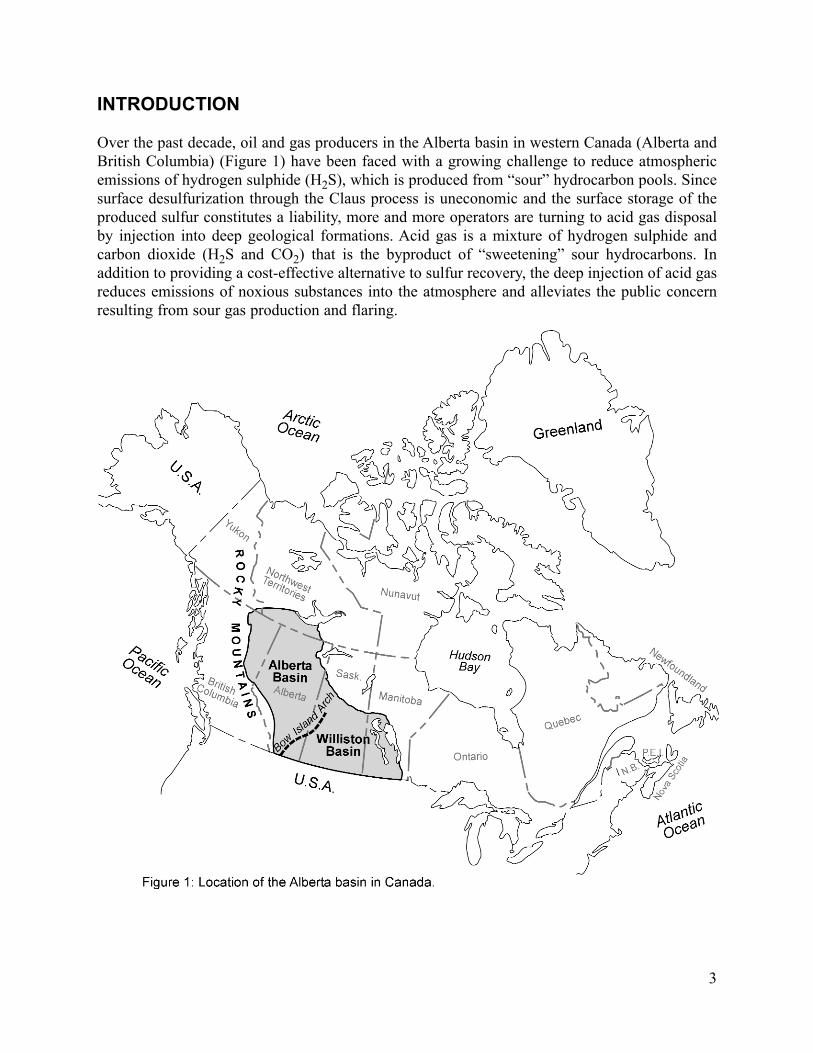
Figure 1: Location of the Alberta basin in Canada........................................................................3
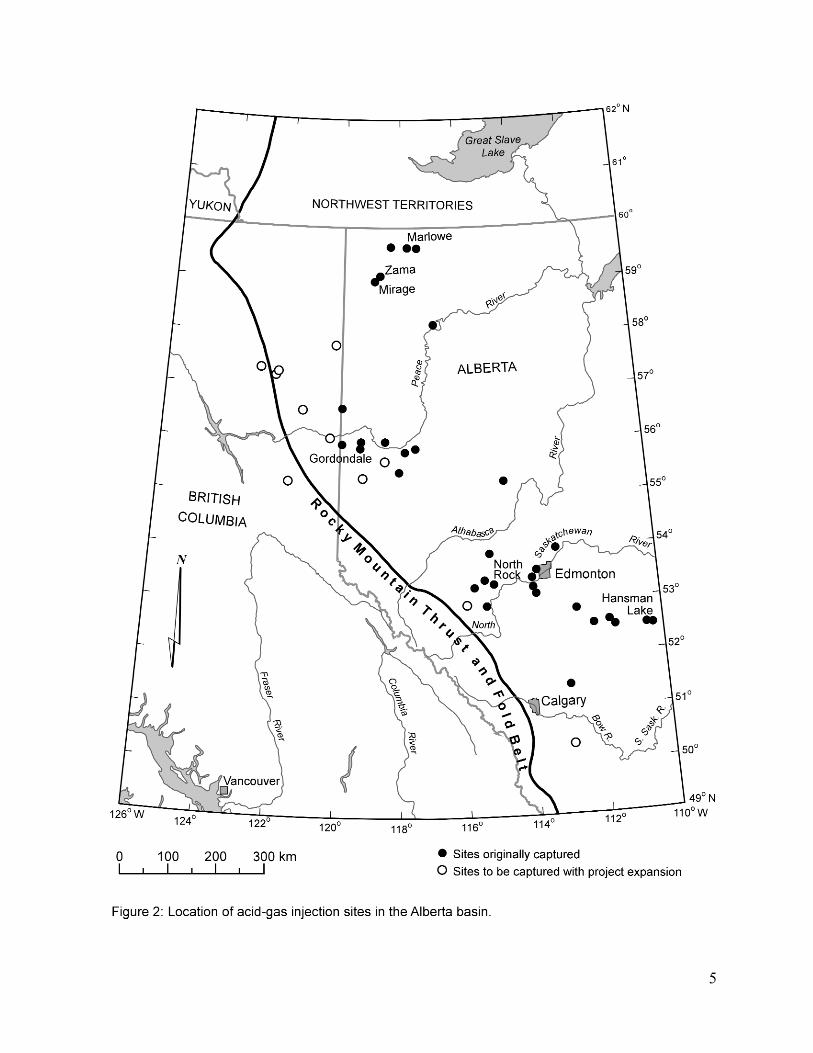
Figure 2: Location of acid gas injection sites in the Alberta basin ..............................................5
Figure 3: Cumulative volumes of CO2 and H2S licensed for injection as acid gas in Alberta up to Fall 2001 ......................................................................................................9
Figure 4: Phase diagrams for methane (CH4), carbon dioxide (CO2), hydrogen sulphide (H2S) and a 50%-50% acid gas mixture; hydrate conditions for CO2 and H2S; and a 4- stage acid-gas compression cycle ..............................................10
2
INTRODUCTION
Over the past decade, oil and gas producers in the Alberta basin in western Canada (Alberta andBritish Columbia) (Figure 1) have been faced with a growing challenge to reduce atmosphericemissions of hydrogen sulphide (H2S), which is produced from “sour” hydrocarbon pools. Sincesurface desulfurization through the Claus process is uneconomic and the surface storage of theproduced sulfur constitutes a liability, more and more operators are turning to acid gas disposalby injection into deep geological formations. Acid gas is a mixture of hydrogen sulphide andcarbon dioxide (H2S and CO2) that is the byproduct of “sweetening” sour hydrocarbons. Inaddition to providing a cost-effective alternative to sulfur recovery, the deep injection of acid gasreduces emissions of noxious substances into the atmosphere and alleviates the public concernresulting from sour gas production and flaring.
3
Although the purpose of the acid gas injection operations is to dispose of H2S, significantquantities of CO2 are being injected at the same time because it is uneconomic to separate the twogases. In the context of current debates and research regarding global climate change as a resultof anthropogenic greenhouse gas emissions, of which CO2 is the most important, the acid gasinjection operations in western Canada represent an analogue to geological sequestration of CO2.This option is an immediately-available and technologically-feasible means of reducing CO2emissions into the atmosphere that is particularly suited for land-locked regions located onsedimentary basins, such as the North American mid-continent. Large-scale injection of CO2 intodepleted oil and gas reservoirs and into deep saline aquifers is one of the most promising methodsof geological sequestration of CO2, and in this respect it is no different from acid gas injectionoperations. However, before implementation of greenhouse gas geological sequestration, a seriesof questions need addressing, the most important ones relating to the short- and long-term fate ofthe injected CO2. Thus, the study of the acid gas injection operations in western Canada providesthe opportunity to learn about the safety of these operations and about the fate of the injectedgases, and represents a unique opportunity to investigate the feasibility of CO2 geologicalsequestration.
Acid Gas Injection Operations
In Alberta, the Oil and Gas Conservation Act requires that operators apply for and obtain approvalfrom the Alberta Energy and Utilities Board (EUB), a provincial regulatory agency, to dispose ofacid gas. Similarly, in British Columbia (B.C.) operators have to apply to B.C. Ministry of Energyand Mines for approval. Before approving any operation, the regulatory agencies review theapplication to maximize conservation of hydrocarbon resources, minimize environmental impactand ensure public safety. To adequately address these matters, the regulators require that theapplicants submit information regarding surface facilities, injection well configurations, charac-teristics of the injection reservoir or aquifer, and operations. After approval for acid gas injectionis granted, the operators have to submit to the regulatory agencies biannual progress reports onthe operations.
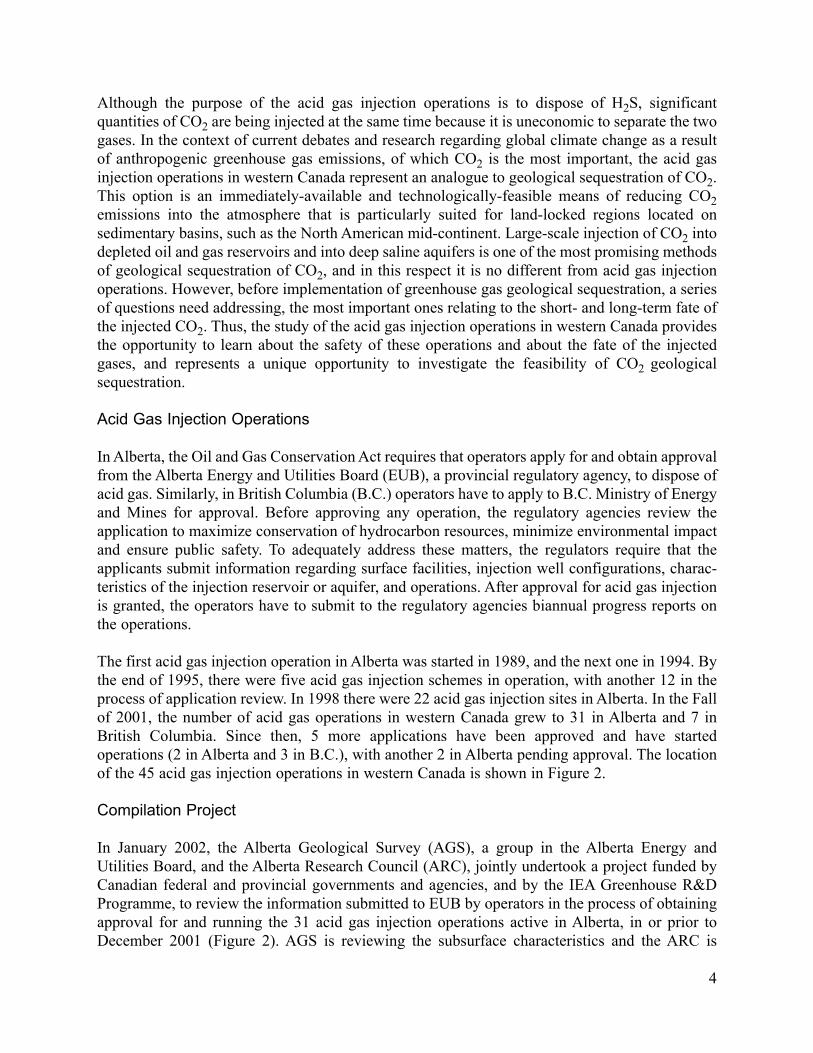
The first acid gas injection operation in Alberta was started in 1989, and the next one in 1994. Bythe end of 1995, there were five acid gas injection schemes in operation, with another 12 in theprocess of application review. In 1998 there were 22 acid gas injection sites in Alberta. In the Fallof 2001, the number of acid gas operations in western Canada grew to 31 in Alberta and 7 inBritish Columbia. Since then, 5 more applications have been approved and have startedoperations (2 in Alberta and 3 in B.C.), with another 2 in Alberta pending approval. The locationof the 45 acid gas injection operations in western Canada is shown in Figure 2.
Compilation Project
In January 2002, the Alberta Geological Survey (AGS), a group in the Alberta Energy andUtilities Board, and the Alberta Research Council (ARC), jointly undertook a project funded byCanadian federal and provincial governments and agencies, and by the IEA Greenhouse R&DProgramme, to review the information submitted to EUB by operators in the process of obtainingapproval for and running the 31 acid gas injection operations active in Alberta, in or prior toDecember 2001 (Figure 2). AGS is reviewing the subsurface characteristics and the ARC is
4
5
reviewing the surface facilities of these operations. The original deadline of the project wasSeptember 2002. In June 2002, the first industry participant joined the project, at which time thefunding agencies agreed to expand the scope of the project to include the 10 acid gas injectionoperations in British Columbia and the additional 4 acid gas operations in Alberta (2 alreadyapproved and 2 pending approval). Concomitantly, the project deadline was extended to March31, 2003. This interim report presents results to date of the review of the original 31 sites inAlberta, as per the terms of the original contract.
Historical files with the respective regulatory agencies in Alberta and British Columbia weresearched for applications for acid gas injection operations, for approvals and for the subsequentprogress reports submitted by operators. Relevant information from these hard copy documentswas entered into a specially-designed database. Several synthesis reports (tables) were generatedthat compile and present information from the acid gas injection sites. These reports andassociated graphs are included in the Appendix.
With regard to the reviewed documentation, this interim report contains all the informationcurrently existing with the Alberta Energy and Utilities Board for the initial 31 sites in Alberta.Documentation is missing or was not captured in the following cases:
• The original application for Marlowe is missing, for unknown reasons.• Applications for the Redwater and Belshill Lake sites do not exist because they did not
require an acid-gas application since they were originally water disposal sites that changed to “sour-water”.
It must be emphasized here that the information presented herein is “as submitted” by theoperators, with no additional checking and interpretation by AGS and/or EUB staff, except forevidently and blatantly wrong data. The data were adequately checked for data-entry accuracy,but were not checked for validity. Any data inconsistencies reflect the data and information assubmitted to EUB by operators. Missing data for some sites are due to the lack of submissions byoperators, or to unavailability within EUB. In cases that data and information were not submitted,no additional search was performed to fill in from other sources. The verification of the submittedinformation and collection of additional data should be the purpose of another, continuing project.
HISTORICAL BACKGROUND
A significant portion of raw natural gas production in the Alberta basin, Canada, contains varyingpercentages of acid gas components, specifically hydrogen sulphide (H2S) and carbon dioxide(CO2). To meet pipeline and sales gas specifications, this raw sour natural gas must pass throughgas processing facilities to separate out the acid gas components. Furthermore, a number of souroil pools produce solution gas that contains significant amounts of H2S and CO2 (e.g., 4% and17% respectively at the Wayne –Rossdale; Ho et al. 1996). Prior to 1988, if sulfur-recoverytechnology could not economically remove the sulfur from the acid gas, the alternative was toburn the acid gas in flare stacks or incinerators. Each flaring source was permitted to emit up to10 t/d of sulfur. To reduce the waste and pollution resulting from sour-gas flaring, regulatoryagencies in Alberta and British Columbia require since 1989 that gas plants with a sulfurthroughput of more than 1 t/d recover the sulfur from the gas stream (Longworth et al. 1996). Theamount of recovered sulfur increases from 70% for plants producing 1 to 5 t/d, to 96% for plants
6
producing more than 10 t/d. Nevertheless, even with sulfur recovery in place, significant volumesof tail, or acid gas, are generated, and this is often flared from stacks at the well sites. In the early‘90s, the yearly average emission from gas flaring in the Alberta basin was in the order of 0.3 MtSO2 and 6 Mt CO2 (Longworth et al. 1996).
Until the late ‘80s and early ‘90s, sulfur recovery and acid gas flaring were considered the mosteconomic ways of dealing with the sulfur in sour and acid gases. As a result of public concernabout flaring, including environment degradation, human and animal health, and waste, theregulatory agencies require more and more that operators reduce emissions, particularly in areasof high public concern. Because the sulfur world supply is dominated by recovered sulfur andenvironmental pressure has driven desulfurization to the point that the supply has exceededdemand, large tonnages of sulfur are being poured into block storage throughout the world,including the Alberta basin (Connock 2001). Since desulfurization is uneconomic in a weak sulfurmarket, and flaring is publicly unacceptable, more and more operators in the Alberta basin areturning to acid gas disposal through injection into deep subsurface formations, mostly in salineaquifers, but also in depleted oil and gas reservoirs. The on-site geological disposal is particularlyattractive if, otherwise, operators have to build their own sulfur recovery plant or a pipeline to thenearest plant with available capacity, each alternative having its own undesirable effects(Keushnig 1995).
These acid gas injection sites in the Alberta basin are by and large located mostly in the regionclose to the Rocky Mountain Thrust and Fold Belt that corresponds to sour gas production fromdeep reservoirs (Figure 2). Two sites in B.C. are actually located within the thrust and fold belt.At 26 sites the acid gas is injected into deep saline aquifers in regional-scale flow systemsconfined by regional-scale aquitards, with the remainder of sites injecting into depleted oil andgas reservoirs. The acid gas could increase oil or gas recovery if it is injected to maintain reservoirpressure (Longworth et al. 1996; Connock 2001). Because site selection and approval must meeta set of stringent criteria imposed by regulatory agencies to address H2S emissions (Keushnig1995; Longworth et al. 1996), the sites meet also the criteria for and are located in areas suitablefor CO2 sequestration in geological media in the Alberta basin (Bachu 2000; Bachu & Stewart2002).
In 1989, Chevron Canada Ltd. started the first acid-gas injection operation at Acheson, on theoutskirts of Edmonton in Alberta, designed to handle a mixture of 15% H2S and 85% CO2 byinjecting it at a depth of 1100 m into a depleted sandstone oil reservoir (Lock, 1997). Theoperation experienced elemental sulfur deposition, which plugged the injection well (Longworthet al., 1996). The next operation, by a different company, started in 1994 by injecting 20% H2Sand 80% CO2 into a water-saturated carbonate reef in central Alberta. Also in 1994, ChevronCanada Ltd. started acid gas injection at 30MPa pressure into a carbonate aquifer 2800 m deep atPembina, west of Edmonton. The acid gas composition is 74% H2S, 21% CO2, 1% hydrocarbongases, and water for the remainder (Lock, 1997).
In 1995, PanCanadian Petroleum Ltd. started mixing, at surface, acid gas with produced water atelevated pressure, and injected the solution (“sour water”) into a water-saturated sandstone zoneunderlying an oil pool at Hansman Lake, and into a deep, dolomitized carbonate-shelf aquifer atThompson Lake in eastern Alberta (Kopperson et al. 1998a,b). Both injection zones are overlain
7
by shales. The sandstone aquifer has high porosity (30% on average) and permeability (up toseveral darcies, or 10-12 m2), while the carbonate zone has 22% porosity. Also in 1995,PanCanadian started an acid-gas injection operation at Wayne-Rosedale, northeast of Calgary inAlberta. The acid gas mixture (20% H2S and 80% CO2), with an estimated daily production rateof 21,000 m3/d, was the result of sweetening a 34oAPI oil with an associated solution gascontaining 4% H2S and 17% CO2 (Ho et al., 1996). Injection takes place in a 26 m water-saturated carbonate-reef unit, characterized by 6% porosity, 150x10-15 m2 (150 md) permeability,65oC temperature and 15.5 MPa formation pressure, confined by tight dolomite units. At in situconditions, the acid gas density is ~543 kg/m3 (Ho et al., 1996).
In 1995, Penzoil Canada Inc. started injecting a mix of 20% H2S and 80% CO2 at 120,000 m3/dinto a depleted oil reservoir in a pinnacle carbonate reef ~1510 m deep at Zama X2X in northernAlberta. Because acid gas is miscible with oil, at one point during the operation it was used inconjunction with a miscible-flood scheme to enhance the oil recovery (Davison et al., 1999). The~115 m dolomitized reef with an average porosity of 7.6% is underlain by ~45 m of tight limemudstone and is overlain by 60 to 90 m of anhydrite. The critical point of the acid gas mixture is42oC and 7.64 MPa. At target operating conditions of 14.5 MPa and 76oC (initial reservoirpressure and temperature), the injected acid gas is supercritical, with a density of ~500 kg/m3 anda viscosity of 0.04 cp (Davison et al., 1999). The caprock threshold displacement pressure wasmeasured in the laboratory to be 22.3 MPa. Considering that the initial differential pressure acrossthe caprock is ~7 MPa, the maximum operating pressure was established at 30 MPa. Because theformation water naturally contains significant amounts of both CO2 and H2S, acid gas injectionwas not expected to cause dissolution of reservoir rock and/or precipitation.
The West Stodddart acid gas injection operation in British Columbia, which started in 1998, is thelargest to date in the Alberta basin and the world, with a licensed capacity of 390,000 m3/d, butoperating only at 280,000 m3/d. The acid gas stream contains 85% H2S and 15% CO2 (340 and78 t/d H2S and CO2, respectively).
The acid gas is or was mixed with water at surface, prior to injection, at the following sites:Mitsue Wabamun, Provost-Leduc (up to 1999), Hansman Lake, Mirage, Redwater and BelshillLake. The last two are actually water disposal sites with a minor amount of dissolved acid gas(“sour water” disposal) and injection at these sites is done “randomly” through 49 and 19 wells,respectively. Because these are water disposal schemes approved previously as such, theoperators did not have to submit a special application to the regulatory agency to inject sour water.The Hansman Lake, Gordondale Halfway, and Mirage sites (Figure 2) were rescinded in 1997,1998 and 1999, respectively. The Zama X2X and Z3Z sites stopped injecting (shut in) in May1998 and December 2000, respectively. One operation, at Northrock, although approved, was never implemented.
Currently, acid gas injection in the Alberta basin occurs over a wide range of aquifer and reservoircharacteristics, acid-gas composition, and operating conditions. The composition of the injectedacid gas varies from site to site, from 95% H2S and 5% CO2 to 5% H2S and 95% CO2. In 2000,the total approved rates for acid gas injection in Alberta reached more than 1,300,000 m3/d CO2and 900,000 m3/d H2S (Figure 3). Considering also the seven acid gas injection sites in British
8
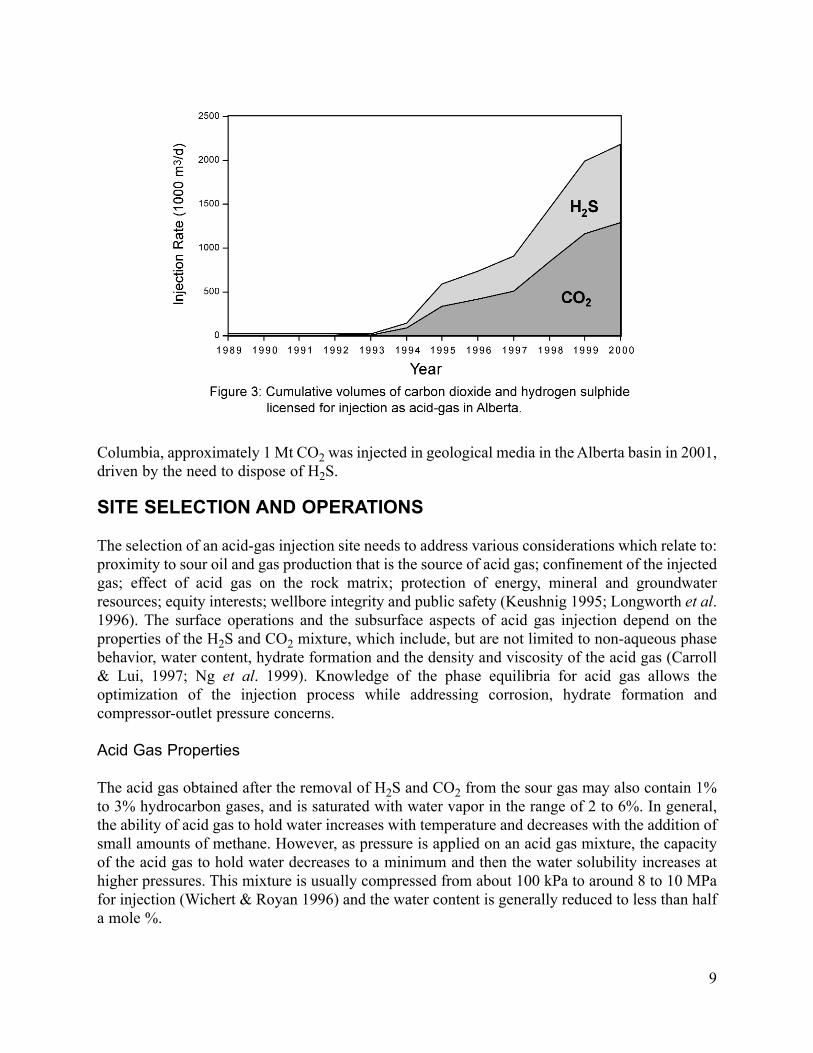
Columbia, approximately 1 Mt CO2 was injected in geological media in the Alberta basin in 2001,driven by the need to dispose of H2S.
SITE SELECTION AND OPERATIONS
The selection of an acid-gas injection site needs to address various considerations which relate to:proximity to sour oil and gas production that is the source of acid gas; confinement of the injectedgas; effect of acid gas on the rock matrix; protection of energy, mineral and groundwaterresources; equity interests; wellbore integrity and public safety (Keushnig 1995; Longworth et al.1996). The surface operations and the subsurface aspects of acid gas injection depend on theproperties of the H2S and CO2 mixture, which include, but are not limited to non-aqueous phasebehavior, water content, hydrate formation and the density and viscosity of the acid gas (Carroll& Lui, 1997; Ng et al. 1999). Knowledge of the phase equilibria for acid gas allows theoptimization of the injection process while addressing corrosion, hydrate formation andcompressor-outlet pressure concerns.
Acid Gas Properties
The acid gas obtained after the removal of H2S and CO2 from the sour gas may also contain 1%to 3% hydrocarbon gases, and is saturated with water vapor in the range of 2 to 6%. In general,the ability of acid gas to hold water increases with temperature and decreases with the addition ofsmall amounts of methane. However, as pressure is applied on an acid gas mixture, the capacityof the acid gas to hold water decreases to a minimum and then the water solubility increases athigher pressures. This mixture is usually compressed from about 100 kPa to around 8 to 10 MPafor injection (Wichert & Royan 1996) and the water content is generally reduced to less than halfa mole %.
9
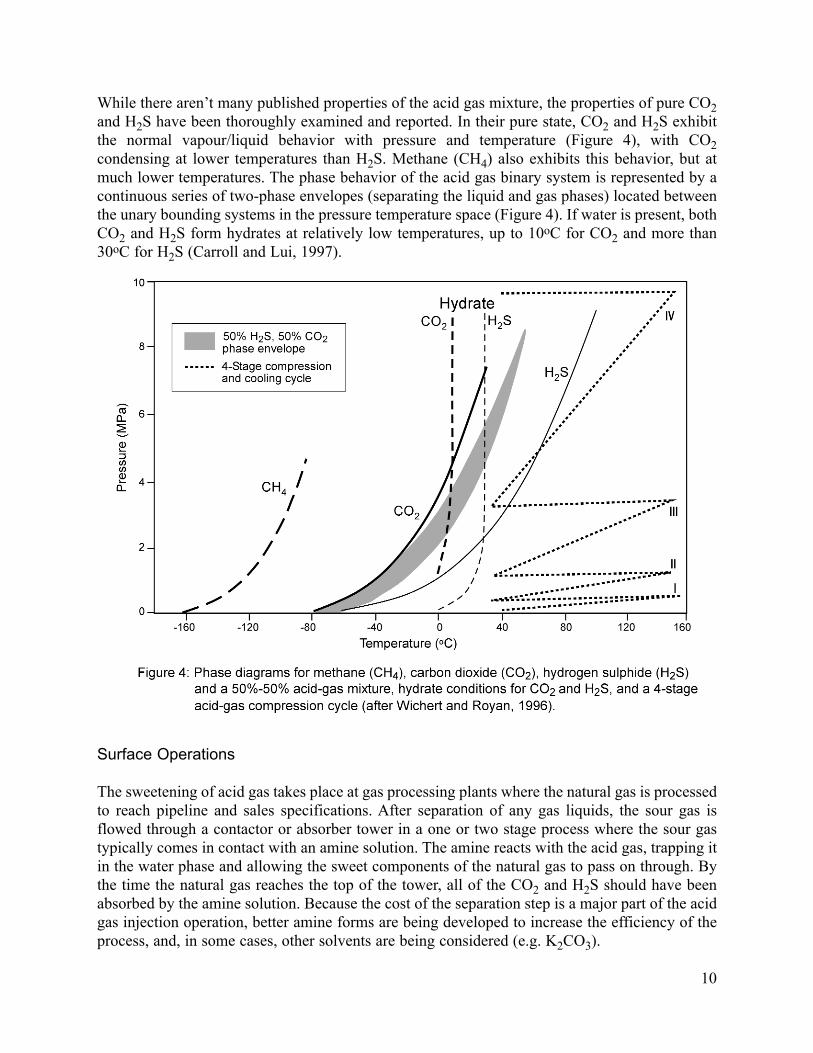
While there aren’t many published properties of the acid gas mixture, the properties of pure CO2and H2S have been thoroughly examined and reported. In their pure state, CO2 and H2S exhibitthe normal vapour/liquid behavior with pressure and temperature (Figure 4), with CO2condensing at lower temperatures than H2S. Methane (CH4) also exhibits this behavior, but atmuch lower temperatures. The phase behavior of the acid gas binary system is represented by acontinuous series of two-phase envelopes (separating the liquid and gas phases) located betweenthe unary bounding systems in the pressure temperature space (Figure 4). If water is present, bothCO2 and H2S form hydrates at relatively low temperatures, up to 10oC for CO2 and more than30oC for H2S (Carroll and Lui, 1997).
Surface Operations
The sweetening of acid gas takes place at gas processing plants where the natural gas is processedto reach pipeline and sales specifications. After separation of any gas liquids, the sour gas isflowed through a contactor or absorber tower in a one or two stage process where the sour gastypically comes in contact with an amine solution. The amine reacts with the acid gas, trapping itin the water phase and allowing the sweet components of the natural gas to pass on through. Bythe time the natural gas reaches the top of the tower, all of the CO2 and H2S should have beenabsorbed by the amine solution. Because the cost of the separation step is a major part of the acidgas injection operation, better amine forms are being developed to increase the efficiency of theprocess, and, in some cases, other solvents are being considered (e.g. K2CO3).
10
After separation, the gas is now sweet, meeting pipeline and market specifications for allowableacid gas content. The gas-saturated amine solvent is collected from the bottom of the tower andis regenerated by heating the aqueous solution to approximately 170oC. The water-saturated acid-gas stream leaves the regeneration unit at 35 to 70 kPa and must be cooled and then compressedin excess of the subsurface storage formation pressure for injection. Typically, four stages ofcompression are required to provide the required discharge pressure (Figure 4). Duringcompression, the acid gas mixture heats up and, therefore, cooling is required after each stage ofcompression. It is desirable to keep the compression cycle at a higher temperature than thestability field for hydrates to prevent compressor breakdown and plugging. The hydrate-formingtemperature at any pressure of an acid gas increases with increasing content of H2S. In the limit,compression temperatures maintained above 35oC will avoid hydrates forming (Figure 4).
Even if hydrate forming is avoided, excess water accelerates corrosion of the steel in contact withthe acid gas, and is the main reason why dehydration of the acid gas is needed. Compression willtend to dewater the acid gas up to a maximum pressure between 3 and 5 MPa if there are nohydrocarbon impurities present. This pressure maximum reflects the pressure at which the acidgas mixture is in the dense liquid phase form, where the solubility of water can increasesubstantially with increasing pressure due to the molecular attraction between these polarcompounds (Wichert and Royan, 1996). Compressing the acid gas to higher pressures increasesthe solubility of water in the acid gas and more than counteracts the decrease in solubility due tointerstage cooling. Hence, a separate dehydration step may not be needed (Clark et al., 1998)Thus, by collecting the condensed water during each compression stage and by keeping thetemperature a few degrees above the hydrate stability temperature, the probability of hydrateformation and corrosion are minimized, and lower-quality, less expensive steels can be used fortransporting the acid gas mixture to the subsurface storage formation.
To avoid pump cavitation, the acid gas must not enter the two-phase region during compression.Higher temperatures, although required in the process to avoid hydrate formation and plugging ofthe lines, lead to accelerated corrosion. Both plugging and corrosion can lead to containmentfailure. Additional safety precautions require addition of chemical inhibitors to the acid gasstream (for example methanol to lower hydrate formation temperatures, and glycol to extract theexcess water from the acid gas stream) or use of specialty corrosion-resistant steels. Both add tothe cost of the operation. Corrosion monitoring is normally done to assess the effectiveness of thetreatments.
Once the acid gas is compressed, it is transported through a pipeline to the injection wellheadusually at a short distance from the gas plant. The well consists of a central steel tubing stringwith an outer annulus bounded by a steel casing, which is cemented to the subsurface formations.The acid gas flows down the well tubing to the subsurface storage formation depth and across thewell casing, through perforations in the casing, to the subsurface storage formation. The dischargepressure from the compressor must exceed the sum of the formation pressure, the pressure lossdue to friction in the line from the compressor to the wellhead, friction loss in the tubing string,pressure drop across the perforations, pressure loss/gain due to elevation change from thecompressor to the well head, and pressure-head gain due to the liquid column in the tubing string.Ultimately, the discharge pressure must consider the desired injectivity into the subsurface storageformation, which depends on the thickness and permeability of the formation and on the viscosity
11
and density of the acid gas at in situ conditions. The high pressures after the fourth compressionstage stabilize, upon cooling, the high-density liquid-phase of the acid gas, which can have adensity of approximately 75% of the density of water, providing the hydrocarbon content is notgreater than approximately 2%. Considering that in most cases the pressure of the subsurfaceinjection formation is near hydrostatic, the hydraulic head provided by the acid gas provides asignificant amount of the total pressure required to inject it into the subsurface formation.
Several safety features are incorporated in the injection well to prevent leakage. The casing isisolated from the tubing string and the acid gas by installing a packer in the annulus between thecasing and the tubing string just above the subsurface storage formation, which is pressure testedfor integrity once a year. A down-hole safety valve or a check valve can be incorporated in thetubing string so that if something fails at surface, the flow of acid gas from the formation will beprevented. The wellhead of the injection well is similarly protected with valves.
Although a number of safety valves are installed, both in the well and in the surface facilities tobe able to isolate the containment lines for the acid gas injection system into small volumes, evenrelease of small volumes of acid gas can be harmful. Consequently, the operators are required tohave a detailed emergency response plan (ERP) if a leak occurs that may impact humans. Anemergency planning zone, the EPZ (i.e. area of land which may be impacted by the release ofH2S), is defined around the sour gas facility. The size of the EPZ increases with time as thecumulative amount of acid gas re-injected increases, initially from that in the pipeline to that inthe reservoir. However, the EPZ must be kept to a reasonable size (Longworth et al, 1996). Tohave an effective ERP, the area surrounding the injection site should be equipped with H2Sdetection and alarm systems, windsocks, self-contained breathing apparatus, and remote unit andplant shutdown stations.
Subsurface Considerations
The general location for an acid-gas injection well is often influenced by the proximity to sourgas oil or gas production that is the source of acid gas. The actual location is based on a generalassessment of the regional geology and hydrogeology, designed to evaluate the potential forleakage (Longworth et al., 1996), which include:1. size of the injection zone, to confirm that the it is large enough to hold all of the injected acid
gas over the project lifetime;2. thickness and extent of the overlying confining layer (caprock), and any stratigraphic traps or
fractures that may affect its ability to contain the acid gas;3. location and extent of the underlying or lateral bounding formations;4. folding or faulting in the area, and an assessment of seismic risk;5. flow rate and direction of the natural flow system, to assess the potential for migration of the
injected acid gas;6. permeability and heterogeneity of the injection zone;7. chemical composition of the formation fluids (water for aquifers, oil or gas for reservoirs);8. formation temperature and pressure;9. analyses of formation and caprock core (if available); and, finally,10. a complete and accurate drilling history of offsetting wells within several km of the injection
well, to identify any wells or zones that may be impacted by the injected acid gas.
12
In addition, the regulatory agencies require that environmental concerns are addressed, such asinjection-formation suitability, wellbore integrity, operating parameters (to ensure formation andwell integrity), and optimization of the injection space, considered a limited resource. Because ofthe nature of acid gas injection operations, the wells are considered as Class III disposal wells,unless the acid gas is dissolved in produced water prior to injection, in which case the well isdesignated as either Class Ib or Class II, depending on the produced-water designation (AEUB,2000). Completion and logging requirements are similar for Class II and III wells, and include:a. all geological zones must be identified using logs and/or core;b. all potential hydrocarbon-bearing zones and the shallow potable groundwater aquifers must
be hydraulically isolated by cement;c. injection must be through tubing, and the annulus must be with a corrosion-inhibiting fluid;d. hydraulic isolation and cement integrity must be confirmed by a full-length casing log; ande. safety devices must be installed both above the ground and in the well bore to ensure that
failure of any component in the system does not result in environmental damage.
If the injection pressure drops for any reason, the well is automatically shut-in, to prevent acidgas backflow.
Knowledge of the geological setting and characteristics is critical to assess the integrity of thehost formation or reservoir, and the short- and long-term fate of the injected acid gas. Ofparticular importance are potential migration pathways from the injection zone to otherformations, shallow groundwater and/or the surface. These potential pathways are of three types:the caprock pore space (“membrane”), natural and/or induced fractures (“cracks”) through theconfining strata, and improperly completed and/or abandoned wells (“punctures”). To avoiddiffuse gas migration through the caprock pore space, the difference between the pressure at thetop of the injection aquifer or reservoir and the pressure in the confining layer must be less thanthe caprock threshold displacement pressure, which is the pressure needed for the acid gas toovercome the capillarity barrier and displace the water which saturates the caprock pore space. Toavoid acid gas migration through fractures, the injection zone must be free of natural fractures,and the injection pressure must be below a certain threshold to ensure that fracturing is notinduced. The maximum bottomhole injection pressure is set by regulatory agencies at 90% of thefracturing pressure. In the absence of site-specific tests, the pressures are limited by pressure-depth correlations, based on basin-wide statistical data for the Alberta basin. From this point ofview, injection into a depleted oil or gas reservoir has the advantages of injection pressures beinglow and of wells and pipelines being already in place (Keushnig, 1995).
REVIEW OF OPERATIONS IN ALBERTA
Because the suitability for and approval of acid gas injection operations are determined by thecharacteristics and containment properties of the injection aquifer or reservoir, which then affectoperation and engineering characteristics, the review, subsurface and surface, for the 31 sites inAlberta is summarized in Tables 1 to 6 in the Appendix in the following order. Tables 1 and 2summarize the aquifer and reservoir geology, rock characteristics and fluids. Table 3 summarizeslicensed operating parameters, such as injection pressure, rate and volumes, and the radius of theemergency protection zone (EPZ). The latter is established for the case of an atmospheric releaseof acid gas, either as a result of an escape to the surface from the injection zone, or as a result of
13
failure in surface facilities. Tables 4, 5 and 6 summarize engineering characteristics of the acidgas injection operations, such as: injection wells, pipelines, and gas plant compressors,respectively. Common to each table is a site number or plant number. The two designations werenecessary because one plant compressor train could serve several injection sites, and at eachinjection site there could be several injection wells. The plant designation number ends in “00”.The non-zero integers making up the plant number are the group indicator for the sites belongingto that particular plant. For example, plant number 1500 refers to site numbers 1510, 1522, and1563 in the tables. Lack of data or information in the original applications is denoted in tables byND (no data). If a data category does not apply to a certain case, such as water salinity for an oilreservoir, then NA (not applicable) is used. Although only 31 acid gas injection sites werelicensed up to Fall 2001, Tables 1-3 have 34 lines because: a) at one site the original applicationwas for one formation (site 312) and then, after a period of operation, it was changed to another,deeper formation (site 320), and b) at one site there are actually 3 individual injection wells indifferent units (sites 1510, 1522 and 1563). Tables 4-6 have more than 34 lines because there areinjection sites with multiple wells and pipelines and/or compressors. A series of self-explanatorygraphs were produced on the basis of the summary tables, which are grouped into 3 categories:host rock, host fluids and injection operations.
Subsurface Characteristics
The depth of the injection zone varies mostly in the 1100-2100 m range, although in a few casesit is as shallow as 705 m, and as deep as 2918 m (Table 1). The shallow injection zones (i.e. at705 m, 809 m and 913 m depth) correspond actually to sour water injection. Although thethickness of the injection zone varies between 4 and 276 m, the actual net pay reaches only 100m. At 23 locations acid gas is injected into a deep saline aquifer, and at 11 sites it is injected intoa depleted oil or gas reservoir. Of these, 22 are in carbonate rocks and 12 are in sandstones (Table1). Shales constitute the overlying confining unit (caprock) in most cases, although tightlimestones, evaporates and anhydrites are also present. Their thickness varies between 2 and 270m. (Table 1). The porosity of the injection zone varies between 4% and 30% (Table 2). Thecarbonate rocks generally have low porosity, except for carbonate reefs. Only the porosity ofsandstone rocks displays a general trend of decreasing porosity with increasing depth. Rockpermeability is indicated only in 3 cases: 29.5, 34.5 and 500 mD.
The original formation pressure is generally subhydrostatic with respect to freshwater, which ischaracteristic of the Alberta basin (Bachu, 1999), and, except for one very low case of 5915 kPathat actually corresponds to a sour water injection operation, varies between 8900 kPa and 28,588kPa (Table 2). The cases where pressure seems to be slightly above hydrostatic, correspondactually to high salinity formation waters. If the real formation water density is taken intoaccount, then pressure at all sites is hydrostatic or less. In the case of acid gas injection intodepleted oil or gas reservoirs, the original reservoir pressure was drawn down as a result ofproduction, such that formation pressure at the start of acid gas injection was less than the originalformation pressure (Table 2). Production-induced drawdown occurs also in the case of injectioninto an aquifer underlying an oil pool, and into an aquifer located very close to an oil pool. In 5cases formation pressure at start up was below the critical pressure of CO2.
Formation temperature varies between 47oC at ~1360 m depth and 103oC at ~2800 m depth
14
(Table 2), although higher temperatures than the lowest are recorded at shallower depth (e.g. 56oCat ~1140 m), and a relatively low temperature (82oC) is indicated for a deep injection zone (~2680m). The relatively wide spread in temperature variation with depth for the acid-gas injection zonesis due to the variability in geothermal gradients across the Alberta basin, which exhibits a trendof increasing gradients from the south, where they are as low as 20oC/km, to the north, where theyreach more than 50oC/km (Bachu, 1993).
Generally formation waters are very saline, with salinity varying in a very wide range, from~56,000 mg/l to ~340,000 mg/l (Table 3). Although there is a broad trend of increasing salinitywith depth, exceptions are due to the injection zones being either characterized by fresher waterinflux, or in the vicinity of evaporitic beds. The very high salinity encountered at a relativelyshallow depth corresponds to injection into a carbonate aquifer in eastern Alberta overlain bythick halite beds. For the case of acid gas being injected into depleted oil reservoirs, the oils aremedium to very light (33oAPI to 68oAPI) (Table 2). This indicates that there is a high probabilityof the acid gas being miscible with reservoir oil, property that may be used for enhanced oilrecovery, as was the case of one of the Zama sites (Davison et al., 1999). Reservoir gases aregenerally light (specific gravity less than 0.75) except for three cases of 0.915, 1.024 and 1.121(Table 3). Because acid gas is generally heavier than these reservoir gases, it may be used forenhanced gas recovery.
Licensed Operations
The licensed parameters for the acid gas operations are listed in Table 3. The composition of theacid gas licensed for injection varies between 0.15% CO2 and 75% H2S, and 95% CO2 and 4%H2S, with C+ gases for the balance. The maximum approved well head injection pressure (WHIP)and bottom hole injection pressure (BHIP) reach 13,000 kPa and 35,800 kPa, respectively. Themaximum approved well head pressure (WHIP) is generally lower than the formation pressureexcept for the few cases where the injection reservoir has been depleted prior to operations startup. The maximum approved bottom hole injection pressure (BHIP) is always higher than theformation pressure to ensure injectivity. Approved daily injection rates vary between 2,800 and210,000 m3/day, and maximum allowed injection volumes vary between 6⋅106 and 290⋅106 m3.Operations lifetime ranges from 10 to 25 years. Emergency planning zones in case of anaccidental acid gas escape into the atmosphere vary between as low as 0.48 km and as high as 9km around the injection well.
Surface Characteristics
Injection well characteristics are listed in Table 4. Depths range from 1,000 to 3,000 metres.Casing diameter ranges from 114 to 244 mm, while the tubing diameter ranges from 60 to 178mm. The annulus fluid is sealed by a packer and is corrosion inhibited being either fresh water,KCl water, produced water, crude oil, or diesel.
Pipeline characteristics are compiled in Table 5. The pipelines connect the plant compressors tothe re-injection wells, and range in length from 0.1 to 5.4 km, with diameters ranging from 60 to114 mm and wall thicknesses from 4 to 11 mm. Typically, only the shorter pipelines are stainlesssteel. The majority of the pipelines are mild carbon steel. Currently, stress levels in the pipeline
15
are less than half the approved levels, and do not exceed 30%, while licensed levels are as highas 61%.
No attempt has been made to compare the sweetening steps for the sour gas stream for thedifferent sites. The comparison starts at the compression stage, where the acid gas stream has beenconcentrated to a mixture of H2S and CO2, with accessory water vapour and hydrocarboncomponents. Table 6 summarizes the characteristics of the gas plant compressors. Over 90% ofthe compressors are electricity driven. Four-stage compression dominates, with power rangingfrom 50 to 800 HP. In the majority of cases dehydration is supplied by the compression cycle asdiscussed previously, and only in a few cases either triethylene glycol, refrigeration or a desiccantis used. The maximum approved injection rates of the acid gas stream ranges from 3,000 to210,000 m3/day (i.e. flow rates through the compressors), with the highest rates being incarbonate reservoirs. Generally, the rates of injection actually used are close to the maximumapproved rates. However, this is not true for the compressor discharge pressures. They aregenerally more than 25% lower than the maximum approved wellhead injection pressure WHIP).Maximum wellhead injection pressures range from 4 MPa to 13 MPa. Generally, the compressedacid gas is injected in a pressure-temperature range where the liquid phase is stable, resulting inan appreciable head pressure being generated due to the height of column of this liquid in thewellbore. Assuming the average density of the acid gas liquid is 750 kg/m3, a head gradient ofapproximately 7.5 kPa/m will be generated by the liquid column.
ISSUES
Issues are for the most part environmentally and safety related and need addressing, hence, theydirectly affect the economics of the process. Either a slow or rapid acid gas leak can result in lossof life or contamination of the bio- and atmosphere leading to degradation of the environment.Surface safety is addressed through engineering, installation of safety valves and monitoringsystems, and emergency procedures in case of H2S leaks. Subsurface issues are of two inter-related categories: the effect of the acid gas on the rock matrix and well cements, and plumecontainment.
Depending on mineralogy, rock dissolution or precipitation may occur, affecting the porosity andpermeability of the host rock. The fact that both CO2 and H2S are dissolving in the formationwater leads to some complex reaction paths (Gunter et al., 2000; Hitchon et al., 2001) wherecarbonates precipitate and dissolve, and pyrite/pyrrhotite precipitates. Dissolution of some of therock matrix in carbonate strata, or of the carbonates surrounding the sand grains in sandstone unitsresults in lower injection pressures in the short term. A major concern with the injection processis the potential for formation damage and reduced injectivity in the vicinity of the acid gasscheme. The reduction in injectivity could be the result of fines migration, precipitation and scalepotential, oil or condensate banking and plugging, asphaltene and elemental sulfur deposition,and hydrate plugging (Bennion et al. 1996).
Cement compatibility with the acid gas, primarily in the injection well, but also in neighbouringwells, is crucial for safety and containment. For example, a noncarbonate and calcium blendshattered when tested in an acid-gas stream for several weeks (Whatley, 2000). Thus, thecompatibility of the acid gas with the cement that bonds the casing to the formation must be tested
16
at a minimum. While the cement for the newly implemented acid-gas operation can be tested andproperly selected prior to drilling, the cements in nearby wells are already in place and theircondition is largely unknown. Some of these wells could be quite old, with the cement already insome stage of degradation as a result of brine composition. The acid gas, when reaching thesewells, may enhance and speed up the cement degradation, leading to possible leaks through thewell annulus and/or along casing.
If the acid gas is injected into the originating or other oil or gas pool, the main concern is theimpact on further hydrocarbon recovery from the pool and acid-gas production at the pump,although the operation may prove successful, like the Zama X2X pool (Davison et al., 1999). Ifthe gas mixture is injected into an aquifer, the degree to which it forms a bubble and migratesfrom the injection well depends on various factors, including pressure and temperature, solubility,interplay between driving forces like buoyancy and aquifer hydrodynamics, and aquiferheterogeneity, which controls gravity override and viscous fingering.
CONCLUSIONS
Acid gas injection has largely been developed into a safe and environmentally-friendlytechnology. It can be injected as a dry gas or a solution gas depending on the wastewateravailable. Compared to other options, acid gas injection has less environmental consequencesthan sulfur recovery (where leaching of the sulfur piles can lead to groundwater contamination)or flaring (which essentially substitutes SO2 for H2S in the atmosphere, as well as releasing CO2).Knowledge of the phase-equilibria and properties of the acid gas is extremely important indesigning a safe injection operation, which minimizes corrosion, hydrate formation andcavitation, leading to a dense liquid phase for injection. Both monitoring for gas leaks andcorrosion, and plans for mitigation if a leak occurs, are an essential part of the technology.
Equally important for a safe acid gas injection operation is the proper characterization andselection of the subsurface injection zone (reservoir or aquifer). Critical elements are containmentand prevention of leakage and/or migration through natural or man-made conduits, such asfractures (“cracks”) and abandoned wells (“punctures”). Maintaining the integrity of theconfining aquitard (or caprock), which is subjected to physical and chemical stresses, is essential.
An accounting scheme for net CO2 stored in an acid gas injection operation has not beenapproved. However, there are certain important factors to consider. Probably the largestcontributor to the net CO2 stored is the composition of the acid gas and the size of the operation.Fuel switching and efficiency can also play a significant role. In the area of fuel switching, mostof the compression is supplied by electricity, which in Alberta is dominantly produced by coal-fired power plants. In an environment where credit for CO2 emission reduction is sought, gas-fired compressors would be favored, as they have approximately half the CO2 emissions per unitof energy consumed. The transition would mean that part of the gas plant sweet gas stream wouldbe used to fire the compressors. There are also efficiency savings that can help maximize the netCO2 injected. Most acid gas injection schemes are run in a pressure-temperature region so that aliquid column of acid gas exists in the wellbore during injection, thus minimizing the compressionrequired for injection. Another saving can be gained by operating the compression cycles so as tocondense the water from the acid gas while it is still in the gaseous state, thereby eliminating the
17
need for dehydrators.
Acid gas injection is more than an industrial, scaled-up analogue for geological storage of CO2.It is a mature technology and applications of this process are growing in number and size. Theexperience gained so far in North America, particularly in Canada, can be applied elsewhere inthe world. As gas resources become more depleted, even more sour gas will be produced; andtherefore we predict that this technology will be resulting in the reduction of significant CO2emissions even without the incentive of CO2 emission trading. With the advent of trading, acidgas injection should become even more appealing to oil and gas producers.
The technology and experience developed in the engineering aspects of acid gas injectionoperations (i.e., design, materials, leakage prevention and safety) can be easily adopted for large-scale operations for CO2 geological storage, since a CO2 stream with no H2S is less corrosive anddangerous. Although the fate of the injected acid gas has not been monitored to date, thesubsurface information about aquifer and reservoir rocks and fluids may provide a wealth ofinformation as to what characteristics a good CO2-sequestration site should have. Thisinformation can be used for the screening and identification of future sites for the geologicalsequestration and storage of CO2. In addition, monitoring the fate of the injected acid gas at oneor more such sites will provide invaluable information about the long term fate of injected acidand greenhouse gases.
Finally, H2S, like CH4, is a valuable energy source. Besides hydrocarbons, sulfur and H2Srepresent the only additional store of chemical energy that occurs naturally on Earth in substantialquantity (Connock, 2001). Just as CH4 is oxidized to CO2 to recover energy, oxidation of H2S toSO2 can provide energy. If technology can be developed to make this economically attractive,then the acid gas components for injection would become CO2 and SO2 instead of CO2 and H2S(Connock, 2001).
18
REFERENCES
AEUB (Alberta Energy and Utilities Board) 2000. Guide 65: Resources Applications Guide. Alberta Energy and Utilities Board, Calgary, AB, 113-136.
BACHU, S. 1993. Basement heat flow in the Western Canada Sedimentary Basin: Tectonophysics, 222:1, 119-133.
BACHU, S. 1999. Flow systems in the Alberta Basin: Patterns, types and driving mechanisms. Bulletin of Canadian Petroleum Geology, 47, 455-474.
BACHU, S. 2000. Sequestration of carbon dioxide in geological media: criteria and approach forsite selection. Energy Conversion and Management, 41:9, 953-970.
BACHU, S. & STEWART, S. 2002. Geological sequestration of anthropogenic carbon dioxide inthe Western Canada Sedimentary Basin. Journal of Canadian Petroleum Technology, 41:2, 32-40.
BENNION, D.B., THOMAS, F.B., BENNION D.W. & BIETZ, R.F. 1996. Formation screening to minimize permeability impairment associated with acid gas or sour gas injection/disposal. CIM Paper 96-93 Presented at the 47th Annual Technical Meeting ofthe CIM Petroleum Society, Calgary, AB, June 10-12, 1996.
CARROLL, J.J. & LUI, D.W. 1997 Density, phase behavior keys to acid gas injection.Oil and Gas Journal, June 23, 63-72.
CLARK, M.A., SYREK, W.Y., MONNERY, W.D., JAMALUDDIN, A.K.M.,BENNION, D.B., THOMAS, F.B., WICHERT, E., REED, A.E. & JOHNSON, D.J. 1998 Designing an optimized injection strategy for acid gas disposal without dehydration. In: Proceedings ofthe Seventy-Seventh Gas Processors Association Annual Convention, Tulsa, OK, 49-56.
CONNOCK, L. 2001. Acid gas re-injection reduces sulfur burden. Sulfur, 272, 35-41.DAVISON, R. J., MAYDER, A., HLADIUK, D. W. & JARRELL, J. 1999. Zama acid gas
disposal/miscible flood implementation and results. Journal of Canadian Petroleum Technology, 38:2, 45-54.
GUNTER, W.D., PERKINS, E.H. & HUTCHEON, I. 2000. Aquifer disposal of acid gases: modeling of water-rock reactions for trapping acid wastes. Applied Geochemistry, 15, 1085-1095.
HITCHON, B., PERKINS, E.H. & GUNTER, W.D. 2001. Recovery of trace metals in formationwaters using acid gases from natural gas. Applied Geochemistry, 16, 1481-1497.
KEUSHNIG, H. 1995. Hydrogen sulphide – if you don’t like it, put it back. Journal of CanadianPetroleum Technology, 34:6, 18-20.
KOPPERSON, D., HORNE, S., KOHN, G., ROMANSKY, D., CHAN, C. & DUGWORTH, G.L.1998a. Injecting acid gas with water creates new disposal option. Oil & Gas Journal, 96:31, 33-37.
KOPPERSON, D., HORNE, S., KOHN, G., ROMANSKY, D., CHAN, C. & DUGWORTH, G.L.1998b. Two cases illustrate acid gas/water injection scheme. Oil & Gas Journal, 96:32, 64-70.
HO, K. T., MCMULLEN, J., BOYLE, P., ROJEK, O., FORGO, M. & BEATTY, T. 1996. Subsurface acid gas disposal scheme in Wayne-Rosedale, Alberta. SPE Paper 35848, In:Proceedings of the Gas Technology Symposium, Calgary, AB, Canada, 28 April – 1 May1996, SPE, 699-704.
19
LOCK, B.W. 1997. Acid gas disposal – A field perspective. In: Proceedings of the Seventy-SixthGas Processors Association Annual Convention, San Antonio, TX, March 10-12, 1999, Tulsa, OK, p. 161-170.
LONGWORTH, H. L., DUNN, G. C. & SEMCHUK, M. 1996. Underground disposal of acid gasin Alberta, Canada: regulatory concerns and case histories. SPE Paper 35584, In: Proceedings of the Gas Technology Symposium, Calgary, AB, Canada, 28 April – 1 May1996, SPE, 181-192.
NG, H-J., CARROLL, J. J. & MADDOCKS, J. R. 1999. Impact of thermophysical properties research on acid gas injection process design. In: Proceedings of the Seventy-Eighth GasProcessors Association Annual Convention, Nashville, TN, March 1-3, 1999, Tulsa, OK,114-120.
WHATLEY, L. 2000. Acid-gas injection proves economic for west-Texas plant. Oil & Gas Journal, 98:21, 58-61.
WICHERT, E. & ROYAN, T. 1996. Sulfur disposal by acid gas injection. SPE Paper 35585, In:Proceedings of the Gas Technology Symposium, Calgary, AB, Canada, 28 April – 1 May1996, SPE, 193-200.
20
Appendix
Acid Gas Injection Operations
in Alberta, Canada
Appendix Tables 1. Reservoir Geology 2. Reservoir Properties and Fluids 3. Licensed Injection Operations 4. Acid Gas Injection Wells 5. Pipelines 6. Gas Plant Compressors
Appendix Graphs Host Rock Graphs Host Fluids Graphs Injection Operations Graphs
21
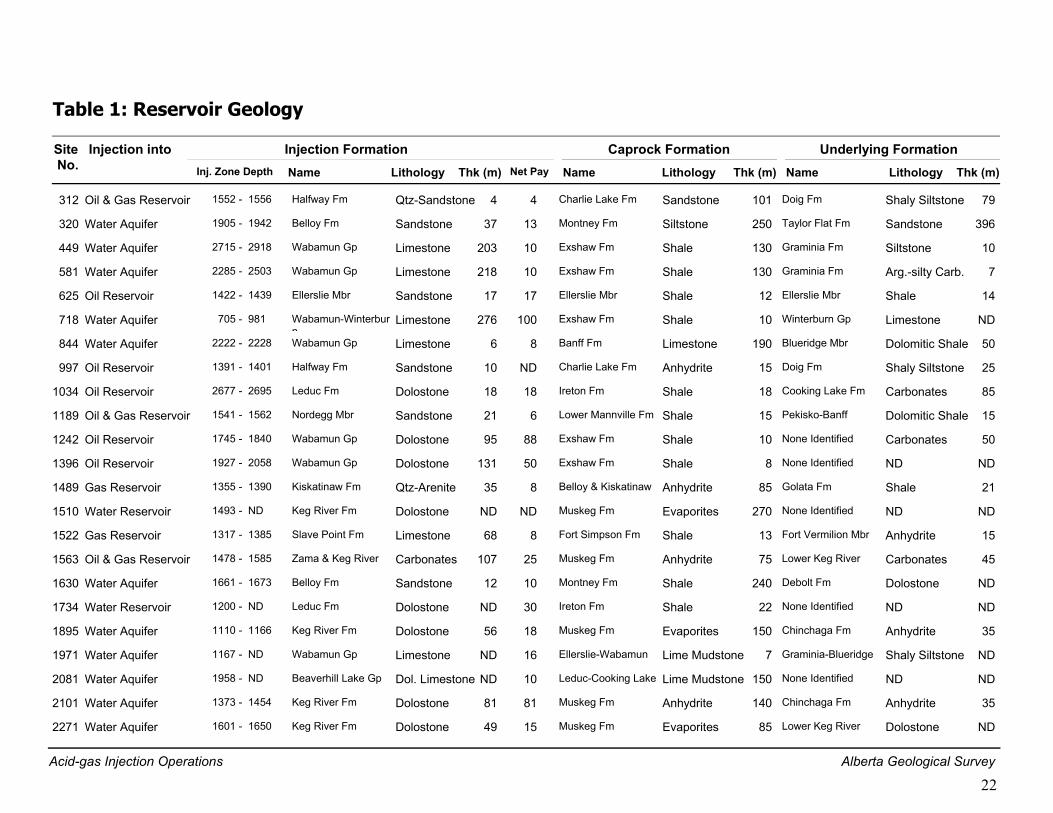
Table 1: Reservoir Geology
Site No.
Injection intoName Lithology Thk (m)
Underlying FormationName Lithology Thk (m)
Caprock FormationName Lithology Thk (m)
Injection FormationInj. Zone Depth Net Pay
Halfway Fm Qtz-Sandstone Charlie Lake Fm Doig Fm4 79101Oil & Gas Reservoir Sandstone Shaly Siltstone312 15561552 - 4
Belloy Fm Sandstone Montney Fm Taylor Flat Fm37 396250Water Aquifer Siltstone Sandstone320 19421905 - 13
Wabamun Gp Limestone Exshaw Fm Graminia Fm203 10130Water Aquifer Shale Siltstone449 29182715 - 10
Wabamun Gp Limestone Exshaw Fm Graminia Fm218 7130Water Aquifer Shale Arg.-silty Carb.581 25032285 - 10
Ellerslie Mbr Sandstone Ellerslie Mbr Ellerslie Mbr17 1412Oil Reservoir Shale Shale625 14391422 - 17
Wabamun-Winterburn
Limestone Exshaw Fm Winterburn Gp276 ND10Water Aquifer Shale Limestone718 981705 - 100
Wabamun Gp Limestone Banff Fm Blueridge Mbr6 50190Water Aquifer Limestone Dolomitic Shale844 22282222 - 8
Halfway Fm Sandstone Charlie Lake Fm Doig Fm10 2515Oil Reservoir Anhydrite Shaly Siltstone997 14011391 - ND
Leduc Fm Dolostone Ireton Fm Cooking Lake Fm18 8518Oil Reservoir Shale Carbonates1034 26952677 - 18
Nordegg Mbr Sandstone Lower Mannville Fm Pekisko-Banff21 1515Oil & Gas Reservoir Shale Dolomitic Shale1189 15621541 - 6
Wabamun Gp Dolostone Exshaw Fm None Identified95 5010Oil Reservoir Shale Carbonates1242 18401745 - 88
Wabamun Gp Dolostone Exshaw Fm None Identified131 ND8Oil Reservoir Shale ND1396 20581927 - 50
Kiskatinaw Fm Qtz-Arenite Belloy & Kiskatinaw Golata Fm35 2185Gas Reservoir Anhydrite Shale1489 13901355 - 8
Keg River Fm Dolostone Muskeg Fm None IdentifiedND ND270Water Reservoir Evaporites ND1510 ND1493 - ND
Slave Point Fm Limestone Fort Simpson Fm Fort Vermilion Mbr68 1513Gas Reservoir Shale Anhydrite1522 13851317 - 8
Zama & Keg River Carbonates Muskeg Fm Lower Keg River107 4575Oil & Gas Reservoir Anhydrite Carbonates1563 15851478 - 25
Belloy Fm Sandstone Montney Fm Debolt Fm12 ND240Water Aquifer Shale Dolostone1630 16731661 - 10
Leduc Fm Dolostone Ireton Fm None IdentifiedND ND22Water Reservoir Shale ND1734 ND1200 - 30
Keg River Fm Dolostone Muskeg Fm Chinchaga Fm56 35150Water Aquifer Evaporites Anhydrite1895 11661110 - 18
Wabamun Gp Limestone Ellerslie-Wabamun Graminia-BlueridgeND ND7Water Aquifer Lime Mudstone Shaly Siltstone1971 ND1167 - 16
Beaverhill Lake Gp Dol. Limestone Leduc-Cooking Lake None IdentifiedND ND150Water Aquifer Lime Mudstone ND2081 ND1958 - 10
Keg River Fm Dolostone Muskeg Fm Chinchaga Fm81 35140Water Aquifer Anhydrite Anhydrite2101 14541373 - 81
Keg River Fm Dolostone Muskeg Fm Lower Keg River49 ND85Water Aquifer Evaporites Dolostone2271 16501601 - 15
Acid-gas Injection Operations Alberta Geological Survey
22
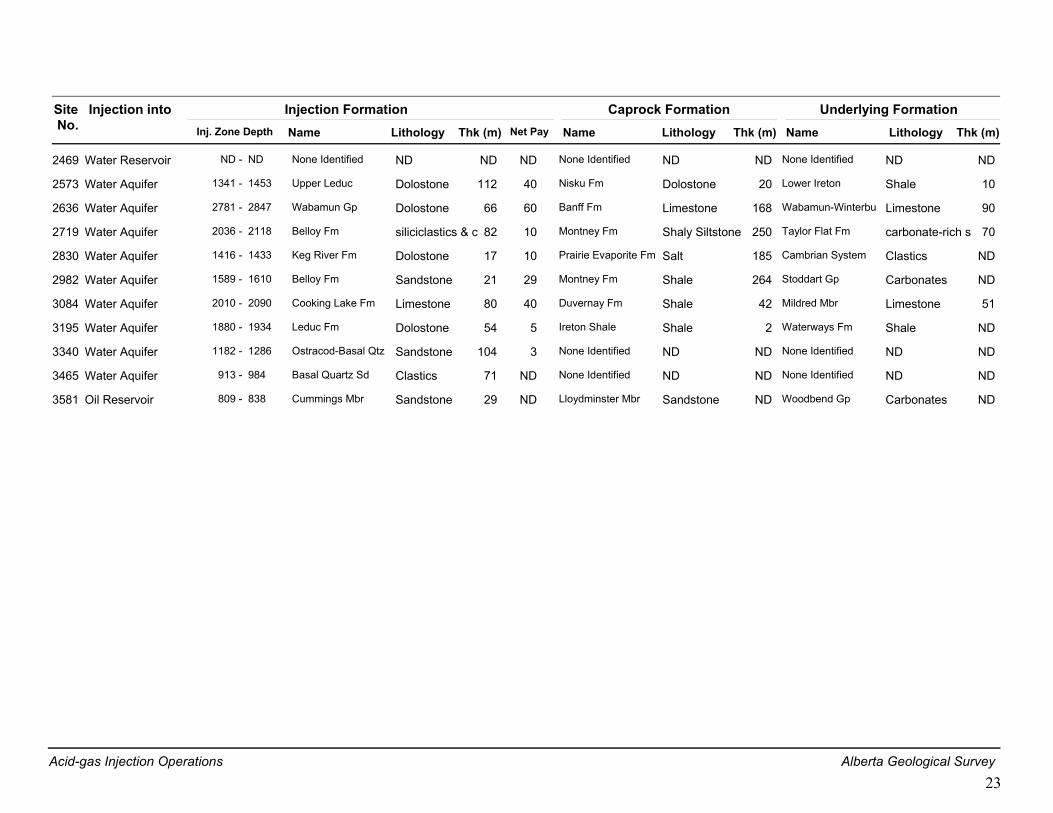
Site No.
Injection intoName Lithology Thk (m)
Underlying FormationName Lithology Thk (m)
Caprock FormationName Lithology Thk (m)
Injection FormationInj. Zone Depth Net Pay
None Identified ND None Identified None IdentifiedND NDNDWater Reservoir ND ND2469 NDND - ND
Upper Leduc Dolostone Nisku Fm Lower Ireton112 1020Water Aquifer Dolostone Shale2573 14531341 - 40
Wabamun Gp Dolostone Banff Fm Wabamun-Winterbu66 90168Water Aquifer Limestone Limestone2636 28472781 - 60
Belloy Fm siliciclastics & c Montney Fm Taylor Flat Fm82 70250Water Aquifer Shaly Siltstone carbonate-rich s2719 21182036 - 10
Keg River Fm Dolostone Prairie Evaporite Fm Cambrian System17 ND185Water Aquifer Salt Clastics2830 14331416 - 10
Belloy Fm Sandstone Montney Fm Stoddart Gp21 ND264Water Aquifer Shale Carbonates2982 16101589 - 29
Cooking Lake Fm Limestone Duvernay Fm Mildred Mbr80 5142Water Aquifer Shale Limestone3084 20902010 - 40
Leduc Fm Dolostone Ireton Shale Waterways Fm54 ND2Water Aquifer Shale Shale3195 19341880 - 5
Ostracod-Basal Qtz Sandstone None Identified None Identified104 NDNDWater Aquifer ND ND3340 12861182 - 3
Basal Quartz Sd Clastics None Identified None Identified71 NDNDWater Aquifer ND ND3465 984913 - ND
Cummings Mbr Sandstone Lloydminster Mbr Woodbend Gp29 NDNDOil Reservoir Sandstone Carbonates3581 838809 - ND
Acid-gas Injection Operations Alberta Geological Survey23
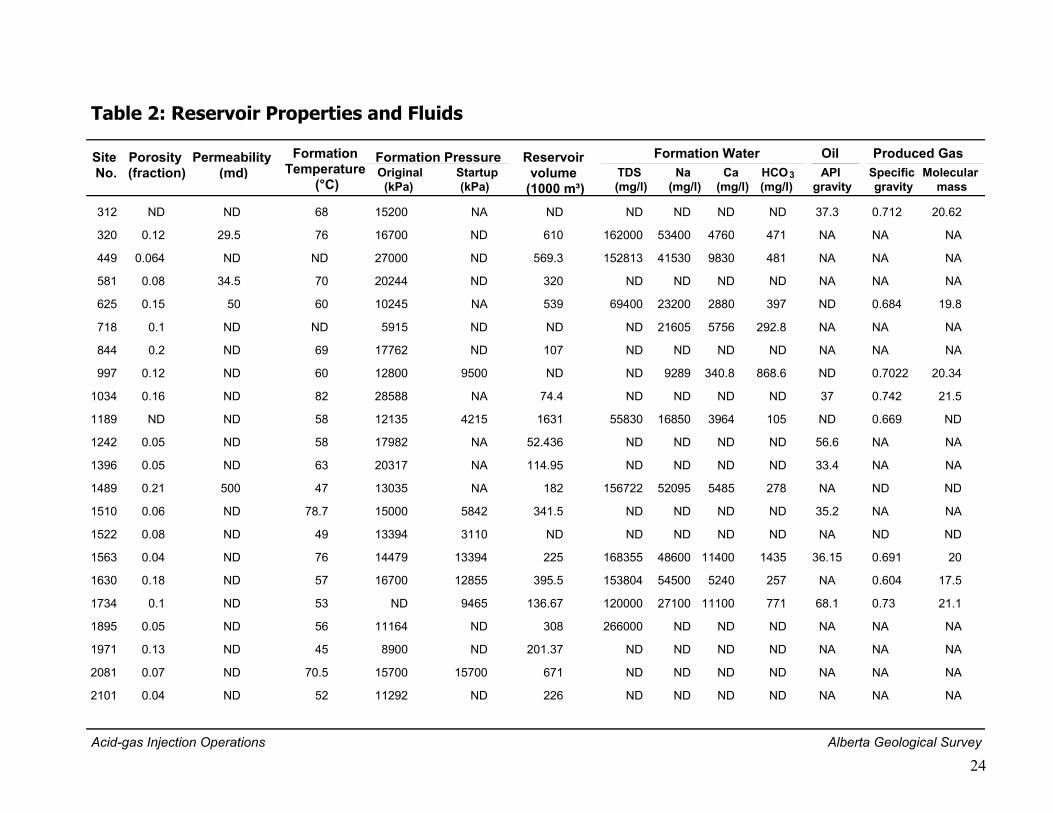
Table 2: Reservoir Properties and Fluids
Site No.
Reservoir volume
(1000 m³)
Porosity (fraction)
Permeability (md)
Formation Pressure Formation Temperature
(°C) Original Startup (kPa) (kPa)
Na (mg/l)
Ca (mg/l)
TDS (mg/l)
HCO (mg/l)
API gravity
Specific gravity
Molecular mass
Formation Water Oil Produced Gas3
312 ND ND 1520068 NA ND ND ND 37.3 0.712 20.62NDND
320 0.12 29.5 1670076 ND 53400 4760 471 NA NA NA162000610
449 0.064 ND 27000ND ND 41530 9830 481 NA NA NA152813569.3
581 0.08 34.5 2024470 ND ND ND ND NA NA NAND320
625 0.15 50 1024560 NA 23200 2880 397 ND 0.684 19.869400539
718 0.1 ND 5915ND ND 21605 5756 292.8 NA NA NANDND
844 0.2 ND 1776269 ND ND ND ND NA NA NAND107
997 0.12 ND 1280060 9500 9289 340.8 868.6 ND 0.7022 20.34NDND
1034 0.16 ND 2858882 NA ND ND ND 37 0.742 21.5ND74.4
1189 ND ND 1213558 4215 16850 3964 105 ND 0.669 ND558301631
1242 0.05 ND 1798258 NA ND ND ND 56.6 NA NAND52.436
1396 0.05 ND 2031763 NA ND ND ND 33.4 NA NAND114.95
1489 0.21 500 1303547 NA 52095 5485 278 NA ND ND156722182
1510 0.06 ND 1500078.7 5842 ND ND ND 35.2 NA NAND341.5
1522 0.08 ND 1339449 3110 ND ND ND NA ND NDNDND
1563 0.04 ND 1447976 13394 48600 11400 1435 36.15 0.691 20168355225
1630 0.18 ND 1670057 12855 54500 5240 257 NA 0.604 17.5153804395.5
1734 0.1 ND ND53 9465 27100 11100 771 68.1 0.73 21.1120000136.67
1895 0.05 ND 1116456 ND ND ND ND NA NA NA266000308
1971 0.13 ND 890045 ND ND ND ND NA NA NAND201.37
2081 0.07 ND 1570070.5 15700 ND ND ND NA NA NAND671
2101 0.04 ND 1129252 ND ND ND ND NA NA NAND226
Acid-gas Injection Operations Alberta Geological Survey
24
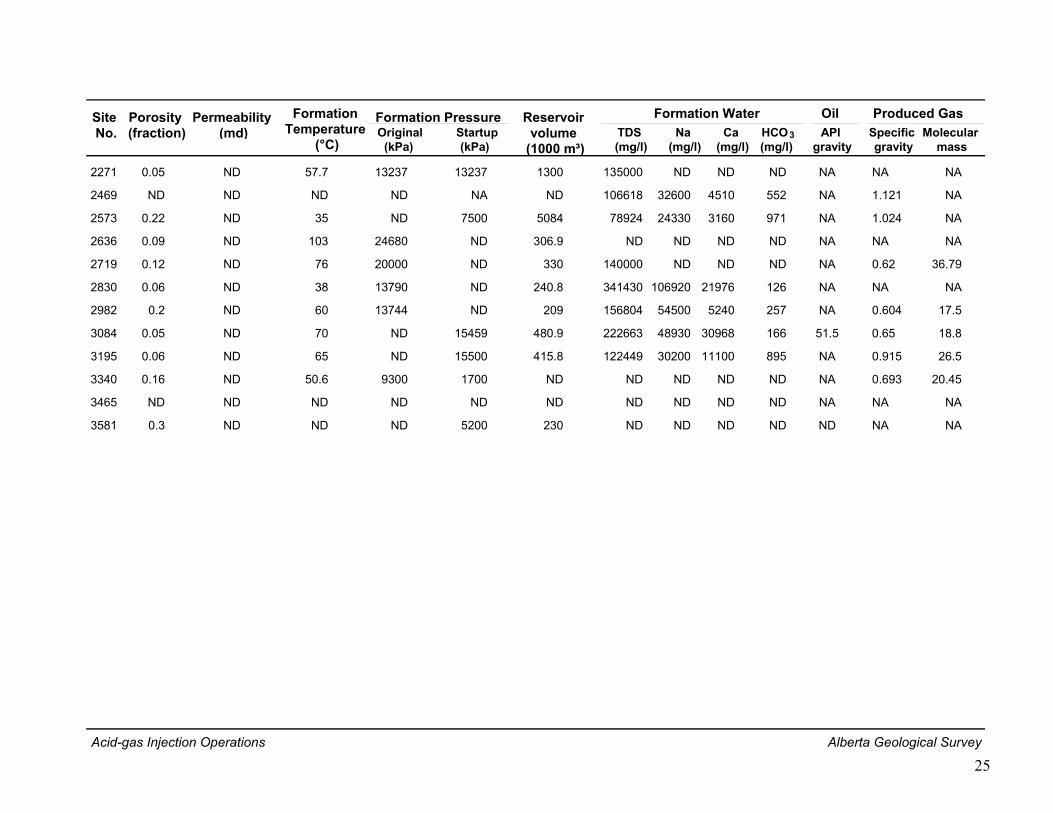
Site No.
Reservoir volume
(1000 m³)
Porosity (fraction)
Permeability (md)
Formation Pressure Formation Temperature
(°C) Original Startup (kPa) (kPa)
Na (mg/l)
Ca (mg/l)
TDS (mg/l)
HCO (mg/l)
API gravity
Specific gravity
Molecular mass
Formation Water Oil Produced Gas3
2271 0.05 ND 1323757.7 13237 ND ND ND NA NA NA1350001300
2469 ND ND NDND NA 32600 4510 552 NA 1.121 NA106618ND
2573 0.22 ND ND35 7500 24330 3160 971 NA 1.024 NA789245084
2636 0.09 ND 24680103 ND ND ND ND NA NA NAND306.9
2719 0.12 ND 2000076 ND ND ND ND NA 0.62 36.79140000330
2830 0.06 ND 1379038 ND 106920 21976 126 NA NA NA341430240.8
2982 0.2 ND 1374460 ND 54500 5240 257 NA 0.604 17.5156804209
3084 0.05 ND ND70 15459 48930 30968 166 51.5 0.65 18.8222663480.9
3195 0.06 ND ND65 15500 30200 11100 895 NA 0.915 26.5122449415.8
3340 0.16 ND 930050.6 1700 ND ND ND NA 0.693 20.45NDND
3465 ND ND NDND ND ND ND ND NA NA NANDND
3581 0.3 ND NDND 5200 ND ND ND ND NA NAND230
Acid-gas Injection Operations Alberta Geological Survey
25
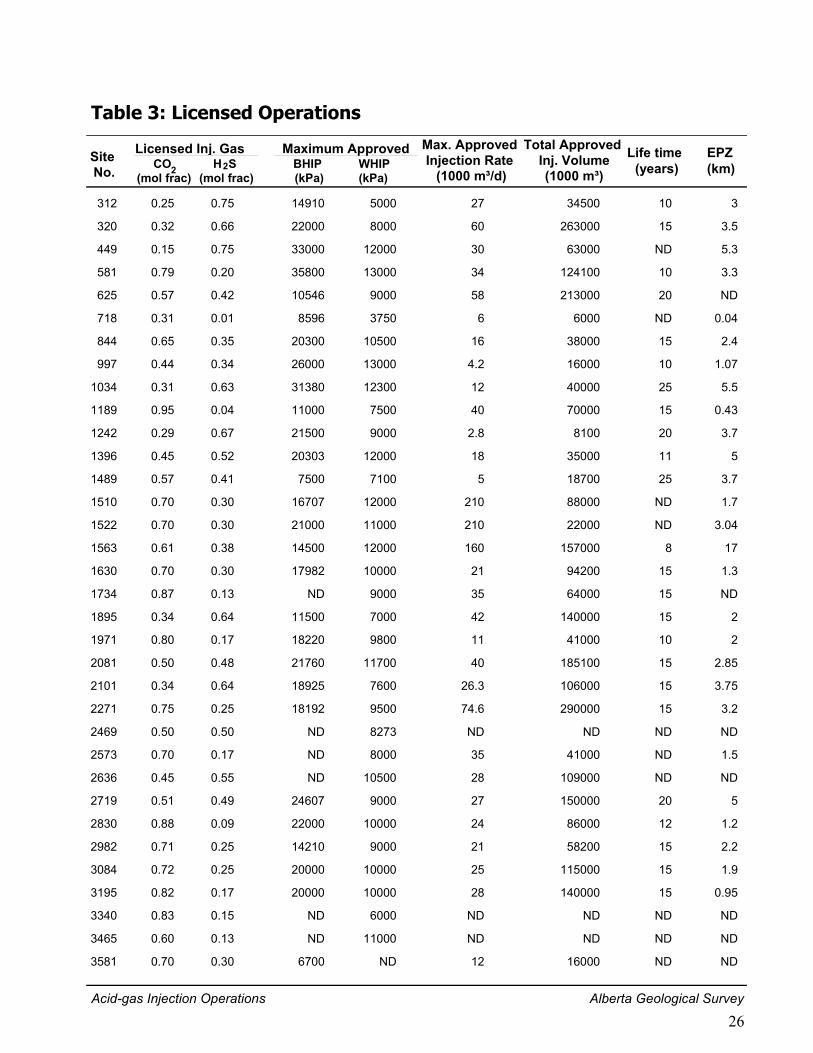
Table 3: Licensed Operations
Site No. CO
(mol frac)H S
(mol frac)
Licensed Inj. Gas 2 2
Total Approved Inj. Volume(1000 m³)
Maximum Approved BHIP (kPa)
WHIP(kPa)
Life time EPZ (km)(years)
Max. Approved Injection Rate
(1000 m³/d)
0.25 0.75312 14910 5000 10 327 34500
0.32 0.66320 22000 8000 15 3.560 263000
0.15 0.75449 33000 12000 ND 5.330 63000
0.79 0.20581 35800 13000 10 3.334 124100
0.57 0.42625 10546 9000 20 ND58 213000
0.31 0.01718 8596 3750 ND 0.046 6000
0.65 0.35844 20300 10500 15 2.416 38000
0.44 0.34997 26000 13000 10 1.074.2 16000
0.31 0.631034 31380 12300 25 5.512 40000
0.95 0.041189 11000 7500 15 0.4340 70000
0.29 0.671242 21500 9000 20 3.72.8 8100
0.45 0.521396 20303 12000 11 518 35000
0.57 0.411489 7500 7100 25 3.75 18700
0.70 0.301510 16707 12000 ND 1.7210 88000
0.70 0.301522 21000 11000 ND 3.04210 22000
0.61 0.381563 14500 12000 8 17160 157000
0.70 0.301630 17982 10000 15 1.321 94200
0.87 0.131734 ND 9000 15 ND35 64000
0.34 0.641895 11500 7000 15 242 140000
0.80 0.171971 18220 9800 10 211 41000
0.50 0.482081 21760 11700 15 2.8540 185100
0.34 0.642101 18925 7600 15 3.7526.3 106000
0.75 0.252271 18192 9500 15 3.274.6 290000
0.50 0.502469 ND 8273 ND NDND ND
0.70 0.172573 ND 8000 ND 1.535 41000
0.45 0.552636 ND 10500 ND ND28 109000
0.51 0.492719 24607 9000 20 527 150000
0.88 0.092830 22000 10000 12 1.224 86000
0.71 0.252982 14210 9000 15 2.221 58200
0.72 0.253084 20000 10000 15 1.925 115000
0.82 0.173195 20000 10000 15 0.9528 140000
0.83 0.153340 ND 6000 ND NDND ND
0.60 0.133465 ND 11000 ND NDND ND
0.70 0.303581 6700 ND ND ND12 16000
Acid-gas Injection Operations Alberta Geological Survey
26
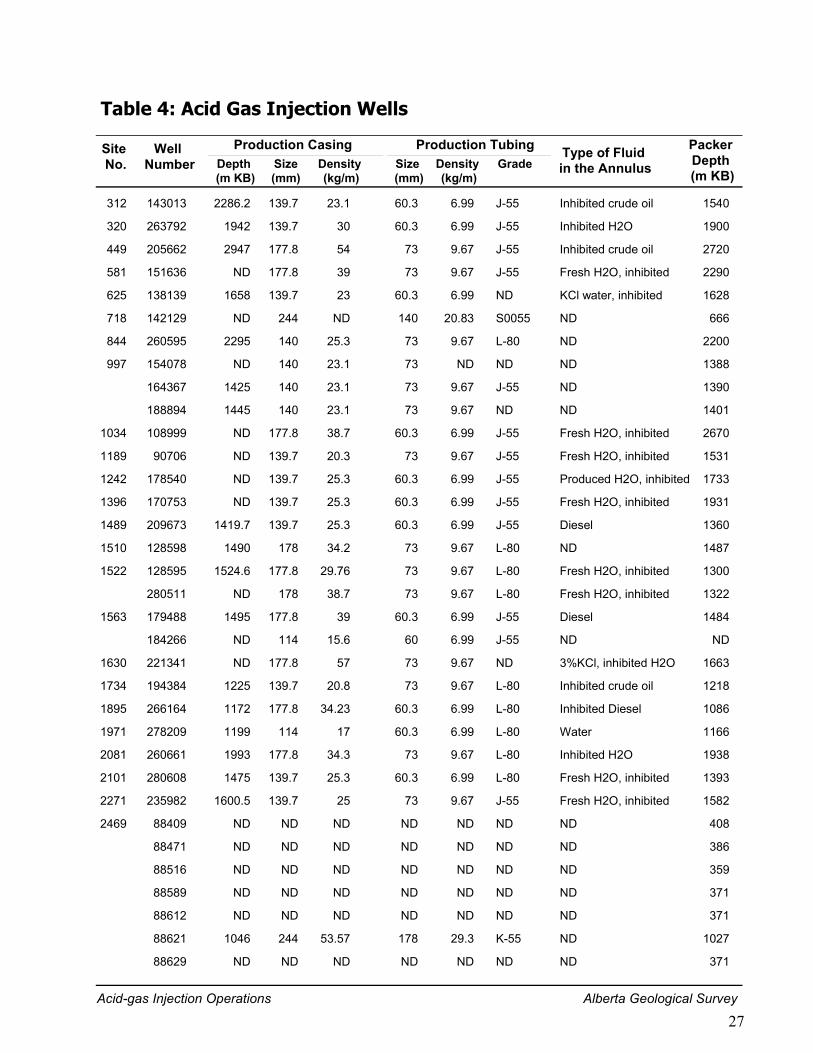
Table 4: Acid Gas Injection Wells
Site No.
Well Number Depth
(m KB)
Production TubingSize(mm)
Production Casing Type of Fluid in the Annulus
Packer Depth (m KB)
Size (mm)
Density (kg/m)
Density (kg/m)
Grade
312 143013 2286.2 139.7 23.1 60.3 J-556.99 Inhibited crude oil 1540
320 263792 1942 139.7 30 60.3 J-556.99 Inhibited H2O 1900
449 205662 2947 177.8 54 73 J-559.67 Inhibited crude oil 2720
581 151636 ND 177.8 39 73 J-559.67 Fresh H2O, inhibited 2290
625 138139 1658 139.7 23 60.3 ND6.99 KCl water, inhibited 1628
718 142129 ND 244 ND 140 S005520.83 ND 666
844 260595 2295 140 25.3 73 L-809.67 ND 2200
997 154078 ND 140 23.1 73 NDND ND 1388
164367 1425 140 23.1 73 J-559.67 ND 1390
188894 1445 140 23.1 73 ND9.67 ND 1401
1034 108999 ND 177.8 38.7 60.3 J-556.99 Fresh H2O, inhibited 2670
1189 90706 ND 139.7 20.3 73 J-559.67 Fresh H2O, inhibited 1531
1242 178540 ND 139.7 25.3 60.3 J-556.99 Produced H2O, inhibited 1733
1396 170753 ND 139.7 25.3 60.3 J-556.99 Fresh H2O, inhibited 1931
1489 209673 1419.7 139.7 25.3 60.3 J-556.99 Diesel 1360
1510 128598 1490 178 34.2 73 L-809.67 ND 1487
1522 128595 1524.6 177.8 29.76 73 L-809.67 Fresh H2O, inhibited 1300
280511 ND 178 38.7 73 L-809.67 Fresh H2O, inhibited 1322
1563 179488 1495 177.8 39 60.3 J-556.99 Diesel 1484
184266 ND 114 15.6 60 J-556.99 ND ND
1630 221341 ND 177.8 57 73 ND9.67 3%KCl, inhibited H2O 1663
1734 194384 1225 139.7 20.8 73 L-809.67 Inhibited crude oil 1218
1895 266164 1172 177.8 34.23 60.3 L-806.99 Inhibited Diesel 1086
1971 278209 1199 114 17 60.3 L-806.99 Water 1166
2081 260661 1993 177.8 34.3 73 L-809.67 Inhibited H2O 1938
2101 280608 1475 139.7 25.3 60.3 L-806.99 Fresh H2O, inhibited 1393
2271 235982 1600.5 139.7 25 73 J-559.67 Fresh H2O, inhibited 1582
2469 88409 ND ND ND ND NDND ND 408
88471 ND ND ND ND NDND ND 386
88516 ND ND ND ND NDND ND 359
88589 ND ND ND ND NDND ND 371
88612 ND ND ND ND NDND ND 371
88621 1046 244 53.57 178 K-5529.3 ND 1027
88629 ND ND ND ND NDND ND 371
Acid-gas Injection Operations Alberta Geological Survey
27
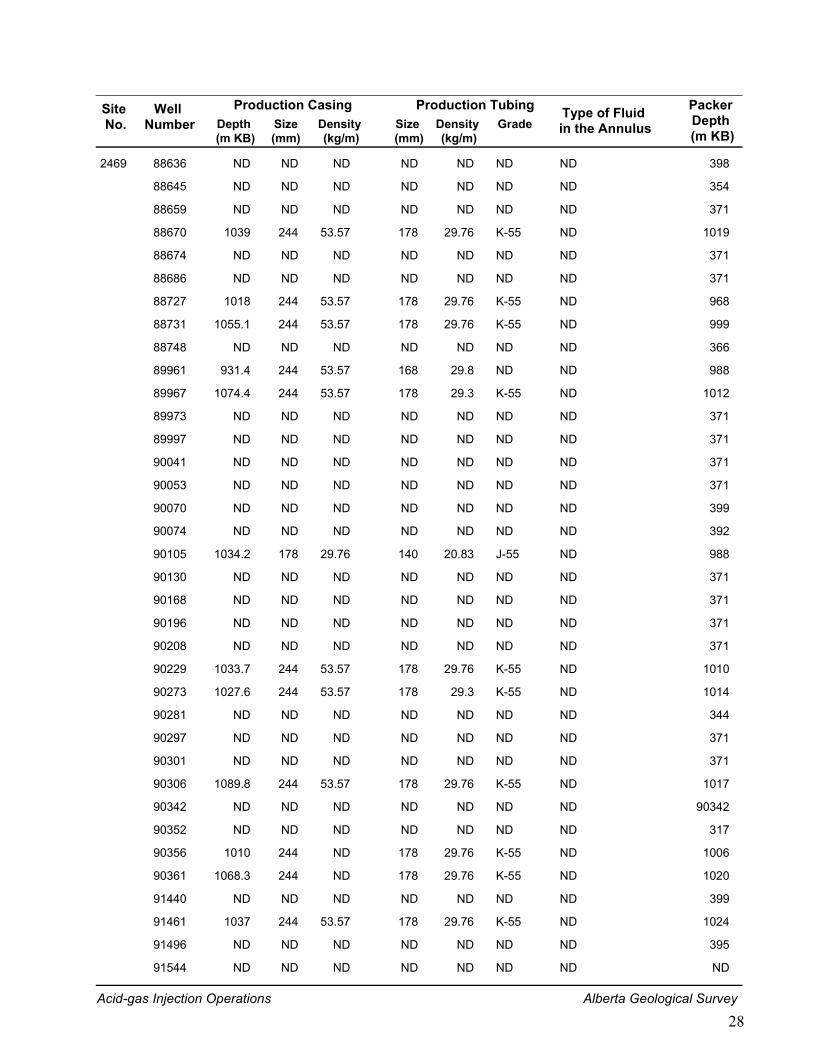
Site No.
Well Number Depth
(m KB)
Production TubingSize(mm)
Production Casing Type of Fluid in the Annulus
Packer Depth (m KB)
Size (mm)
Density (kg/m)
Density (kg/m)
Grade
2469 88636 ND ND ND ND NDND ND 398
88645 ND ND ND ND NDND ND 354
88659 ND ND ND ND NDND ND 371
88670 1039 244 53.57 178 K-5529.76 ND 1019
88674 ND ND ND ND NDND ND 371
88686 ND ND ND ND NDND ND 371
88727 1018 244 53.57 178 K-5529.76 ND 968
88731 1055.1 244 53.57 178 K-5529.76 ND 999
88748 ND ND ND ND NDND ND 366
89961 931.4 244 53.57 168 ND29.8 ND 988
89967 1074.4 244 53.57 178 K-5529.3 ND 1012
89973 ND ND ND ND NDND ND 371
89997 ND ND ND ND NDND ND 371
90041 ND ND ND ND NDND ND 371
90053 ND ND ND ND NDND ND 371
90070 ND ND ND ND NDND ND 399
90074 ND ND ND ND NDND ND 392
90105 1034.2 178 29.76 140 J-5520.83 ND 988
90130 ND ND ND ND NDND ND 371
90168 ND ND ND ND NDND ND 371
90196 ND ND ND ND NDND ND 371
90208 ND ND ND ND NDND ND 371
90229 1033.7 244 53.57 178 K-5529.76 ND 1010
90273 1027.6 244 53.57 178 K-5529.3 ND 1014
90281 ND ND ND ND NDND ND 344
90297 ND ND ND ND NDND ND 371
90301 ND ND ND ND NDND ND 371
90306 1089.8 244 53.57 178 K-5529.76 ND 1017
90342 ND ND ND ND NDND ND 90342
90352 ND ND ND ND NDND ND 317
90356 1010 244 ND 178 K-5529.76 ND 1006
90361 1068.3 244 ND 178 K-5529.76 ND 1020
91440 ND ND ND ND NDND ND 399
91461 1037 244 53.57 178 K-5529.76 ND 1024
91496 ND ND ND ND NDND ND 395
91544 ND ND ND ND NDND ND ND
Acid-gas Injection Operations Alberta Geological Survey
28
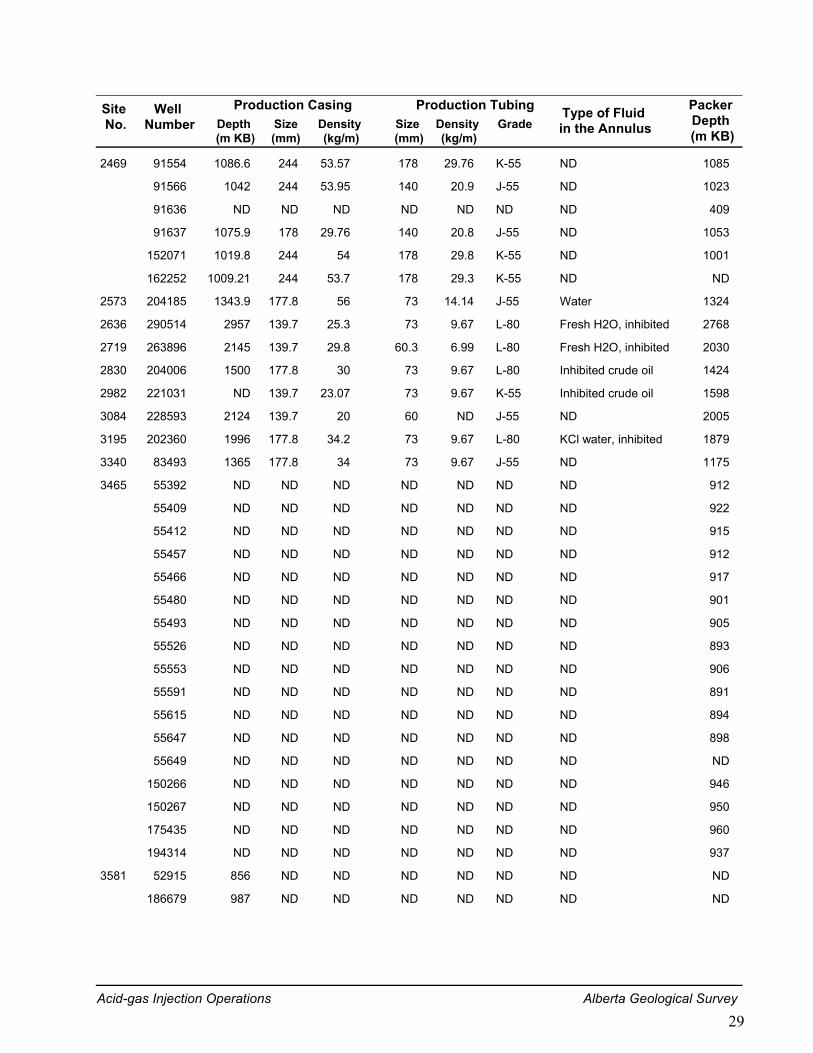
Site No.
Well Number Depth
(m KB)
Production TubingSize(mm)
Production Casing Type of Fluid in the Annulus
Packer Depth (m KB)
Size (mm)
Density (kg/m)
Density (kg/m)
Grade
2469 91554 1086.6 244 53.57 178 K-5529.76 ND 1085
91566 1042 244 53.95 140 J-5520.9 ND 1023
91636 ND ND ND ND NDND ND 409
91637 1075.9 178 29.76 140 J-5520.8 ND 1053
152071 1019.8 244 54 178 K-5529.8 ND 1001
162252 1009.21 244 53.7 178 K-5529.3 ND ND
2573 204185 1343.9 177.8 56 73 J-5514.14 Water 1324
2636 290514 2957 139.7 25.3 73 L-809.67 Fresh H2O, inhibited 2768
2719 263896 2145 139.7 29.8 60.3 L-806.99 Fresh H2O, inhibited 2030
2830 204006 1500 177.8 30 73 L-809.67 Inhibited crude oil 1424
2982 221031 ND 139.7 23.07 73 K-559.67 Inhibited crude oil 1598
3084 228593 2124 139.7 20 60 J-55ND ND 2005
3195 202360 1996 177.8 34.2 73 L-809.67 KCl water, inhibited 1879
3340 83493 1365 177.8 34 73 J-559.67 ND 1175
3465 55392 ND ND ND ND NDND ND 912
55409 ND ND ND ND NDND ND 922
55412 ND ND ND ND NDND ND 915
55457 ND ND ND ND NDND ND 912
55466 ND ND ND ND NDND ND 917
55480 ND ND ND ND NDND ND 901
55493 ND ND ND ND NDND ND 905
55526 ND ND ND ND NDND ND 893
55553 ND ND ND ND NDND ND 906
55591 ND ND ND ND NDND ND 891
55615 ND ND ND ND NDND ND 894
55647 ND ND ND ND NDND ND 898
55649 ND ND ND ND NDND ND ND
150266 ND ND ND ND NDND ND 946
150267 ND ND ND ND NDND ND 950
175435 ND ND ND ND NDND ND 960
194314 ND ND ND ND NDND ND 937
3581 52915 856 ND ND ND NDND ND ND
186679 987 ND ND ND NDND ND ND
Acid-gas Injection Operations Alberta Geological Survey
29
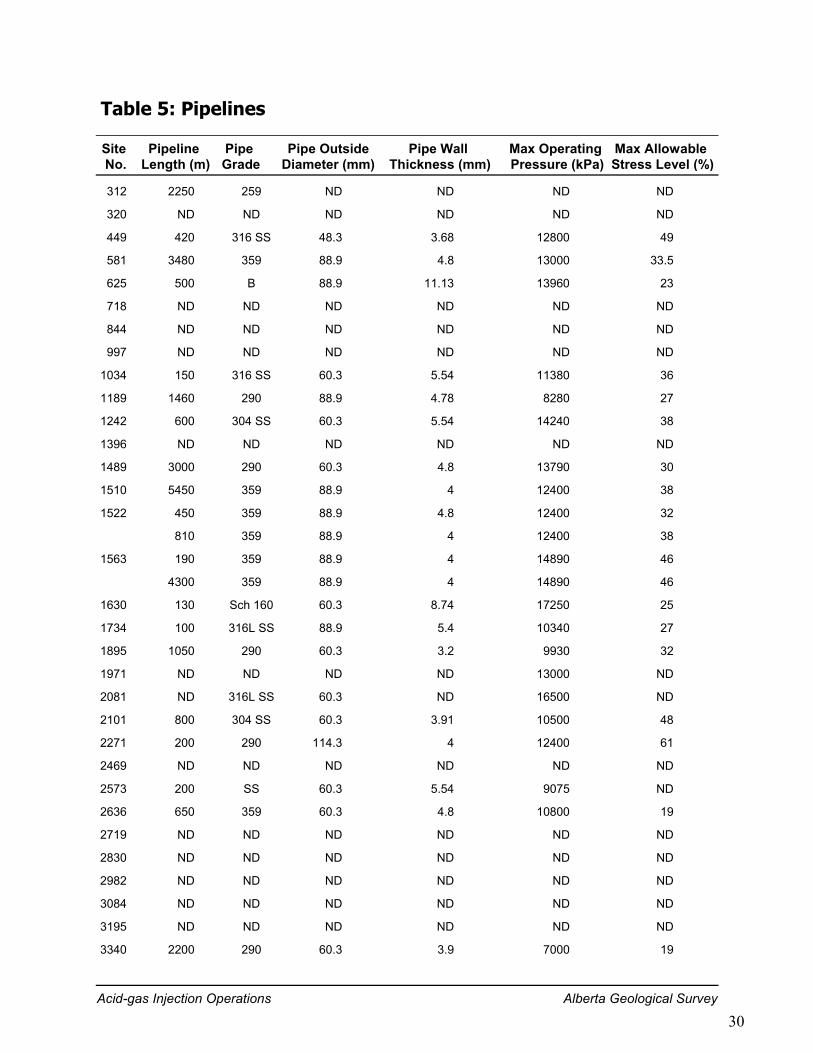
Table 5: Pipelines
Site No.
Pipeline Length (m)
Pipe Grade
Pipe OutsideDiameter (mm)
Pipe Wall Thickness (mm)
Max Operating Pressure (kPa)
Max Allowable Stress Level (%)
312 2250 259 ND ND ND ND
320 ND ND ND ND ND ND
449 420 316 SS 48.3 3.68 12800 49
581 3480 359 88.9 4.8 13000 33.5
625 500 B 88.9 11.13 13960 23
718 ND ND ND ND ND ND
844 ND ND ND ND ND ND
997 ND ND ND ND ND ND
1034 150 316 SS 60.3 5.54 11380 36
1189 1460 290 88.9 4.78 8280 27
1242 600 304 SS 60.3 5.54 14240 38
1396 ND ND ND ND ND ND
1489 3000 290 60.3 4.8 13790 30
1510 5450 359 88.9 4 12400 38
1522 450 359 88.9 4.8 12400 32
810 359 88.9 4 12400 38
1563 190 359 88.9 4 14890 46
4300 359 88.9 4 14890 46
1630 130 Sch 160 60.3 8.74 17250 25
1734 100 316L SS 88.9 5.4 10340 27
1895 1050 290 60.3 3.2 9930 32
1971 ND ND ND ND 13000 ND
2081 ND 316L SS 60.3 ND 16500 ND
2101 800 304 SS 60.3 3.91 10500 48
2271 200 290 114.3 4 12400 61
2469 ND ND ND ND ND ND
2573 200 SS 60.3 5.54 9075 ND
2636 650 359 60.3 4.8 10800 19
2719 ND ND ND ND ND ND
2830 ND ND ND ND ND ND
2982 ND ND ND ND ND ND
3084 ND ND ND ND ND ND
3195 ND ND ND ND ND ND
3340 2200 290 60.3 3.9 7000 19
Acid-gas Injection Operations Alberta Geological Survey
30
Site No.
Pipeline Length (m)
Pipe Grade
Pipe OutsideDiameter (mm)
Pipe Wall Thickness (mm)
Max Operating Pressure (kPa)
Max Allowable Stress Level (%)
3465 ND ND ND ND ND ND
3581 ND ND ND ND ND ND
Acid-gas Injection Operations Alberta Geological Survey
31
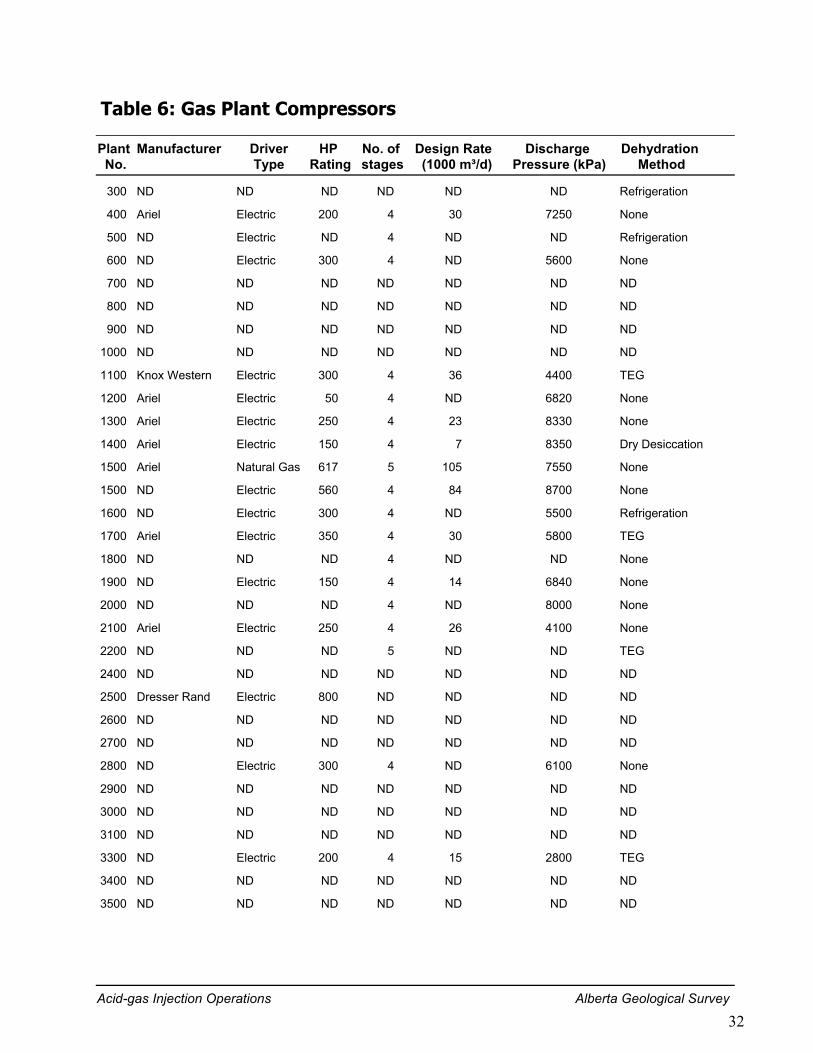
Table 6: Gas Plant Compressors
Plant No.
Manufacturer HP Rating
DriverType
No. of stages
Design Rate (1000 m³/d)
Discharge Pressure (kPa)
Dehydration Method
300 ND NDND ND ND ND Refrigeration
400 Ariel 200Electric 4 30 7250 None
500 ND NDElectric 4 ND ND Refrigeration
600 ND 300Electric 4 ND 5600 None
700 ND NDND ND ND ND ND
800 ND NDND ND ND ND ND
900 ND NDND ND ND ND ND
1000 ND NDND ND ND ND ND
1100 Knox Western 300Electric 4 36 4400 TEG
1200 Ariel 50Electric 4 ND 6820 None
1300 Ariel 250Electric 4 23 8330 None
1400 Ariel 150Electric 4 7 8350 Dry Desiccation
1500 Ariel 617Natural Gas 5 105 7550 None
1500 ND 560Electric 4 84 8700 None
1600 ND 300Electric 4 ND 5500 Refrigeration
1700 Ariel 350Electric 4 30 5800 TEG
1800 ND NDND 4 ND ND None
1900 ND 150Electric 4 14 6840 None
2000 ND NDND 4 ND 8000 None
2100 Ariel 250Electric 4 26 4100 None
2200 ND NDND 5 ND ND TEG
2400 ND NDND ND ND ND ND
2500 Dresser Rand 800Electric ND ND ND ND
2600 ND NDND ND ND ND ND
2700 ND NDND ND ND ND ND
2800 ND 300Electric 4 ND 6100 None
2900 ND NDND ND ND ND ND
3000 ND NDND ND ND ND ND
3100 ND NDND ND ND ND ND
3300 ND 200Electric 4 15 2800 TEG
3400 ND NDND ND ND ND ND
3500 ND NDND ND ND ND ND
Acid-gas Injection Operations Alberta Geological Survey
32
Appendix
Acid Gas Injection Operations
in Alberta, Canada
Host Rock Graphs Injection Interval Depths Injection Reservoir Type and Lithology Net Pay of Injection Reservoir Porosity vs. Depth of Host Rock
33
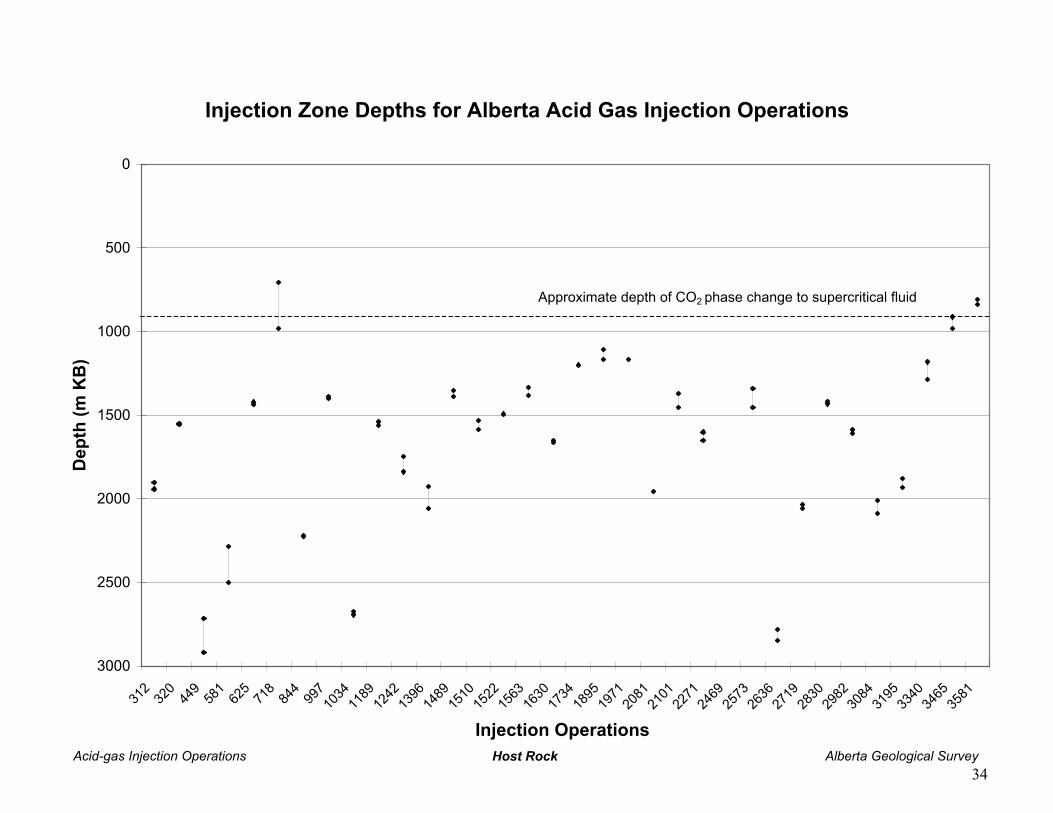
Injection Zone Depths for Alberta Acid Gas Injection Operations
Acid-gas Injection Operations Host Rock Alberta Geological Survey
0
500
1000
1500
2000
2500
3000
312
320
449
581
625
718
844
997
1034
1189
1242
1396
1489
1510
1522
1563
1630
1734
1895
1971
2081
2101
2271
2469
2573
2636
2719
2830
2982
3084
3195
3340
3465
3581
Injection Operations
Dep
th (m
KB
)
Approximate depth of CO2 phase change to supercritical fluid
34
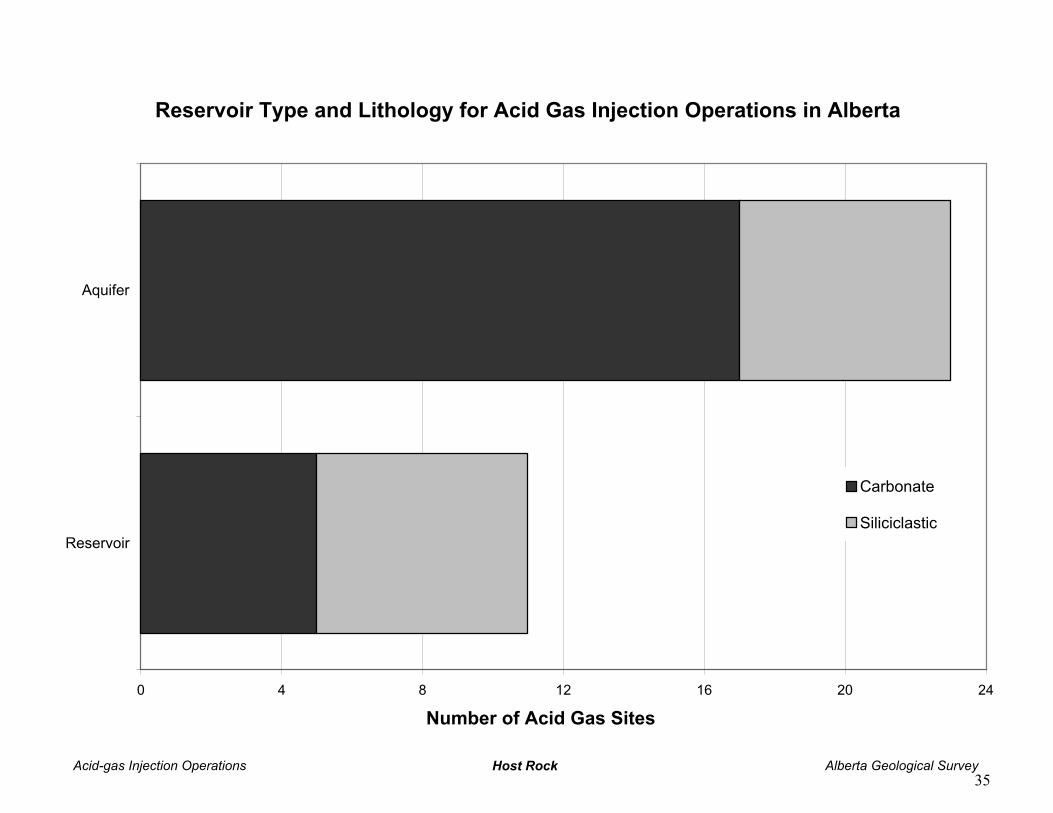
Reservoir Type and Lithology for Acid Gas Injection Operations in Alberta
Acid-gas Injection Operations Host Rock Alberta Geological Survey
0 4 8 12 16 20 24
Reservoir
Aquifer
Number of Acid Gas Sites
Carbonate
Siliciclastic
35
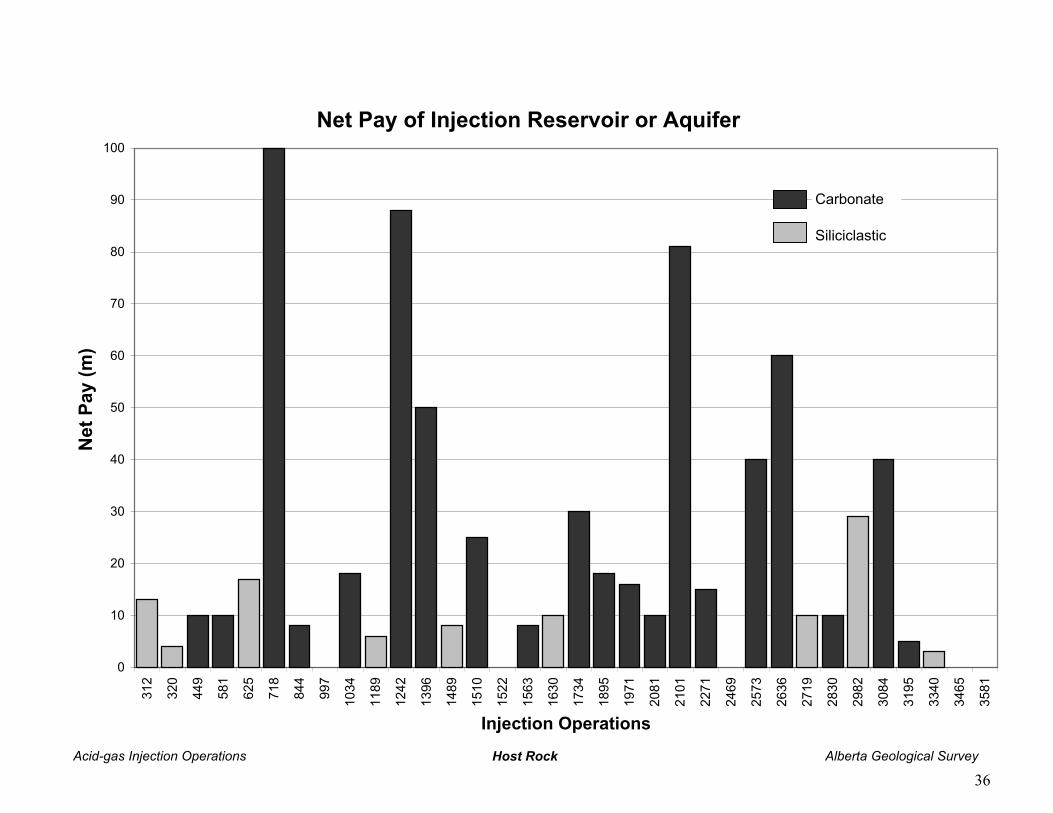
Acid-gas Injection Operations Host Rock Alberta Geological Survey
Net Pay of Injection Reservoir or Aquifer
0
10
20
30
40
50
60
70
80
90
10031
2
320
449
581
625
718
844
997
1034
1189
1242
1396
1489
1510
1522
1563
1630
1734
1895
1971
2081
2101
2271
2469
2573
2636
2719
2830
2982
3084
3195
3340
3465
3581
Injection Operations
Net
Pay
(m)
Carbonate
Siliciclastic
36
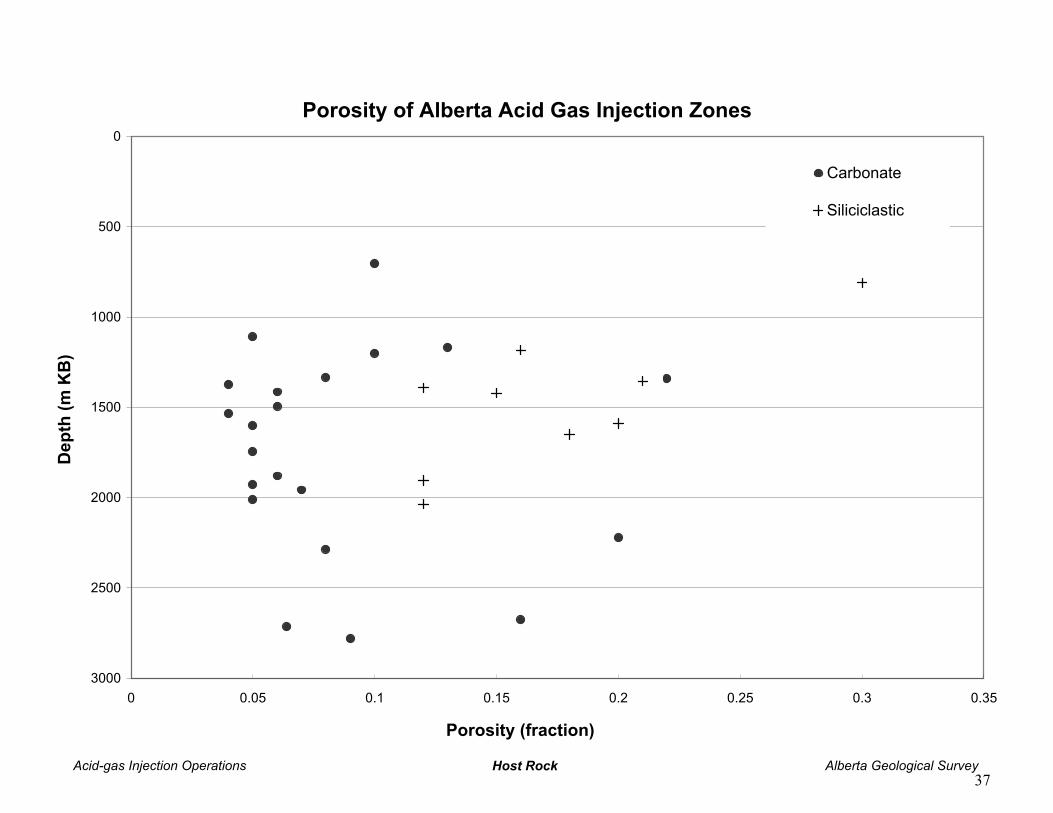
Porosity of Alberta Acid Gas Injection Zones
Acid-gas Injection Operations Host Rock Alberta Geological Survey
0
500
1000
1500
2000
2500
30000 0.05 0.1 0.15 0.2 0.25 0.3 0.35
Porosity (fraction)
Dep
th (m
KB
)
Carbonate
Siliciclastic
37
Appendix
Acid Gas Injection Operations
in Alberta, Canada
Host Fluids Graphs Original Formation Pressure at Injection Zones Formation Temperature of Injection Zones Formation Water Salinity Oil API Gravity in Depleted Oil Reservoirs used
for Injection Specific Gravity in Depleted Gas Reservoir used
for Injection
38
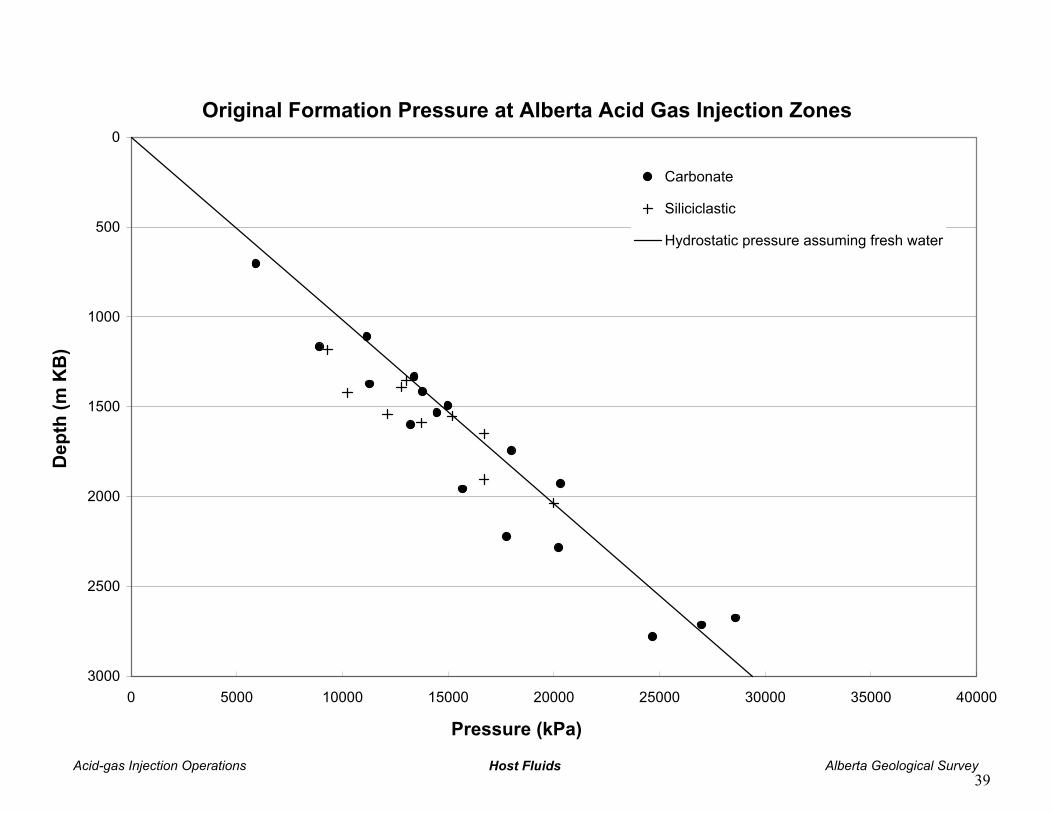
Original Formation Pressure at Alberta Acid Gas Injection Zones
Acid-gas Injection Operations Host Fluids Alberta Geological Survey
0
500
1000
1500
2000
2500
30000 5000 10000 15000 20000 25000 30000 35000 40000
Pressure (kPa)
Dep
th (m
KB
)
Carbonate
Siliciclastic
Hydrostatic pressure assuming fresh water
39
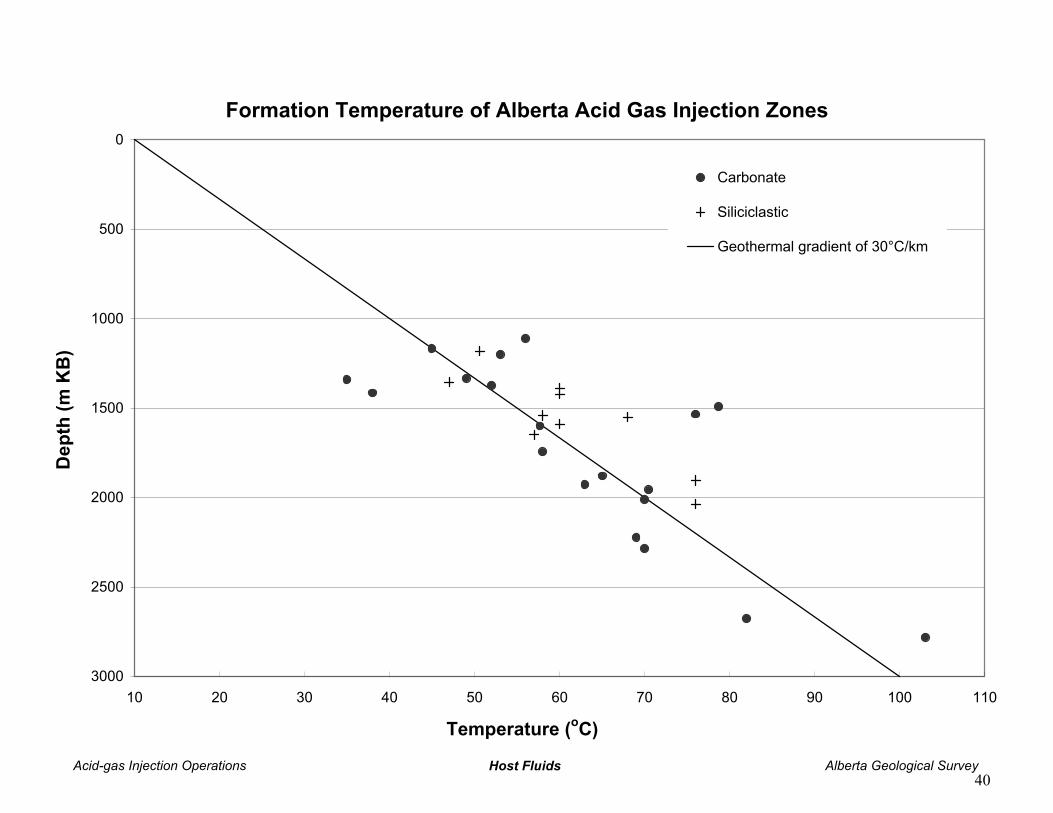
Formation Temperature of Alberta Acid Gas Injection Zones
Acid-gas Injection Operations Host Fluids Alberta Geological Survey
0
500
1000
1500
2000
2500
300010 20 30 40 50 60 70 80 90 100 110
Temperature (oC)
Dep
th (m
KB
)
Carbonate
Siliciclastic
Geothermal gradient of 30°C/km
40
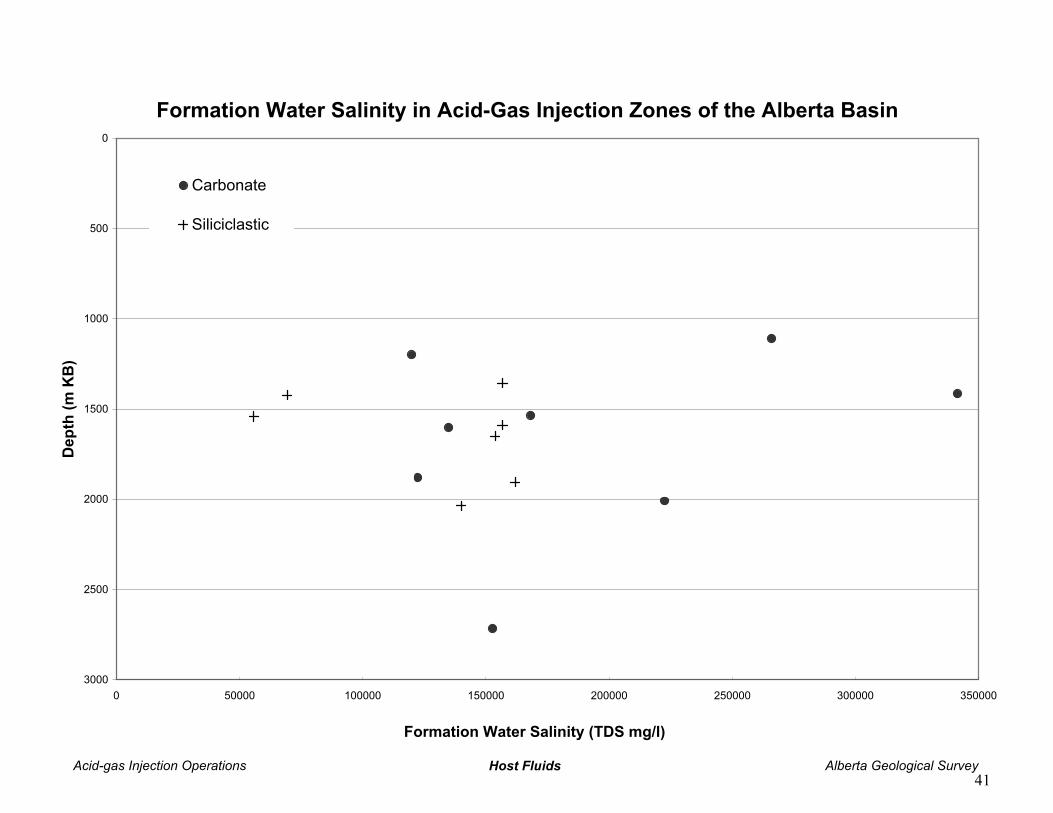
Formation Water Salinity in Acid-Gas Injection Zones of the Alberta Basin
Acid-gas Injection Operations Host Fluids Alberta Geological Survey
0
500
1000
1500
2000
2500
30000 50000 100000 150000 200000 250000 300000 350000
Formation Water Salinity (TDS mg/l)
Dep
th (m
KB
)
Carbonate
Siliciclastic
41
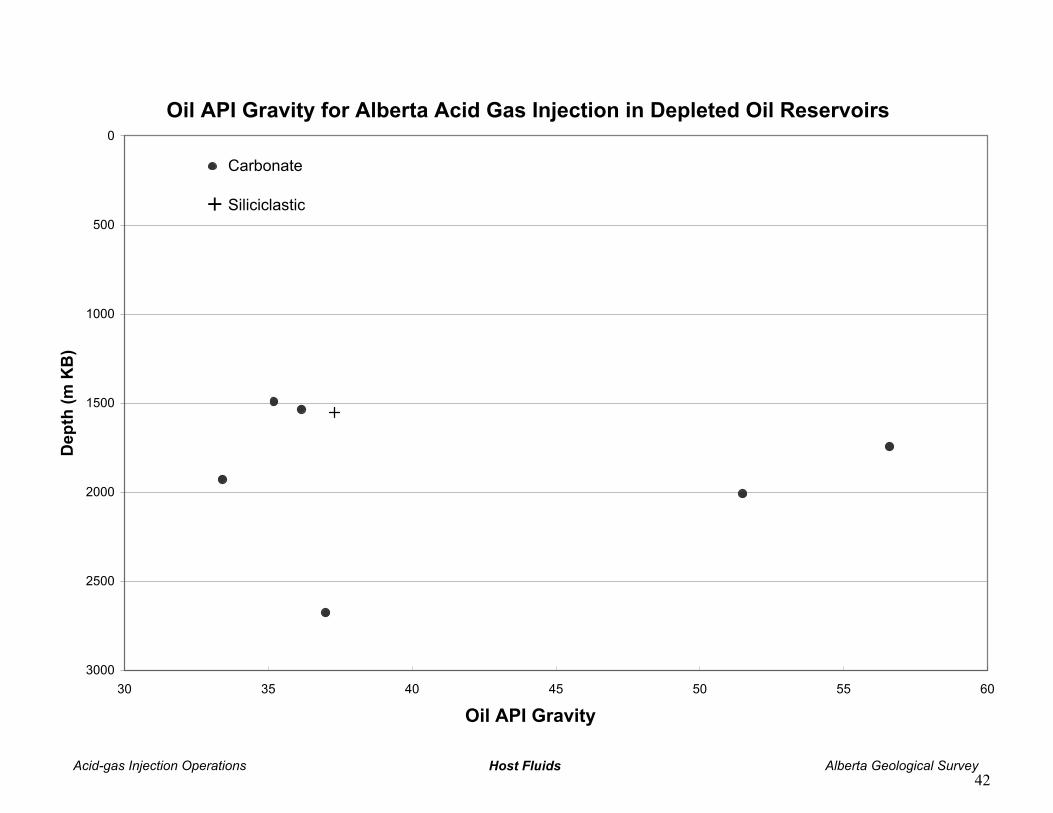
Oil API Gravity for Alberta Acid Gas Injection in Depleted Oil Reservoirs
Acid-gas Injection Operations Host Fluids Alberta Geological Survey
Oil API Gravity
0
500
1000
1500
2000
2500
300030 35 40 45 50 55 60
Dep
th (m
KB
)
Carbonate
Siliciclastic+
42
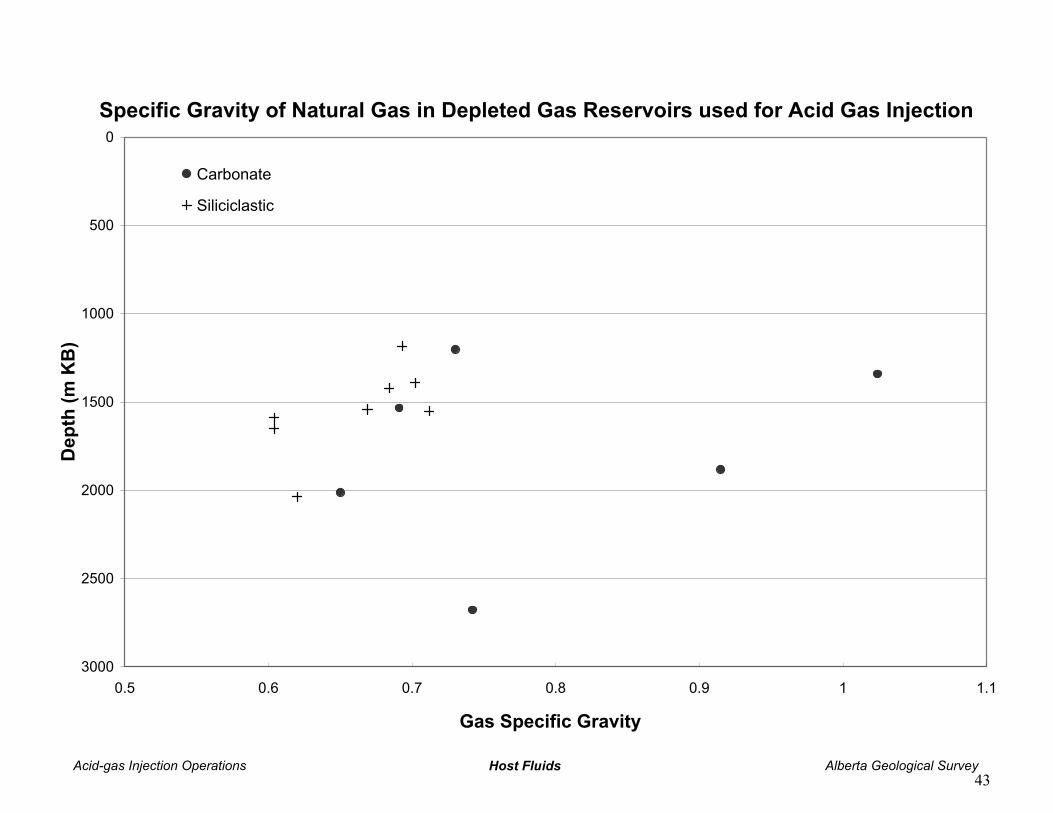
Specific Gravity of Natural Gas in Depleted Gas Reservoirs used for Acid Gas Injection
Acid-gas Injection Operations Host Fluids Alberta Geological Survey
Gas Specific Gravity
0
500
1000
1500
2000
2500
30000.5 0.6 0.7 0.8 0.9 1 1.1
Dep
th (m
KB
)
Carbonate
Siliciclastic
43
Appendix
Acid Gas Injection Operations
in Alberta, Canada
Injection Operations Graphs
Composition of Injected Acid Gas in Alberta Wellhead and Formation Pressures of Acid Gas
Injection Operations Maximum Approved Acid Gas Injection Rate Pipeline Length
44
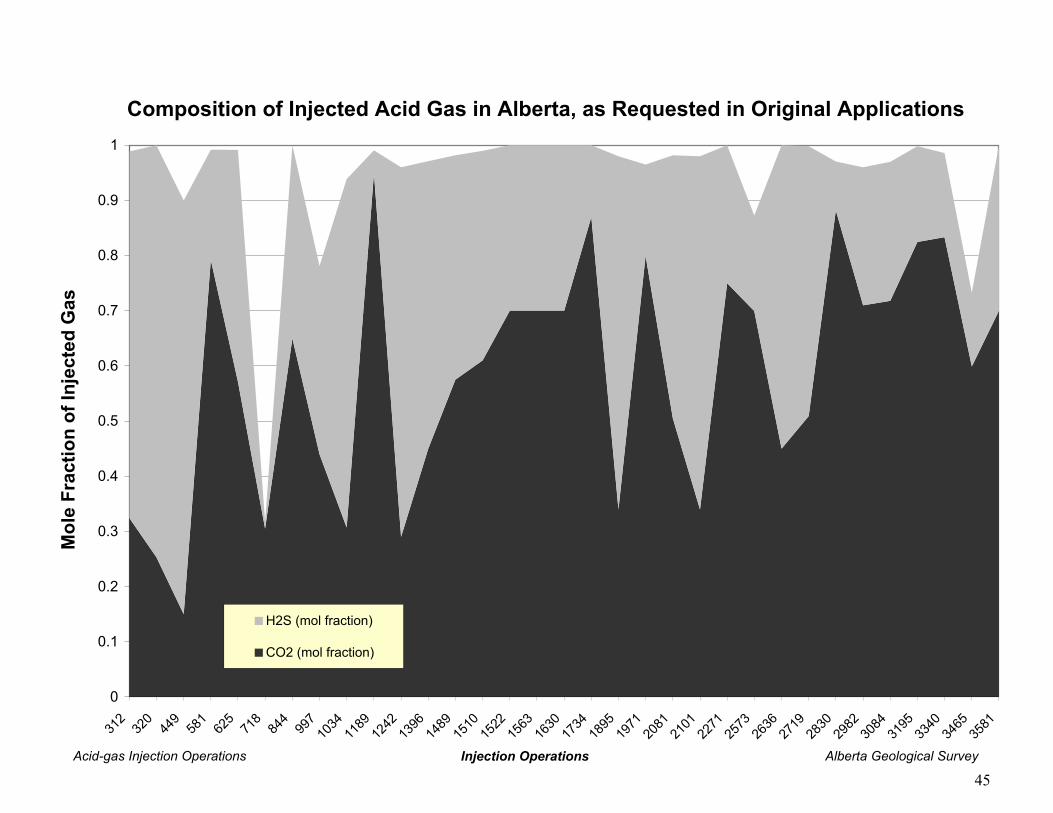
Composition of Injected Acid Gas in Alberta, as Requested in Original Applications
Acid-gas Injection Operations Injection Operations Alberta Geological Survey
0
0.1
0.2
0.3
0.4
0.5
0.6
0.7
0.8
0.9
1
312
320
449
581
625
718
844
997
1034
1189
1242
1396
1489
1510
1522
1563
1630
1734
1895
1971
2081
2101
2271
2573
2636
2719
2830
2982
3084
3195
3340
3465
3581
Mol
e Fr
actio
n of
Inje
cted
Gas
H2S (mol fraction)
CO2 (mol fraction)
45
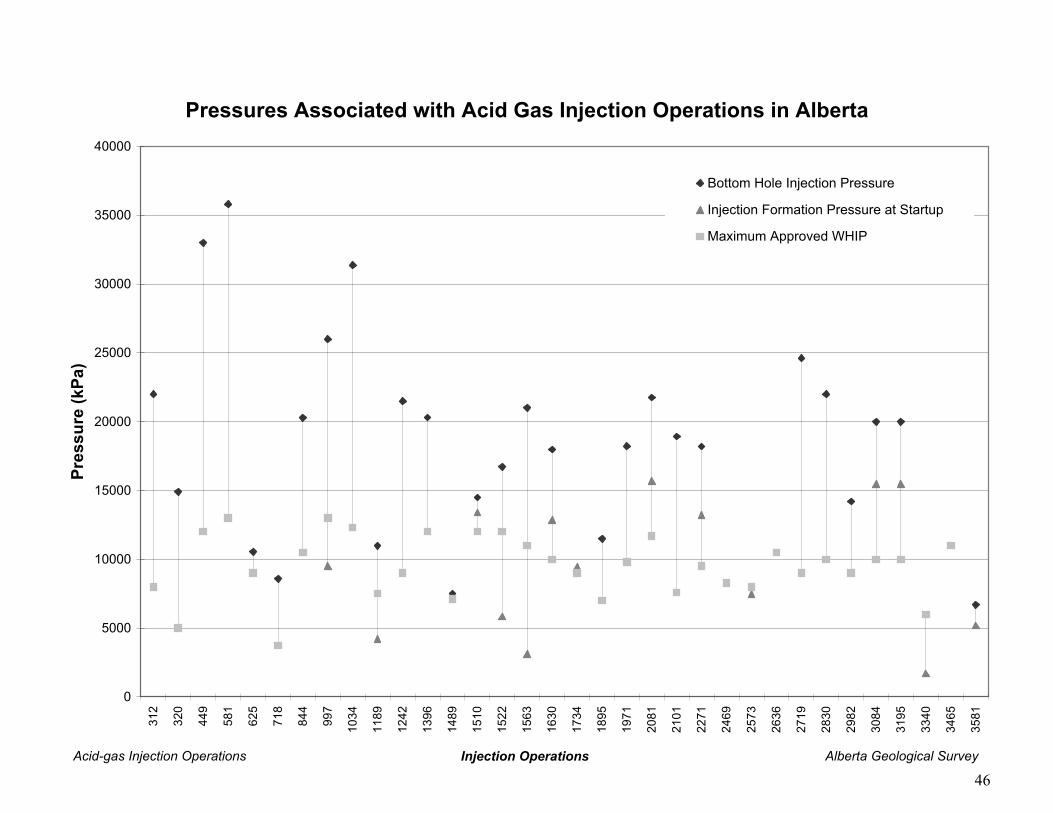
Pressures Associated with Acid Gas Injection Operations in Alberta
Acid-gas Injection Operations Injection Operations Alberta Geological Survey
0
5000
10000
15000
20000
25000
30000
35000
4000031
2
320
449
581
625
718
844
997
1034
1189
1242
1396
1489
1510
1522
1563
1630
1734
1895
1971
2081
2101
2271
2469
2573
2636
2719
2830
2982
3084
3195
3340
3465
3581
Pres
sure
(kPa
)
Bottom Hole Injection Pressure
Injection Formation Pressure at Startup
Maximum Approved WHIP
46
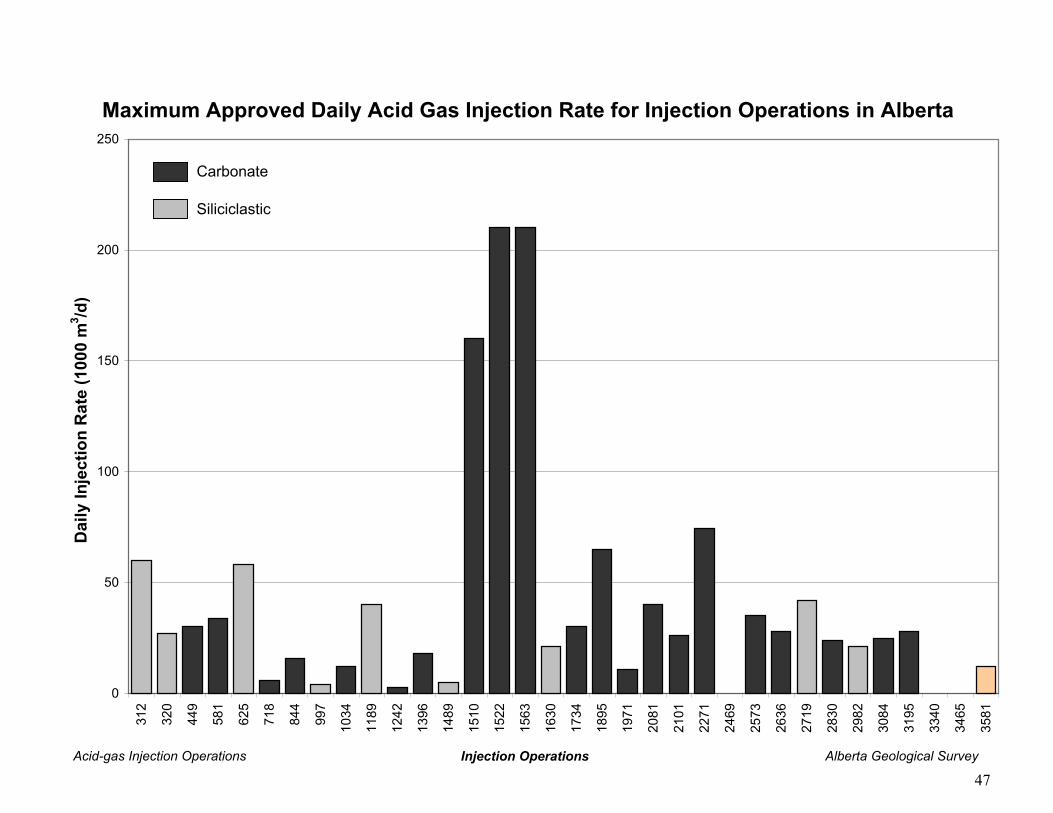
Maximum Approved Daily Acid Gas Injection Rate for Injection Operations in Alberta
Acid-gas Injection Operations Injection Operations Alberta Geological Survey
0
50
100
150
200
25031
2
320
449
581
625
718
844
997
1034
1189
1242
1396
1489
1510
1522
1563
1630
1734
1895
1971
2081
2101
2271
2469
2573
2636
2719
2830
2982
3084
3195
3340
3465
3581
Dai
ly In
ject
ion
Rat
e (1
000
m3 /d
)
Carbonate
Siliciclastic
47
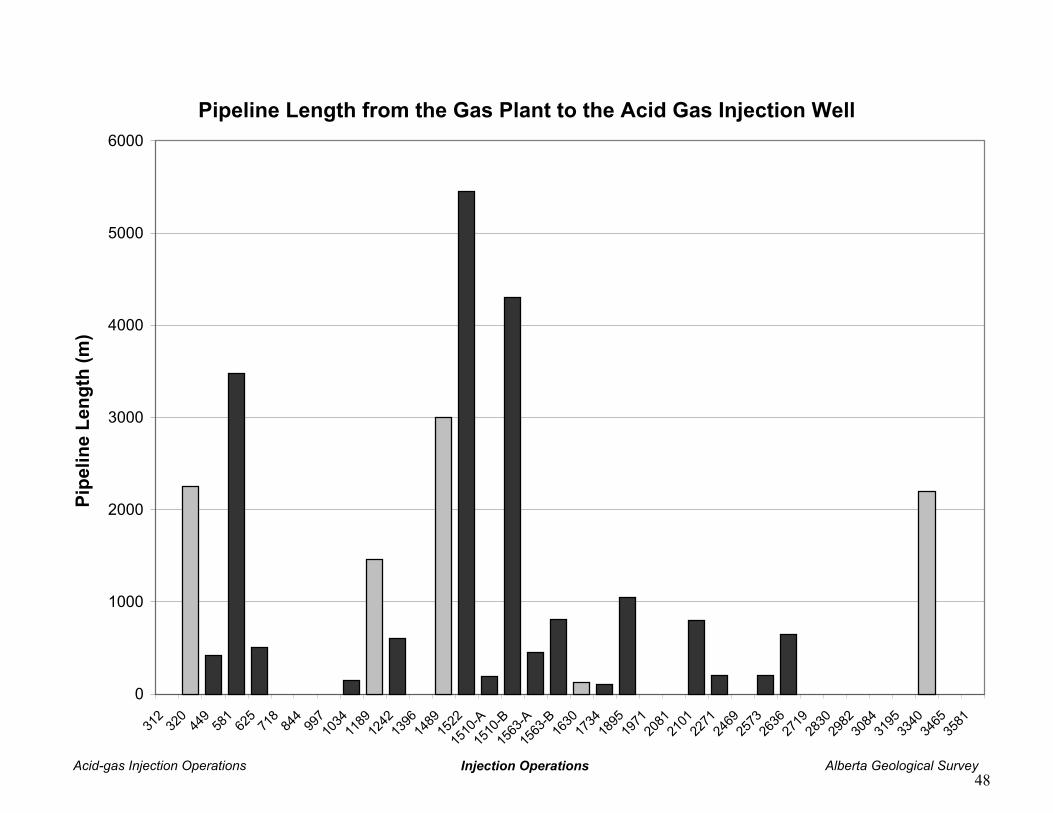
Pipeline Length from the Gas Plant to the Acid Gas Injection Well
Acid-gas Injection Operations Injection Operations Alberta Geological Survey
0
1000
2000
3000
4000
5000
6000
312
320
449
581
625
718
844
997
1034
1189
1242
1396
1489
1522
1510
-A15
10-B
1563
-A15
63-B
1630
1734
1895
1971
2081
2101
2271
2469
2573
2636
2719
2830
2982
3084
3195
3340
3465
3581
Pipe
line
Leng
th (m
)
48


![ATX-101 (DEOXYCHOLIC ACID) INJECTION ADVISORY …ghk.h-cdn.co/assets/cm/15/11/5500ae2372422_-_ucm436604.pdf · ATX-101 (deoxycholic acid [DCA] injection) is a first-in-class, injectable](https://img.pdfslide.us/doc/110x75/5fde35f6a3f51d515e21d8cc/atx-101-deoxycholic-acid-injection-advisory-ghkh-cdncoassetscm15115500ae2372422-.jpg)