Embed Size (px)
Citation preview

ACIAR ImpACt Assessment seRIes
ACIAR investment in research on forages in Indonesia
65

ACIAR investment in research on forages in Indonesia
Greg MartinIDA Economics Pty Ltd
2010

The Australian Centre for International Agricultural Research (ACIAR) was established in June 1982 by an Act of the Australian Parliament. ACIAR operates as part of Australia’s international development cooperation program, with a mission to achieve more productive and sustainable agricultural systems for the benefit of developing countries and Australia. It commissions collaborative research between Australian and developing-country researchers in areas where Australia has special research competence. It also administers Australia’s contribution to the International Agricultural Research Centres.
Where trade names are used, this constitutes neither endorsement of nor discrimination against any product by the Centre.
ACIAR IMPACT ASSESSMENT SERIES
ACIAR seeks to ensure that the outputs of the research it funds are adopted by farmers, policymakers, quarantine officers and other beneficiaries. In order to monitor the effects of its projects, ACIAR commissions independent assessments of selected projects. This series of publications reports the results of these independent studies. Numbers in this series are distributed internationally to selected individuals and scientific institutions, and are also available from ACIAR’s website at <www.aciar.gov.au>.
© Commonwealth of Australia 2010
This work is copyright. Apart from any use as permitted under the Copyright Act 1968, no part may be reproduced by any process without prior written permission from the Commonwealth. Requests and inquiries concerning reproduction and rights should be addressed to the Commonwealth Copyright Administration, Attorney-General’s Department, Robert Garran Offices, National Circuit, Barton ACT 2600 or posted at <http://www.ag.gov.au/cca>.
Published by the Australian Centre for International Agricultural Research (ACIAR)
GPO Box 1571, Canberra ACT 2601, AustraliaTelephone: 61 2 6217 [email protected]
Martin G. 2010. ACIAR investment in research on forages in Indonesia. ACIAR Impact Assessment Series Report No. 65. Australian Centre for International Agricultural Research: Canberra. 59 pp.
ISSN 1832-1879ISBN 978 1 921615 91 7 (print)ISBN 978 1 921615 92 4 (online)
Editing and design by Clarus Design, CanberraPrinting by Elect Printing
Cover: Research leading to the adoption of higher quality forages in Indonesia has improved the productivity of local cattle and the incomes and livelihoods of smallholder farmers. Photo © Jim Holmes

ACIAR investment in research on forages in Indonesia (IAS 65) 3
The rapid rise in demand for livestock products throughout Asia is having a profound impact on the cattle industry in eastern Indonesia. Sell-off to meet this demand has reportedly led to a rapid decline in numbers of Bali cattle, including breeders. Farmers needed to adopt strategies to turn this situation around, but there have been some major constraints to improving livestock production. These include the quantity and quality of animal feed available, and poor animal husbandry that affects breeding and disease management.
Improving feed quality by introducing higher quality forages can go a long way towards removing some of those constraints. Previous research has identified many nutritious forage species that are well adapted to the mixed crop–livestock systems of eastern Indonesia. However their adoption has been limited, leading to the notion that there has been ‘50 years of failure’ in tropical forage research and development.
The Australian Centre for International Agricultural Research (ACIAR) has sought to rectify this situation, starting from the hypothesis that farmers may not be convinced that the benefits of adopting the new forages outweigh the costs of doing so. They may also consider that there are more attractive alternatives for investment of their time and effort, and they may be uneasy about the levels of risk associated with the changes.
Against this background, ACIAR developed six related ‘forage research’ projects, designed to lift the adoption of productivity-improving technologies by smallholder farmers in eastern Indonesia and thus bring them higher incomes and better livelihoods.
The research team adopted a whole-of-farm or systems approach to the smallholder farming systems, with the intention of improving farmer understanding of the
opportunities offered in a crop–livestock enterprise, and to alert them to both the benefits and constraints of forages adoption. The project work included the development of an integrated analysis tool that has helped researchers, advisers and farmers understand the potential economic and other benefits of improved forages and livestock-management strategies.
Farmers are now increasingly taking up the new ‘best-bet’ strategies. Although widespread adoption has yet to occur, those undertaking this impact assessment ascertained that, relative to costs, this research investment offers a high rate of return. One reason is low adoption costs for farmers. This has assisted adoption to date and will continue to do so.
The projects have also raised the research capacity among members of the Indonesian team, enhanced the capacity of farmer groups to work together on their mutual problems, and have helped to build on-ground teams of experienced extension workers. These outcomes typify a successful partnership.
Nick AustinChief Executive Officer, ACIAR
Foreword


ACIAR investment in research on forages in Indonesia (IAS 65) 5
Contents
Foreword . . . . . . . . . . . . . . . . . . . . . . . . . . . . . . . . . . . . . . . . . . . . . . . . . . . . . . . . . . . . . . . . . . . . . . . . . . . . . . . . . . . . . . . . . . . . . . . . . . . . . . . . . . . . . . . . . . . . . . 3
Abbreviations . . . . . . . . . . . . . . . . . . . . . . . . . . . . . . . . . . . . . . . . . . . . . . . . . . . . . . . . . . . . . . . . . . . . . . . . . . . . . . . . . . . . . . . . . . . . . . . . . . . . . . . . . . . . . . . . . 7
Acknowledgments . . . . . . . . . . . . . . . . . . . . . . . . . . . . . . . . . . . . . . . . . . . . . . . . . . . . . . . . . . . . . . . . . . . . . . . . . . . . . . . . . . . . . . . . . . . . . . . . . . . . . . . . . . . . 8
Summary . . . . . . . . . . . . . . . . . . . . . . . . . . . . . . . . . . . . . . . . . . . . . . . . . . . . . . . . . . . . . . . . . . . . . . . . . . . . . . . . . . . . . . . . . . . . . . . . . . . . . . . . . . . . . . . . . . . . . . 9
1 ACIAR’s forage R&D investment . . . . . . . . . . . . . . . . . . . . . . . . . . . . . . . . . . . . . . . . . . . . . . . . . . . . . . . . . . . . . . . . . . . . . . . . . . . . . . . . . . . . . . . .15
1.1 Areas of activity . . . . . . . . . . . . . . . . . . . . . . . . . . . . . . . . . . . . . . . . . . . . . . . . . . . . . . . . . . . . . . . . . . . . . . . . . . . . . . . . . . . . . . . . . . . . . . . . . . . . . .15
1.2 Background to this study . . . . . . . . . . . . . . . . . . . . . . . . . . . . . . . . . . . . . . . . . . . . . . . . . . . . . . . . . . . . . . . . . . . . . . . . . . . . . . . . . . . . . . . . . . . .15
2 Impact assessment: forages and integrated crop–livestock management, eastern Indonesia . . . . . . . . . . . . . . . . . . . . . . .16
2.1 Context . . . . . . . . . . . . . . . . . . . . . . . . . . . . . . . . . . . . . . . . . . . . . . . . . . . . . . . . . . . . . . . . . . . . . . . . . . . . . . . . . . . . . . . . . . . . . . . . . . . . . . . . . . . . . .16
2.2 Research investment . . . . . . . . . . . . . . . . . . . . . . . . . . . . . . . . . . . . . . . . . . . . . . . . . . . . . . . . . . . . . . . . . . . . . . . . . . . . . . . . . . . . . . . . . . . . . . . . .16
2.3 Outputs of the research . . . . . . . . . . . . . . . . . . . . . . . . . . . . . . . . . . . . . . . . . . . . . . . . . . . . . . . . . . . . . . . . . . . . . . . . . . . . . . . . . . . . . . . . . . . . .22
2.4 Adoption pathway . . . . . . . . . . . . . . . . . . . . . . . . . . . . . . . . . . . . . . . . . . . . . . . . . . . . . . . . . . . . . . . . . . . . . . . . . . . . . . . . . . . . . . . . . . . . . . . . . . .27
2.5 Impact assessment . . . . . . . . . . . . . . . . . . . . . . . . . . . . . . . . . . . . . . . . . . . . . . . . . . . . . . . . . . . . . . . . . . . . . . . . . . . . . . . . . . . . . . . . . . . . . . . . . . .38
2.6 Benefit flows (economic, environmental and social) . . . . . . . . . . . . . . . . . . . . . . . . . . . . . . . . . . . . . . . . . . . . . . . . . . . . . . . . . . . . . . . .43
2.7 Lessons and learnings . . . . . . . . . . . . . . . . . . . . . . . . . . . . . . . . . . . . . . . . . . . . . . . . . . . . . . . . . . . . . . . . . . . . . . . . . . . . . . . . . . . . . . . . . . . . . . . .50
References . . . . . . . . . . . . . . . . . . . . . . . . . . . . . . . . . . . . . . . . . . . . . . . . . . . . . . . . . . . . . . . . . . . . . . . . . . . . . . . . . . . . . . . . . . . . . . . . . . . . . . . . . . . . . . . . . . . .51
Appendix. Project results frame chart . . . . . . . . . . . . . . . . . . . . . . . . . . . . . . . . . . . . . . . . . . . . . . . . . . . . . . . . . . . . . . . . . . . . . . . . . . . . . . . . . . . . .53
Figures
1 ACIAR’s integrated forage and smallholder crop–livestock R&D projects in Indonesia . . . . . . . . . . . . . . . . . . . . . . . . . .10
2 Estimated adoption profile for forage technologies, with and without additional extension support . . . . . . . . . . .12
3 ACIAR’s integrated forage and smallholder crop–livestock R&D projects in Indonesia . . . . . . . . . . . . . . . . . . . . . . . . . .17
4 Cattle prices Indonesia, 2005–09 . . . . . . . . . . . . . . . . . . . . . . . . . . . . . . . . . . . . . . . . . . . . . . . . . . . . . . . . . . . . . . . . . . . . . . . . . . . . . . . . .27
5 Estimated profile for adoption of new crop–livestock technologies by smallholders in South Sulawesi and Lombok, Indonesia . . . . . . . . . . . . . . . . . . . . . . . . . . . . . . . . . . . . . . . . . . . . . . . . . . . . . . . . . . . . . . . . . . . . . . . . . . . . . . . . . . . . . . . . . . .36
6 Measurement of R&D gains: producer and consumer surplus . . . . . . . . . . . . . . . . . . . . . . . . . . . . . . . . . . . . . . . . . . . . . . . . . . . .39
7 Estimated adoption profile for new forage technologies, with and without additional extension support . . . . . .41
8 Indonesia’s beef supply, by source, 1993–2008 . . . . . . . . . . . . . . . . . . . . . . . . . . . . . . . . . . . . . . . . . . . . . . . . . . . . . . . . . . . . . . . . . . . .43
A1 ACIAR projects on forages in improving smallholder crop–livestock systems in eastern Indonesia: results frame chart . . . . . . . . . . . . . . . . . . . . . . . . . . . . . . . . . . . . . . . . . . . . . . . . . . . . . . . . . . . . . . . . . . . . . . . . . . . . . . . . . . . . . . . . . . . . . . . .53
A2 Summary chart on capacity-building aspects of ACIAR projects on forages in improving smallholder crop–livestock systems in eastern Indonesia . . . . . . . . . . . . . . . . . . . . . . . . . . . . . . . . . . . . . . . . . . . . . . . . . . . . . . . . . . . . . . . . . . . . . .55

6 ACIAR investment in research on forages in Indonesia (IAS 65)
Tables
1 Estimated economic gains from adoption of forage technologies (net present value, 5% discount rate). . . . . . . .12
2 Investment returns to R&D and extension in forage technology projects (net present value, 5% discount rate) . . . . . . . . . . . . . . . . . . . . . . . . . . . . . . . . . . . . . . . . . . . . . . . . . . . . . . . . . . . . . . . . . . . . . . . . . . . . . . . . . . . . . . . . . . . . . . . . .13
3 Project investment: ACIAR expenditure and agency contributions on the seven forage-research projects in dollars of the day and real 2009 present values (A$m) . . . . . . . . . . . . . . . . . . . . . . . . . . . . . . . . . . . . . . . . . . . . . . .22
4 Estimated annual cash gains, based on integrated analysis tool determinations, from adopting various forage technologies in Sumbawa and South Sulawesi . . . . . . . . . . . . . . . . . . . . . . . . . . . . . . . . . . . . . . . . . . . . . . . . . . . . . . . . . . . .25
5 Cattle numbers, and beef production, consumption and prices in Indonesia, 2008–2018 (forecast) . . . . . . . . . . . .28
6 Factors affecting future adoption of forage technologies in Indonesia: review by current project teams . . . . . . . .37
7 Cattle numbers in South Sulawesi and Lombok, Indonesia . . . . . . . . . . . . . . . . . . . . . . . . . . . . . . . . . . . . . . . . . . . . . . . . . . . . . . .40
8 Estimated gains in economic welfare from adoption of forage technologies (net present values, 5% discount rate) . . . . . . . . . . . . . . . . . . . . . . . . . . . . . . . . . . . . . . . . . . . . . . . . . . . . . . . . . . . . . . . . . . . . . . . . . . . . . . . . . . . . . . . . . . . . . . . . .44
9 Investment returns to R&D and extension for selected forage projects in Indonesia . . . . . . . . . . . . . . . . . . . . . . . . . . . .46
10 Sensitivity of the estimated returns on investment to project factors . . . . . . . . . . . . . . . . . . . . . . . . . . . . . . . . . . . . . . . . . . . .48
11 Sensitivity of the estimated returns on investment to the discount rate applied . . . . . . . . . . . . . . . . . . . . . . . . . . . . . . . .49
Boxes
1 Farmer comments on productivity change . . . . . . . . . . . . . . . . . . . . . . . . . . . . . . . . . . . . . . . . . . . . . . . . . . . . . . . . . . . . . . . . . . . . . . .29
2 Features of successful adoption of new forage technologies: summary of the findings of the review by Shelton et al. (2005) . . . . . . . . . . . . . . . . . . . . . . . . . . . . . . . . . . . . . . . . . . . . . . . . . . . . . . . . . . . . . . . . . . . . . . . . . . . . . . . . . . . . . . . . . . . . . . .33

ACIAR investment in research on forages in Indonesia (IAS 65) 7
ACIAR Australian Centre for International Agricultural Research
A$ Australian dollars
CIAT International Center for Tropical Agriculture
CSIRO Commonwealth Scientific and Industrial Research Organisation (Australia)
OGT/s on-ground [extension] team/s
IAT integrated analysis tool
IRR internal rate of return
m million (in monetary values)
NPV net present value
R&D research and development
Rp rupiah (monetary unit of Indonesia)
Abbreviations

8 ACIAR investment in research on forages in Indonesia (IAS 65)
The author thanks staff of CSIRO Sustainable Ecosystems and the partner researchers in Indonesia. The project leaders, Dr Bruce Pengelly (CSIRO Sustainable Ecosystems), Dr Rusnadi Padjang (Hasanuddin University) and Dr Ketut Puspadi (Balai Pengkajian Teknologi Pertanian NTB), assisted greatly with overall support and encouragement. The principal researchers Jeff Corfield and Cam McDonald (CSIRO Sustainable Ecosystems) provided valuable insights from their extensive experience in working with the production challenges in Indonesia. Special thanks go to the project-coordinators Ms Monica van Wensveen (CSIRO Sustainable Ecosystems), Rakhmat Rachman (Balai Pengkajian Teknologi Pertanian, South Sulawesi) and Dr Dahlanuddin (Universitas Mataram) for advice, data and field-trip arrangements. Finally, thanks to the many Indonesian researchers, farmers, officials and members of the on-ground teams for their openness and enthusiasm.
Acknowledgments

ACIAR investment in research on forages in Indonesia (IAS 65) 9
Research investment
Six related ACIAR Indonesian ‘forage research’ projects have focused on increasing the adoption of productivity-improving technologies and thus the incomes and livelihoods of crop–livestock smallholders in eastern Indonesia:
AS2/2000/124: Prospects for improving integration of high quality forages in the crop livestock systems of Sulawesi
AS2/2000/125: Optimising crop–livestock systems in West Nusa Tenggara province
AS2/2000/103: Developing an integrated production system for Bali cattle in the eastern islands of Indonesia
LPS/2004/005: Improving smallholder crop–livestock systems (Sulawesi, Lombok and Sumbawa)
SMAR/2006/061: Building capacity in the knowledge and adoption of Bali cattle improvement technology in Sulawesi
SMAR/2006/096: Scaling-up herd management strategies in crop–livestock systems in Lombok.
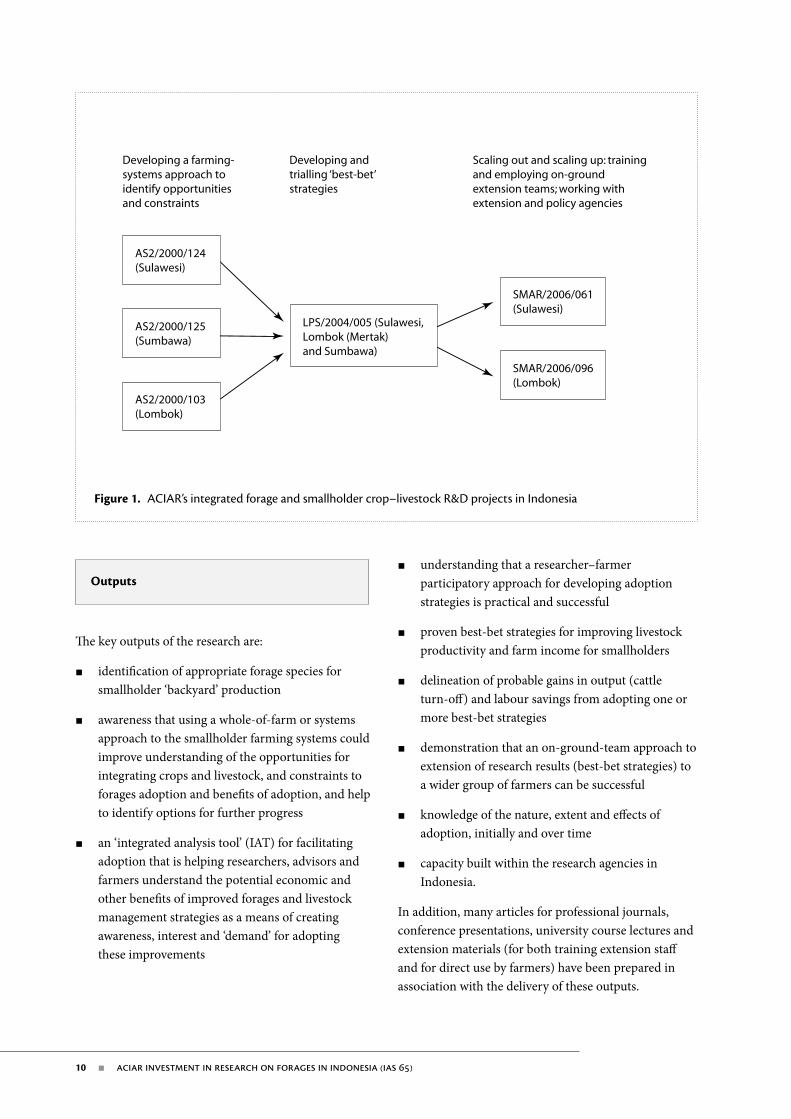
The broad relationships and objectives of the projects are shown in Figure 1. The total expenditure on them, expressed in real, present values (2009), is estimated at A$11.4m.
Background
As part of the continuing approach of the Australian Centre for International Agricultural Research (ACIAR) to assess the impact of its past research and development (R&D) investments, this study presents a brief overview of ACIAR-funded forage research in Indonesia.
Context
Demand for livestock products is expanding rapidly in the tropics and is having a major impact on household and regional economies. These changes are reported as having had a profound impact on the cattle industry of eastern Indonesia, including a rapid decline in numbers of Bali-breed cattle.
While the strong growth in demand does provide opportunities for farmers to increase income from livestock production and improve the economic sustainability of their farming enterprises, some major constraints (e.g. lack of feed, poor animal management and health) have been identified. Use of improved forages has the capacity to overcome these constraints.
Previous research has identified many forage species that are well adapted to mixed crop–livestock farming systems. However, their adoption has been limited. A starting hypothesis for the ACIAR projects was that farmers may not be convinced that the advantages of new forages outweigh the costs of introducing them; there may be more attractive options for investment; or perhaps there is a perception of unacceptable risk associated with the change.
Summary
10 ACIAR investment in research on forages in Indonesia (IAS 65)
understanding that a researcher–farmer participatory approach for developing adoption strategies is practical and successful
proven best-bet strategies for improving livestock productivity and farm income for smallholders
delineation of probable gains in output (cattle turn-off) and labour savings from adopting one or more best-bet strategies
demonstration that an on-ground-team approach to extension of research results (best-bet strategies) to a wider group of farmers can be successful
knowledge of the nature, extent and effects of adoption, initially and over time
capacity built within the research agencies in Indonesia.
In addition, many articles for professional journals, conference presentations, university course lectures and extension materials (for both training extension staff and for direct use by farmers) have been prepared in association with the delivery of these outputs.
Outputs
The key outputs of the research are:
identification of appropriate forage species for smallholder ‘backyard’ production
awareness that using a whole-of-farm or systems approach to the smallholder farming systems could improve understanding of the opportunities for integrating crops and livestock, and constraints to forages adoption and benefits of adoption, and help to identify options for further progress
an ‘integrated analysis tool’ (IAT) for facilitating adoption that is helping researchers, advisors and farmers understand the potential economic and other benefits of improved forages and livestock management strategies as a means of creating awareness, interest and ‘demand’ for adopting these improvements
Figure 1. ACIAR’s integrated forage and smallholder crop–livestock R&D projects in Indonesia
Developing a farming- systems approach to identify opportunities and constraints
Developing and trialling ‘best-bet’ strategies
Scaling out and scaling up: training and employing on-ground extension teams; working with extension and policy agencies
SMAR/2006/061(Sulawesi)
SMAR/2006/096(Lombok)
AS2/2000/124(Sulawesi)
AS2/2000/125(Sumbawa)
AS2/2000/103(Lombok)
LPS/2004/005 (Sulawesi, Lombok (Mertak) and Sumbawa)
ACIAR investment in research on forages in Indonesia (IAS 65) 11
Accordingly it has been argued that the adoption of the R&D technologies can be expected to follow the standard statistical normal distribution of adoption in the farming population over time: some early adopters, a majority of later adopters and some non-adopters.
Impact assessment: benefit flows
The impact assessment follows the ACIAR guidelines (Davis et al. 2008), in particular using economic surplus as the basis of measuring the gain in economic welfare. A partial-equilibrium approach has been used, thus allowing analysis of distribution of the prospective benefits between farmers and consumers. The industry has been disaggregated into three groups of farming smallholders: those on Sumbawa, South Sulawesi and Lombok.
A generally conservative approach has been used to estimate the key parameters; in particular, the on-farm cash-flow gains, and application of the technologies (applicable to an estimated one-third of the cattle herd by 2038) with two scenarios of the rate of adoption reflecting differential levels of extension support (Figure 2).
Expressed in net-present-value (NPV) terms, the adoption of the forage R&D technologies could return an estimated A$1,300m if there were strong policy support (Table 1) and about A$1,000m in the absence of such support.
Virtually all (93%) of the gain would flow to producers since the impact on the consumer price is quite small, reflecting the highly elastic demand for cattle faced by producers.
In addition to the quantified benefits, there are spillover benefits to others.
The technologies have application to a wider range of farmers: smallholders with buffalo and goats; smallholder cattle farmers in other regions of Indonesia that face the same challenges; larger farmers where feed supplies are, or could be, provided or supplemented by forages; and smallholders in other countries.
Implications for farmers
A general picture of the output implications is provided by the analysis conducted during the development of the best-bet strategies. It found that:
the types of strategies examined and reported are being taken up by farmers, so they are realistic strategies for the purposes of the present analysis
the output changes from adopting identified strategies outlined in the IAT analysis appear consistent with field observations.
Updating the IAT analysis, and generalising from it, provides a reasonable basis for estimating the potential gains at the farm level. The annual cash gains per head owned are estimated at Rp0.54m (Sumbawa) and Rp2.09m (South Sulawesi and Lombok).
It is early days in the adoption of the R&D outputs from the projects. While significant adoption is evident on farms and in some villages and areas that were at the centre of the research, widespread adoption has not occurred as yet. The level of future adoption is a major issue, particularly given a mood of pessimism engendered by low levels of adoption characterising previous tropical forages R&D. It seems, however, that this time it might be different.
First, adoption is off to a good start. There are significant numbers of best-bet and scale-out farmers, though they are fewer than 2,000 to date. By all accounts these farmers are expanding their activities and the best-bet strategies they use—there seems to be no withdrawal or failure.
Second, the attributes of the technology itself and its application appear to pass the ‘tests’ or features of successful adoption identified by the Shelton review (Shelton et al. 2005) of the challenges and successes of past adoption of tropical forage R&D.
Third, the adoption profile of the best-bet strategies and the characteristics of the scale-out farmers appear to reflect what other researchers of adoption by smallholders have recognised (ex post) as the formation of coalitions and development of an extension process specific to the particular circumstances rather than a standard, extension-manual approach.

12 ACIAR investment in research on forages in Indonesia (IAS 65)
On Lombok, where community kandangs1 dominate the production system, the R&D and associated programs have led to a significant improvement in effluent management.
1 A kandang is typically a covered stall where cattle are tethered for feeding. Small landowners have a kandang where one or two cattle are fed. Cattle are usually walked to grazing areas during the day and fed cut forage in the kandang in the evening. With improved forages, cattle are more often totally fed from cut-and-carried forage. On Lombok, community kandangs dominate. Community kandangs might have 20 or more stalls, each one managed by a farmer. Again, cattle are typically grazed outside the kandang during the day and tethered and fed cut forages at night. The collective kandangs also provide security against theft, as cattle owners take it in turns to watch over the cattle at night.
A key feature of the ‘end’ projects (SMAR/2006/061 and SMAR/2006/096) has been the on-ground-team (OGT) experience for extension. This model can be expected to have significant application in future advisory structures for new forages as well as other technologies for smallholders in Indonesia. Given its success, it can be expected to be examined, trialled and adopted in research projects in other countries. The expected benefit can be viewed as a greater probability of adoption, and/or faster adoption, and/or more widespread adoption.
Changes in cattle feeding brought about by planting new forages can be expected to have environmental benefits. Backyard forage production can replace grazing of upland areas unsuited to cropping and under-utilised backyard weedy plots used for low-productivity grazing.
Figure 2. Estimated adoption profile for forage technologies, with and without additional extension support
2008
2010
2012
2014
2016
2018
2020
2022
2024
2026
2028
2030
2032
2034
2036
2038
0
5
10
15
20
25
30
35Pr
op
ort
ion
(%) o
f cat
tle
her
d 'a
do
pti
ng
' n
ew fo
rag
e te
chn
olo
gie
s With additional extension
Without additional extension
Table 1. Estimated economic gains from adoption of forage technologies (net present value, 5% discount rate).
Consumer benefits Producer benefits Total benefits
Without additional extension A$67m A$942m A$1,010m
With additional extension A$87m A$1,221m A$1,308m
Gain from additional extension A$20m A$278m A$298m
Note: Benefits are measured as the change in economic surplus to consumers, producers, and consumers plus producers .

ACIAR investment in research on forages in Indonesia (IAS 65) 13
farmers. This low adoption cost has assisted adoption to date and can be expected to continue to do so.
Sensitivity analysis
Two factors that underpin the estimated returns and about which there is a degree of uncertainty are:
cash flow gains at the farm level, especially given the difference between Sumbawa and South Sulawesi, and the extent to which adoption is likely to reflect only some of the best-bet strategies
the eventual level of adoption, including the effect of extension, given both the doubts about the availability of funds and the effectiveness of future extension, with the consequence that the strategies are applied to a smaller proportion of the herd.
More conservative approaches for both these factors reduce the expected pay-off. Taken together, the two scenarios reduce the investment return from 19% to around 15%. This return nevertheless still exceeds the benchmark required return (discount rate) of 5%, suggesting that the base-case analysis is robust.
A third factor considered in the sensitivity analysis is the net benefits beyond the 30-year time frame in the base-case analysis; that is, the annuity net benefit. When these post-30-year benefits are excluded, the value of benefits halves and the costs fall by about 20%. Accordingly, the benefit:cost ratio falls. The investment return falls marginally from 19% to 18%.
Three broad areas of additional capacity are evident to date:
enhanced research capability amongst Indonesian researchers involved with the projects, and their associated institutions
enhanced capacity of farmer groups to work together to solve problems
the OGTs are trained, and now experienced, extension workers. Whether they are retained in an extension role or not, significant capability has been developed.
Investment analysis
The investment, noting that major adoption has yet to occur, appears to offer a high rate of return. The internal rate of return (IRR) is estimated at around 20% and the benefit:cost ratio at greater than 20:1 (Table 2), even allowing for a significant investment in future extension activities of around Rp5,000m per annum after 2011 for 30 years and beyond (as either new extension funding or reprioritising existing extension service expenditure). This extension investment, in present value terms, is about equal to the total R&D investment to date.
If the extension investment is increased to Rp15,000m per annum to achieve a faster rate of adoption, the investment return is higher, with an estimated IRR of around 22%.
Relative to the costs, the potential benefits are very high, even recognising the conservative approach adopted in the analysis. One major reason is low adoption costs for
Table 2. Investment returns to R&D and extension in forage technology projects (net present value, 5% discount rate)
Without additional extension With additional extension
Present value (PV) of benefits A$1,010m A$1,308m
PV of costs A$23m A$48m
Net PV A$989m A$1,270m
Benefit:cost ratio 43 28
Internal rate of return 19% 22%

14 ACIAR investment in research on forages in Indonesia (IAS 65)
Lessons
This impact assessment was challenging in that the R&D is completed but adoption is at an early stage, as indicated by the low numbers of adopting farmers to date. Further, estimating the scale and pace of future adoption remains an open question, given an experience of ‘50 years of failure’ in tropical forage R&D (Pengelly et al. 2003).
As a result the analysis has focused on what might happen and why, rather than what has happened and the associated drivers. Making assessments of future adoption is also challenging when a key factor is what the nature and level of future institutional support might be.
Against this background, the information-gathering field trips undertaken as part of the impact assessment were essential—they put the smallholder cattle enterprise in context from both a farming perspective and the need for household income to meet special expenditures. Further, they enabled ground-truthing of the ex-ante analysis of the potential gains.
The following three steps could be incorporated into future projects:
ex-ante impact analysis, including indicative quantitative assessments, as a basis for both R&D design and collection of relevant data during the R&D project
verification of economic models in the latter part of the R&D
development of appropriate markers or indicators that could provide guidance for updating impacts in future years.
Attribution
About 60% of the past investment dollars were provided by ACIAR, and the balance through in-kind or other funding of the research and extension agencies— predominantly CSIRO, the University of Queensland, Balai Pengkajian Teknologi Pertanian and the universities in Indonesia.
Also, there are future costs in terms of extension, particularly if the extension effort is to be increased. This investment, if it is made, will change the relative contributions between R&D and extension from around 50% R&D 50% extension to 25% R&D 75% extension. In terms of attribution of the 50% R&D investment, identifying the opportunities, developing forage- and cattle-management strategies and demonstrating the importance and effectiveness of ground-level extension has clearly come from CSIRO through the ACIAR funding. The ACIAR investment was necessary since the R&D was required and it appears unlikely that others would have funded the level of R&D activity, especially given the past experiences of tropical-forage R&D investments. That said, the ACIAR-funded work has drawn upon a good deal of previous tropical-forage R&D work.
The ACIAR financial contribution to the R&D investment has been calculated at 60%. For the delivery of the estimated benefits, future extension work will be critical. Both investments—R&D and extension—are required in order to deliver the estimated benefits. With the base level of extension (and resulting 50%/50% R&D/extension contribution), ACIAR’s share of the benefits would be 30%—around A$300m. As the extra benefits arising from additional extension are attributable to only that additional extension, the value of the benefits attributable to ACIAR under this scenario remains at A$300m.

ACIAR investment in research on forages in Indonesia (IAS 65) 15
1.2 Background to this study
As part of its continuing approach to assessing the impact of past R&D investments, ACIAR contracted IDA Economics to provide a brief overview of all ACIAR-funded forage research in partner countries and a detailed impact assessment of at least two research activities.
There are two reasons to review ACIAR’s forage-related investment.
There has been no previous ACIAR impact assessment of its investment in forages even although some forage projects began in the early 1980s.
A 2008 ACIAR internal review of future directions for ACIAR-supported beef research in Indonesia stated that ‘ACIAR had very little knowledge of the context in which beef production is taking place’ and that ‘…we know very little about how the sector is responding to rapid change’. It was concluded that ACIAR should aim to gain a better understanding of the situation by, among other things:
− postponing funding further technical/policy intervention research until the research topics for which there is effective demand for ACIAR inputs to the beef sector could be identified
− impact assessments of major investments in beef production science, for example those in forages planted for livestock feed, were conducted.
1.1 Areas of activity
The involvement of the Australian Centre for International Agricultural Research (ACIAR) in forages research and development (R&D) began in the early 1980s as a new, stand-alone forages subprogram—the ‘FOG’ series—in the broader agronomy program. However, the investment in forages then shifted into the livestock area, reflecting recognition of the need to focus on utilisation or demand for forages in the context of other opportunities for improving livestock performance (genetics, disease control, management). Further, forages (especially pastures) began to have a greater role in the broader, natural-resources management area.
A review of forage-related investment by ACIAR shows that there are six broad areas of investment:
forages for red soils in China
forages integrated into crop–livestock systems of eastern Indonesia
forages for other smallholders in South-East Asia
leucaena
forages in plantation crops
other.
This impact assessment is focused on forages integrated into crop–livestock systems of eastern Indonesia.
1 ACIAR’s forage R&D investment

16 ACIAR investment in research on forages in Indonesia (IAS 65)
there may be more attractive options for investment or perhaps there is a perception of unacceptable risk associated with the change.
2.2 Research investment
2.2.1 Review: research undertaken
Six related ACIAR ‘forage research’ projects have focused on improving the adoption of productivity-improving technologies and thus the incomes and livelihoods of crop–livestock smallholders in eastern Indonesia:
AS2/2000/124: Prospects for improving integration of high quality forages in the crop livestock systems of Sulawesi
AS2/2000/125: Optimising crop–livestock systems in West Nusa Tenggara province
AS2/2000/103: Developing an integrated production system for Bali cattle in the eastern islands of Indonesia
LPS/2004/005: Improving smallholder crop–livestock systems (Sulawesi, Lombok and Sumbawa)
SMAR/2006/061: Building capacity in the knowledge and adoption of Bali cattle improvement technology in Sulawesi
2.1 Context
Demand for livestock products is expanding rapidly in the tropics, and is having a major impact on household and regional economies. These changes are reported as having had a profound impact on the cattle industry of eastern Indonesia, where high beef prices fuelled by increased demand in Java has led to a rapid decline in numbers of the Bali breed of cattle, including breeding animals. Increased supply has been primarily met through beef and live-cattle imports from Australia.
While the strong growth in demand does provide opportunities for farmers to increase income from livestock production and improve the economic sustainability of their farming enterprises, some major constraints (e.g. animal feed shortage, poor animal management and health) have been identified. Planting and use of improved forages has the capacity to overcome these constraints, but also introduces conflicts with resource demands (land and labour) and with traditional cropping systems. While previous research has identified many forage species that are well adapted to mixed crop–livestock farming systems, their adoption has been limited, even where participatory research has suggested a good fit with farmers’ needs (Pengelly and Lisson 2001). A starting hypothesis to explain this was that farmers may not be convinced that the advantages of new forages outweigh the costs of such an activity:
2 Impact assessment: forages and integrated crop–livestock management, eastern Indonesia

ACIAR investment in research on forages in Indonesia (IAS 65) 17
in some areas and a rice – dry-season crop (such as maize or peanuts) in other areas. Although there is a range of systems, typically one of two head of cattle are grazed on rice stubble after harvest, on communal land or fed cut grass carried from communal or other land not necessarily close to the house, with the cattle tethered, usually in a kandang adjacent to the house.2 The reasons why farmers were reluctant to adopt new technological options were also examined within the systems approach.
As well as trials of forage species suitable for backyard forage production, the project used a farming systems approach to investigate the benefits of new forages to
2 A kandang is typically a covered stall where cattle are tethered for feeding. Small landowners have a kandang where one or two cattle are feed. Cattle are usually walked to grazing areas during the day and fed cut forage in the kandang of an evening. With improved forages, cattle are more often totally fed from cut-and-carried forage. On Lombok, community kandangs dominate. Community kandangs might have 20 or more stalls, each stall managed by a farmer. Again, cattle are typically grazed outside of the kandang during the day and tethered and fed cut forages of a night. The collective kandangs also provide security against theft as cattle owners take it in turns to watch over the cattle at night.
SMAR/2006/096: Scaling-up herd management strategies in crop–livestock systems in Lombok.
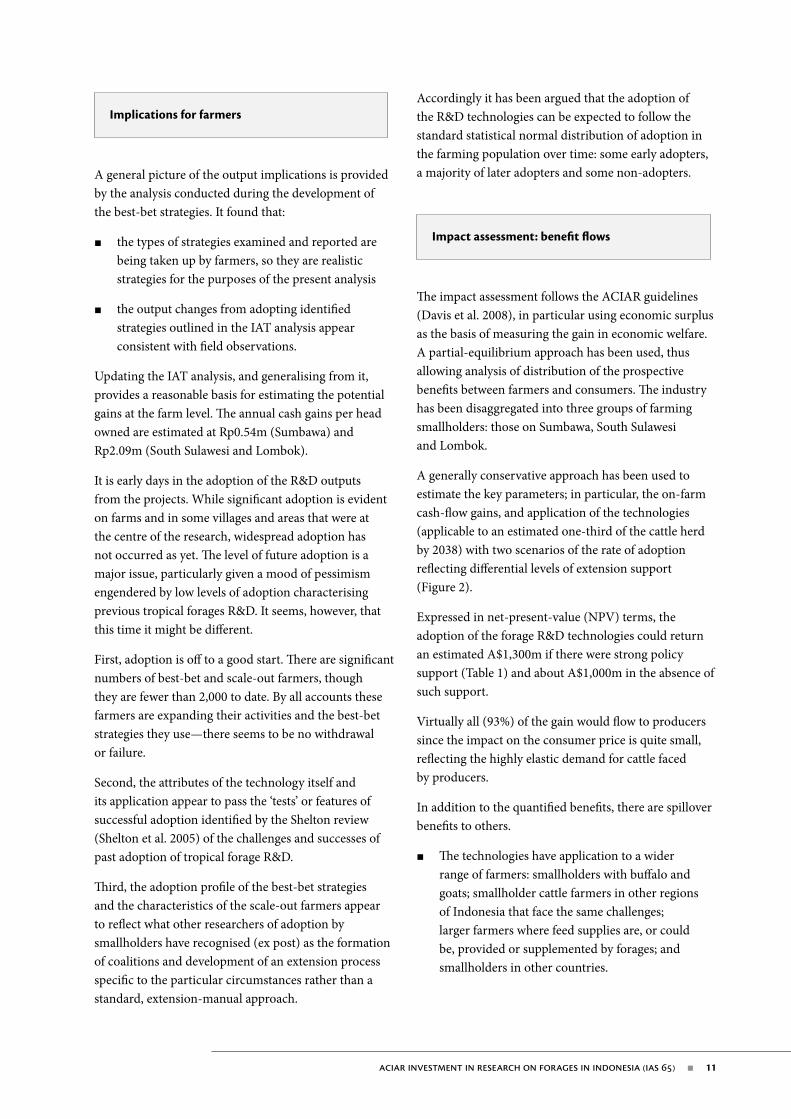
The broad relationship and objective of each is shown in Figure 3 with the scope and outcomes of the research outlined below.
AS2/2000/124 (January 2001 – June 2004)
AS2/2000/124 examined the prospects for improved integration of high-quality forages in the crop–livestock systems of Sulawesi. Sulawesi is viewed as having the potential to increase (beef) cattle production. Nutrition has been identified as the major constraint to increased cattle productivity. Research over the past 20 years had identified a range of forages that are well suited to mixed cropping–livestock systems in the tropics, although adoption of these forages by farmers has been very limited. The project investigated the feed supply per se and forage-quality constraints through comparisons of farming systems with differing agroecological potential.
The project concentrated on smallholder farmers operating rainfed mixed farming systems of rice–cattle or estate crops – cattle. Cropping (primarily rice) is confined to the wet season, but there is some rainfall in most months, enabling two or three rice crops
Figure 3. ACIAR’s integrated forage and smallholder crop–livestock R&D projects in Indonesia
Developing a farming- systems approach to identify opportunities and constraints
Developing and trialling ‘best-bet’ strategies
Scaling out and scaling up: training and employing on-ground extension teams; working with extension and policy agencies
SMAR/2006/061(Sulawesi)
SMAR/2006/096(Lombok)
AS2/2000/124(Sulawesi)
AS2/2000/125(Sumbawa)
AS2/2000/103(Lombok)
LPS/2004/005 (Sulawesi, Lombok (Mertak) and Sumbawa)
18 ACIAR investment in research on forages in Indonesia (IAS 65)
The primary aim of this project was to explore options for increasing the productivity of livestock enterprises in the crop–livestock systems practised in semi-arid Sumbawa.
The basis of this project (and also of AS2/2000/124) was that the development of simulation models can enhance the understanding of crop–livestock systems, promote the more efficient use of existing resources and identify options for intervention that may be difficult or impossible to detect by conventional experimentation.
There were substantial increases in capacity in the modelling of crop–livestock systems (in this project as well as AS2/2000/124) in both Australia and Indonesia, and significant progress towards a functional model based on data collected at the sites in both Sumbawa and South Sulawesi (AS2/2000/124). This is the first time that such an integrated model has been developed.
AS2/2000/103 (January 2001 – December 2004)
This project, although not directly focused on forages, is relevant to the impact of forage work in Indonesia because of the subsequent application of its findings and capacity building as an input into LPS/2004/005.
The low weight of cattle for sale, and declining cattle numbers, are recognised as constraints to poverty alleviation in eastern Indonesia. A major limitation to beef production has been the poor reproductive performance of particularly Bali-breed cattle, expressed as long inter-calving intervals (18–24 months) and high calf mortalities (up to 30%). The major reasons for these problems were identified as poor nutrition and poor timing of peak nutritional requirements against availability of feed.
This project established an integrated management system designed to increase weaning rate and growth of cattle for sale. This was backed by a technical extension package in reproduction and nutrition, with an emphasis on system development, and identification of low-cost supplementation strategies.
A simple and practical method using the twin strategies of controlled mating (one bull, 3-month mating period) and weaning calves at 6 months was developed. After extensive consultation with all farmers in Kelebub village in Lombok, the cows kept were in better condition, were less costly to feed and cycle post calving, and calves grew faster with preferential feeding. Over
improve production in mixed crop–livestock systems and to quantify these benefits using biophysical and economic measures. Thus, the whole-of-farm and income situation with and without adoption could be detailed. A series of models was developed using benchmarking data collected in the project and combined operationally in a transparent and user-friendly spreadsheet described as the integrated analysis tool (IAT). The IAT was intended to be used by local researchers to identify options and strategies for improving productivity and incomes, recognising that, in sustaining the research effort and moving to extension, training would require additional resources.
AS2/2000/125 (January 2001 – March 2004)
The economy of West Nusa Tenggara is based on agriculture, which contributes 38% of regional GDP and involves 70% of the population. Rice is the staple crop, and maize, mung bean, cashew and coconut are grown as cash crops. Cattle are an important component of the farming systems in the region, with most households owning one to eight head, which are retained as a source of accumulated wealth and provide cash to meet household needs.
As a result of growing regional demand for beef, increasing numbers of cattle, especially females, are being slaughtered. This, combined with poor reproductive rates of cattle, is causing a decline in cattle numbers in the region. Lower returns for rice, and a rapid increase in the price of livestock, have generated interest in increasing animal production in these farming systems.
An important socioeconomic feature of Sumbawa is that many farmers migrated to the area in the mid-1980s, having shifted as part of government-sponsored transmigration programs to increase agricultural production across Indonesia, and have not yet built a full understanding of the limitations and potential of their farming environment.
Integration of profitable livestock enterprises within smallholder farming systems in the region is particularly challenging because the nutrition of cattle is usually poor during the long dry season when forages are in short supply and of low quality. The system analysis approach taken in this project was designed to provide tools to explore a wide range of forage–crop options and trade-offs.

ACIAR investment in research on forages in Indonesia (IAS 65) 19
forage supply and quality (better management of existing forages, such as elephant grass and some tree legumes3 and new forages, both grasses and legumes), extending into feed budgeting
effective herd management (controlled mating; pre- and post-calving cow nutrition; early weaning and associated nutritional requirements)
a better understanding of the trade-offs needed to increase production.
This project explored the merits of an approach for improving livestock production that combined the principles and tools of farming systems analysis and farmer participation. It developed and tested a process that:
began with an extensive benchmarking to understand and quantify how the current farming systems function and the constraints to livestock production
identified potential strategies for overcoming these constraints and assessed their economic, social and environmental viability using a customised whole-of-farm model (the IAT developed in AS2/2000/124 and AS2/2000/125)
‘workshopped’ with farmers the simulated strategies, to come up with a shortlist of feasible, ‘best-bet’ strategies for subsequent on-farm trialling
used on-farm trials to apply the best-bet strategies and engaged the ‘best-bet farmers’ as an extension platform for subsequent extension and communication to other farmers within and beyond the target village.
The approach was applied in selected villages in Sumbawa, South Sulawesi and Lombok.
3 The principal tree legumes are Gliricidia sepium (gliricidia; gamal), Leucaena leucocephala (leucaena; lamtoro) and Sesbania grandiflora (sesbania; turi). In some regions (central Lombok) the turi was being used primarily for food (leaves, seed pods and flowers) and poles for building and, to a limited extent, in cattle rations. In several regions, gamal, although growing naturally, was not being used at all in the feed ration. A key strategy for making better use of tree legumes was identified as cutting and using younger green leaves and stems.
90% of the 100 cows in the village produced a calf, compared with 60% using traditional management methods. A technical extension package was developed through workshops and from results of the management package tested by farmers.
The program both developed and benefited from strong new partnerships between the Indonesian institutions and between them and the Australian institutions.
LPS/2004/005 (January 2005 – June 2008)
The demand for beef cattle has been increasing strongly in Indonesia. This has been viewed as a potential opportunity for smallholder farmers who are the main producers of Bali cattle in Indonesia to improve their economic welfare. However, figures indicate that Bali cattle numbers have actually been declining across most regions of Indonesia over the past decade, leading to a so-called ‘supply deficit’ that was largely being serviced by imports of beef and live cattle from Australia. Against this background, previous research including ACIAR projects AS2/2000/124, AS2/2000/125 and AS2/2000/103, and limited success of government policies to increase cattle numbers (such as artificial insemination and cross-breeding programs) there appeared to be potential to improve farmer incomes through improving Bali-cattle productivity.
This project identified a range of factors that were constraining livestock production in the smallholder farming systems of eastern Indonesia. These included: shortage and poor quality of forages, especially during the dry season; poor knowledge and/or capacity to implement optimal feed-management practices; limited supplies of readily accessible stock water; insufficient access to bulls; inadequate cattle housing; limited labour availability (especially during the main cropping times); extended and suboptimal breeding cycles; diseases; marketing constraints; and limited access for smallholders to the formal credit sector for acquiring cattle and livestock handling materials.
Significantly, most of the technologies needed to overcome these constraints have already been developed in Indonesia or elsewhere, but have yet to be adopted by local farmers. Specifically, the project sought to apply the technologies identified earlier (AS2/2000/124) and focused on three factors to increase production (annual turn-off):

20 ACIAR investment in research on forages in Indonesia (IAS 65)
quantifiable gains in forage and livestock production, labour savings and gains in household income over the life of the project. The increase in expected income (of the order of 50% to 300%) was typically attributed to the sale of additional cattle and the higher price obtained for those cattle
The researchers considered it reasonable to expect that these gains would continue into the future as most farmers intend to continue (and in some cases expand) successful strategies beyond the life of the project. It was reported that there was also evidence of significant adoption/adaptation of the livestock improvement technologies by other (non-project) farmers. This was also expected to extend further to other farmers.
SMAR/2006/061 (July 2007 – June 2010)
SMAR/2006/061 seeks to build capacity in the knowledge and adoption of Bali cattle improvement technology in South Sulawesi. Specific objectives are: to develop, implement and monitor best-bet options with farmers; to support, monitor and evaluate the scale-out process; and to build institutional and community capacity to support adoption. The project builds on cattle- and forage-improvement tools and technologies developed by precursor ACIAR projects, and successfully tested and implemented by ACIAR project LPS/2004/005. The best-bet strategies have been identified as: making better use of existing forages (in particular, elephant grass) in a farming system; introducing new forages; seasonal (controlled) mating to match feed supply and labour availability (given rice-cropping requirements); early weaning; preferentially feeding particular animals; feed budgeting and planning to meet forecast feed demands.
A feature of the project is the employment, through the project, of an ‘on-ground team’ (OGT) to facilitate adoption of best-bet strategies to another group of farmers (in addition to the best-bet farmers in LPS/2004/005) in the three study regions of Gowa, Barru and Bone regencies. It is proposed to learn about the suitability of the OGT approach (for this situation and more generally in facilitating adoption) and assess the potential for the OGT to further facilitate adoption beyond the project. The OGT comprises 13 recent graduates with experience in smallholder systems and all with regional language skills. The OGT received practical training from Sulawesi and Australian
The project concluded that the feedback from farmers and the results from monitoring the on-farm trials indicated that the participatory, farming systems approach was successful.
The project final report concluded that there was a range of evidence to support this approach when applied in the smallholder situation in eastern Indonesia:
quantifiable gains in forage and livestock production
labour savings and gains in household income
the intention of most farmers to continue successful strategies
evidence of significant adoption/adaptation of the livestock improvement technologies by other (non-project) farmers.
The pathways to adoption of livestock improvement strategies were reported as varying with the region and the technology concerned. Strategies requiring more skill and knowledge to implement, and for which the implications are more complex and less predictable (e.g. changing feed availability or the breeding cycle) required greater input from the project team and benefited most from the modelling analysis. The involvement of village ‘champions’ was instrumental in fostering uptake in two of the focus sites.
The project concluded that the apparent success of the approaches developed and tested in this project provided support for wider adoption in other regions of Indonesia.
Scientific outputs included the development of an approach combining the principles of participatory, on-farm engagement with farming system analysis and modelling to encourage the uptake of technologies that improve the productivity and welfare of smallholder farmers. The project noted that the approach and tools are generic and could be readily adapted for application in other environments and to tackle other farming systems issues.
The project reported significant increase in capacity building by individuals and institutions.
In terms of economic and community impacts the project reported that the feedback from farmers and the results from the monitoring of field trials showed

ACIAR investment in research on forages in Indonesia (IAS 65) 21
bull rather than free mating (thereby ensuring controlled mating with an emphasis on a calf from each cow every year)
improving forage resources, starting with nurseries and small demonstration areas established by the OGT and farmers at each participating kandang to demonstrate new forages, forage management, and balanced rations and other aspects of animal nutrition for improving productivity
introduction of additional breeding and management strategies shown to be successful in previous ACIAR projects (in particular early weaning and preferential feeding of calves).
The OGT comprises 12 graduates/recruits with smallholder experience and relevant language skills, plus a project officer to facilitate coordination.
As with SMAR/2006/061, a project management team, a project specialist team and an advisory committee were established.
2.2.2 Agencies and countries involved
CSIRO Sustainable Ecosystems, Australia, is the commissioned agency for the all of the projects except AS2/2000/103. Collaborating Indonesian institutions are:
Assessment Institute for Agricultural Technology, Nusa Tenggara Barat (Balai Pengkajian Teknologi Pertanian)
Assessment Institute for Agricultural Technology, South Sulawesi
Hasanuddin University
University of Mataram
Livestock Services of Nusa Tenggara Barat Province
Livestock Services of South Sulawesi Province.
Project AS2/2000/103 was led by the University of Queensland, Australia, with the collaborating agencies comprising:
Universitas Nusa Cendana, Indonesia
Queensland Department of Primary Industries and Fisheries
specialists. To ensure effective project coordination and delivery, a project management team (operations and coordination) and a project specialist team (technical expertise, training the OGT) were established. In addition, a steering committee comprising representatives from Dinas Peternakan at provincial and regency levels, Universitas Hasanuddin and CSIRO, provides overall guidance and advice on the direction of the project.
The modality employed in this project is outlined in the project objectives as the model for extension services in Sulawesi.
An adoption study was begun in late 2009. Semi-structured interviews were used to understand household decision-making processes for adoption, and social network analysis was used to examine which people and institutions are influential in information transfer and exchange. Further, data are being collected from project LPS/2004/005 farmers in Barru, Gowa and Mertak to enable a review of the biophysical and social impacts. With these farmers now engaged with the projects for 5 years, it should be possible to test the hypothesis that changes in farm practices lead to biophysical impacts that lead, in turn, to increased incomes and changes in livelihood.
SMAR/2006/096 (July 2007 – June 2010)
SMAR/2006/096 involves scaling-up herd-management and forage-production strategies in crop–livestock systems in Central Lombok. In contrast to Sulawesi and Southern Lombok, Central Lombok is generally characterised by community kandangs in which Bali cattle are tethered in individual farmer-managed shed areas (at least at night) within a fenced compound (guarded at night by members of the kandang) to provide night-time security from poachers. During the day cattle are either grazed on individual members’ farms, on community areas or fed using forage cut and carried to the kandang.
A three-step approach to adoption of livestock technologies is being used, based on farmer perceptions of need and potential for improvement:
improvement of existing kandang facilities (drainage in particular and construction of a bull and calf pen—encouraged by a small contribution of project funds, but mainly funds/labour from member farmers) and provision of a communal

22 ACIAR investment in research on forages in Indonesia (IAS 65)
2.2.4 Total expenditure on the research
Total investment in the seven projects (ACIAR and agency contributions) is given in Table 3. Total real expenditure, expressed in present values (2009), is estimated at A$11.37m.
2.3 Outputs of the research
2.3.1 Overview
The key outputs of the research are as follows:
Identification of appropriate forage species for smallholder backyard production, including utilisation of SoFT (Selection of Forages for the Tropics), a computer-based system enabling selection of ‘elite’ forage accessions for specific farming systems and environments. (SoFT was developed through a previous ACIAR-funded project—AS2/2001/029: Development of a knowledge system for the selection of forages for farming systems in the tropics.)
University of Mataram, Indonesia
Balai Pengkajian Teknologi Pertanian, Indonesia.
2.2.3 Previous research
The six ACIAR-funded Indonesian forage projects studied here build on an earlier ACIAR project (FOG/1984/071: Forage and plant nutrition coordination) and previous research undertaken by CSIRO and the International Center for Tropical Agriculture (CIAT). However, the earlier research focused primarily on technology development, in terms of the identification of appropriate species and associated farm-level management, whereas the focus of the six Indonesian projects being assessed is the development of integrated farming systems with an underlying emphasis on identifying/developing systems that have the potential for adoption. In other words, the latter body of research recognised that while there has been substantial previous investment in forages the level of adoption by smallholders has been less than expected.
Table 3. Project investment: ACIAR expenditure and agency contributions on the seven forage-research projects in dollars of the day and real 2009 present values (A$m)
Dollars of the daya Real present valueb
ACIAR Other agenciesc
Total ACIAR Other agenciesc
Total
FOG/1984/071 0 .18 0 .05 0 .23 1 .22 0 .31 1 .53
AS2/2000/124 0 .40 0 .45 0 .85 0 .67 0 .74 1 .41
AS2/2000/125 0 .35 0 .32 0 .67 0 .60 0 .52 1 .12
AS2/2000/103 0 .45 1 .00 1 .45 0 .78 1 .80 2 .58
LPS/2004/005 0 .88 0 .57 1 .45 1 .13 0 .73 1 .86
SMAR 2006/061 1 .00 0 .27 1 .26 1 .06 0 .29 1 .35
SMAR/2006/096 1 .00 0 .27 1 .27 1 .19 0 .33 1 .52
Total 4 .25 2 .93 7 .18 6 .66 4 .71 11 .37
a Dollars of the day: total expenditure, unadjusted for inflation and the opportunity cost of money (discount rate)b Present value (real 2009 prices): dollars of the day expenditure converted to 2009 prices using the CPI and to 2009 present values using a
5% discount rate .c Predominantly CSIRO Sustainable Ecosystems, but includes in-kind contributions by the University of Queensland, Balai Pengkajian
Teknologi Pertanian, Indonesian universities and Dinas Peternakan
Source: data from ACIAR and CSIRO, and IDA Economics estimates

ACIAR investment in research on forages in Indonesia (IAS 65) 23
Monitoring of the extent (numbers of farmers), nature (which best-bet strategies) and effects (e.g. changes in calf mortality, weight gain, turn-off) of adoption, initially and over time.
Capacity building within the research agencies within Indonesia.
In addition, many articles for professional journals, conference presentations, university course lectures and extension materials (for both training extension staff and for direct use by farmers) have been prepared in association with the delivery of these outputs.
Figure A1 in the appendix maps project outputs and expected outcomes and impacts.
2.3.2 Implications for farm productivity
The implications for farm productivity of adopting individual best-bet strategies are being documented as part of the current work of the OGTs and will be further examined through a survey undertaken in 2009.
A general overview of the productivity implications is provided through the analysis conducted during the development of the best-bet strategies. Using the IAT, the project team reported the implications of selected intervention and management strategies.
Two comments are pertinent.
The types of strategies examined and reported are being taken up by farmers. Evidence for this comes from the research project exit interviews of best-bet farmers, subsequent OGT and project reports, and field observations. The strategies can therefore be deemed realistic for the purposes of the present analysis.
The productivity changes from adopting identified strategies outlined in the IAT analysis appear consistent with field observations. The dominant message during field discussions with best-bet and scale-out farmers was that they had sold more cattle than before, and/or that they now have a larger herd than before, and/or that their cattle were in much better condition, and that they had saved labour. Farmers attributed these changes to the adoption of one or more best-bet strategies: an entirely credible outcome given the forage crops that were now being grown by these farmers and others, and other readily observable changes such as calving time and forage conservation.
Demonstration that using a whole-of-farm or systems approach to the smallholder farming systems could improve understanding of the opportunities for integrating crops and livestock, the constraints to forages adoption and the benefits of adoption, and could help identify promising options for future work.
Development of the IAT as means of facilitating adoption—by helping researchers, advisors and farmers understand the potential economic and other benefits of improved forages and improved livestock-management strategies as a means of creating awareness, interest and ‘demand’ for adopting these improvements.
Demonstration that a researcher–farmer participatory approach to the short-listing of strategies for adoption of forage R&D is practical and, in the present context, successful in delivering best-bet strategies that participating farmers said they were adopting or for which monitoring indicates full or partial adoption.
Identification, through the above processes, of five main, best-bet strategies for improving livestock productivity and farm income for smallholders. The main strategies, which vary in relative importance to some extent between agricultural regions and farming systems, are as follows:
− making better use of existing forages
− new forages
− controlled mating
− early weaning
− feed budgeting, including ration mix and forage conservation.
Delineation of probable gains in output (cattle turn-off) and labour savings from adopting one, or more, best-bet strategies.
Demonstration that an OGT approach to extension of research results (best-bet strategies) to a wider group of farmers can be successful; that is, demonstrating that recruiting a team of purpose-focused and appropriately skilled and resourced ‘extension’ staff working one on one with farmers can deliver change at the farm level.
24 ACIAR investment in research on forages in Indonesia (IAS 65)
apparent among scale-out farmers, although this was difficult to judge given the small numbers of scale-out farmer interviews.
In Central Lombok (where growing elephant grass has been historically less important), group decisions about controlled mating and weaning were of more initial importance, combined with new forages and the addition of tree legumes. The Mertak experience supports the view that forage plantings combined with legume supplements (mostly tree legumes) are the key first steps undertaken by farmers. As a general observation, forage conservation through storage of crop residues does not seem to be the first strategy adopted nor is it widespread as yet. That said, the use of rice straw, mostly untreated, was a significant change in Mertak. Cutting tree legumes was an immediate strategy in Mertak, as the trees were already well established but not utilised as forage. An important issue not explicitly noted in the IAT scenario summaries is the underlying importance of feed plans as a driver or complement to planting new forages, use of legumes and changes in cattle management.
The extent of change among farmers should not be underestimated. Indeed the increase in cattle prices (Figure 4), combined with the opportunities created by the new forage technologies, appears to be encouraging some smallholders to review land use and increase the proportion of land used for forage. At least one of the best-bet farmers had totally withdrawn from rice production (even given the 2007 rise in rice prices) and now produces only forage for his cattle; another was seriously contemplating such a move.
Moreover, the price increase since 2007 is expected to hold or rise further, given increasing Indonesian and world beef demand as per-capita incomes rise, combined with limited growth in world beef and live cattle supply. Indonesian consumption, imports and retail prices are forecast to increase over the coming decade (Table 5), suggesting that farm-level cattle prices will also increase.
The changes in forage production and management observed in the field broadly accord with scenarios 5, 7 and 8 for SPA (suggesting an annual cash balance gain of Rp0.54m per head owned on an equal weighting of scenarios) and scenarios 3, 4, and 5 for South Sulawesi (an annual cash balance gain of Rp2.09m on equal weighting of scenarios). The much smaller gain in SPA
The IAT identified that labour saving has several important effects. Labour involved in herding cattle or cut-and-carry systems has an opportunity cost. During the rice-growing season, labour released from cattle husbandry can be used for better management of rice crops (such as weeding), which is reportedly leading to higher rice yields. Several farmers noted that the increased time was being used to spend more time with their family or by their wives to operate small businesses (such as a local kiosk or making and selling craftwork). A further side effect of the change in husbandry systems to cut and carry using nearby forage was the greater opportunity for wives, children and parents to undertake the cut-and-carry work, thus converting under-employment into employment and again freeing up more time for the farmer. Field observations supported this conclusion.
In the absence of a detailed survey of strategies adopted, and their immediate and longer term implications for farm output and incomes in the context of the range of farm situations, a generalised estimate has been used for present purposes. Published IAT analysis has been adopted as the underlying basis of these estimates. The investment in developing the IAT and associated databases suggests that the analysis is both systematic and comprehensive. Further, use of the IAT output to develop subsequent best-bet strategies in working sessions with farmers suggests that the scenario analysis has credibility and support.
IAT modelling results for SPA village on Sumbawa and Barru Regency on South Sulawesi (Table 4), have been adjusted to reflect higher (50%) cattle prices since the time of the IAT analysis (Figure 4), with cattle income estimated to represent 20% of the 5-year accumulated cash balance: a net increase of 10% in the accumulated cash balance.
Data collected during the ACIAR project research phase suggested that the best-bet farmers had adopted most of the best-bet strategies. This was confirmed during the field visits, although the predominant change appeared to be better managing existing forages, planting new forages, use of tree legumes and controlled mating. For the scale-out farmers in South Sulawesi, the principal changes appeared to be planting new forages (and often a larger area) and the use of tree legumes. Changes to mating practices, including early weaning and associated preferential feeding, were less

ACIAR investment in research on forages in Indonesia (IAS 65) 25
Tabl
e 4.
Est
imat
ed a
nnua
l cas
h ga
ins,
base
d on
inte
grat
ed a
naly
sis to
ol d
eter
min
atio
ns, f
rom
ado
ptin
g va
rious
fora
ge te
chno
logi
es in
Sum
baw
a an
d So
uth
Sula
wes
i
Opt
ion
Cut a
nd
carr
y (k
g/da
y)
Cat
tle
sold
ove
r 5
year
sa
Cat
tle
on
hand
aft
er
5 ye
ars
Ann
ual
fodd
er
surp
lus
(kg/
year
)
Seco
nd
dry
seas
on
labo
ur
(day
s)
Fina
l cas
h ba
lanc
eb
(Rup
iah
(Rp)
m
illio
n)
Cat
tle
sold
re
lati
ve to
ba
selin
e (n
umbe
r)
Cas
h ba
lanc
e co
mpa
red
to
base
line
(Rp
mill
ion)
Cas
h ba
lanc
e ga
in p
er h
ead
catt
le a
t be
ginn
ing
(Rp
mill
ion)
Per a
nnum
ca
sh g
ain
per
head
ow
ned
at
begi
nnin
g (R
p m
illio
n)
SPA
vill
age,
Sum
baw
a (2
009
pric
es)
Curr
ent b
asel
ine:
Wet
seas
on: 0
.6 h
a lo
wla
nd ri
ce, 0
.3 h
a up
land
pea
nut,
2 co
ws
256
4–3
,000
–20
2 .86
Scen
ario
1: P
lus 8
0% re
tent
ion
of p
eanu
t res
idue
s
259
4–2
,000
604 .
293
1 .4
0 .36
0 .07
Scen
ario
2: P
lus 0
.4 h
a of
ele
phan
t gra
ss o
n up
land
256
440
090
3 .85
01 .
00 .
250 .
05
Scen
ario
3: P
lus 2
00 m
of g
liric
idia
on
upla
nd
256
4–2
,000
03 .
960
1 .1
0 .28
0 .06
Scen
ario
4: a
ll 3
scen
ario
s com
bine
d
259
41,
200
906 .
053
3 .2
0 .80
0 .16
Base
line
2 : W
et se
ason
: 0 .6
ha
low
land
rice
, 0 .3
ha
upla
nd p
eanu
t, 20
0 m
of t
ree
legu
me,
0 .4
ha o
f ele
phan
t gra
ss (S
cena
rio 4
)
Scen
ario
5: B
asel
ine
2 pl
us se
ason
al m
atin
g of
cow
s
2511
212
0090
6 .82
54 .
00 .
990 .
20
Scen
ario
6: A
s for
Sce
nario
5 b
ut w
ith 2
0% lo
wer
bee
f pric
es
2511
212
0090
4 .95
52 .
10 .
520 .
10
Base
line
3 : W
et se
ason
: 0 .6
ha
low
land
rice
, 0 .3
ha
upla
nd p
eanu
t, 20
0 m
of t
ree
legu
me,
0 .4
ha o
f ele
phan
t gra
ss, s
easo
nal m
atin
g, 2
5 kg
cut
and
car
ry (S
cena
rio 5
)
Scen
ario
7: B
asel
ine
3 pl
us 2
ext
ra b
reed
ing
cow
s, 40
kg
cut a
nd c
arry
4021
4–5
0040
12 .3
215
.09 .
52 .
370 .
47
Scen
ario
8: B
asel
ine
3 bu
t sel
ling
at 2
yea
rs o
ld w
ith 3
5 kg
cut
and
car
ry
359
4–5
0090
21 .5
63 .
018
.74 .
680 .
94

26 ACIAR investment in research on forages in Indonesia (IAS 65)
Perc
enta
ge
crop
re
sidu
e re
tent
ion
Cut a
nd
carr
y (k
g/da
y)
Cat
tle
sold
ov
er 5
yea
rsFo
dder
(k
g/ye
ar)
Labo
ur
bala
nce
5-ye
ar c
ash
bala
nce
(Rp
mill
ion)
Cat
tle
sold
re
lati
ve to
ba
selin
e (n
umbe
r)
Cas
h ba
lanc
e co
mpa
red
to
base
line
(Rp
mill
ion)
Cas
h ba
lanc
e ga
in p
er h
ead
catt
le a
t be
ginn
ing
(Rp
mill
ion)
Per a
nnum
ca
sh g
ain
per
head
ow
ned
at
begi
nnin
g (R
p m
illio
n)
Barr
u Re
genc
y, S
outh
Sul
awes
i (20
09 p
rice
s)
Base
line:
Wet
seas
on: 0
.54
ha lo
wla
nd ri
ce, 0
.3 h
a up
land
pea
nut,
2 co
ws
80 p
eanu
t30
6–3
,000
defic
it15
.4
Scen
ario
1: B
asel
ine
plus
ferm
ente
d 40
% o
f ric
e st
raw
80 p
eanu
t30
7–2
,000
defic
it24
.21
8 .8
4 .4
0 .9
Scen
ario
2: B
asel
ine
plus
0 .3
ha
of N
apie
r gra
ss o
n up
land
80 p
eanu
t30
6–3
,000
defic
it15
.40
00 .
0
Scen
ario
3: B
asel
ine
plus
+ 2
00 m
of g
liric
idia
on
upla
nd
80 p
eanu
t30
7–1
,000
surp
lus
19 .8
14 .
42 .
20 .
4
Scen
ario
4: W
et se
ason
: 0 .5
4 ha
low
land
rice
, 0 .3
ha
upla
nd p
eanu
t, 20
0 m
of t
ree
legu
me,
0 .3
ha o
f Nap
ier g
rass
, 40%
rice
ferm
ente
d, 4
cow
s
80 p
eanu
t50
140
surp
lus
41 .8
826
.413
.22 .
6
Scen
ario
5: A
s for
Sce
nario
4 p
lus s
easo
nal m
atin
g of
cow
s
80 p
eanu
t50
17–2
,000
surp
lus
47 .3
1131
.916
.03 .
2
a C
attle
pric
es (2
004)
: wea
ners
Rp1
0,00
0/kg
; 2-y
ear-o
lds R
p15,
000;
old
er c
attle
Rp1
2,00
0/kg
live
wei
ght;
fem
ales
Rp5
00,0
00 a
nd m
ales
Rp6
00,0
00b
Incl
udes
cas
h fro
m a
ll so
urce
s inc
ludi
ng ri
ce sa
les a
nd c
attle
sale
s, le
ss c
ash
purc
hase
s of f
arm
item
s, ca
ttle
and
con
stan
t mon
thly
hou
seho
ld li
ving
exp
ense
s .
Sour
ces:
McD
onal
d et
al . (
2004
), M
acLe
od e
t al . (
2007
) and
IDA
est
imat
es
Tabl
e 4.
(co
ntin
ued)

ACIAR investment in research on forages in Indonesia (IAS 65) 27
IAT analysis that the cash balance gains come from both more cattle and selling cattle at increased weights and in better condition (Box 1). However, these farmers were reporting markedly higher cattle prices than implied in the IAT analysis, even with the upward adjustment to prices. Farmers consistently reported sale prices of the order of Rp3m for a weaned calf at 7 months and between Rp10 and 12m/head for a fattened young bull (up to 2 years old). Further, many farmers reported the ability to now sell one or more additional animals per year, suggesting that the cash balance gains could be several times that suggested by the IAT.
2.4 Adoption pathway
It is early days in the adoption of the R&D outputs from the projects. While significant adoption is evident on farms and in some villages and areas that were at the centre of the research, widespread adoption has not occurred as yet. Accordingly, the following analysis examines adoption to date and forecasts of future adoption separately.
is surprising (given the additional number of cattle sold), and appears to reflect much lower sale weights and prices than on South Sulawesi.4
Unlike for Sumbawa and South Sulawesi, the IAT was not used to help develop best-bet farmer strategies for Central Lombok, in part because revision would have been required given the different cattle management systems and the prime focus of the Central Lombok work was the introduction of controlled mating and greater efficiency in mating (substantially fewer bulls). However, it appears that from field observations and discussions with farmers that the cash balance gains are likely to be comparable with those estimated for South Sulawesi.
Based on field observations and discussions the aforementioned productivity increases and resulting income gains seem conservative. Discussions with best-bet farmers and scale-out farmers5 reinforce the
4 Even so the results seem questionable. Sale of an additional animal appears to return around Rp0.8m, which on the prices quoted of at least Rp10,000/kg suggests a sale weight of only 80 kg.
5 The term ‘scale-out farmers’ refers to other farmers adopting the technology; that is, farmers in addition to the so-called best-bet farmers.
Figure 4. Cattle prices Indonesia, 2005–09. Source: Dinas Peternakan, Nusa Tenggara Barat
-
5,000
10,000
15,000
20,000
25,000
30,000
Jan
05
Ap
r 05
Jul 0
5
Oct
05
Jan
06
Ap
r 06
Jul 0
6
Oct
06
Jan
07
Ap
r 07
Jul 0
7
Oct
07
Jan
08
Ap
r 08
Jul 0
8
Oct
08
Jan
09
Ap
r 09
Jul 0
9
Pric
e p
er h
ead
(ru
pia
h/k
g li
ve w
eig
ht)
Lombok
Sumbawa

28 ACIAR investment in research on forages in Indonesia (IAS 65)
Tabl
e 5.
Cat
tle n
umbe
rs, a
nd b
eef p
rodu
ctio
n, c
onsu
mpt
ion
and
pric
es in
Indo
nesia
, 200
8–20
18 (f
orec
ast)
2008
2009
2010
2011
2012
2013
2014
2015
2016
2017
2018
Cat
tle
num
bers
Cat
tle in
vent
orie
s (be
ginn
ing)
(m
illio
n he
ad)
11 .5
11 .6
11 .7
11 .9
12 .1
12 .3
12 .5
12 .7
13 .0
13 .1
13 .3
Live
cat
tle im
port
s(‘0
00 h
ead)
456
545
571
563
564
572
580
590
598
605
614
Beef
and
vea
l
Prod
uctio
n(’0
00 t)
464
469
475
480
488
494
501
506
512
518
523
Begi
nnin
g st
ocks
00
00
00
00
00
0
Dom
estic
supp
ly46
446
947
548
048
849
450
150
651
251
852
3
Cons
umpt
ion
477
480
488
504
520
540
560
584
607
629
650
Endi
ng st
ocks
00
00
00
00
00
0
Dom
estic
use
477
480
488
504
520
540
560
584
607
629
650
Net
trad
e (im
port
s)–1
3–1
1–1
3–2
3–3
2–4
6–5
9–7
7–9
4–1
11–1
27
Reta
il pr
ice
(rup
iah/
kg)
61,3
9465
,258
67,1
8567
,465
68,5
6069
,249
70,0
0870
,450
71,0
5271
,609
72,2
10
Per c
apit
a co
nsum
ptio
n(k
g)2 .
02 .
02 .
02 .
12 .
12 .
22 .
22 .
32 .
32 .
42 .
5
Sour
ces:
Food
and
Agr
icul
tura
l Pol
icy
Rese
arch
Inst
itute
; and
200
9 U
S an
d W
orld
Agr
icul
tura
l Out
look
at <
http
://w
ww
.fapr
i .iast
ate .e
du/o
utlo
ok/2
009/
>

ACIAR investment in research on forages in Indonesia (IAS 65) 29
Farmers reported significant gains from adopting some or several best-bet strategies, although it has to be recognised that underlying increases in cattle prices have contributed to the reported gains. Further, some of the changes to cattle sales outlined by farmers reflect cattle sales to meet special ‘one-off ’ needs (such as weddings) in addition to more or less annual commitments such as education or religious occasions. Comments included:
Previously I walked cattle to off-farm grazing in the mountains. Now I have planted elephant grass and paspalum. The paspalum grows very fast and I have it in my garden (for easier cut and carrying). Now I grow 1 ha of paspalum (and some gamal) and still have my rice (< 1 ha). I used to have just two head of cattle; now I have nine (I need about 0.1 ha for forage for each animal, little bit less for young cattle). I can keep the younger ones and fatten them. I have the kandang in the middle of the garden which makes cut and carry and manure management easier. I now sell young cattle for Rp2m more and the bull for Rp5m more (bigger bull and better prices as it is in better condition). Also, the trader comes looking for my cattle which gives me a little more bargaining power and I am no hurry to sell as I have my forage crops. I am looking to rent land to grow more forage. I have been helping others to grow forages too by giving them paspalum cuttings and I mostly sell the gamal poles for planting material for Rp100 each (as there is a lot of demand). Some come here to get it; I send it to others on the bus. About 100 farmers have copied me. Farmer groups and students come to look and copy what I have done.
Before I had four cows and sold the calves for Rp2.5m each. Now I have eight cows and have sold young cattle at Rp6m. Yes the price of cattle has risen but the cattle I can now sell are bigger and in better condition. The trader now comes to me to seek out the cattle and he sees the quality difference. Other farmers are now following what I am doing.
I have a bull and two cows. I cut and carry elephant grass. It is a long distance to carry but I have no land close by. I have cocoa but it is too shady for forages. Need 20 kg/day to feed the bull in the kandang. With forages in the garden I can take a short cut and reduce the time required, and the bull fattens faster.
Before I had just two cows. Now I have three cows, one bull and one calf. I kept a heifer and so had another breeding unit. They’re all healthier—brighter skin colour.
The survey findings from participating kandangs in Central Lombok point to significant productivity gains through lower calf mortality (down from 15% to 5–6%); higher turn-off (given the focus and achievement of ‘a calf from each cow each year’) and higher weaning and sale weights. These gains are attributable to a mix of strategies including controlled mating (and initial bull supply under a Dinas program); improved forage options (enhancing fodder production and quality of fodder); early weaning and preferential feeding of weaned calves and cows before and after calving. The lower calf mortality is worth on average Rp100,000/cow/annum given calf prices of around Rp1m/head.
In addition, several farmers are now using the effluent to produce biogas, a household cost saving not included in the IAT analysis since it was not recognised at the time. The forage technologies favour feeding in kandangs. This provides an opportunity to use the resulting concentrated location of manure for biogas production. One farmer outlined the gains as follows:
continued …
Box 1. Farmer comments on productivity change

30 ACIAR investment in research on forages in Indonesia (IAS 65)
Lombok
Central Lombok
− Two kandangs used for OGT training plus 12 kandang communities were selected by early 2008 for implementing best-bet strategies with farmers, including the provision of a community bull and funds for part financing of kandang improvements. A further 12 kandang communities have been selected for the second year of the project, with the remaining five to be selected in 2010 — bringing the total for the project to 31. The number of farmers varies between kandangs (estimated range 10–25) as does the average number of cattle per farmer (estimated range 1–4) and herd structure (e.g. cow(s) and calves, bulls for fattening). A significant change as a result of the controlled mating program is the reduction in bull numbers. The participating kandangs are now using 1 bull (which might service 50 cows owned by kandang farmers and be used by ‘satellite farmers’9) compared to the previous free-mating system of 1 bull to 5 or 10 cows.
− By June 2009, 653 farmers in kandang groups and 385 satellite farmers were reported to have adopted at least one project practice.
9 Satellite farmers are villagers who are not members of the village kandang.
2.4.1 Adoption to date
Adoption to date of the best-bet strategies in full or in part is estimated as follows.6
Sumbawa
From the six best-bet farmers selected in 2006, it is estimated that almost all the farmers in Sumbawa have adopted at least one best-bet strategy. The most evident practice has been the use of the tree legume gamal and lamtoro in the feed ration with the demonstrable evidence the reported virtual conversion of all village roads and tracks to avenues of gamal.7
South Sulawesi
The 60 best-bet farmers have adopted three of the five practices (better use of existing forages, use of introduced forages, and feed budgeting) (SMAR/2006/061 annual report 2009).
To date (June 2009), known8 scale-out is around 145 in Bone (around 7.2 scale-out farmers for each best-bet farmer); 33 in Barru (1.16:1) and 44 in Gowa (2.2:1).
6 Most of the reported adoption is taken from researcher reports and file notes. In addition, field visits were undertaken by the author in May 2009 to farmers and villages in Barru and Bone, Central Lombok and Mertak.
7 J. Corfield, pers. comm.8 Known in the sense that best-bet farmers and/or OGTs
are able to identify the number of scale-out farmers (SMAR/2006/061 annual report 2009)
Box 1. continued …
Rp100,000 per month was the usual gas bill for each of the two households. Now I supply the two families from biogas. Set up cost was about Rp2m (mixer, tank and piping), and while basic it is quite functional and reliable. This cost was recovered in 10 months. It will last several years before major repairs are needed. I am looking to expand the system to supply other neighbours.
This household expense saving is estimated at Rp0.9m per household per annum (allowing 10% of capital cost for repairs and equipment life of 5 years). If taken up by an estimated 20% of farmers adopting the forage technologies it would increase net household income by some Rp0.2m. Using an estimated 2.5 head of cattle per household, this implies a gain of Rp0.08m per head of cattle owned. These gains suggest that wider adoption can be expected.

ACIAR investment in research on forages in Indonesia (IAS 65) 31
Although there is a ‘good story’ from adoption levels to date, an observer of the adoption of tropical forages by smallholders cannot begin the task of considering the future without recalling the conclusion by Pengelly et al. (2003) that ‘Despite 50 years of involvement in forage research in the tropics, forage adoption has been relatively poor across all tropical farming systems’.
It seems, however, that this time the prognosis might be better. First, adoption is off to a good start. As noted above there are significant numbers of best-bet and scale-out farmers. By all accounts these farmers are expanding their activities and the best-bet strategies they use: there does not seem to be withdrawal or failure. Furthermore, the scale-out farmers appear to be planting larger areas than the best-bet farmers, most likely reflecting their innovativeness and the fact that they can build upon the demonstrated achievements of the best-bet farmers: it is less risky than it was for the best-bet farmers. Also, the best-bet farmers were selected because they were willing to cooperate rather than necessarily being identified as leaders or champions.
Second, the attributes of the technology itself and its application appear to pass the ‘tests’ for, or features of successful adoption. The mood of pessimism about the lack of adoption of tropical forage legumes around the world, and concern expressed at the 2001 International Grassland Conference, prompted a survey of the use of tropical forage legumes to examine the extent of adoption and the features of successful adoption (Shelton et al. 2005; see Box 2). During 2001–04, an international working group contributing to the survey systematically identified and considered more than 30 potential success stories. Of these 19 were chosen as having met the criteria for success.11 Two of the successes were in Indonesia.12
11 The criteria for ‘success’ were that: at least 50,000 ha had been planted in farmers’ fields; or at least 50,000 smallholder farmers were using a particular legume in a particular country or region; or the commercial value of a smaller area was particularly significant and sustained.
12 The first was on Nusa Tenggara Timur and involved use of Leucaena leucocephala for erosion control, forage for cattle and wood production, with between 70,000 and 93,000 ha estimated to have been planted. The second was on Lombok, using Sesbania grandiflora in cut-and-carry forage systems, with an estimated 65,000 farmers using the sesbania (Shelton et al. 2005).
South-east Lombok (Mertak)
− Ten best-bet farms were established in Mertak in 2006. All farms have continued with the original best-bet strategies and some have extended to other strategies. Other farmers have adopted some of the best-bet strategies, typically growing some of the new forage grasses and gamal as both are easily established from cuttings and best-bet farmers have been encouraging through both supplying plant material cuttings and other support.
− Given the drier climate there is increased interest in stylo, particularly in areas not currently cropped. Potentially substantial grazing areas will support stylo and gamal. The potential for stylo seed dispersal through dung is already evident and will increase as stylo further establishes itself. There is evidence of innovation as farmers plant grasses on dam beds as water levels drop in the dry season.
2.4.2 Future adoption: issues
A major issue is the level and rate of future adoption of the technologies by smallholders within the villages where the best-bet farmers are located, in other villages and provinces in South Sulawesi and Lombok, and more generally across Indonesia. In addition, other groups within Indonesia may adopt some or part of the ‘best-bet package of options’. These include larger cattle operations, dairy farmers, and owners of goats and buffaloes.
A more general issue is the adoption of the research and extension approach developed and proven through the projects, specifically the participatory approach to identifying options, the information technology to assist that approach and the use of an OGT for extension and monitoring. New ACIAR projects are adopting the approach—for example, forage supply for smallholders in Vietnam, and there appears to be significant interest in applying the approach not only to forages but also more generally to technologies relevant to smallholders—for example, cropping and pasture options for smallholders in eastern Africa.10
10 B.C. Pengelly, pers. comm.
32 ACIAR investment in research on forages in Indonesia (IAS 65)
Fourth, there is empirical support with respect to forages from recent studies of smallholders by Connell et al. (2010):
Since CIAT introduced planted forages to South-East Asia in 1995, the adoption of managed forages has spread and increased rapidly. Many government and development agencies and NGOs have started to promote the planting of forages so it is difficult to estimate adoption. In 2005, CIAT conducted an adoption study in the areas where CIAT and its local partners had introduced forages in South-East Asia. In these areas alone, there were more than 15,000 smallholder families that were growing and using managed forages.
2.4.3 Future adoption: consideration of the issues
Meeting the needs of farmers
The focus of the best-bet strategies has been on meeting farmers’ needs for forage and increased cattle productivity. This was identified through the initial best-bet strategies and has continued through the subsequent work of the OGTs where the individual farmers’ needs and circumstances are taken account of in developing strategies.
The forage technologies are not overly complex (better management of elephant grass, some new forages, some legume in the ration); they build on existing cut-and-carry systems; they focus on available opportunities, namely backyard production, living fences and other plantings of gamal, lamtoro and turi on paddy bunds; use of crop residues (such as peanut straw); and forage conservation.
Similarly, controlled mating, early weaning and feed budgeting are relatively simple strategies. Furthermore, not all strategies need to be adopted to achieve financial gains.
The overriding incentive is profitability for the adopter and better cash-flow management. Initial and more recent financial modelling and the experience of the best-bet farmers/scale-out farmers attest to the strategies being profitable—indeed they have become more profitable given the improvement in relative returns of cattle compared to rice production.
Factors identified across the 19 ‘stories’ as ‘vital’ to successful adoption were:
meeting the needs of farmers
building relevant partnerships
understanding the socioeconomic context and skills of farmers
participatory involvement with farmers and rural communities
long-term involvement of champions.
These factors are elaborated in Box 2.
Third, the adoption profile of the best-bet strategies and the characteristics of the scale-out farmers would appear to reflect what other researchers of adoption by smallholders have recognised as the formation of coalitions and caution about enshrining extension processes in manuals. Adoption has reflected a variety of information sources and influences. As Cramb (2000) has noted:
The successful development, dissemination and adoption of improved technologies for smallholders depends on more than careful planning of research and the use of appropriate methodologies in extension. It depends on the timely formation of coalitions of key actors—including key farmers as well as a range of key outsiders, researchers and others—whose interests converge sufficiently that they can focus their resources and efforts on achieving change in agricultural systems, if only locally and only for a period …
Successful adoption of technology also depends on critical external factors—climatic events, market fluctuations, the availability of subsidies for planting hedgerows, livestock dispersal programs, edicts on land tenure—which enhance (or undermine) the effectiveness of a development coalition in pursuit of its strategy. It also depends on a good deal of luck.
… A broader and more flexible approach is needed which gives explicit recognition to the role of development coalitions and to the personal, cultural, and political dimensions of coalition-building for technology development.

ACIAR investment in research on forages in Indonesia (IAS 65) 33
Meeting the needs of farmers
Grasses were being adopted more quickly and more strongly than legumes. Legumes were regarded as less resilient than grasses under cutting or grazing, benefits were largely long term and grass–legume systems were more complex to manage. Targeted education programs (especially where a tradition of planting legumes was absent), successful demonstrations and favourable profitability were needed. The technology must be applicable – live up to expectations. A key point was that the technology must meet farmers’ needs recognising that needs differ between farmers and regions.
Although success could be achieved when there was a combination of several benefits (such as profitability, rotation and environment) the ‘most successful examples of adoption of forage legumes were unambiguously profitable for the adopter’.
High-yielding grasses to supplement crop residues during the dry season will likely intensify the need for forage legumes to balance the ration, increase the intake of poor-quality forage and avoid the ‘high cost’ of protein concentrates. The challenge is to find trees that can be propagated easily, are highly nutritious and can be pruned intensively.
Building relevant partnerships
All successful cases studies have involved the formation of critical partnerships between farmers and public and private institutions. Reliable seed of high quality in appropriate pack sizes and at reasonable prices was important.
Where vegetative propagation was required, an accessible supply of planting material was essential. In Nusa Tenggara Timur in Indonesia, local village heads, NGOs, church groups, the Dutch administration and government departments all showed great commitment to L. leucocephala adoption. Local administrators instituted new regulations creating a favourable policy environment for adoption to proceed (including enforcement of tethering; conditional provision of credit; promotion of cattle husbandry in livestock-distribution schemes).
Partnerships with researchers were an integral part of the successful case studies—researchers needed to be available to solve problems and progress the technology, including achieving diversification through appropriate species and contributing to a more balanced ration.
Timely formation of a flexible coalition of key stakeholders whose interests converge sufficiently so that their joint resources focus on sharing the adoption outcomes, as previously identified by Cramb (2000), was important.
Scaling-up to large numbers of farmers involves working across villages, districts and provinces, and requires alliances with a multitude of institutions working with forages, many of which will have limited expertise. The use of expert decision-making systems (such as ‘Selection of forages for the tropics’) may assist, but they cannot replace the longer-term experience of forage agronomists, especially given the
Box 2. Features of successful adoption of new forage technologies: summary of the findings of the review by Shelton et al. (2005)
continued …

34 ACIAR investment in research on forages in Indonesia (IAS 65)
Building relevant partnerships
A critical element of success to date has been the OGTs. A key question for the future is whether the OGT approach will be adopted (i.e. supported institutionally and financially) by local and provincial governments; whether stronger partnerships will develop between local extension workers and farmers (where these are currently limited) or whether other approaches will emerge. This is the major area of future uncertainty. The now-developed OGT resource appears to be viewed by agencies as valuable but there are questions as to how it will be used and integrated into existing extension systems.
Breeding and fattening cattle are typically focused on meeting farm expense spikes (such as fertiliser for rice) or household social or economic obligations (e.g. for religious occasions and payment for education). Better feeding management enables cattle to be sold in better condition and provides the opportunity to fatten more cattle.
Adoption by scale-out farmers reinforces the view that the technology, particularly forage production, is meeting farmers’ needs across different production systems and agroecological regions. Scale-out adoption is of extra significance since it is independent of the OGT input, whereas the best-bet farmers have had intensive support from the OGTs.
diversity of situations and the resources required to develop and maintain relevant models and current data. Here the intense process of interaction with participating farmers can create challenges for scaling-up to new regions, given the (participatory) process of promoting the technology.
Understanding and matching the socioeconomic context and skills of farmers
Specifically, simple innovations are more quickly adopted than complex ones. Where land tenure is uncertain, most researchers reported failure of adoption. Communally grazed lands can create special problems since the incentive for improvement necessitates a broader decision-making basis.
Participatory involvement with farmers and rural communities
In response to a lack of participatory involvement with farmers during 40 years of forage-development programs in South-East Asia, Horne et al. (2000) proposed an intensive interactive program of discussion, interviews and on-farm trials jointly conducted with farmers to identify the best solutions to problems identified by farmers. Others have noted that careful selection of participating farmers was important and that good facilitation and communication skills with farmers were essential.
However, flexibility was needed so that farmer innovations could be absorbed into the technology recommendations and passed on. Within the participatory framework, it was important to ensure that accurate and practical information on the technology was readily available and transmitted to farmers using an appropriate vehicle.
Long term involvement of funders, supporters and farmer champions
Most successful cases studies have occurred over a long period, e.g. 10–15 years. R&D organisations would need to provide long-term support and greater investment for legume technologies to deliver benefits to farmers. Support will be needed for training and education programs to overcome declining availability of forage-legume expertise and lack of awareness of opportunity for the use of tropical legumes.
Box 2. continued …

ACIAR investment in research on forages in Indonesia (IAS 65) 35
The best-bet strategies meet the challenges created by communal grazing in a direct way since they empower individual farmers to supply forage when very little is available from overgrazed communal areas such as village commons and roadsides.
Participatory involvement with farmers and rural communities
A key step in the projects was the participatory approach and involvement of farmers in the development of the best-bet strategies and in the implementation of those strategies with the best-bet farmers. But there are differences in the strategies individual farmers have adopted, most likely reflecting differing circumstances and awareness of the gains from specific strategies. Field observations suggest that farmers are modifying the strategies to meet specific situations, implying that the technologies have application across a broad range of production environments.
To date, a range of mechanisms has been used (and foreshadowed) to create awareness and promote the technology. These include the OGTs and their activities (including field days and fact sheets), working with local government extension services, and some media coverage (including TV). Moreover, adopting farmers have become the promoters of the technology and suppliers of forage cuttings and seeds, factors which almost universally facilitate adoption.
Long-term involvement of champions
Although it is too early to venture whether ‘champions’ will be a feature of the future, it is already clear that champions are emerging from among the best-bet farmers. There appear to be three types: those who utilise the technology to its fullest (planting all available areas and a diverse range of forages); those who freely give to others planting material; and those who promote the strategies while making only limited use of the technology themselves. These champions complement each other and there is every reason to think that the current and new champions will feature in enhancing adoption levels.
2.4.4 Project planning enhances adoption
Both the current South Sulawesi and the Lombok project participants recognise the importance of future adoption if these (and the preceding) projects are to achieve their ultimate objectives. As part of their annual
Moreover, there are questions as to the likely effectiveness of training of existing extension resources, given competing demands for their time, a current focus on data collection and limited resourcing to enable effective communication with farmers and farmer groups.
Encouraging indicators of potential success are the extent of current and independent scale-out, at least of increased quantity and quality of forage production, aided by the technology—particularly forage establishment using cuttings and tethering in kandangs; ready integration into existing cropping systems (along banks and bunds, and in backyards); identifiable labour savings and quick response in cattle condition and growth (and associated profitability). They suggest that significant adoption will occur even in the absence of a formal or institutional extension services, especially given recent and expected increases in cattle prices. The experience in Sumbawa supports this view. Furthermore, the influence of other informal extension mechanisms such as family and relatives, sharefarmers (who might own a few or even 50 cattle managed by other farmers in the village) and cattle buyers is already apparent.
Nonetheless, adoption would be facilitated by stronger support from governments and government agencies. Traditional views that rice growing is a priority land use, that a larger cattle herd rather than turn-off is the appropriate means of increasing smallholder incomes, and that existing extension services are adequate and priorities appropriate, will likely act as a brake on adoption. Despite the best efforts of individual researchers and managers within the current projects, and support from some extension agencies, a major change in overall policy direction seems doubtful at this stage.
Understanding the socioeconomic context and skills of farmers
While the technologies developed are relatively simple, some of them, such as the shift to early weaning and associated preferential feeding, and pre- and post-calving nutrition, are more involved in the sense that the gains take longer to become evident. Observations of scale-out to date (albeit limited) point to farmers (particularly on South Sulawesi) readily adopting the simple forage-production technologies, with other cattle management strategies coming later, or yet to be evident.

36 ACIAR investment in research on forages in Indonesia (IAS 65)
innovators: the best-bet farmers, in the sense that they have been the first to adopt the technologies and have adopted a wide range of the technologies
early adopters: the scale-out farmers, although these are more typically the innovators as they have adopted the technologies through their own observation, research and evaluation
early majority: the next group of adopters and proportionately a major group. This group can be expected to follow from the experiences of the best-bet and scale-out farmers and access resources from these groups; they posses a general eagerness to adopt changes, especially with support from others in the community, including household members. As well as farmers adopting technologies on their own farms, it is probable that new production systems will develop, such as leasing land, local markets in forages and assorted conservation techniques.
late majority: this group, also proportionately signif-icant, tend to be later adopters because they perceive the challenges to be greater and the risks higher
non-adopters: some farmers may not adopt any of the technologies. It could be because tradition dominates or they perceive that they already have adequate access to forage.
review and planning both project teams have recently examined the factors that have led to success to date and that they believe will be important to the future (Table 6). These reviews highlight the importance of continuing future investment through extension in particular, and the central role that will be played by farmer-to-farmer communication and supply of forage planting material.
2.4.5 Adoption profile over time
Adoption of agricultural technologies across farm populations the world over is generally held to reflect a normal distribution over time: first innovators, then early adopters, are followed by an early majority, a later majority and a group of non-adopters. Although there is limited research on the adoption profile of smallholders, the foregoing pattern seems plausible.
Such an adoption profile is likely to characterise uptake of the integrated crop–livestock technologies of the seven projects. Current research in projects SMAR/2006/061 and SMAR/2006/096 will provide further guidance on these issues, given its focus on the reasons that have influenced adoption by best-bet and scale-out farmers.
The general adoption profile has been characterised as follows (Figure 5):
Figure 5. Estimated profile for adoption of new crop–livestock technologies by smallholders in South Sulawesi and Lombok, Indonesia
0
5
10
15
20
25
30
35
40
Best
-bet
farm
ers
Scal
e-ou
t far
mer
s
Early
maj
ority
Late
maj
ority
Very
late
ado
pter
s
Non
-ado
pter
s
Perc
enta
ge
of a
do
pti
on

ACIAR investment in research on forages in Indonesia (IAS 65) 37
Table 6. Factors affecting future adoption of forage technologies in Indonesia: review by current project teams
South Sulawesi Lombok
Factors driving current scale-out
• Success of ‘best-bet’ (BB) farmers
• Strategic BB location (with good access)
• Farmers’ ability to interact and communicate
• Family relationship
• Initial image/rumours
• Farmers impressed with new things
• Experienced BB farmers
• Farmers always try something new
• Farmer status in the society
• Collaboration and hard work of the on-ground teams (OGTs)
• Socialisation by OGTs and extension workers
• BB farmers actively deliver information to other farmers
• Good strategic location of BB activities
• Evidence of success that can be seen by farmers
• Positive competition between groups
• Good perception of the ACIAR program
• Willingness (and motivation) to change
• Experience and foresight
• Intensive communication from farmer to farmer
• Field visit / study tour from new farmer group to established project farmer group
• Increase in the number of project or champion farmers
Constraints to scale-out
• Some farmers do not share information and resources
• Competition among farmers
• Farmers are too busy and have limited resources
• Remote / isolated location
• BB farmers not active and less confident
• Egoism
• Field condition
• Information is not appropriately delivered (too broad/deep)
• Limited resources
• Farmers who keep their tradition or mindset
• Too dependent on external incentive
• Internal conflict within farmer group
• Farmers who adopt a wait-and-see attitude
• Resource availability
• Land ownership (some farmers don’t have land)
• Less motivation
• Uncertainty around animal security (at provincial level)
Suggestions to boost scale-out
• Support from government, society and farmer leaders
• Incentive to farmers
• Other public activities e .g . religious activity, family, trade/other job, strengthening of institutions
• Farmer visits
• Workshops
• Collaboration with other relevant institutions
• Training to extension workers in other villages and subdistricts
• Establish nurseries in each village and subdistrict
• Collaboration with local government for dissemination of information
• Use of BB location as a destination for government program visits
• Meeting with farmer groups and farmer visits
• Information from farmers to farmers
• The role of society leaders
• Farmer field days
• Find the key person
• Establish centre to visit (e .g . nursery)
• Appropriate publications
• Government policy (central and regional levels)
• Easy access to information: need posters, leaflets, video, radio, newspaper, TV, internet and other networking .
• Need support for farmers to get extra capital (e .g . microfinance)
Source: projects SMAR2006/061 and SMAR/2006/096 annual reports 2009

38 ACIAR investment in research on forages in Indonesia (IAS 65)
extension workers and more general policy support, it is estimated that the adoption curve could be brought forward by 5 years. This would imply that, by 2018, 16% of farmers (some 34,000 farmers) on South Sulawesi will have adopted one of the technologies, with a similar adoption level on Lombok.
In one sense, these estimates of adoption seem modest, if not disappointing. On the other hand, in the context of past adoption of tropical forage R&D findings, they are substantial. Moreover, the adoption profile of farmers, including most likely smallholders in Asia, shows that the early majority and late majority segments are where the rapid rate of adoption occurs.
There are other potential risks to adoption that have not been considered here. These might include pest risks not yet identified (but minimised through encouraging multiple species); a change in relative cattle and rice returns (favouring labour diversion to rice); a significant drop in cattle returns or policy interventions that encourage farmers to hold cattle without an emphasis on improved nutrition and management. Conversely, cattle prices might improve further, hastening the rate of adoption.
Nevertheless (although not necessarily in contrast), some reviews of adoption by smallholders have suggested that ‘in contrast to the notion of “transfer of technology”, there is no unambiguous, one-way progression in the research, extension and adoption process’. Furthermore, there are varying degrees of experimentation as farmers adapt technology. The latter is particularly pertinent in the present context as there is the option for farmers to adopt only part of the research output of the project, now or in the future.
2.5 Impact assessment
2.5.1 Approach to estimating economic welfare changes
ACIAR’s guidelines for impact assessment (Davis et al. 2008) require that ‘economic surplus analysis should be used where possible’.
The key parameters for the analysis are:
initial price and quantity
There are four further issues in addition to this generalised adoption profile.
First, the technologies are a bundle of technologies that, although interrelated, can to some extent be adopted individually. Farmers seem likely to adopt new forages and better management of existing forages first, followed by other technologies such as livestock management later. Thus there is, in practice, a separate adoption profile for each of the technologies. Specifically, ‘forage first’ is mostly the emphasis in South Sulawesi; Lombok is ‘mating first’, mostly because mating is seen by farmers as more of a constraint to production, there was stronger emphasis on breeding by previous researchers and a land limitation is viewed as making ‘forage wins’ harder.
Second, the time frame of adoption must be considered. With scale-out now following the best-bet farmers, the central issue will be how long it takes for the early majority to adopt at least some of the technologies. Considered from the perspective of the proportion of the smallholder population that could adopt the technologies, it is estimated that the adoption proportion on South Sulawesi, in the absence of significant institutional investment in extension, might reach 5% (nearly 11,000 farmers) in a decade. A similar rate is estimated for Lombok). The estimated slow rate of adoption recognises that while the technologies are attractive to farmers, there are a great many villages to cover with limited extension services (assuming no OGTs) and the next group of farmers is unlikely to be as innovative and seeking of change as the scale-out farmers to date. Further, the issues facing potential adopters may not be as well answered as has been the case to date. Finally, there are likely to be some farmers who never adopt the technology.
Third, there is the role of institutional extension services. To date, the OGTs have been the dominant extension provider. The future role of the OGTs and the government extension services is less clear. However, a continuing or greater supporting role from either or both groups, plus more general government support and encouragement for improving cattle productivity, can be expected to hasten adoption, possibly considerably. This would bring forward the whole adoption profile rather than changing the shape of the adoption curve itself. Given continuing support of OGTs or equivalent services, for both training and supporting general

ACIAR investment in research on forages in Indonesia (IAS 65) 39
current) prices and quantities for cattle supplied by smallholders; k is the derived cost reduction (derived from the measured productivity gain j) and P1 and Q1 represent the new price and output levels following adoption of the R&D. Demand and supply are presented as linear functions, with the cost reduction assumed to result in a parallel (downwards) shift in the supply curve.
Consumer surplus (CS), producer surplus (PS) and total surplus (TS) have been measured in the standard fashion:
∆CS = P0*Q0*Z * (1 + 0.5*Z*ή)
∆PS = P0*Q0*(K – Z) * (1 + 0.5*Z*ή)
∆TS = P0*Q0*K * (1 + 0.5*Z*ή)
where K is the vertical shift of the supply function (k) expressed as a proportion of the initial price, ή is the absolute value of the elasticity of demand, έ is the elasticity of supply, and Z = Kέ/(έ + ή) is the reduction in price, relative to its initial (i.e. pre-research) value, due to the supply shift (Alston et al. 1998).
In measuring the supply increase (and associated economic welfare gains) resulting from the forage R&D a forecast adoption profile (without and with additional extension support) has been used in estimating the welfare gains in each year.
price elasticity of the demand and supply functions at the initial price and quantity
shifts in supply due to the adoption of the R&D, i.e. the cost reduction or the productivity gain measured as a cost reduction.
An alternative often-used approach, especially where there are limited data for elasticities of supply and demand, is to estimate gross annual research benefits. Put simply, this approach measures the productivity gain, cost saving or income gain multiplied by the pre-R&D quantity of output. It underestimates the potential gains, since there is no allowance for producer response and, because of that, it does not permit analysis of the distribution of the gains between producers and consumers.
A partial equilibrium approach has been used in the present analysis since the supply response by farmers is relevant and the distribution of the prospective benefits between farmers and consumers is thus potentially important.
In the present analysis the population of smallholders has been disaggregated into smallholders on Sumbawa, South Sulawesi and Lombok. Figure 6 shows the conceptual basis for measuring the benefits of the R&D for each of the regions. P0 and Q0 represent initial (essentially
Figure 6. Measurement of R&D gains: producer and consumer surplus
Q0 withoutR&D
Q1 withR&D
Quantity cattle
Price of cattle
Demand for smallholder cattle
Supply without R&D
Supply with R&D
k
Productivity gainrepresented as costreduction (k)
P0
P1

40 ACIAR investment in research on forages in Indonesia (IAS 65)
The relevant initial quantity in each subsequent year is the proportion of cattle managed by smallholders influenced by awareness of the technologies through farmer-to-farmer contact, media, extension and advisory services and other policy interventions by local or regional authorities. As discussed in Section 2.4.5, this proportion will increase over time in response to the spread of technology through word-of-mouth, local and regional farmer groups and agency extension, and policy in support of adoption. The implications of two levels of extension support have been examined: limited extension (‘more of the same’) and an expanded extension investment of additional OTG personnel supported by policy within the respective local and regional agencies. It is estimated that around one-third of the smallholders who manage cattle in the regions will adopt the forage technologies in the next three decades, with adoption affecting about one-third of the cattle herd (Figure 7). This may be conservative, given the low cost of applying some of the technologies and the scale-out evident to date, but the history of forage technology adoption, as well as the possibility of forage crop disease outbreaks and land and resource constraints, suggest this conservatism is justified. The principal effects of additional extension support a faster rate of adoption, although the maximum level of adoption is still expected to be around 33% of the cattle herd.
Additional extension is presumed to affect the rate and level of adoption. This is by no means a certainty in terms of timing or overall impact as there are constraints to progress. In particular:
‘institutionalising’ the new management practices and strategies will be difficult given the competing institutional priorities of government policy and extension services (such as the emphasis on artificial insemination and exotic beef breeds)
overcoming the cow numbers objective (rather than the income of smallholders)
addressing the relative merits of approaches to extension given budget constraints (for example, short sessions for many smallholders to stimulate interest and opportunities, compared with an ongoing mentoring network with a focus on participatory processes).
2.5.2 Parameter values
Initial price
Prices for cattle owned/sold by smallholders differ according to the animals’ age, sex and condition. Moreover, prices have risen in recent years (Section 2.3.2). Nonetheless, real prices are forecast to remain at least at current levels in the medium term. Current average prices for cattle sold are estimated to be around Rp5m per head.
Given that most beef cattle are sold to traders, or through traders in local markets, for subsequent processing and consumption in Kalimantan, prices are much the same in both South Sulawesi and Lombok.
Initial quantity
Cattle on South Sulawesi and Lombok are estimated to total close to 1.4 million head (Table 7). The cattle population on Sumbawa is put at 102,000.13 In addition to smallholder beef cattle in these regions, some aspects of the forage R&D technologies and strategies will be directly applicable to smallholders owning buffalo and goats, and more generally to other cattle owners in these regions and elsewhere, specifically larger beef farmers and dairy farmers. However, the prime focus of the R&D has been smallholders and that is also the focus of this economic assessment.
Table 7. Cattle numbers in South Sulawesi and Lombok, Indonesia
South Sulawesi
Lombok
Cattle numbers 669,000 a 700,000 b
Percentage of cattle managed by smallholders c
80 80
Average number cattle/smallholder c
2 .5 2 .5
Number of smallholders with cattle
214,080 224,000
Sources: a Rachmat Rahman, pers . comm .; b,c estimated by IDA from information collected on field visits .
13 Anthrax alert halts Sumbawa cattle trading in two districts, http://www.thejakartapost.com/news/2009/01/13/anthrax-alert-halts-sumbawa-cattle-trading-2-districts.html

ACIAR investment in research on forages in Indonesia (IAS 65) 41
smallholders in South Sulawesi and Lombok are one source of supply and hence the demand for cattle faced by these smallholders is correspondingly more elastic.15
The estimated price elasticity of demand for cattle facing smallholders on South Sulawesi and Lombok reflects:
the derived demand for cattle given elasticity estimates for beef (assumed equal, given very little opportunity for substitution for cattle in the beef supply chain)
the South Sulawesi–Lombok share of Indonesian cattle (estimated at 13%, i.e. 1.5 million of 11.5 million head)
the smallholder share of South Sulawesi–Lombok cattle production (estimated at 80%)
local (Indonesian) beef production as a share of total beef supply (local cattle, live imports plus imported beef).
15 Technically, the price elasticity of demand measures the proportionate quantity change in response to a proportionate price change—thus a product characterised by highly elastic demand means that a small price response will lead to a large change in the quantity demanded. It also means that a large change in quantity supplied is required before there is a change in price.
Price elasticity of demand
Previous studies of the Indonesian beef-cattle industry have suggested that an own-price elasticity for retail beef demand in Indonesia of –1.09 (short run) to –1.43 (long run) (Hadi et al. 2002)14, with another study (incorporating later data but focused on the province of Bali) suggesting a demand elasticity of –0.9 (Ambarawati et al. 2003).
However, these studies related to the 1990s when there were both tariff and non-tariff restrictions on the supply of imported beef, fewer live cattle imports and, in the late 1990s, the Asian financial crisis, which resulted in a substantial drop in both live cattle and beef imports into Indonesia. Imports rebounded in 2000 and continued to grow, given both population growth and the income elasticity of beef demand. Furthermore, the estimates relate to beef demand in Indonesia in aggregate:
14 Not surprisingly this study consequently found that an improvement in production efficiency in the native breeding and fattening industry (across the whole of Indonesia) would lead to some increase in supply but also a resulting significant fall in prices to consumers and farmers.
Figure 7. Estimated adoption profile for new forage technologies, with and without additional extension support. Source: IDA Economics estimates
2008
2010
2012
2014
2016
2018
2020
2022
2024
2026
2028
2030
2032
2034
2036
2038
0
5
10
15
20
25
30
35
Pro
po
rtio
n (%
) of c
attl
e h
erd
'ad
op
tin
g'
new
fora
ge
tech
no
log
ies With additional extension
Without additional extension

42 ACIAR investment in research on forages in Indonesia (IAS 65)
facing smallholders on South Sulawesi and Lombok is estimated at –14.19
Note that if the R&D technologies have application to the rest of Indonesia then the price elasticity of demand faced by the combined total of smallholders would be lower.
Elasticity of supply
There is limited formal analysis of the supply responsiveness of smallholders to changes in prices. Typically, cattle production by smallholders is reported to be driven primarily by non-price influences—a means of saving for special events. However, anecdotal evidence suggests that smallholders respond in a positive way to higher cattle prices. The rise in prices in recent years has seen increased interest in cattle production, and higher cattle prices have encouraged a greater interest in applying the strategies identified in the R&D reported here. Equally, higher prices can lead to a reduction in the breeding herd as farmers seek to gain the benefit of higher prices, especially if these prices are regarded as short term. Studies undertaken a decade ago report a low supply elasticity of between 0.7 and 1.06 (Hadi et al. 2002). A smallholder supply elasticity of 1 has been used in the analysis, which means that a 1% increase in price at the farm gate can be expected to lead to a 1% increase in cattle supply.
There are constraints to expanding beef production in South Sulawesi and Lombok. These include land and labour shortages, the former especially on Lombok where available land consists primarily of small backyards and rice paddy bunds. On South Sulawesi there appears to be more land that could be used for tropical forages—backyards that are currently used for tethered grazing on native grasses.
The land and labour constraints are likely the explanation for the low supply elasticity as historically measured. However, in the context of the R&D, the
19 Derived as follows
Price elasticity of beef demand a –1Cattle share of beef supply b FixedHerd size: South Sulawesi and Lombok c 1.5 millionHerd size: Indonesia d 11.5 millionSmallholder share of production e 80%Local cattle share of total beef supply f 68%Price elasticity of demand = a/(c/d)/e/f –14
Local beef production is estimated at 283,000 tonnes in 2006–07, about 62% of total supply (Figure 8). Live imports from Australia totalled 517,000 head in 2006–07 (and increased to 650,000 in 2007–08). In 2006–07, beef imports (from Australia and New Zealand) totalled nearly 40,000 tonnes, increasing to almost 60,000 tonnes in 2007–08.
There is a degree of contention as to whether the local share of beef supply will rise or fall. The Indonesian Government has a policy of increasing the degree of self-sufficiency.16,17 Beef demand continues to increase with rising incomes and population growth. Live-cattle imports and beef imports have risen significantly in recent years while supplies from local cattle have risen only slightly.18 Moreover, it is expected that beef imports from Brazil will commence in the near future once import protocols are established. Also, the government is reported to be planning to open beef trading with the Netherlands and Ireland. The Australian beef industry, through Meat and Livestock Australia, has said that it anticipates making a major investment to promote meat and live-cattle exports to Indonesia. These additional imports are expected to lower local beef prices.
This analysis has used the average local beef production market share in the past 3 years (68%) as indicative of the future. On this basis, the elasticity of demand
16 Minister of Agriculture Anton Apriyantono has outlined that the new law (passed in May 2009) emphasises the development of millions of small- and medium-scale cattle farms by encouraging farmers to cooperate with plantations, fisheries and the forestry sector, in order to take advantage of synergies when raising cattle, such as grazing cattle on unused land. The ministry will also continue to provide funds to farmers to buy cattle and increase beef production (although this is not covered by the new legislation). In addition, the new law widens the potential source of imports to include countries with zones free from foot-and-mouth disease (FMD), such as Brazil and Uruguay. (Previously imports were restricted to FMD-free countries, and Australia and New Zealand in particular.) The new law also extends the time to reach the goal of self-sufficiency from 2010 to 2014.
17 Farmers doubt animal husbandry law will significantly raise beef production, Jakarta Post, 24 May 2009. At <http://www.thejakartaglobe.com/business/farmers-doubt-animal-husbandry-law-will-significantly-raise-beef-production/276922>
18 Significantly, as demonstrated to date, a fundamental constraint to expanding smallholder beef production will be forage and fodder production.
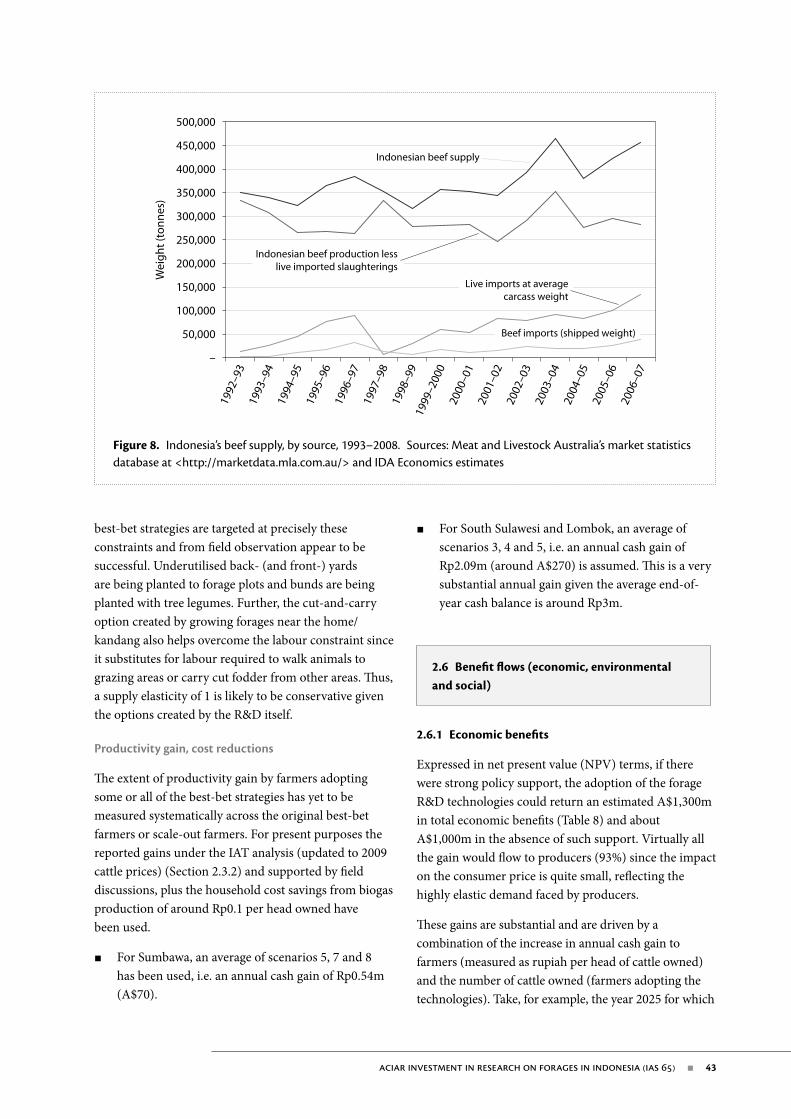
ACIAR investment in research on forages in Indonesia (IAS 65) 43
For South Sulawesi and Lombok, an average of scenarios 3, 4 and 5, i.e. an annual cash gain of Rp2.09m (around A$270) is assumed. This is a very substantial annual gain given the average end-of-year cash balance is around Rp3m.
2.6 Benefit flows (economic, environmental and social)
2.6.1 Economic benefits
Expressed in net present value (NPV) terms, if there were strong policy support, the adoption of the forage R&D technologies could return an estimated A$1,300m in total economic benefits (Table 8) and about A$1,000m in the absence of such support. Virtually all the gain would flow to producers (93%) since the impact on the consumer price is quite small, reflecting the highly elastic demand faced by producers.
These gains are substantial and are driven by a combination of the increase in annual cash gain to farmers (measured as rupiah per head of cattle owned) and the number of cattle owned (farmers adopting the technologies). Take, for example, the year 2025 for which
best-bet strategies are targeted at precisely these constraints and from field observation appear to be successful. Underutilised back- (and front-) yards are being planted to forage plots and bunds are being planted with tree legumes. Further, the cut-and-carry option created by growing forages near the home/kandang also helps overcome the labour constraint since it substitutes for labour required to walk animals to grazing areas or carry cut fodder from other areas. Thus, a supply elasticity of 1 is likely to be conservative given the options created by the R&D itself.
Productivity gain, cost reductions
The extent of productivity gain by farmers adopting some or all of the best-bet strategies has yet to be measured systematically across the original best-bet farmers or scale-out farmers. For present purposes the reported gains under the IAT analysis (updated to 2009 cattle prices) (Section 2.3.2) and supported by field discussions, plus the household cost savings from biogas production of around Rp0.1 per head owned have been used.
For Sumbawa, an average of scenarios 5, 7 and 8 has been used, i.e. an annual cash gain of Rp0.54m (A$70).
Figure 8. Indonesia’s beef supply, by source, 1993–2008. Sources: Meat and Livestock Australia’s market statistics database at <http://marketdata.mla.com.au/> and IDA Economics estimates
50,000
100,000
150,000
200,000
250,000
300,000
350,000
400,000
450,000
500,000
–
Wei
gh
t (t
on
nes
)
1992
–93
1993
–94
1994
–95
1995
–96
1996
–97
1997
–98
1998
–99
1999
–200
020
00–0
120
01–0
220
02–0
320
03–0
420
04–0
520
05–0
620
06–0
7
Indonesian beef supply
Indonesian beef production lesslive imported slaughterings
Live imports at averagecarcass weight
Beef imports (shipped weight)

44 ACIAR investment in research on forages in Indonesia (IAS 65)
Extension systems: the OGT experience
A key feature of the projects has been the experience of the OGT approach to extension. This model can be expected to have significant application in future advisory structures for new forages as well as other technologies for smallholders in Indonesia. Given its success, it can be expected to be examined, trialled and adopted in research projects in other countries. The expected benefit can be viewed as a greater probability of adoption, and faster and more widespread adoption.
Environmental
Changes in cattle feeding brought about by the planting new forages can be expected to have an impact on the environment.
The new forages primarily enable backyard forage production. This practice substitutes for grazing upland areas unsuited to cropping. The upland areas, typically grazed day after day, can be expected to revert to native bushland with an associated reduction in land degradation and erosion. Further, backyard production of new forages often substitutes for under-utilised backyard areas. Observations from the field trips revealed a surprising level of conversion of backyards from unused and weedy plots used for low productivity grazing to initially small but increasing areas of significant forage production. In a few instances forages are being grown in front yards and gardens—again indicative of the pay-offs.
The new forages also substitute for cut and carrying of local species. This could lead to a reduction in cutting on communal areas and roadsides. Equally, as is apparent in some situations, the opportunity offered by the new forages has seen roadsides, creek banks and other areas become new forage production areas. In areas where there is cutting of existing species such as
the R&D applies to an estimated 115,000 cattle owned by smallholders. For South Sulawesi and Lombok the annual gain is estimated at Rp2.09m per head of cattle owned—about A$270 per head owned. This gives, in that year, a total benefit of around A$31m. When discounted back to 2009 values, the gain is about A$14m.
The gains from additional investment in extension are also substantial—around A$290m, noting that these are the estimated gross gains and do not include the cost of additional extension. On the basis of the estimates made of the gains from additional extension, the Indonesian authorities could justify investing up to A$290m (NPV equivalent) in additional extension over the next 30 years. A key point in regard to extension is that there is little commercial or market-driven incentive for promoting adoption of the forage and cattle management technologies. Since the forages can be grown from cuttings there is not the usual incentive for commercial seed companies to promote the forage types. Furthermore, for the cattle management strategies there is again no commercial incentive for product or service providers.
2.6.2 Spillover benefits
Other farmers
The quantitative impact assessment has focused on the benefits to smallholder farmers in three regions in Indonesia. However, the technologies also have application to:
smallholders with buffalo and goats
smallholder cattle farmers in other regions of Indonesia that face the same challenges
larger-scale farmers for whom feed supplies are, or could be, provided or supplemented by forages
smallholders in other countries.
Table 8. Estimated gains in economic welfare from adoption of forage technologies (net present values, 5% discount rate)
Consumer benefits (A$m)
Producer benefits (A$m)
Total benefits (A$m)
Without additional extension 67 942 1,010
With additional extension 87 1,221 1,308
Gain from additional extension 20 278 298
Source: IDA estimates

ACIAR investment in research on forages in Indonesia (IAS 65) 45
2.6.4 Investment returns to R&D
The investment, noting that adoption in a major way has yet to occur, appears to offer a high rate of return. The internal rate of return (IRR) is estimated at around 20% and the benefit:cost ratio to be greater than 20:1 (Table 9), even allowing for a significant investment in future extension activities of around Rp5,000m per annum post 2011 for 30 years and beyond (as either new extension funding or reprioritising of existing extension services). This extension investment, in present value terms, is about equal to the total R&D investment to date.
If the extension investment is increased to Rp15,000m per annum to achieve a faster rate of adoption, the investment return is higher with an estimated IRR of around 22%.
Relative to the costs, the potential benefits are very high, even recognising the conservative approach adopted in the analysis. One major reason is that the adoption costs for farmers are low. Growing the new forages or improved management of existing forages is primarily about labour inputs: planting material is obtained from other farmers or the initial nurseries. There are few purchased inputs apart from some nitrogenous fertiliser and again there is potential to better utilise manure from the kandangs. This low adoption cost has assisted adoption to date and can be expected to continue to do so.
The future investment in extension is a major uncertainty. The above estimate of the future investment in extension (Rp15,000m per annum) compares with Rp100m made available to each of 10,000 villages under the 2008 agropolitant village business program (PUAP) to support the accelerated development of the agricultural sector through revolving capital provided to villages.20
Furthermore, the extension system is not well documented, making it difficult to identify current and prospective policy commitments, the relative role of livestock feeding and management (especially relative to breeding and increasing the number of cattle owners)
20 ‘Agricultural Ministry provides Rp 100 MLN to each village’, press release, August 2007. At <http://www.indonesia.go.id/en/index.php?option=com_content&task=view&id=7219&Itemid=699>
gliricidia, for example in SPA and Mertak, there are no apparent adverse effects on tree densities, but it is early days and longer term sustainability may become an issue in communal areas with more intensive cutting, in the absence of property rights of one type or another.
A potential risk, given the demonstrated capacity for the new forages to grow well in and around villages, is that the new forages become weeds or come to dominate the environment. The new forages will be planted and spread into areas not used for cropping. However, the fact that they are highly nutritious for livestock will ensure they are utilised either as cut and carry or grazing. Current and prospective returns from cattle are likely to see the forages utilised rather than becoming a problem. Further, these landscapes are typically man made, as is especially evident in the extensive rice paddies intricate irrigation systems that dominate the landscape.
On Lombok, where community kandangs dominate the production system, the R&D and associated programs have led to a significant improvement in effluent management. Support for individual kandangs through provision of a bull has typically been conditional on improving effluent management. Field-trip observations point to improvements, substantial in several cases and generally with little or no capital expenditure. In some instances the effluent is being used for fertiliser or biogas production.
2.6.3 Capacity building
Three broad areas of capacity built are evident to date.
There is enhanced research capability among Indonesian researchers involved with the projects, and in their associated institutions.
The capacity of farmer groups to work together to tackle problems has also been enhanced. This is particularly evident on Lombok where communal decisions are required in terms of changes to kandang management. Bull and effluent management required a higher level of communal decision-making than that previously applying.
The OGT are trained, and now experienced, extension workers. Whether or not they are retained in an extension role, significant capability has been developed.
Figure A2 in the appendix summarises capacity-building aspects of the projects.

46 ACIAR investment in research on forages in Indonesia (IAS 65)
other characteristics of the farmers and their families. In one sense, the adoption of the forage-supply and cattle-management technologies could be seen as traditional technology transfer. However, as Birner et al. (2006) have argued:
Past experiences clearly show that importing standardized models of extension to a new context is not a promising strategy, even when the imported models are viewed as ‘best practice’. What is important is to build capacity among policy planners and extension managers to identify modes of providing and financing extension that best fit the specific conditions and development priorities of their country.
Birner et al. (2006) further suggest that the extension model should be more encompassing of knowledge and innovation generally and thus include a broad view of advisory services (to include non-governmental organisations, corporate and other private sector service/material providers as well as government extension services). It should include integration of agricultural research, agricultural extension and agricultural education. Moreover, the context should extend well beyond the farmer per se to include the family and local community interest groups. The key emphasis of the approach is viewing the development and capacity of advisory services within a demand-driven framework.
The project to date has considered and incorporated aspects of this approach. What is more important, however, is future extension activity; that is, whether an appropriate approach is an expanded and enhanced traditional extension capacity (recognising the experiences and capacity of the OGT in the project), as has been generally foreshadowed, or whether a broader consideration of the issue is warranted. Such considerations lie outside the scope of this study.
and the capacity for reprioritising existing extension services. The analysis that is available is relevant to understanding the context of extension in overall government programs but it is usually dated.21
Nonetheless, the apparent ‘latest thinking’ is that since the municipalities are not viable economic units for delivering extension services, the extension responsibilities should be moved back to the provincial level. In Indonesia, extension services have been marginalised because most district governments, irrespective of national policy, have certain priorities for generating quick revenues, and agricultural extension, unlike estate crops or livestock, generally gives longer rather than shorter term returns, and so is not considered as a priority.22
Indonesia has successfully established new institutions called Agricultural Technology Assessment Institutes at provincial level, bringing together farmers, researchers and extension specialists. FAO remarked that this model is so far the best hope for research and extension to work not only hand-in-hand but also with full involvement of farmers, extension services and other stakeholders.23
Another consideration is whether the extension model might be better viewed in a broader context. One of the challenges for facilitating adoption is selecting the appropriate approach, given the context of the technologies involved and the skills, resources and
21 See, for example, ‘Agricultural extension In Indonesia’ (circa 1991). At <http://www.mamud.com/Docs/03indoext.pdf>
22 FAO, ‘Modernising national extension systems’, p. 14. At <ftp://ftp.fao.org/docrep/fao/008/a0219e/a0219e00.pdf>
23 FAO, ‘Modernising national extension systems’, p. 54. At <ftp://ftp.fao.org/docrep/fao/008/a0219e/a0219e00.pdf>
Table 9. Investment returns to R&D and extension for selected forage projects in Indonesia
Without additional extension With additional extension
Present value (PV) of benefits A$1,010m A$1,308m
PV of costs A$23m A$48m
Net present value (5% discount rate) A$989m A$1,270m
Benefit:cost ratio 43 28
Internal rate of return 19% 22%
Source: IDA estimates

ACIAR investment in research on forages in Indonesia (IAS 65) 47
Similarly, there is uncertainty about the cash-flow gains on Lombok, given that the IAT model was not applied in the ACIAR research projects there (i.e. the parameter values were not estimated). In the current assessment the gains on Lombok were, on the basis of field discussions, estimated to be the same as those on South Sulawesi.
The eventual level of adoption. The effect of extension is important, given doubts about both the availability of funds and the effectiveness of future extension, with the possible consequence that the strategies are applied to a smaller proportion of the herd.
The durability of the project achievements. This should be considered in the context of other future developments that might substitute for the project findings. The base-case analysis reports benefits out to the year 2038 (i.e. a 30-year interval) plus the perpetuity value of benefits forever after that year. There is the question of whether the level of adoption would increase above the 30% of the herd and over what period, or whether it might in fact decline though research depreciation or disadoption; that is, diminutions of a research benefit reflecting, for example in a general context, susceptibility of a crop variety to disease, or obsolescence due to changes in market circumstances. In the case of the ACIAR Indonesian forage projects, depreciation factors could include changes in relative farm-product returns that favoured crops over forage-based livestock production; structural change in the beef industry (for example, large-scale holdings based on feedstuffs apart from local forages, but recognising that the project technologies may have significant applicability to large holdings) or substitution of local beef production with imports or other meats. Although the forage technologies are path breaking in the sense of bringing a potentially much more applicable approach to forage production/adoption, the technologies are not of themselves a new threshold of knowledge that will necessarily underlie all future development. Another factor is the potential for improved savings options for smallholders. Given the importance of cattle as a store of savings and short-term wealth accumulation an improved savings system could see a decline in interest in cattle production. For the sensitivity analysis, the benefits past the year 2038 have been excluded.
In this analysis, the estimated fiscal commitment to extension reflects the size of the investment relative to the potential gains in improving farmers’ cash flow rather than the returns at the margin of investing in additional extension support.
Of key importance is that the above analysis suggests that the potential returns from adopting the forage R&D technologies are substantial and that a significant extension investment can be made to ensure even a modest rate of adoption, to hasten adoption and to increase adoption above the 30% of the herd assumed in this analysis. Finally, the investment returns estimated in the above analysis are likely to be conservative since:
the maximum level of adoption is put at 30% (achieved over 30 years)
application of the technologies to smallholders in other areas of Indonesia is not included, nor are the prospective gains to larger-scale livestock raisers
dairy farmers and smallholders raising buffalo and goats also stand to gain since the technologies (forage production and livestock management) have a high degree of ready applicability to these livestock enterprises.
The impact assessment period is defined as 30 years. However, the benefits are likely to extend beyond that period since there is unlikely to be disadoption. It is possible that new forage species might be developed but even in that case the adoption of those species will be influenced by the experiences, and formal and informal knowledge systems within the farming and education community. The ACIAR work will thus have lasting benefits. These lasting benefits have been included as the annuity value for future benefits (and any costs) in the final year of the impact, as outlined in Davis et al. (2008).
2.6.5 Sensitivity analysis
Project factors
There is a degree of uncertainty about the following three factors that underpin the estimated returns.
Cash-flow gains at the farm level. This is especially so given the substantial difference between the IAT-modelled gains on Sumbawa and South Sulawesi, and the extent to which adoption is likely to reflect only some of the best-bet strategies.
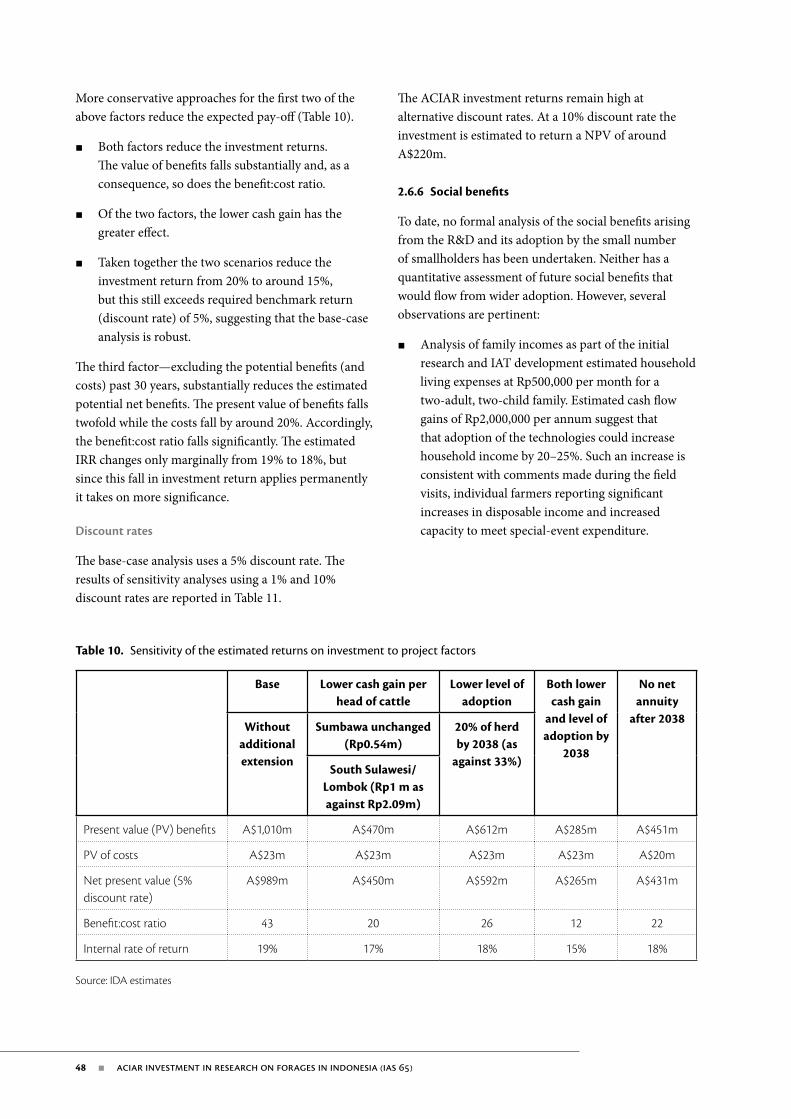
48 ACIAR investment in research on forages in Indonesia (IAS 65)
The ACIAR investment returns remain high at alternative discount rates. At a 10% discount rate the investment is estimated to return a NPV of around A$220m.
2.6.6 Social benefits
To date, no formal analysis of the social benefits arising from the R&D and its adoption by the small number of smallholders has been undertaken. Neither has a quantitative assessment of future social benefits that would flow from wider adoption. However, several observations are pertinent:
Analysis of family incomes as part of the initial research and IAT development estimated household living expenses at Rp500,000 per month for a two-adult, two-child family. Estimated cash flow gains of Rp2,000,000 per annum suggest that that adoption of the technologies could increase household income by 20–25%. Such an increase is consistent with comments made during the field visits, individual farmers reporting significant increases in disposable income and increased capacity to meet special-event expenditure.
More conservative approaches for the first two of the above factors reduce the expected pay-off (Table 10).
Both factors reduce the investment returns. The value of benefits falls substantially and, as a consequence, so does the benefit:cost ratio.
Of the two factors, the lower cash gain has the greater effect.
Taken together the two scenarios reduce the investment return from 20% to around 15%, but this still exceeds required benchmark return (discount rate) of 5%, suggesting that the base-case analysis is robust.
The third factor—excluding the potential benefits (and costs) past 30 years, substantially reduces the estimated potential net benefits. The present value of benefits falls twofold while the costs fall by around 20%. Accordingly, the benefit:cost ratio falls significantly. The estimated IRR changes only marginally from 19% to 18%, but since this fall in investment return applies permanently it takes on more significance.
Discount rates
The base-case analysis uses a 5% discount rate. The results of sensitivity analyses using a 1% and 10% discount rates are reported in Table 11.
Table 10. Sensitivity of the estimated returns on investment to project factors
Base Lower cash gain per head of cattle
Lower level of adoption
Both lower cash gain
and level of adoption by
2038
No net annuity
after 2038Without
additional extension
Sumbawa unchanged (Rp0.54m)
20% of herd by 2038 (as
against 33%)South Sulawesi/
Lombok (Rp1 m as against Rp2.09m)
Present value (PV) benefits A$1,010m A$470m A$612m A$285m A$451m
PV of costs A$23m A$23m A$23m A$23m A$20m
Net present value (5% discount rate)
A$989m A$450m A$592m A$265m A$431m
Benefit:cost ratio 43 20 26 12 22
Internal rate of return 19% 17% 18% 15% 18%
Source: IDA estimates

ACIAR investment in research on forages in Indonesia (IAS 65) 49
2.6.7 Attribution
About 60% of the past investment dollars in the project areas were provided by ACIAR, and the balance through in-kind or other funding of the research and extension agencies—predominantly CSIRO, the University of Queensland, Balai Pengkajian Teknologi Pertanian and the universities in Indonesia.
Earlier forages R&D also needs to be recognised, especially the work within CIAT and national agencies such as CSIRO. It has not been possible to identify or cost these contributions as part of this analysis.
Also, there are future costs in terms of extension, particularly if the extension effort is to be increased. This investment, if it is made, will change the relative contributions between R&D and extension from around 50% R&D 50% extension to 25% R&D 75% extension.24 In terms of attribution of the 50% R&D investment, identifying the opportunities, developing forage- and cattle-management strategies and demonstrating the importance and effectiveness of ground-level extension has clearly come from CSIRO through the ACIAR funding. The ACIAR investment was necessary since the R&D was required and it appears unlikely that others would have funded the level of R&D activity, especially given the past experiences of tropical-forage R&D investments. That said, the ACIAR-funded work has drawn upon a good deal of previous tropical-forage R&D work.
24 IDA Economics estimates; calculated as the relative real present value of the investment in R&D to date plus future extension .
Relative to capital purchases such as a home or motor cycle, the estimated annual gains are significant. Field trip comment suggested that a relatively simple house might cost Rp20–30m in materials to build and a motor cycle Rp15m. An annual gain of around Rp2m would make an important contribution to these purchases.
Also, adoption of the technologies is relatively riskless for farmers who have cattle: there are no purchased inputs or capital required. The primary input is labour to plant, maintain and cut and carry forage, and feed cattle. In some cases a modest kandang may be required, but again its construction is primarily by the farmer’s own labour.
In most situations it appears likely that there are labour savings from planting and using new forages since the feed supply is close by thus reducing the need to walk cattle to grazing. These labour savings typically benefit the farming family as a whole since the woman and children as well as the farmer are involved in leading cattle to grazing areas.
From a distributional perspective the income gains will benefit those smallholders with cattle. In the future more farmers will seek to raise cattle, either through purchase or share farming with cattle owners. Given greater capacity to manage the feed supply, the trade in store cattle for local fattening is likely to expand. Further, it was evident from the field trip that the technologies empower woman, children and the elderly to contribute to the workload since the forage supply is literally in backyards and forage can be cut and carried in small quantities.
Table 11. Sensitivity of the estimated returns on investment to the discount rate applied
Base: without additional extension
Discount rate
1% 5% 10%
Present value (PV) of benefits A$10,011m A$1,010m A$243m
PV of costs A$72m A$23m A$22m
Net present value A$9,987m A$989m A$222m
Benefit:cost ratio 139 43 11
Source: IDA estimates

50 ACIAR investment in research on forages in Indonesia (IAS 65)
A concern is that undertaking an impact update in several years time might have to deal with the same situation. The projects are scheduled for completion in mid-2010. Data systems to measure the extent of adoption, the drivers/constraints and impact are not part of the research agendas of the researchers involved.
More generally, the following three steps could be incorporated in future projects:
ex-ante impact analysis, including quantitative assessments, as a basis for both R&D design and collection of relevant data during the R&D project. These assessments need not be particularly sophisticated but they do need to be transparent and consistent with the ACIAR guidelines for impact assessments.
verification of economic models in a latter part of the R&D. This would increase confidence in their use, identify issues in future model development and provide a better basis for subsequent impact analysis, especially where that analysis is undertaken in the early years of adoption.
development of appropriate markers or indicators that could provide guidance for updating impacts in future years. Ideally these indicators would help set up and be consistent with the incentives for extension workers and researchers to achieve their objectives. The principal markers should relate to gains at the farm level, numbers of farmers adopting which particular strategies and numbers of farmers ceasing to pursue specific strategies. In one sense these data should be available in the usual course of business for an effective extension service. Accordingly, it would be appropriate to consider the matter in future discussions of institutional strengthening of the extension services.
The ACIAR financial contribution to the R&D investment has been calculated at 60%. For the delivery of the estimated benefits, future extension work will be critical. Both investments—R&D and extension—are required in order to deliver the estimated benefits. With the base level of extension (and resulting 50%/50% R&D/extension contribution), ACIAR’s share of the benefits would be 30%—around A$300m. As the extra benefit arising from additional extension are attributable to only that additional extension, the value of the benefits attributable to ACIAR under this scenario remains at A$300m.
2.7 Lessons and learnings
This impact assessment was especially challenging as it is essentially an analysis of future adoption. The R&D is completed but adoption is at an early stage, as indicated by the small numbers of farmers who have adopted the technologies and strategies so far. Moreover, the background experience is of ‘50 years of failure’ in tropical forage R&D (Pengelly et al. 2003). As a result, the analysis has focused on what might happen and why, rather than what has happened and the associated drivers. Making assessments of future adoption is also particularly difficult when a key factor is the nature and level of future institutional support.
Against this background the field trips made during this study were essential. First, they put the smallholder cattle enterprise in context from both a farming perspective and the household income context of historically meeting special expenditures. Second, they enabled ground-truthing of the ex-ante analysis of the potential gains from improved cattle performance through forage planting and management. Certainly, the evidence is anecdotal but the field observations provided consistent endorsement of observable gains in livestock performance and the high degree of interest and enthusiasm among both the best-bet and scale-out farmers.

ACIAR investment in research on forages in Indonesia (IAS 65) 51
Horne P.M., Magboo E., Kerridge P.C., Tuhlele M., Phimphachanhvongsod V., Gabunada F. Jr, Binh L.H. and Stür W.W. 2000. Participatory approaches to forage technology development with smallholders in South-East Asia. In ‘Working with farmers: the key to adoption of forage technologies’, ed. by W.W. Stür, P.M. Horne, J.B. Hacker and P.C. Kerridge. ACIAR Proceedings No. 95, 23–31. Australian Centre for International Agricultural Research: Canberra. Available at: <http://www.aciar.gov.au/publication/PR095>.
McDonald C., Lisson S., MacLeod N., Rachmat Rahman, Lalu Wirajaswadi, Tanda Panjaitan, Yusuf Sutaryono, Rusnadi Padjung, Sania Saenong, Syamsu Bahar, Corfield J., Ash A., Pengelly B. and Brennan L. 2004. A whole farm system approach to enhancing Bali cattle production in the mixed crop/livestock systems of eastern Indonesia. Pp. 1–8 in Proceedings Seminar Nasional Pemberdayaan Petani Miskin di Lahan Marginal Melalui Inovasi Teknologi Tepat Guna, Mataram 2004. Available at <http://ntb.litbang.deptan.go.id/ind/2004/MU/awhole.doc>
MacLeod N.S., McDonald C.K., Lisson S.N. and Rahman R. 2007. Modelling for scenario analysis for improved smallholder farming systems in Indonesia. Pp. 109–114 in ‘MODSIM 2007. International congress on modelling and simulation’, ed. by L. Oxley and D. Kulasiri. Modelling and Simulation Society of Australia and New Zealand, December 2007. At <www.mssanz.org.au/MODSIM07/papers/2_s44/ ModellingForScenario_s44_MacLeod_.pdf>.
Pengelly B.C. and Lisson S.N. 2001. Strategies for using improved forages to enhance production in Bali cattle. In ‘Strategies to improve Bali cattle in Indonesia’, ed. by K. Entwistle and D.R. Lindsay. ACIAR Proceedings 110, 29–33. Australian Centre for International Agricultural Research: Canberra.
Pengelly B.C., Whitbread A., Mazaiwana P.R. and Mukombe N. 2003. Tropical forage research for the future—better use of research resources to deliver adoption and benefits to farmers. Tropical Grasslands 37, 2007 –2216.
Shelton H.M., Franzel S. and Peters M. 2005. Adoption of tropical legume technology around the world: analysis of success. Tropical Grasslands 39, 198–209.
Alston J.M., Norton G. and Pardy P. 1998. Science under scarcity: principles and practices for agricultural research evaluation and priority setting. Cornell University Press: New York.
Ambarawati I.G.A.A., Xueyan Zhao, Griffith G. and Piggott R. 2003. Distribution of gains from cattle development in a multi-stage production system: the case of the Bali beef industry. Paper presented to the 47th Annual Conference of the Australian Agricultural and Resource Economics Society, Fremantle, Perth, Australia, 11–14 February 2003. At <http://www.aares.info/files/2003_ambarawati.pdf>.
Birner R., Davis K., Pender J., Nkonya E., Anandajayasekeram P., Ekboir J.M., Mbabu A.N., Spielman D.J., Horna D., Benin S. and Kisamba-Mugerwa W. 2006. From ‘best practice’ to ‘best fit’: a framework for designing and analyzing pluralistic agricultural advisory services. International Food Policy Research Institute: Washington, DC. At <http://www.ifpri.org/sites/default/files/publications/dsgdp37.pdf>.
Connell, J., Stür W. and Horne, P. 2010. Forages and farmers: case studies from South-East Asia. ACIAR Monograph No. 142, 9. Australian Centre for International Agricultural Research: Canberra; International Center for Tropical Agriculture: Vientiane.
Cramb R.A. 2000. Processes influencing the successful adoption of new technologies by smallholders. In ‘Working with farmers: the key to adoption of forage technologies’, ed. by W.W. Stür, P.M. Horne, J.B. Hacker and P.C. Kerridge. ACIAR Proceedings No. 95, 11–22. Australian Centre for International Agricultural Research: Canberra. Available at: <http://www.aciar.gov.au/publication/PR095>.
Davis J., Gordon J., Pearce D. and Templeton D. 2008. Guidelines for assessing the impacts of ACIAR’s research activities. ACIAR Impact Assessment Series No. 58. Australian Centre for International Agricultural Research: Canberra.
Hadi P.U., Ilham N., Thahar A., Winarso B., Vincent D. and Quirke D. 2002. Improving Indonesia’s beef industry. ACIAR Monograph No. 95, 116. Australian Centre for International Agricultural Research: Canberra.
References


ACIAR investment in research on forages in Indonesia (IAS 65) 53
Appendix Project results frame chart
Figure A1. ACIAR projects on forages in improving smallholder crop–livestock systems in eastern Indonesia: results frame chart
ADOPTION
Agents of change: researchers and OGTs; future: demonstration of farm success using best-bet activities, local farm groups; existing and expanded government extension services
ACIAR projects AS2/2000/124, AS2/2001/125, AS2/2000/103, LPS/2004/005, SMAR/2006/061, SMAR/2006/096
Commercialisation embodied in market• Ready access to forage
planting material from farmers
• Cattle buyers seeking younger, better finished cattle
Communication• Researchers as
extension advisors/training
• OGT as extension support
• Fact sheets, field days, farmer proponents
Capacity building• Researchers, extension
training, local farm groups
• OGTs: trained, experienced extension support
Regulation and policy• Some support to new
farmers conditional on adopting management proposals
• Probable integration with policy to increase cattle-owners’ incomes
OUTPUTS
Technology outputs• Benchmark database
of farming systems and constraints to adoption
• Demonstrated capacity to apply improved management systems through ‘best-bet’ activities for farmers
• Disease risk management
Scientific knowledge• Identification of
nutrition, reproduction and management links for improved cattle productivity/turn-off in local context
• Identification of suitable forage species and management options
Capacity built• Research capacity
to develop livestock management systems and resolve emerging issues
• ‘On-ground teams’ (OGTs) as future extension support
• ‘Best-bet’ farmers as forage suppliers and promoters of the approach
Policy analysis and response• Recognition of early
success through OGT approach, in achieving demonstration farm and early scale out (farmers) and scale up (institutions)
continued on next page …

54 ACIAR investment in research on forages in Indonesia (IAS 65)
Figure A1. (continued)
EXPECTED OUTCOMES
Changes in forage supply and cattle management practices by current and future smallholders
Demand• Better finished
cattle being sought out by the trade
Supply• Higher productivity through faster
growth and higher reproduction efficiency leading to higher total annual cattle turn-off weight
• Lower cost of forage especially labour savings, enabling employment elsewhere (on and off farm)
• Similar gains likely to accrue to larger farmers
Environment• Conversion of
unused, weed areas into forage crops
• Potential effective use of dung as fertiliser
• Reduced grazing impact on upland forest/community land
Social• Higher household
incomes for smallholders with cattle
• Livelihood improvement: e .g . housing, education
• Increased opportunity for off-farm work/employment by farmer and family
ANTICIPATED RISKS
EXPECTED IMPACTS
Limited widespread adoption (especially scale-out to other villages); partial adoption of best-bet set of management activities
Economic• Higher farm income (cattle and
other sources)• Greater capacity to manage timing
of cattle sales given seasonal variation in feed supply and household cash flow requirements
Environmental• Reduced weed invasion• Reduced land degradation in
upland areas
Social• Increased family income• Increased opportunity for other
activities (employment/family)
Value delivered by outcomes
continued from previous page …

ACIAR investment in research on forages in Indonesia (IAS 65) 55
Figure A2. Summary chart on capacity-building aspects of ACIAR projects on forages in improving smallholder crop–livestock systems in eastern Indonesia
Outputs
Outcomes
Technical
Professional development• Researchers• OGT
Capacity
Adoption by farmers• Capacity for farmers to adopt best-
bet activities/strategies established• Substantial scale-out expected,
given relatively straightforward best-bet activities, low risks and little cost
Policy analysis
Changes in regulation/policy• Move away from past policy of
artificial insemination evident• Probable that scope of ‘increasing
cattle numbers’ policy will be reviewed to focus on increasing turn-off weight
Capacity utilised
Individual• Competence• Income• Confidence• Promotion
Capacity built
Inputs• Financial: ACIAR• CSIRO: in kind• Indonesia
(universities): in kind
• Training/time, especially technical staff
Individual capacity built• Knowledge by researchers—
Indonesian and Australian• On-ground team (OGT) members• Technical skills of research support
staff• Research project management skills• Personal development—researchers
and OGTs, and extension workers and farmers
Aggregate capacity built• Improved stock of knowledge: best-
bet activities, forage species• Major increase in extension support
capability (through OGTs)• Understanding of the issues; capacity
to communicate to other agencies and train extension staff
• Significant improvement in farmers’ knowledge and understanding
Organisational
Efficiency• Direct and sustainable
mechanism for increasing farmers’ incomes
• Low-risk, incremental, change for farmers
• Enables farmers to individually choose to adopt or not
• Enables productivity and income increase without apparent adverse environmental or social effects
Innovation• Integrated systems
approach to improving productivity
• Profitable, low-risk, best-bet activities developed through farmer involvement
• OGT model demonstrated to be an effective approach to implementing change
Effectiveness within policy environment• Indonesian researchers
reputation/position established as a source of advice
• Relationships to be built with other agencies, especially those responsible for extension training and extension

No. Author(s) and year of publication Title ACIAR project numbers
1 Centre for International Economics 1998.
Control of Newcastle disease in village chickens AS1/1983/034, AS1/1987/017 and AS1/1993/222
2 George P.S. 1998. Increased efficiency of straw utilisation by cattle and buffalo
AS1/1982/003, AS2/1986/001 and AS2/1988/017
3 Centre for International Economics 1998.
Establishment of a protected area in Vanuatu ANRE/1990/020
4 Watson A.S. 1998. Raw wool production and marketing in China ADP/1988/011
5 Collins D.J. and Collins B.A. 1998. Fruit fly in Malaysia and Thailand 1985–1993 CS2/1983/043 and CS2/1989/019
6 Ryan J.G. 1998. Pigeonpea improvement CS1/1982/001 and CS1/1985/067
7 Centre for International Economics 1998.
Reducing fish losses due to epizootic ulcerative syndrome—an ex ante evaluation
FIS/1991/030
8 McKenney D.W. 1998. Australian tree species selection in China FST/1984/057 and FST/1988/048
9 ACIL Consulting 1998. Sulfur test KCL–40 and growth of the Australian canola industry
PN/1983/028 and PN/1988/004
10 AACM International 1998. Conservation tillage and controlled traffic LWR2/1992/009
11 Chudleigh P. 1998. Postharvest R&D concerning tropical fruits PHT/1983/056 and PHT/1988/044
12 Waterhouse D., Dillon B. and Vincent D. 1999.
Biological control of the banana skipper in Papua New Guinea
CS2/1988/002-C
13 Chudleigh P. 1999. Breeding and quality analysis of rapeseed CS1/1984/069 and CS1/1988/039
14 McLeod R., Isvilanonda S. and Wattanutchariya S. 1999.
Improved drying of high moisture grains PHT/1983/008, PHT/1986/008 and PHT/1990/008
15 Chudleigh P. 1999. Use and management of grain protectants in China and Australia
PHT/1990/035
16 McLeod R. 2001. Control of footrot in small ruminants of Nepal AS2/1991/017 and AS2/1996/021
17 Tisdell C. and Wilson C. 2001. Breeding and feeding pigs in Australia and Vietnam AS2/1994/023
18 Vincent D. and Quirke D. 2002. Controlling Phalaris minor in the Indian rice–wheat belt
CS1/1996/013
19 Pearce D. 2002. Measuring the poverty impact of ACIAR projects— a broad framework
20 Warner R. and Bauer M. 2002. Mama Lus Frut scheme: an assessment of poverty reduction
ASEM/1999/084
21 McLeod R. 2003. Improved methods in diagnosis, epidemiology, and information management of foot-and-mouth disease in Southeast Asia
AS1/1983/067, AS1/1988/035, AS1/1992/004 and AS1/1994/038
22 Bauer M., Pearce D. and Vincent D. 2003.
Saving a staple crop: impact of biological control of the banana skipper on poverty reduction in Papua New Guinea
CS2/1988/002-C
23 McLeod R. 2003. Improved methods for the diagnosis and control of bluetongue in small ruminants in Asia and the epidemiology and control of bovine ephemeral fever in China
AS1/1984/055, AS2/1990/011 and AS2/1993/001
24 Palis F.G., Sumalde Z.M. and Hossain M. 2004.
Assessment of the rodent control projects in Vietnam funded by ACIAR and AUSAID: adoption and impact
AS1/1998/036
IMPACT ASSESSMENT SERIES

No. Author(s) and year of publication Title ACIAR project numbers
25 Brennan J.P. and Quade K.J. 2004. Genetics of and breeding for rust resistance in wheat in India and Pakistan
CS1/1983/037 and CS1/1988/014
26 Mullen J.D. 2004. Impact assessment of ACIAR-funded projects on grain-market reform in China
ANRE1/1992/028 and ADP/1997/021
27 van Bueren M. 2004. Acacia hybrids in Vietnam FST/1986/030
28 Harris D. 2004. Water and nitrogen management in wheat–maize production on the North China Plain
LWR1/1996/164
29 Lindner R. 2004. Impact assessment of research on the biology and management of coconut crabs on Vanuatu
FIS/1983/081
30 van Bueren M. 2004. Eucalypt tree improvement in China FST/1990/044, FST/1994/025, FST/1984/057, FST/1988/048, FST/1987/036, FST/1996/125 and FST/1997/077
31 Pearce D. 2005. Review of ACIAR’s research on agricultural policy
32 Tingsong Jiang and Pearce D. 2005. Shelf-life extension of leafy vegetables—evaluating the impacts
PHT/1994/016
33 Vere D. 2005. Research into conservation tillage for dryland cropping in Australia and China
LWR2/1992/009, LWR2/1996/143
34 Pearce D. 2005. Identifying the sex pheromone of the sugarcane borer moth
CS2/1991/680
35 Raitzer D.A. and Lindner R. 2005. Review of the returns to ACIAR’s bilateral R&D investments
36 Lindner R. 2005. Impacts of mud crab hatchery technology in Vietnam FIS/1992/017 and FIS/1999/076
37 McLeod R. 2005. Management of fruit flies in the Pacific CS2/1989/020, CS2/1994/003, CS2/1994/115 and CS2/1996/225
38 ACIAR 2006. Future directions for ACIAR’s animal health research
39 Pearce D., Monck M., Chadwick K. and Corbishley J. 2006.
Benefits to Australia from ACIAR-funded research FST/1993/016, PHT/1990/051, CS1/1990/012, CS1/1994/968, AS2/1990/028, AS2/1994/017, AS2/1994/018 and AS2/1999/060
40 Corbishley J. and Pearce D. 2006. Zero tillage for weed control in India: the contribution to poverty alleviation
CS1/1996/013
41 ACIAR 2006. ACIAR and public funding of R&D. Submission to Productivity Commission study on public support for science and innovation
42 Pearce D. and Monck M. 2006. Benefits to Australia of selected CABI products
43 Harris D.N. 2006. Water management in public irrigation schemes in Vietnam
LWR2/1994/004 and LWR1/1998/034
44 Gordon J. and Chadwick K. 2007. Impact assessment of capacity building and training: assessment framework and two case studies
CS1/1982/001, CS1/1985/067, LWR2/1994/004 and LWR2/1998/034
45 Turnbull J.W. 2007. Development of sustainable forestry plantations in China: a review
46 Monck M. and Pearce D. 2007. Mite pests of honey bees in the Asia–Pacific region AS2/1990/028, AS2/1994/017, AS2/1994/018 and AS2/1999/060
IMPACT ASSESSMENT SERIES <continued>

IMPACT ASSESSMENT SERIES <continued>
No. Author(s) and year of publication Title ACIAR project numbers
47 Fisher H. and Gordon J. 2007. Improved Australian tree species for Vietnam FST/1993/118 and FST/1998/096
48 Longmore C., Gordon J., and Bantilan M.C. 2007.
Assessment of capacity building: overcoming production constraints to sorghum in rainfed environments in India and Australia
CS1/1994/968
49 Fisher H. and Gordon J. 2007. Minimising impacts of fungal disease of eucalypts in South-East Asia
FST/1994/041
50 Monck M. and Pearce D. 2007. Improved trade in mangoes from the Philippines, Thailand and Australia
PHT/1990/051 and CS1/1990/012
51 Corbishley J. and Pearce D. 2007. Growing trees on salt-affected land FST/1993/016
52 Fisher H. and Gordon J. 2008. Breeding and feeding pigs in Vietnam: assessment of capacity building and an update on impacts
AS2/1994/023
53 Monck M. and Pearce D. 2008. The impact of increasing efficiency and productivity of ruminants in India by the use of protected-nutrient technology
AH/1997/115
54 Monck M. and Pearce D. 2008. Impact of improved management of white grubs in peanut-cropping systems
CS2/1994/050
55 Martin G. 2008. ACIAR fisheries projects in Indonesia: review and impact assessment
FIS/1997/022, FIS/1997/125, FIS/2000/061, FIS/2001/079, FIS/2002/074, FIS/2002/076, FIS/2005/169 and FIS/2006/144
56 Lindner B. and McLeod P. 2008. A review and impact assessment of ACIAR’s fruit-fly research partnerships – 1984 to 2007
CS2/1983/043, CS2/1989/019, CS2/1989/020, CS2/1994/003, CS2/1994/115, CS2/1996/225, CS2/1997/101, CS2/1998/005, CS2/2003/036, CP/2007/002, CP/2007/187, PHT/1990/051, PHT/1994/133, PHT/1993/87, CP/1997/079, CP/2001/027 and CP/2002/086
57 Montes N.D., Zapata Jr N.R., Alo A.M.P. and Mullen J.D. 2008.
Management of internal parasites in goats in the Philippines
AS1/1997/133
58 Davis J., Gordon J., Pearce D. and Templeton D. 2008.
Guidelines for assessing the impacts of ACIAR’s research activities
59 Chupungco A., Dumayas E. and Mullen J. 2008.
Two-stage grain drying in the Philippines PHT/1983/008, PHT/1986/008, PHT/1990/008
60 Centre for International Economics 2009.
ACIAR Database for Impact Assessments (ADIA): an outline of the database structure and a guide to its operation
61 Fisher H. and Pearce D. 2009. Salinity reduction in tannery effluents in India and Australia
AS1/2001/005
62 Francisco S.R., Mangabat M.C., Mataia A.B., Acda M.A., Kagaoan C.V., Laguna J.P., Ramos M., Garabiag K.A., Paguia F.L. and Mullen J.D. 2009.
Integrated management of insect pests of stored grain in the Philippines
PHT/1983/009, PHT/1983/011, PHT/1986/009 and PHT/1990/009
63 Harding M., Tingsong Jiang and Pearce D. 2009.
Analysis of ACIAR’s returns on investment: appropriateness, efficiency and effectiveness
64 Mullen J.D. 2010. Reform of domestic grain markets in China: a reassessment of the contribution of ACIAR-funded economic policy research
ANRE1/1992/028 and ADP/1997/021

No. Author(s) and year of publication Title ACIAR project numbers
65 Martin G. 2010. ACIAR investment in research on forages in Indonesia AS2/2000/124, AS2/2001/125, AS2/2000/103, LPS/2004/005, SMAR/2006/061, SMAR/2006/096
IMPACT ASSESSMENT SERIES <continued>


ACIAR investm
ent in research on forages in Indonesia65