Embed Size (px)
Citation preview

76ACIAR IMPACT ASSESSMENT SERIES
The contribution of agricultural growth to poverty reduction

The contribution of agricultural growth to poverty reduction
2012
Bhajan Grewal, Helena Grunfeld and Peter Sheehan

The Australian Centre for International Agricultural Research (ACIAR) was established in June 1982 by an Act of the Australian Parliament. ACIAR operates as part of Australia’s international development cooperation program, with a mission to achieve more productive and sustainable agricultural systems, for the benefit of developing countries and Australia. It commissions collaborative research between Australian and developing-country researchers in areas where Australia has special research competence. It also administers Australia’s contribution to the International Agricultural Research Centres.
Where trade names are used this constitutes neither endorsement of nor discrimination against any product by the Centre.
ACIAR IMPACT ASSESSMENT SERIES
ACIAR seeks to ensure that the outputs of the research it funds are adopted by farmers, policymakers, quarantine officers and other beneficiaries. In order to monitor the effects of its projects, ACIAR commissions independent assessments of selected projects. This series of publications reports the results of these independent studies. Numbers in this series are distributed internationally to selected individuals and scientific institutions, and are also available from ACIAR’s website at <aciar.gov.au>.
© Australian Centre for International Agricultural Research (ACIAR) 2012
This work is copyright. Apart from any use as permitted under the Copyright Act 1968, no part may be reproduced by any process without prior written permission from ACIAR, GPO Box 1571, Canberra ACT 2601, Australia, [email protected]
Grewal B., Grunfeld H. and Sheehan P. 2012. The contribution of agricultural growth to poverty reduction. ACIAR Impact Assessment Series Report No. 76. Australian Centre for International Agricultural Research: Canberra. 59 pp.
ACIAR Impact Assessment Series – ISSN 1832-1879 (print); ISSN 1839-6097 (online)
ISBN 978 1 921962 27 1 (print)ISBN 978 1 921962 28 8 (online)
Editing and design by Clarus DesignPrinting by Elect Printing

The contribution of agricultural growth to poverty reduction (IAS 76) 3
The Australian Centre for International Agricultural Research (ACIAR) commissions research that leads to more productive and sustainable agriculture for its developing-country partners. In line with Australia’s development-assistance strategy, ACIAR’s program of research has adopted a greater focus on poverty reduction over the past decade. The success of this approach was highlighted in the Australian Government’s response to the review of aid effectiveness, with the acknowledgement that agricultural research remains an important driver of agricultural productivity. The Government’s response endorses ACIAR’s role in research and recognises the impressive results from its work.
There is general consensus that, since 1980, there has been a significant reduction in poverty in many developing countries, with some countries achieving ahead of time the Millennium Development Goal of halving extreme poverty by 2015. Many studies pointed to the strong link between agricultural growth and poverty reduction. Nevertheless, the interest of government policymakers and the donor organisations in agriculture declined from the 1980s onwards, regaining momentum only when the price of staple food crops started to rise sharply in the mid 2000s.
This report outlines the poverty experiences of five countries— China, India, Indonesia, South Africa and Vietnam—all of which have been substantial long-term research partners with ACIAR. The poverty status of each country was examined in terms of monetary
(unidimensional) indicators and an emerging alternative indicator, the Multidimensional Poverty Index. The key linkages between agricultural development and poverty reduction are defined, with the forms of rural development most conducive to poverty reduction examined.
The authors concluded that all the countries studied in this report had made substantial progress in reducing poverty, although their performance had been uneven. While the largest reductions had been achieved in China and Vietnam, Indonesia had also made impressive progress. Poverty reduction in South Africa was slow and heavily dependent on social protection, because of the retarded growth in sustainable employment generation. India, the country with the largest number of poor in the world, had made slow but steady progress in poverty reduction.
The report stresses that, regardless of past performance, major challenges remain ahead for all five countries. Such challenges must be tackled to achieve further reductions in poverty and reduce vulnerabilities due to external shocks. This advice should prove valuable to ACIAR in assessing future program directions.
Nick AustinChief Executive Officer, ACIAR
Foreword


The contribution of agricultural growth to poverty reduction (IAS 76) 5
Contents
Foreword . . . . . . . . . . . . . . . . . . . . . . . . . . . . . . . . . . . . . . . . . . . . . . . . . . . . . . . . . . . . . . . . . . . . . . . . . . . . . . . . . . . . . . . . . . . . . . . . . . . . . . . . . . . . . . . . . . . . . . 3
Abbreviations . . . . . . . . . . . . . . . . . . . . . . . . . . . . . . . . . . . . . . . . . . . . . . . . . . . . . . . . . . . . . . . . . . . . . . . . . . . . . . . . . . . . . . . . . . . . . . . . . . . . . . . . . . . . . . . . . 7
Acknowledgments . . . . . . . . . . . . . . . . . . . . . . . . . . . . . . . . . . . . . . . . . . . . . . . . . . . . . . . . . . . . . . . . . . . . . . . . . . . . . . . . . . . . . . . . . . . . . . . . . . . . . . . . . . . . 8
Executive summary . . . . . . . . . . . . . . . . . . . . . . . . . . . . . . . . . . . . . . . . . . . . . . . . . . . . . . . . . . . . . . . . . . . . . . . . . . . . . . . . . . . . . . . . . . . . . . . . . . . . . . . . . . . 9
1 Introduction . . . . . . . . . . . . . . . . . . . . . . . . . . . . . . . . . . . . . . . . . . . . . . . . . . . . . . . . . . . . . . . . . . . . . . . . . . . . . . . . . . . . . . . . . . . . . . . . . . . . . . . . . . . . .14
2 Conceptual issues . . . . . . . . . . . . . . . . . . . . . . . . . . . . . . . . . . . . . . . . . . . . . . . . . . . . . . . . . . . . . . . . . . . . . . . . . . . . . . . . . . . . . . . . . . . . . . . . . . . . . . .16
2.1 Monetary income measures . . . . . . . . . . . . . . . . . . . . . . . . . . . . . . . . . . . . . . . . . . . . . . . . . . . . . . . . . . . . . . . . . . . . . . . . . . . . . . . . . . . . . . . . .16
2.2 Unidimensional indicators . . . . . . . . . . . . . . . . . . . . . . . . . . . . . . . . . . . . . . . . . . . . . . . . . . . . . . . . . . . . . . . . . . . . . . . . . . . . . . . . . . . . . . . . . . .17
2.3 Multidimensional indicators . . . . . . . . . . . . . . . . . . . . . . . . . . . . . . . . . . . . . . . . . . . . . . . . . . . . . . . . . . . . . . . . . . . . . . . . . . . . . . . . . . . . . . . . .17
2.4 Rural and urban poverty . . . . . . . . . . . . . . . . . . . . . . . . . . . . . . . . . . . . . . . . . . . . . . . . . . . . . . . . . . . . . . . . . . . . . . . . . . . . . . . . . . . . . . . . . . . . .21
2.5 Poverty and social exclusion . . . . . . . . . . . . . . . . . . . . . . . . . . . . . . . . . . . . . . . . . . . . . . . . . . . . . . . . . . . . . . . . . . . . . . . . . . . . . . . . . . . . . . . . .22
2.6 Policy implications of poverty measurements . . . . . . . . . . . . . . . . . . . . . . . . . . . . . . . . . . . . . . . . . . . . . . . . . . . . . . . . . . . . . . . . . . . . . . .23
3 Incidence of poverty . . . . . . . . . . . . . . . . . . . . . . . . . . . . . . . . . . . . . . . . . . . . . . . . . . . . . . . . . . . . . . . . . . . . . . . . . . . . . . . . . . . . . . . . . . . . . . . . . . . .24
3.1 China . . . . . . . . . . . . . . . . . . . . . . . . . . . . . . . . . . . . . . . . . . . . . . . . . . . . . . . . . . . . . . . . . . . . . . . . . . . . . . . . . . . . . . . . . . . . . . . . . . . . . . . . . . . . . . . . .24
3.2 India . . . . . . . . . . . . . . . . . . . . . . . . . . . . . . . . . . . . . . . . . . . . . . . . . . . . . . . . . . . . . . . . . . . . . . . . . . . . . . . . . . . . . . . . . . . . . . . . . . . . . . . . . . . . . . . . . .25
3.3 Indonesia . . . . . . . . . . . . . . . . . . . . . . . . . . . . . . . . . . . . . . . . . . . . . . . . . . . . . . . . . . . . . . . . . . . . . . . . . . . . . . . . . . . . . . . . . . . . . . . . . . . . . . . . . . . . .26
3.4 South Africa . . . . . . . . . . . . . . . . . . . . . . . . . . . . . . . . . . . . . . . . . . . . . . . . . . . . . . . . . . . . . . . . . . . . . . . . . . . . . . . . . . . . . . . . . . . . . . . . . . . . . . . . .27
3.5 Vietnam . . . . . . . . . . . . . . . . . . . . . . . . . . . . . . . . . . . . . . . . . . . . . . . . . . . . . . . . . . . . . . . . . . . . . . . . . . . . . . . . . . . . . . . . . . . . . . . . . . . . . . . . . . . . . .28
4 Agriculture and poverty reduction . . . . . . . . . . . . . . . . . . . . . . . . . . . . . . . . . . . . . . . . . . . . . . . . . . . . . . . . . . . . . . . . . . . . . . . . . . . . . . . . . . . . .29
4.1 Does growth in agriculture reduce poverty? . . . . . . . . . . . . . . . . . . . . . . . . . . . . . . . . . . . . . . . . . . . . . . . . . . . . . . . . . . . . . . . . . . . . . . . .29
4.2 Agriculture, economic growth and structural change . . . . . . . . . . . . . . . . . . . . . . . . . . . . . . . . . . . . . . . . . . . . . . . . . . . . . . . . . . . . . . .32
5 Agriculture and poverty: country perspectives . . . . . . . . . . . . . . . . . . . . . . . . . . . . . . . . . . . . . . . . . . . . . . . . . . . . . . . . . . . . . . . . . . . . . . . .34
5.1 China . . . . . . . . . . . . . . . . . . . . . . . . . . . . . . . . . . . . . . . . . . . . . . . . . . . . . . . . . . . . . . . . . . . . . . . . . . . . . . . . . . . . . . . . . . . . . . . . . . . . . . . . . . . . . . . . .34
5.2 India . . . . . . . . . . . . . . . . . . . . . . . . . . . . . . . . . . . . . . . . . . . . . . . . . . . . . . . . . . . . . . . . . . . . . . . . . . . . . . . . . . . . . . . . . . . . . . . . . . . . . . . . . . . . . . . . . .35
5.3 Indonesia . . . . . . . . . . . . . . . . . . . . . . . . . . . . . . . . . . . . . . . . . . . . . . . . . . . . . . . . . . . . . . . . . . . . . . . . . . . . . . . . . . . . . . . . . . . . . . . . . . . . . . . . . . . . .38
5.4 South Africa . . . . . . . . . . . . . . . . . . . . . . . . . . . . . . . . . . . . . . . . . . . . . . . . . . . . . . . . . . . . . . . . . . . . . . . . . . . . . . . . . . . . . . . . . . . . . . . . . . . . . . . . .40
5.5 Vietnam . . . . . . . . . . . . . . . . . . . . . . . . . . . . . . . . . . . . . . . . . . . . . . . . . . . . . . . . . . . . . . . . . . . . . . . . . . . . . . . . . . . . . . . . . . . . . . . . . . . . . . . . . . . . . .41
6 The neglect of agriculture . . . . . . . . . . . . . . . . . . . . . . . . . . . . . . . . . . . . . . . . . . . . . . . . . . . . . . . . . . . . . . . . . . . . . . . . . . . . . . . . . . . . . . . . . . . . . . .43
6.1 Why has agriculture been neglected by policymakers and investors? . . . . . . . . . . . . . . . . . . . . . . . . . . . . . . . . . . . . . . . . . . . . . . .43
6.2 The untapped potential of agriculture . . . . . . . . . . . . . . . . . . . . . . . . . . . . . . . . . . . . . . . . . . . . . . . . . . . . . . . . . . . . . . . . . . . . . . . . . . . . . .46

6 The contribution of agricultural growth to poverty reduction (IAS 76)
7 Conclusions . . . . . . . . . . . . . . . . . . . . . . . . . . . . . . . . . . . . . . . . . . . . . . . . . . . . . . . . . . . . . . . . . . . . . . . . . . . . . . . . . . . . . . . . . . . . . . . . . . . . . . . . . . . . . .49
References . . . . . . . . . . . . . . . . . . . . . . . . . . . . . . . . . . . . . . . . . . . . . . . . . . . . . . . . . . . . . . . . . . . . . . . . . . . . . . . . . . . . . . . . . . . . . . . . . . . . . . . . . . . . . . . . . . . .52
Figures
1 Sectoral shares (%) of gross domestic product (GDP) in Indonesia, 1971–2010 . . . . . . . . . . . . . . . . . . . . . . . . . . . . . . . . .39
2 Sectoral shares (%) of employment in Indonesia, 1971–2010 . . . . . . . . . . . . . . . . . . . . . . . . . . . . . . . . . . . . . . . . . . . . . . . . . . . .39
Tables
1 Data sources for the Multidimensional Poverty Index . . . . . . . . . . . . . . . . . . . . . . . . . . . . . . . . . . . . . . . . . . . . . . . . . . . . . . . . . . . .20
2 Incidence of poverty using monetary indicators and the Multidimensional Poverty Index . . . . . . . . . . . . . . . . . . . . . .21
3 Alternative poverty measures for China, India, Indonesia, South Africa and Vietnam . . . . . . . . . . . . . . . . . . . . . . . . . . .25
4 Percentage of poverty in rural and urban populations in India . . . . . . . . . . . . . . . . . . . . . . . . . . . . . . . . . . . . . . . . . . . . . . . . . . .26
5 Poverty shift by race of household head in South Africa, 1995–2005 . . . . . . . . . . . . . . . . . . . . . . . . . . . . . . . . . . . . . . . . . . . .27
6 Share of agriculture in gross domestic product (GDP) and total employment in India . . . . . . . . . . . . . . . . . . . . . . . . . .36
7 Growth rates of gross value of output in Indian agriculture and allied sectors . . . . . . . . . . . . . . . . . . . . . . . . . . . . . . . . . . .38
8 Agricultural total factor productivity (TFP) growth by country and region . . . . . . . . . . . . . . . . . . . . . . . . . . . . . . . . . . . . . .46

The contribution of agricultural growth to poverty reduction (IAS 76) 7
OECD Organisation for Economic Co-operation and Development
OPHI Oxford Poverty and Human Development Initiative
R&D research and development
TFP total factor productivity
UN United Nations
UNDP United Nations Development Programme
ACIAR Australian Centre for International Agricultural Research
GDP gross domestic product
HDI Human Development Index
HDR Human Development Report
HPI Human Poverty Index
IFAD International Fund for Agricultural Development
MDG Millennium Development Goal/s
MPI Multidimensional Poverty Index
Abbreviations

8 The contribution of agricultural growth to poverty reduction (IAS 76)
The five case-study reports are available on the CSES website at <http://www.vu.edu.au/centre-for-strategic-economic-studies>. The authors are grateful for the contributions from the country experts, and for the other support that they have received. They also wish to acknowledge the valuable input from participants at a project workshop held at Victoria University in Melbourne on 6 May 2011.
This report describing the results of the project was written by Professor Bhajan Grewal and Ms Helena Grunfeld of the Centre for Strategic Economic Studies (CSES), Victoria University, supported by Professor Peter Sheehan and Mrs Margarita Kumnick of CSES and Dr Abdullahi Ahmed of the Central Queensland University. It drew heavily on five case-study reports prepared for the project by individuals with expert knowledge of the five countries:
China—Dr Enjiang Cheng, International Poverty Reduction Centre of China, Beijing, and Dr Yu Jiantuo, China Development Research Foundation, Beijing
India—Professor Alakh Sharma, Director of the Institute for Human Development, New Delhi
Indonesia—Professor Asep Suryahadi, Director, SMERU1 Research Institute, Jakarta
South Africa—Professor Haroon Bhorat, University of Cape Town
Vietnam—Professor Adam Fforde, CSES
1 Originally stood for ‘Social Monitoring and Early Response Unit’, but now used as a stand-alone title.
Acknowledgments

The contribution of agricultural growth to poverty reduction (IAS 76) 9
studied in this report have made substantial progress in reducing poverty, although their performance has been uneven. While the largest reductions have been made in China and Vietnam, Indonesia has also made impressive progress. Poverty reduction in South Africa has been slow and heavily dependent on social protection. India, the country with the largest number of poor in the world, has made slow but steady progress in poverty reduction. Regardless of past performance, major challenges remain for all these countries to achieve further reductions in poverty and reduce vulnerabilities due to external shocks.
Growth in agriculture—an important driver of poverty reduction
The literature on poverty concludes that the potential to make a significant contribution to poverty reduction is related to the composition of, and growth in, economic sectors (agriculture, industry, services) in developing countries. Most studies also come to the conclusion that growth in agriculture is highly beneficial for poverty reduction, although the importance of agriculture diminishes as economies grow and become more diversified.
The importance of agriculture in poverty reduction derives from two basic circumstances: (a) the incidence of poverty is disproportionately high in developing countries, which still rely heavily on agriculture for output and employment; and (b) as the poorest households also have few assets and no skills, they typically rely more on agriculture, and generally face many obstacles in connecting with the non-agricultural economy for income and employment. As a result, poverty in developing countries is primarily rural, as
Poverty—a multidimensional concept
Poverty is now increasingly acknowledged to be a multidimensional concept that encapsulates deprivations in several dimensions that limit opportunities for a happy, healthy and productive life. The key deprivations include income poverty, hunger, malnutrition, gender bias, social exclusion, and lack of access to education, health services and housing. There has been a shift away from focusing only on income or consumption towards defining poverty as a multidimensional condition and developing adequate ways of measuring it over time and across nations. The Multidimensional Poverty Index (MPI) launched in 2010 by the United Nations Development Programme (UNDP) and the Oxford Poverty and Human Development Initiative (OPHI) at the University of Oxford are the latest among several multidimensional measures of poverty. Most countries are still using poverty measures based on income or consumption, primarily for ease of temporal comparisons of progress, although some countries have expressed a clear intention of adopting the MPI in the future. Vietnam is one such example.
Poverty has declined, but challenges remain
The incidence of poverty depends on the particular measures used, but there is general consensus that, since 1980, there has been a significant reduction in poverty in developing countries, some of which have achieved ahead of time the Millennium Development Goal of halving extreme poverty by 2015. All the countries
Executive summary

10 The contribution of agricultural growth to poverty reduction (IAS 76)
poverty, but non-agricultural growth is more powerful in reducing poverty among the better-off poor (i.e. income ≤US$2.00 per day). The effectiveness of agriculture in reducing extreme poverty is also known to decline as countries become richer and as income inequality increases, but whether this is due to the declining role of agriculture in overall production or to a declining impact of each additional unit of agricultural value-added on poverty is a matter requiring further examination.
The variable importance of agriculture in reducing poverty
The poverty-reducing impact of agriculture varies across countries for several reasons, including the types of agriculture, the relative size and growth rate of agriculture in comparison with the non-agriculture sectors, the level of public and private investment in agriculture, and the level of government policy support.
China
Agriculture is recognised as having been the major source of poverty reduction in the initial stages of China’s rural reforms in the 1980s, when the household responsibility system, combined with supportive policies, public investments in infrastructure, and research and development, unleashed massive gains in agricultural productivity. A related aspect of agricultural growth in China is that it reduced urban–rural income disparities, whereas industrial growth accentuated them. Some estimates suggest that, if the same aggregate growth rate had been balanced across China’s economic sectors, the same reduction in poverty rates could have been achieved in half the time—10 years rather than 20 (Ravallion 2008).
India
Growth rates in Indian agriculture have been modest, ranging from 2.6% per annum in the 1950s, falling to 1.7% in the 1970s, rising to 2.0% in the 1980s, then rising for the first time to, and staying at, 3.2% per annum in the 1990s and in the 2000s. A 4.0% target for agricultural growth was set in the 11th Five Year Plan, but on the basis of the Mid-term Appraisal of the 11th Plan, it is now accepted that the best that can be expected is about
nearly 72% of those in poverty in these countries live in rural areas (IFAD 2010). In Sub-Saharan Africa the figure is 75% and in South Asia it is more than 80%. Social and economic exclusion further reduces alternative opportunities that may be open to certain minority groups, including women, youth, ethnic minorities and Indigenous people. Thus, by providing a greater share in employment of the poor and the unskilled workforce, agriculture plays, either directly or indirectly, a crucial role in making economic growth more pro-poor.
The impact of agriculture on poverty reduction depends on the interaction of several effects. First of all, the direct effect of growth in the agriculture sector is to raise the income levels of those employed in this sector. Many poor people have a marginal attachment to employment in agriculture, and growth in the sector will provide them with more substantial and/or better remunerated employment. Second, how much the poor people benefit from agricultural growth depends on the rate and nature of their participation in agriculture. This remains high in many developing countries, but can vary, depending, for example, on the type of agriculture or the ownership structure in a particular location. In India, for instance, rapid growth rates in livestock agriculture have contributed to poverty reduction because of the high labour intensity of this subsector. Third, growth in agricultural incomes generally will provide increased demand for both rural and urban services in surrounding areas, some of which (e.g. construction, transport and personal services) can be provided by poor people.
Many studies provide empirical support for the view that agricultural growth has been a major driver of poverty reduction in the developing world. In addition to agriculture and construction, some services also help in poverty reduction by employing unskilled workers. In Indonesia, for example, urban services have been identified as the most important source of poverty reduction, although whether the growth in these services can be linked to the expansion of agriculture needs to be explored further.
In recent years, some studies have provided more nuanced, and qualified, support for the role of agriculture in poverty reduction, by suggesting that growth in agriculture plays a leading role in the reduction of extreme (i.e. income ≤US$1.25 per day)

The contribution of agricultural growth to poverty reduction (IAS 76) 11
2005 still almost half of South Africans were living in poverty, according to the national Cost of Basic Needs poverty line. Thanks to the social protection programs put in place by the Government of South Africa, access by poor households to most of the basic services has increased significantly since 1994, but the poorest households still lack adequate access to all assets, in particular to piped water and flush or chemical toilets.
South Africa is very different from the other four countries studied, as its economy consists of an advanced, modern sector coexisting with typical developing-country institutions and problems. In agriculture, this is manifested in a mix of large-scale commercial agribusiness and small-scale agriculture, together with rapid structural change. As a result of the structural transformation that has occurred in the South African economy, only 5.1% of South Africa’s workforce is employed in agriculture, and this sector lost 594,000 jobs between 1995 and 2009.
The South African economy is going through a difficult period. While employment in commercial agriculture has fallen, growth of the non-agriculture sectors has not been rapid enough to absorb the growth in the labour force. Employment growth has been concentrated in two main sectors—wholesale and retail trade, and financial and business services—which are together responsible for two-thirds of total employment growth since 1994. Despite the emphasis given by the South African Government on the role of agriculture in contributing to economic growth and job creation, the scope for this might be limited unless several issues are resolved. The most critical include support for emerging farmers, in terms of skills development, improved support and extension services, improved access to financial services, and further progress with the land redistribution process.
Vietnam
According to standard income measures, the poverty rate in Vietnam fell from 58.1% in 1993 to only 19.5% in 2004. While alternative measures may give different results, the overall finding of a substantial reduction in poverty in Vietnam over the past two decades or so is widely endorsed. It is also clear that agriculture has played a key role in this reduction—rapid growth in Vietnam’s agriculture (4.1% per annum growth over 1990–2008) has opened pathways out of poverty for
3.0%. In recent years, growth in India’s gross domestic product (GDP) has been driven by the services sector, but employment in this sector has been growing at a slower pace than its output. Furthermore, the poor and the unskilled cannot find employment in the rapidly growing, high-skill areas of the services sector.
India’s agriculture sector is dominated by the crops subsector, which accounts for more than 42% of the total value of agricultural output. The other subsectors, with their shares in total agricultural output in brackets, are livestock (24%), horticulture (20%), forestry (10%) and fisheries (4%). The livestock subsector has been growing strongly since 1980, and this growth is considered to be particularly helpful for poverty reduction, and gender and social equity. This subsector employs about 21 million people. It is an important source of livelihood for smallholders and landless labourers. The distribution of livestock is also more egalitarian than that of land.
Indonesia
In Indonesia, growth in agriculture has been found to be not the most effective source of poverty reduction. Growth in urban services appears to have had a greater impact on poverty reduction, in both urban and rural areas, than growth in agriculture. The role of agriculture sector growth nevertheless remains important in reducing poverty in rural areas, and two factors may qualify the finding about the relative impacts of agriculture and urban services. One is that the geography of Indonesia’s urban centres may have a bearing on the role of urban services in poverty reduction. In other words, it appears that large numbers of rural poor in Indonesia may be able to engage in urban services without the need to migrate, longer term, to urban areas, and the growth in those services may be influenced by the level of agricultural incomes. Equally important is the point that the neglect of agriculture in Indonesia may also have contributed to the inability of agriculture to contribute more to poverty reduction.
South Africa
The incidence of both absolute and relative poverty in South Africa has declined since the advent of democracy, not only in aggregate but also for the largest population group, namely Africans. The gains in terms of income have been modest, however, and by

12 The contribution of agricultural growth to poverty reduction (IAS 76)
Working Group believes (UN WEHAB 2002) that the donor organisations dropped agriculture as a priority for world development in the 1990s, when agriculture in the developed countries was considered to be associated with overproduction, environmental pollution and budgetary subsidies. Many developing countries took this as a lead and also dropped agriculture as a priority. It is suggested that, together, these factors pushed agriculture into the low-priority sectors when development strategies were focused on export-oriented manufacturing and services as the key drivers of national economic growth.
One result has been a substantial decline in public-sector support for agriculture. Because private investment has not flowed in to fill the gap, agriculture and the broader rural economy in most countries have suffered from the withdrawal of public investment.
In common with the worldwide trend, public investment in Indian agriculture also fell, and the sector drifted into relative policy neglect from the 1990s onwards. Growth in agricultural productivity also decelerated during the same period and this continued up to the middle of the last decade. Agriculture in Indonesia has also suffered from policy neglect after the Asian Financial Crisis of 1997–98 as the government’s agricultural policy became narrowly focused on achieving self-sufficiency and price stability for the import-competing commodities, particularly rice, sugar and palm oil. The Indonesian Government has used input subsidies and export taxes to achieve these objectives, and both of these policy instruments have been shown to be highly inefficient and inequitable means for supporting rural incomes.
In China, the ‘urban biases’ in government development strategy and the policy neglect of agriculture are contributing to the persistence of rural poverty. Institutional reforms have also suffered from policy neglect in China. For example, private ownership of agricultural land is still subject to many constraints that severely limit economic opportunities available to the rural population. Currently, farmland cannot be mortgaged or sold, limiting the ability of a farmer to raise loan capital for either education of children or investment in new technologies on the farm.
It is encouraging to note that, in recent years, interest in the development of agriculture appears to have increased, partly because of the increases in food
farming households. A central reason for Vietnam’s success in poverty reduction appears to lie in the pattern of development and the nature of Vietnamese institutions in rural areas, which involve a relatively flat and equitable land distribution and powerful ruling groups in the rural areas that were not dependent upon control over land for their positions.
The government’s Resolution 10 in 1988 promoted privatisation in agriculture, on which more than 70% of its population depended. Under this resolution, the distribution of lands was relatively equitable in proportion to the size of the farming household. Food production, which was essential for poverty reduction over the 1990s, increased from 19.5 million tonnes in 1988 to 21.7 million tonnes in 1991, 32.1 million tonnes in 2001 and 39.5 million tonnes in 2005, a rate of growth in food production that was unprecedented in the country’s recent history. The Land Law of 1993 also played a substantive role in reducing poverty by allowing land-use rights to be legally transferred, exchanged, mortgaged and inherited. The near-universal literacy and selected technical and higher education has also helped to attract foreign investors and facilitated industrial and technological development in Vietnam.
Agriculture has been neglected by policymakers and investors
It is widely acknowledged that the interest of both government policymakers and the donor organisations in agriculture declined from the 1980s until there was a new resurgence of interest when food prices started rising in the mid 2000s.
Some observers have associated this neglect of agriculture with a broader shift in economic strategy in many countries that occurred in the 1980s, focused single-mindedly on reduction in budget deficits and resulting in a reduction in public investment, especially in agriculture. Others, including the World Bank, have attributed the falling productivity in agriculture and the poor performance of many agricultural development projects to the decline in the world price of food and the rising appeal of East Asia’s export-led manufacturing growth miracle. The United Nations Water, Energy, Health, Agriculture and Biodiversity

The contribution of agricultural growth to poverty reduction (IAS 76) 13
The role of research and development (R&D) in agricultural progress and eventually in poverty reduction needs a special mention. The challenges facing agriculture in most developing countries include raising crop yields, increasing the efficiency of energy and water use, improving product quality and protecting the environment. Meeting these challenges requires new and innovative technologies and processes that are suited to the local conditions in different countries. Pioneering work by scientists in developing high-yielding varieties of wheat and rice in the 1960s revolutionised the crops subsector of agriculture in parts of India and Pakistan. Australian researchers have also contributed significantly to these challenges. Further effective investment in agricultural R&D across many countries will be necessary if the potential of agriculture to meet emerging food needs and to contribute to poverty reduction is to be realised.
prices, concerns about food security in some regions and the impact of growing demand for biofuels. An important part of this revival of interest in agricultural development is also due to the efforts of organisations such as the International Fund for Agricultural Development, the Food and Agriculture Organization of the United Nations, the Organisation for Economic and Co-operation and Development, United Nations agencies and the World Bank.
The task ahead
The fact remains that, given the high concentration of the world’s poor in developing countries and in rural areas within them, further substantial reduction in poverty requires lifting the growth of the agriculture sector through increased agricultural productivity and within a social context that will best facilitate flow-on to the poor. Agriculture still provides employment to a large proportion of the workforce, and growth in the non-agricultural economies of developing countries cannot absorb all the surplus labour from agriculture, especially for the poorest workers. In other words, a transitional period is needed during which agriculture will continue to sustain employment at higher levels. Further work is needed to better understand the economic and social conditions under which agricultural growth facilitates poverty reduction.

14 The contribution of agricultural growth to poverty reduction (IAS 76)
reduction. This discussion shows that all the countries studied in this report have made substantial progress in reducing poverty, although their performance has been uneven. While the largest reductions have been made in China and Vietnam, Indonesia has also made impressive progress. Poverty reduction in South Africa has been slow and heavily dependent on social protection. India, the country with the largest number of poor in the world, has made slow but steady progress in poverty reduction. Regardless of past performance, major challenges remain for all these countries, if they are to achieve further reductions in poverty and reduce vulnerabilities due to external shocks.
The contribution of agriculture to poverty reduction is discussed in Chapter 4, where the extensive literature on this subject is reviewed. It is clear from this review that there is no linear relationship between rates of economic growth and poverty reduction, and that sectoral composition of economic growth is an important factor in poverty reduction. Most studies have concluded that growth in the agriculture sector is highly beneficial for poverty reduction, although some recent studies have also found that the importance of agriculture diminishes as economies grow and become more diversified. The finding of this recent literature is that growth in agriculture plays a leading role in the reduction of extreme poverty (income ≤US$1.25 per day), but non-agricultural growth is more powerful in reducing poverty among the better-off poor (income ≤US$2.00 per day).
This discussion also shows that the poverty-reducing impact of agriculture varies across countries, depending on the types of agriculture, the relative size of agriculture in the national economy, growth rates of agriculture in comparison with the non-agriculture sectors, the level of public and private investment in agriculture and the level of government policy
In spite of the impressive progress made in some developing countries, particularly China and Vietnam, poverty remains a universal challenge. For the developing countries of South Asia and Sub-Saharan Africa, where the highest proportion of world’s poor is concentrated, the challenge of reducing poverty is particularly daunting. Economic growth in these regions has been feeble and there has been a deceleration in the growth in the agriculture sector.
The consequences of the global financial crisis and the subsequent recession, which have added some 64 million more people to extreme poverty according to the World Bank’s World Development Indicators 2010, have substantially increased the challenge of meeting the targets of the Millennium Development Goals (MDGs). The effects of the crisis were transmitted from high-income economies to developing economies as exports, private capital flows, commodity prices and workers’ remittances declined. The aim of this report is to assess the role that agricultural growth has played in poverty reduction in the past and what role it can play in the future.
How poverty is measured is a central issue in assessing how and where poverty has been reduced. Poverty can be measured in several different ways. Recently the focus has turned to multidimensional poverty and to the Multidimensional Poverty Index (MPI) launched by the United Nations Development Programme (UNDP) and the Oxford Poverty and Human Development Initiative (OPHI) at the University of Oxford in 2010. These issues are discussed in Chapter 2. Chapter 3 details the incidence of poverty in the five countries covered in this study, using both monetary (conventional) and multidimensional measures. These particular countries were selected due to their different development models, sectoral composition of national output, variable success in poverty reduction, and strategies for poverty
1 Introduction

The contribution of agricultural growth to poverty reduction (IAS 76) 15
A central reason for Vietnam’s success in poverty reduction appears to lie in the pattern of development and the nature of Vietnamese institutions in rural areas, which involve a relatively flat and equitable land distribution and powerful ruling groups in the rural areas that were not dependent upon control over land for their positions.
These findings about the role of agriculture in poverty reduction need to be tempered by the fact that the agriculture sector suffered from neglect by policymakers and investors during the 1980s and 1990s. Some observers associate this neglect with a broader shift in economic strategy in many countries. This occurred in the 1980s and focused single-mindedly on reduction in budget deficits and resulted in a reduction in public investment, especially in agriculture. Others, including the World Bank, attribute the falling productivity in agriculture and the poor performance of many agricultural development projects to the decline in the world price of food and the rising appeal of East Asia’s export-led manufacturing growth miracle. The United Nations Water, Energy, Health, Agriculture and Biodiversity Working Group believes (UN WEHAB 2002) that the donor organisations dropped agriculture as a priority for world development in the 1990s, when agriculture in the developed countries was considered to be associated with overproduction, environmental pollution and budgetary subsidies. Many developing countries followed the lead of the developed world and also dropped agriculture as a priority. These issues are discussed in Chapter 6. The need for, and the role of, new investments in agricultural R&D, innovation and rural institutional development in rejuvenating the agriculture sector in developing countries are also discussed in this chapter. Chapter 7 provides a summary of the main conclusions.
support. These features of agriculture in the selected five countries and their impact on poverty reduction are discussed in Chapter 5. It is noted that growth rates in Indian agriculture, which is dominated by smallholders, have been modest. The crops subsector dominates India’s agriculture, accounting for more than 42% of the total value of agricultural output. The livestock subsector—employing about 21 million people and contributing 24% of total value of output—has been growing strongly since 1980 and this growth is considered to be particularly helpful for poverty reduction and gender and social equity. Agriculture is also recognised as having been the major driver of poverty reduction in the initial stages of China’s rural reforms in the 1980s, when the household responsibility system, combined with supportive policies, public investments in infrastructure and research and development (R&D) unleashed massive gains in agricultural productivity. Agricultural growth in China during this period also helped to reduce urban–rural income disparity.
The growth in agriculture has been found to be not the most effective source of poverty reduction in all countries. In Indonesia, the growth in urban services appears to have had a greater impact on poverty reduction, in both urban and rural areas, than growth in agriculture.
South Africa is very different from the other four countries studied, as its economy consists of an advanced, modern agriculture sector coexisting with typical developing-country institutions and problems. In agriculture, this is manifested in a mix of large-scale commercial agribusiness and small-scale agriculture, together with rapid structural change. As a result of the structural transformation that has occurred in the South African economy, only 5.1% of South Africa’s workforce is employed in agriculture, and this sector lost 594,000 jobs between 1995 and 2009. Poverty reduction in South Africa has been driven more by the growth in urban services and social protection programs than by agricultural growth.

16 The contribution of agricultural growth to poverty reduction (IAS 76)
by the World Bank to US$1.25 in 2008 at 2005 prices. This monetary measure is reflected in the MDG No. 1: ‘Halve, between 1990 and 2015, the proportion of people whose income is less than US$1 a day’.
Some monetary measures are derived from macro-economic data, e.g. gross domestic product (GDP) per capita, but other poverty line measures are calculated from databases containing detailed information on expenditure and consumption on food and other items, derived from household surveys, either developed nationally or in multicountry surveys.
There is general agreement that monetary-based indicators for measuring poverty do not adequately convey the highly complex, context-specific and multifaceted attributes of poverty, particularly the way in which they deal with non-food items. For example, while some poor people may receive education and health services free of charge from the government, these services may show up as expenses for other households. Food items, using a benchmark based on energy intake, do not take into account variable energy requirements or important micronutrients, and using the same basket of foods for different countries, or different regions within a country, ignores regional dietary preferences.
These shortcomings and, most importantly, the fact that monetary measures do not reflect the many dimensions of poverty, have given rise to the development of new approaches, mainly to complement, rather than replace, monetary indicators. There are several types of alternative indicators and one way of classifying them is as unidimensional or multidimensional indicators. While the former may be included in a system of indicators in several dimensions, e.g. MDG indicators, each deals with a single dimension, such as health. Multidimensional indicators, on the other hand, include several dimensions in the same indicator.
In this chapter, the way poverty is measured is discussed first as this is a central issue in the assessment of the role of agriculture in poverty reduction. What constitutes an appropriate poverty measure has been subject to debate. Traditionally measured in monetary terms, it is increasingly recognised that such measures do not convey sufficient information to be of use to policymakers. Some shortcomings of a monetary approach are discussed below. In an effort to broaden the understanding of poverty, alternative ways of measuring it have emerged and, after a brief introduction of monetary and unidimensional non-monetary indicators, an emerging alternative indicator, the Multidimensional Poverty Index (MPI), is discussed in detail. Finally, this section concludes with reflections on rural and urban poverty, and poverty and social exclusion.
2.1 Monetary income measures
Poverty measured in monetary terms, whether according to a national poverty line or by international benchmarks, is the most widely used method in the academic literature and by various agencies. It captures the levels of income or consumption expenditure per capita or per household. Monetary poverty measures are often referred to as a single indicator, but Ravallion (2011) argues that these are in fact composite measures of consumption and income, derived from market prices in aggregation. The World Bank’s frequently cited ‘dollar-a-day’ international poverty line is probably the best-known poverty indicator. This poverty line, which was initially US$1, is expressed in purchasing power parity (PPP) terms adjusted to 1985 prices using national price indexes, then converted to US dollars using PPPs (World Bank 2008). It was officially revised
2 Conceptual issues

The contribution of agricultural growth to poverty reduction (IAS 76) 17
The Multidimensional Energy Poverty Index developed by Nussbaumer et al. (2011) is another example of this. While it appears unidimensional in its focus on energy, the index also considers appliances and telecommunications, to capture both the incidence and intensity of energy poverty.
In his critique of the MPI, covered in the next section, Ravallion (2010) points to several benefits of unidimensional indicators:
they are more practical for policymakers because they can be used to indicate outcomes of specific policies
they can better take into account consumer choice in a market economy
there is no requirement for multicountry data availability and consistency across several indicators, e.g. components of multidimensional indicators for international comparisons are constrained by similar data being available in different countries
they can have relevant denominators, e.g. those relating to children can use total number of children as the denominator
the weights and cut-off points for poverty in multidimensional indicators are arbitrary and, according to Stiglitz et al. (2009), often reflect value systems of those responsible for defining these measures.
In general, unidimensional indicators require fewer assumptions than multidimensional indicators for their construction. The latter, by their very nature, might not be as explicit in showing the ways in which important aspects of the complex phenomena involved have been handled.
2.3 Multidimensional indicators
Influenced by Amartya Sen’s writings on capabilities and deprivations (e.g. Sen 1989), there has been growing interest in multidimensional measures of poverty in the academic literature and among some United Nations (UN) agencies, particularly the UNDP. According to the capability approach, wellbeing depends on a person’s
2.2 Unidimensional indicators
A strong advocate of a system of unidimensional rather than multidimensional indicators, Ravallion (1996, pp. 1332–1333) suggested a system of four sets of indicators:
(i) a sensible poverty measure based on the distribution of real expenditure per single adult, covering all market goods and services (including those obtained from non-market sources)
(ii) indicators of access to non-market goods for which meaningful prices cannot be assigned, such as access to non-market education and health services
(iii) indicators of distribution within households; measures of gender disparities and child nutritional status
(iv) indicators of certain personal characteristics that entail unusual constraints on the ability to escape poverty, such as physical handicaps or impairments due to past chronic undernutrition.
The more than 60 indicators established for measuring progress towards achievement of MDG No. 1 provide a more extensive range of non-monetary unidimensional indicators, sometimes with more than one indicator measuring a specific target. For example, Target 1C, ‘halve, between 1990 and 2015, the proportion of people who suffer from hunger’, is measured by two separate indicators: the prevalence of underweight children under 5 years of age and the proportion of the population below a minimum level of dietary energy consumption.
Unidimensional indicators can also be composite, e.g. the annual Human Development Reports (HDRs) of the UNDP, contain several tables with unidimensional measures that can be indicative of wellbeing in various domains. For example, Table 9 in the 2010 HDR, has an indicator of overall life satisfaction; a composite of satisfaction with personal dimensions of wellbeing and elements of happiness. Each of these has, in turn, individual indicators, such as ‘treated with respect’ and ‘social support networks’. This illustrates that the demarcation between uni- and multidimensional indicators is not always clear-cut.

18 The contribution of agricultural growth to poverty reduction (IAS 76)
that the former aggregated deprivation indicators from different populations and could therefore not identify specific households or larger groups of people as jointly deprived, e.g. for a specific region or ethnic group, rendering it less useful for policymaking purposes (Alkire and Foster 2011).
In the short time since it was published in 2010, the MPI, developed by OPHI at the University of Oxford, has received much attention. It is based on the Alkire and Foster (2009) method and uses principles derived from Foster et al. (1984), who introduced a new class of poverty measures with axiomatic properties of additive decomposability and subgroup consistency, enabling coherent evaluation of poverty across population subgroups. The former requires overall poverty to be a population share weighted average of subgroup poverty levels, enabling the construction of consistent profiles of poverty, the identification of factors contributing to poverty and estimates of the contribution to overall poverty by a subgroup. Subgroup consistency deals with the link between subgroups and overall poverty and requires the overall poverty in a population to rise whenever poverty in a subgroup increases but remains the same in the rest of the population and there is no migration across subgroups. It is the consistency property that makes this approach relevant for regional and other targeted policies aimed at reducing overall poverty.
Suitable for measuring acute poverty in less-developed countries, the MPI captures direct failures in functionings that the capability approach argues should form the focal space for describing and reducing poverty, rather than equating poverty solely with low incomes. The MPI considers several distinct deprivations and their overlap in the dimensions of health, education and living standards, and combines the number of deprived people and the intensity of their deprivation. The specifics of the MPI are discussed below and, unless otherwise stated, the information has been derived from UNDP (2010) and Alkire and Santos (2010).
2.3.1 Components and calculations of the Multidimensional Poverty Index
In the MPI, the poor are identified through two forms of threshold: a cut-off within each dimension to determine whether a person is deprived in that dimension, and a cut-off across dimensions, identifying the poor using a
capabilities or freedoms to achieve certain valuable ‘doings and beings’, called functionings, so that expanding people’s capabilities should be the prime objective of human development. While income is important, it is not an end in itself, but the means through which an individual gains ‘command over resources’ (Anand and Sen 2000), which can then be converted into capabilities and functionings. In this framework, poverty is viewed as capability deprivation. Multidimensional measures, indicating levels of achievement below certain minimum levels, reflect the complexity of wellbeing and poverty in that they convey the extent to which a person is poor in several distinct and independently important dimensions (Foster et al. 2010).
Benefits of a multidimensional approach have been argued mainly from the capability approach perspective, as it reflects one of the approach’s major tenets, namely that several things matter simultaneously. Sen (1976) regards the poverty measurement problem as involving the identification of the poor and the aggregation of the characteristics of the poor into an overall indicator that quantifies the extent of poverty.
In the context of discussing quality-of-life indicators, Stiglitz et al. (2009), while acknowledging the benefits of unidimensional indicators, point to the awareness-raising attributes of a multidimensional index. For example, there is considerable awareness of GDP per capita and the dollar-per-day poverty line. They argue that, in the absence of a single alternative to monetary indicators, monetary measures will prevail, thus retaining the focus on money in the context of development.
The Human Development Index (HDI) has, to some extent, performed the role of an alternative attention-attracting tool with a compelling policy message since it was first introduced in the UNDP’s HDR in 1990 (UNDP 1990). Consisting of indicators related to leading a long and healthy life, to being knowledgeable and to enjoying a decent standard of living, the HDI attracts interest mainly in conjunction with the media releases at the launch of UNDP’s annual HDRs, but does not feature much in the ongoing poverty debate. The Human Poverty Index (HPI), published in the HDRs since 1997 and replaced by the MPI in the 2010 HDR (UNDP 2010), has attracted even less attention. The HPI used the same three dimensions as this new MPI. The key difference between these two indexes is

The contribution of agricultural growth to poverty reduction (IAS 76) 19
The MPI weights each dimension equally at 3.33 (10/3), and each indicator within the dimension has equal weight. This means that each health and education indicator has a weight of 1.67 (3.33/2) and each of the living standards a weight of 0.56 (3.33/6). The HDI is also weighted equally between dimensions, but does not place equal weights on indicators within a dimension; e.g. in the education dimension, the HDI places a 2/3 weight on adult literacy and 1/3 on gross enrolment ratio. Alkire and Santos (2010) discussed possible approaches to setting the weights, but did not offer a specific justification for the weights used in the MPI. They did, however, subject the MPI to sensitivity analyses with different weights and found them to be quite robust.
To identify the multidimensionally poor, the deprivation scores for each household are summed to obtain the household deprivation. A cut-off of 3 (30% of the indicators) is used to distinguish between the poor and non-poor; i.e. a household with an aggregate weight of 3 or more is defined as multidimensionally poor (although it is possible to get this score within one dimension). Households with a deprivation count between 2 and 3 are considered at risk of becoming multidimensionally poor. Everyone in the household is defined in the same way, despite the likelihood that some members might be multidimensionally poor while others are not.
The MPI value is the product of two measures:
H × A (1)
where H is the multidimensional headcount ratio and A the intensity (or breadth) of poverty.
The headcount ratio, H, is the proportion of the population that is multidimensionally poor:
H = qn— (2)
where q is the number of people who are multidimen-sionally poor and n is the total population, reflecting the proportion of the weighted component indicators in which, on average, poor people are deprived. For poor households only, the deprivation scores are summed and divided by the total number of indicators and by the total number of poor persons:
A = qd
qc1—
∑ (3)
(weighted) count of the dimensions in which a person is deprived. The MPI has been derived from household surveys, but the index is expressed with respect to the total population. Following identification of the multidimensionally poor households, each household is multiplied by the number of household members to obtain the headcount ratio. The MPI thus works on the principle that if at least one household member is deprived in an indicator, all household members are treated as being deprived in that indicator. The MPI is the product of two factors:
the multidimensional poverty headcount (the share of people who are multidimensionally poor)
the average number of deprivations each multidimensionally poor household experiences (the intensity of their poverty).
The indicators and thresholds in respective dimensions are as follows.
Health: nutrition and child mortality—at least one malnourished household member and having at least one child die.
Education: years of schooling, children enrolled—no household member has completed 5 years of schooling and at least one school-age child (up to grade 8) is not attending school.
Living standards: electricity, water, toilet, cooking fuel, floor, assets—no access to electricity, clean drinking water, or adequate sanitation, using ‘dirty’ cooking fuel (dung, wood or charcoal), having a home with a dirt floor, and owning no car, truck or similar motorised vehicle, and owning at most one of these assets: bicycle, motorcycle, radio, refrigerator, telephone or television.
Thus, the MPI uses the same three dimensions as the HDI and the HPI, but with different indicators. With the exception of electricity and flooring, all the indicators relate directly to the MDGs, thereby reflecting international consensus about dimensions of serious disadvantage. Electricity was included because of its importance in the pursuit of other functionings, and flooring serves to give an indication of quality of housing and as an influence on hygiene. The MPI dimensions are also emphasised in human-capital approaches that seek to clarify how each dimension is instrumental to income growth (Alkire and Santos 2010).

20 The contribution of agricultural growth to poverty reduction (IAS 76)
human rights. The data constraints also precluded the incorporation of gender aspects. Another drawback of having to rely on data from existing sources is illustrated in Table 1, which shows that the MPI for some of the countries included in this study, particularly for China, South Africa and Vietnam, would have been quite outdated at the time of publication.
Table 1. Data sources for the Multidimensional Poverty Index
Country Data source Year
China World Health Survey (WHS) 2003
India Demographic and Health Survey (DHS)
2005
Indonesia DHS 2007
South Africa WHS 2002
Vietnam DHS 2002
Source: UNDP (2010)
However, it is not necessary to rely on these multicountry databases when constructing MPIs for one or a group of countries, as most countries conduct their own household surveys, some of which are longitudinal. As long as there is reasonable commonality between surveys in countries being studied, it should be possible to construct more timely multidimensional indicators, possibly incorporating additional indicators that can capture wider aspects of poverty and social exclusion.
2.3.3 Results of application of the Multidimensional Poverty Index
Table 2 shows the incidence of poverty in terms of both income and multidimensional criteria. The values in this table include only the population in the 92 countries for which both types of data were available. The number of multidimensionally poor people (1.74 billion) lies in between the two income poverty measures of US$1.25 per day and US$2.00 per day. This means that the international poverty line for measuring extreme income poverty underestimates the incidence of poverty as defined by the multidimensional poverty index, suggesting that a larger number of people (than those below the extreme poverty line) were deprived in relation to access to education, health care and basic living conditions.
where c is the total number of weighted deprivations the poor experience and d is the total number of component indicators considered (10 in this case).
The MPI thus represents the share of the population that is multidimensionally poor, adjusted by the intensity of deprivations they suffer.
2.3.2 Data sources used for the Multidimensional Poverty Index
All data used for the MPI have been sourced from existing survey databases: neither the OPHI nor UNDP conducted surveys for the MPI. All data used to construct the indicators for a country must come from the same survey, as the cut-off point for multidimensional poverty is determined on a household basis. If data were sourced from different surveys for the same country, e.g. one survey for the education dimension and another for the health dimension, it is unlikely that the same household would be surveyed and it would be impossible to estimate the MPI headcount and/or intensity. As there is no survey covering all countries, three main existing household survey databases were used to compute the MPI:
Demographic and Health Survey (DHS)—funded by the United States Agency for International development (USAID 2010), used for 48 countries
Multiple Indicators Cluster Survey (MICS)—a United Nations Children’s Fund (UNICEF) survey, used for 35 countries
World Health Survey (WHS)—a World Health Organization database, used for 19 countries.
Where more than one survey was available for the same country, the preference rankings were DHS, MICS and WHS, on the basis of available data in each survey.
The MPI has been calculated for the 104 countries for which all 10 indicators are available, representing 5.2 billion people, which was approximately 78.5% of the estimated world population in 2007. Alkire and Santos (2010) included details on sample sizes in each country and percentage of missing information for each indicator and described how they dealt with these.
Similar to the construction of the HDI and the HPI, the MPI is constrained by available cross-country data, which prevented the inclusion of other important dimensions, such as employment, empowerment and

The contribution of agricultural growth to poverty reduction (IAS 76) 21
families between urban and rural areas results in a loss of traditional ‘safety nets’, contributing to higher levels of divorce, single-parent families, domestic violence, delinquency in children left behind and depression (UNESCAP 2008; Friel et al. 2011).
Notwithstanding the ambiguous definitions, data are available on rural and urban poverty as defined in each country. Despite some countries being on track to meet the MDGs on average, this is often not the case for rural and remote areas where extreme poverty tends to be more prevalent than in urban areas. In the context of discussing spatial disparities in poverty at the country level, a UN (2009) report pointed to the rural–urban divide, referring to the poor as tending to be heavily concentrated in rural areas, often with limited access to roads, schools, hospitals and other public assets. It also noted disparities between different regions in some countries, e.g. the central and western regions of China compared with the eastern coastal regions, and, in India, the gaps between the southern and northern states. According to Sharma and Kumar (2011), there is evidence to show that inequalities in several dimensions, including income, consumption and human development outcomes, have increased between rural and urban areas and some regions and states in India.
But poverty is not confined to rural areas. By 2008, the urban areas in the Asia–Pacific region were home to almost 43% of the people, of whom approximately one-third lived in slums (UNESCAP 2010). With lack of assets, limited economic opportunities, and poor education and capabilities, as well as disadvantages rooted in social and political inequalities, poor people from rural areas face specific risks in several domains, particularly those related to health, climate change and insecurity of access to land. Children in rural areas have lower access to education than in urban areas, partly due to inadequate educational infrastructure, particularly beyond primary level, and partly because of reliance on child labour (IFAD 2010).
A study by Fotso (2006) showed that while malnutrition is, on average, higher in rural than urban areas, socioeconomic inequalities are, to a large extent, higher in urban than in rural areas. The consequences of nutritional deficiencies associated with poverty can, as pointed out by Fotso, have longer term implications in addition to short-term impacts, such as increased risk of both morbidity and mortality from infectious
Table 2. Incidence of poverty using monetary indicators and the Multidimensional Poverty Index
Number of income poor at US$1 .25 PPPa/day
1 .44 billion
Number of multidimensionally poor 1 .74 billion
Number of income poor at US$2 .00 PPP/day 2 .60 billion
a Purchasing power parity
In analysing the results of the MPI, Alkire and Santos (2010) identified different clusters of deprivations, suggesting these would improve understanding of interconnectedness among deprivations, thereby being useful in the identification of poverty traps. Such understanding would also facilitate the design and targeting of poverty-alleviation policies, a benefit of the MPI over both monetary and unidimensional poverty measures. For example, the Somali have the highest MPI of all ethnic groups in Kenya, followed by the Masai. The composition of the MPI also shows that 96% of the Masai and 88% of the Somali are poor. Poverty among the Somali is, however, more intense; on average they are deprived in 67% of dimensions, the Masai in 62%. We can also learn from the MPI that the Somali are more deprived in education and have higher child mortality, whereas malnutrition and standard-of-living indicators are worse among the Masai.2 So the MPI opens out a wider field of information and can assist policymakers to develop more-tailored policy responses than would be the case if they relied on income poverty indicators only.
2.4 Rural and urban poverty
The distinction between rural and urban poverty is not always clear-cut, as many families have a foot in each camp. When family members migrate to urban areas to support livelihoods in their rural areas of origin through remittances, they often end up living in poverty in urban areas to which they have migrated. The separation of
2 This example is from the response of Sabina Alkire (2011) to Martin Ravallion, available at <www.ophi.org.uk/policy/multidimensional-poverty-index/mpi-debate>, accessed on 25 September 2011.

22 The contribution of agricultural growth to poverty reduction (IAS 76)
humiliation, and violence. The UNDP 2010 HDR reiterated the importance of such indicators and acknowledged that better data would be required in core areas such as informal work, empowerment, safety from violence, and human relationships (social capital and respect) (UNDP 2010, p. 94).
Women’s social exclusion has been widely recognised. Despite often being the primary caregivers and performing a large part of the agricultural work, rural women have fewer critical assets, especially land, or less secure access and control over them (IFAD 2010). They also tend to suffer a higher degree of violence, identified as another dimension of poverty (Diprose 2007). Concerns for physical safety and security emerged as a key concern in the ‘Voices of the Poor’ study (Narayan et al. 2000), which summarised work undertaken for the World Bank’s 2000–01 World Development Report on the theme of poverty and development. The project involved interviews with 60,000 poor men and women in 60 countries.
Theft of animals and crops is a specific security issue related to agriculture and of such magnitude that it is included in the International Crime Victim Surveys for Africa and can incite violence between neighbours and villages.
Time is another dimension often missing in poverty studies. Moving beyond static assessments of poverty to a more dynamic view would facilitate distinction between chronic and transitory poverty, and also consider vulnerability to poverty. The different forms of poverty affect the type and level of social exclusion, which is usually associated with chronic capability failure (Gunther and Klasen 2009). Social exclusion can also be seen as lack of functionings, e.g. a person could be educated, but prevented from exercising associated capabilities due to discrimination. Treating social exclusion as the weighted sum of functionings from which a person is excluded, Chakravarty and D’Ambrosio (2006) developed an approach for measuring social exclusion at an aggregate level as a function of individual exclusions.
There is a growing awareness and interest in the convergence between agricultural growth and social protection, as reflected in the recommendations of FAO (2008) relating to issues arising from increased food prices, which suggested an integrated approach, combining traditional transfers in the form of social
diseases. These can be manifested in impaired cognitive or delayed mental development, resulting in reduced learning abilities and work capacity, which can lead, in turn, to poverty.
The link between nutrition and education points to the importance of using multidimensional indicators to reflect the simultaneously occurring deprivations in different dimensions to get a sense of the poverty intensity. While the MPI incorporates both malnutrition and education, a major weakness is that it does not explicitly include social exclusion. This dimension is discussed in the next section.
2.5 Poverty and social exclusion
While some of the domains from which people can be socially excluded are covered in the MPI, this is not the case for many other dimensions, some of which are included in the long, but non-exhaustive, list of Silver (1995, p. 60) consisting of:
… a livelihood; secure, permanent employment; earnings; property, credit, or land; housing; minimal or prevailing consumption levels; education, skills, and cultural capital; the welfare state; citizenship and legal equality; democratic participation; public goods; the nation or the dominant race; family and sociability; humanity, respect, fulfilment and understanding.
Exclusion from the above and other domains is often geographically based, suffered by the rural poor and in some cases compounded by intergroup disparities based on ethnic group and/or religion, which can also be linked to location.
Having to rely on indicators available in existing multicountry databases, Alkire and Santos (2010) acknowledged that many dimensions of poverty had to be excluded due to lack of data on comparative indicators in what Alkire (2007) referred to as ‘missing dimensions’. She pointed to the absence of ‘indicators related to shame of being associated with poverty or stigma of poverty’. The special issue of the journal Oxford Development Studies (2007, volume 35, issue 4), where that paper was published, was dedicated to identification of missing indicators, with papers on employment, agency and empowerment, shame and

The contribution of agricultural growth to poverty reduction (IAS 76) 23
measured in terms of consumption rather than income, and that government in China should adopt a broader conception of poverty to include access to affordable basic services in education and health. The benefits of a multidimensional approach for policy development were also illustrated in a study of 10 provinces in China (Yu 2011), which noted that the worsening deprivation in education between 2000 and 2006 raised new policy concerns. As the study was conducted in different provinces, the policy recommendations varied depending on the outcome in each province; e.g. in Guangxi, reducing income deprivation should be given priority, while in Guizhou and Henan, improving education was more critical.
In contrast, Sharma and Kumar (2011) consider income-related indicators more appropriate for tackling poverty in India because, in their opinion, raising incomes will also help in the reduction of other forms of deprivation. With respect to the nutrition component in the MPI, Sharma and Kumar highlight the influence of food habits and cultural practices for nutritional outcomes, pointing to the relatively high malnutrition levels in Kerala, despite its good health facilities, and high levels of energy deficiencies in the more prosperous states of India. The diverse views on the appropriateness of a multidimensional approach in addressing poverty might be also associated with trust, or lack thereof, in the ability of governments to deliver benefits in the different dimensions. For example, high rates of absenteeism among teachers in government schools in rural India is a well-known phenomenon, which households could respond to by sending their children to private schools if they had sufficient financial resources.
safety nets and policies enabling smallholders to respond quickly to market opportunities. There is thus a role for the government in overcoming deprivation, in terms of both the provision of services and policy formulation.
However, due to widespread corruption and inadequate government administration, safety nets do not always reach the intended recipients, as highlighted by a World Bank (2011) study on poverty reduction schemes in India. This establishes a clear link between poverty and governance.
2.6 Policy implications of poverty measurements
The definition of poverty and the approach to measuring it have policy implications, but there is no consensus on the most efficient measurement type for policy formulation and evaluation. While Ravallion (2011) argues that unidimensional measurements are more efficient, Alkire and Santos (2010) suggest that, by showing interconnectedness among deprivations, the MPI would facilitate the design of better poverty-reduction policies. It appears that the Government of Vietnam has embraced this approach by indicating in its latest poverty-reduction strategy for 2011–20 (GOVN 2011) that it will pay more attention to multidimensional poverty in formulating practical and sustainable support policies. An understanding of the key factors leading to movement of people in and out of poverty is also useful for policy formulation.
In its policy recommendations for reducing poverty in China, the World Bank (2009) suggested that poverty be

24 The contribution of agricultural growth to poverty reduction (IAS 76)
multidimensionally poor.3 Of the three components of MPI (education, health and standard of living), living standards were found to make the highest contribution to poverty in India (IFAD 2011).
To obtain a deeper understanding of poverty in China, India, Indonesia, South Africa and Vietnam, details on poverty estimates from each of them are discussed below.4
3.1 China
China’s record on poverty reduction since the 1980s has been impressive, with a decrease in the headcount ratio of income poverty (US$1 per day) from 64% in 1981 to 7% in 2007. The World Bank (2009, p. iii) noted that despite lifting more than 500,000 people out of poverty between 1981 and 2004, an achievement that is ‘without historical precedent’, China still faces considerable poverty-reduction challenges, with more than 254 million people living in poverty in 2005. The World Bank report also points out that the responsiveness of poverty to growth declined from –2.52 during 1981–1985 to –1.02 during 2001–2005, leading to greater inequality in people’s livelihoods, as reflected in an increase in the Gini coefficient of income inequality from 30.9 in 1990 to 45.3 in 2003.
3 In addition to India, 51% of Pakistan’s, 58% of Bangladesh’s and 65% of Nepal’s population was MPI poor. Only Sri Lanka had a low figure of 5% MPI poor.
4 Unless otherwise indicated, information was sourced from the country papers presented at the Centre for Strategic Economic Studies – Australian Centre for International Agricultural Research international workshop, ‘The role of agriculture in poverty reduction’ (Melbourne, 6 May 2011). Those papers are listed in the references to this report and are available at <http://www.vu.edu.au/centre-for-strategic-economic-studies>.
As noted in Section 2.3.3, the incidence of poverty depends on the poverty measures used. Using the US$1.25 per day extreme poverty line, 1.4 billion people lived at or below this level in 2005, the latest estimate available (UNDP 2010). This was a reduction from 1.9 billion in 1981. Based on world population figures of 4.4 billion and 6.6 billion in 1981 and 2005, respectively (UNDESA 2011), this corresponds to a proportional reduction of the poverty rate from 43% to 21% over those 24 years.
Among the poor, there is a considerable group of ‘ultra-poor’ living well below the poverty line, and close to 1 billion people suffer from hunger. At least 70% of the world’s very poor people and 50% of the poor in East Asia live in rural areas and a large proportion are children and young people (IFAD 2010). Some of the poor live in chronic poverty, whereas others move in and out of poverty. If food prices continue to rise, the number of people living below the poverty line is likely to increase. According to an estimate by UNESCAP (2011), a price increase in 2011 of half the rise in 2010, combined with an oil price of US$105 per tonne, would prevent 8.3 million people in Asia and the Pacific from moving out of poverty and an additional 1.5 million people would join them below the poverty line. Some poor farmers might be able to benefit from the price increases, if they do not consume more than they produce.
Turning to multidimensional poverty, Table 3 shows that the incidence of poverty in four of the five countries included in this study was less than the incidence of extreme income poverty. India is the only country in Table 3 in which the incidence of multidimensional poverty was higher than that of extreme income poverty (US$1.25 per day). This reflects the fact that MPI poverty is highest in South Asia, which is home to nearly 30% of world’s population but 51% of world’s
3 Incidence of poverty

The contribution of agricultural growth to poverty reduction (IAS 76) 25
and Hunan in central China, and Guizhou and Guangxi in western China, are the most marginalised provinces.
The results showed that 95% of the households covered in the survey were deprived in fewer than two of the five dimensions in 2009, i.e. less than 5% of the population was multidimensionally poor. This reduction is primarily due to expansions of China’s social security system. Having been the major contributor to multidimensional poverty before 2006, deprivation in social security had fallen dramatically by 2009, from 40% to 4%. Multidimensional poverty in rural areas was 1.4–1.5 times higher than in urban areas throughout the study period. At a cut-off for poverty at two dimensions, the study found that the proportion of poor households fell from 21% to 4% between 2000 and 2009. An important finding was also that economic growth did not automatically reduce poverty.
3.2 India
India has the highest incidence of poverty among the five countries covered in this study. As recorded in Table 3, 41.6% of the Indian population was extremely poor (i.e. living below the international poverty line of US$1.25 per day) in 2005. If the poverty line of US$2.00 per day is considered, the incidence of poverty rises to 75.6% of India’s population. The incidence of multidimensional poverty was estimated to be 55.4%. The official estimates of poverty in India are based on different (national) poverty lines, which measure poverty in terms
More than 99% of China’s poor live in rural areas. Migration from rural to urban areas increased from 84 million in 2001 to 137 million in 2007, often leaving behind the most vulnerable, such as the older and less educated people.
Nearly one-third of China’s rural residents were found to be consumption poor at least once between 2001 and 2004. The World Bank (2009) cautions that for domestic consumption to supplement investment and external trade as a central driver of China’s economic growth, vulnerability to poverty must be reduced. Growing constraints on publicly funded health care and basic education add to the vulnerability of households, potentially forcing many back into consumption poverty, because of the need to fund education and health care (Meng et al. 2005). China’s government has been aware of the remaining challenges of poverty and inequality and has been searching in recent years for an alternative development model that provides greater equality, especially in respect of access to health and education (Sheehan 2010; Grewal and Ahmed 2011a).
A study on poverty in five dimensions, using data from the China Health and Nutrition Survey concluded that deprivations had reduced between 2000 and 2009 in income, health, social security and living standards, but had increased for education, measured as less than 5 years schooling. Among the nine sampled provinces, Heilongjiang and Liaoning, located in north-eastern China, have the highest level of industrialisation and urbanisation. Shandong and Jiangsu, in eastern-coastal China, were among the most successful in achieving rapid economic development since 1978. Henan, Hubei
Table 3. Alternative poverty measures for China, India, Indonesia, South Africa and Vietnam
Country Year Multidimensional poverty
Income poverty
(US$1.25 per day) (US$2.00 per day)
(Proportion of population poor, %)
China 2005 12 .5 15 .9 36 .3
India 2005 55 .4 41 .6 75 .6
Indonesia 2007 20 .8 29 .4 60 .0
South Africa 2003 3 .1 26 .2 42 .9
Vietnam 2002 14 .3 21 .5 48 .4
Source: Alkire and Santos (2010)
Note: These estimates are also in UNDP (2010) .

26 The contribution of agricultural growth to poverty reduction (IAS 76)
3.3 Indonesia
In Indonesia, the poverty rate is calculated by the government’s statistical agency based on data from the National Socioeconomic Survey (Susenas). The poverty line is estimated based on food corresponding to 2,100 kilocalories (8.8 MJ) per person per day plus some essential non-food allowances. Before 2002, the poverty rate was calculated every 3 years and, since then, it has been calculated every year. Poverty rates before and following 1998 are not directly comparable as the method of establishing the poverty line was changed.
The poverty rate has been declining in Indonesia since it was initially estimated in 1976, with two exceptions. The first was linked to the Asian financial crisis in 1997–98, when the poverty rate increased from 17.3% in 1996 to 23.4% in 1999, caused by a combination of declining incomes and hyperinflation. The second exception followed an increase of 125% in domestic fuel prices in 2005, leading to an inflation rate of 18% and an increase in the poverty rate from 15.9% in 2005 to 17.8% in 2006.
The pace of poverty reduction in the period following the Asian financial crisis has not caught up with the rate during the pre-crisis period, when poverty reduction averaged 1.44% per annum. Indonesia was then among the best performers in reducing income poverty in relation to economic growth, particularly in rural areas. Between 2002 and 2010, the average annual poverty reduction slowed to 0.61% per annum, and it took until 2003 before the poverty headcount rate returned to its 1996 level. Regardless, with population growth, the annual absolute number of people living in poverty between 1999 and 2008 remained higher than it was in 1996.
The absolute number of people living in rural areas, and the proportion of the poor that are classified as rural, have changed significantly since the mid 1990s. While the number of poor people in rural areas fell from 25 million to 22 million between 1996 and 2008, urban poverty increased from 10 million to almost 13 million during the same period. This represents an increase in the urban share of poverty from 27% to 35%, and a corresponding decrease in the rural poor from 83% to 65%. While more than half of the poor still derive their livelihood from agriculture, the proportion of the poor deriving their livelihood from
of consumption (energy intake). The most recent of these estimates was made by the Tendulkar Expert Group in 2009. This poverty-line approach is based on the minimum consumption expenditure for the standardised national consumption baskets, set at 2,400 kilocalories (10 megajoules, MJ) and 2,100 kilocalories (8.8 MJ) for rural and urban areas, respectively. According to Sharma and Kumar (2011), this was estimated at Rs 49.09 and Rs 56.64 (A$1.05 and A$1.19 at the 2011 exchange rate) at the 1973–74 prices for rural and urban areas, respectively, and the price is updated regularly to take price changes into account. According to these estimates, shown in Table 4, more than 37% of India’s population was poor in 2004–05. These figures also show that poverty rates are much higher (nearly 42%) in the rural than the urban population (26%). The values in Table 4 also show that, while both rural and urban poverty has been reduced since 1993–94, the pace of poverty reduction has been quite slow.
Table 4. Percentage of poverty in rural and urban populations in India
Years Rural Urban Total
Old estimates based on National Sample Survey data
2004–05 28 .3 25 .7 27 .5
1993–94 37 .3 32 .4 36 .0
New estimates by the Tendulkar Expert Group 2009
2004–5 41 .8 25 .8 37 .2
1993–94 50 .1 31 .8 45 .3
Source: Sharma and Kumar (2011)
These aggregate data mask not only differences between the different parts of India, but also those between different social groups. Poverty in India is also heavily concentrated in certain regions. The five poorest states—Bihar, Jharkhand, Madhya Pradesh, Chhattisgarh and Uttar Pradesh—accounted for more than 50% of the poor people in the country. The concentration of poverty in Bihar and Jharkhand is particularly severe, as around 80% of the population in these states are classified as poor. Poverty rates among scheduled castes and scheduled tribes and women are also generally much higher. Economic growth has, according to Grewal et al. (2010) and Grewal and Ahmed (2011b), not reduced social barriers to inclusion. The poor population also remains highly vulnerable to the consequences of illness.

The contribution of agricultural growth to poverty reduction (IAS 76) 27
the lower poverty line of R174, also in 2000 prices, poverty fell from 31% to 24% during the same period. The relatively larger decline at the lower poverty line suggests that those in deeper poverty experienced a relatively larger improvement in their living standards over the period. Relative poverty, as measured by the poverty gap ratio, displays a similar trend. At the R322 line, the poverty gap index declined from 26% to 21%. This means that the average poor person lived about 26% below the R322 poverty line in 1995 and about 21% below it in 2005. At the lower poverty line, the poverty gap ratio declined from 12% to approximately 8%. However, race and gender have remained key markers of vulnerability. Despite reductions in South African poverty, African female-headed households accounted for a disproportionate share of those living below the poverty line.
The 2010 OPHI/UNDP estimates based on the 2003 data in Table 3 show that 26.2% of the population lived below US$1.25 per day in 2003, but only 3.1% in poverty in MPI terms. This indicates that South Africa’s government has been more successful in the delivery of basic services than in raising incomes, particularly electricity for lighting, but also access to housing, piped water and sanitation.
this sector declined from 57.7% in 2002 to 52.3% in 2008. In 2007, as shown in Table 3, 29.4% of the total population lived in extreme poverty (US$1.25 per day) and 60.0% on less than US$2.00 per day.
3.4 South Africa
The latest information on poverty available from South Africa is from the 2005–06 Income and Expenditure Survey, conducted by Statistics South Africa, the government agency responsible for household surveys. Poverty measures are calculated from household surveys, using individual per-capita household expenditure. The headcount rate, shown in Table 5, refers to the share of the total population with expenditure below a predefined poverty line. The poverty gap ratio is a measure of the average expenditure of the poor relative to the poverty line.
The headcount rate of poverty declined in the first decade of democracy in South Africa. At the higher poverty line of 322 rand (R) in 2000 prices, poverty declined from 53% in 1995 to 49% in 2005, while at
Table 5. Poverty shift by race of household head in South Africa, 1995–2005
Category Headcount index (%) Poverty gap ratio (%)
Year 1995 2005 1995 2005
322 rand per month (approximately A$47) poverty line
African 63 .04 57 .55 31 .86 25 .23
Coloured 39 .00 35 .13 14 .66 13 .51
Asian 4 .71 8 .43 1 .03 2 .32
White 0 .53 0 .38 0 .22 0 .11
Total 52.54 49.03 26.04 21.29
174 rand per month (approximately A$24) poverty line
African 38 .18 28 .17 14 .71 9 .01
Coloured 14 .62 12 .94 4 .09 4 .09
Asian 0 .82 1 .60 0 .14 1 .09
White 0 .23 0 .07 0 .09 0 .00
Total 30.92 23.55 11.77 7.54
Source: Bhorat et al . (2011)

28 The contribution of agricultural growth to poverty reduction (IAS 76)
The MPI, based on surveys in 2002, showed that the major areas of comparative success were related to schooling, electricity, housing, cooking fuel and assets. The major problem areas were sanitation, drinking water and child mortality. Other metrics also show that child mortality was of overriding importance. According to the MPI, poverty was far more intense for the rural poor.
Based on partial calculations of multidimensional poverty carried out by the Vietnamese statistics office from 2008 data, the national poverty rate was 28.9%, which is higher than the expenditure poverty rate. Some regions with lower expenditure poverty, e.g. the Mekong Delta, had higher multidimensional poverty, while the reverse was the case for the Red River Delta and the north–central and central coast areas.
Vietnam’s government is reportedly supportive of the continued use of multidimensional poverty indicators, as Mr Ha Hung, the Vice Chairman of the National Assembly’s Committee for Ethnology was quoted as saying (Chaobuoisang.net 2011) in conjunction with the release of the 2011 to 2020 poverty reduction strategy: ‘Previously, poverty was purely judged based on income, from now on, we’ll have a more multidimensional approach to the matter’.
3.5 Vietnam
Vietnam has achieved remarkable reductions in poverty since the 1990s, measured through consumption from the government’s Vietnam Household Living Conditions Surveys. A real income poverty line applied uniformly across the country indicates a reduction in poverty from almost 60.0% in 1993 to 18.1% in 2004, 15.6% in 2006 and 13.4% in 2008. By 2010, the poverty rate had fallen to 9.45% (GOVN 2011). Between 2004 and 2008, the reported poverty incidence in urban areas fell from 8.6% to 6.7% and in rural areas from 21.2% to 16.1%. Based on expenditure measures, the national poverty incidence declined from 37.4% in 1998 to 14.5% in 2008. The highest regional rates of poverty, near or above 20% in 2008, were found in the uplands and mountainous areas, inhabited by ethnic minorities and large numbers of inward ‘kinh’ migrants. Expenditure poverty rates among ethnic minorities moved as follows: 1993, 86.4%; 1998, 75.2%; 2002, 69.3%; 2004, 60.7%; and 2006, 52.3%. According to the poverty reduction strategy for 2011 to 2020, released in May 2011, the highest priority for poverty reduction will be given to poor ethnic minority people and those living in mountainous areas (GOVN 2011).
While poverty has declined rapidly in rural areas, the decline seems to have plateaued or perhaps even reversed in urban areas, due to the higher cost of living in booming economic hubs, affecting particularly those just above the poverty line.

The contribution of agricultural growth to poverty reduction (IAS 76) 29
Many studies provide empirical support to the view that agricultural growth has been a major driver of poverty reduction in the developing world. Ravallion and Datt (1996), for example, found that growth in agriculture and the rural economy had been highly beneficial to reducing rural poverty in India.6 Having reviewed the literature on the role of agricultural productivity in alleviating poverty in developing countries, Thirtle et al. (2001) reported that there are significant relationships between productivity growth and both poverty and nutrition, and that agriculture had a greater impact on poverty than the other sectors. Their estimate was that, on average, every 1% increase in agricultural productivity reduces the percentage of people living on less than a dollar a day by between 0.6% and 1.2%. In a subsequent study on India, Ravallion and Datt (2002) found that although higher farm yields, higher state development spending, higher non-farm output and lower inflation all reduced poverty, the rates of growth in farm output were the most important factor benefiting the poor in Indian states. Virmani (2007) found that higher agriculture growth in India has an impact on poverty reduction in addition to its normal contribution to overall GDP growth: every 1% increase in agricultural growth reduces the rate of poverty by 0.45%, in addition to its effect on average per-capita GDP. In principle, growth in agriculture is found to reduce poverty through four transmission mechanisms. These are: a direct and relatively immediate effect of improved agricultural performance on rural incomes; the benefit of cheaper food for both urban and rural poor; agriculture’s contribution to growth and the generation of economic opportunity in the non-farm sector; and agriculture’s fundamental role
6 Discussing the situation in China, Ravallion (2008) empha-sises the role of strong state institutions implementing supportive policies and public investments, coupled with promotion of agriculture and the rural economy.
4.1 Does growth in agriculture reduce poverty?
The literature on poverty reduction is unanimous in concluding that the sectoral composition of economic growth makes a significant difference to poverty reduction. Most studies also come to the conclusion that growth in agriculture is highly beneficial for poverty reduction, although its importance diminishes as economies grow and become more diversified.
The importance of agriculture in poverty reduction derives from two basic circumstances: (a) the incidence of poverty is disproportionately high in developing countries, which still rely heavily on agriculture for output and employment;5 and (b) as the poorest households also have few assets and no skills, they typically rely more on agriculture and generally face many obstacles in connecting with the non-agricultural economy for income and employment. Social and economic exclusion further reduce alternative opportunities that may be open to certain groups, including women, youth, ethnic minorities and Indigenous people. Thus, by providing a greater share in employment of the poor and the unskilled workforce, agriculture plays a crucial role in making economic growth more pro-poor.
The linkage between agricultural growth and rural poverty can be gauged from the fact that 76% of the population in India lives in rural areas. Among rural households, 59% are involved in agriculture either as farmers or as agricultural labourers—34% are self-employed in agriculture and 25% are in agricultural labour households (Sharma and Kumar 2011).
5 This is true in spite of the fact that, as these countries grow, the share of agriculture in GDP and total employment falls. This point is discussed in greater detail in a later section.
4 Agriculture and poverty reduction

30 The contribution of agricultural growth to poverty reduction (IAS 76)
Case studies on individual countries also provide evidence of increase in rural incomes in the wake of growth in agricultural productivity (Dev 1998; DFID 2005). In a study of the relationship between output growth and poverty in more than 50 countries, Loayza and Raddatz (2010) found that the composition of growth in terms of intensive use of unskilled labour, which is the kind of input that the poor can offer to the production process, matters significantly for poverty reduction. Sectors that are more labour-intensive (in relation to their size) tend to have stronger effects on poverty alleviation. They found that agriculture is the most poverty-reducing sector, followed by construction then manufacturing, while mining, utilities and services by themselves do not seem to help poverty reduction (Loayza and Raddatz 2010, pp. 21–22).
The rural concentration of poverty in developing countries highlights the importance of agriculture in poverty-reduction strategies of these countries, because most of the rural population relies directly or indirectly on agriculture. According to the International Fund for Agricultural Development (IFAD 2010), poverty in developing countries is primarily rural: nearly 72% of those in poverty in these countries live in rural areas. In Sub-Saharan Africa, the figure is 75%, and it is more than 80% in South Asia. According to simulations done by IFAD (2011), meeting the MDG of halving the poverty in Asia and the Pacific region would require increases of 28% in agricultural expenditure, 23% in fertiliser use and 24% in agricultural investment during 2007–13, together with a 56% increase in official development assistance to agriculture.
Despite the major roles agriculture plays, Hasan and Quibria (2004) caution against what they call the misplaced ‘agricultural fundamentalism’, or the argument that agricultural growth always leads to more rapid poverty reduction, because they found that, while agriculture was the most effective driver of poverty reduction in South Asia and Sub-Saharan Africa, poverty reduction in East Asia resulted more from the growth of the industry sector, and that the services sector had the greatest impact on poverty reduction in Latin America.
De Janvry and Sadoulet (2010) found that growth in agriculture is nearly three times more effective in reducing poverty than is growth in manufacturing and nearly double that of growth in construction. They
in stimulating and sustaining economic transition, as countries (and poor people’s livelihoods) shift away from being primarily agricultural towards a broader base of manufacturing and services. The practical impact on poverty resulting from a given rate of growth in agriculture in a country depends upon several factors, including the concentration of population close to the country’s poverty line, its system of land ownership, agricultural wages and so on. As these conditions differ across countries, so too does the precise impact of agricultural growth on poverty.
Warr (2002) has suggested that, in addition to providing employment to unskilled workers, the agriculture sector also contributes to poverty reduction by stimulating growth in the secondary and the tertiary sectors. For example, increased commercial agricultural activities may lead to the expansion of small food-processing industries, thereby increasing, in turn, labour mobility from rural to urban areas. In a similar vein, Pack (2009), who doubts whether South Asian countries would be able to follow the same growth path in manufacturing and exports as was followed by the East Asian countries, points out that, in South Asia, growth in rural incomes and employment should be propelled by an expansion in agricultural productivity that gives rise to increased demand by rural families for household products and agricultural inputs that can be efficiently produced in rural areas. Pack further notes that, even in China, Korea and Taiwan, a dramatic increase in agricultural productivity had supported the growth of the small and medium enterprise (SME) sector that sells its products to the farms.
Ravallion and Chen (2007) found that, in China over the period 1980–2001, the impact of the primary sector on headcount poverty reduction was 3.5 times higher than the impact of either the secondary or tertiary sector. They estimated the poverty elasticity of growth in China at –7.85 for agricultural and –2.25 for non-agricultural economy; that is, 1% growth originating in the primary sector brings a 7.85% reduction in poverty, whereas the same magnitude of growth originating in the non-primary sectors results in only a 2.25% reduction in poverty. The lead role of the primary sector in poverty reduction in China was further confirmed by a more recent study that used provincial panel data (Montalvo and Ravallion 2010).

The contribution of agricultural growth to poverty reduction (IAS 76) 31
example, employment of unskilled labour may not be high in highly mechanised agriculture.
Some studies have suggested that when growth in agriculture is accompanied by investment in infrastructure, education and health, its effect on poverty reduction is further enhanced. In a study of 15 Asian countries, Habito (2009) analysed sectoral contribution to poverty in two stages, first using pair-wise correlations, then multiple-regression equations. The pair-wise correlations revealed only weak evidence of any systematic relationship between sectoral growth and poverty reduction, especially for agriculture and services. However, when using multiple-regression equations, it was found that the joint effect of agriculture-driven growth, good governance and social expenditures by the government appear to well explain the variation in poverty elasticity of growth across Asian countries. Contrary to the puzzling results obtained under pair-wise correlation analysis, agriculture’s role this time emerged as a significant determinant of the poverty elasticity of growth, in the expected direction. However, its impact on this measure was still considerably weaker than those of governance and public expenditures on education and heath, with governance having the strongest effect.
The impact of agriculture on poverty reduction depends on the interaction of several effects. First of all, the direct effect of growth in the agriculture sector is to raise income levels of those employed in the sector. Second, how much the poor people benefit from agricultural growth depends on the rate of participation of the poor in agriculture. This depends, in turn, on the type of agriculture in a particular location. For example, in highly mechanised agriculture, the participation of the poor and unskilled people may be minimal. On the other hand, in subsistence agriculture, or in fruit and vegetable farming, the rate of participation of the poor may be relatively high. As noted above, Loayza and Raddatz (2010) emphasised the importance of the intensity of unskilled labour use in agriculture in determining its ability to reduce poverty. Third, the total contribution of agriculture to poverty reduction depends on the relative size of the sector; i.e. the share of the agriculture sector in the national economy. Finally, there are indirect contributions that growth in one sector of the economy make for enhancing growth in the other sectors and helping to reduce poverty.
found that labour productivity gains in agriculture (measured by the value-added per worker) were large in East Asia during 1993–2002, when rural poverty rates also fell sharply. They also found that growth in agricultural productivity had large positive effects on poverty reduction in the developing countries of Sub-Saharan Africa and other parts of Asia, but not so in Latin America and the Caribbean. The authors suggested that, in Latin America and the Caribbean, gains in agricultural productivity did not translate into lower rural poverty rates because they were driven by capital and thereby created fewer employment opportunities. According to these authors, an important determinant of a sector’s impact on poverty lies in the intensity of its employment of unskilled workers, and because agriculture and construction are the leading sectors in this regard, both have a large impact on poverty reduction.
In recent years, some studies have provided more nuanced, and qualified, support for the role of agriculture in poverty reduction. Thus, for example, based on an examination of a sample of 25 countries, Cervantes-Godoy and Dewbre (2010) found that growth in agriculture plays a leading role in the reduction of extreme poverty (i.e. income ≤US$1.25 per day), but non-agricultural growth is more powerful in reducing poverty among the better-off poor (i.e. in reducing the US$2.00 per day poverty headcount). They found that the dominance of agriculture in reducing extreme poverty declined as countries became richer and as income inequality increased. They also found that more than 52% of the average poverty reduction in 12 of the 25 countries studied was due to agricultural growth, while remittances contributed to 35% of the reduction and the rest was due to non-agricultural growth. A further finding was that high initial income inequality in a country reduced the impact of agricultural growth on poverty reduction.
But agriculture and construction are not the only sectors that employ unskilled workers—some service industries also do so; for example, domestic and cleaning services in the tourism industry. Studies by Suryahadi et al. (2009) and Suryahadi and Hadiwidjaja (2011) reported that urban services have been the most important source of poverty reduction in Indonesia. At the same time, different types of agriculture had different intensities for employment of unskilled labour. Thus, for

32 The contribution of agricultural growth to poverty reduction (IAS 76)
products such as meat, dairy, fruits and vegetables, providing an additional demand boost for agriculture and thus larger reverse linkage effects.
The current awareness of climate change has further strengthened the indirect multiplier effect of agriculture by increasing the demand for fuel derived from agricultural products (World Bank 2007).
The whole process of sectoral transformation creates forward and backward linkages between the agriculture and non-agriculture sectors. The demand from the growing agriculture sector also feeds into higher growth in non-agriculture sectors. In addition to the demand for manufactured products such as tractors, tube wells, fertilisers and pesticides, rising agricultural incomes are also spent on purchasing industrial products for households and on services including education, health care, and financial and domestic services. Thus, agricultural growth also has a multiplier effect on non-agricultural growth. Many studies suggest that the agricultural multiplier is significantly greater than 1, especially in relatively closed, non-trading economies of the sort found in rural Africa, where the multiplier is often between 2 and 3 (Timmer 2009). But even in the more open economies of Asia, where rice is more tradeable than in most African countries and staple foods and local prices more easily reflect world prices, the agricultural multiplier is close to 2 in the early stages of agricultural modernisation when productivity gains are the fastest.
Most developing countries are currently going through their sectoral transformation, but not all are moving at the same pace. For example, in 1961 the share of agriculture in employment was roughly the same in China, India and Indonesia, when all three countries had about 74% of their workforce employed in agriculture. By about 2008, this share had dropped to around 40% in China, 42% in Indonesia but by much less, to about 52%, in India. This indicates that, for various reasons, employment in industry and services has not been growing as rapidly in India as it has in China and Indonesia.
In its 2008 World Development Report, the World Bank (2007) delineated three classes of developing countries—agriculture-based economies, transforming economies and urbanised economies—to emphasise the point that policy responses need to be shaped by the specific conditions in each country; in particular by
4.2 Agriculture, economic growth and structural change
As economies grow, they go through a sectoral transformation that is characterised by falling shares of agriculture in both GDP and employment, even when the absolute size of the agriculture sector continues to grow in terms of output. All the developed countries have gone through this process during their economic development. A common feature of this sectoral transformation is that the share of agriculture in a country’s economy (i.e. GDP and employment) falls as the industry and services sectors grow. The main driver of this transformation is captured in the so-called Engle’s Law.7 The rate at which the share of the agriculture sector declines differs between countries and depends on many factors, including how rapidly the alternative sectors of an economy are growing, how equally or unequally non-agricultural income is distributed, and how strong the feedback effects of urbanisation are on demand for agricultural products. As urban incomes grow, demand also increases for agricultural products, such as meat, eggs, milk, vegetables and fruits, generating further growth within the agriculture sector. Haggblade et al. (2007, p. 14) explain this process of sectoral transformation as follows:
As countries grow, the role of agriculture as a generator of overall growth declines, and new drivers emerge both in the rural non-farm economy (urban-to-rural subcontracting) as well as the urban economy (e.g., manufactured exports), a phenomenon widely observed over the past decades in the Asian economies. With rapid (urban) income growth comes a significant diversification of diets into higher value agricultural
7 Engle’s Law is the name given to the relationship, first articulated by 19th century German statistician Ernst Engle (not to be confused with Friederich Engels, the collaborator of Karl Marx), between growth in income and the proportion of income spent on consumption in general, and food in particular. Engle found that as the level of income rises, the proportion of income spent on food falls, although the absolute amount of expenditure on food does not decrease. This relationship suggests, therefore, that as a country experiences economic development, the share of agriculture in its economy declines (and that of the industry and services sectors increases).

The contribution of agricultural growth to poverty reduction (IAS 76) 33
These general suggestions for policy focus must be adjusted according to the importance of heterogeneities of agriculture within a given country. In the different regions of China, India, Indonesia, South Africa and Vietnam, there are many different types of agriculture, depending upon climatic conditions. It would be sensible therefore to align policies for agricultural growth and poverty reduction accordingly. In some places, for example, large commercial farming coexists with smallholders. Some smallholders are subsistence farmers, while others sell a part of their produce in the markets. Price-support policies, commonly used in developing countries, would benefit the net sellers, but not the net buyers. As the World Bank (2007, p. 6) notes, balancing attention to the favoured and less favoured subsectors, regions and households is ‘one of the toughest policy dilemmas facing poor countries with severe resource constraints’.
the share of agriculture in a country’s GDP and whether there is rural or urban dominance of poverty. In the agriculturally based economies (mostly in Sub-Saharan Africa8), agriculture accounted for around 29% of GDP, and 68% of the population lived in rural areas. In the transforming economies (mostly South Asia, East Asia and the Pacific, and the Middle East and North Africa), agriculture accounted for 13% of GDP on average, and 63% of the population were rural. Most of the urbanised economies are in Latin America, the Caribbean, Europe and Central Asia where, on average, 6% of GDP came from agriculture and 26% of the population was rural.
While raising productivity in both agriculture and non-agriculture sectors remains the fundamental challenge for developing countries, policy responses need to be designed according to county-specific conditions. According to the World Bank (2007), the focus of policies should be on raising agricultural productivity by greater investment in R&D and innovation, as well as in developing supportive institutions for facilitating growth in rural non-farm employment. Depending upon the heterogeneities of agriculture within the countries, smallholder farms should be targeted with policies for promoting improved seeds and better use of fertilisers, and improving access to markets and credit facilities. In the transforming economies, the main thrust of policies might be on improving the quality of sectoral public goods such as rural education, infrastructure investment, and agricultural R&D and extension services. In the urbanised economies, while improvements in agricultural productivity may be still targeted, the main thrust of policies should be directed at reducing urban poverty.
8 This includes South Africa, but the shares of agriculture in GDP and employment in South Africa are much lower than the averages for this region (see Chapter 5).

34 The contribution of agricultural growth to poverty reduction (IAS 76)
irrigation, R&D and rural infrastructure. Their argument is that these investments had prepared the ground for the great increase in agricultural production and incomes following the decollectivisation of farming brought in under the Household Responsibility System introduced in 1978 under the Four Modernizations Campaign.
Before the reforms began, the returns to government investment were inhibited by policy and institutional barriers. The mountainous topography of many parts of China had hindered the development of roads, resulting in the isolation of rural communities from urban markets and employment opportunities. The government gave highest priority in its investment portfolio in the 1980s to rural road construction, electrification of rural areas and development of irrigation systems. These reforms reduced the barriers, enabling investments to generate immense economic growth and poverty reduction. Fan et al. (2004, p. 408) estimated that, between 1978 and 1984, rural reforms accounted for more than 60% of total production growth in Chinese agriculture and more than 51% of poverty reduction, and that public investment accounted for 12% of growth and 45% of poverty reduction. They found that public investment in education had the highest impact on poverty reduction, lifting 12 people out of poverty for every 10,000 yuan of investment in education. Investment in agricultural R&D had the second-largest impact on poverty and the largest impact on agricultural GDP growth.
Ravallion (2008) largely supports the findings of Fan et al. (2004). In particular, he reiterates the role of government investments in complementing the rural decollectivisation reforms. ‘China’s success was
5.1 China
The contribution of China’s agriculture to poverty reduction was discussed earlier in this report. Following the continuous migration of rural labourers into urban areas, urban poverty and inequality have become serious problems in China. The migrant workers and their families have received different treatment in terms of health, education and other social services, and have also been discriminated against in the local job markets, factors which tend to generate social divisions and even social unrest in the more developed urban areas.
New poverty has also emerged in China’s pastoral regions. The growth rates in the incomes of herders have been lower than those of the farmers in some regions of Inner Mongolia. Factors responsible for this include declining productivity because of land degradation, a drought that lasted for several years, policies that were aimed at protecting grassland (partial or full grassland enclosures), deterioration in the agricultural extension and technical support services for animal production, and limited scope for herders to diversify their income sources. The new poverty has also been caused by an increase in living costs, especially for education, medical care and fuel.
Fan et al. (2004) argue that, even with the economic reforms that began in 1978, it would not have been possible for China to achieve rapid economic growth and poverty reduction in the absence of the substantial government investment that had occurred in the decades before and after those reforms. They refer to huge amounts of public investment in rural education,
5 Agriculture and poverty: country perspectives

The contribution of agricultural growth to poverty reduction (IAS 76) 35
This does not mean that everything is rosy with China’s agriculture. Indeed, it is facing several challenges, which are discussed in the next chapter.
5.2 India
Agriculture contributed a little more than 51% of the total output of India’s economy in the early 1950s. Its share has steadily declined to around 18% in 2008 (Table 6). In 1952, agriculture was the principal occupation of more than 72% of India’s labour force. During the next two decades, the share of the workforce employed in agriculture remained virtually unchanged, but started declining, albeit slowly, after 1971. The latest estimates reveal that about 52% of the total labour force was engaged in the agriculture sector during the triennium ending 2008 (Table 6). As discussed in the previous chapter, these changes in the share of agriculture in GDP and employment are consistent with the processes of structural transformation that accompany economic growth. India’s structural transformation has been much slower, however, than that of China, Indonesia or Vietnam, and Indian agriculture is carrying the weight of providing employment to a much larger share of the country’s population than is the case in comparable countries.
India’s agriculture is dominated by smallholders, and rates of growth in this sector have been modest. Under the pressures of population growth and subdivision of family farms, the average size of landholdings has been falling. The share of farm holdings of less than 2 hectares (ha) has increased from 70% in 1970–71 to 83% in 2005–06. Further, more than 60% of the farmers in the country are operating on less than 1 ha. Land distribution is highly skewed and uneven; the bottom 83% farmers control about 41% of farmed area. Thus, the changing structure of farm holdings in favour of smaller size poses a challenge for accelerated poverty reduction in rural areas and calls for land reforms.
Rural employment in India has undergone significant changes since the 1970s. Total rural employment did not experience much growth during the 1970s and even declined during the 1980s. But since 1987 total employment in rural India has been growing at almost 2% per annum. Non-agricultural employment has grown
not just a matter of letting markets do their work’, he points out, adding that success would not have been possible without strong state institutions implementing supportive policies and public investments (Ravallion 2008, p. 309). Research also played an important role. The government established the first publicly funded agricultural research organisation, the China Rural Development Research Group, in 1980. This was followed by the establishment of the Chinese Academy of Social Sciences and the Development Research Center under the State Council.
No doubt China’s poverty reduction has been greatly helped by rapid and sustained growth of its export-led manufacturing sector, which grew at an average annual rate of 12% over 1985–2005. However, Ravallion (2008) argues that it was growth in the rural economy that did the ‘heavy lifting’ in reducing the number of poor in the early stages of China’s reform process.9 It should be recalled that Ravallion and Chen (2007) had decomposed the impact of sectoral growth on poverty reduction in China over the period 1981–2004 and had found that growth in the primary sector had had about a four times greater beneficial impact on national poverty as had growth in either the secondary or the tertiary sectors. Ravallion (2008) argued that the success of agrarian reforms in promoting a rapid reduction in rural poverty was ‘causally relevant’ to the subsequent success in promoting labour-intensive manufacturing.
Another relevant feature of agricultural growth as compared with industrial growth in China is that agricultural growth reduced urban–rural income disparities, whereas industrial growth accentuated them. ‘Imagine if the same aggregate growth rate had been balanced across sectors’, Ravallion suggested, in an attempt to illustrate the superiority of the equality-enhancing impact of agricultural growth. ‘Then it would have taken 10 years to bring the poverty rate down to 10%, rather than 20 years’ (Ravallion 2008, p. 306).
Thus, agriculture played a highly significant role in poverty reduction in the early stages of China’s growth and prepared the ground for the subsequent impact of the industrial sector and urbanisation on poverty.
9 Critics may argue that initial success in poverty reduction is relatively easier when large numbers of the poor are lifted from just below the poverty line and that subsequent reductions are more difficult as they have to dig deeper into the poverty gap.
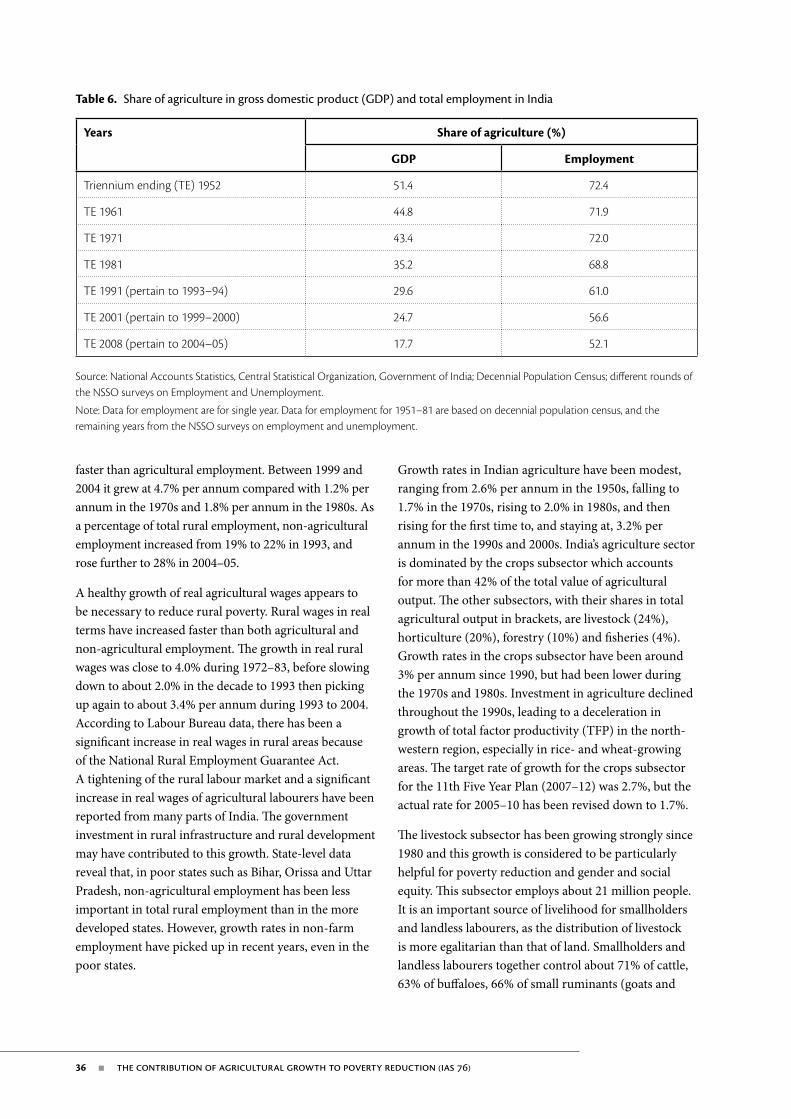
36 The contribution of agricultural growth to poverty reduction (IAS 76)
Growth rates in Indian agriculture have been modest, ranging from 2.6% per annum in the 1950s, falling to 1.7% in the 1970s, rising to 2.0% in 1980s, and then rising for the first time to, and staying at, 3.2% per annum in the 1990s and 2000s. India’s agriculture sector is dominated by the crops subsector which accounts for more than 42% of the total value of agricultural output. The other subsectors, with their shares in total agricultural output in brackets, are livestock (24%), horticulture (20%), forestry (10%) and fisheries (4%). Growth rates in the crops subsector have been around 3% per annum since 1990, but had been lower during the 1970s and 1980s. Investment in agriculture declined throughout the 1990s, leading to a deceleration in growth of total factor productivity (TFP) in the north-western region, especially in rice- and wheat-growing areas. The target rate of growth for the crops subsector for the 11th Five Year Plan (2007–12) was 2.7%, but the actual rate for 2005–10 has been revised down to 1.7%.
The livestock subsector has been growing strongly since 1980 and this growth is considered to be particularly helpful for poverty reduction and gender and social equity. This subsector employs about 21 million people. It is an important source of livelihood for smallholders and landless labourers, as the distribution of livestock is more egalitarian than that of land. Smallholders and landless labourers together control about 71% of cattle, 63% of buffaloes, 66% of small ruminants (goats and
faster than agricultural employment. Between 1999 and 2004 it grew at 4.7% per annum compared with 1.2% per annum in the 1970s and 1.8% per annum in the 1980s. As a percentage of total rural employment, non-agricultural employment increased from 19% to 22% in 1993, and rose further to 28% in 2004–05.
A healthy growth of real agricultural wages appears to be necessary to reduce rural poverty. Rural wages in real terms have increased faster than both agricultural and non-agricultural employment. The growth in real rural wages was close to 4.0% during 1972–83, before slowing down to about 2.0% in the decade to 1993 then picking up again to about 3.4% per annum during 1993 to 2004. According to Labour Bureau data, there has been a significant increase in real wages in rural areas because of the National Rural Employment Guarantee Act. A tightening of the rural labour market and a significant increase in real wages of agricultural labourers have been reported from many parts of India. The government investment in rural infrastructure and rural development may have contributed to this growth. State-level data reveal that, in poor states such as Bihar, Orissa and Uttar Pradesh, non-agricultural employment has been less important in total rural employment than in the more developed states. However, growth rates in non-farm employment have picked up in recent years, even in the poor states.
Table 6. Share of agriculture in gross domestic product (GDP) and total employment in India
Years Share of agriculture (%)
GDP Employment
Triennium ending (TE) 1952 51 .4 72 .4
TE 1961 44 .8 71 .9
TE 1971 43 .4 72 .0
TE 1981 35 .2 68 .8
TE 1991 (pertain to 1993–94) 29 .6 61 .0
TE 2001 (pertain to 1999–2000) 24 .7 56 .6
TE 2008 (pertain to 2004–05) 17 .7 52 .1
Source: National Accounts Statistics, Central Statistical Organization, Government of India; Decennial Population Census; different rounds of the NSSO surveys on Employment and Unemployment .
Note: Data for employment are for single year . Data for employment for 1951–81 are based on decennial population census, and the remaining years from the NSSO surveys on employment and unemployment .

The contribution of agricultural growth to poverty reduction (IAS 76) 37
acknowledged that the best that might be achieved is likely to be around 3% per annum (Ahluwalia 2011).
There are several reasons for the poor performance of the sector, one of which could be characterised as implementation fatigue, causing delays in the introduction of key initiatives that were expected to raise the growth rates of agriculture. The mid-term appraisal report itself provides such evidence (GOI 2010, pp. 70–71):
Given these ambitious objectives, the performance so far has been most disappointing. Till 31 August 2009, an expenditure of nearly Rs. 5000 crore10 [Rs 50,000 million] had been incurred during the Eleventh Plan period but this was entirely on old projects. No watershed project under the new IWMP [Integrated Water Management Programme] had been sanctioned till then. There are still about 16,744 ongoing projects at various stages of completion, which have been unduly delayed on one account or another. This poses a serious question over where the massively raised outlays for the new IWMP in the Eleventh Plan are going to be spent. What is even more worrisome is that the steps that need to be taken to actualise the potential inherent in the new guidelines have yet to be put in place.
As Table 7 shows, growth rates in all subsectors of Indian agriculture are below the target rates for the 11th Five Year Plan.
In summary, agriculture and the rural economy continue to be the primary source of income and employment for the majority of India’s population. The process of structural transformation has been proceeding more slowly in India than in China, Indonesia, South Africa and Vietnam, as a relatively greater proportion of the population is employed in this sector in India than in the other countries. This also reflects that employment growth in the secondary and tertiary sectors has not been sufficiently high to further reduce the share of agricultural employment. In recent years, India’s GDP growth has been driven by the services sector, but employment growth in this sector has been slower than its output. Furthermore, the poor and the unskilled cannot find employment in the growing subsectors of the services sector.
10 One crore is equal to 10 million.
sheep), 70% of pigs and 74% of poultry. According to Sharma and Kumar (2011), the rapid growth of the livestock subsector benefits the poorest households the most, because livestock contributes nearly half of the total income of the smallholders. This subsector also has a special role in promoting gender and social equity, since around 60% of its total workforce are women. Furthermore, the majority of workers engaged in livestock belong to socially and economically backward communities. Scheduled tribes, and scheduled and other backward castes, together constitute about 70% of the persons employed.
The fisheries subsector is still small, given the length of India’s coastline and its internal waterways. Growth in this sector was above 5.0% per annum during the 1980s and the 1990s, but has fallen to a little above 3.0% since 2000. The fisheries subsector was targeted to grow at an annual rate of 6.0% during the 11th Five Year Plan, but actual growth has been revised down to around 4.0% per annum until 2009–10. Given the scope of this subsector for employing people with little education and no particular technical skills, further growth could help reduce rural poverty.
It is well documented that while the introduction of high-yielding varieties (HYVs) of crops and the expansion of irrigation and fertiliser use have been major engines of productivity growth in Indian agriculture, there have been substantial regional differences in the level of application of these inputs. By and large, the use of these inputs was low in poorer states compared with the developed states. In Punjab, for instance, more than 90% of the cropped area was planted with HYVs, while in states with high poverty rates, such as Bihar and Orissa, about 45% of the total cropped area was still planted with traditional varieties in 2006–07. Although many factors are associated with rural poverty, the lower rates of HYV adoption, irrigation and fertiliser use in these states are clearly correlated with a higher incidence of rural poverty.
The deceleration in the growth of Indian agriculture has contributed to rural distress in parts of the country, affecting both large and small farmers. The government developed a strategy aiming for a near doubling of the rates of growth of agriculture during the 11th Five Year Plan (2007–12). The plan had a target rate of more than 4% per annum for the agriculture sector but, in the light of a mid-term appraisal (GOI 2010), it is now

38 The contribution of agricultural growth to poverty reduction (IAS 76)
The GDP share of the industrial sector actually declined between 1980 and 1990, but its employment share continued to increase significantly. This reflects the change in Indonesia’s industrial development strategy in the mid 1980s, from capital-intensive import substitution to labour-intensive export orientation. However, after the Asian financial crisis, the employment share of the industrial sector declined again and reached 14% in 2000. During the reform period, this share stagnated and remained at 14% in 2010 (Figure 2).
The share of employment in services has been rising rapidly since the 1990s and now accounts for close to 46%.
In line with Suryahadi et al. (2009), Suryahadi and Hadiwidjaja (2011) found that the growth of the agriculture sector was not effective as growth in the non-agriculture sectors in terms of poverty reduction. The growth in the services sector appears to have had the highest impact in reducing poverty in Indonesia in both urban and rural areas. This result held for both the pre– and post–Asian financial crisis eras. The role of agriculture sector growth nevertheless remained important in reducing poverty in rural areas. However, its effect fell slightly after the crisis.
Comparison of the agricultural and services sectors shows that growth elasticity of poverty for the services sector is higher than that for the agriculture sector, both before and after the Asian financial crisis. As the estimation of sectoral growth is weighted by GDP share, the services sector, which contributes the most in terms of GDP, outplays the agriculture sector in its capacity
While the livestock subsector has benefited from policy support and urbanisation, the largest subsector of Indian agriculture, namely the crops subsector, has suffered from policy neglect and lower investment. The use of HYVs and the spread of electrification have played a crucial part in the past growth of this sector, but have also gone through neglect and are limited to only some states. Sharma and Kumar (2011) find that rising rural literacy is the most important driver of poverty reduction in India, presumably because it helps the poor in connecting with non-agricultural employment either in the diversifying rural economy or in urban areas.
5.3 Indonesia
Suryahadi and Hadiwidjaja (2011) found urban services to be the most important force in poverty reduction in Indonesia. The share of agriculture in Indonesia’s GDP has been falling steadily since the 1970s and is now around 14%. Correspondingly, the share of industry and services has fluctuated since 1980, although the services sector has been growing rapidly and accounts for close to 50% of GDP (Figure 1).
Some of these studies also suggest that agriculture in Indonesia has been badly neglected in recent decades due to the urban bias in government policies, particularly since the Asian financial crisis of 1997–98.
Table 7. Growth rates of gross value of output in Indian agriculture and allied sectors
Subsector Share of value of output (%)
Average growth 2000–01 to
2004–05
Target growth for 11th Five Year Plan
Average growth 2005–06 to
2009–10
Crops 42 .4 1 .0 2 .7 1 .7
Horticulture 19 .8 2 .0 5 .0 4 .1
Livestock 23 .8 3 .3 6 .0 4 .1
Forestry and logging 9 .6 1 .4 0 .0 2 .6
Fisheries 4 .5 3 .7 6 .0 4 .8
Total 100.0 1.7 4.0 3.0
Source: GOI (2010, p . 62)

The contribution of agricultural growth to poverty reduction (IAS 76) 39
Figure 1. Sectoral shares (%) of gross domestic product (GDP) in Indonesia, 1971–2010
60
Shar
e o
f GD
P (%
)
50
40
30
20
10
0
Agriculture
1971
Industry Services
1980 1990 2000 2010
Figure 2. Sectoral shares (%) of employment in Indonesia, 1971–2010
60
70
50
40
30
20
10
0
Agriculture
1971
Industry Services
1980 1990 2000 2010
Shar
e o
f em
plo
ymen
t (%
)

40 The contribution of agricultural growth to poverty reduction (IAS 76)
As a result of the structural transformation that has occurred in the South African economy, only 7.4% of South Africa’s workforce was employed in the primary sector in 2000—5.1% in agriculture and 2.3% in mining. The agriculture sector lost 594,000 jobs between 1995 and 2009, while a further 150,000 jobs were lost in the mining sector. Employment growth during this period was mainly in the services sector, where 3,290,000 new jobs were created. Two subsectors within the services sector, namely wholesale and retail trade, and finance, have been the engines of growth in employment. In the industrial sector, only 271,000 jobs were created in the manufacturing industry, while 608,000 were created in the construction industry. In 2001, just under 1.2 million workers (including farmers) were employed in the primary sector. After an increase to just over 1.4 million, the number of individuals working in agriculture fell to about half of the number employed in 2001. Thus, by 2009, fewer than 600,000 people were classified as working in the sector.
According to Bhorat et al. (2011), the decline in employment was the result of several factors, including the increased level of capital intensity of commercial agriculture, the introduction of minimum-wage legislation and the replacement of permanent farm workers with seasonal or casual labour (the last also partly in response to the introduction of the minimum wage). While it is uncertain whether agriculture has played any role in the reduction of poverty levels since 1995, the decline in the employment of farm workers does suggest a loss of income experienced by the households of these workers. Evidence suggests further that farm workers were also still more likely to receive wages below the statutory minimum than workers in other sectors governed by sectoral wage determinations.
Furthermore, the evidence on the impact of the measures introduced since 1994 suggests that interventions such as trade liberalisation, market deregulation and land reform policies have been less than successful in increasing participation in the sector (particularly by previously excluded groups). Small and emerging farmers generally lack the skills and experience to take advantage of the policy changes. Progress in the land redistribution process has also been slow.
It is clear from the above discussion that the South African economy is heading towards a difficult period. While employment in commercial agriculture has
to reduce poverty. The fact that the agriculture sector excelled during the financial crisis shows that its growth is more stable. Nonetheless, growth in the services sector is more effective in reducing poverty.
The geography of Indonesia’s urban centres may also have a bearing on the role of urban services in poverty reduction, as suggested by the greater role of urban services in reducing rural poverty. In other words, it appears that large numbers of rural poor are able to engage in urban services without long-term migration to urban areas.
5.4 South Africa
The incidence of both absolute and relative poverty in South Africa has declined since the advent of democracy, not only in aggregate but also for the largest population group, namely Africans. The gains in terms of income have been modest, however, and by 2005 still almost half of South Africans were living in poverty according to a Cost of Basic Needs poverty line. By contrast and thanks to the social protection programs put in place by the Government of South Africa, access by the poor households to most of the basic services has increased significantly since 1994. The poorest households still lack access to all assets, in particular to piped water and flush or chemical toilets.
The agriculture sector in South Africa has experienced extensive changes since 1994, first as a result of domestic reforms introduced by successive post-apartheid governments and, more recently, as a result of the stimulation of production in both the commercial and small-scale farming sector in the wake of the global food crisis in 2008. The basic premise of the Accelerated and Shared Growth Initiative for South Africa (ASGISA) has been that the agriculture sector has a critical contribution to make in achieving the initiative’s goals of higher economic growth, poverty reduction and increase in employment (Tregurtha 2008, p. 2).
Between 1995 and 2005, growth in the output of South African agriculture kept pace with the increase in aggregate output, and the contribution of the sector to aggregate GDP has remained relatively unchanged at about 2.3%, although the rate of growth of agriculture has slowed since 2000.

The contribution of agricultural growth to poverty reduction (IAS 76) 41
must eventually endanger the sustainability of South Africa’s public finances. There is already indirect evidence that the opportunity cost of the current social protection system in South Africa is adversely affecting the government’s budgetary priorities. For example, while government expenditure on social grants has increased from 3.2% of GDP in 2001 to 4.4% in 2009, expenditure on some other budget items, including education and health has remained fairly constant in real terms (Leibbrandt et al. 2010). The more the social grants grow in the future, the more difficult it will become for the government to finance public investment and expenditure on other productive budgetary priorities.
In South Africa, the well-intended policy of equalising the rural and urban wage has had an unintended effect of causing higher unemployment of unskilled agricultural workers after 2006. This example is also relevant for China, where demands for basic service equalisation are often made without realisation of the costs involved.
It may be concluded, therefore, that despite the South African government’s emphasis on the role of agriculture in contributing to economic growth and job creation, the scope for this might be limited. For the sector to play a significant role in poverty reduction, several issues need to be resolved. The most critical of these include support for emerging farmers, in terms of skills development, improved support and extension services, and improved access to financial services. The slow progress in land redistribution also warrants attention.
5.5 Vietnam
The Vietnamese economy grew at an average annual rate of 7.9% during the 1990s and at 7.5% per annum between 2000 and 2004 (World Bank 2007). The core objective of Vietnam’s economic strategy since the early 1990s has been a rapid integration into the world economy: the development of a diversified portfolio of oil, manufactured and agricultural exports, and the attraction of direct foreign investment. The share of merchandise exports in Vietnam’s GDP rose from around 10% in the 1980s to 47% in 2002, then to 70% by 2005.
fallen, especially for unskilled workers, growth of non-agriculture sectors has not been rapid enough to absorb the growth in the labour force. Employment growth has been concentrated mainly in two sectors—wholesale and retail trade, and financial and business services—which are together responsible for two-thirds of total employment growth since 1994. Three of every four jobs created in the financial and business sector are those for security services and labour brokers. The high incidence of crime in South Africa has in fact resulted in a rapid growth in employment within the financial and retail trade subsectors, primarily for providing crime prevention services.
Although 3.2 million jobs were created between 1994 and 2009, the labour force grew by 4.7 million during the same period, adding further to the already large pool of the unemployed. Indeed, the number of unemployed more than doubled between 1995 and 2009, and the unemployment rate, which has been rising at the average annual rate of 5.2%, reached 28.3% in 2009, one of the highest rates among developing countries. Unemployment rates for Africans and young people are even higher, because their share in employment has fallen. Thus, growth in the South African economy has been inadequate to absorb the growing workforce. Unemployment, already alarmingly high, continues to grow. African male workers, and households whose head lacks secondary education, have not benefited from economic growth.
The number of social protection grant recipients increased from 3.0 million in 1997 to 9.4 million in 2005, then to 13.5 million in 2009. Labour market outcomes have also generated increasing income inequalities. Not only those without education, but also those with education only up to grade 12, seem to have been unable to access gainful employment. As noted by Bhorat et al. (2011), the high level of inequality might have been even higher without the growth of social protection programs.
While South Africa’s social protection system has helped in reducing poverty, from the longer term perspective this solution to poverty reduction is unsustainable. It is a challenge for the Government of South Africa to rebalance the current model of economic growth in favour of one that creates sufficient numbers of jobs to reduce both poverty and unemployment. The rapidly growing fiscal burden of social protection programs

42 The contribution of agricultural growth to poverty reduction (IAS 76)
rapid growth in Vietnam’s agriculture has opened pathways out of poverty for farming households. The government’s Resolution 10 in 1988 promoted privatisation in agriculture, on which more than 70% of its population depended. Under Resolution 10, the distribution of land was relatively equal in proportion to the size of the farming household. Food production, which was essential for poverty reduction over the 1990s, increased from 19.5 million tonnes in 1988 to 21.7 million tonnes in 1991, 32.1 million tonnes in 2001, then 39.5 million tonnes in 2005, a rate of growth in food production that was unprecedented in the country’s recent history. The Land Law of 1993 also played a substantive role in reducing poverty by allowing land-use rights to be legally transferred, exchanged, mortgaged and inherited. Ravallion and van de Walle (2006) found that land allocation in Vietnam had become more efficient since the 1993 Land Law. Vietnam also succeeded in maintaining agricultural output growth beyond the initial, once-off spurt caused by land reform. This was done by investing in rural infrastructure for raising agricultural productivity. State organisations took an active role in building rural roads, which facilitated greater access to markets, vocational education and training facilities, as well as information and communication technologies.
The country’s efforts to integrate deeper into the world since 2000 contributed further to boosting economic growth and poverty reduction. Price reform, replacing plan prices with market prices, was quickly implemented in the early days of doi moi 11 and, by 1987, most non-essential consumer good prices had moved towards market prices.
The near-universal literacy and selected technical and higher education also helped attract foreign investors and facilitated industrial and technological development in Vietnam.
11 Doi moi (meaning ‘renovation’) is the name given to the economic reforms initiated in Vietnam in 1986.
According to the Organisation for Economic Co-operation and Development (OECD Observer, No. 233, August 2002):
Vietnam became the first East Asian country to complete a full poverty reduction strategy paper in May 2002. But the strain of an externally imposed poverty reduction framework on this growth-hungry economy became apparent. The country already had a five-year plan and a ten-year strategy which defined national goals of doubling GDP by 2010 and achieving industrialisation and modernisation by 2020. All fiscal resources were mobilised accordingly. When some eager donors insisted that their poverty reduction strategies were the supreme tool for resource allocation, the Vietnamese government sternly rejected the idea. The differences were papered over, and the resulting document—renamed the Comprehensive Poverty Reduction and Growth Strategy—is lauded as a model by the World Bank! But shouldn’t we rather have supported Vietnam’s own growth strategy, instead of trying to replace it with an entirely new one?
The Comprehensive Poverty Reduction and Growth Strategy for Vietnam reaffirmed the need, if development was to proceed, to continue the open-door policy and to actively integrate into the international economy (GOVN 2002, p. 60). The Socio-Economic Development Plan for 2006–10 continued the strategy, with a projected 16% annual increase in export turnover.
The poverty rate in Vietnam (as measured by per-capita consumption) came down from 58.1% in 1993 to only 19.5% in 2004. The poverty rate in 2004 was one-third of 1993 levels. The growth elasticity of poverty reduction in Vietnam is estimated at 0.95 for 1993–98 and 1.32 for 1998–2004.
What are the factors that helped this remarkable achievement in poverty reduction in Vietnam? According to de Janvry and Sadoulet (2010),

The contribution of agricultural growth to poverty reduction (IAS 76) 43
growth potential of the affected countries and limit targeted improvements in social indicators.
According to the United Nations report ‘Rethinking poverty’ (UN 2009, p. 87):
The IMF/World Bank programmes and policy advice improved the efficiency of tax administration but have done little to help raise tax revenues and have tended to result in the reduction of direct taxation in favour of indirect taxation.
The report argued for a shift in macro-economic policies and development strategies towards more inclusive growth, and for enhancing the roles of fiscal policy and fiscal space in tackling poverty (UN 2009, p. 91):
Macroeconomic policies should strive for both short-run stability and long-term development. Therefore, public investment for building up infrastructure, technological capabilities and human resources is critical for growth and productive employment generation and, hence, for poverty reduction. Public expenditure must also give priority to primary health care, universal basic education and human security—all of which are pro-poor. There is a substantial body of research on pro-poor budgets and the poverty alleviating effects of fiscal policy (Roy and Weeks 2004; McKinley 2004, 2008). Such an approach does not focus on government spending per se, but on whether government expenditure reduces poverty by disproportionately benefiting the poor relative to the non-poor (Osmani 2005), explicitly linking macroeconomic policy with poverty reduction and human development.
The UN report also noted that promoting full and productive employment was proclaimed as one of the three pillars of social development by the Copenhagen World Summit for Social Development in 1995. In 2008, a new employment target was added under the
6.1 Why has agriculture been neglected by policymakers and investors?
It is widely acknowledged that, among government policymakers and donor organisations, interest in agriculture declined in the 1980s, that the decline slowed gradually in the late 1990s and that a resurgence of interest has been evident since food prices started rising in the mid 2000s. Timmer (2009, p. 46) writes:
Agriculture has been seriously undervalued by both the public and private sectors in those societies in which poverty has remained untouched (or, in some cases, has been deepened). That is, market prices for basic food commodities have reflected both market and government failures in sending appropriate signals about the full social value of increased output—a value that needs to include the value that society places in poverty reduction and reduced hunger, as well as the incremental value to GDP.
The neglect of agriculture since the 1980s is also associated with a broader shift in economic strategy in many countries, which focused single-mindedly on reduction in budget deficits and resulted in a fall in public investment, especially in agriculture. The failure of this strategy to deliver on economic and social outcomes was acknowledged by the International Monetary Fund in the following terms (IMF 2004, p. 3):
The share of public investment in GDP, and especially the share of infrastructure investment, has declined during the last three decades in a number of countries, particularly in Latin America. Since the private sector has not increased infrastructure investment as hoped for, significant infrastructure gaps have emerged in several countries. These gaps may adversely affect the
6 The neglect of agriculture

44 The contribution of agricultural growth to poverty reduction (IAS 76)
and support for new technologies, access to credit and markets for agricultural produce. As noted by the OECD (2006), there has been a substantial decline in public-sector support for agriculture and many producers have lost access to key inputs and services. While public-sector provision of these services was not very efficient, it often provided the sole linkages to markets for poor rural producers. Today, such links are tenuous and complicated by much greater integration of the global economy. Smallholder producers now compete in markets that are much more demanding in terms of quality and food safety, and are more concentrated and integrated than in the past. OECD agricultural subsidies further distort many of these same markets (OECD 2006, Executive summary, p. 2).
The economic reforms of the early 1990s in Africa did not promote commercial farming to enhance growth of agriculture and therefore there were no major improvements in the lives of the rural population. As a result of the poor policies and governance, the number of people living in extreme poverty increased in Africa as agricultural productivity declined. In many countries, although the agriculture sector employs a large number of people, lack of access to formal financial services has hindered increases in large-, medium- and small-scale commercial agricultural productivity. Therefore, the rural productive sector and small agricultural enterprises suffer and are exposed to a multitude of market failures. This may include development policies that favour urban areas, and lending policies that are biased against small-scale agricultural firms and benefit urban big business and commercial activities. For example, Cromwell et al. (2005) examined the treatment of rural productive sectors in Malawi, Nicaragua and Vietnam in terms of their potential to reduce rural poverty and deliver pro-poor growth. They observed that although agriculture is a major contributor to growth (about 40%, 18% and 22% of GDP, respectively) in those countries and accounts for a larger percentage of total workforce employment (about 80%, 31% and 63%, respectively), appropriate treatment, particularly in terms of funding and resource allocation, has not been given to rural productive sectors. Their study concluded that significant investment and long-term policy commitment in rural agriculture is required to assist the poor and enhance rural productive sectors. A more focused rural development strategy is needed that should deliver increased reliability to power supply,
MDG No. 1 of halving poverty by 2015, with the objective of achieving ‘full and productive employment and decent work for all, including women and young people’.
In discussing the falling productivity in the agriculture sector and the poor performance of many agricultural development projects, the World Bank (2007) noted that the decline in the world price of food and other primary commodities, and the rising appeal of East Asia’s export-led manufacturing growth miracle, contributed to this neglect. Together, these factors pushed the agriculture sector into lower priority when the development strategies focused on export-oriented manufacturing and services as the key drivers of national economic growth.
Donor organisations also dropped agriculture as a priority for world development in the 1990s, when agriculture was considered to be associated with overproduction, pollution and subsidies in the developed countries. According to the UN Water, Energy, Health, Agriculture and Biodiversity Working Group (UN WEHAB 2002), many developing countries also did the same and reduced the priority of agriculture in their development strategies.
The contribution of the agriculture sector to poverty reduction can be witnessed in the historical patterns of economic development and poverty reduction in African and Asian countries. In the early years of independence, most of the African economies relied heavily on agriculture to propel economic growth and provide income and employment opportunities to the masses. Agriculture in Sub-Saharan African countries employed a large percentage of the labour force in the 1970s and 1980s. As a result, agricultural output increased, providing export earnings, mainly from primary products, supporting the livelihoods of millions of people and giving direct employment to more than half of the labour force in these countries (UNDP 2002). Similarly, agriculture provided significant employment in Asian countries and was a major source of income for most of the population in the 1960s to 1980s (Rosegrant and Hazell 2000). Thus, agricultural growth has contributed to a rapid reduction in poverty.
Government policies play a crucial role in agricultural development, through many channels, including land reforms, irrigation systems, electrification of rural areas, roads and telecommunication systems, pricing policies and fiscal support for agricultural inputs, R&D

The contribution of agricultural growth to poverty reduction (IAS 76) 45
growth in the rest of the economy. This relationship grows into a mutually supportive one and matures into one where the rest of the economy drives agricultural growth by absorbing surplus labour from agriculture. As noted above, it is well documented in the literature that, in the initial stages of economic reforms, agriculture also contributed significantly to poverty reduction in China.
In spite of this evidence, however, agriculture in many developing countries is still suffering from policy neglect and this is directly contributing to the persistence of rural poverty. For example, there are many examples in China of what has been called in the literature ‘the urban biases’ in government policies. First, the provision of basic public services—education, health, social security and social welfare—is heavily skewed in favour of urban areas. Second, the economic opportunities available to the rural population are severely limited by the many constraints that still apply to private ownership of agricultural land. Thus, farmland cannot be mortgaged or sold, limiting the ability of the farmers to raise loan capital for either education of their children or investment in new technologies on the farm (Chi 2009).
In common with a worldwide trend, public investment in Indian agriculture also fell, and the sector drifted into relative policy neglect from the 1990s onwards. Growth in agricultural productivity also decelerated during the same period and continued up to the mid 2000s, as shown in Table 8. The decade-and-a-half to 2006 witnessed acceleration in agricultural productivity growth in the world as whole, embracing developed and developing countries. In China, productivity growth accelerated in the 1990s and has remained high, but at a slightly lower rate of growth since 2000. Vietnam has also maintained TFP growth of more than 2.8% per annum over the period 1990–2006 (Fuglie 2008, p. 440). It is clear from these comparisons that productivity in India’s agriculture, on which 44% of total households rely, has been growing since the 1990s at lower rates than in Brazil, China or Vietnam, as well as the average rate for developing countries.
Sharma and Kumar (2011, p. 17) have noted that economic reforms launched in the early 1990s did not have a favourable impact on the agriculture sector in India, because economic reforms neglected investment in infrastructure development and institutional changes in the agriculture sector, and that the slowdown in agricultural growth after the mid 1990s was attributed
provision of transportation and storage equipment, better access to roads, investment in skills development, better coordination of information and marketing of produce. Overall, reforms and capacity-building initiatives are needed in the developing world to encourage markets to provide the agriculture sector with better access to finance and promote land use so that it can support rural poverty alleviation.
Cervantes-Godoy and Dewbre (2010) point out that agriculture in Indonesia has also suffered from policy neglect after the Asian financial crisis of 1997–98, as the government’s agricultural policy has been narrowly focused on achieving self-sufficiency and price stability for the import-competing commodities, particularly rice, sugar and palm oil. They noted (Cervantes-Godoy and Dewbre 2010, p. 30) that the Indonesian government has used input subsidies and export taxes to achieve these objectives and that both these policy instruments have been shown to be highly inefficient and inequitable means for supporting rural incomes.
It has further been suggested that the declining interest in agriculture was also responsible for an associated decline in efforts to understand the continuing role of the sector in both economic growth and poverty reduction (Timmer 2009).
The neglect of agriculture appears to be at least in part the result of a misconception in some policy circles that, because the share of agriculture in an economy declines as the economy grows, deceleration of growth in agriculture is inevitable. While it is true that the statistics show falling shares of agricultural GDP and employment in the developed and developing economies, this is not to say that agriculture is inherently an inferior or losing sector. Christiaensen et al. (2010) challenged this view of the inferiority of the agriculture sector by showing that, between 1960 and 2003, labour productivity in the global agriculture sector increased at an average annual rate of 2.40% compared with 0.74% in the non-agriculture sector. In the East Asia and Pacific regions, the comparable rates were 2.9% and 2.7%, respectively, and, in Latin America and the Caribbean, 2.3% and 0.5%, respectively. Only in South Asia, despite the green revolution, was the rate of labour productivity growth lower for agriculture (1.2%) than for the non-agriculture sector (2.2%). This study found an evolving relationship between agriculture and the rest of the economy. At low levels of development, growth in agriculture encourages

46 The contribution of agricultural growth to poverty reduction (IAS 76)
services). It is gratifying to note that encouraging signs have emerged in recent years to suggest that the neglect of agriculture may be receding and giving way to the realisation that the full potential of the sector for poverty reduction and economic development has not yet been realised in any developing countries. International agencies such as the Food and Agriculture Organization of the United Nations (FAO), the OECD, the World Bank and IFAD are generating substantial literature on the need to rejuvenate agriculture, for both development and poverty reduction. Agricultural prices have also risen, lifting the levels of agricultural incomes. Greater demand for biofuels is also making agriculture more profitable, even though the potential conflict between biofuels (which currently depend on heavy subsidies) and food security remains to be resolved.
As discussed earlier, economic growth leads to structural transformation in every economy. As part of this transformation, the share of agriculture in GDP and employment declines and the industry and services sectors’ shares expand. Because non-agricultural activity is generally concentrated in urban centres, it is common to observe that urban living standards rise faster than those in rural areas. It was also noted above that, in China and Vietnam, the industry sector absorbed the surplus labour and thereby played a major role in poverty reduction. The same has not happened in South Asia (particularly India), however, because while the share of agriculture in national economies continues to decline, the growing sector is not industry, but services, which has not generated sufficient employment to absorb the labour force leaving agriculture.
to (1) declining public investment in agriculture; (2) deteriorating terms of trade for agriculture; (3) no expansion of agricultural markets and irrigation in underdeveloped areas; and (4) slow dissemination of improved technologies.
India’s agriculture also suffers from implementation fatigue, which has been a source of delays in the introduction of important policy initiatives. A second aspect of the neglect of Indian agriculture is the lack of sufficient R&D and extension services. Technology is recognised by the Government of India as one of the prime movers of agricultural productivity (Sharma and Kumar 2011), but India’s expenditure on it remains below the average rate for developing countries (0.34% in India as opposed to 0.53% of agriculture-GDP in the latter). Technology generation in India is also dominated by the public sector, which continues to follow a supply-driven process that is not well suited to meeting the farmers’ needs and has created a widening gap between what is available on the shelf and what is needed on the ground.
6.2 The untapped potential of agriculture
The result of the policy neglect of agriculture is that for more than two decades the agriculture sector has been starved of new investment and is desperately short of complementary infrastructure and public goods (i.e. education, health, R&D, technology and extension
Table 8. Agricultural total factor productivity (TFP) growth by country and region
Average annual growth rate (%) in TFP index
1970–79 1980–89 1990–99 2000–06
Brazil –0 .54 3 .13 3 .00 3 .66
China –0 .19 2 .47 3 .78 3 .22
India 0 .80 2 .10 1 .74 1 .43
Vietnam … … >2 .80 >2 .80
Developing countries 0 .55 1 .67 2 .31 2 .08
Developed countries 1 .62 1 .48 2 .25 1 .76
World 0 .60 0 .94 1 .60 1 .55
Source: Updated from Fuglie (2008)

The contribution of agricultural growth to poverty reduction (IAS 76) 47
for agriculture in Africa, where farmers do not have draft animals for tilling, because sleeping sickness kills cattle and horses. African agriculture could also benefit from the ‘Roundup-ready’12 crops, which can be grown in zero-tillage cultivation. In zero tillage, after harvesting of rice, wheat or maize, new crops can be planted without ploughing. Because the Roundup-ready varieties have built into their seed a gene conferring resistance to Roundup®, the herbicide can be used safely for killing weeds without harming the crop (Borlaug, quoted in Bailey 2000).
Borlaug’s optimism about science and innovation is also reflected in the World Development Report 2008, which provides quantitative estimates of the contributions made by investment in R&D and public infrastructure in the past. Thus, it is noted that investment in science, roads and human capital from the 1960s onward, together with better policies and institutions, drove gains in agricultural productivity. TFP of agriculture grew at 1–2% per annum in Asia due to technology breakthroughs. This growth in TFP of agriculture was responsible for half of the output growth in China and India, and 30–40% in Indonesia, reducing pressure to increase the supply of scarce land. Investments in R&D have turned much of developing-world agriculture into a dynamic sector, with rapid technological innovation accelerating growth and reducing poverty (World Bank 2007, p. 159).
The contribution of scientific plant breeding to the green revolution is one of the major success stories of development. The contribution of improved crop varieties to yield growth since 1980 has been even greater than in the green revolution decades (World Bank 2007, p. 159). According to Witcombe et al. (1996) and Walker (2007), participatory plant breeding is now paying off with strong and early adoption of farmer-selected varieties that provide 40% higher yields in the very poor rainfed rice-growing areas of South Asia which, due to lack of irrigation, had not benefited from the green revolution.
In the 1980s and 1990s, improved varieties are estimated to have contributed as much as 50% of yield growth, compared with 21% in the preceding two decades. Without those gains in yields, cereal prices would have
12 Roundup® is a herbicide widely used for weed control in crops.
This situation has created for India’s planners a policy challenge for generating sufficient employment in both the agricultural and non-agricultural economy.
The fact remains that, given the high concentration of the world’s poor in developing countries and in rural areas, it would be wrong to think that a poverty reduction strategy in any of these countries could succeed without lifting the growth of the agriculture sector. This is not only because agriculture still provides employment to a large proportion of the workforce in China, India, Indonesia and Vietnam, but also because the agriculture sector has suffered from a long period of neglect and its full potential has not yet been tapped. A successful strategy for poverty reduction should focus not only on agriculture, but also on raising the level of growth in the broader rural economy, including non-farm services, to complement the farm-sector growth.
The World Development Report 2008 underscores the importance of agriculture as being a crucial development and environmental challenge of the 21st century by making ‘agriculture for development’ its principal theme. In the report, the World Bank (2008, p. 158) argues that ‘technology for development must go well beyond just raising yields to saving water and energy, reducing risk, improving product quality, protecting the environment, and tailoring to gender differences’.
Over the centuries, agriculture has flourished as a result of the application of knowledge in the form of innovative irrigation technologies, crop-rotation practices and management of pastures for livestock. In the more recent past, Norman Borlaug, widely acknowledged as the father of the green revolution, led teams of researchers in the 1960s in using scientific research and knowledge to develop new high-yielding varieties of wheat and rice, which brought about the dramatic increases in crop production in India and Pakistan. Wheat and rice output has continued to rise since then and the Malthusian predictions that India would not be able to feed its population by 1980 have been proven wrong. Rising yields on arable land also help the environment by stopping further clearing of natural forests for crop cultivation.
According to Borlaug, scientific knowledge still has an important role to play in uplifting agriculture in other regions. For example, biotechnology has great potential

48 The contribution of agricultural growth to poverty reduction (IAS 76)
Using the example of India, Virmani (2007) argues for greater investment in rural roads, which contributed about a quarter of the growth in agricultural output in the 1970s. The empirical results also justify an added focus on rural roads and telecommunications connectivity (in addition to the general effects found earlier), to the extent that they promote the development of agriculture. Development of rural connectivity also improves market integration and labour mobility which, in turn, will remove the differential and segmented impact of growth on rural and urban poverty. Rural areas need to be connected to markets and towns. Roads and communications infrastructure are needed for this to happen. State policies, rules and regulations that facilitate this process then lead to faster growth, through construction of shops, workshops, restaurants, offices, hotels and housing along the town roads extending into the countryside, and in roadside villages.
been 18–21% higher in 2000, food energy availability per capita in developing countries would have been 4–7% lower, 13–15 million more children would have been classified as malnourished, and many more hectares of forest and other fragile ecosystems would have been brought under cultivation (Evenson and Rosegrant 2003; cited in World Bank 2007, p. 160).
The World Bank considers that these investments will be even more important in the future, with rapidly changing markets, growing importance of resource security and greater uncertainty. Science is changing rapidly, offering new opportunities and possibilities for future agricultural growth. For example, the development of insect-resistant transgenic cotton has reduced yield losses, increased farm profits and greatly reduced pesticide use for millions of smallholders. The benefits of innovation are not limited to crop farming: they are also revolutionising aquaculture and livestock farming. For example, genetically improved tilapia (fish) is changing aquaculture into one of the fastest growing subsectors of agriculture in South Asia (World Bank 2007, p. 163). Figures in Sharma and Kumar (2011) confirm that this is the fastest growing subsector of India’s agriculture.
Nearly 94% of agricultural R&D in developing countries comes from the public sector and did not increase as a share of agricultural GDP (remaining at 0.52%) between 1981 and 2000. In India, the figure had increased from 0.18% in 1981 to 0.34% in 2000, whereas there had been a slight reduction in China from 0.41% to 0.40% during the same period. Another problem with public sector–dominated R&D is that it has become supply driven, whereas there is need for R&D to become demand driven—reflecting the needs of the farmers and consumers (World Bank 2007, p. 165). Sharma and Kumar (2011) also note that innovation systems in India are dominated by the public sector.

The contribution of agricultural growth to poverty reduction (IAS 76) 49
Regardless of past performance, major challenges remain for all these countries to achieve further reductions in poverty and reduce vulnerabilities due to external shocks.
The growth in agriculture has been a leading source of poverty reduction in most developing countries, especially in the case of extreme and rural poverty. Agriculture contributes to poverty reduction because it provides employment to the poor, who have also generally low skills and education, as well as supporting the growth of non-agricultural employment in rural areas. Growth in agriculture also contributes to a greater supply of food and to lower food prices, and benefits both rural and urban poor.
While it is true that, as economies grow, demand for non-agricultural products and services grows faster than for agricultural products, and that the shares of agriculture in GDP and employment decline over time, the full potential of the agriculture sector for poverty reduction has not yet been realised in most developing countries. Indeed, it is a broadly shared view among the experts that agriculture has been neglected in the past three decades, during which time investment in rural infrastructure has fallen, reducing the capacity of rural economies to generate incomes and employment. It is encouraging to note that, in recent years, interest in the development of agriculture appears to have increased, partly because of rising food prices, concerns about food security in some regions and the effects of growing demand for biofuels. An important part of this revival of interest in agricultural development is also due to the efforts of organisations such as IFAD, FAO, the OECD, the UN and UNDP, and the World Bank.
Another important conclusion emerging from the review of the literature is that the impact of agriculture on poverty reduction cannot be assessed by focusing on
Given that the focus of this report is on assessing the role of agriculture in poverty reduction, it was essential to clarify at the outset the main issues related to the definition and measurement of poverty. Poverty is now widely acknowledged to be a multidimensional concept that encapsulates deprivations in several dimensions that limit opportunities for a happy, healthy and productive life. The key deprivations include income poverty, hunger, malnutrition, gender bias, social exclusion, and lack of access to education, health services and housing. There has been a clear shift away from focusing only on income or consumption, towards defining poverty as a multidimensional condition and developing adequate ways of measuring it over time and across nations. The MPI launched in 2010 by the UNDP and the OPHI at the University of Oxford is the latest among multidimensional measures of poverty. Most countries are still using poverty measures based on income or consumption, primarily because of the ease of temporal comparisons of progress, although some countries have expressed a clear intention of adopting the MPI in the future. Vietnam is one such example.
Obviously, the level of poverty assessed depends on the particular measures used, but there is general consensus that, since 1980, there has been a significant reduction in poverty in developing countries, some of it ahead of the MDG of halving extreme poverty by 2015. All the countries studied in this report have made substantial progress in reducing poverty, although their performance has been uneven. While the largest reductions have been made in China and Vietnam, Indonesia has also made impressive gains. Poverty reduction in South Africa has been slow and heavily dependent on social protection, because of slow growth in sustainable employment generation. India, now home to the largest number of poor in the world, has made steady but slow progress in poverty reduction.
7 Conclusions

50 The contribution of agricultural growth to poverty reduction (IAS 76)
and innovative technologies and processes that are suited to the local conditions in different countries. Pioneering work by scientists in developing high-yielding varieties of wheat and rice in the 1960s revolutionised the crops subsector of agriculture in parts of India and Pakistan.
An associated issue is the need to strengthen the capacity of public institutions so that an appropriate blend of policies, regulatory frameworks and investments can be developed to relaunch the agriculture sector. Traditional agricultural policies have concentrated on increasing agricultural production, neglecting investment in postharvest enterprises and in non-agricultural assets that could contribute to greater diversification of rural economies. In the absence of diversified sources of income, rural communities remain vulnerable to a variety of external shocks. Pro-poor policies need to aim at removing all those barriers that increase these vulnerabilities and risks.
Agriculture is also a highly diverse sector and does not lend itself to be run by uniform policies and programs. Various scales of activity can be identified: large-scale commercial agriculture, traditional agriculture that is not internationally competitive, subsistence agriculture, landless rural households and micro-enterprises, and chronically poor rural households many of whom are no longer economically active. Then there are distinct subsectors in all countries: crops, livestock, horticulture, fisheries and forestry. Policies for agricultural growth and rejuvenation need to be framed in full recognition of this diversity, including, for example, the importance of distinct subsectors of agriculture that require specific policy responses. The fact is, however, that the efforts of policymakers to better understand the role of the various subsectors in poverty reduction also appear to have become a casualty of the neglect of agriculture during the past three decades. In India, for example, the importance of the livestock subsector in poverty reduction and in promoting gender balance is only now being recognised. There is a clear need to fully understand the impact of the diversities and heterogeneities of agriculture on poverty, malnutrition, gender imbalances and social exclusion.
Finally, it is also clear from the literature review that better insights can be gained from studies that are conducted at a disaggregated level, because they are able to capture the full significance of the diversity
this sector in isolation, because such analysis is likely to miss the important forward and backward linkages among the various sectors of an economy. Instead, the impact of agriculture ought to be considered simultaneously with the other sectors. The study by Habito (2009) provides a good illustration of this issue. When using pair-wise correlations between different sectors, Habito found no significant contribution of agriculture or industry to poverty reduction. This result changed materially, however, when all the sectors were analysed by simultaneous equation regressions together with social expenditures and governance indicators, because it was now possible to capture all the forward and backward linkages for sectoral growth. There are other examples that reinforce this. The point assumes even greater importance in the context of the findings of several studies discussed in this report, which suggest that growth in the rural economy has a greater impact on rural poverty reduction than growth in just the narrowly defined agriculture sector.
The basic lesson of structural transformation of the economies is that while the absolute size of the agriculture sector continues to grow, its share in employment will fall because of the more rapid employment growth outside agriculture. This growth in non-agricultural employment does not necessarily have to be all in urban centres. With the support of appropriate policies and institutions, rural areas can also generate additional employment in non-agricultural activities. These policies for rural economic growth require an increase in the level and effectiveness of public investment on infrastructure and expenditure on education, health care, other social services and safety nets for vulnerable groups. Several studies have emphasised the importance of the impact of public expenditure when it is combined with other sectoral growth and employment generation policies. This is crucial because public investment in agriculture and public support for farmers has fallen around the world, despite the demonstrated high rates of return and the reduction in poverty that come from such investment.
The role of R&D in agricultural development and, eventually, in poverty reduction needs a special mention. The challenges facing agriculture in most developing countries include raising crop yields, increasing efficiency of energy and water use, improving product quality and protecting the environment. Meeting these challenges requires new

The contribution of agricultural growth to poverty reduction (IAS 76) 51
of agriculture. It is worth pointing out, for example, that Habito (2009) was able to find that it was the manufacturing sector, not agriculture, that played a more important role in poverty reduction in the South-East Asian countries, once he had examined these countries separately from the larger South Asian region. An earlier study by Hasan and Quibria (2004) had examined all these countries together as parts of the larger South Asian region and found that agricultural growth was the leading driver of poverty reduction. There is need, therefore, to conduct further research at a sufficiently disaggregated level, preferably at the state or provincial levels in the larger countries, to obtain more accurate and precise results.

52 The contribution of agricultural growth to poverty reduction (IAS 76)
Chaobuoisang.net 2011. Government to embrace new poverty reduction strategy. At <http://news.chaobuoisang.net/government-to-embrace-new-poverty-reduction-strategy-182265.htm>, accessed 31 May 2011.
Chi F. 2009. China’s reform in the shadows of the global financial crisis. Foreign Language Press: Beijing.
Christiaensen L., Demery L. and Kuhl J. 2010. The (evolving) role of agriculture in poverty reduction. Working Paper No. 2010/36. World Institute for Development Economics Research of the United Nations University: Helsinki.
Cromwell E., Luttrell C., Shepherd L. and Wiggins S. 2005. Poverty reduction strategies and the rural productive sectors: insights from Malawi, Nicaragua and Vietnam. Working Paper No. 258. Overseas Development Institute: London.
de Janvry A. and Sadoulet E. 2010. Agricultural growth and poverty reduction: additional evidence. World Bank Research Observer 25(1), 1–20.
Dev M. 1998. Regional disparities in agricultural labour productivity and rural poverty. Indian Economic Review 23(2), 167–205.
DFID (Department for International Development) 2005. Growth and poverty reduction: the role of agriculture. Policy Paper. DFID: London.
Diprose R. 2007. Physical safety and security: a proposal for internationally comparable indicators of violence. Oxford Development Studies 35(4), 431–456.
Evenson R.E. and Rosegrant M. 2003. The economic consequences of crop genetic improvement programmes. Pp. 473–497 in ‘Crop variety improvement and its effect on productivity: the impact of international agricultural research’, ed. by R.E. Evenson and D. Gollin. CABI Publishing: Wallingford, UK.
Fan S., Zhang L. and Zhang X. 2004. Reforms, investment, and poverty in rural China. Economic Development and Cultural Change 52(2), 395–421.
Ahluwalia M.S. 2011. Prospects and policy challenges in the Twelfth Plan. Economic and Political Weekly 46(21), 88–105.
Alkire S. 2007. The missing dimensions of poverty data: introduction to the special issue. Oxford Development Studies 35(4), 347–359.
Alkire S. and Foster J. 2009. Counting and multidimensional poverty measurement (revised and updated). Oxford Poverty and Human Development Initiative, Working Paper No. 32. University of Oxford: Oxford.
— 2011. Understandings and misunderstandings of multidimensional poverty measurement. Oxford Poverty and Human Development Initiative, Working Paper No. 43. University of Oxford: Oxford.
Alkire S. and Santos E.M. 2010. Acute multidimensional poverty: a new index for developing countries. Oxford Poverty and Human Development Initiative, Working Paper No. 38. University of Oxford: Oxford.
Anand S. and Sen A. 2000. The income component of the human development index. Journal of Human Development 1(1), 83–106.
Bhorat H., van der Westhuizen C. and Jacobs E. 2011. The role of agriculture in poverty reduction: South Africa. Paper presented at the Centre for Strategic Economic Studies – Australian Centre for International Agricultural Research International Workshop on the Role of Agriculture in Poverty Reduction, Melbourne, May 2011. Centre for Strategic Economic Studies, Victoria University: Melbourne.
Cervantes-Godoy D. and Dewbre J. 2010. Economic importance of agriculture for poverty reduction. Food, Agriculture and Fisheries Working Papers, No. 23. Organisation for Economic Co-operation and Development: Paris.
Chakravarty S. and D’Ambrosio C. 2006. The measurement of social exclusion. Review of Income and Wealth 52(3), 377–398.
References

The contribution of agricultural growth to poverty reduction (IAS 76) 53
Habito C. 2009. Patterns of inclusive growth in developing Asia: insights from an empirical growth–poverty elasticity analysis. Working Paper No. 145. Asian Development Bank Institute: Tokyo.
Haggblade S., Hazell P. and Dorosh P. 2007. Sectoral growth linkages between agriculture and the rural nonfarm economy. Pp. 141–182 in ‘Transforming the rural nonfarm economy: opportunities and threats in the developing world’, ed. by S. Haggblade, P. Hazell and T. Reardon. Johns Hopkins University Press: Baltimore, MA.
Hasan R. and Quibria M.G. 2004. Industry matters for poverty: a critique of agricultural fundamentalism. Kyklos 57(2), 253–264.
IFAD (International Fund for Agricultural Development) 2010. Rural poverty report 2011: new realities, new challenges: new opportunities for tomorrow’s generation. IFAD: Rome.
— 2011. Agriculture: pathways to prosperity in Asia and the Pacific. IFAD: Rome.
IMF (International Monetary Fund) 2004. Public investment and fiscal policy. IMF: Washington, DC. At <http://www.imf.org/external/np/fad/2004/pifp/eng/pifp.pdf>.
Leibbrandt M., Woolard I., Finn A. and Argent J. 2010. Trends in South African income distribution and poverty since the fall of apartheid. Social, Employment and Migration Working Papers, No. 101. Organisation for Economic Co-operation and Development: Paris.
Loayza N.V. and Raddatz C. 2010. The composition of growth matters for poverty alleviation. Journal of Development Economics 93(1), 137–151.
McKinley T. 2004. Economic policies and poverty reduction in Asia and the Pacific: alternatives to neoliberalism. United Nations Development Programme: New York.
— 2008. Economic policies for growth and poverty reduction: PRSPs, neoliberal conditionalities and ‘post-consensus’ alternatives. IDS Studies Bulletin 39(2), 93–103. Institute of Development Studies: Brighton, UK.
Meng X., Gregory R. and Wang Y. 2005. Poverty, inequality and growth in urban China: 1986–2000. Journal of Comparative Economics 33(4), 710–729.
Montalvo J.G. and Ravallion M. 2010. The pattern of growth and poverty reduction in China. Journal of Comparative Economics 38(1), 2–16.
Narayan D., Chambers R., Shah M.K. and Petesch P. 2000. Voice of the poor: crying out for change. Oxford University Press, for the World Bank: New York.
FAO (Food and Agriculture Organization of the United Nations) 2008. Soaring food prices: facts, perspectives, impacts and actions required. High level conference on world food security: the challenges of climate change and bioenergy, June 2008. FAO: Rome.
Foster J., Greer J. and Thorbecke E. 1984. A class of decomposable poverty measures. Econometrica 52(3), 761–765.
— 2010. The Foster–Greer–Thorbecke (FGT) poverty measures: 25 years later. Journal of Economic Inequality 8(4), 491–524.
Fotso J.C. 2006. Child health inequities in developing countries: differences across urban and rural areas. International Journal for Equity in Health 5(9), 1–10.
Friel S., Chiang T., Cho Y., Guo Y., Hashimoto H., Jayasinghe S., et al. 2011. Freedom to lead a life we have reason to value? A spotlight on health inequity in the Asia Pacific Region. Asia–Pacific Journal of Public Health 23(2), 246–263.
Fuglie K.O. 2008. Is a slowdown in agricultural productivity growth contributing to the rise in commodity prices? Agricultural Economics 39, 431–441.
GOI (Government of India) 2010. Mid term appraisal for Eleventh Five Year Plan 2007–2012. Planning Commission: New Delhi.
GOVN (Government of the Socialist Republic of Vietnam) 2002. The comprehensive poverty reduction and growth strategy (CPRGS). GOVN: Hanoi.
— 2011. Resolution no. 80 /NQ-CP, direction for sustainable poverty reduction from 2011 to 2020. At <http://www.undp.org.vn/detail/newsroom/feature-details/?contentId=3943&languageId=1>, accessed 2 June 2011.
Grewal B. and Ahmed A. 2011a. Is China’s western regional development strategy on track? Journal of Contemporary China 20(69), 161–181.
— 2011b. Agriculture and poverty reduction: literature review and outstanding issues. Paper presented at the Centre for Strategic Economic Studies – Australian Centre for International Agricultural Research International Workshop on the Role of Agriculture in Poverty Reduction, Melbourne, May 2011. Centre for Strategic Economic Studies, Victoria University: Melbourne.
Grewal B., Ahmed A. and Malhotra P. 2010. Inclusive growth in India: past performance and future prospects. India Economy Review 7, 76–83.
Gunther I. and Klasen S. 2009. Measuring chronic non-income poverty. Pp. 77–101 in ‘Poverty dynamics: interdisciplinary perspectives’, ed. by T. Addison, D. Hulme and R. Kanbur. Oxford University Press: Oxford.

54 The contribution of agricultural growth to poverty reduction (IAS 76)
Sharma A.N. and Kumar A. 2011. The role of agricultural policy in poverty reduction: the Indian experience. Paper presented at the Centre for Strategic Economic Studies – Australian Centre for International Agricultural Research International Workshop on the Role of Agriculture in Poverty Reduction, Melbourne, May 2011. Centre for Strategic Economic Studies, Victoria University: Melbourne.
Sheehan P. 2010. Rebalancing economic growth: financing innovation in health. Presentation made at the Workshop on the APEC Growth Strategy, Sapporo, Japan, June 2010.
Silver H. 1995. Reconceptualizing social disadvantage: three paradigms of social exclusion. Pp. 57–80 in ‘Social exclusion: rhetoric, reality, responses’ ed. by G. Rodgers, C. Gore and J. Figueiredo. International Institute for Labour Studies: Geneva.
Stiglitz J., Sen A. and Fitoussi J.-P. 2009. Report of the commission on the measurement of economic performance and social progress. At <www.stiglitz-sen-fitoussi.fr>.
Suryahadi A. and Hadiwidjaja G. 2011. The role of agriculture in poverty reduction in Indonesia. Paper presented at the Centre for Strategic Economic Studies – Australian Centre for International Agricultural Research International Workshop on the Role of Agriculture in Poverty Reduction, Melbourne, May 2011. Centre for Strategic Economic Studies, Victoria University: Melbourne.
Suryahadi A., Suryadarma D. and Sumarto S. 2009. The effects of location and sectoral components of economic growth on poverty: evidence from Indonesia. Journal of Development Economics 89(1), 109–117.
Thirtle C., Irz X., Lin L., McKenzie-Hill V. and Wiggins S. 2001. Relationship between changes in agricultural productivity and the incidence of poverty in developing countries. Commissioned report. Department for International Development: London.
Tregurtha N. 2008. Position paper on the role of skills development in accelerating growth and equity in the South African agricultural sector. Paper prepared for the Joint Initiative on Priority Skills Acquisition (JIPSA) Technical Working Group, November 2008.
Timmer C.P. 2009. A world without agriculture: the structural transformation in historical perspective. The AFI Press: Washington DC.
UN (United Nations) 2009. Rethinking poverty. UN: New York.
UNDESA (United Nations Department of Economic and Social Affairs) 2011. Database with annual population. At <http://esa.un.org/unpd/wpp/Excel-Data/population.htm>, accessed 3 June 2011.
Nussbaumer P., Bazilian M., Modi V. and Yumkella K.K. 2011. Measuring energy poverty: focusing on what matters. Working Paper No. 42, Oxford Poverty and Human Development Initiative. University of Oxford: Oxford.
OECD (Organisation for Economic Co-operation and Development) 2006. Promoting pro-poor growth: agriculture. OECD: Paris.
Osmani S. 2005. Defining pro-poor growth. One Pager No. 9 (January). International Poverty Centre, United Nations Development Programme, Brasilia, Brazil.
Pack H. 2009. Should South Asia emulate East Asian tigers? Pp. 75–80 in ‘Accelerating growth and job creation in South Asia’, ed. by E. Ghani and S. Ahmed. Oxford University Press, for the World Bank: New Delhi.
Ravallion M. 1996. Issues in measuring and modelling poverty. The Economic Journal 106 (438), 1328–1343.
— 2008. Are there lessons for Africa from China’s success against poverty? World Bank: Washington, DC.
— 2010. Mashup indices of development. Policy Research Working Paper No. 5432. World Bank: Washington, DC.
— 2011. On multidimensional indices of poverty. Journal of Economic Inequality 9(2), 235–248.
Ravallion M. and Chen S. 2007. China’s (uneven) progress against poverty. Journal of Development Economics 82(1), 1–42.
Ravallion M. and Datt G. 1996. How important to India’s poor is the sectoral composition of economic growth. World Bank Economic Review 10(1), 1–26.
— 2002. Why has economic growth been more pro-poor in some states of India than others? Journal of Development Economics 68(2), 381–400.
Ravallion M. and van de Walle D. 2006. Land reallocation in an agrarian transition. Economic Journal 116(514), 924–942.
Rosegrant M.W. and Hazell P.B. 2000. Transforming the rural Asian economy: the unfinished revolution. Oxford University Press: New York.
Roy R. and Weeks J. 2004. Making fiscal policy work for the poor. United Nations Development Programme, Asia–Pacific Regional Programme on Macroeconomics of Poverty Reduction. UNDP: New York.
Sen A.K. 1976. Poverty: an ordinal approach to measurement. Econometrica 44(2), 219–231.
— 1989. Development as capabilities expansion. Journal of Development Planning 19, 41–58.

The contribution of agricultural growth to poverty reduction (IAS 76) 55
Virmani A. 2007. The sudoku of growth, poverty and malnutrition: policy implications for lagging states. Planning Commission Working Paper No. 2/2007-PC. Government of India: New Delhi.
Walker T. 2007. Participatory varietal selection, participatory plant breeding, and varietal change. Background paper for the World Development Report 2008. The World Bank: Washington, DC.
Warr P. 2002. Poverty reduction and sectoral growth: evidence from Southeast Asia. Draft Paper, Economics Division, Research School of Pacific and Asian Studies. Australian National University: Canberra.
Witcombe J.R., Joshi A., Joshi K.D. and Sthapit B.R. 1996. Farmer participatory crop improvement: varietal selection and breeding methods and their impact on biodiversity. Experimental Agriculture 32(4), 445–460.
World Bank 2007. World development report 2008: agriculture for development. World Bank: Washington, DC.
— 2008. World development indicators: poverty data—a supplement to world development indicators, 2008. World Bank: Washington, DC.
— 2009. From poor areas to poor people. China’s evolving poverty reduction agenda: an assessment of poverty and inequality in China. Poverty Reduction and Economic Management Department. World Bank: Washington, DC.
— 2011. Social protection for a changing India. World Bank: Washington, DC.
Yu, Jiantuo 2011. Multidimensional poverty in China: some preliminary findings based on CHNS 2000–2009. Paper presented at the Centre for Strategic Economic Studies – Australian Centre for International Agricultural Research International Workshop on the Role of Agriculture in Poverty Reduction, Melbourne, May 2011. Centre for Strategic Economic Studies, Victoria University: Melbourne.
UNDP (United Nations Development Programme) 1990. Human development report 1990: concept and measurement of human development. Oxford University Press, for UNDP: New York.
— 2002. Local governance for poverty reduction in Africa. Concept paper, Fifth Africa Governance Forum, Maputo, Mozambique, UNDP and United Nations Economic Commission for Africa.
— 2010. Human development report: the real wealth of nations—pathways to human development. Palgrave Macmillan, for UNDP: New York.
UNESCAP (United Nations Economic and Social Commission for Asia and the Pacific) 2008. Economic and social survey of Asia and the Pacific 2008: sustaining growth and sharing prosperity. UNESCAP: Bangkok.
— 2010. Statistical yearbook for Asia and the Pacific 2009. UNESCAP: Bangkok.
— 2011. Rising food prices and inflation in the Asia–Pacific region: causes, impact and policy response. Policy Brief No. 7, Macroeconomic Policy and Development Division. UNESCAP: Bangkok.
UN WEHAB (United Nations Water, Energy, Health Agriculture and Biodiversity Working Group) 2002. A framework for action on agriculture. United Nations: Johannesburg. Accessible at: <http://www.gdrc.org/sustdev/un-desd/wehab_agriculture.pdf>.
USAID (United States Agency for International Development) 2010. Demographic health survey. At <http://www.measuredhs.com/start.cfm>, datasets accessed from January 2011.

No. Author(s) and year of publication Title ACIAR project numbers
1 Centre for International Economics 1998.
Control of Newcastle disease in village chickens AS1/1983/034, AS1/1987/017 and AS1/1993/222
2 George P.S. 1998. Increased efficiency of straw utilisation by cattle and buffalo
AS1/1982/003, AS2/1986/001 and AS2/1988/017
3 Centre for International Economics 1998.
Establishment of a protected area in Vanuatu ANRE/1990/020
4 Watson A.S. 1998. Raw wool production and marketing in China ADP/1988/011
5 Collins D.J. and Collins B.A. 1998. Fruit fly in Malaysia and Thailand 1985–1993 CS2/1983/043 and CS2/1989/019
6 Ryan J.G. 1998. Pigeonpea improvement CS1/1982/001 and CS1/1985/067
7 Centre for International Economics 1998.
Reducing fish losses due to epizootic ulcerative syndrome—an ex ante evaluation
FIS/1991/030
8 McKenney D.W. 1998. Australian tree species selection in China FST/1984/057 and FST/1988/048
9 ACIL Consulting 1998. Sulfur test KCL–40 and growth of the Australian canola industry
PN/1983/028 and PN/1988/004
10 AACM International 1998. Conservation tillage and controlled traffic LWR2/1992/009
11 Chudleigh P. 1998. Postharvest R&D concerning tropical fruits PHT/1983/056 and PHT/1988/044
12 Waterhouse D., Dillon B. and Vincent D. 1999.
Biological control of the banana skipper in Papua New Guinea
CS2/1988/002-C
13 Chudleigh P. 1999. Breeding and quality analysis of rapeseed CS1/1984/069 and CS1/1988/039
14 McLeod R., Isvilanonda S. and Wattanutchariya S. 1999.
Improved drying of high moisture grains PHT/1983/008, PHT/1986/008 and PHT/1990/008
15 Chudleigh P. 1999. Use and management of grain protectants in China and Australia
PHT/1990/035
16 McLeod R. 2001. Control of footrot in small ruminants of Nepal AS2/1991/017 and AS2/1996/021
17 Tisdell C. and Wilson C. 2001. Breeding and feeding pigs in Australia and Vietnam AS2/1994/023
18 Vincent D. and Quirke D. 2002. Controlling Phalaris minor in the Indian rice–wheat belt
CS1/1996/013
19 Pearce D. 2002. Measuring the poverty impact of ACIAR projects— a broad framework
20 Warner R. and Bauer M. 2002. Mama Lus Frut scheme: an assessment of poverty reduction
ASEM/1999/084
21 McLeod R. 2003. Improved methods in diagnosis, epidemiology, and information management of foot-and-mouth disease in Southeast Asia
AS1/1983/067, AS1/1988/035, AS1/1992/004 and AS1/1994/038
22 Bauer M., Pearce D. and Vincent D. 2003.
Saving a staple crop: impact of biological control of the banana skipper on poverty reduction in Papua New Guinea
CS2/1988/002-C
23 McLeod R. 2003. Improved methods for the diagnosis and control of bluetongue in small ruminants in Asia and the epidemiology and control of bovine ephemeral fever in China
AS1/1984/055, AS2/1990/011 and AS2/1993/001
24 Palis F.G., Sumalde Z.M. and Hossain M. 2004.
Assessment of the rodent control projects in Vietnam funded by ACIAR and AUSAID: adoption and impact
AS1/1998/036
IMPACT ASSESSMENT SERIES

No. Author(s) and year of publication Title ACIAR project numbers
25 Brennan J.P. and Quade K.J. 2004. Genetics of and breeding for rust resistance in wheat in India and Pakistan
CS1/1983/037 and CS1/1988/014
26 Mullen J.D. 2004. Impact assessment of ACIAR-funded projects on grain-market reform in China
ADP/1997/021 and ANRE1/1992/028
27 van Bueren M. 2004. Acacia hybrids in Vietnam FST/1986/030
28 Harris D. 2004. Water and nitrogen management in wheat–maize production on the North China Plain
LWR1/1996/164
29 Lindner R. 2004. Impact assessment of research on the biology and management of coconut crabs on Vanuatu
FIS/1983/081
30 van Bueren M. 2004. Eucalypt tree improvement in China FST/1984/057, FST/1987/036, FST/1988/048, FST/1990/044, FST/1994/025, FST/1996/125 and FST/1997/077
31 Pearce D. 2005. Review of ACIAR’s research on agricultural policy
32 Tingsong Jiang and Pearce D. 2005. Shelf-life extension of leafy vegetables—evaluating the impacts
PHT/1994/016
33 Vere D. 2005. Research into conservation tillage for dryland cropping in Australia and China
LWR2/1992/009 and LWR2/1996/143
34 Pearce D. 2005. Identifying the sex pheromone of the sugarcane borer moth
CS2/1991/680
35 Raitzer D.A. and Lindner R. 2005. Review of the returns to ACIAR’s bilateral R&D investments
36 Lindner R. 2005. Impacts of mud crab hatchery technology in Vietnam FIS/1992/017 and FIS/1999/076
37 McLeod R. 2005. Management of fruit flies in the Pacific CS2/1989/020, CS2/1994/003, CS2/1994/115 and CS2/1996/225
38 ACIAR 2006. Future directions for ACIAR’s animal health research
39 Pearce D., Monck M., Chadwick K. and Corbishley J. 2006.
Benefits to Australia from ACIAR-funded research AS2/1990/028, AS2/1994/017, AS2/1994/018, AS2/1999/060, CS1/1990/012, CS1/1994/968, FST/1993/016 and PHT/1990/051
40 Corbishley J. and Pearce D. 2006. Zero tillage for weed control in India: the contribution to poverty alleviation
CS1/1996/013
41 ACIAR 2006. ACIAR and public funding of R&D. Submission to Productivity Commission study on public support for science and innovation
42 Pearce D. and Monck M. 2006. Benefits to Australia of selected CABI products
43 Harris D.N. 2006. Water management in public irrigation schemes in Vietnam
LWR1/1998/034 and LWR2/1994/004
44 Gordon J. and Chadwick K. 2007. Impact assessment of capacity building and training: assessment framework and two case studies
CS1/1982/001, CS1/1985/067, LWR2/1994/004 and LWR2/1998/034
45 Turnbull J.W. 2007. Development of sustainable forestry plantations in China: a review
46 Monck M. and Pearce D. 2007. Mite pests of honey bees in the Asia–Pacific region AS2/1990/028, AS2/1994/017, AS2/1994/018 and AS2/1999/060
IMPACT ASSESSMENT SERIES <continued>

IMPACT ASSESSMENT SERIES <continued>
No. Author(s) and year of publication Title ACIAR project numbers
47 Fisher H. and Gordon J. 2007. Improved Australian tree species for Vietnam FST/1993/118 and FST/1998/096
48 Longmore C., Gordon J. and Bantilan M.C. 2007.
Assessment of capacity building: overcoming production constraints to sorghum in rainfed environments in India and Australia
CS1/1994/968
49 Fisher H. and Gordon J. 2007. Minimising impacts of fungal disease of eucalypts in South-East Asia
FST/1994/041
50 Monck M. and Pearce D. 2007. Improved trade in mangoes from the Philippines, Thailand and Australia
CS1/1990/012 and PHT/1990/051
51 Corbishley J. and Pearce D. 2007. Growing trees on salt-affected land FST/1993/016
52 Fisher H. and Gordon J. 2008. Breeding and feeding pigs in Vietnam: assessment of capacity building and an update on impacts
AS2/1994/023
53 Monck M. and Pearce D. 2008. The impact of increasing efficiency and productivity of ruminants in India by the use of protected-nutrient technology
AH/1997/115
54 Monck M. and Pearce D. 2008. Impact of improved management of white grubs in peanut-cropping systems
CS2/1994/050
55 Martin G. 2008. ACIAR fisheries projects in Indonesia: review and impact assessment
FIS/1997/022, FIS/1997/125, FIS/2000/061, FIS/2001/079, FIS/2002/074, FIS/2002/076, FIS/2005/169 and FIS/2006/144
56 Lindner B. and McLeod P. 2008. A review and impact assessment of ACIAR’s fruit-fly research partnerships—1984 to 2007
CP/1997/079, CP/2001/027, CP/2002/086, CP/2007/002, CP/2007/187, CS2/1983/043, CS2/1989/019, CS2/1989/020, CS2/1994/003, CS2/1994/115, CS2/1996/225, CS2/1997/101, CS2/1998/005, CS2/2003/036, PHT/1990/051, PHT/1993/87 and PHT/1994/133
57 Montes N.D., Zapata Jr N.R., Alo A.M.P. and Mullen J.D. 2008.
Management of internal parasites in goats in the Philippines
AS1/1997/133
58 Davis J., Gordon J., Pearce D. and Templeton D. 2008.
Guidelines for assessing the impacts of ACIAR’s research activities
59 Chupungco A., Dumayas E. and Mullen J. 2008.
Two-stage grain drying in the Philippines PHT/1983/008, PHT/1986/008 and PHT/1990/008
60 Centre for International Economics 2009.
ACIAR Database for Impact Assessments (ADIA): an outline of the database structure and a guide to its operation
61 Fisher H. and Pearce D. 2009. Salinity reduction in tannery effluents in India and Australia
AS1/2001/005
62 Francisco S.R., Mangabat M.C., Mataia A.B., Acda M.A., Kagaoan C.V., Laguna J.P., Ramos M., Garabiag K.A., Paguia F.L. and Mullen J.D. 2009.
Integrated management of insect pests of stored grain in the Philippines
PHT/1983/009, PHT/1983/011, PHT/1986/009 and PHT/1990/009
63 Harding M., Tingsong Jiang and Pearce D. 2009.
Analysis of ACIAR’s returns on investment: appropriateness, efficiency and effectiveness
64 Mullen J.D. 2010. Reform of domestic grain markets in China: a reassessment of the contribution of ACIAR-funded economic policy research
ADP/1997/021 and ANRE1/1992/028

No. Author(s) and year of publication Title ACIAR project numbers
65 Martin G. 2010. ACIAR investment in research on forages in Indonesia AS2/2000/103, AS2/2000/124, AS2/2001/125, LPS/2004/005, SMAR/2006/061 and SMAR/2006/096
66 Harris D.N. 2010. Extending low-cost fish farming in Thailand: an ACIAR–World Vision collaborative program
PLIA/2000/165
67 Fisher H. 2010. The biology, socioeconomics and management of the barramundi fishery in Papua New Guinea’s Western Province
FIS/1998/024
68 McClintock A. and Griffith G. 2010.
Benefit–cost meta-analysis of investment in the International Agricultural Research Centres
69 Pearce D. 2010. Lessons learned from past ACIAR impact assessments, adoption studies and experience
70 Harris D.N. 2011. Extending low-chill fruit in northern Thailand: an ACIAR–World Vision collaborative project
PLIA/2000/165
71 Lindner R. 2011. The economic impact in Indonesia and Australia from ACIAR’s investment in plantation forestry research, 1987–2009
FST/1986/013, FST/1990/043, FST/1993/118, FST/1995/110, FST/1995/124, FST/1996/182, FST/1997/035, FST/1998/096, FST/2000/122, FST/2000/123, FST/2003/048 and FST/2004/058
72 Lindner R. 2011. Frameworks for assessing policy research and ACIAR’s investment in policy-oriented projects in Indonesia
ADP/1994/049, ADP/2000/100, ADP/2000/126, AGB/2000/072, AGB/2004/028, ANRE1/1990/038, ANRE1/1993/023, ANRE1/1993/705, EFS/1983/062 and EFS/1988/022
73 Fisher H. 2011. Forestry in Papua New Guinea: a review of ACIAR’s program
FST/1994/033, FST/1995/123, FST/1998/118, FST/2002/010, FST/2004/050, FST/2004/055, FST/2004/061, FST/2006/048, FST/2006/088, FST/2006/120, FST/2007/078 and FST/2009/012
74 Brennan J.P. and Malabayabas A. 2011.
International Rice Research Institute’s contribution to rice varietal yield improvement in South-East Asia
75 Harris D.N. 2011. Extending rice crop yield improvements in Lao PDR: an ACIAR–World Vision collaborative project
CIM/1999/048, CS1/1995/100 and PLIA/2000/165
76 Grewal B., Grunfeld H. and Sheehan P. 2011.
The contribution of agricultural growth to poverty reduction
IMPACT ASSESSMENT SERIES <continued>


The contribution of agricultural growth to poverty reduction
76