Embed Size (px)
Citation preview

ACI WEB SESSIONS
Field Measurements of Form Pressure Exerted by Self-Consolidating Concrete
ACI Spring 2013 ConventionApril 14 - 16, Minneapolis, MN
ACI WEB SESSIONS
ACI Member Ahmed F. Omran is a Research Professional in the Cement and Concrete Research Group, Department of Civil Engineering, Université de Sherbrooke (Canada) and Assistant Professor,
Menoufia University (Egypt). He holds BS and MS degrees in Civil Engineering from Menoufia University. He received Ph.D. degree from the Université de Sherbrooke in 2009. His research interests include formwork pressure, thixotropy and rheology of concrete, developing new materials for concrete replacement, and non-destructive tests for concrete.
3
Ahmed Omran, University of Sherbrooke, Canada
Kamal Khayat, Missouri University of Science & Technology
ACI Spring Convention
Minneapolis-Minnesota-USA
April 14th 2013
Effect of Material Constituents & Mix Design Parameters on Thixotropy and Form
Pressure for SCC
- Spring Convention 2013 Minneapolis
Factors influencing formwork pressure
• w/cm• Coarse agg. characteristics• S/A• Vp (paste volume)• Binder type and content• SCMs and fillers• Admixtures (HRWRA, VMA, Set-
modifying admixtures) • Unit weight
Mix design
• Casting rate, depth, method• Height of pouring• Waiting period between lifts• Vibration (magnitude, duration, ..etc)• Consolidation• Impact during placement• Concrete temperature
Placement conditions
• Minimum dimension, surface material, permeability and drainage of formwork
• Release agent• Density of reinforcement
Formwork characteristics
Consistency / Fluidity level
Thixotropy / structural build-up at rest& Formwork pressure
Concrete temperature
Initial maximum pressure
Rate of pressure drop after casting
4
- Spring Convention 2013 Minneapolis
Casting Rate
R ~ 1 m/hrLift height = 3.5 mThickness = 0.9 m Length x width = 9 x 4 m
5 - Spring Convention 2013 Minneapolis Introduction 6
Lift height > 3 mW = 0.15 mR ~ 8-10 m/hr
6

- Spring Convention 2013 Minneapolis
Rehabilitation of retaining walls
R ~ 6-10 m/hrRepair panels
Height, up to 7 m
Length = 7 m
Width = 0.19 m
7 - Spring Convention 2013 Minneapolis
Validation of Role of Thixotropy on Form Pressure
Sand/CA = 0.44, 0.5, 0.54HRWRA: PCP vs. PNSCement: Tenary vs. BinaryEffect of synthetic fibers
8
- Spring Convention 2013 Minneapolis
Typical Formwork Pressure Diagram
0
1
2
3
4
5
6
0 20 40 60 80 100 120
Pressure developed on formwork (kPa)
Hea
d of
con
cret
e (m
)
Slump flow = 720 mm S/CA = 0.50Ternary cement = 475 kg/m³ w/cm = 0.40
R = 6.5 m/h right after casting
1 h3 h
P(max)
9 - Spring Convention 2013 Minneapolis
Pressure Variations with ThixotropyAb1 = 260 to 405 J/m³.s
Time after casting (min)
P(m
axim
um) /
P(h
ydro
stat
ic)
0.0
0.2
0.4
0.6
0 200 400 600 800 1000 1200
BIN-0.50-Nap (Ab1 = 260 J/m³.s)
TER-0.50-Nap (310 J/m³.s)
TER-0.44-Nap(405 J/m³.s)
S / A
HRWRA: PNS
R = 6.0 m/hr
R = 6.5 m/hr
R = 7.5 m/hr
10
- Spring Convention 2013 Minneapolis
Variations in Pressure until Cancellation
Slump flow = 725 mm Ternary cement = 475 kg/m³ w/cm = 0.40
0
20
40
60
80
0 400 800 1200 1600
Time after casting (min)
Dev
elop
ped
pres
sure
(kPa
)
2 nd sensor
3 rd sensor
6 th sensor
Top sensor
12
14
16
18
20
22
24
26
Con
cret
e te
mpe
ratu
re (°
C)
(Physical + Chemical) effect
Chemical effect
11 - Spring Convention 2013 Minneapolis
Pressure Decay Comparison
0.0
0.2
0.4
0.6
0.8
1.0
0 200 400 600 800 1000 1200 1400Time after casting (min)
P(m
axim
um) /
P(h
ydro
stat
ic)
In-situ
1.1-m PVC PNS No fibers
12
- Spring Convention 2013 Minneapolis
Thixotropy as Input to Evaluate Form Pressure for SCC
• ρ: unit weight of SCC• H: casting depth in the form• R: casting rate• T: concrete temperature• Dmin: formwork width
• TI: thixotropy index
Pmax = ρgH [a1H + a2R + a3T + a4Dmin + a5TI@fixed Temp.]
13 - Spring Convention 2013 Minneapolis
Effect of casting rate & thixotropy on lateral pressure characteristics
SCC lateral pressure can be reduced by:
lowering casting speed, orincreasing thixotropy
0
20
40
60
80
100
0 10 20 30
K0
(%)
Casting rate (m/hr)
SCC40SCC51SCC52SCC53SCC54SCC46SCC55SCC56
H = 3 m
(Low thixotropy)
(High thixotropy)
14
- Spring Convention 2013 Minneapolis
Thixotropy
is a decrease in time of viscosity under constant shear stress or shear rate, followed by a gradual recovery when the stress or shear rate is removed (Barnes, 1997). a reversible phenomenon
Agitated state Turned after rest
0
40
80
120
160
0 200 400 600 800 1000 1200
Time (s)
= fixed
= 0.03 s-1sample at rest
Shea
r str
ess
(Pa)
Structural build-up(flocculation, coagulation)
15 - Spring Convention 2013 Minneapolis
Testing Protocol of Thixotropy : breakdown curves
1
Shea
rstr
ess
(Pa)
0
200
400
600
800
0 5 10 15 20 25Time (sec)
0
200
400
600
800
0.2 0.4 0.6 0.8Rotational speed (rps)
N = 0.3 rpsN = 0.9 rpsN = 0.5 rps
N = 0.7 rps
τ τ0.9
31 i e
0.3
Lapas in et a l. [1983] Ab = ︵N ︶- ︵N ︶dN J/m .s
16
- Spring Convention 2013 Minneapolis
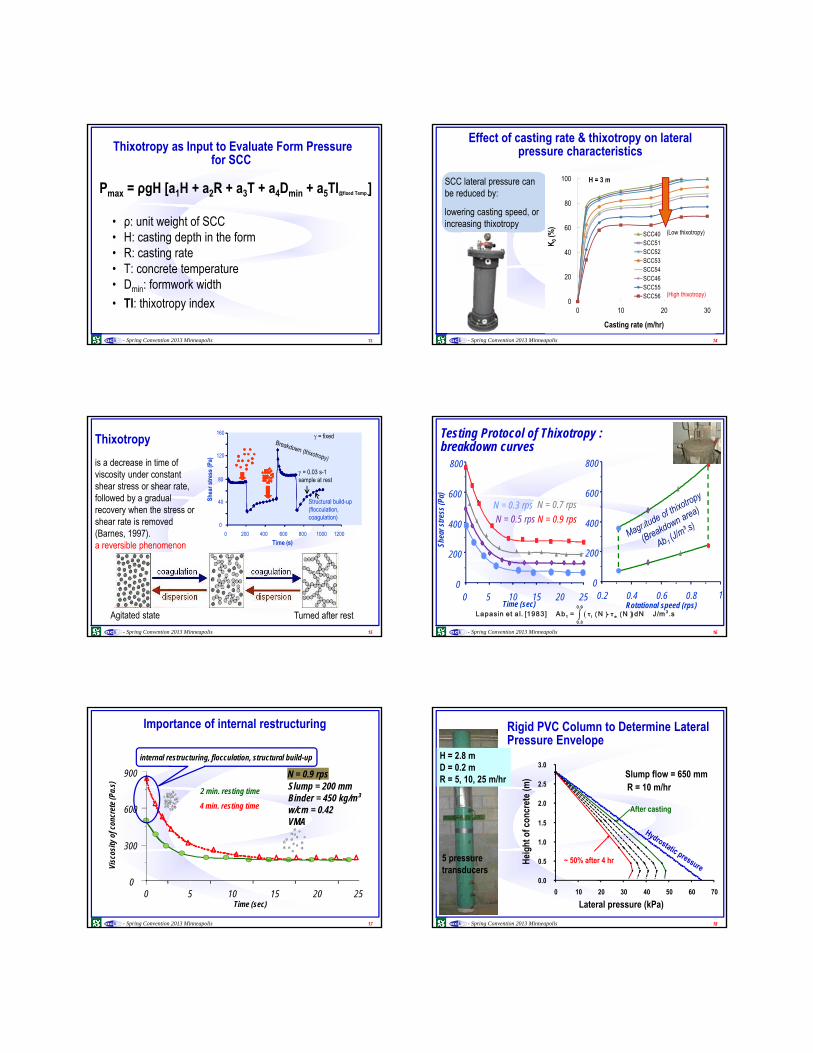
4 min. resting time
Importance of internal restructuring
0
300
600
900
0 5 10 15 20 25Time (sec)
Visc
osity
of c
oncr
ete
(Pa.
s)
2 min. resting time
N = 0.9 rps
internal restructuring, flocculation, structural build-up
Slump = 200 mmBinder = 450 kg/m³w/cm = 0.42 VMA
17 - Spring Convention 2013 Minneapolis
5 pressure transducers
H = 2.8 mD = 0.2 mR = 5, 10, 25 m/hr
Rigid PVC Column to Determine LateralPressure Envelope
0.0
0.5
1.0
1.5
2.0
2.5
3.0
0 10 20 30 40 50 60 70
Lateral pressure (kPa)
Hei
ght o
f con
cret
e (m
)
After casting
~ 50% after 4 hr
R = 10 m/hrSlump flow = 650 mm
18
- Spring Convention 2013 Minneapolis
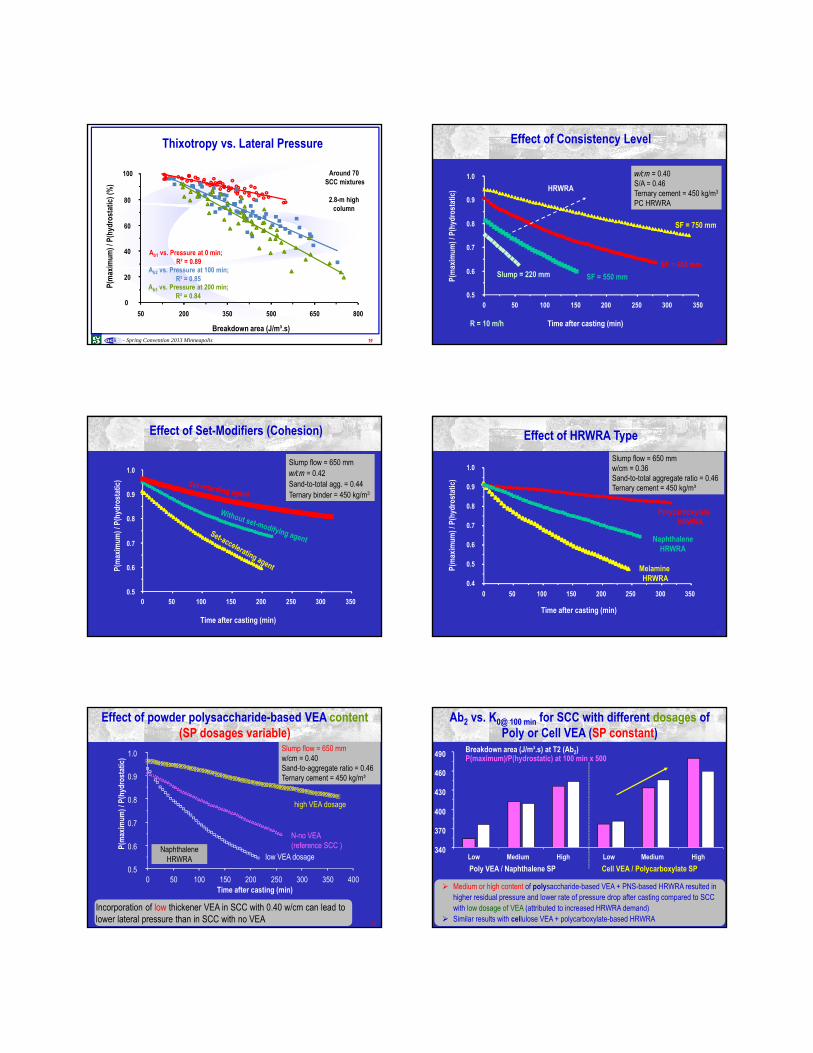
Thixotropy vs. Lateral Pressure
0
20
40
60
80
100
50 200 350 500 650 800
Breakdown area (J/m³.s)
P(m
axim
um) /
P(h
ydro
stat
ic) (
%)
Ab1 vs. Pressure at 0 min; R² = 0.89
Ab2 vs. Pressure at 100 min; R² = 0.85
Ab3 vs. Pressure at 200 min; R² = 0.84
Around 70 SCC mixtures
2.8-m high column
19
Effect of Consistency Level
0.5
0.6
0.7
0.8
0.9
1.0
0 50 100 150 200 250 300 350
Time after casting (min)
P(m
axim
um) /
P(h
ydro
stat
ic)
SF = 750 mm
SF = 650 mm
SF = 550 mmSlump = 220 mm
HRWRA
w/cm = 0.40 S/A = 0.46 Ternary cement = 450 kg/m3
PC HRWRA
R = 10 m/h
20
Effect of Set-Modifiers (Cohesion)
0.5
0.6
0.7
0.8
0.9
1.0
0 50 100 150 200 250 300 350
Time after casting (min)
P(m
axim
um) /
P(h
ydro
stat
ic)
Slump flow = 650 mm w/cm = 0.42 Sand-to-total agg. = 0.44Ternary binder = 450 kg/m3
Effect of HRWRA Type
0.4
0.5
0.6
0.7
0.8
0.9
1.0
0 50 100 150 200 250 300 350
Time after casting (min)
P(m
axim
um) /
P(h
ydro
stat
ic)
Melamine HRWRA
NaphthaleneHRWRA
PolycarboxylateHRWRA
Slump flow = 650 mmw/cm = 0.36 Sand-to-total aggregate ratio = 0.46 Ternary cement = 450 kg/m³
22
Effect of powder polysaccharide-based VEA content(SP dosages variable)
0.5
0.6
0.7
0.8
0.9
1.0
0 50 100 150 200 250 300 350 400Time after casting (min)
P(m
axim
um) /
P(h
ydro
stat
ic)
N-no VEA (reference SCC )
high VEA dosage
low VEA dosage
Slump flow = 650 mmw/cm = 0.40Sand-to-aggregate ratio = 0.46 Ternary cement = 450 kg/m³
NaphthaleneHRWRA
23
Incorporation of low thickener VEA in SCC with 0.40 w/cm can lead to lower lateral pressure than in SCC with no VEA
Ab2 vs. K0@ 100 min for SCC with different dosages of Poly or Cell VEA (SP constant)
340
370
400
430
460
Low Medium High Low Medium High
Breakdown area (J/m³.s) at T2 (Ab2)P(maximum)/P(hydrostatic) at 100 min x 500
Poly VEA / Naphthalene SP Cell VEA / Polycarboxylate SP
490
24
Medium or high content of polysaccharide-based VEA + PNS-based HRWRA resulted in higher residual pressure and lower rate of pressure drop after casting compared to SCC with low dosage of VEA (attributed to increased HRWRA demand)
Similar results with cellulose VEA + polycarboxylate-based HRWRA

Effect of Thickner Type (low concentration)
0.4
0.5
0.6
0.7
0.8
0.9
1.0
0 50 100 150 200 250 300
Time after casting (min)
P(m
axim
um) /
P(h
ydro
stat
ic)
C-Cell-L
N-Poly-L
N-Pow-LM-PC-L
Slump flow = 650 mmw/cm = 0.40Sand-to-total aggregate ratio = 0.46 Ternary cement = 450 kg/m³
25
Mixtures incorporating TEA exhibited the lowest initial pressure and the fastest rate of pressure drop
Unlike conventional VEA, increase in TEA lead to further reduction in initial pressure and increased rate of drop in pressure - Spring Convention 2013 Minneapolis
Effect of concrete temperature on lateral pressure characteristics
30%
40%
50%
60%
70%
80%
90%
100%
5 15 25 35
K0
Concrete temp., T (ºC)
R = 5 m/hr
H = 3 m
H = 7 m
SCC
38
CC35
12 ºC
22 ºC
30 ºC
0
1
2
3
4
5
6
7
0 50 100 150 200
Cas
ting
dept
h (m
)
Lateral pressure (kPa)
R = 5 m/hr
SCC38
CC35@22 ºC
Hydrostatic pressure
26
Effect of Binder Type
0.5
0.6
0.7
0.8
0.9
1.0
0 50 100 150 200 250 300 350
Time after casting (min)
P(m
axim
um) /
P(h
ydro
stat
ic)
6% SF + 22% FA
8% SF
Type I cement
Type III cement
Binder content = 450 kg/m³
Slump flow = 650 mm w/cm = 0.40S/A = 0.46
27
500 kg/m³
450 kg/m³
550 kg/m³
Effect of Binder Content
0.40
0.5
0.6
0.7
0.8
0.9
1.0
50 100 150 200 250 300 350
Time after casting (min)
P(m
axim
um) /
P(h
ydro
stat
ic)
400 kg/m³
Slump flow = 650 mmw/cm = 0.40Sand-to-total agg. = 0.46Ternary cement
28
Effect of w/cm
0.5
0.6
0.7
0.8
0.9
1.0
0 50 100 150 200 250 300 350
Time after casting (min)
P(m
axim
um) /
P(h
ydro
stat
ic)
w/cm = 0.36
Slump flow = 650 mm Sand-to-total aggregate ratio = 0.46 Polycarboxylate-based HRWRATernary cement = 450 kg/m³
w/cm = 0.46
w/cm = 0.40Higher HRWRA dosage
29
Effect of S/A (Internal Friction)
0.5
0.6
0.7
0.8
0.9
1.0
0 100 200 300 400
Time after casting (min)
P(m
axim
um) /
P(h
ydro
stat
ic)
Slump flow = 650 mmw/cm = 0.40Ternary cement = 450 kg/m³
R = 1.0(mortar)
R = 0.75
R = 0.50
R = 0.40
R = 0.36R = 0.30
R : sand-to-total agg. ratio
30
- Spring Convention 2013 Minneapolis
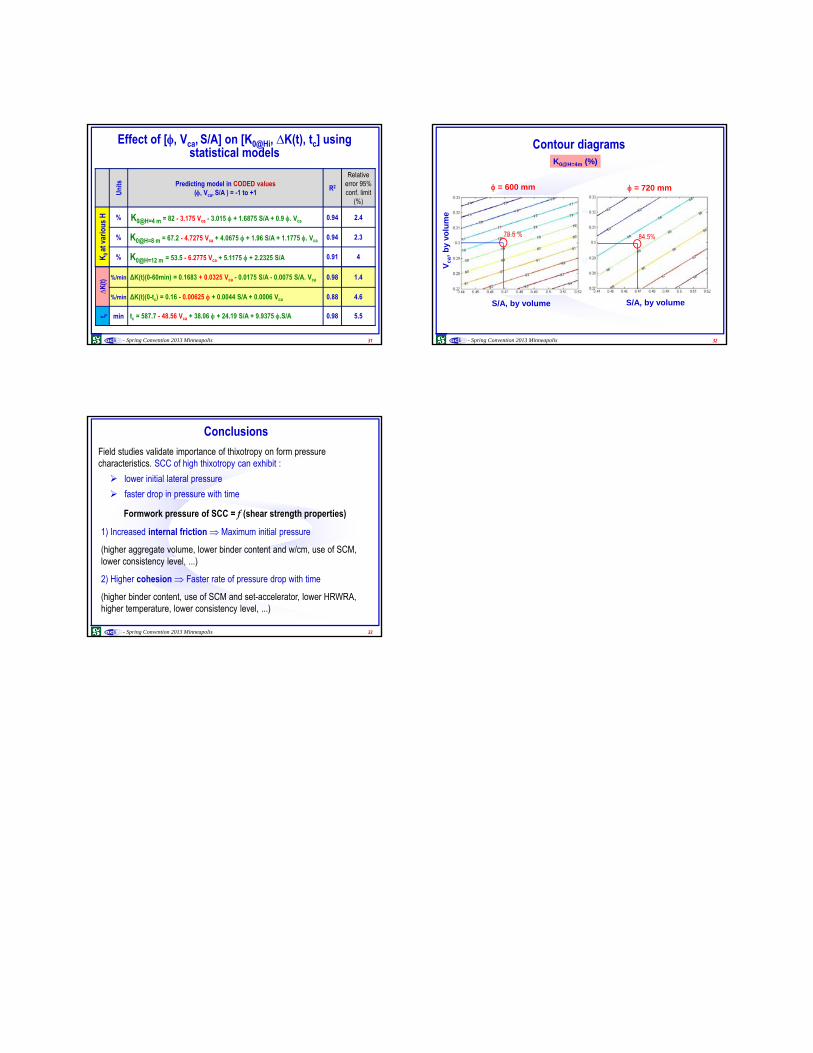
Effect of [, Vca, S/A] on [K0@Hi, ∆K(t), tc] using statistical models
Uni
ts Predicting model in CODED values(, Vca, S/A ) = -1 to +1
R2
Relative error 95% conf. limit
(%)
K0
at v
ario
us H % K0@H=4 m = 82 - 3.175 Vca - 3.015 + 1.6875 S/A + 0.9 . Vca 0.94 2.4
% K0@H=8 m = 67.2 - 4.7275 Vca + 4.0675 + 1.96 S/A + 1.1775 . Vca 0.94 2.3
% K0@H=12 m = 53.5 - 6.2775 Vca + 5.1175 + 2.2325 S/A 0.91 4
∆K
(t)
%/min ΔK(t)(0-60min) = 0.1683 + 0.0325 Vca - 0.0175 S/A - 0.0075 S/A. Vca 0.98 1.4
%/min ΔK(t)(0-tc) = 0.16 - 0.00625 + 0.0044 S/A + 0.0006 Vca 0.88 4.6
t c min tc = 587.7 - 48.56 Vca + 38.06 + 24.19 S/A + 9.9375 .S/A 0.98 5.5
31 - Spring Convention 2013 Minneapolis
Contour diagrams
= 600 mm = 720 mm
S/A, by volume S/A, by volume
Vc
a, b
y vo
lum
e
32
78.5 % 84.5%
K0@H=4m (%)
- Spring Convention 2013 Minneapolis
Conclusions
Field studies validate importance of thixotropy on form pressure characteristics. SCC of high thixotropy can exhibit :
lower initial lateral pressure
faster drop in pressure with time
33
Formwork pressure of SCC = f (shear strength properties)
1) Increased internal friction Maximum initial pressure
(higher aggregate volume, lower binder content and w/cm, use of SCM, lower consistency level, ...)
2) Higher cohesion Faster rate of pressure drop with time
(higher binder content, use of SCM and set-accelerator, lower HRWRA, higher temperature, lower consistency level, ...)