Embed Size (px)
Citation preview
Achieving the SDGs for children in Indonesia: Emerging findings for reaching the targets
© Indonesia Ministry of National Development Planning (BAPPENAS) and the United Nations Children’s Fund (UNICEF)
July 2019
This document may be freely reviewed, abstracted, reproduced and translated, in part or in whole, but is neither for sale nor for use in conjunction with commercial purposes.
Suggested citation: Indonesia Ministry of National Development Planning and the United Nations Children’s Fund (2019). Achieving the SDGs for children in Indonesia: Emerging findings on trajectories for reaching the targets. Jakarta: BAPPENAS and UNICEF
Photographs: © UNICEF Indonesia
Design and layout: Handmade Communications
C O N T E N T S
Achieving the SDGs for children in Indonesia: Emerging findings
for reaching the targets
ACRONYMS 02
INTRODUCTION 03
METHODOLOGY 04
GOAL 1: CHILD POVERTY 05
GOAL 2: CHILD MALNUTRITION 08
GOAL 3: CHILD SURVIVAL 11
GOAL 4: QUALITY EDUCATION 14
GOAL 5: CHILD MARRIAGE 18
GOAL 16: BIRTH REGISTRATION 21
CONCLUSION 24
02
ACHIEVING THE SDGS FOR CHILDREN IN INDONESIA
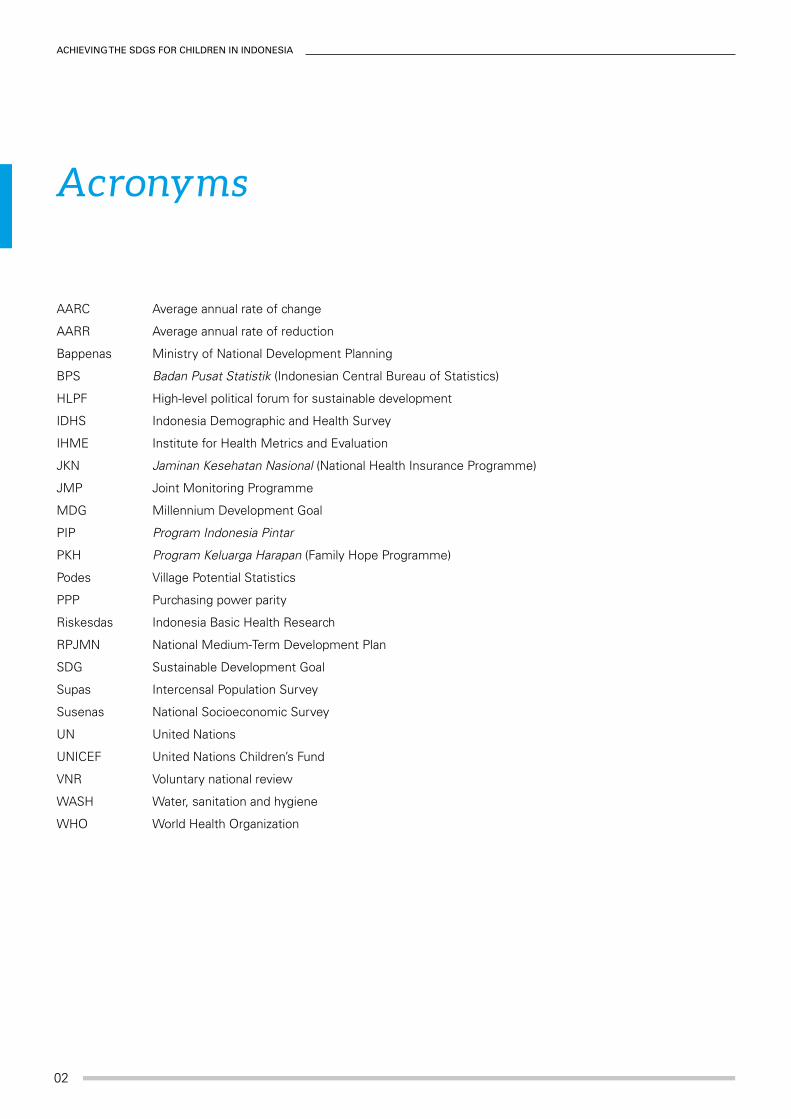
AARC Average annual rate of change
AARR Average annual rate of reduction
Bappenas Ministry of National Development Planning
BPS Badan Pusat Statistik (Indonesian Central Bureau of Statistics)
HLPF High-level political forum for sustainable development
IDHS Indonesia Demographic and Health Survey
IHME Institute for Health Metrics and Evaluation
JKN Jaminan Kesehatan Nasional (National Health Insurance Programme)
JMP Joint Monitoring Programme
MDG Millennium Development Goal
PIP Program Indonesia Pintar
PKH Program Keluarga Harapan (Family Hope Programme)
Podes Village Potential Statistics
PPP Purchasing power parity
Riskesdas Indonesia Basic Health Research
RPJMN National Medium-Term Development Plan
SDG Sustainable Development Goal
Supas Intercensal Population Survey
Susenas National Socioeconomic Survey
UN United Nations
UNICEF United Nations Children’s Fund
VNR Voluntary national review
WASH Water, sanitation and hygiene
WHO World Health Organization
Acronyms

IntroductIon
03
Introduction
Indonesia is strongly committed to achieving the Sustainable Development Goals (SDGs). Globally, the country played an active leadership role in the negotiations for the Post-2015 Development Agenda, which led to the formulation of the SDGs. It has also presented two voluntary national reviews (VNRs) at the high-level political forum for sustainable development (HLPF) in 2017 and 2019. Domestically, the country has made great efforts to put in place institutional mechanisms for coordination and multi-stakeholder collaboration. The Presidential Decree No. 59/2017 formalised the national SDG governance structure and mechanisms for planning and budgeting, financing, monitoring and reporting. The Ministry of National Development Planning fulfils a strong coordination function, supported by a dedicated SDG Secretariat, and it has fully integrated the SDG targets into the country’s medium-term development plan. The decree also acknowledges the critical role of sub-national authorities as well as non-state actors in achieving the SDGs.
Indonesia has recognised the critical role of data and evidence to inform policies and programmes to accelerate progress towards the SDG targets, and to monitor their implementation. The country’s national statistics agency (Badan Pusat Statistic or BPS) has invested heavily in efforts to align the production of national data with the global indicator framework for the SDGs. For example, amendments were made to the questionnaires of the National Socioeconomic Survey (Susenas), one of the largest annual household surveys in the world that collects comprehensive information from a sample of 295,000 households, including 390,000 children under 18. The Government of Indonesia has also collaborated with UNICEF to fill specific knowledge gaps, with new studies on critical issues such as the prevalence of child marriage, the measurement of multidimensional child poverty, and the quality of drinking water. Moreover, the country developed the first national SDG baseline report on
children and 34 provincial briefs to support planning and reporting at the subnational level.
The next decade constitutes a critical period in achieving Indonesia’s ambition to transform into one of the world’s largest economies and a peaceful and secure nation that is equitable and offers a good quality of life to all of its citizens, while using its natural resources sustainably. The country is dealing with an unfinished agenda of the Millennium Development Goals to reduce child malnutrition and increase access to improved water and sanitation services, amongst other priorities. At the same time, new and emerging factors are influencing and shaping long-term trends. Examples include: the influence of new technologies on society and the economy, the rising incidence of non-communicable diseases, air and water pollution, and the growing threat of climate change. Indonesia’s performance can also tip the scales of the world’s global achievement of the SDGs. It is, after all, the world’s fourth most populous country, home to 265 million people including nearly 85 million children under 18.
The Government of Indonesia and UNICEF are therefore collaborating on research to better understand key factors that are influencing child outcomes and the likelihood of making satisfactory progress towards the SDGs under different scenarios. This summary note highlights emerging findings from that research. It focuses on a subset of the SDG targets and indicators, related to child poverty, malnutrition, mortality, education, child marriage and birth registration. The indicators selected reflect priority areas for children in the country as well as data availability. A forthcoming research report will discuss a broader range of outcomes and results from sensitivity analysis using alternative scenarios and assumptions. Moreover, work is ongoing to investigate the interlinkages between different goals and how progress in one area could influence progress in another.
04
ACHIEVING THE SDGS FOR CHILDREN IN INDONESIA
National targets are used to gauge progress on the SDG indicators. The targets for 2024 and 2030 were taken from the technocratic draft of the Medium-Term Development Plan (RPJMN) for 2020-2024 and the National SDG Roadmap, as at the end of June 2019. The target values may be subject to further revisions.
To examine past progress and trends in SDG indicators, time series were constructed using data from a wide range of sources, including: Indonesia’s Demographic and Health Surveys (IDHS), Basic Health Research (Riskesdas), Family Life Survey (IFLS), Village Potential Statistics (Podes), and Intercensal Population Surveys (Supas). Secondary analysis was conducted of the annual National Socioeconomic Surveys (Susenas) from 2007 to 2018 to construct comparable data, disaggregated by demographic and socioeconomic stratifiers.
A dynamic microsimulation model was developed that can forecast trends in SDG indicators up to 2030, building on assumptions related to Indonesia’s macroeconomic and labour market conditions and demographic processes. The model can be used to examine how patterns of economic growth across different sectors may influence social outcomes and the trajectory of future trends among subgroups of the population, including children and adults, people living in urban and rural areas, and those from the poorest and wealthiest households.
The dynamic model is a discreet, closed population model simulating demographic processes (births, deaths, marriages and household formation); education outcomes (school attendance and completion); labour force participation; sector of employment; and housing conditions. The model relies upon transition probabilities with discrete state space, applied using Monte Carlo simulation. Microlevel data from the Susenas 2017 was used as the basis for the model.
Projections of key aggregate indicators such as overall population size were aligned with those from the Government of Indonesia. The household consumption simulation model links projected macroeconomic trends with micro data and serves to align the forecasted population welfare with the projected macroeconomic conditions.
Two macroeconomic projection scenarios are used. The baseline macroeconomic scenario is equivalent to the ‘business-as-usual’ scenario developed by Bappenas for the RPJMN 2020–2024, supplemented by longer-term projections developed by the Economist Intelligence Unit (EIU) for 2025–2030. It assumes, for instance, that real GDP will grow at an annual rate of 4.9 per cent until 2024 and that labour productivity will be in line with historical trends but accelerate over time. The optimistic macroeconomic scenario is equivalent to the RPJMN medium variant scenario, with real GDP growth between 5.4 and 6.1 per cent until 2024, and stable growth of 6.1 per cent from 2025 onwards with rapid acceleration of sector labour productivity growth rates.
The results from the dynamic microsimulation model are complemented by trend analysis of SDG indicators. The strength of trends and progress needed to achieve national targets is measured with the average annual rate of change or the annual average rate of reduction, calculated using a log-linear regression. In sum, the formula for its calculation is given by AARR= 1 – exp(β), where β is the slope of the natural logarithm of the prevalence regressed on the survey year.
Further technical details will be available in the forthcoming research report.
Methodolog y
Goal 1: chIld poverty
05
• Indonesia has made solid progress in reducing poverty and improving living standards.
• economic growth has not benefitted everyone equally and geographic disparities remain large.
• past gains in reducing child poverty could be reversed if macroeconomic conditions worsen.
• Investing in social protection is critical to achieve more inclusive growth in the future.
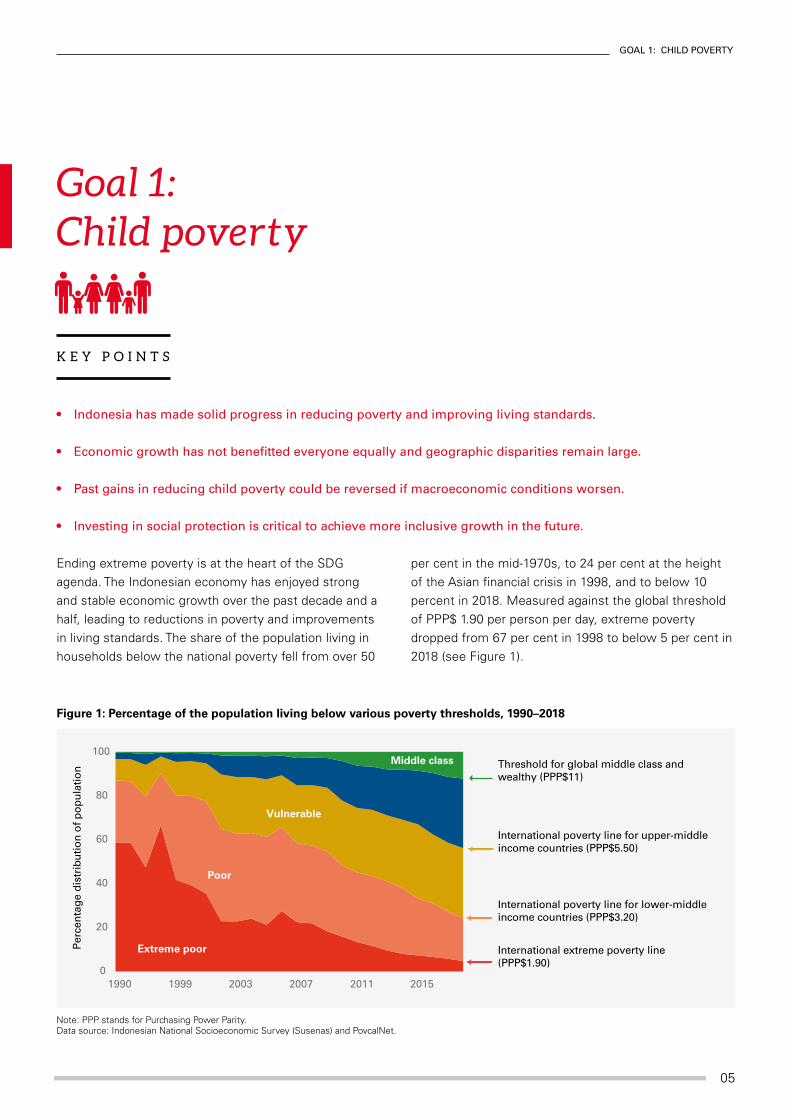
Ending extreme poverty is at the heart of the SDG agenda. The Indonesian economy has enjoyed strong and stable economic growth over the past decade and a half, leading to reductions in poverty and improvements in living standards. The share of the population living in households below the national poverty fell from over 50
per cent in the mid-1970s, to 24 per cent at the height of the Asian financial crisis in 1998, and to below 10 percent in 2018. Measured against the global threshold of PPP$ 1.90 per person per day, extreme poverty dropped from 67 per cent in 1998 to below 5 per cent in 2018 (see Figure 1).
Goal 1: Child poverty
K E Y P O I N T S
0
20
40
60
80
100
1990 1999 2003 2007 2011 2015
Per
cen
tag
e d
istr
ibu
tion
of p
op
ula
tion
Extreme poor
Poor
Vulnerable
Middle class Threshold for global middle class and wealthy (PPP$11)
International poverty line for upper-middle income countries (PPP$5.50)
International poverty line for lower-middle income countries (PPP$3.20)
International extreme poverty line (PPP$1.90)
Figure 1: Percentage of the population living below various poverty thresholds, 1990–2018
Note: PPP stands for Purchasing Power Parity.Data source: Indonesian National Socioeconomic Survey (Susenas) and PovcalNet.
06
ACHIEVING THE SDGS FOR CHILDREN IN INDONESIA
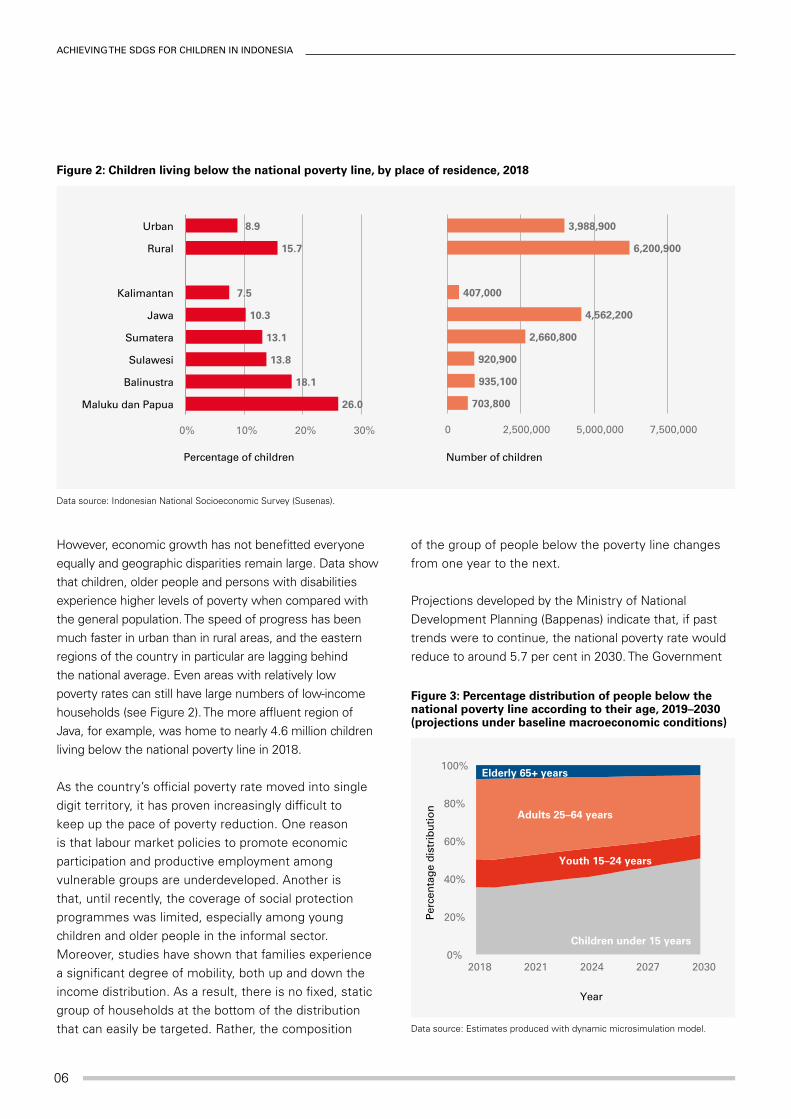
However, economic growth has not benefitted everyone equally and geographic disparities remain large. Data show that children, older people and persons with disabilities experience higher levels of poverty when compared with the general population. The speed of progress has been much faster in urban than in rural areas, and the eastern regions of the country in particular are lagging behind the national average. Even areas with relatively low poverty rates can still have large numbers of low-income households (see Figure 2). The more affluent region of Java, for example, was home to nearly 4.6 million children living below the national poverty line in 2018.
As the country’s official poverty rate moved into single digit territory, it has proven increasingly difficult to keep up the pace of poverty reduction. One reason is that labour market policies to promote economic participation and productive employment among vulnerable groups are underdeveloped. Another is that, until recently, the coverage of social protection programmes was limited, especially among young children and older people in the informal sector. Moreover, studies have shown that families experience a significant degree of mobility, both up and down the income distribution. As a result, there is no fixed, static group of households at the bottom of the distribution that can easily be targeted. Rather, the composition
of the group of people below the poverty line changes from one year to the next.
Projections developed by the Ministry of National Development Planning (Bappenas) indicate that, if past trends were to continue, the national poverty rate would reduce to around 5.7 per cent in 2030. The Government
26.0
18.1
13.8
13.1
10.3
7.5
15.7
8.9
0% 10% 20% 30%
Maluku dan Papua
Balinustra
Sulawesi
Sumatera
Jawa
Kalimantan
Rural
Urban
Percentage of children
703,800
935,100
920,900
2,660,800
4,562,200
407,000
6,200,900
3,988,900
0 2,500,000 5,000,000 7,500,000
Number of children
Figure 2: Children living below the national poverty line, by place of residence, 2018
Data source: Estimates produced with dynamic microsimulation model.
0%
20%
40%
60%
80%
100%
2018 2021 2024 2027 2030
Per
cen
tag
e d
istr
ibu
tion
Year
Children under 15 years
Youth 15–24 years
Adults 25–64 years
Elderly 65+ years
Figure 3: Percentage distribution of people below the national poverty line according to their age, 2019–2030 (projections under baseline macroeconomic conditions)
Data source: Indonesian National Socioeconomic Survey (Susenas).
Goal 1: chIld poverty
07
intends to accelerate progress, though, and has set a national target of between 4.0 and 4.5 per cent.
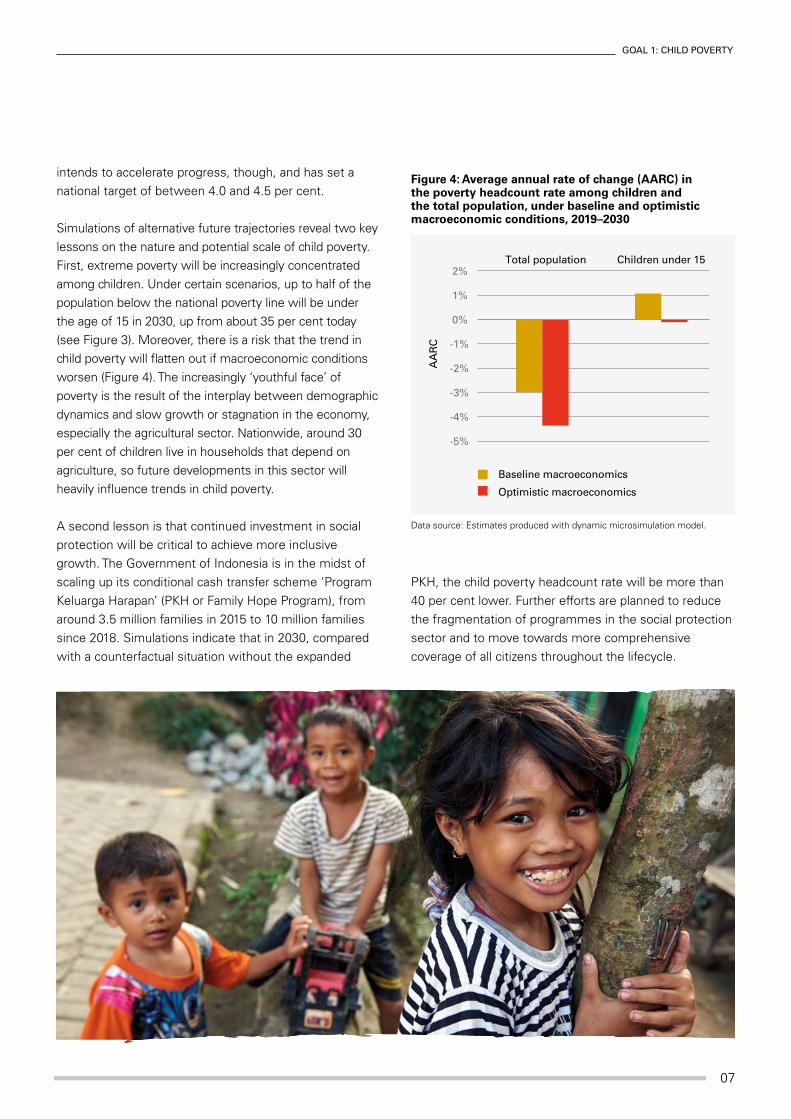
Simulations of alternative future trajectories reveal two key lessons on the nature and potential scale of child poverty. First, extreme poverty will be increasingly concentrated among children. Under certain scenarios, up to half of the population below the national poverty line will be under the age of 15 in 2030, up from about 35 per cent today (see Figure 3). Moreover, there is a risk that the trend in child poverty will flatten out if macroeconomic conditions worsen (Figure 4). The increasingly ‘youthful face’ of poverty is the result of the interplay between demographic dynamics and slow growth or stagnation in the economy, especially the agricultural sector. Nationwide, around 30 per cent of children live in households that depend on agriculture, so future developments in this sector will heavily influence trends in child poverty.
A second lesson is that continued investment in social protection will be critical to achieve more inclusive growth. The Government of Indonesia is in the midst of scaling up its conditional cash transfer scheme ‘Program Keluarga Harapan’ (PKH or Family Hope Program), from around 3.5 million families in 2015 to 10 million families since 2018. Simulations indicate that in 2030, compared with a counterfactual situation without the expanded
PKH, the child poverty headcount rate will be more than 40 per cent lower. Further efforts are planned to reduce the fragmentation of programmes in the social protection sector and to move towards more comprehensive coverage of all citizens throughout the lifecycle.
-5%
-4%
-3%
-2%
-1%
0%
1%
2%Total population Children under 15
AA
RC
Baseline macroeconomics
Optimistic macroeconomics
Figure 4: Average annual rate of change (AARC) in the poverty headcount rate among children and the total population, under baseline and optimistic macroeconomic conditions, 2019–2030
Data source: Estimates produced with dynamic microsimulation model.

08
ACHIEVING THE SDGS FOR CHILDREN IN INDONESIA
• the Government of Indonesia has made strong commitments to address the high levels of child stunting throughout the country.
• compared with the rate of progress achieved during the last five years, the speed of change needs to accelerate 2.5 times to achieve the national 2030 target for stunting.
• While undernutrition is a key priority, policies should not neglect the emerging rise of childhood overweight.
Child malnutrition is a longstanding and persistent problem in Indonesia (see Figures 5 to 7). Stunting, a form of chronic malnutrition, affected 7.3 million children under the age of five in 2018. The share of children who were too short for their age was 31 per cent, down from 37 per cent a decade earlier. This is just above the average rate of stunting across all middle-income countries in East and South Asia. The prevalence of wasting or acute malnutrition is classified as high, too: over 10 per cent of children under 5 were too thin for their height because of acute food shortages or disease in 2018.
The country is not on track to meet the global nutrition targets endorsed as part of the United Nations Decade of Action on Nutrition 2016–2025. According to governmental projections from the Ministry of National Development Planning (Bappenas), still 26 per cent of under-fives would be stunted in 2024 and 22 per cent in 2030 under the ‘business-as-usual’ scenario. Without acceleration of progress, the prevalence of child wasting would decrease only slightly, to 8 per cent in 2030.
The causal factors influencing child malnutrition trends are complex and multifaceted. At the household and individual level, they include suboptimal infant and young child feeding practices, the incidence of infectious diseases, and
poor maternal health and nutrition. Indonesia’s exclusive breastfeeding rate, for example, has been increasing steadily during the last decade, to 52 per cent in 2017, while other indicators such as the prevalence of anaemia in pregnant women have worsened significantly. On the supply side, nutrition services fall under the responsibility of districts and municipalities in Indonesia’s decentralised system of governance. Across the country, there is
Goal 2: Child malnutrition
K E Y P O I N T S
0%
10%
20%
30%
40%
50%
1990 1995 2000 2005 2010 2015 2020
Pre
vale
nce
of s
tun
ting
RiskesdasIFLS
Figure 5: Observed trend in the percentage of children under 5 who are stunted, by data source, 1993–2018
Data source: Indonesia Family Life Survey (IFLS) and Basic Health Research (Riskesdas).

Goal 2: chIld malnutrItIon
09
29.9
30.4
32.2
32.3
33.2
34.8
0% 10% 20% 30% 40%
Jawa
Sumatera
Kalimantan
Maluku dan Papua
Sulawesi
Balinustra
Percentage of children under 5
3,661,500
1,746,000
502,000
244,800
624,600
502,200
0 2,000,000 4,000,000
Number of children under 5
Figure 6: Children under 5 who are stunted, by region, 2018
Data source: Indonesia Basic Health Research (Riskesdas) 2018.
0% 15% 30% 45% 60%
China
Mongolia
Sri Lanka
Thailand
Maldives
Viet Nam
Indonesia
Bhutan
Philippines
Myanmar
Bangladesh
Cambodia
Lao PDR
Pakistan
Timor-Leste
Prevalence of stunting
Figure 7: Percentage of children under 5 who are stunted in middle-income countries in South and East Asia
Note: Data are for the latest year available between 2010 and 2018.Data source: Indonesia Basic Health Research (Riskesdas) 2018 and United Nations’ Global SDG Indicators Database (accessed in June 2019).
10
ACHIEVING THE SDGS FOR CHILDREN IN INDONESIA
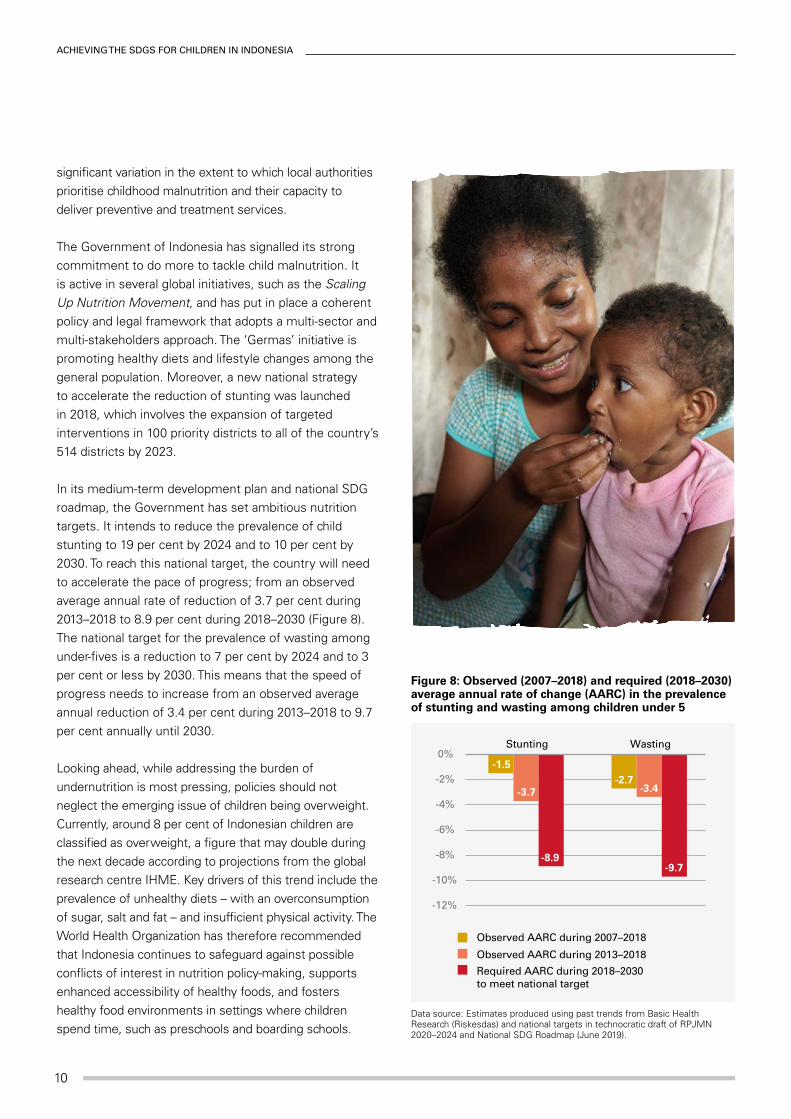
significant variation in the extent to which local authorities prioritise childhood malnutrition and their capacity to deliver preventive and treatment services.
The Government of Indonesia has signalled its strong commitment to do more to tackle child malnutrition. It is active in several global initiatives, such as the Scaling Up Nutrition Movement, and has put in place a coherent policy and legal framework that adopts a multi-sector and multi-stakeholders approach. The ‘Germas’ initiative is promoting healthy diets and lifestyle changes among the general population. Moreover, a new national strategy to accelerate the reduction of stunting was launched in 2018, which involves the expansion of targeted interventions in 100 priority districts to all of the country’s 514 districts by 2023.
In its medium-term development plan and national SDG roadmap, the Government has set ambitious nutrition targets. It intends to reduce the prevalence of child stunting to 19 per cent by 2024 and to 10 per cent by 2030. To reach this national target, the country will need to accelerate the pace of progress; from an observed average annual rate of reduction of 3.7 per cent during 2013–2018 to 8.9 per cent during 2018–2030 (Figure 8). The national target for the prevalence of wasting among under-fives is a reduction to 7 per cent by 2024 and to 3 per cent or less by 2030. This means that the speed of progress needs to increase from an observed average annual reduction of 3.4 per cent during 2013–2018 to 9.7 per cent annually until 2030.
Looking ahead, while addressing the burden of undernutrition is most pressing, policies should not neglect the emerging issue of children being overweight. Currently, around 8 per cent of Indonesian children are classified as overweight, a figure that may double during the next decade according to projections from the global research centre IHME. Key drivers of this trend include the prevalence of unhealthy diets – with an overconsumption of sugar, salt and fat – and insufficient physical activity. The World Health Organization has therefore recommended that Indonesia continues to safeguard against possible conflicts of interest in nutrition policy-making, supports enhanced accessibility of healthy foods, and fosters healthy food environments in settings where children spend time, such as preschools and boarding schools.
Observed AARC during 2007–2018
Required AARC during 2018–2030 to meet national target
-1.5-2.7
-3.7 -3.4
-8.9-9.7
-12%
-10%
-8%
-6%
-4%
-2%
0%Stunting Wasting
Observed AARC during 2013–2018
Figure 8: Observed (2007–2018) and required (2018–2030) average annual rate of change (AARC) in the prevalence of stunting and wasting among children under 5
Data source: Estimates produced using past trends from Basic Health Research (Riskesdas) and national targets in technocratic draft of RPJMN 2020–2024 and National SDG Roadmap (June 2019).

Goal 3: chIld survIval
11
• Indonesia achieved the millennium development Goal target on reducing child mortality by two-thirds between 1990 and 2015.
• to reach the national targets for 2030, the speed of progress will need to accelerate further especially among newborns.
• most child deaths could be prevented by improving access to quality health care and reducing high-risk fertility behaviour.
Indonesia has experienced a steep fall in its levels of child mortality over the past 30 years (Figure 9). As a result, the country was able to achieve the Millennium Development Goal target to reduce the under-five mortality rate by at least two-thirds between 1990 and 2015. The decline was especially fast during the 1990s, in part because of the expanded immunisation programmes and gains in the diagnosis and treatment of common childhood illnesses. The latest Demographic and Health Survey from 2017 recorded an under-five mortality rate of 32 deaths per 1,000 live during the five-year period preceding the survey. The infant mortality rate was estimated at 24 deaths per 1,000 live births and the neonatal mortality rate at 19.
Nonetheless, there is scope for further improvement. Newborns account for a growing share of under-five deaths, as progress in reducing neonatal mortality has been significantly slower than reductions in mortality among 1–59 months olds. Disparities based on geography and other socio-economic stratifiers remain significant. Children from the poorest wealth quintile, for example, were two times more likely to die before their fifth birthday than children born in the wealthiest quintile of households in 2017. When compared with other middle-income countries in East and South Asia, UN estimates indicate
that Indonesia’s under-five mortality rate is just below the regional average and still two to three times higher than the rate in Thailand, China or Sri Lanka (Figure 10).
Most child deaths could be prevented by improving access to quality health care and reducing high-risk
Goal 3: Child survival
K E Y P O I N T S
Under-5 Infant Neonatal
0
20
40
60
80
100
1987 1992 1997 2002 2007 2012 2017
Dea
ths
per
1,0
00 li
ve b
irth
s
Figure 9: Observed trend in neonatal, infant and under-five mortality rate, 1987–2017
Note: Data points are estimates for the five-year period preceding the survey year.Data source: Indonesia Demographic and Health Survey (IDHS).

12
ACHIEVING THE SDGS FOR CHILDREN IN INDONESIA
0 10 20 30 40 50 60 70 80
Malaysia
Maldives
Sri Lanka
China
Thailand
Mongolia
Viet Nam
Indonesia
Philippines
Cambodia
Bhutan
Bangladesh
India
Timor-Leste
Myanmar
Lao PDR
Pakistan
Deaths per 1,000 live births
Neonatal Infant Under-5
Figure 10: Estimates of neonatal, infant and under-five mortality rate in middle-income countries in South and East Asia, 2017
Data source: United Nations Inter-agency Group for Child Mortality Estimation (UN IGME), 2018.
Deaths during neonatal period
Pneumonia 13
Diarrhoea 6
Measles 3
Injuries 7
Meningitis 1
Other 20
Pneumonia 3 Other 4
Sepsis 6
Congenital 9
Intrapartum 11
Preterm 17
Figure 11: Percentage distribution of the causes of deaths of children under 5 years of age, 2017
Data source: Estimates for Indonesia generated by the WHO and Maternal and Child Epidemiology Estimation Group (MCEE) 2018.

Goal 3: chIld survIval
13
fertility behaviour. Over one-third of under-five deaths were caused by infectious diseases that are readily preventable or treatable with proven, cost-effective interventions, such as pneumonia, diarrhoea, sepsis, and measles (Figure 11). For another 28 per cent, the leading cause of death was preterm birth and intrapartum-related complications. These factors can be prevented or managed by appropriate care through labour and access to emergency obstetric care, essential and extra newborn care, and neonatal resuscitation. Other, non-medical factors that increase a child’s risk of early death include low maternal education, early childbearing, pregnancy spacing, and undernutrition, among others. For instance, newborns whose mothers are less than 20 years old are about 1.5 times more likely to die in their first month of life compared to children of 20–29 year-old mothers. Neonatal mortality rates for babies born within less than 2 years after a previous birth are nearly three times as high as for babies born after an interval of 3 years.
In its medium-term development plan and national SDG roadmap, the Government has set targets to reduce the neonatal, infant and under-five mortality rate to 7, 12 and 19 deaths per 1,000 live births by 2030, respectively. Policy interventions are focused on extending the coverage of the National Health Insurance Programme (JKN); increasing the take-up of services such as reproductive health, antenatal care, and immunisation; improving the quality of care and referrals; and broader health systems strengthening.
To achieve the national targets, the country will need to accelerate the speed of progress, especially for neonatal mortality (Figure 12). For instance, during 2007–2017, the average annual rate of reduction in the neonatal mortality rate was 2.4 per cent. This will need to increase to 5.9 per cent annually between 2017 and 2030 to bring the neonatal mortality down to 7 deaths per 1,000 live births. Results from the dynamic microsimulation model also indicate that there is a risk that children from the poorest households will continue to lag behind in the future (Figure 13). Under baseline macroeconomic conditions, the projected average annual rate of reduction in under-five mortality until 2030 is nearly 9 per cent among children in the top quintile compared with only 0.4 per cent among those born in the poorest households.
-2.4
-3.5-3.2
-5.9-5.3
-4.1
-7%
-6%
-5%
-4%
-3%
-2%
-1%
0%
neonatalmortality
Infantmortality
under-fivemortality
aa
rc
observed aarc during 2007–2017
required aarc during 2017–2030 to meet national targets
Figure 12: Observed and required average annual rate of change (AARC) in the national neonatal, infant, and under-five mortality rate
Data source: Estimates produced using past trends from IDHS and national targets in technocratic draft of RPJMN 2020–2024 and National SDG Roadmap (June 2019).
-10.0%
-8.0%
-6.0%
-4.0%
-2.0%
0.0%
2.0%
Bottom 2nd 3rd 4th top
aa
rc
Wealth quintile
Infant mortality
under-five mortality
Figure 13: Projected average annual rate of change (AARC) in infant and under-five mortality under baseline macroeconomic conditions, by wealth quintile, 2018–2030
Data source: Estimates produced with dynamic microsimulation model.
14
ACHIEVING THE SDGS FOR CHILDREN IN INDONESIA
• Indonesia has made great strides in improving children’s access to primary and secondary education.
• the country has achieved gender parity in school enrolment, but inequalities based on children’s disability status, household wealth and place of residence need to be tackled more strongly.
• pupils perform poorly in international standardised assessments of core subjects.
• to achieve the national targets for learning outcomes by 2030, the pace of progress needs to accelerate significantly.
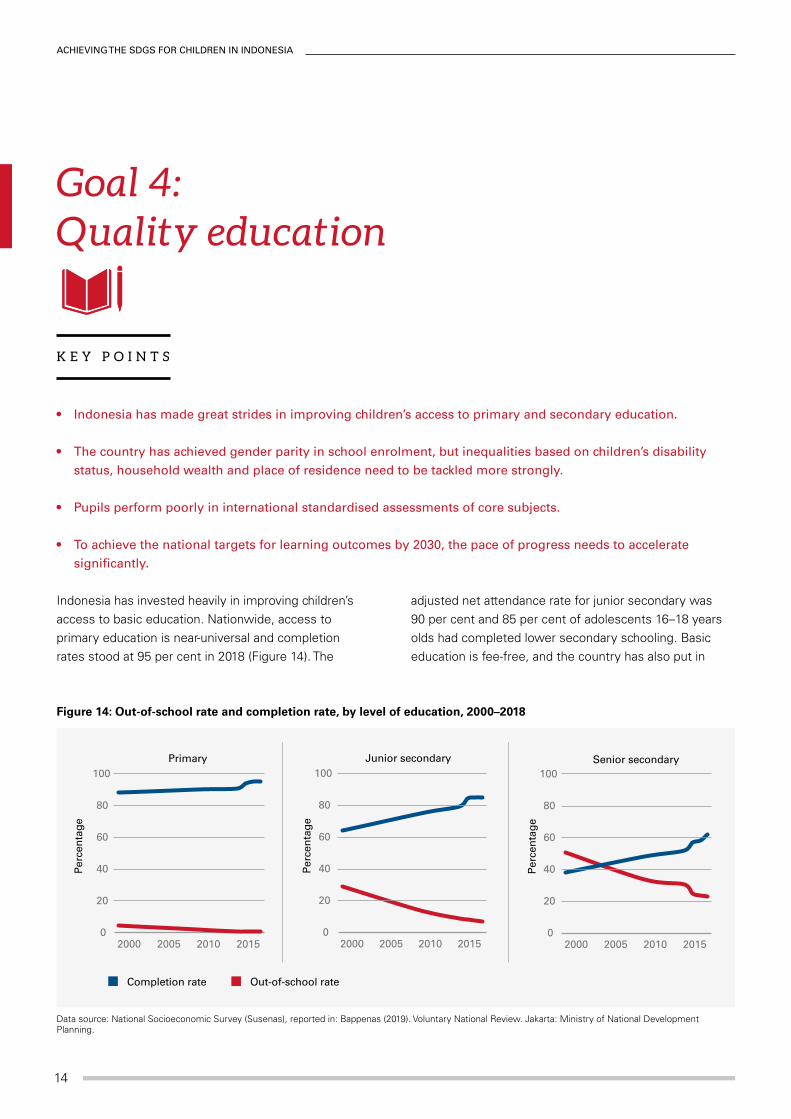
Indonesia has invested heavily in improving children’s access to basic education. Nationwide, access to primary education is near-universal and completion rates stood at 95 per cent in 2018 (Figure 14). The
adjusted net attendance rate for junior secondary was 90 per cent and 85 per cent of adolescents 16–18 years olds had completed lower secondary schooling. Basic education is fee-free, and the country has also put in
Goal 4: Quality education
K E Y P O I N T S
Completion rate Out-of-school rate
0
20
40
60
80
100
2000 2005 2010 2015
Per
cen
tag
e
Primary
0
20
40
60
80
100
2000 2005 2010 2015
Per
cen
tag
e
Junior secondary
0
20
40
60
80
100
2000 2005 2010 2015
Per
cen
tag
e
Senior secondary
Figure 14: Out-of-school rate and completion rate, by level of education, 2000–2018
Data source: National Socioeconomic Survey (Susenas), reported in: Bappenas (2019). Voluntary National Review. Jakarta: Ministry of National Development Planning.
Goal 4: QualIty educatIon
15
place a scholarship programme to help meet out-of-pocket education expenses for children from low-income families, known as ‘Program Indonesia Pintar’ (PIP). Some 19 million pupils are benefiting from the PIP, up from less than 2 million a decade earlier.
Levels of access to senior secondary schooling are expanding too. The out-of-school rate among children of senior secondary school age was more than halved during the last 18 years, from 50 per cent in 2000 to 23 per cent in 2018. Completion rates went up from 38 per cent to 62 per cent during the same period. In 2016, the Government of Indonesia raised the duration of compulsory education from 9 to 12 years to maximise the long-term economic potential of its large youth population. This change is expected to further boost the share of children completing high school and to increase the demand for tertiary education.
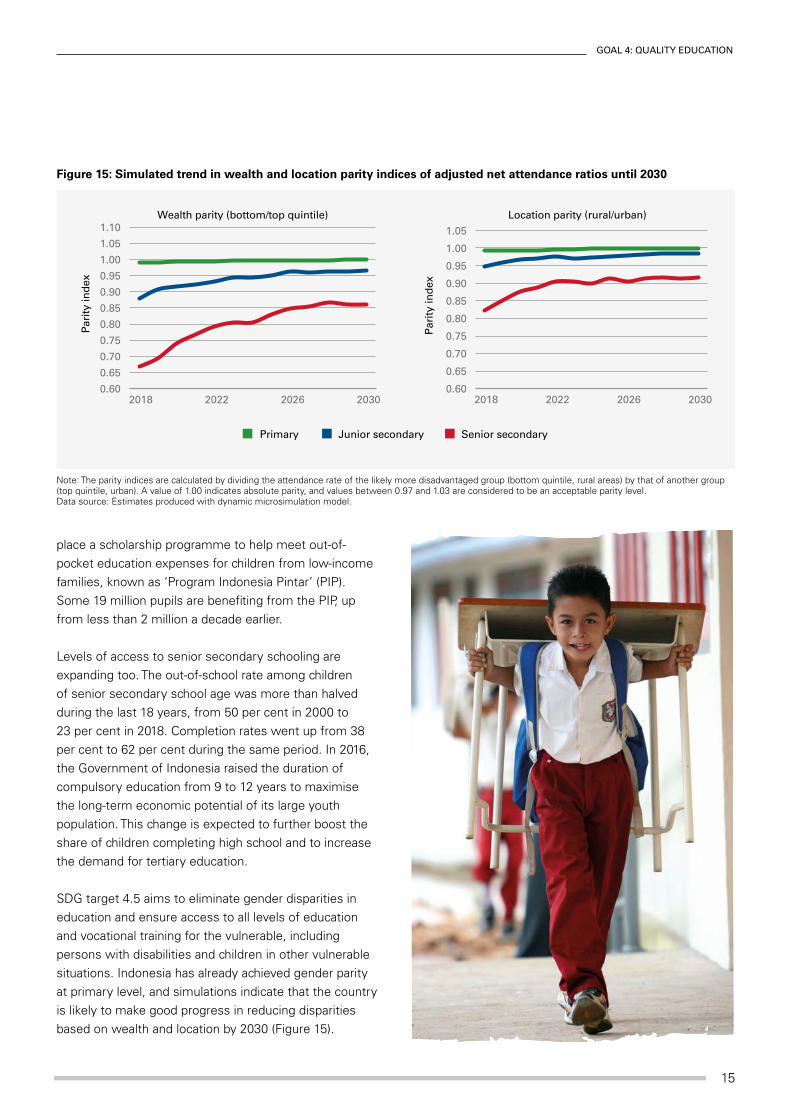
SDG target 4.5 aims to eliminate gender disparities in education and ensure access to all levels of education and vocational training for the vulnerable, including persons with disabilities and children in other vulnerable situations. Indonesia has already achieved gender parity at primary level, and simulations indicate that the country is likely to make good progress in reducing disparities based on wealth and location by 2030 (Figure 15).
0.60
0.65
0.70
0.75
0.80
0.85
0.90
0.95
1.00
1.05
1.10
2018 2022 2026 2030
Par
ity in
dex
Wealth parity (bottom/top quintile)
0.60
0.65
0.70
0.75
0.80
0.85
0.90
0.95
1.00
1.05
2018 2022 2026 2030
Par
ity in
dex
Location parity (rural/urban)
Primary Junior secondary Senior secondary
Figure 15: Simulated trend in wealth and location parity indices of adjusted net attendance ratios until 2030
Note: The parity indices are calculated by dividing the attendance rate of the likely more disadvantaged group (bottom quintile, rural areas) by that of another group (top quintile, urban). A value of 1.00 indicates absolute parity, and values between 0.97 and 1.03 are considered to be an acceptable parity level.Data source: Estimates produced with dynamic microsimulation model.
16
ACHIEVING THE SDGS FOR CHILDREN IN INDONESIA
In 2018, the wealth parity ratio for access to junior secondary schooling was around 0.86, indicating that children from the poorest households are significantly disadvantaged compared with their peers from the top quintile. The ratio is projected to decrease to near-parity in 2030 under baseline macroeconomic assumptions.
Disparity indices for senior secondary schooling are likely to decrease too, but not at a rate fast enough to achieve parity by 2030.
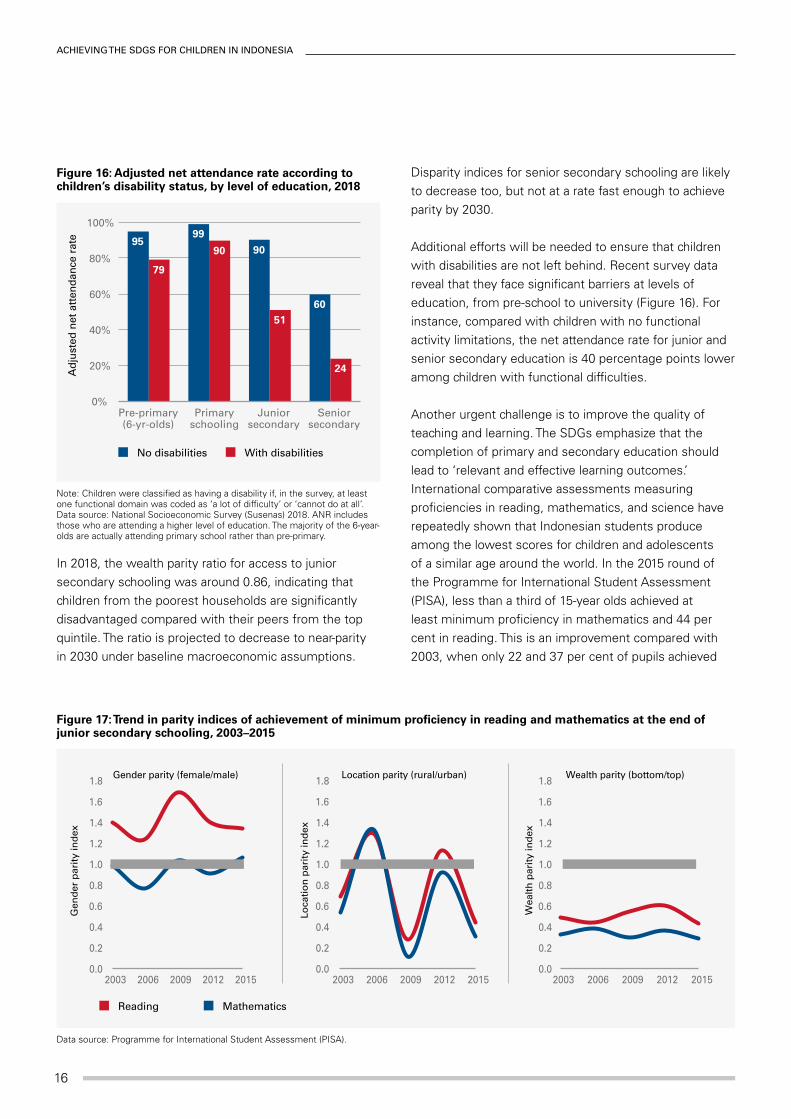
Additional efforts will be needed to ensure that children with disabilities are not left behind. Recent survey data reveal that they face significant barriers at levels of education, from pre-school to university (Figure 16). For instance, compared with children with no functional activity limitations, the net attendance rate for junior and senior secondary education is 40 percentage points lower among children with functional difficulties.
Another urgent challenge is to improve the quality of teaching and learning. The SDGs emphasize that the completion of primary and secondary education should lead to ‘relevant and effective learning outcomes.’ International comparative assessments measuring proficiencies in reading, mathematics, and science have repeatedly shown that Indonesian students produce among the lowest scores for children and adolescents of a similar age around the world. In the 2015 round of the Programme for International Student Assessment (PISA), less than a third of 15-year olds achieved at least minimum proficiency in mathematics and 44 per cent in reading. This is an improvement compared with 2003, when only 22 and 37 per cent of pupils achieved
MathematicsReading
2003 2006 2009 2012 2015
Gen
der
par
ity
ind
ex
Gender parity (female/male)
2003 2006 2009 2012 2015
Loca
tio
n p
arit
y in
dex
Location parity (rural/urban)
0.0
0.2
0.4
0.6
0.8
1.0
1.2
1.4
1.6
1.8
2003 2006 2009 2012 2015
Wea
lth
par
ity
ind
ex
Wealth parity (bottom/top)
0.0
0.2
0.4
0.6
0.8
1.0
1.2
1.4
1.6
1.8
0.0
0.2
0.4
0.6
0.8
1.0
1.2
1.4
1.6
1.8
Figure 17: Trend in parity indices of achievement of minimum proficiency in reading and mathematics at the end of junior secondary schooling, 2003–2015
Data source: Programme for International Student Assessment (PISA).
No disabilities With disabilities
9599
90
60
79
90
51
24
0%
20%
40%
60%
80%
100%
Pre-primary(6-yr-olds)
Primaryschooling
Juniorsecondary
Seniorsecondary
Ad
just
ed n
et a
tten
dan
ce r
ate
Figure 16: Adjusted net attendance rate according to children’s disability status, by level of education, 2018
Note: Children were classified as having a disability if, in the survey, at least one functional domain was coded as ‘a lot of difficulty’ or ‘cannot do at all’.Data source: National Socioeconomic Survey (Susenas) 2018. ANR includes those who are attending a higher level of education. The majority of the 6-year-olds are actually attending primary school rather than pre-primary.
Goal 4: QualIty educatIon
17
minimum proficiency in mathematics and reading, respectively, although the national performance has not improved markedly since 2006. Moreover, disparities in learning outcomes based on wealth and location are large (Figure 17).
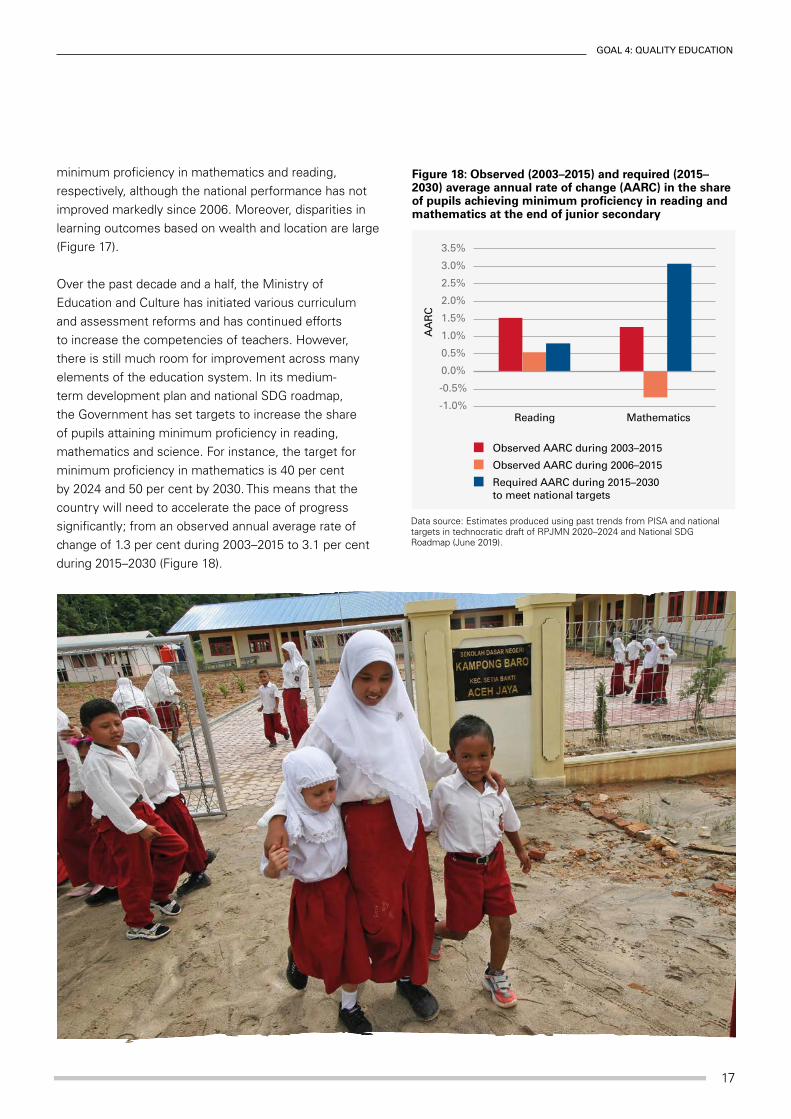
Over the past decade and a half, the Ministry of Education and Culture has initiated various curriculum and assessment reforms and has continued efforts to increase the competencies of teachers. However, there is still much room for improvement across many elements of the education system. In its medium-term development plan and national SDG roadmap, the Government has set targets to increase the share of pupils attaining minimum proficiency in reading, mathematics and science. For instance, the target for minimum proficiency in mathematics is 40 per cent by 2024 and 50 per cent by 2030. This means that the country will need to accelerate the pace of progress significantly; from an observed annual average rate of change of 1.3 per cent during 2003–2015 to 3.1 per cent during 2015–2030 (Figure 18).
-1.0%
-0.5%
0.0%
0.5%
1.0%
1.5%
2.0%
2.5%
3.0%
3.5%
Reading MathematicsA
AR
C
Observed AARC during 2003–2015
Observed AARC during 2006–2015
Required AARC during 2015–2030 to meet national targets
Figure 18: Observed (2003–2015) and required (2015–2030) average annual rate of change (AARC) in the share of pupils achieving minimum proficiency in reading and mathematics at the end of junior secondary
Data source: Estimates produced using past trends from PISA and national targets in technocratic draft of RPJMN 2020–2024 and National SDG Roadmap (June 2019).
18
ACHIEVING THE SDGS FOR CHILDREN IN INDONESIA
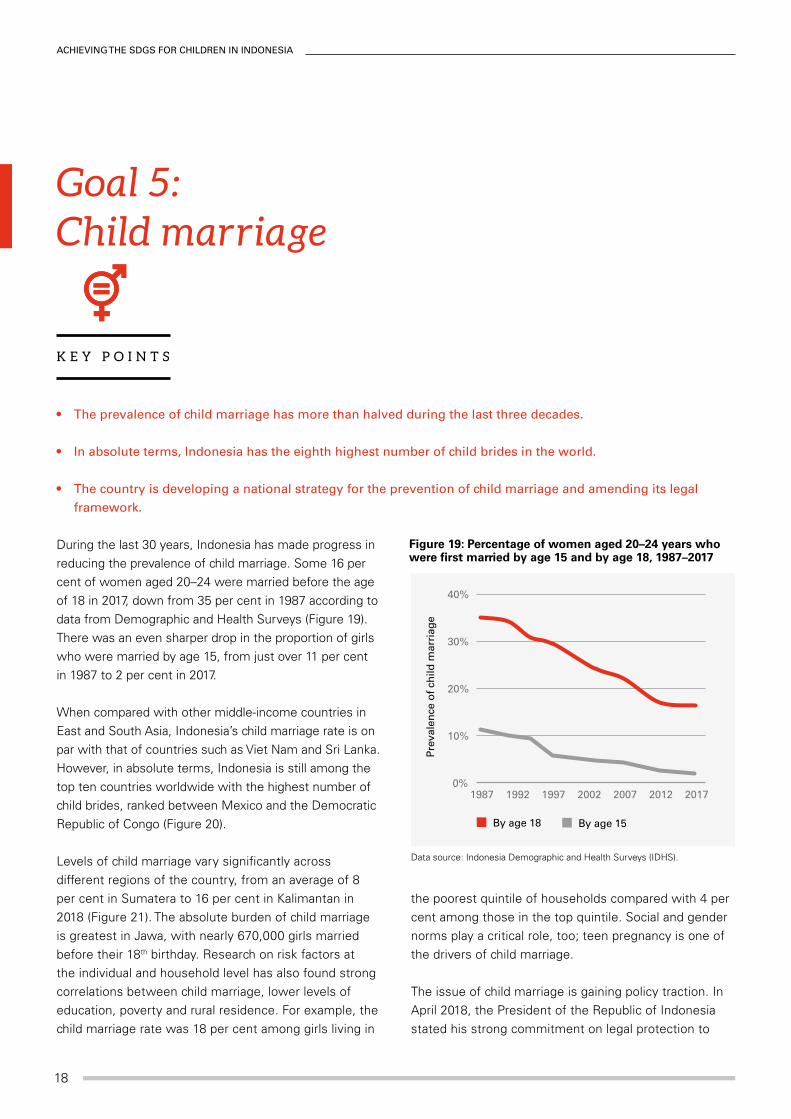
• the prevalence of child marriage has more than halved during the last three decades.
• In absolute terms, Indonesia has the eighth highest number of child brides in the world.
• the country is developing a national strategy for the prevention of child marriage and amending its legal framework.
During the last 30 years, Indonesia has made progress in reducing the prevalence of child marriage. Some 16 per cent of women aged 20–24 were married before the age of 18 in 2017, down from 35 per cent in 1987 according to data from Demographic and Health Surveys (Figure 19). There was an even sharper drop in the proportion of girls who were married by age 15, from just over 11 per cent in 1987 to 2 per cent in 2017.
When compared with other middle-income countries in East and South Asia, Indonesia’s child marriage rate is on par with that of countries such as Viet Nam and Sri Lanka. However, in absolute terms, Indonesia is still among the top ten countries worldwide with the highest number of child brides, ranked between Mexico and the Democratic Republic of Congo (Figure 20).
Levels of child marriage vary significantly across different regions of the country, from an average of 8 per cent in Sumatera to 16 per cent in Kalimantan in 2018 (Figure 21). The absolute burden of child marriage is greatest in Jawa, with nearly 670,000 girls married before their 18th birthday. Research on risk factors at the individual and household level has also found strong correlations between child marriage, lower levels of education, poverty and rural residence. For example, the child marriage rate was 18 per cent among girls living in
the poorest quintile of households compared with 4 per cent among those in the top quintile. Social and gender norms play a critical role, too; teen pregnancy is one of the drivers of child marriage.
The issue of child marriage is gaining policy traction. In April 2018, the President of the Republic of Indonesia stated his strong commitment on legal protection to
Goal 5: Child marriage
K E Y P O I N T S
By age 15 By age 18
0%
10%
20%
30%
40%
1987 1992 1997 2002 2007 2012 2017
Pre
vale
nce
of c
hild
mar
riag
e
Figure 19: Percentage of women aged 20–24 years who were first married by age 15 and by age 18, 1987–2017
Data source: Indonesia Demographic and Health Surveys (IDHS).

Goal 5: chIld marrIaGe
19
787,000
1,300,000
1,459,000
1,479,000
1,909,000
2,104,000
3,034,000
3,538,000
4,451,000
15,509,000
0 2,000,000 4,000,000 6,000,000 8,000,000 10,000,000 12,000,000 14,000,000 16,000,000 18,000,000
Uganda
DR of Congo
Indonesia
Mexico
Pakistan
Ethiopia
Brazil
Nigeria
Bangladesh
India
Number of child brides
Figure 20: Top 10 countries in the world with the highest absolute numbers of child marriage
Data source: UNICEF global databases (2018) and population data from UN DESA (2017). Reported in: Child Marriage Atlas (June 2019).
8.3
11.1
11.1
11.2
15.6
16.3
0% 5% 10% 15% 20%
Sumatera
Balinustra
Maluku dan Papua
Jawa
Sulawesi
Kalimantan
190,700
64,600
31,900
668,900
123,400
104,600
0 200,000 400,000 600,000 800,000
Percentage Number
Figure 21: Women aged 20–24 who were married by age 18, by region, 2018
Data source: National Socioeconomic Survey (Susenas).

20
ACHIEVING THE SDGS FOR CHILDREN IN INDONESIA
prevent child marriages. Currently, the Marriage Law 1974 permits women and men to marry at 21 but girls can marry at 16 and boys at 19 with parental permission. The Ministry of Women’s Empowerment and Child Protection is leading a ‘Stop Child Marriage’ movement, a collaboration between 15 government agencies and 65 NGOs and media networks. The Government is also drafting a National Strategy for the Prevention of Child Marriage to guide different stakeholders in developing more integrated and comprehensive interventions to address child marriage in Indonesia.
Projections developed by the Government of Indonesia indicate that, under a business-as-usual scenario, the prevalence of child marriage would reduce to 10 per cent in 2030 (Figure 22). The Government intends to accelerate progress, though. The national SDG roadmap has set a target to reduce the prevalence of child marriage to 6.9 per cent or less by 2030. To achieve this target, the average annual rate of reduction will need to be 3.8 per cent during 2018–2030, which is well above the average annual rate of progress of 2.7 per cent observed during 2008–2018 in the annual National Socioeconomic Survey.
Observed Business-as-usual
0%
4%
8%
12%
16%
20%
2005 2010 2015 2020 2025 2030
Pre
vale
nce
of c
hild
mar
riag
e
Intervention scenario
Figure 22: Observed trend in the prevalence of child marriage (by age 18) and projections until 2030 under baseline and intervention scenarios
Data source: National Socioeconomic Survey (Susenas) and National SDG Roadmap (June 2019).
Goal 16: BIrth reGIstratIon
21
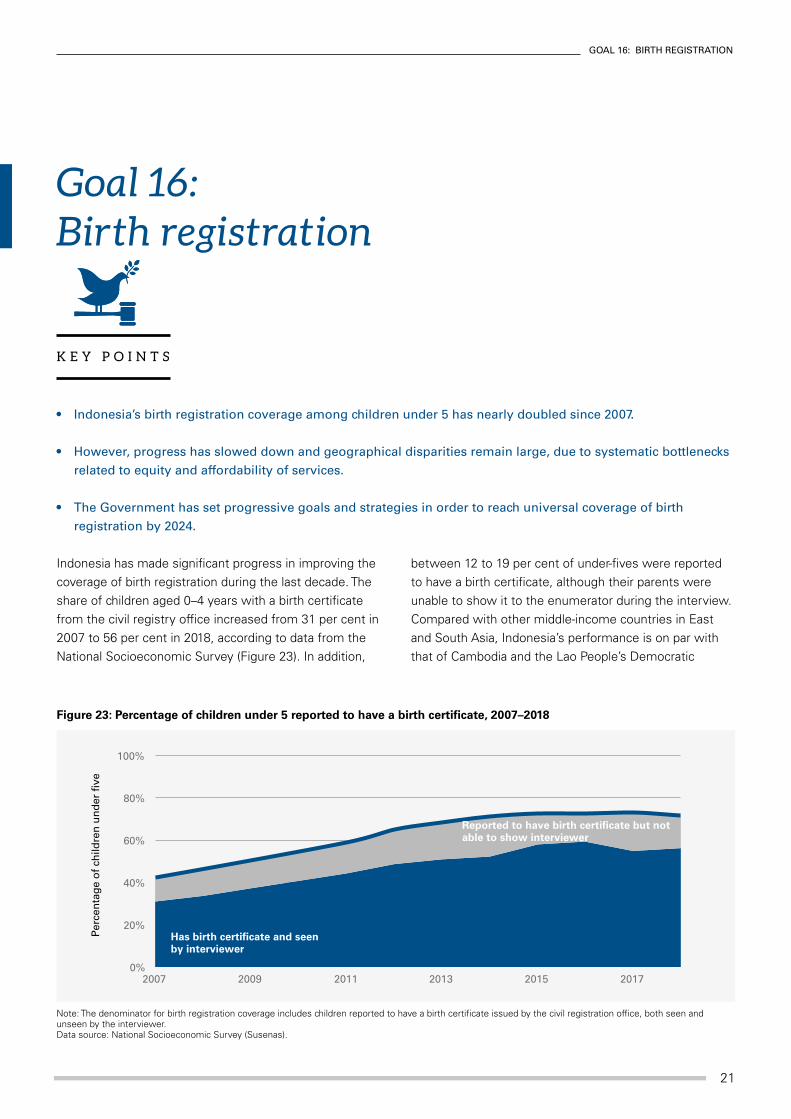
• Indonesia’s birth registration coverage among children under 5 has nearly doubled since 2007.
• however, progress has slowed down and geographical disparities remain large, due to systematic bottlenecks related to equity and affordability of services.
• the Government has set progressive goals and strategies in order to reach universal coverage of birth registration by 2024.
Indonesia has made significant progress in improving the coverage of birth registration during the last decade. The share of children aged 0–4 years with a birth certificate from the civil registry office increased from 31 per cent in 2007 to 56 per cent in 2018, according to data from the National Socioeconomic Survey (Figure 23). In addition,
between 12 to 19 per cent of under-fives were reported to have a birth certificate, although their parents were unable to show it to the enumerator during the interview. Compared with other middle-income countries in East and South Asia, Indonesia’s performance is on par with that of Cambodia and the Lao People’s Democratic
Goal 16: Birth registration
K E Y P O I N T S
0%
20%
40%
60%
80%
100%
2007 2009 2011 2013 2015 2017
per
cen
tag
e o
f ch
ildre
n u
nd
er fi
ve
Has birth certificate and seen by interviewer
Reported to have birth certificate but not able to show interviewer
Figure 23: Percentage of children under 5 reported to have a birth certificate, 2007–2018
Note: The denominator for birth registration coverage includes children reported to have a birth certificate issued by the civil registration office, both seen and unseen by the interviewer.Data source: National Socioeconomic Survey (Susenas).
22
ACHIEVING THE SDGS FOR CHILDREN IN INDONESIA
0% 10% 20% 30% 40% 50% 60% 70% 80% 90% 100%
Bangladesh
Pakistan
Timor-Leste
Indonesia
Lao PDR
Cambodia
India
Myanmar
Philippines
Viet Nam
Mongolia
Thailand
Bhutan
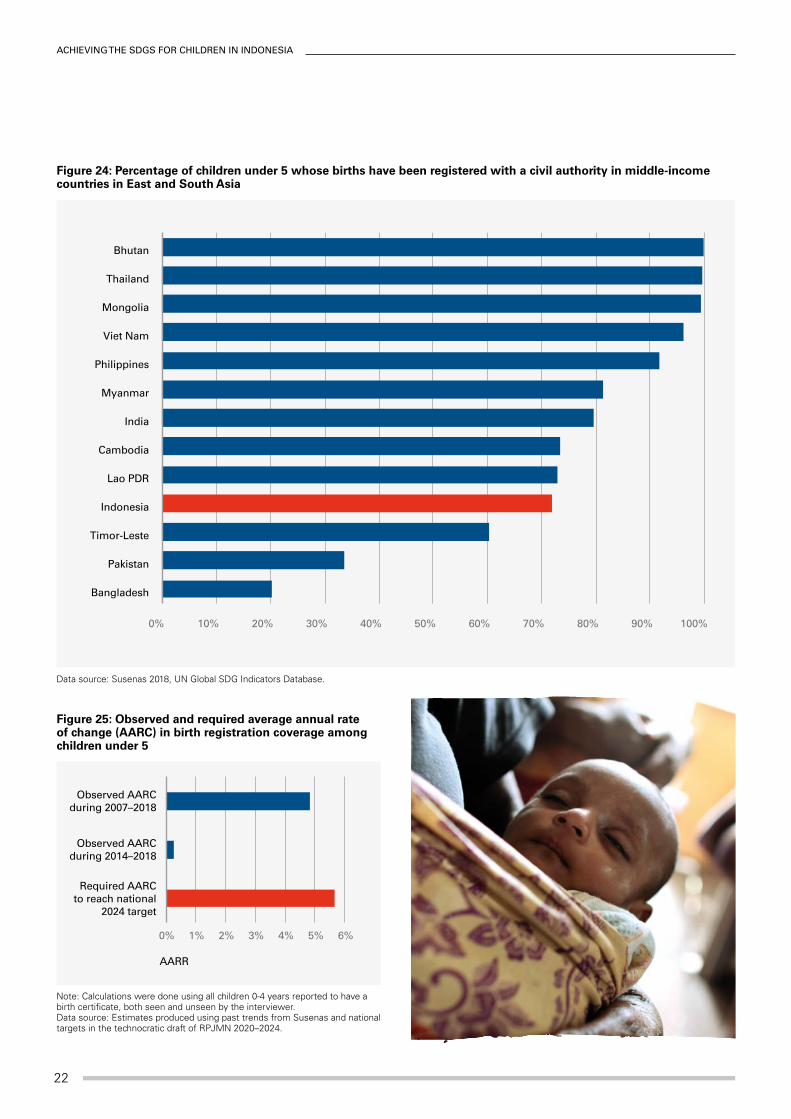
Figure 24: Percentage of children under 5 whose births have been registered with a civil authority in middle-income countries in East and South Asia
Data source: Susenas 2018, UN Global SDG Indicators Database.
0% 1% 2% 3% 4% 5% 6%
Required AARCto reach national
2024 target
Observed AARCduring 2014–2018
Observed AARCduring 2007–2018
AARR
Figure 25: Observed and required average annual rate of change (AARC) in birth registration coverage among children under 5
Note: Calculations were done using all children 0-4 years reported to have a birth certificate, both seen and unseen by the interviewer.Data source: Estimates produced using past trends from Susenas and national targets in the technocratic draft of RPJMN 2020–2024.
Goal 16: BIrth reGIstratIon
23
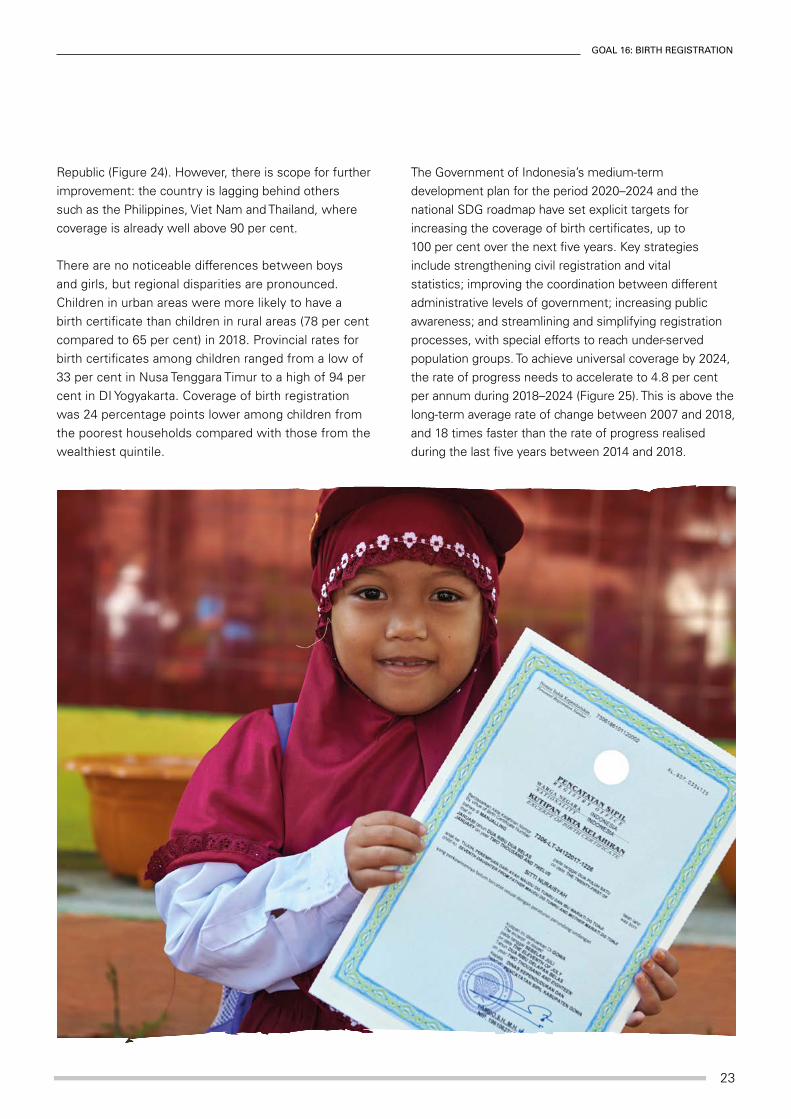
Republic (Figure 24). However, there is scope for further improvement: the country is lagging behind others such as the Philippines, Viet Nam and Thailand, where coverage is already well above 90 per cent.
There are no noticeable differences between boys and girls, but regional disparities are pronounced. Children in urban areas were more likely to have a birth certificate than children in rural areas (78 per cent compared to 65 per cent) in 2018. Provincial rates for birth certificates among children ranged from a low of 33 per cent in Nusa Tenggara Timur to a high of 94 per cent in DI Yogyakarta. Coverage of birth registration was 24 percentage points lower among children from the poorest households compared with those from the wealthiest quintile.
The Government of Indonesia’s medium-term development plan for the period 2020–2024 and the national SDG roadmap have set explicit targets for increasing the coverage of birth certificates, up to 100 per cent over the next five years. Key strategies include strengthening civil registration and vital statistics; improving the coordination between different administrative levels of government; increasing public awareness; and streamlining and simplifying registration processes, with special efforts to reach under-served population groups. To achieve universal coverage by 2024, the rate of progress needs to accelerate to 4.8 per cent per annum during 2018–2024 (Figure 25). This is above the long-term average rate of change between 2007 and 2018, and 18 times faster than the rate of progress realised during the last five years between 2014 and 2018.
24
ACHIEVING THE SDGS FOR CHILDREN IN INDONESIA
This summary note presented emerging findings from ongoing research by the Government of Indonesia and UNICEF to better understand the likelihood of achieving satisfactory progress towards the SDGs for children by 2030. It focused on a subset of the SDG targets and indicators, related to child poverty, malnutrition, mortality, education, child marriage and birth registration.
The analysis shows that most indicators are already moving in the right direction, but that the speed of progress needs to accelerate. Some national targets can be achieved with relatively modest increases in the pace of progress. Others are attainable only by transformative action that dramatically alters the country’s current trajectory. It is clear also that a strong focus on equity is needed to reduce disparities based on children’s disability status, household wealth or place of residence.
A forthcoming research report (2019) will present a broader set of SDG indicators and sensitivity analysis of projections under alternative assumptions. It will also quantify the strength of the interlinkages between different goals and how progress in one area could influence progress in another.
Conclusion