Embed Size (px)
Citation preview
ELINKEINOELÄMÄN TUTKIMUSLAITOS, ETLA THE RESEARCH INSTITUTE OF THE FINNISH ECONOMY
Achieving high productivity in the small Nordic welfare states
Vesa Vihriälä 11 June 2014
ELINKEINOELÄMÄN TUTKIMUSLAITOS, ETLA THE RESEARCH INSTITUTE OF THE FINNISH ECONOMY
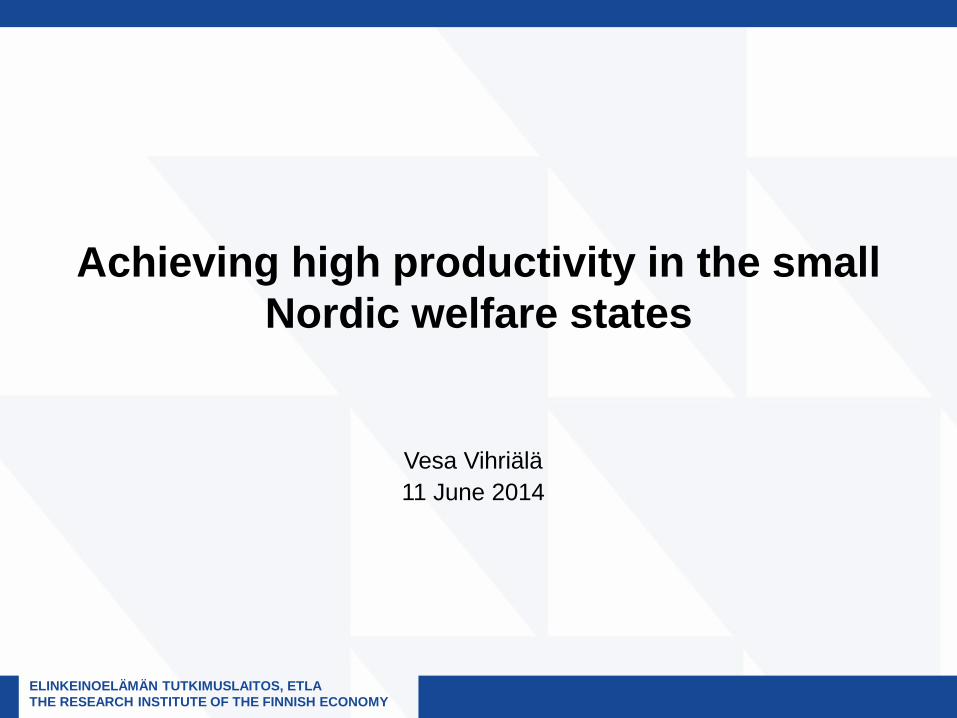
The Nordics have succeeded well • High GDP/capita combined with low income disparities;
the Nordics top many rankings of perceived quality of life (including OECD’s better life index)
• Particularly employment rates but also productivity levels have been high
• The key - mutually reinforcing - elements of the “Nordic model”: – Substantial public spending on human capital, innovation
support, safety nets; financed by high taxes – Trust, capacity to take risks, acceptance of structural change – High productivity, high employment => large tax base limiting the
pressure on tax rates – Fiscal prudence => space for fiscal stabilisation
ELINKEINOELÄMÄN TUTKIMUSLAITOS, ETLA THE RESEARCH INSTITUTE OF THE FINNISH ECONOMY
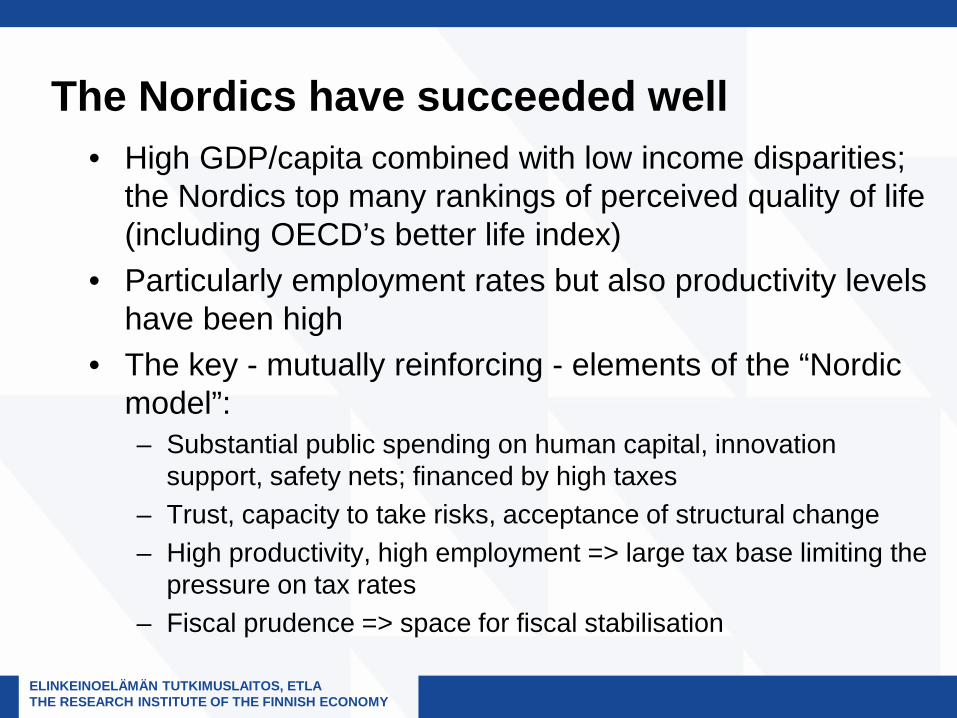
Attractive combinations of average welfare and equality
20 000
30 000
40 000
50 000
60 000
70 000
0.24 0.26 0.28 0.30 0.32 0.34 0.36 0.38 0.40
FIN
GDP per head, USD (CP & PPP) 2012
Gini-coefficient at disposable income (total population) 2010
CAN
ITA FRA
BEL
CZE
AUT
EST
NOR
NLD DNK
POL
USA
KOR
DEU
SVK
GBR ESP
SWE
MEX
ISR
AUS
SVN GRE POR
ISL
LUX Arithmetic average
Arithmetic average
Source: OECD
ELINKEINOELÄMÄN TUTKIMUSLAITOS, ETLA THE RESEARCH INSTITUTE OF THE FINNISH ECONOMY
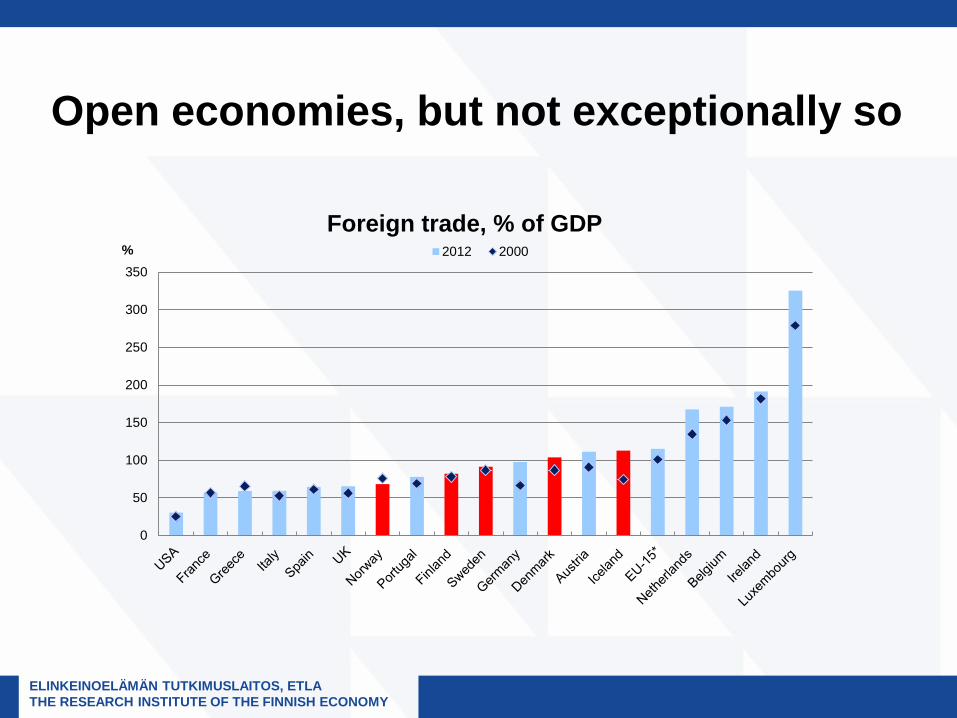
Open economies, but not exceptionally so
0
50
100
150
200
250
300
350%
Foreign trade, % of GDP 2012 2000
ELINKEINOELÄMÄN TUTKIMUSLAITOS, ETLA THE RESEARCH INSTITUTE OF THE FINNISH ECONOMY
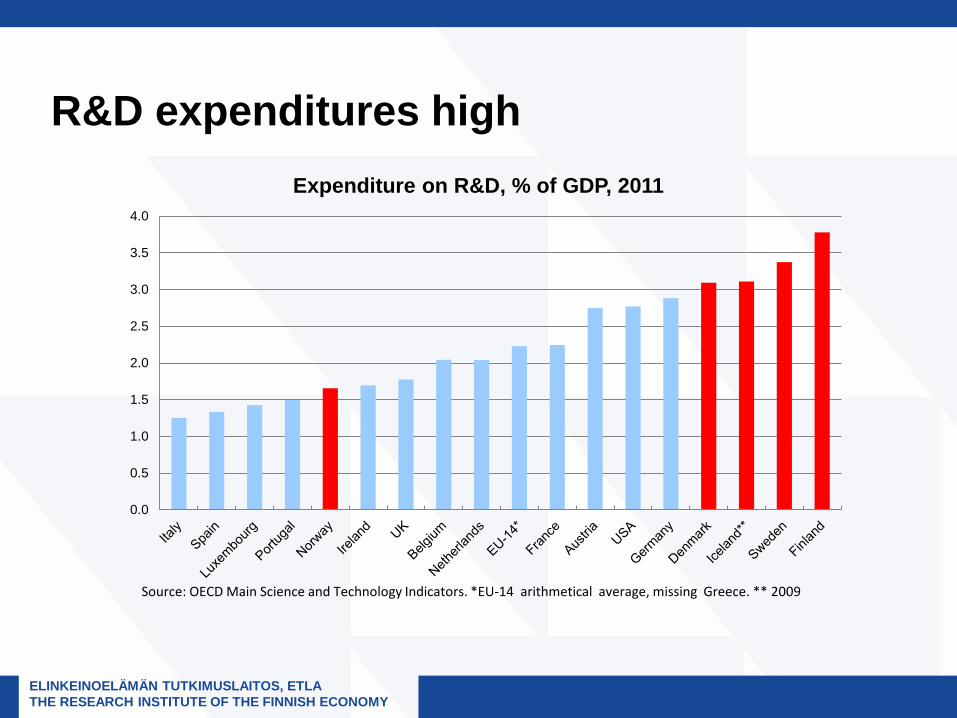
R&D expenditures high
0.0
0.5
1.0
1.5
2.0
2.5
3.0
3.5
4.0
Expenditure on R&D, % of GDP, 2011
Source: OECD Main Science and Technology Indicators. *EU-14 arithmetical average, missing Greece. ** 2009
ELINKEINOELÄMÄN TUTKIMUSLAITOS, ETLA THE RESEARCH INSTITUTE OF THE FINNISH ECONOMY
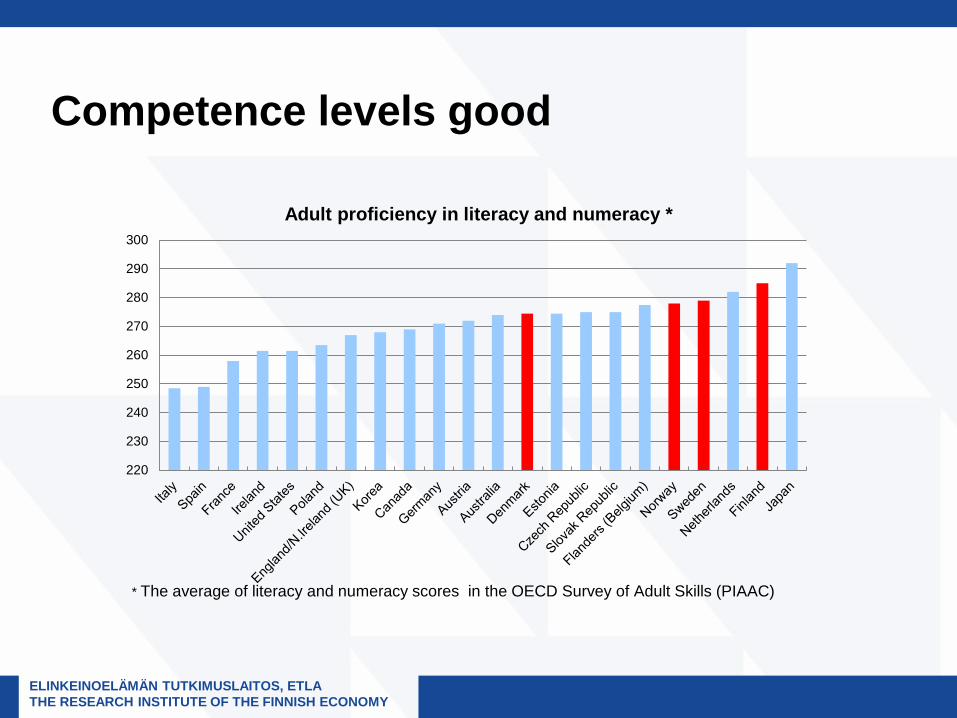
Competence levels good
220
230
240
250
260
270
280
290
300
Adult proficiency in literacy and numeracy *
* The average of literacy and numeracy scores in the OECD Survey of Adult Skills (PIAAC)
ELINKEINOELÄMÄN TUTKIMUSLAITOS, ETLA THE RESEARCH INSTITUTE OF THE FINNISH ECONOMY
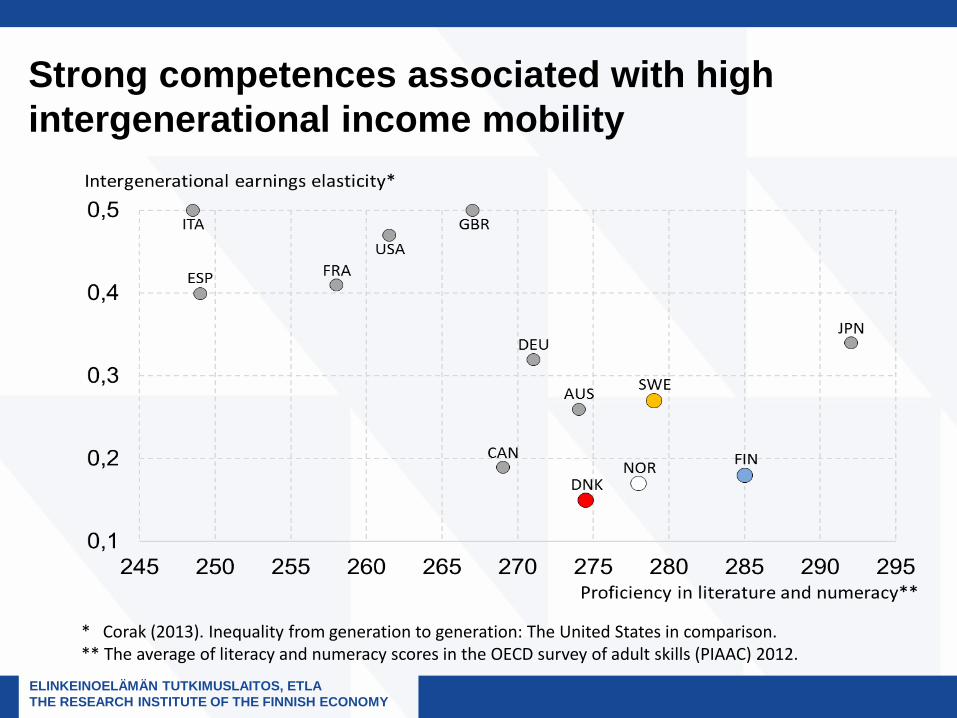
Strong competences associated with high intergenerational income mobility
* Corak (2013). Inequality from generation to generation: The United States in comparison. ** The average of literacy and numeracy scores in the OECD survey of adult skills (PIAAC) 2012.
ELINKEINOELÄMÄN TUTKIMUSLAITOS, ETLA THE RESEARCH INSTITUTE OF THE FINNISH ECONOMY
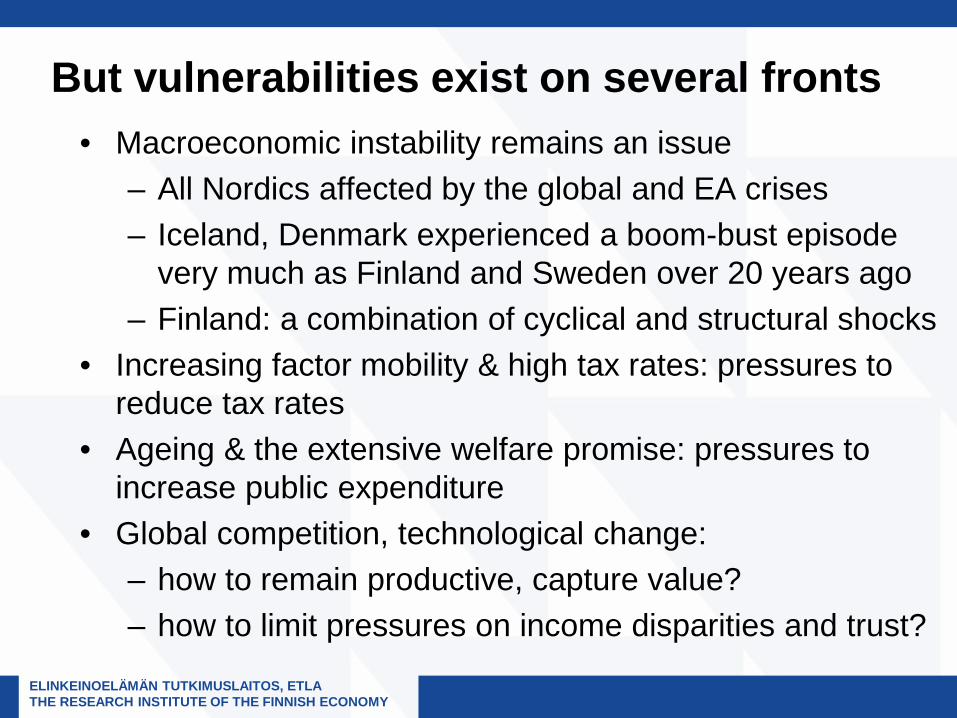
But vulnerabilities exist on several fronts • Macroeconomic instability remains an issue
– All Nordics affected by the global and EA crises – Iceland, Denmark experienced a boom-bust episode
very much as Finland and Sweden over 20 years ago – Finland: a combination of cyclical and structural shocks
• Increasing factor mobility & high tax rates: pressures to reduce tax rates
• Ageing & the extensive welfare promise: pressures to increase public expenditure
• Global competition, technological change: – how to remain productive, capture value? – how to limit pressures on income disparities and trust?
ELINKEINOELÄMÄN TUTKIMUSLAITOS, ETLA THE RESEARCH INSTITUTE OF THE FINNISH ECONOMY
100
102
104
106
108
110
112
114
116
118
120
2005/1 2006/1 2007/1 2008/1 2009/1 2010/1 2011/1 2012/1 2013/1
Volu
me
inde
x, 2
005Q
1=10
0
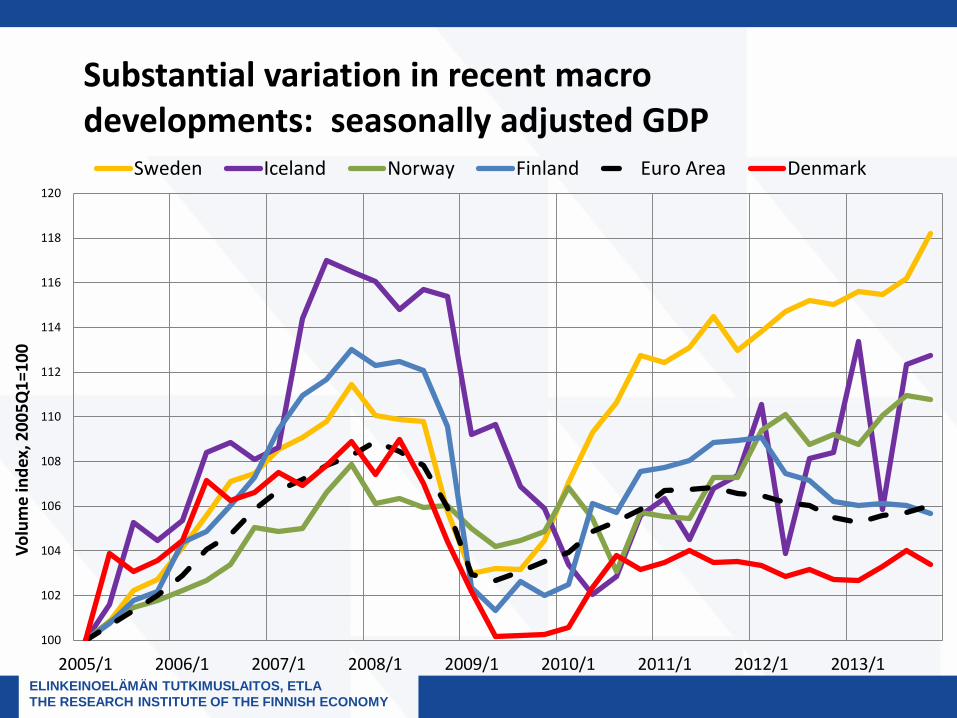
Substantial variation in recent macro developments: seasonally adjusted GDP
Sweden Iceland Norway Finland Euro Area Denmark
ELINKEINOELÄMÄN TUTKIMUSLAITOS, ETLA THE RESEARCH INSTITUTE OF THE FINNISH ECONOMY
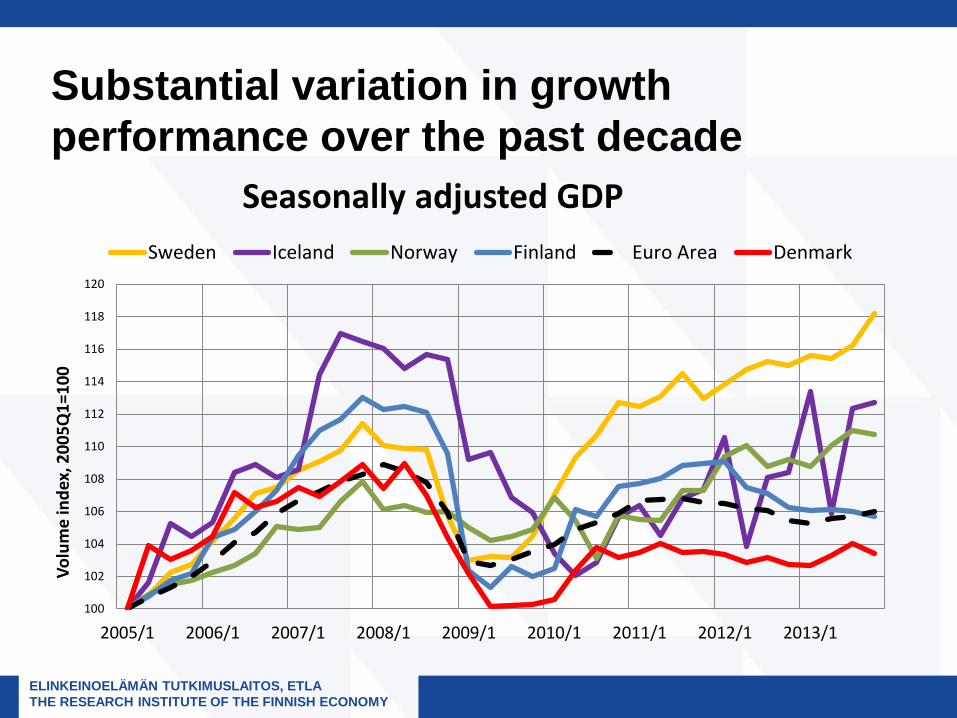
Substantial variation in growth performance over the past decade
100
102
104
106
108
110
112
114
116
118
120
2005/1 2006/1 2007/1 2008/1 2009/1 2010/1 2011/1 2012/1 2013/1
Volu
me
inde
x, 2
005Q
1=10
0
Seasonally adjusted GDP Sweden Iceland Norway Finland Euro Area Denmark
ELINKEINOELÄMÄN TUTKIMUSLAITOS, ETLA THE RESEARCH INSTITUTE OF THE FINNISH ECONOMY
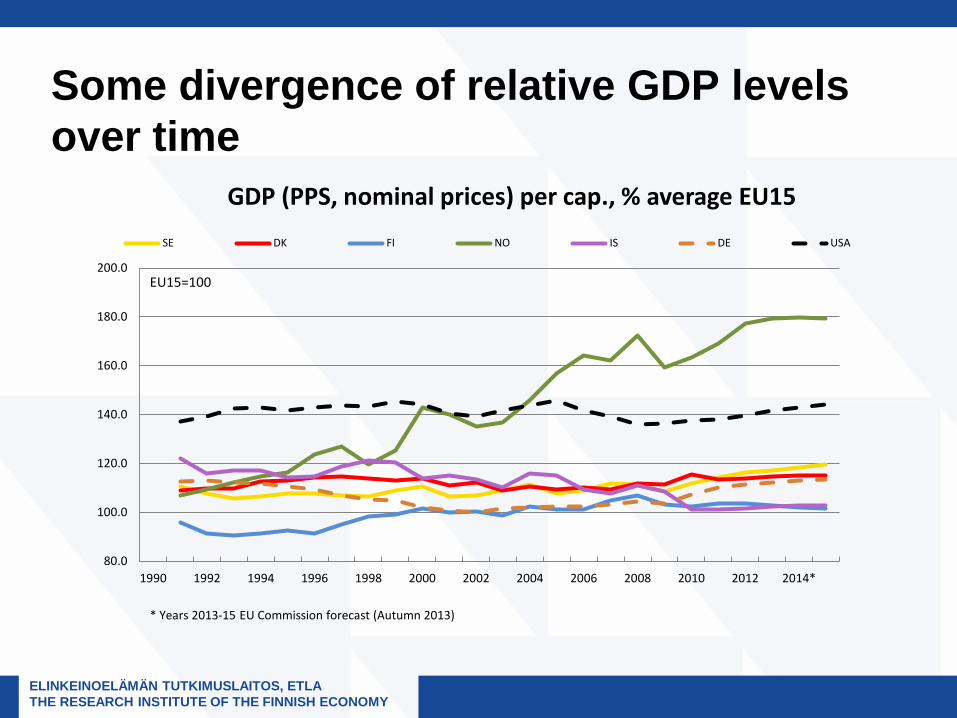
Some divergence of relative GDP levels over time
80.0
100.0
120.0
140.0
160.0
180.0
200.0
1990 1992 1994 1996 1998 2000 2002 2004 2006 2008 2010 2012 2014*
GDP (PPS, nominal prices) per cap., % average EU15 SE DK FI NO IS DE USA
* Years 2013-15 EU Commission forecast (Autumn 2013)
EU15=100
ELINKEINOELÄMÄN TUTKIMUSLAITOS, ETLA THE RESEARCH INSTITUTE OF THE FINNISH ECONOMY
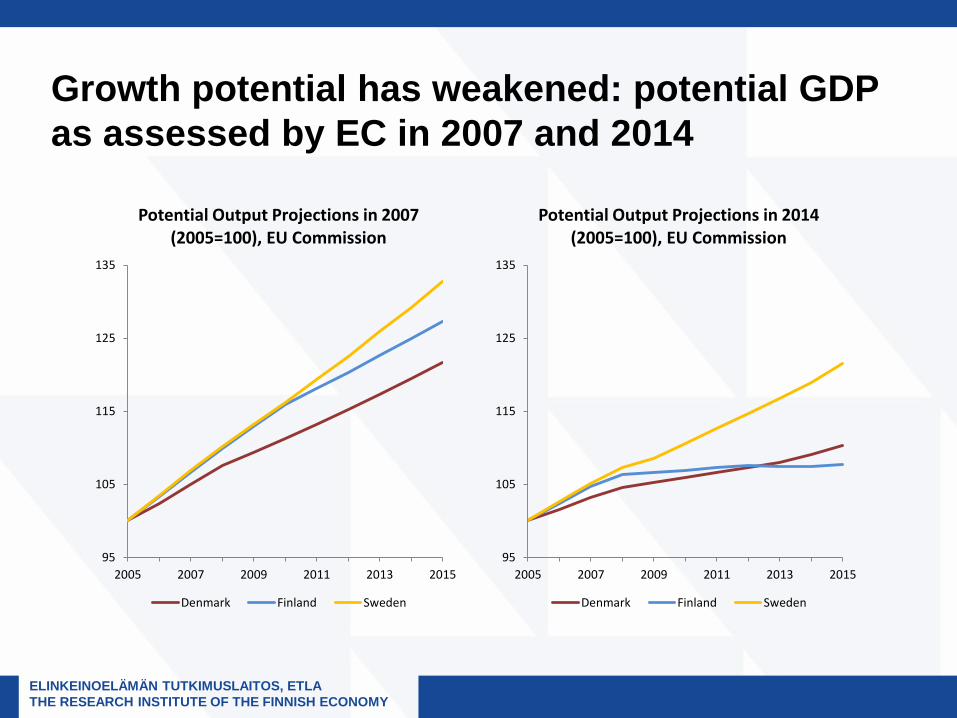
Growth potential has weakened: potential GDP as assessed by EC in 2007 and 2014
95
105
115
125
135
2005 2007 2009 2011 2013 2015
Potential Output Projections in 2007 (2005=100), EU Commission
Denmark Finland Sweden
95
105
115
125
135
2005 2007 2009 2011 2013 2015
Potential Output Projections in 2014 (2005=100), EU Commission
Denmark Finland Sweden
ELINKEINOELÄMÄN TUTKIMUSLAITOS, ETLA THE RESEARCH INSTITUTE OF THE FINNISH ECONOMY
The Nordic approach to productivity • Openness to trade: making the most of
comparative advantage, embracing competition • Acceptance of “creative destruction”; little efforts to
save existing companies, “national champions” • Extensive public investments in human capital and
innovation • Red tape on businesses limited/moderate • Good infrastructure • Competitive corporate tax systems, dual income
taxation to spur capital formation

ELINKEINOELÄMÄN TUTKIMUSLAITOS, ETLA THE RESEARCH INSTITUTE OF THE FINNISH ECONOMY
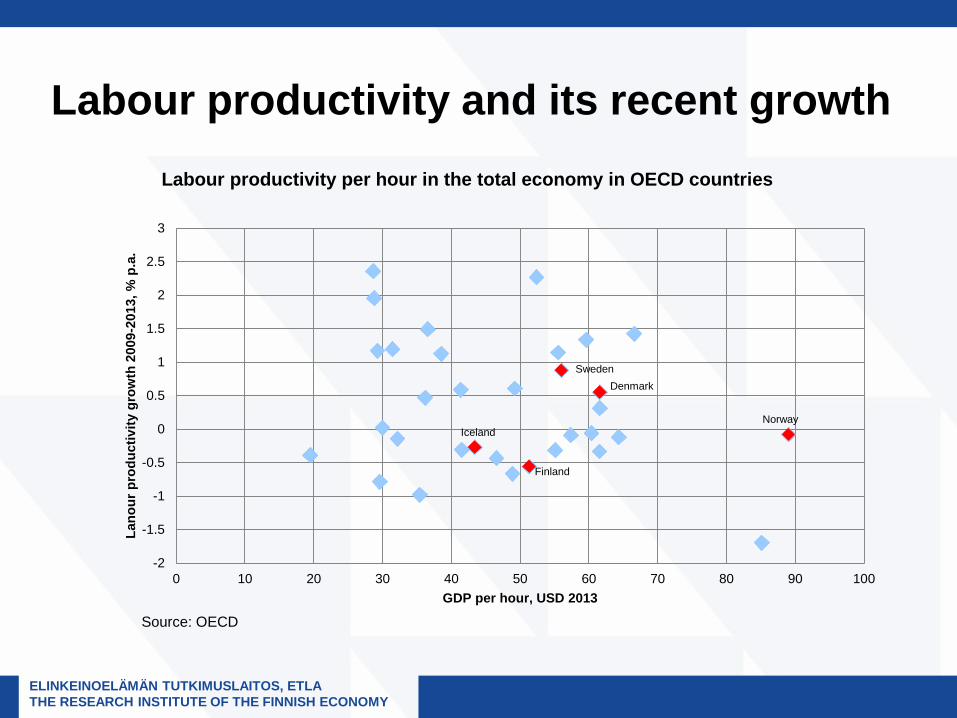
The approach is very much in line with the OECD recommendations. But is it delivering? • Total economy productivity has been reasonably good but
not at the top • Recent productivity growth has been more mediocre or
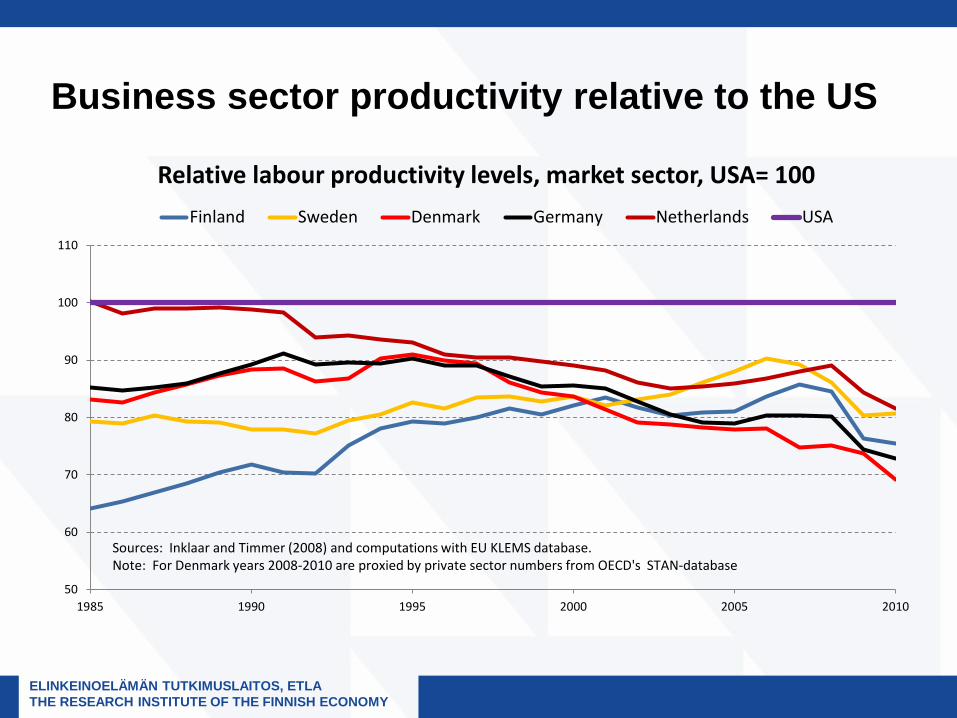
even weak • Considerable variation among the Nordics • All the Nordics have started to lag further behind the USA
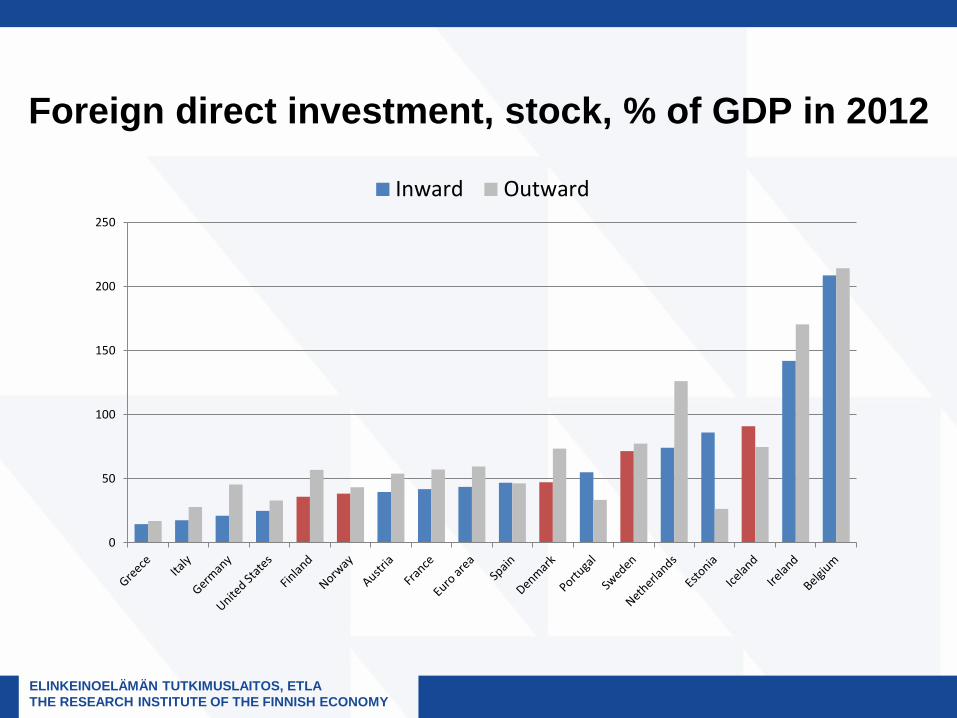
in business sector productivity • The attractiveness of the Nordics as a destination of FDI
not at the top and varies across the countries – Level: FI, NO below average – Recent growth: FI, DEN below average
• Are the Nordics or some of them underperforming?
ELINKEINOELÄMÄN TUTKIMUSLAITOS, ETLA THE RESEARCH INSTITUTE OF THE FINNISH ECONOMY
Labour productivity and its recent growth
-2
-1.5
-1
-0.5
0
0.5
1
1.5
2
2.5
3
0 10 20 30 40 50 60 70 80 90 100
Lano
ur p
rodu
ctiv
ity g
row
th 2
009-
2013
, % p
.a.
GDP per hour, USD 2013
Labour productivity per hour in the total economy in OECD countries
Denmark
Finland
Iceland Norway
Sweden
Source: OECD
ELINKEINOELÄMÄN TUTKIMUSLAITOS, ETLA THE RESEARCH INSTITUTE OF THE FINNISH ECONOMY
Business sector productivity relative to the US
50
60
70
80
90
100
110
1985 1990 1995 2000 2005 2010
Relative labour productivity levels, market sector, USA= 100 Finland Sweden Denmark Germany Netherlands USA
Sources: Inklaar and Timmer (2008) and computations with EU KLEMS database. Note: For Denmark years 2008-2010 are proxied by private sector numbers from OECD's STAN-database
ELINKEINOELÄMÄN TUTKIMUSLAITOS, ETLA THE RESEARCH INSTITUTE OF THE FINNISH ECONOMY
Foreign direct investment, stock, % of GDP in 2012
0
50
100
150
200
250
Inward Outward

ELINKEINOELÄMÄN TUTKIMUSLAITOS, ETLA THE RESEARCH INSTITUTE OF THE FINNISH ECONOMY
Potential problems 1. Are incentives for effort and risk-taking sufficient? 2. Can the Nordics keep and attract innovative talents? 3. Are the labour and product market institutions flexible
enough to facilitate structural change? 4. Can popular support for creative destruction be
maintained in the context of continued labour market polarisation and widening income/wealth disparities?
5. Can the Nordics cope with the innovation needs on a broad enough basis or are they forced to specialise in a way that makes them very vulnerable?

ELINKEINOELÄMÄN TUTKIMUSLAITOS, ETLA THE RESEARCH INSTITUTE OF THE FINNISH ECONOMY
Incentives, attractiveness as entrepreneurial environment • The outcomes likely to depend on the “package”, rather than
individual elements • Taxes are not wholly out of line and in part compensated by
– Risk-sharing arrangements, efficient, non-corrupt administrations and public services, functioning infrastructure
– Also: liberal attitudes, lack of corruption, trust, general work ethics – Relative predictability of policy (consensus approach)
• Labour and product market flexibility neither best nor worst • Anyway, there are several margins on which to improve
– Improved efficiency of the public sector: less tax pressure – More robust and growth-friendly tax structures – Flexibility of wage formation, labour mobility
ELINKEINOELÄMÄN TUTKIMUSLAITOS, ETLA THE RESEARCH INSTITUTE OF THE FINNISH ECONOMY
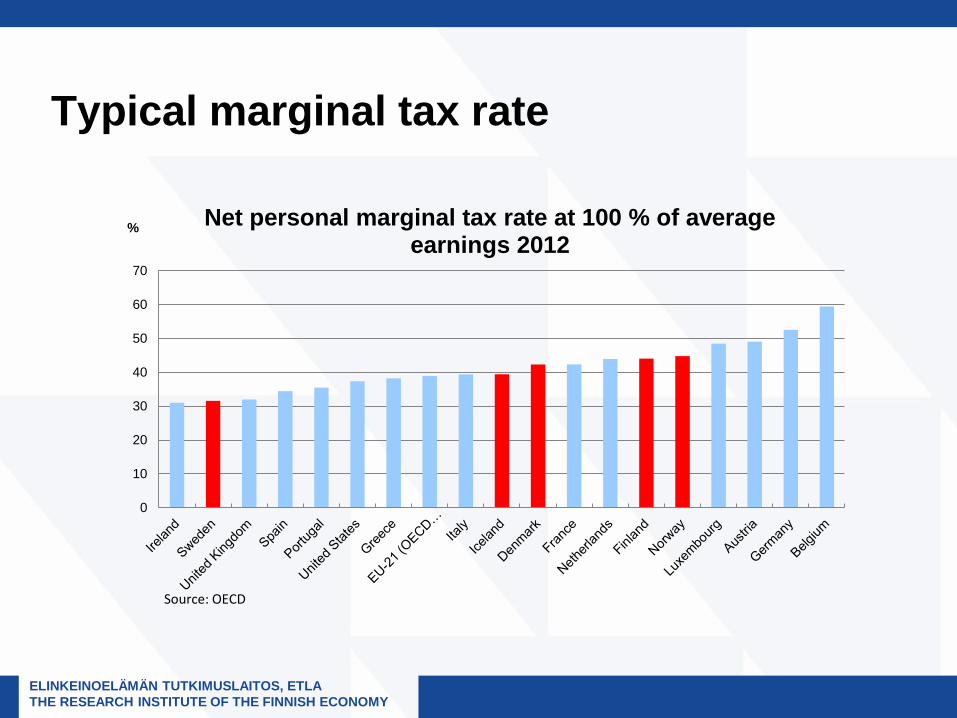
Typical marginal tax rate
0
10
20
30
40
50
60
70
% Net personal marginal tax rate at 100 % of average earnings 2012
Source: OECD
ELINKEINOELÄMÄN TUTKIMUSLAITOS, ETLA THE RESEARCH INSTITUTE OF THE FINNISH ECONOMY
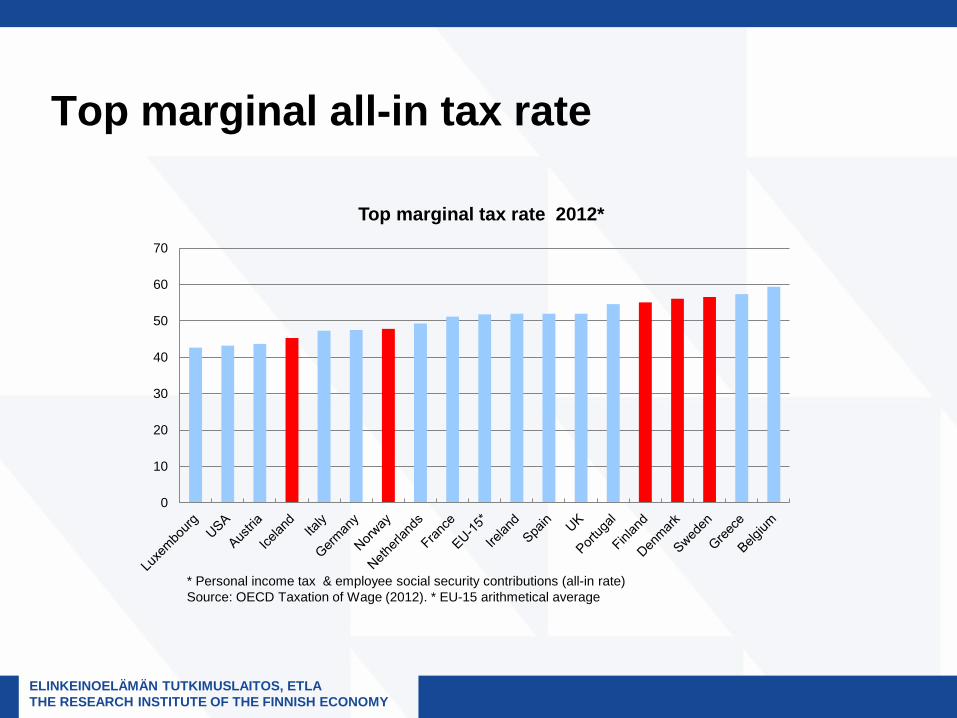
Top marginal all-in tax rate
0
10
20
30
40
50
60
70
Top marginal tax rate 2012*
* Personal income tax & employee social security contributions (all-in rate) Source: OECD Taxation of Wage (2012). * EU-15 arithmetical average
ELINKEINOELÄMÄN TUTKIMUSLAITOS, ETLA THE RESEARCH INSTITUTE OF THE FINNISH ECONOMY
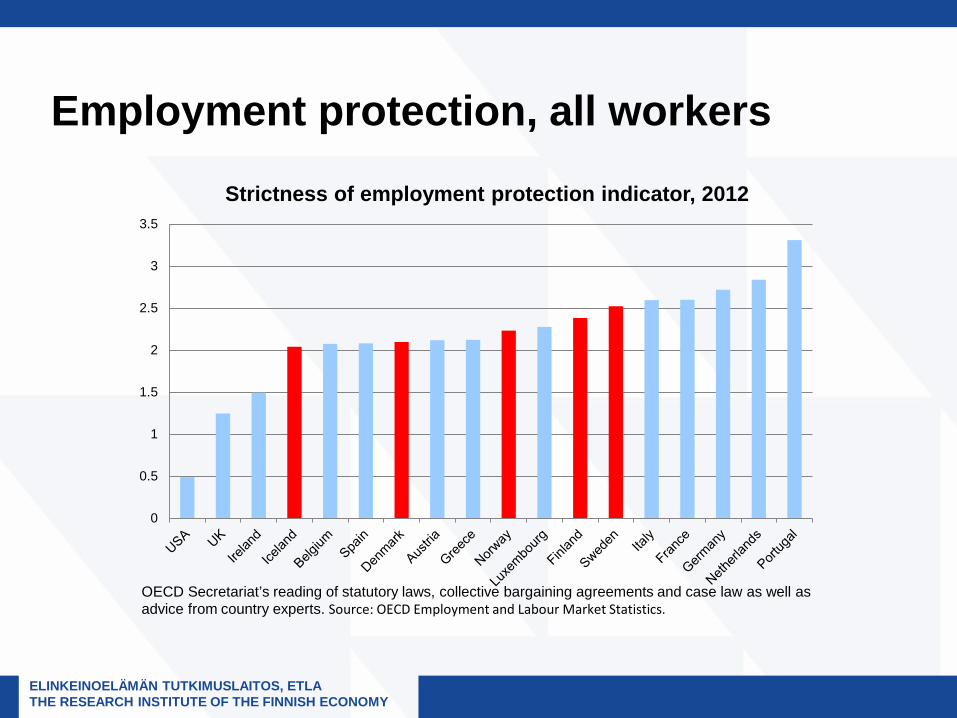
Employment protection, all workers
0
0.5
1
1.5
2
2.5
3
3.5
Strictness of employment protection indicator, 2012
OECD Secretariat’s reading of statutory laws, collective bargaining agreements and case law as well as advice from country experts. Source: OECD Employment and Labour Market Statistics.
ELINKEINOELÄMÄN TUTKIMUSLAITOS, ETLA THE RESEARCH INSTITUTE OF THE FINNISH ECONOMY
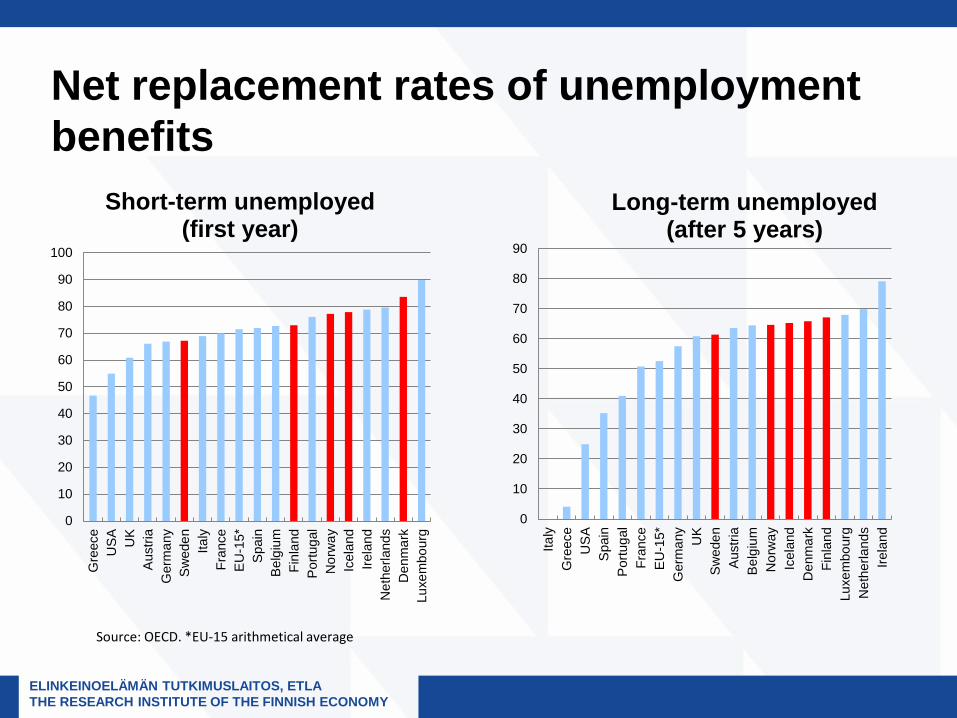
Net replacement rates of unemployment benefits
0
10
20
30
40
50
60
70
80
90
100
Gre
ece
US
AU
KA
ustri
aG
erm
any
Sw
eden
Italy
Fran
ceE
U-1
5*S
pain
Bel
gium
Finl
and
Por
tuga
lN
orw
ayIc
elan
dIre
land
Net
herla
nds
Den
mar
kLu
xem
bour
g
Short-term unemployed (first year)
0
10
20
30
40
50
60
70
80
90
Italy
Gre
ece
US
AS
pain
Por
tuga
lFr
ance
EU
-15*
Ger
man
yU
KS
wed
enA
ustri
aB
elgi
umN
orw
ayIc
elan
dD
enm
ark
Finl
and
Luxe
mbo
urg
Net
herla
nds
Irela
nd
Long-term unemployed (after 5 years)
Source: OECD. *EU-15 arithmetical average
ELINKEINOELÄMÄN TUTKIMUSLAITOS, ETLA THE RESEARCH INSTITUTE OF THE FINNISH ECONOMY
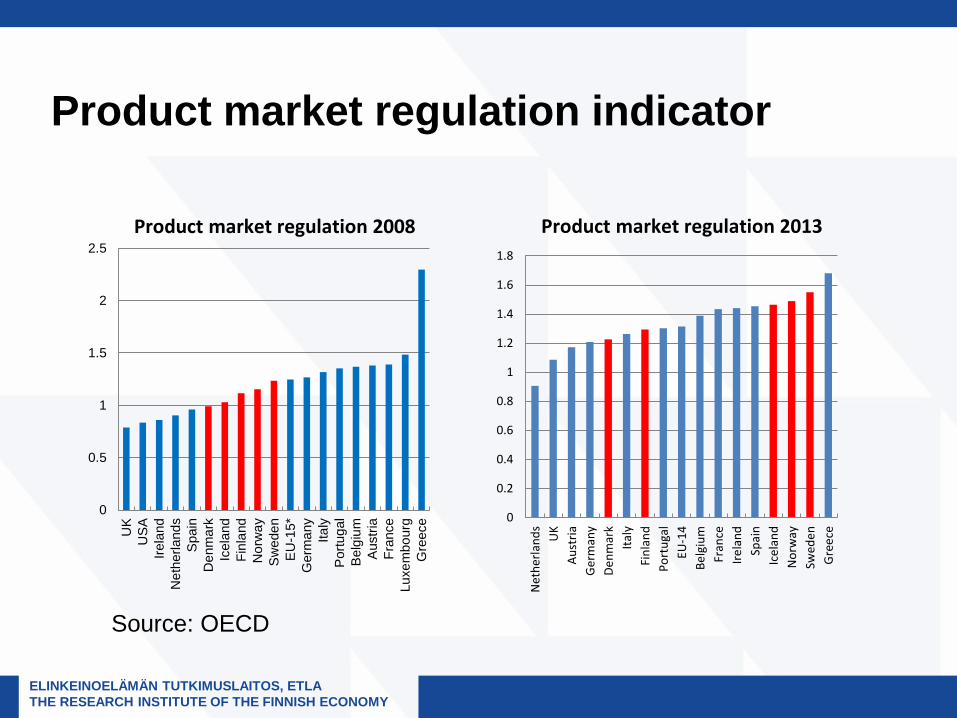
Product market regulation indicator
0
0.5
1
1.5
2
2.5
UK
US
AIre
land
Net
herla
nds
Spa
inD
enm
ark
Icel
and
Finl
and
Nor
way
Sw
eden
EU
-15*
Ger
man
yIta
lyP
ortu
gal
Bel
gium
Aus
tria
Fran
ceLu
xem
bour
gG
reec
e
Product market regulation 2008
0
0.2
0.4
0.6
0.8
1
1.2
1.4
1.6
1.8
Net
herla
nds
UK
Aust
riaG
erm
any
Denm
ark
Italy
Finl
and
Port
ugal
EU-1
4Be
lgiu
mFr
ance
Irela
ndSp
ain
Icel
and
Nor
way
Swed
enG
reec
e
Product market regulation 2013
Source: OECD

ELINKEINOELÄMÄN TUTKIMUSLAITOS, ETLA THE RESEARCH INSTITUTE OF THE FINNISH ECONOMY
Acceptance of structural change • Facilitating factors
– Good basic education, extensive adult education – Generous support for those in need of adjustment (incl. ALMP) – Experience of widely shared benefits of productivity-enhancing
structural change
• Potential fault lines going forward – Strong polarisation of the job market, income disparities – Persistent unemployment (particularly skilled)
• Useful policy responses – More efforts to competence building in general and in the early
years of life in particular – Evidence-based refining the flexicurity approach
ELINKEINOELÄMÄN TUTKIMUSLAITOS, ETLA THE RESEARCH INSTITUTE OF THE FINNISH ECONOMY
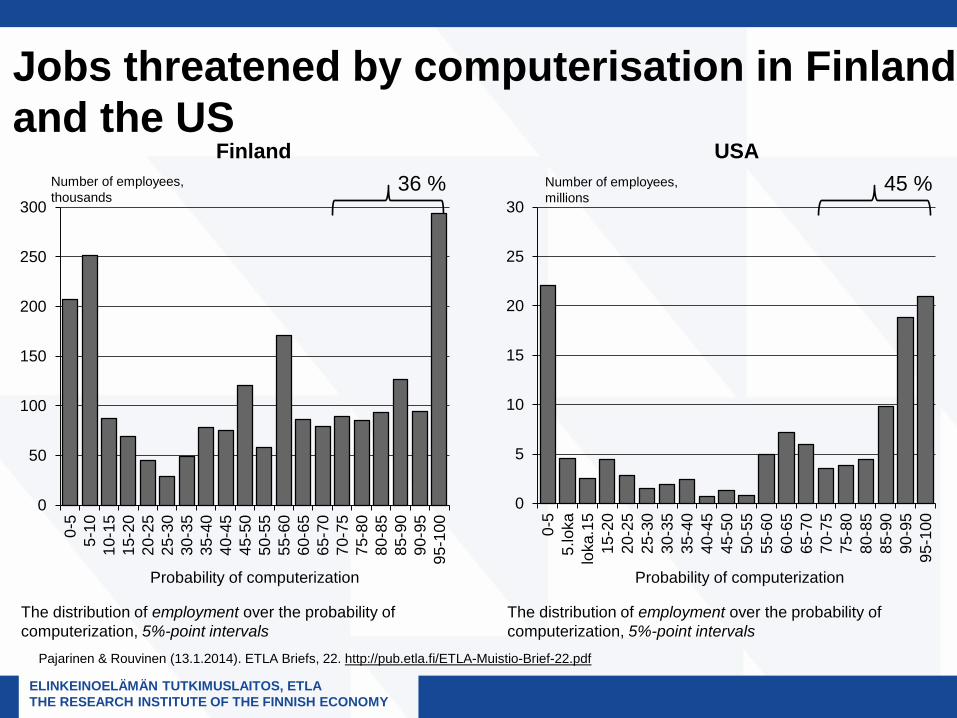
Jobs threatened by computerisation in Finland and the US
Pajarinen & Rouvinen (13.1.2014). ETLA Briefs, 22. http://pub.etla.fi/ETLA-Muistio-Brief-22.pdf
36 %
0
50
100
150
200
250
300
0-5
5-10
10-1
515
-20
20-2
525
-30
30-3
535
-40
40-4
545
-50
50-5
555
-60
60-6
565
-70
70-7
575
-80
80-8
585
-90
90-9
595
-100
The distribution of employment over the probability of computerization, 5%-point intervals
Finland 45 %
0
5
10
15
20
25
30
0-5
5.lo
kalo
ka.1
515
-20
20-2
525
-30
30-3
535
-40
40-4
545
-50
50-5
555
-60
60-6
565
-70
70-7
575
-80
80-8
585
-90
90-9
595
-100
The distribution of employment over the probability of computerization, 5%-point intervals
USA
Probability of computerization Probability of computerization
Number of employees, thousands
Number of employees, millions
ELINKEINOELÄMÄN TUTKIMUSLAITOS, ETLA THE RESEARCH INSTITUTE OF THE FINNISH ECONOMY
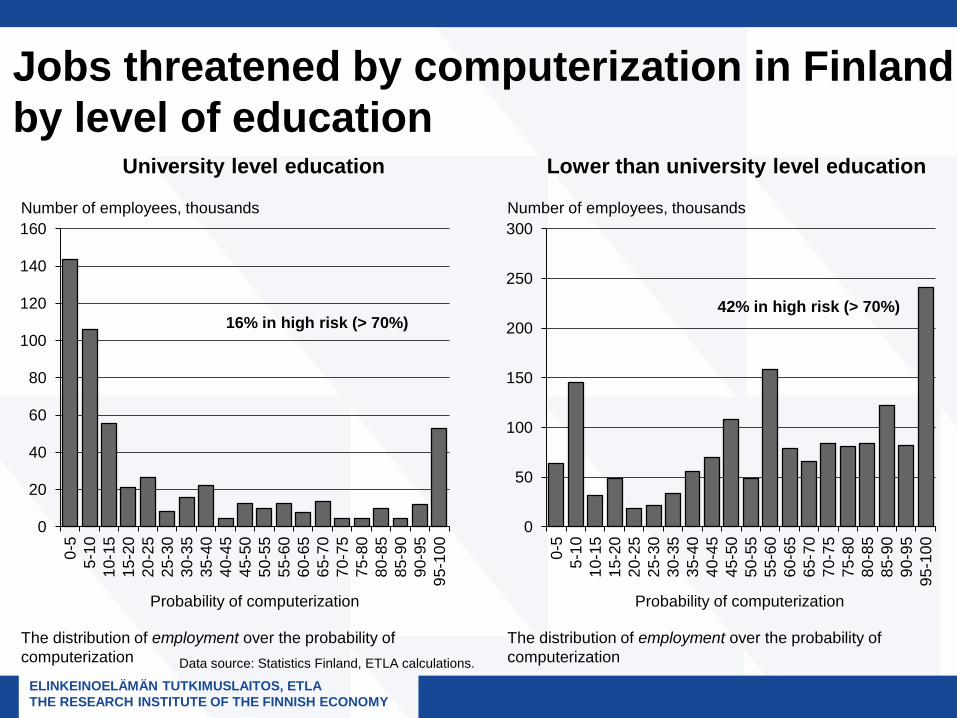
Jobs threatened by computerization in Finland by level of education
Data source: Statistics Finland, ETLA calculations.
0
20
40
60
80
100
120
140
160
0-5
5-10
10-1
515
-20
20-2
525
-30
30-3
535
-40
40-4
545
-50
50-5
555
-60
60-6
565
-70
70-7
575
-80
80-8
585
-90
90-9
595
-100
The distribution of employment over the probability of computerization
University level education
0
50
100
150
200
250
300
0-5
5-10
10-1
515
-20
20-2
525
-30
30-3
535
-40
40-4
545
-50
50-5
555
-60
60-6
565
-70
70-7
575
-80
80-8
585
-90
90-9
595
-100
The distribution of employment over the probability of computerization
Lower than university level education
Number of employees, thousands Number of employees, thousands
16% in high risk (> 70%) 42% in high risk (> 70%)
Probability of computerization Probability of computerization
ELINKEINOELÄMÄN TUTKIMUSLAITOS, ETLA THE RESEARCH INSTITUTE OF THE FINNISH ECONOMY
The vulnerability of the small economies close to the technology frontier?
• Potential problem: small specialised economies could be vulnerable to radical disruptions in cutting-edge technology and strategic choices of multinationals – Example: Finland and Nokia
• Are the Nordics highly specialised? Yes and no • Are they dependent on a few large companies? Yes, but
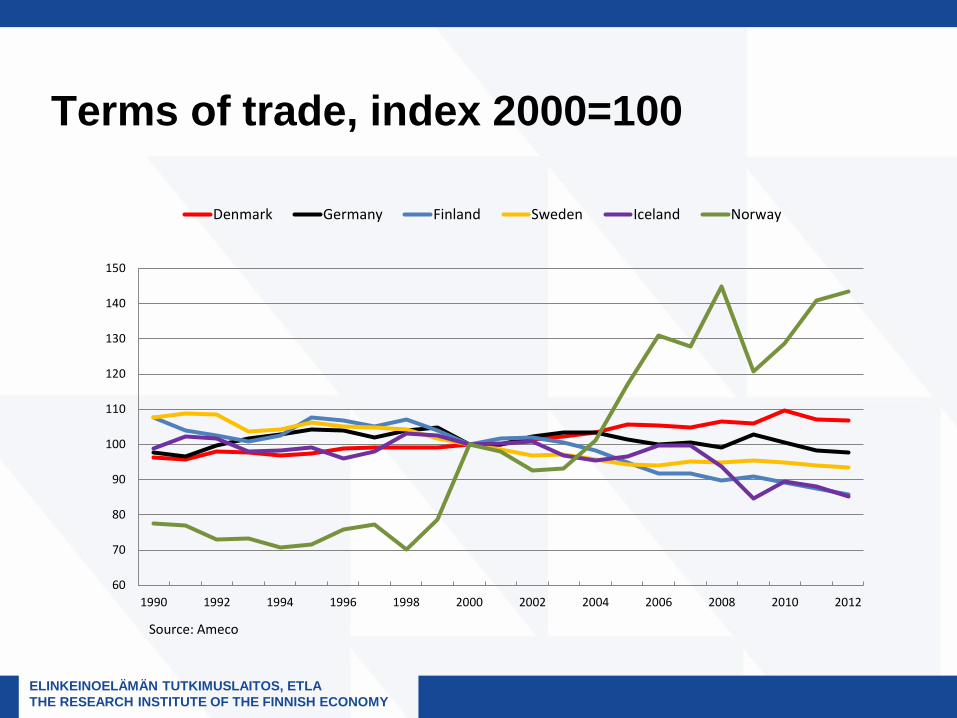
not in the same degree • Can a good terms of trade development compensate for
weak productivity growth? One should not trust that
ELINKEINOELÄMÄN TUTKIMUSLAITOS, ETLA THE RESEARCH INSTITUTE OF THE FINNISH ECONOMY
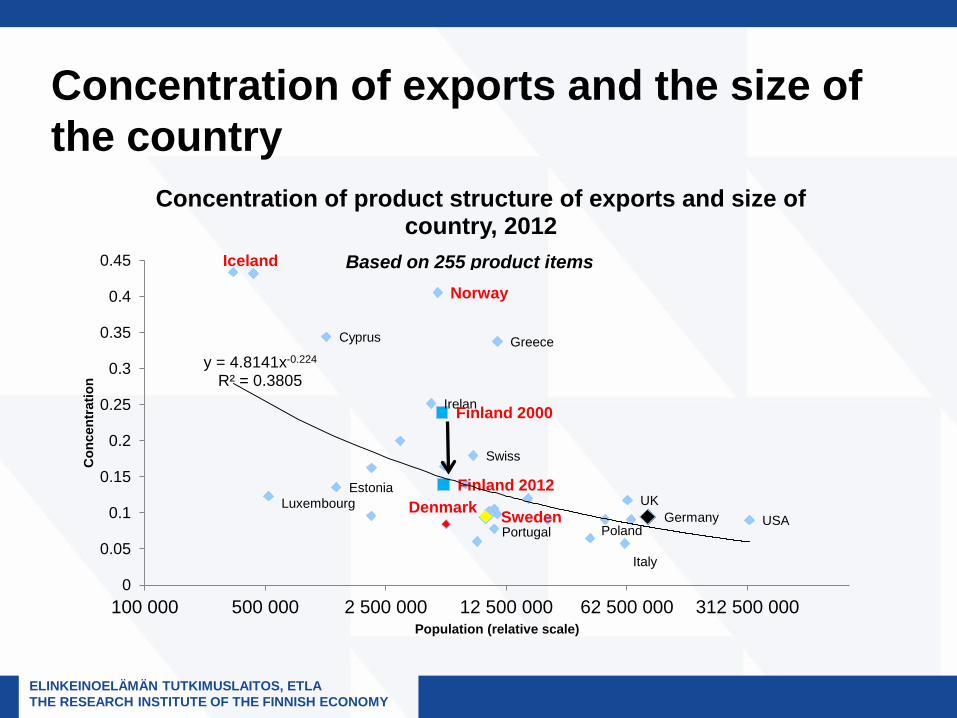
Concentration of exports and the size of the country
Cyprus
Denmark Estonia Finland 2012
Germany
Greece
Iceland
Irelan
Italy
Luxembourg
Norway
Poland Portugal Sweden
Swiss
UK USA
Finland 2000
y = 4.8141x-0.224 R² = 0.3805
0
0.05
0.1
0.15
0.2
0.25
0.3
0.35
0.4
0.45
100 000 500 000 2 500 000 12 500 000 62 500 000 312 500 000
Con
cent
ratio
n
Population (relative scale)
Concentration of product structure of exports and size of country, 2012
Based on 255 product items
ELINKEINOELÄMÄN TUTKIMUSLAITOS, ETLA THE RESEARCH INSTITUTE OF THE FINNISH ECONOMY
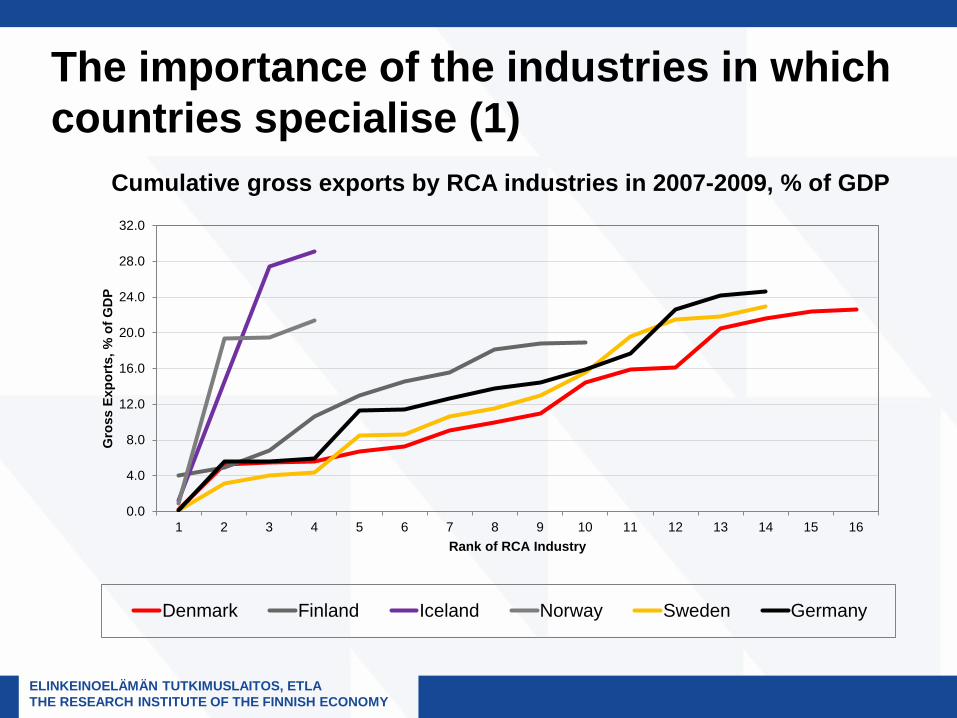
The importance of the industries in which countries specialise (1)
0.0
4.0
8.0
12.0
16.0
20.0
24.0
28.0
32.0
1 2 3 4 5 6 7 8 9 10 11 12 13 14 15 16
Gro
ss E
xpor
ts, %
of G
DP
Rank of RCA Industry
Denmark Finland Iceland Norway Sweden Germany
Cumulative gross exports by RCA industries in 2007-2009, % of GDP
ELINKEINOELÄMÄN TUTKIMUSLAITOS, ETLA THE RESEARCH INSTITUTE OF THE FINNISH ECONOMY
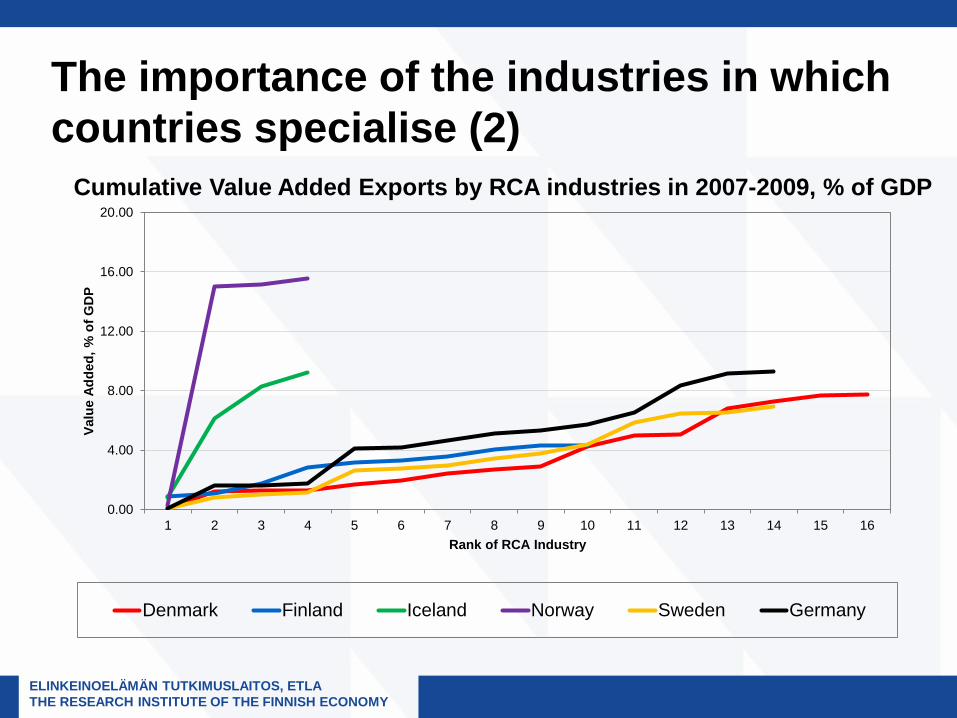
The importance of the industries in which countries specialise (2)
Cumulative Value Added Exports by RCA industries in 2007-2009, % of GDP
0.00
4.00
8.00
12.00
16.00
20.00
1 2 3 4 5 6 7 8 9 10 11 12 13 14 15 16
Valu
e Ad
ded,
% o
f GD
P
Rank of RCA Industry
Denmark Finland Iceland Norway Sweden Germany
ELINKEINOELÄMÄN TUTKIMUSLAITOS, ETLA THE RESEARCH INSTITUTE OF THE FINNISH ECONOMY
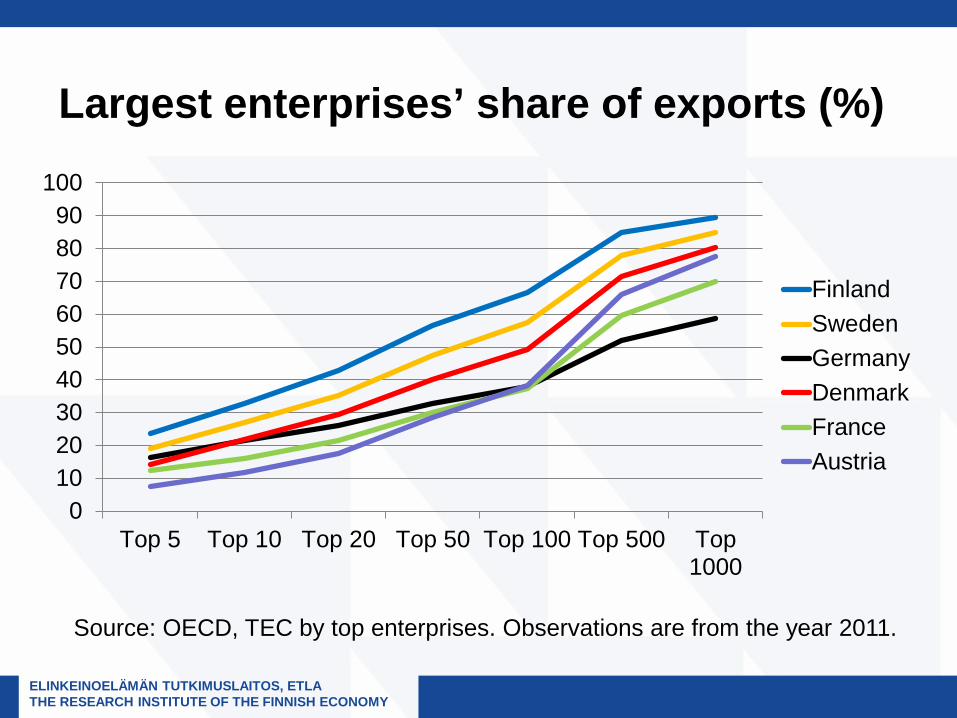
Largest enterprises’ share of exports (%)
0102030405060708090
100
Top 5 Top 10 Top 20 Top 50 Top 100 Top 500 Top1000
FinlandSwedenGermanyDenmarkFranceAustria
Source: OECD, TEC by top enterprises. Observations are from the year 2011.
ELINKEINOELÄMÄN TUTKIMUSLAITOS, ETLA THE RESEARCH INSTITUTE OF THE FINNISH ECONOMY
Terms of trade, index 2000=100
60
70
80
90
100
110
120
130
140
150
1990 1992 1994 1996 1998 2000 2002 2004 2006 2008 2010 2012
Denmark Germany Finland Sweden Iceland Norway
Source: Ameco
ELINKEINOELÄMÄN TUTKIMUSLAITOS, ETLA THE RESEARCH INSTITUTE OF THE FINNISH ECONOMY
Ways to support innovation without taking excessive risks • Difficult to see a sensible alternative to a neutral policy
approach of not picking winners, emphasis on competition • Nevertheless some choices in the use of scarce public
resources necessary – Existing areas of strength have already passed a market test – Support development of general purpose technology rather than
very specific applications
• Support entrepreneurial ecosystems – Incubators, start-up programmes, cluster programmes – Development of domestic capital markets to provide an alternative
for foreign takeovers too early
• Co-operation between national funding agencies?
ELINKEINOELÄMÄN TUTKIMUSLAITOS, ETLA THE RESEARCH INSTITUTE OF THE FINNISH ECONOMY
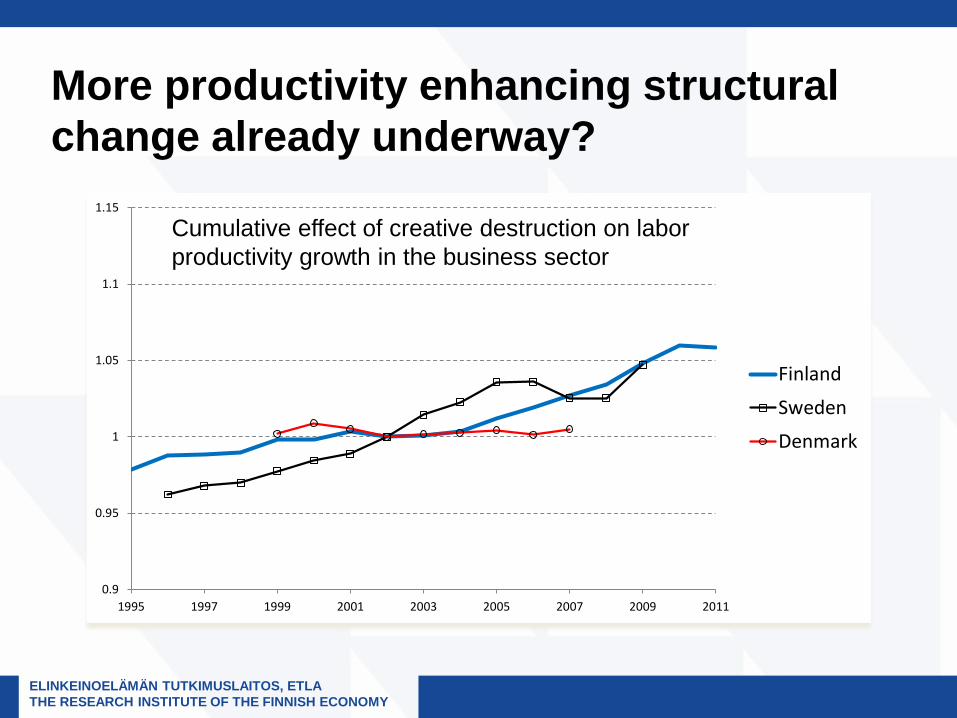
More productivity enhancing structural change already underway?
0.9
0.95
1
1.05
1.1
1.15
1995 1997 1999 2001 2003 2005 2007 2009 2011
Finland
Sweden
Denmark
Cumulative effect of creative destruction on labor productivity growth in the business sector

ELINKEINOELÄMÄN TUTKIMUSLAITOS, ETLA THE RESEARCH INSTITUTE OF THE FINNISH ECONOMY
Concluding remarks
• The Nordics’ point of departure to achieve high productivity is in many ways good
• But they have not performed recently quite as well as one might have expected and face challenges going forward
• There is potential to improve framework conditions • Key issue: maintenance of acceptance/support for
structural change to fully utilize the existing strengths