Embed Size (px)
Citation preview
Achieving 100% Renewable
Energy (Off-Grid) for Residential
Hawaii with Solar Energy + Multi-
Storage1st Published in Renewable Energy World Aug. 2, 2017
Then Presented at Solar Power International Sept. 11, 2017 Mandalay Bay Las
Vegas, NV
Now Oct 20, 2017 AVS Sponsored West Coast Junction Users Group Meeting
Then Nov 15th at the Photovoltaic Science &Engineering Conference,
John Borland, J.O.B. Technologies, 98-1204 Kuawa St, Aiea, HI 96701
Jay Moore & Corpuz Poncho, Poncho’s Solar, 2669 Kilihau St, Honolulu, HI 96819
Takahiro Tanaka & Harumi McClure, Tabuchi Electric, 5225 Hellyer Ave, suite 150, San
Jose, CA 95138J.O.B. Technologies (Strategic
Marketing, Sales &
Technology)
1
Puerto Rico Hurricane Lose Of Centralized Grid Power Lines
For Months To Remote Areas Shows The Critical Need For
Residential Standalone Solar Energy + Multi-Storage For Off-
Grid Operation This Will Save Lives. Tesla’s Grid-Scale Solar
+ Battery Farm Requires Homes To Be Grid-Tied And Battery
Completely Drained By 9PM After 4 Hours!
J.O.B. Technologies (Strategic
Marketing, Sales &
Technology)
2
Tabuchi Electric America
Donates Solar-Plus-
Storage Solutions to Help
Puerto Rico and the
Caribbean Islands
Accelerate Power
Restoration
October 16, 2017 01:28 PM
Eastern Daylight Time
*With single battery
storage I achieved 12+
days a month Off-Grid
since April 2017.
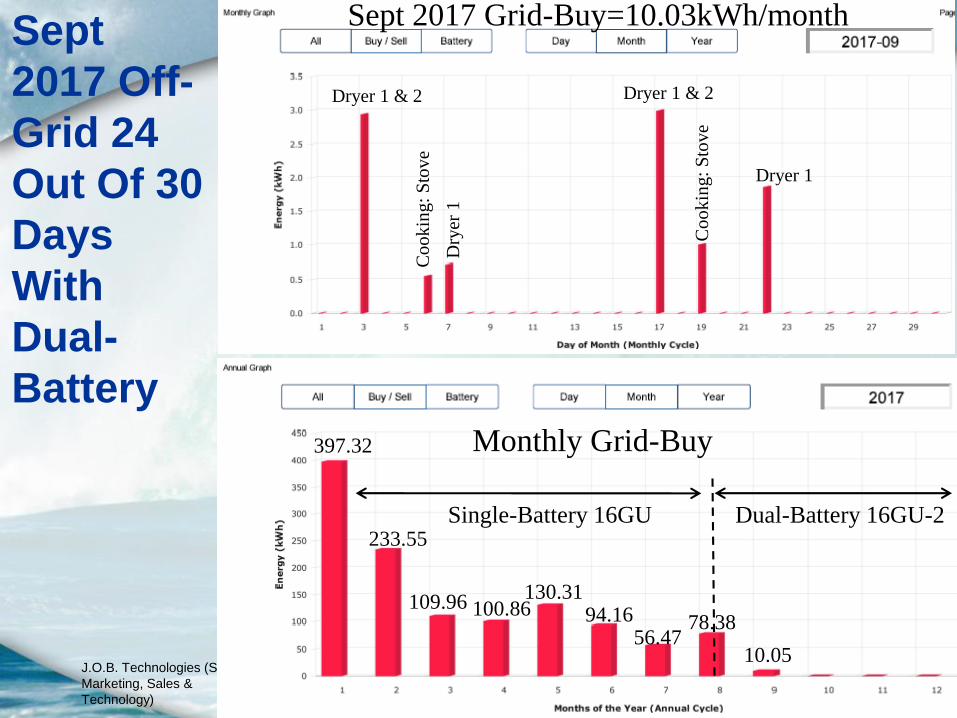
*With dual battery
storage I achieved 24+
days a month Off-Grid
since Sept 2017.
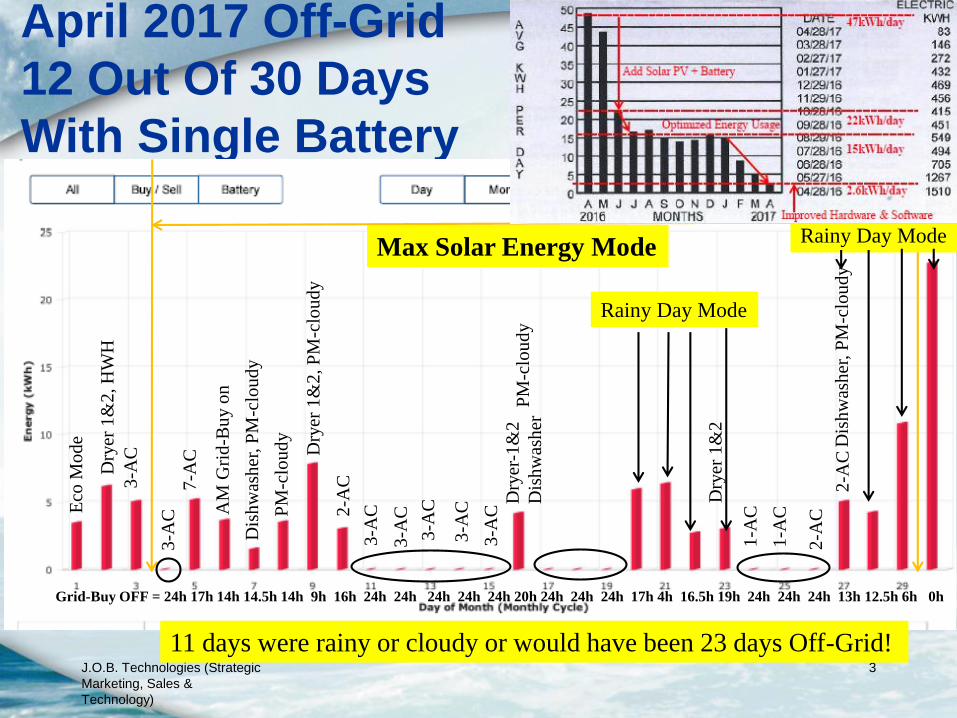
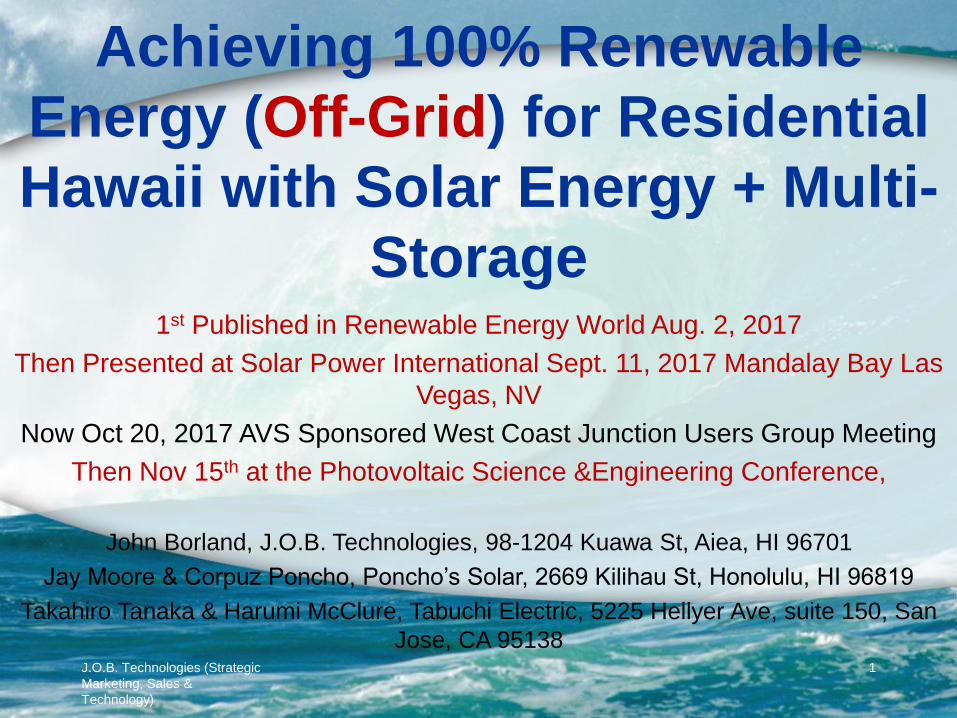
April 2017 Off-Grid
12 Out Of 30 Days
With Single Battery
J.O.B. Technologies (Strategic
Marketing, Sales &
Technology)
3
Max Solar Energy Mode
Grid-Buy OFF = 24h 17h 14h 14.5h 14h 9h 16h 24h 24h 24h 24h 24h 20h 24h 24h 24h 17h 4h 16.5h 19h 24h 24h 24h 13h 12.5h 6h 0h
Eco
Mo
de
Dry
er 1
&2
, H
WH
3-A
C
3-A
C
7-A
C
AM
Gri
d-B
uy o
n
Dis
hw
ash
er, P
M-c
lou
dy
PM
-clo
ud
y
Dry
er 1
&2
, P
M-c
lou
dy
2-A
C
3-A
C
Dry
er 1
&2
Rainy Day Mode
3-A
C
3-A
C
3-A
C
3-A
C
Dry
er-1
&2
Dis
hw
ash
erP
M-c
lou
dy
1-A
C
1-A
C
2-A
C
2-A
CD
ish
was
her
, P
M-c
lou
dy
Rainy Day Mode
11 days were rainy or cloudy or would have been 23 days Off-Grid!
J.O.B. Technologies (Strategic
Marketing, Sales &
Technology)
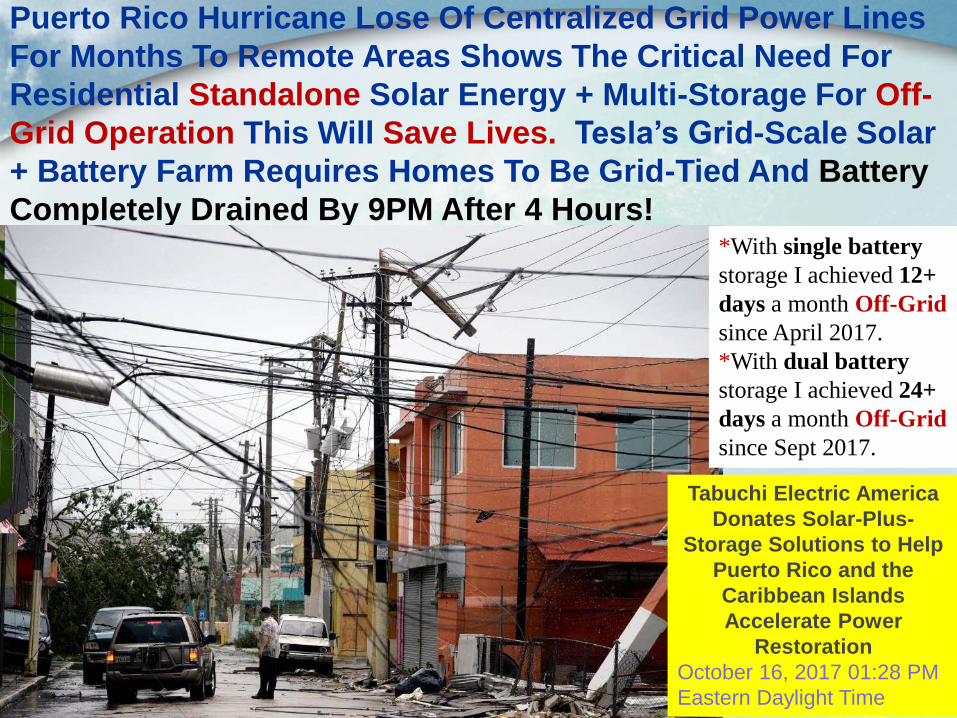
410.05
78.3856.47
94.16130.31
100.86109.96
233.55
397.32
Dryer 1 & 2 Dryer 1 & 2
Dryer 1
Monthly Grid-Buy
Sept 2017 Grid-Buy=10.03kWh/month
Dry
er 1
Co
ok
ing:
Sto
ve
Co
ok
ing:
Sto
ve
Sept
2017 Off-
Grid 24
Out Of 30
Days
With
Dual-
Battery
Single-Battery 16GU Dual-Battery 16GU-2
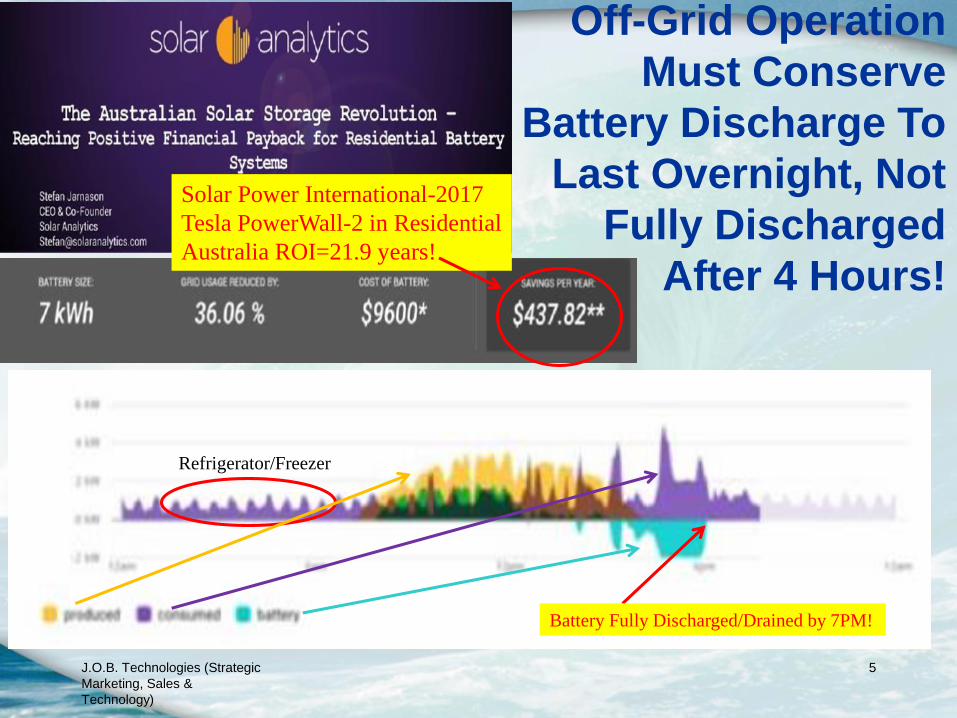
Off-Grid Operation
Must Conserve
Battery Discharge To
Last Overnight, Not
Fully Discharged
After 4 Hours!
J.O.B. Technologies (Strategic
Marketing, Sales &
Technology)
5
Refrigerator/Freezer
Battery Fully Discharged/Drained by 7PM!
Solar Power International-2017
Tesla PowerWall-2 in Residential
Australia ROI=21.9 years!
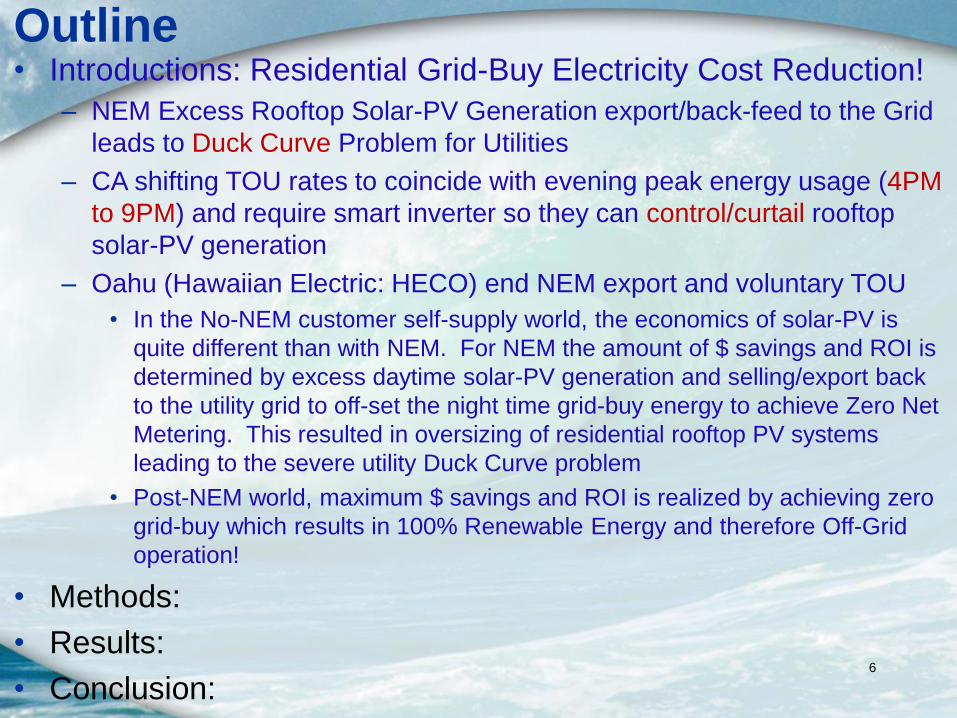
Outline• Introductions: Residential Grid-Buy Electricity Cost Reduction!
– NEM Excess Rooftop Solar-PV Generation export/back-feed to the Grid
leads to Duck Curve Problem for Utilities
– CA shifting TOU rates to coincide with evening peak energy usage (4PM
to 9PM) and require smart inverter so they can control/curtail rooftop
solar-PV generation
– Oahu (Hawaiian Electric: HECO) end NEM export and voluntary TOU
• In the No-NEM customer self-supply world, the economics of solar-PV is
quite different than with NEM. For NEM the amount of $ savings and ROI is
determined by excess daytime solar-PV generation and selling/export back
to the utility grid to off-set the night time grid-buy energy to achieve Zero Net
Metering. This resulted in oversizing of residential rooftop PV systems
leading to the severe utility Duck Curve problem
• Post-NEM world, maximum $ savings and ROI is realized by achieving zero
grid-buy which results in 100% Renewable Energy and therefore Off-Grid
operation!
• Methods:
• Results:
• Conclusion:6
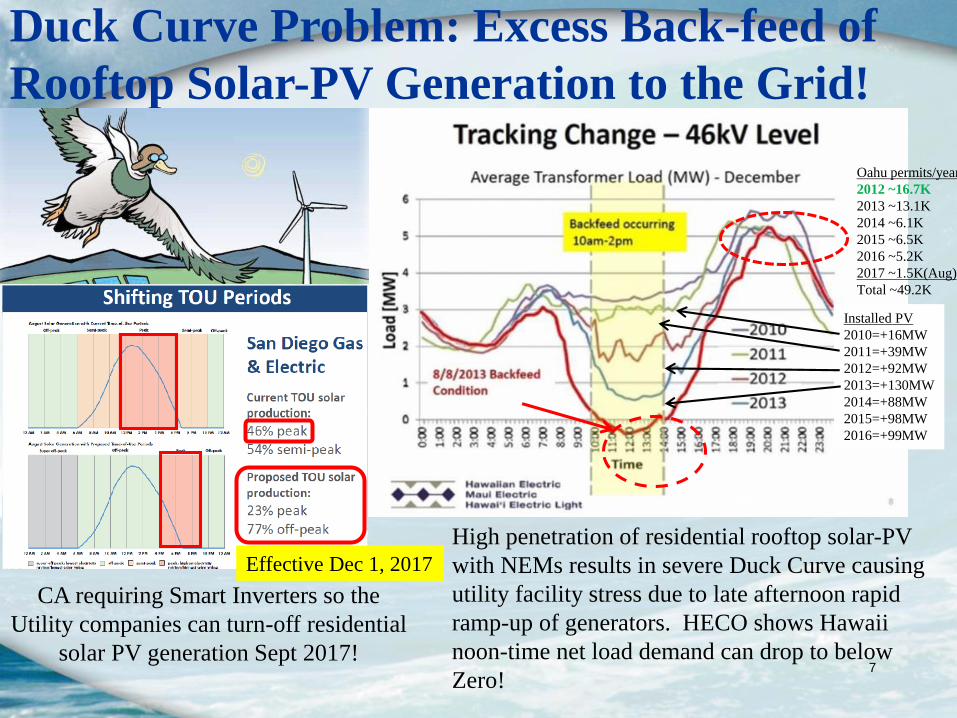
Duck Curve Problem: Excess Back-feed of
Rooftop Solar-PV Generation to the Grid!
7
CA requiring Smart Inverters so the
Utility companies can turn-off residential
solar PV generation Sept 2017!
High penetration of residential rooftop solar-PV
with NEMs results in severe Duck Curve causing
utility facility stress due to late afternoon rapid
ramp-up of generators. HECO shows Hawaii
noon-time net load demand can drop to below
Zero!
Oahu permits/year
2012 ~16.7K
2013 ~13.1K
2014 ~6.1K
2015 ~6.5K
2016 ~5.2K
2017 ~1.5K(Aug)
Total ~49.2K
Installed PV
2010=+16MW
2011=+39MW
2012=+92MW
2013=+130MW
2014=+88MW
2015=+98MW
2016=+99MW
Effective Dec 1, 2017
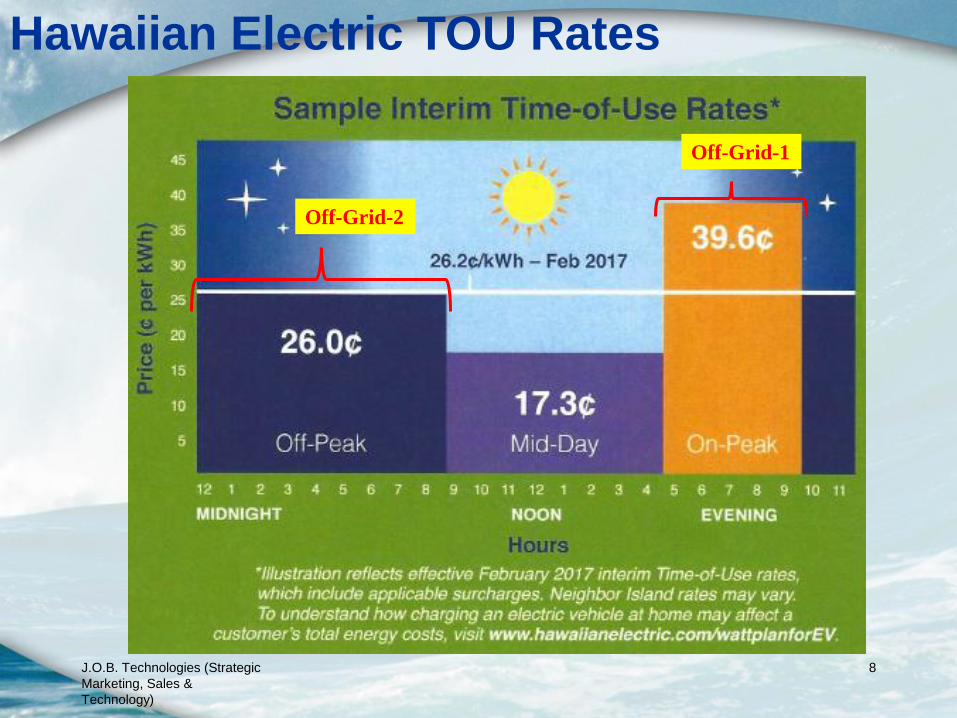
Hawaiian Electric TOU Rates
J.O.B. Technologies (Strategic
Marketing, Sales &
Technology)
8
Off-Grid-1
Off-Grid-2
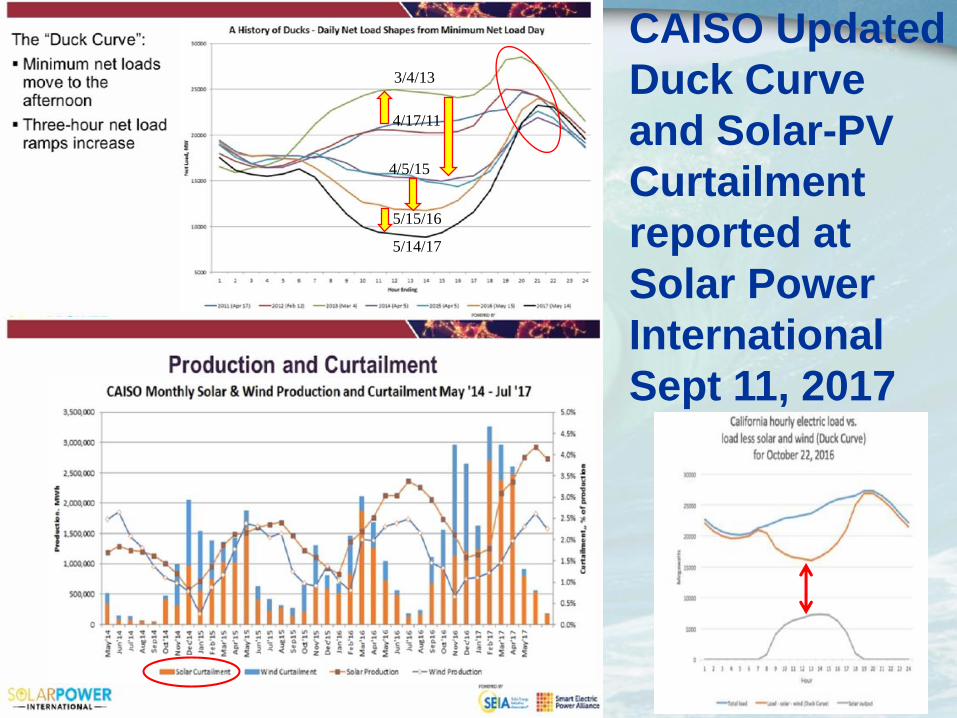
CAISO Updated
Duck Curve
and Solar-PV
Curtailment
reported at
Solar Power
International
Sept 11, 2017
J.O.B. Technologies (Strategic
Marketing, Sales &
Technology)
9
5/14/17
4/17/11
3/4/13
4/5/15
5/15/16
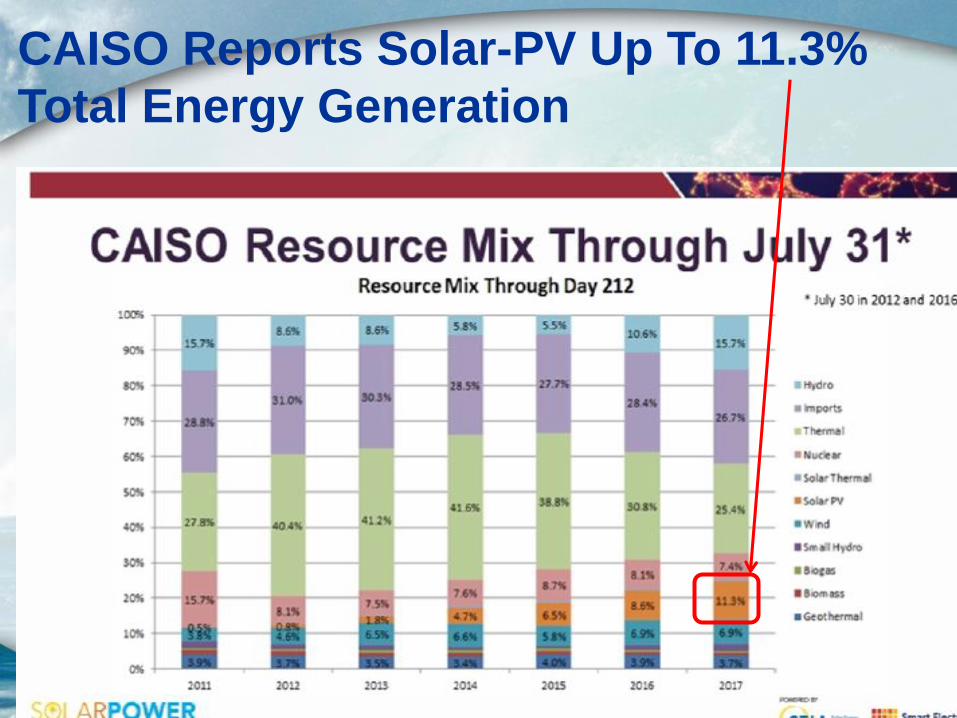
CAISO Reports Solar-PV Up To 11.3%
Total Energy Generation
J.O.B. Technologies (Strategic
Marketing, Sales &
Technology)
10
11
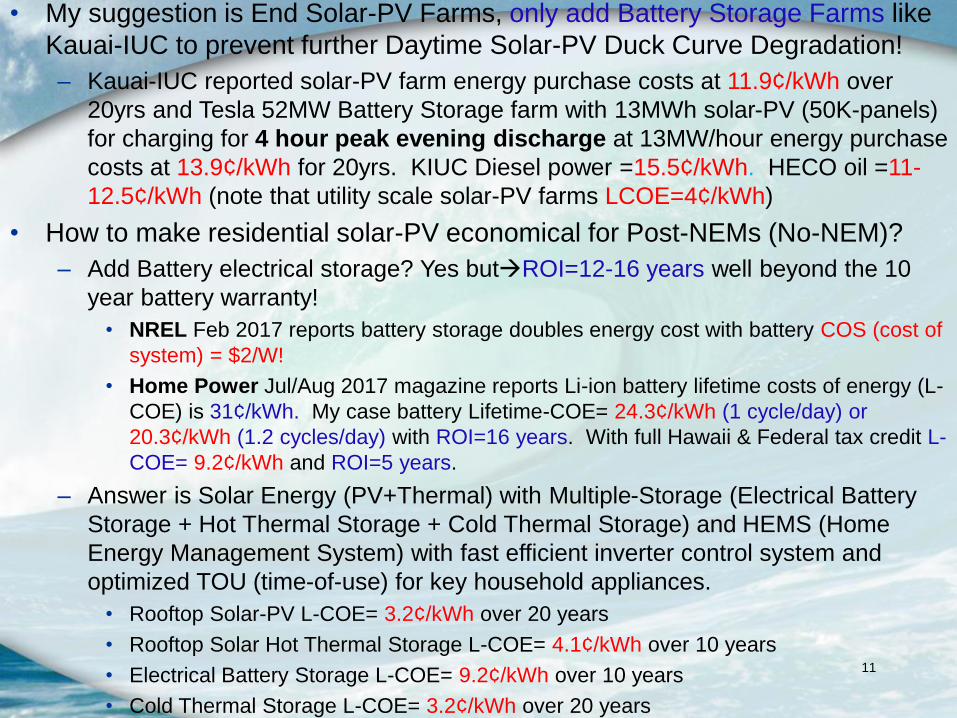
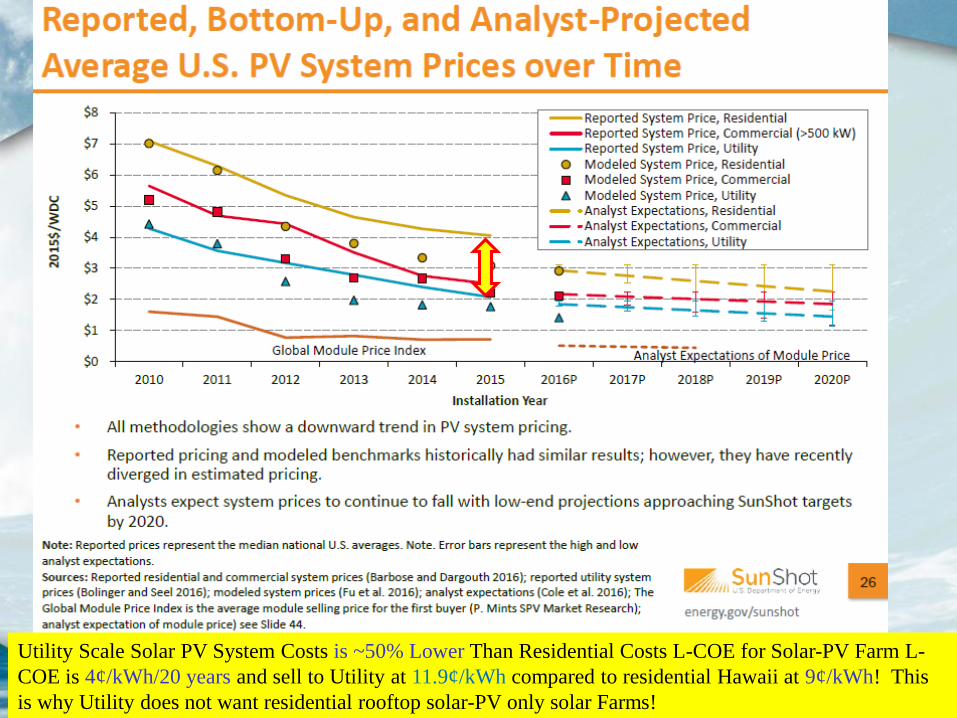
• My suggestion is End Solar-PV Farms, only add Battery Storage Farms like
Kauai-IUC to prevent further Daytime Solar-PV Duck Curve Degradation!
– Kauai-IUC reported solar-PV farm energy purchase costs at 11.9¢/kWh over
20yrs and Tesla 52MW Battery Storage farm with 13MWh solar-PV (50K-panels)
for charging for 4 hour peak evening discharge at 13MW/hour energy purchase
costs at 13.9¢/kWh for 20yrs. KIUC Diesel power =15.5¢/kWh. HECO oil =11-
12.5¢/kWh (note that utility scale solar-PV farms LCOE=4¢/kWh)
• How to make residential solar-PV economical for Post-NEMs (No-NEM)?
– Add Battery electrical storage? Yes butROI=12-16 years well beyond the 10
year battery warranty!
• NREL Feb 2017 reports battery storage doubles energy cost with battery COS (cost of
system) = $2/W!
• Home Power Jul/Aug 2017 magazine reports Li-ion battery lifetime costs of energy (L-
COE) is 31¢/kWh. My case battery Lifetime-COE= 24.3¢/kWh (1 cycle/day) or
20.3¢/kWh (1.2 cycles/day) with ROI=16 years. With full Hawaii & Federal tax credit L-
COE= 9.2¢/kWh and ROI=5 years.
– Answer is Solar Energy (PV+Thermal) with Multiple-Storage (Electrical Battery
Storage + Hot Thermal Storage + Cold Thermal Storage) and HEMS (Home
Energy Management System) with fast efficient inverter control system and
optimized TOU (time-of-use) for key household appliances.
• Rooftop Solar-PV L-COE= 3.2¢/kWh over 20 years
• Rooftop Solar Hot Thermal Storage L-COE= 4.1¢/kWh over 10 years
• Electrical Battery Storage L-COE= 9.2¢/kWh over 10 years
• Cold Thermal Storage L-COE= 3.2¢/kWh over 20 years
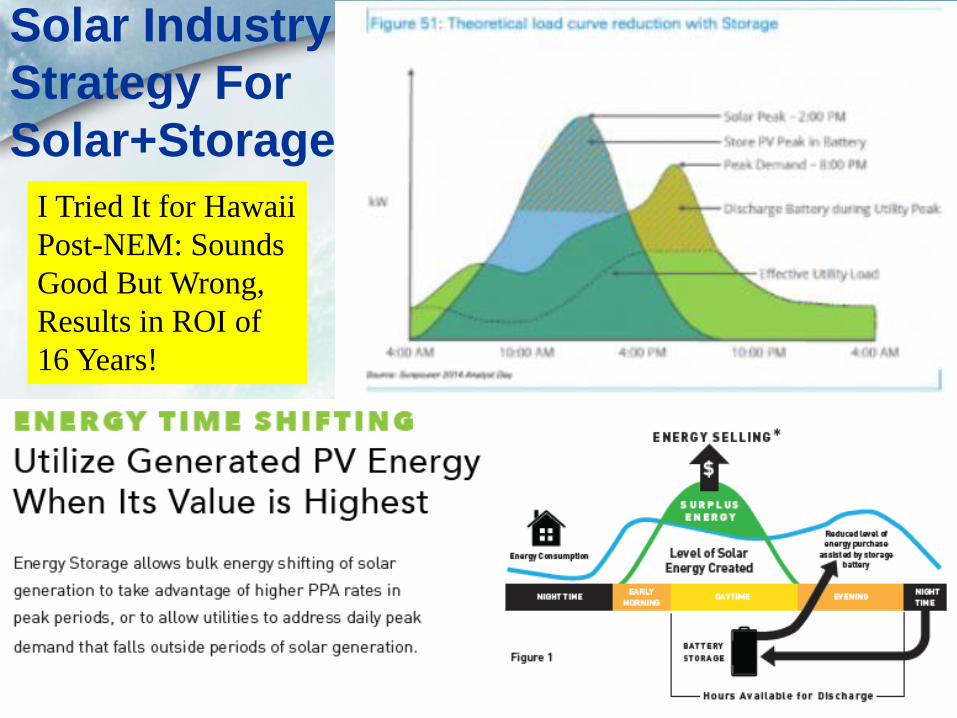
Solar Industry
Strategy For
Solar+Storage
J.O.B. Technologies (Strategic
Marketing, Sales &
Technology)
12
I Tried It for Hawaii
Post-NEM: Sounds
Good But Wrong,
Results in ROI of
16 Years!
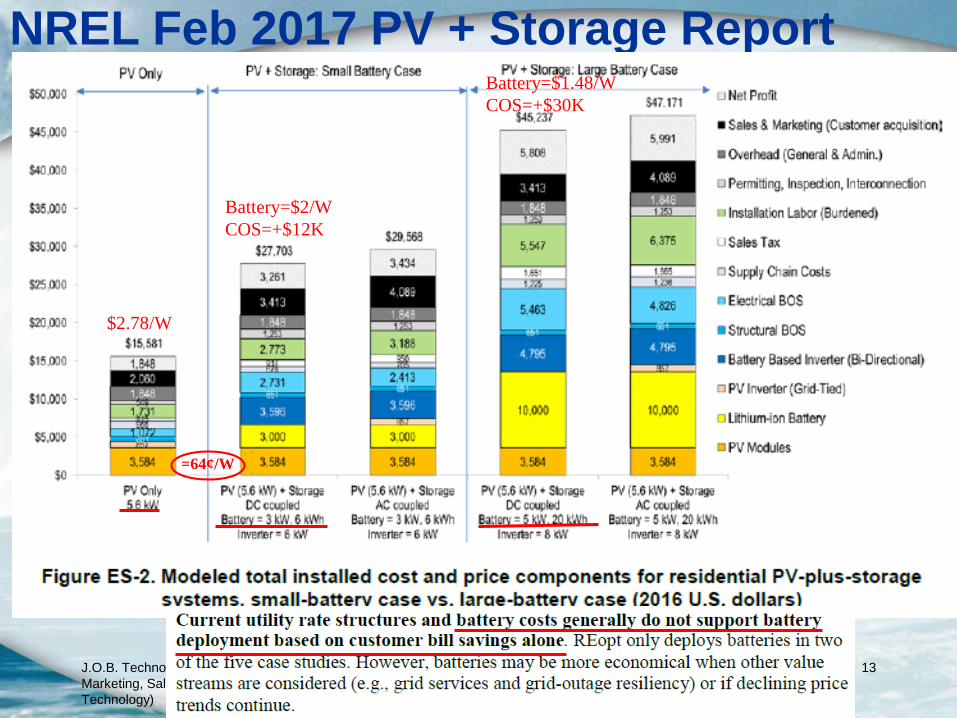
NREL Feb 2017 PV + Storage Report
J.O.B. Technologies (Strategic
Marketing, Sales &
Technology)
13
$2.78/W
Battery=$2/W
COS=+$12K
Battery=$1.48/W
COS=+$30K
=64¢/W
J.O.B. Technologies (Strategic
Marketing, Sales &
Technology)
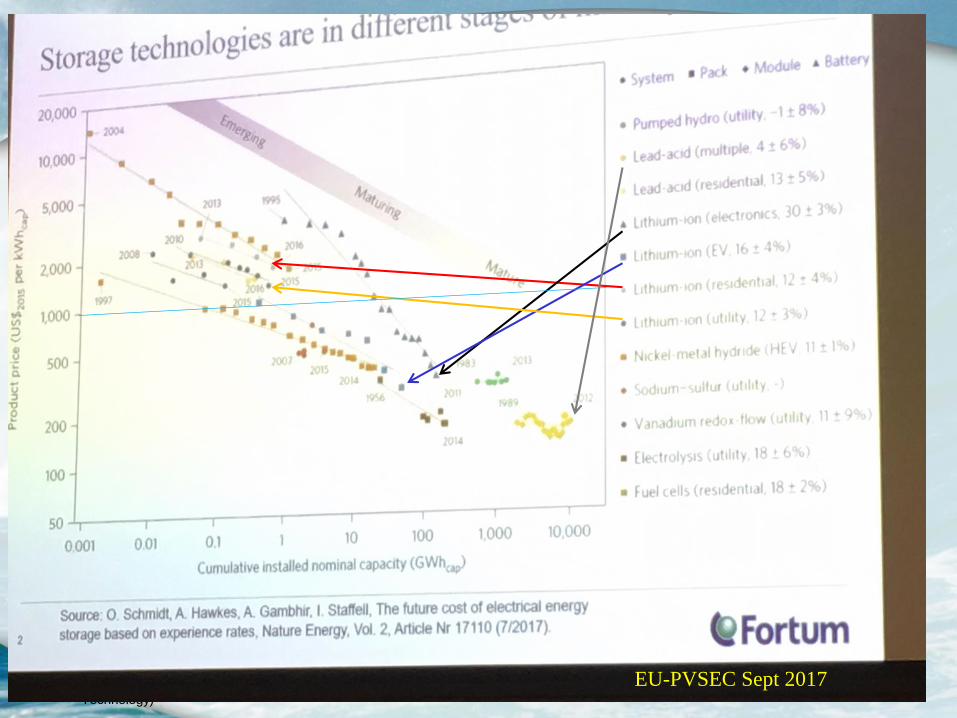
14EU-PVSEC Sept 2017
15
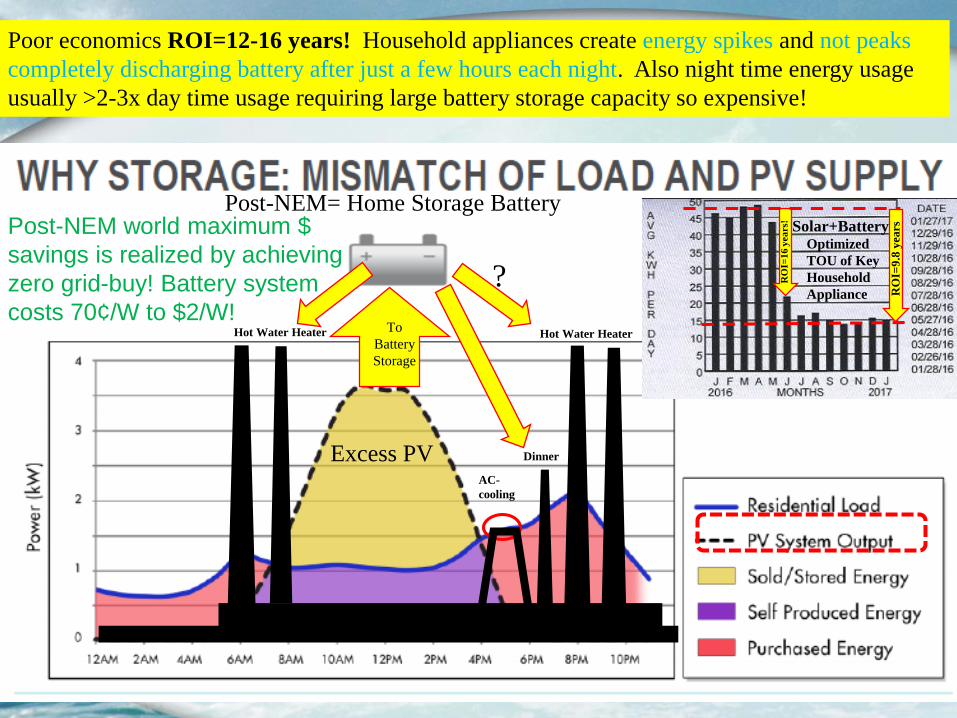
Dinner
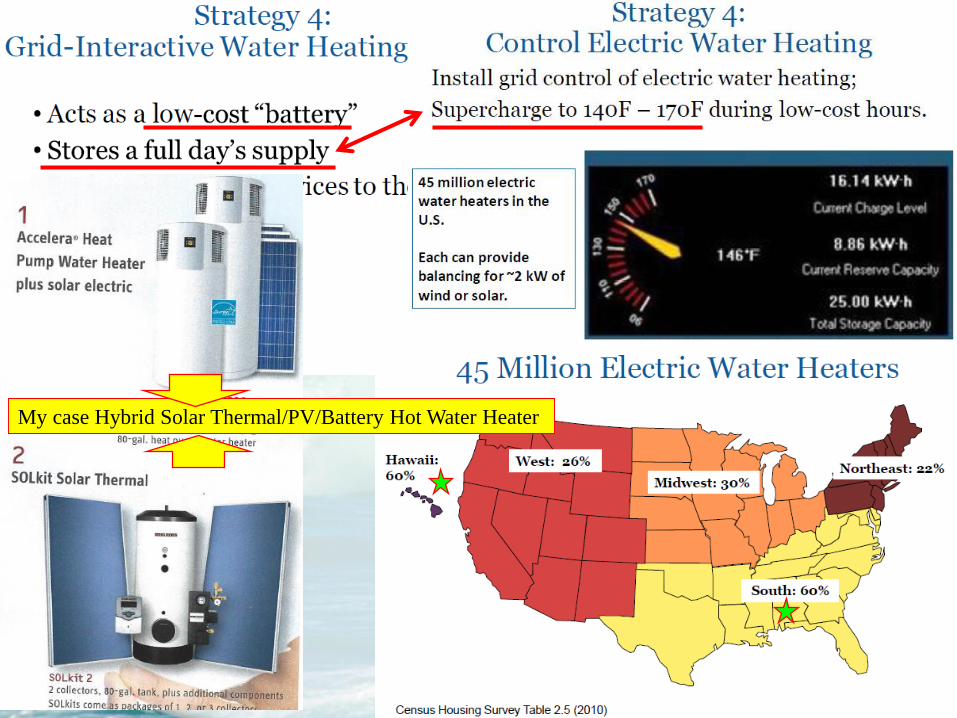
Hot Water HeaterHot Water Heater
AC-
cooling
Poor economics ROI=12-16 years! Household appliances create energy spikes and not peaks
completely discharging battery after just a few hours each night. Also night time energy usage
usually >2-3x day time usage requiring large battery storage capacity so expensive!
Excess PV
Post-NEM= Home Storage Battery
To
Battery
Storage
RO
I=1
6 y
ears
!
Solar+BatteryOptimized
TOU of Key
Household
Appliance RO
I=9
.8 y
earsPost-NEM world maximum $
savings is realized by achieving
zero grid-buy! Battery system
costs 70¢/W to $2/W!
?
16
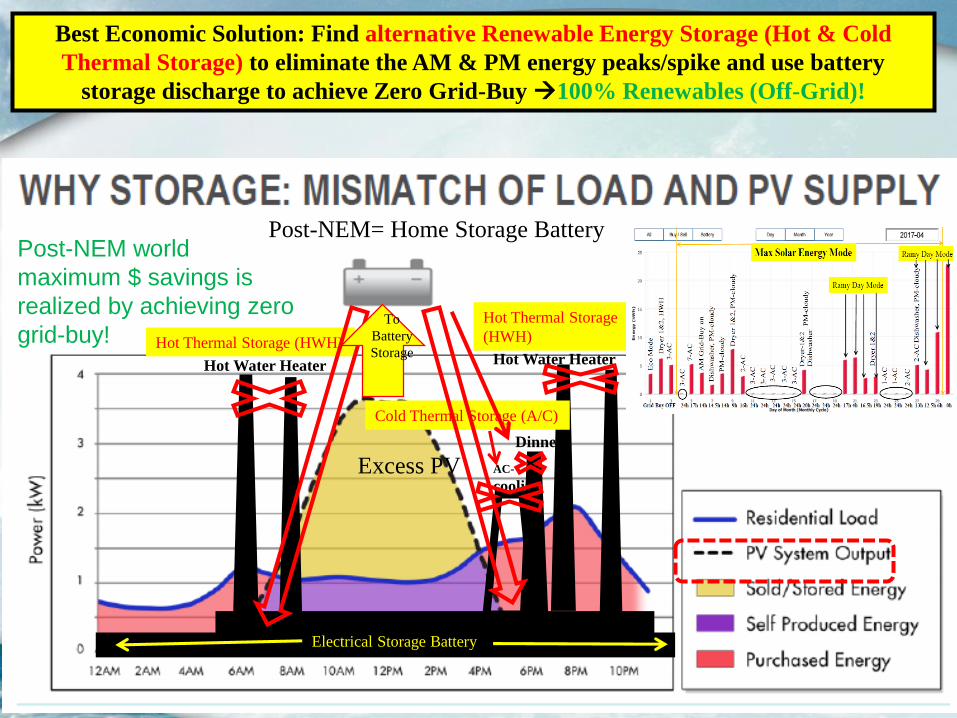
Electrical Storage Battery
Cold Thermal Storage (A/C)
Hot Thermal Storage
(HWH)Hot Thermal Storage (HWH)
Best Economic Solution: Find alternative Renewable Energy Storage (Hot & Cold
Thermal Storage) to eliminate the AM & PM energy peaks/spike and use battery
storage discharge to achieve Zero Grid-Buy 100% Renewables (Off-Grid)!
Dinner
Hot Water HeaterHot Water Heater
AC-
cooling
Excess PV
Post-NEM= Home Storage Battery
To
Battery
Storage
Post-NEM world
maximum $ savings is
realized by achieving zero
grid-buy!
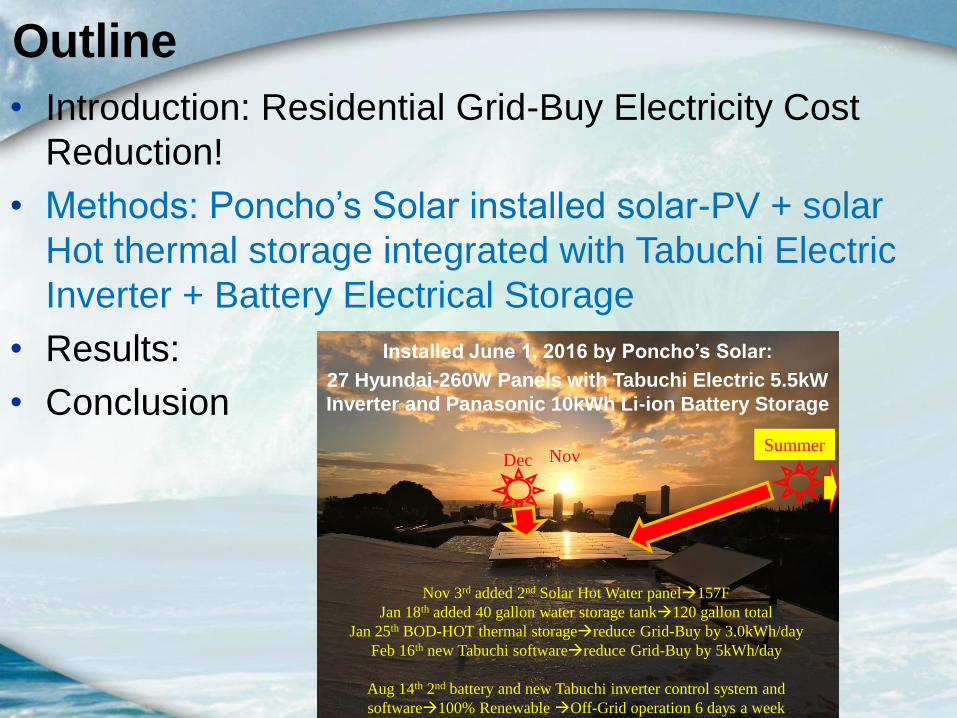
Outline
• Introduction: Residential Grid-Buy Electricity Cost
Reduction!
• Methods: Poncho’s Solar installed solar-PV + solar
Hot thermal storage integrated with Tabuchi Electric
Inverter + Battery Electrical Storage
• Results:
• Conclusion
Installed June 1, 2016 by Poncho’s Solar:
27 Hyundai-260W Panels with Tabuchi Electric 5.5kW
Inverter and Panasonic 10kWh Li-ion Battery Storage
NovDecSummer
Nov 3rd added 2nd Solar Hot Water panel157F
Jan 18th added 40 gallon water storage tank120 gallon total
Jan 25th BOD-HOT thermal storagereduce Grid-Buy by 3.0kWh/day
Feb 16th new Tabuchi softwarereduce Grid-Buy by 5kWh/day
Aug 14th 2nd battery and new Tabuchi inverter control system and
software100% Renewable Off-Grid operation 6 days a week
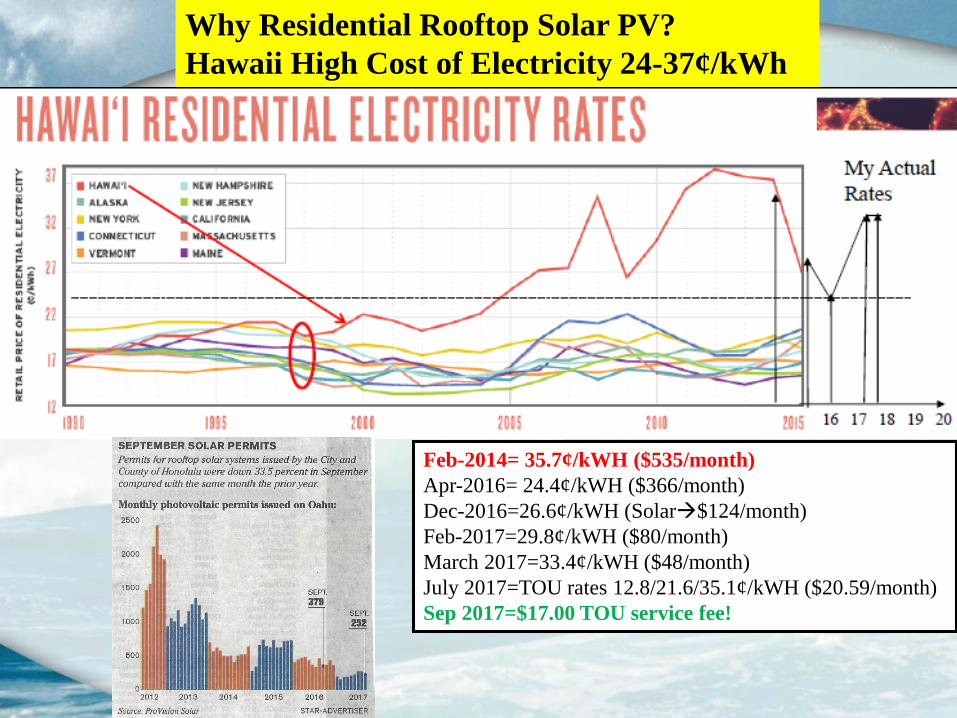
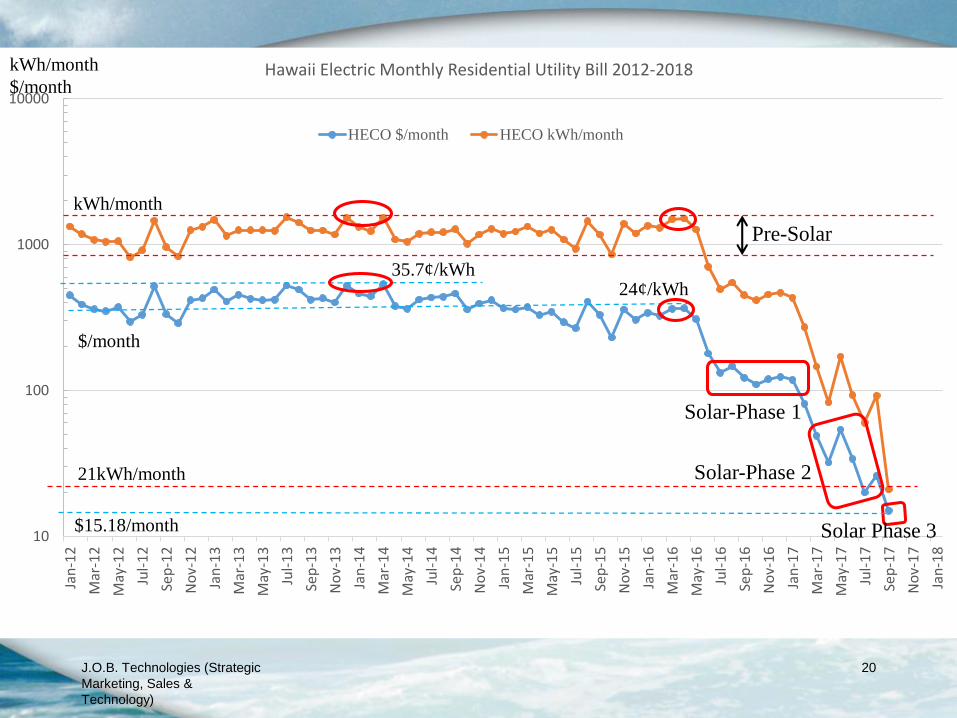
Feb-2014= 35.7¢/kWH ($535/month)
Apr-2016= 24.4¢/kWH ($366/month)
Dec-2016=26.6¢/kWH (Solar$124/month)
Feb-2017=29.8¢/kWH ($80/month)
March 2017=33.4¢/kWH ($48/month)
July 2017=TOU rates 12.8/21.6/35.1¢/kWH ($20.59/month)
Sep 2017=$17.00 TOU service fee!
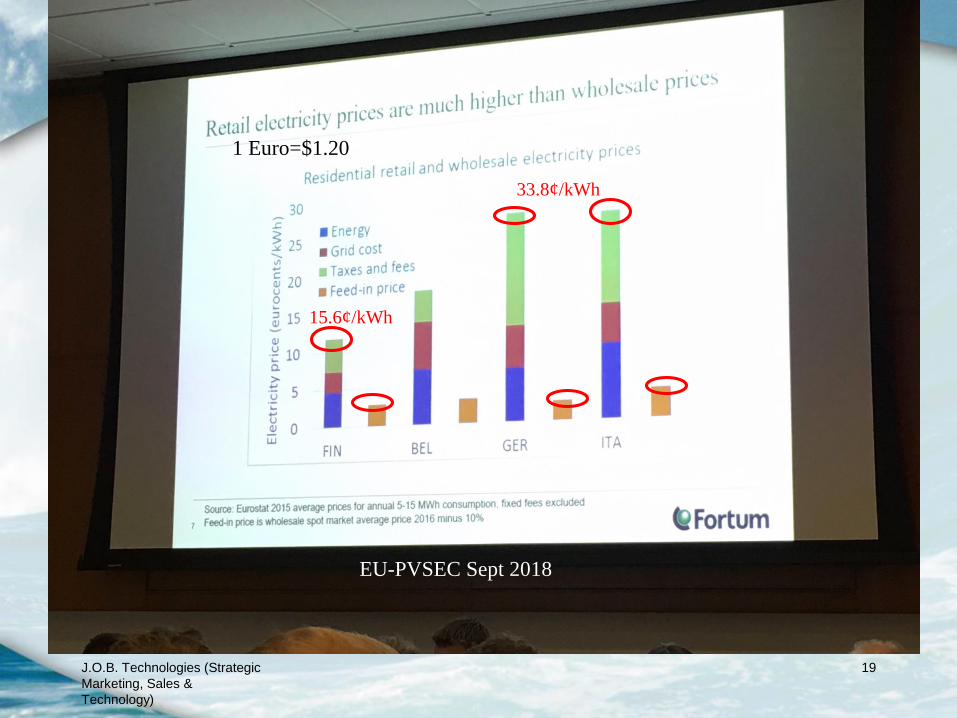
Why Residential Rooftop Solar PV?
Hawaii High Cost of Electricity 24-37¢/kWh
J.O.B. Technologies (Strategic
Marketing, Sales &
Technology)
19
EU-PVSEC Sept 2018
1 Euro=$1.20
33.8¢/kWh
15.6¢/kWh
J.O.B. Technologies (Strategic
Marketing, Sales &
Technology)
20
10
100
1000
10000
Jan
-12
Mar
-12
May
-12
Jul-
12
Sep
-12
No
v-1
2
Jan
-13
Mar
-13
May
-13
Jul-
13
Sep
-13
No
v-1
3
Jan
-14
Mar
-14
May
-14
Jul-
14
Sep
-14
No
v-1
4
Jan
-15
Mar
-15
May
-15
Jul-
15
Sep
-15
No
v-1
5
Jan
-16
Mar
-16
May
-16
Jul-
16
Sep
-16
No
v-1
6
Jan
-17
Mar
-17
May
-17
Jul-
17
Sep
-17
No
v-1
7
Jan
-18
Hawaii Electric Monthly Residential Utility Bill 2012-2018
HECO $/month HECO kWh/month
Pre-Solar
Solar-Phase 1
Solar-Phase 2
Solar Phase 3
kWh/month
$/month
kWh/month
$/month
35.7¢/kWh24¢/kWh
$15.18/month
21kWh/month
0
500
1000
1500
2000
2500
3000
3500
4000
4500
5000
5500
6000
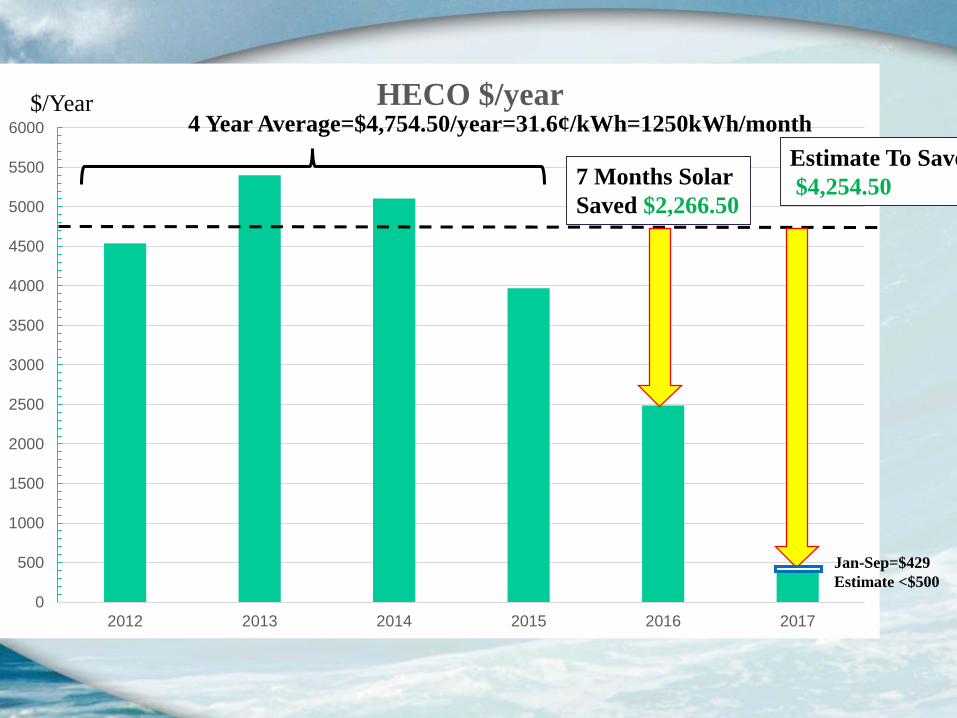
2012 2013 2014 2015 2016 2017
HECO $/year4 Year Average=$4,754.50/year=31.6¢/kWh=1250kWh/month
7 Months Solar
Saved $2,266.50
Estimate To Save
$4,254.50
Jan-Sep=$429
Estimate <$500
$/Year
22
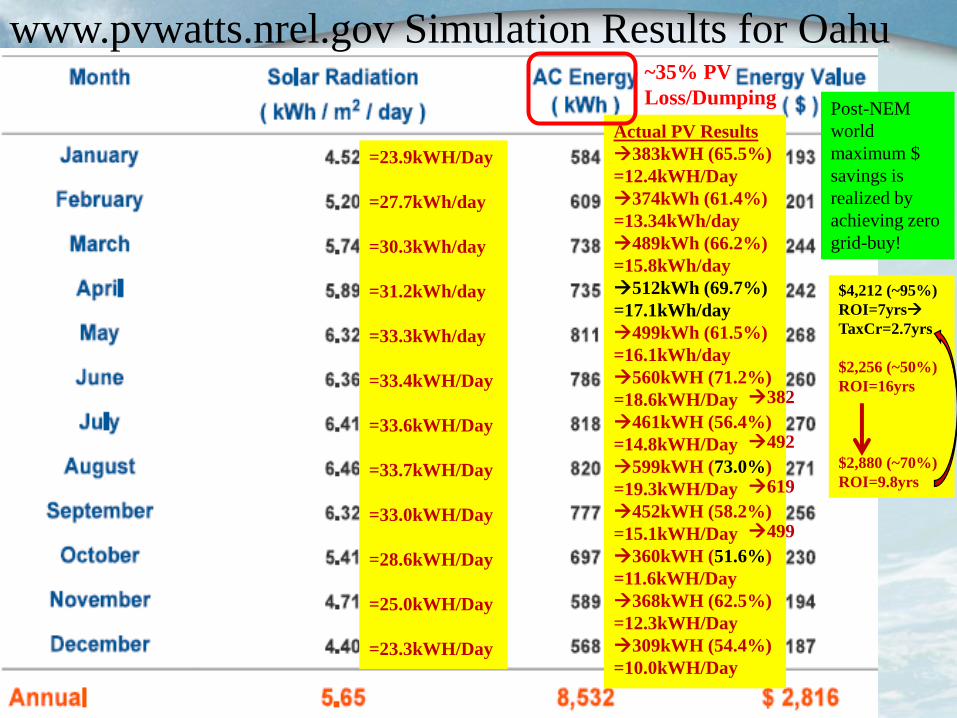
Actual PV Results
383kWH (65.5%)
=12.4kWH/Day
374kWh (61.4%)
=13.34kWh/day
489kWh (66.2%)
=15.8kWh/day
512kWh (69.7%)
=17.1kWh/day
499kWh (61.5%)
=16.1kWh/day
560kWH (71.2%)
=18.6kWH/Day
461kWH (56.4%)
=14.8kWH/Day
599kWH (73.0%)
=19.3kWH/Day
452kWH (58.2%)
=15.1kWH/Day
360kWH (51.6%)
=11.6kWH/Day
368kWH (62.5%)
=12.3kWH/Day
309kWH (54.4%)
=10.0kWH/Day
~35% PV
Loss/Dumping
382
492
619
499
$4,212 (~95%)
ROI=7yrs
TaxCr=2.7yrs
$2,256 (~50%)
ROI=16yrs
$2,880 (~70%)
ROI=9.8yrs
www.pvwatts.nrel.gov Simulation Results for Oahu
Post-NEM
world
maximum $
savings is
realized by
achieving zero
grid-buy!
=23.9kWH/Day
=27.7kWh/day
=30.3kWh/day
=31.2kWh/day
=33.3kWh/day
=33.4kWH/Day
=33.6kWH/Day
=33.7kWH/Day
=33.0kWH/Day
=28.6kWH/Day
=25.0kWH/Day
=23.3kWH/Day
J.O.B. Technologies (Strategic
Marketing, Sales &
Technology)
23
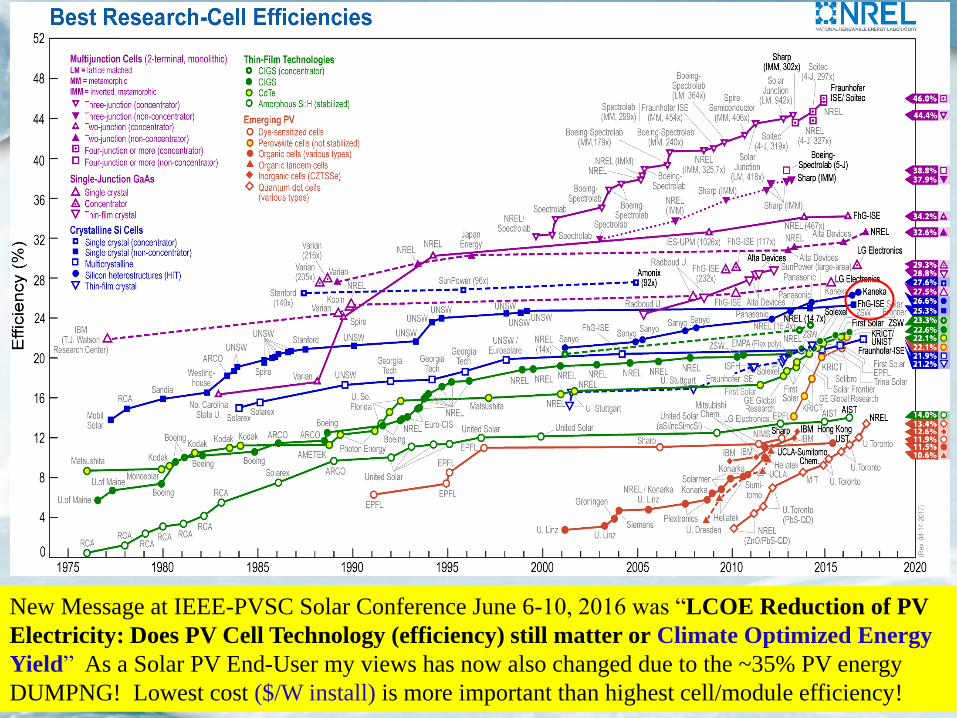
New Message at IEEE-PVSC Solar Conference June 6-10, 2016 was “LCOE Reduction of PV
Electricity: Does PV Cell Technology (efficiency) still matter or Climate Optimized Energy
Yield” As a Solar PV End-User my views has now also changed due to the ~35% PV energy
DUMPNG! Lowest cost ($/W install) is more important than highest cell/module efficiency!
ITRPV-2017
J.O.B. Technologies (Strategic
Marketing, Sales &
Technology)
24
J.O.B. Technologies (Strategic
Marketing, Sales &
Technology)
25
ITRPV-2017
J.O.B. Technologies (Strategic
Marketing, Sales &
Technology)
26
ITRPV-2017
J.O.B. Technologies (Strategic
Marketing, Sales &
Technology)
27
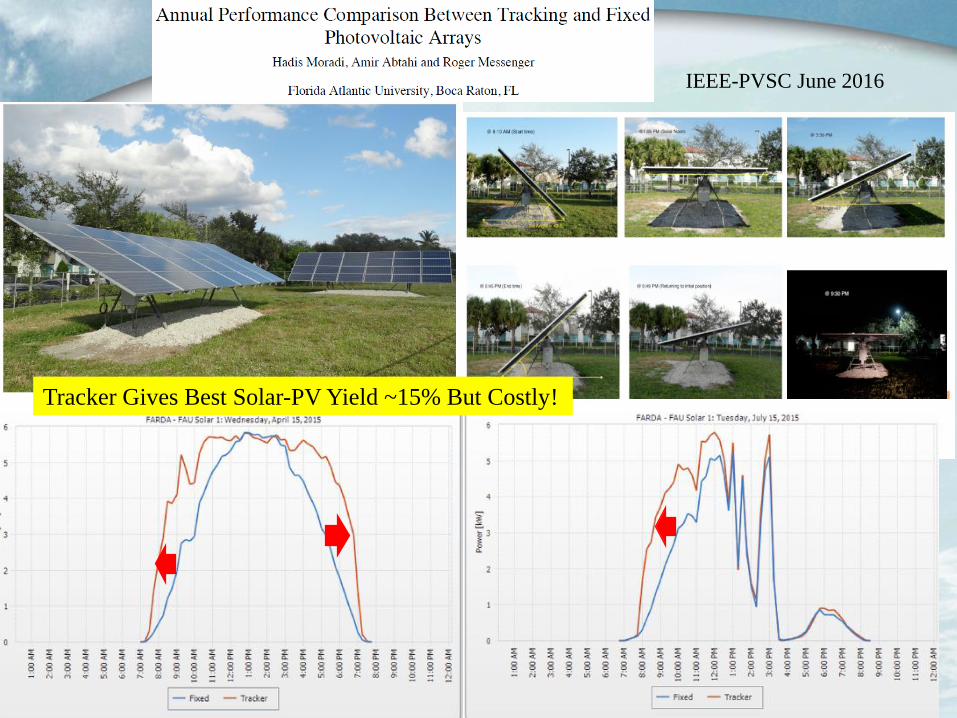
IEEE-PVSC June 2016
Tracker Gives Best Solar-PV Yield ~15% But Costly!
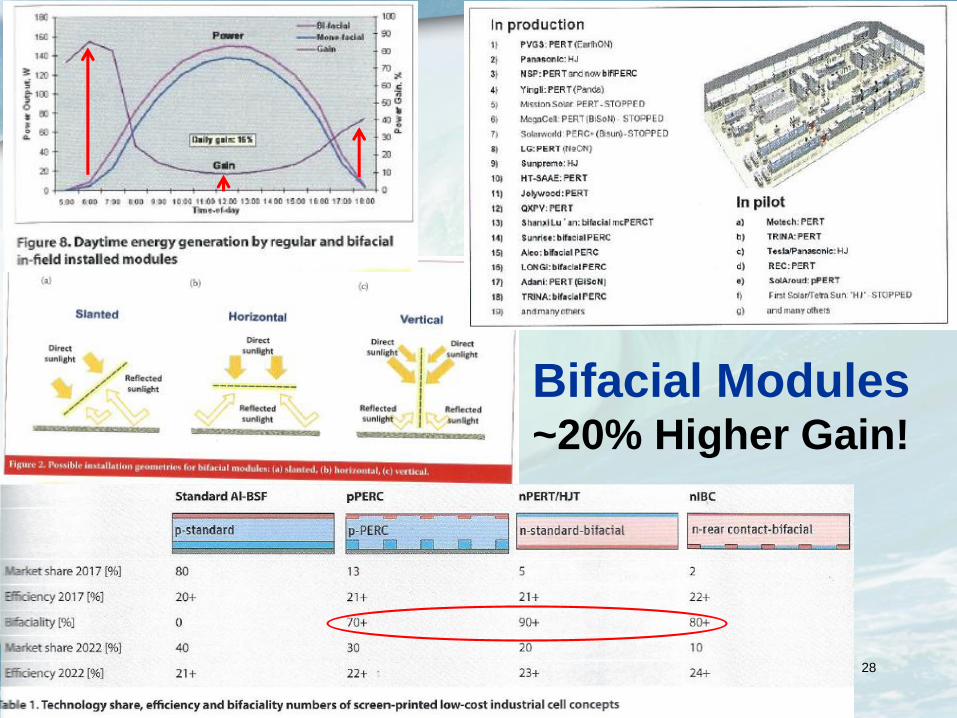
Bifacial Modules ~20% Higher Gain!
J.O.B. Technologies (Strategic
Marketing, Sales &
Technology)
28
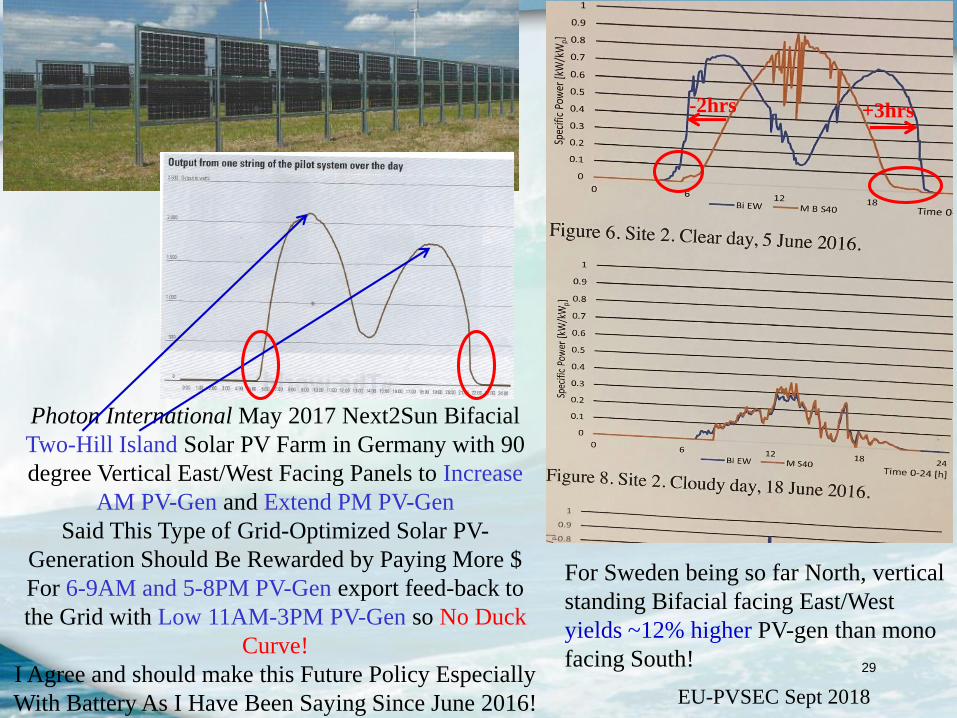
Photon International May 2017 Next2Sun Bifacial
Two-Hill Island Solar PV Farm in Germany with 90
degree Vertical East/West Facing Panels to Increase
AM PV-Gen and Extend PM PV-Gen
Said This Type of Grid-Optimized Solar PV-
Generation Should Be Rewarded by Paying More $
For 6-9AM and 5-8PM PV-Gen export feed-back to
the Grid with Low 11AM-3PM PV-Gen so No Duck
Curve!
I Agree and should make this Future Policy Especially
With Battery As I Have Been Saying Since June 2016!
29
EU-PVSEC Sept 2018
For Sweden being so far North, vertical
standing Bifacial facing East/West
yields ~12% higher PV-gen than mono
facing South!
-2hrs +3hrs
J.O.B. Technologies (Strategic
Marketing, Sales &
Technology)
30
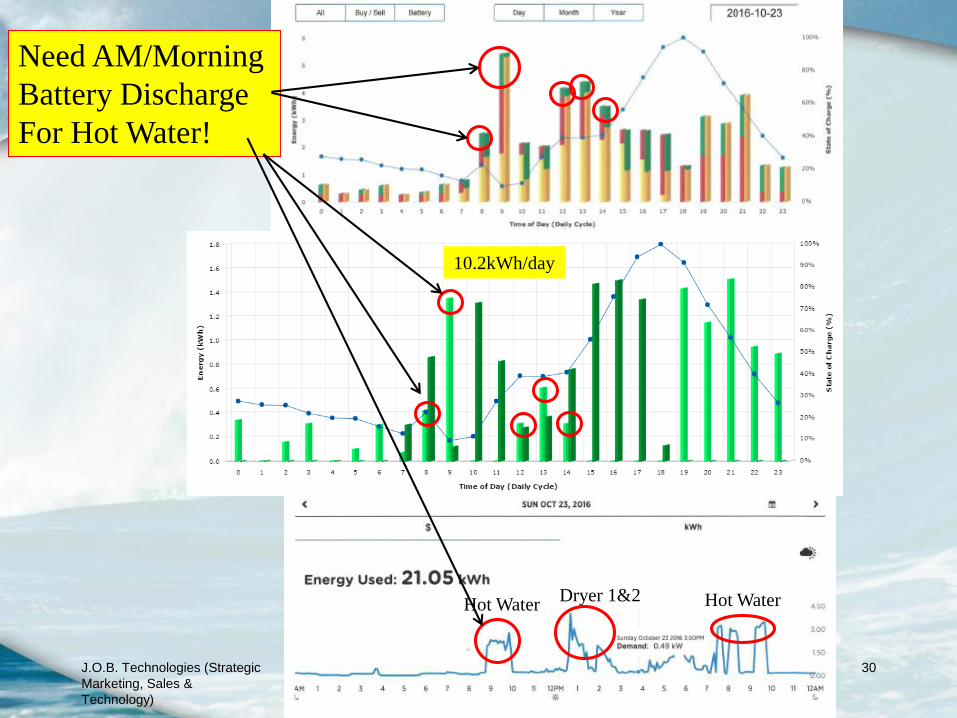
Need AM/Morning
Battery Discharge
For Hot Water!
10.2kWh/day
Hot Water Hot WaterDryer 1&2
J.O.B. Technologies (Strategic
Marketing, Sales &
Technology)
31
My case Hybrid Solar Thermal/PV/Battery Hot Water Heater
J.O.B. Technologies (Strategic
Marketing, Sales &
Technology)
32
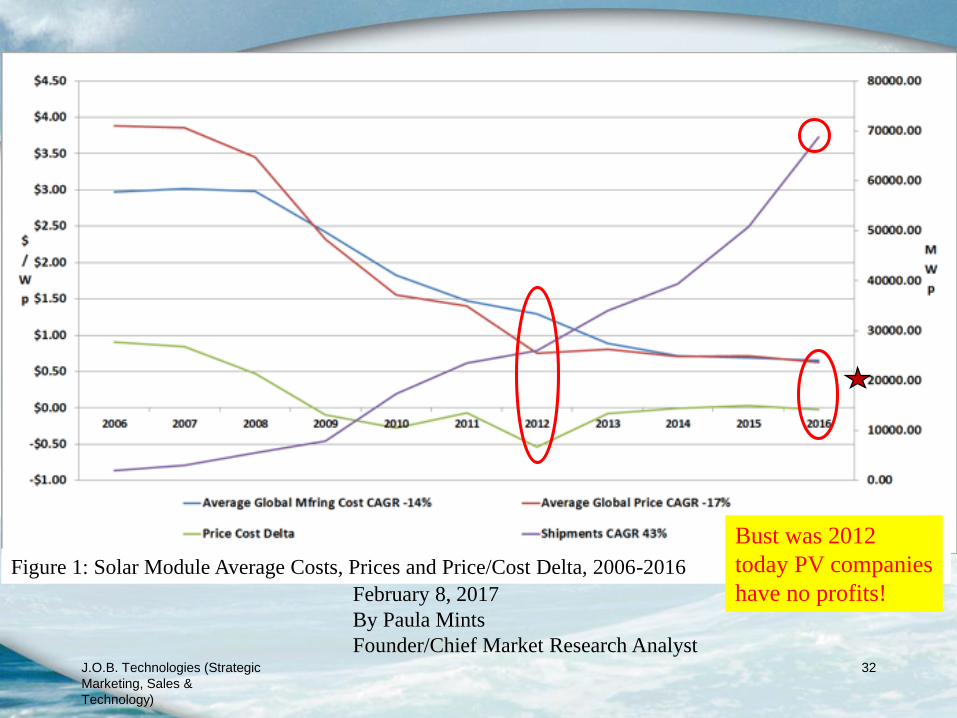
Figure 1: Solar Module Average Costs, Prices and Price/Cost Delta, 2006-2016
February 8, 2017
By Paula Mints
Founder/Chief Market Research Analyst
Bust was 2012
today PV companies
have no profits!

J.O.B. Technologies (Strategic
Marketing, Sales &
Technology)
33
$0.33/W (2017) $3.06-$5.60/W (2016)
Profits are with the PV installation companies
as install costs have increased since 2011
J.O.B. Technologies (Strategic
Marketing, Sales &
Technology)
34
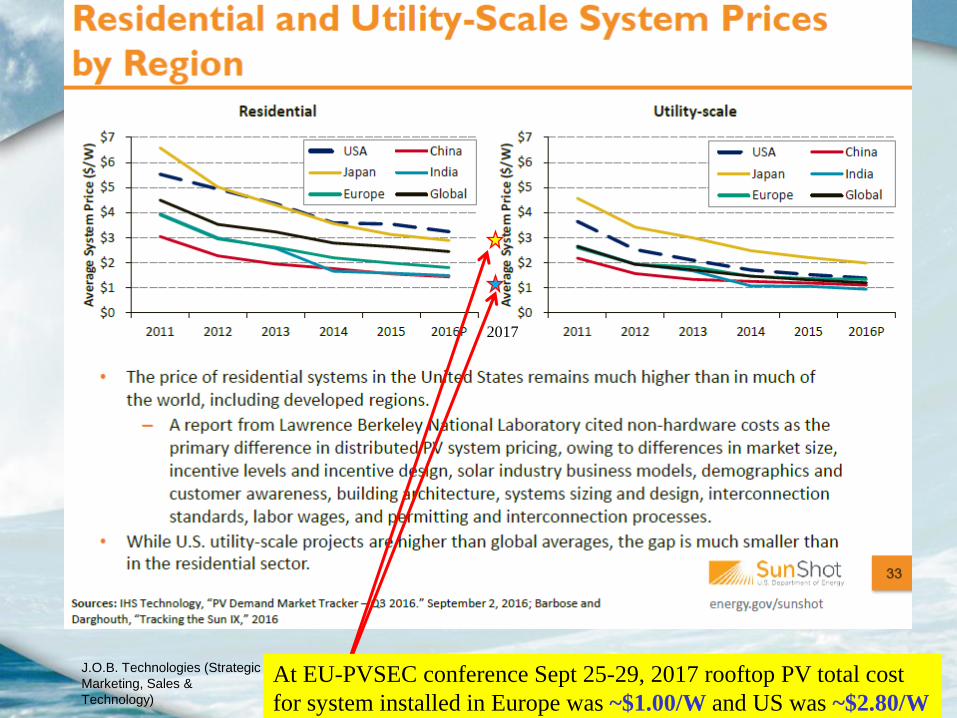
2017
At EU-PVSEC conference Sept 25-29, 2017 rooftop PV total cost
for system installed in Europe was ~$1.00/W and US was ~$2.80/W
35
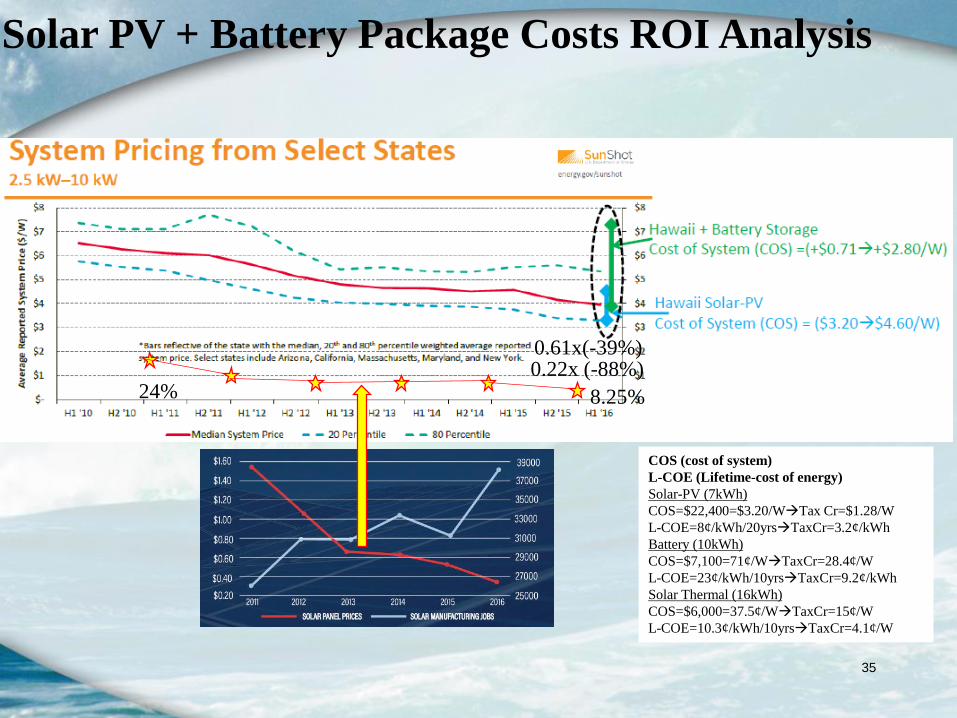
Solar PV + Battery Package Costs ROI Analysis
COS (cost of system)
L-COE (Lifetime-cost of energy)
Solar-PV (7kWh)
COS=$22,400=$3.20/WTax Cr=$1.28/W
L-COE=8¢/kWh/20yrsTaxCr=3.2¢/kWh
Battery (10kWh)
COS=$7,100=71¢/WTaxCr=28.4¢/W
L-COE=23¢/kWh/10yrsTaxCr=9.2¢/kWh
Solar Thermal (16kWh)
COS=$6,000=37.5¢/WTaxCr=15¢/W
L-COE=10.3¢/kWh/10yrsTaxCr=4.1¢/W
24% 8.25%
0.22x (-88%)0.61x(-39%)
J.O.B. Technologies (Strategic
Marketing, Sales &
Technology)
36Utility Scale Solar PV System Costs is ~50% Lower Than Residential Costs L-COE for Solar-PV Farm L-
COE is 4¢/kWh/20 years and sell to Utility at 11.9¢/kWh compared to residential Hawaii at 9¢/kWh! This
is why Utility does not want residential rooftop solar-PV only solar Farms!
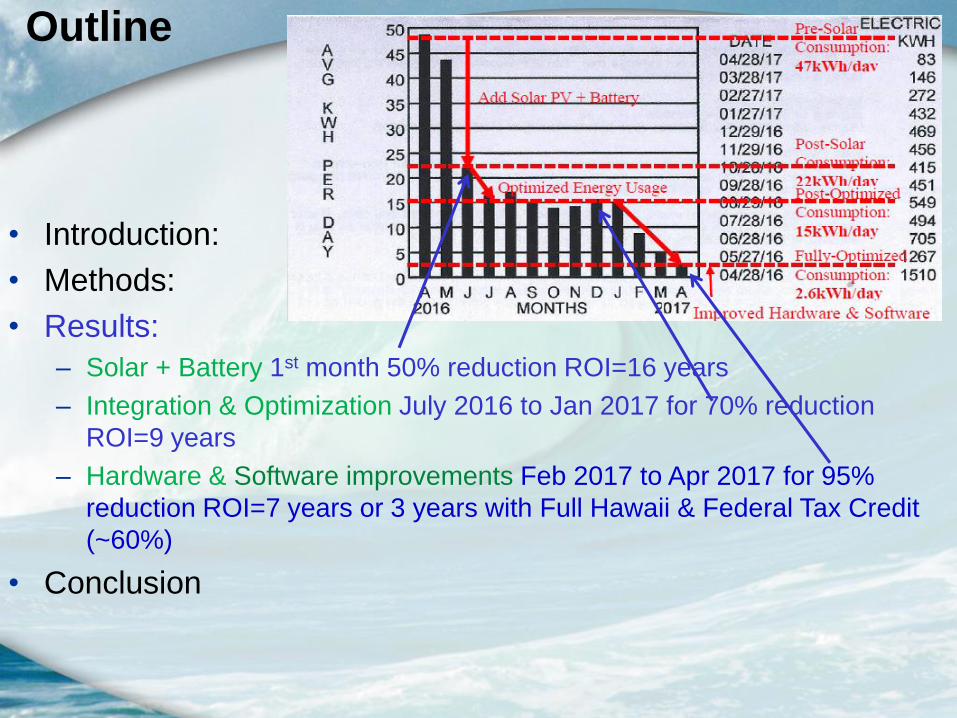
Outline
• Introduction:
• Methods:
• Results:
– Solar + Battery 1st month 50% reduction ROI=16 years
– Integration & Optimization July 2016 to Jan 2017 for 70% reduction
ROI=9 years
– Hardware & Software improvements Feb 2017 to Apr 2017 for 95%
reduction ROI=7 years or 3 years with Full Hawaii & Federal Tax Credit
(~60%)
• Conclusion
($30,000)
($20,000)
($10,000)
$0
$10,000
$20,000
$30,000
$40,000
$50,000
$60,000
$70,000
$80,000
$90,000
$100,000
0 1 2 3 4 5 6 7 8 9 10 11 12 13 14 15 16 17 18 19 20 21 22 23 24 25
ROI Analysis with 10 Year Battery Life
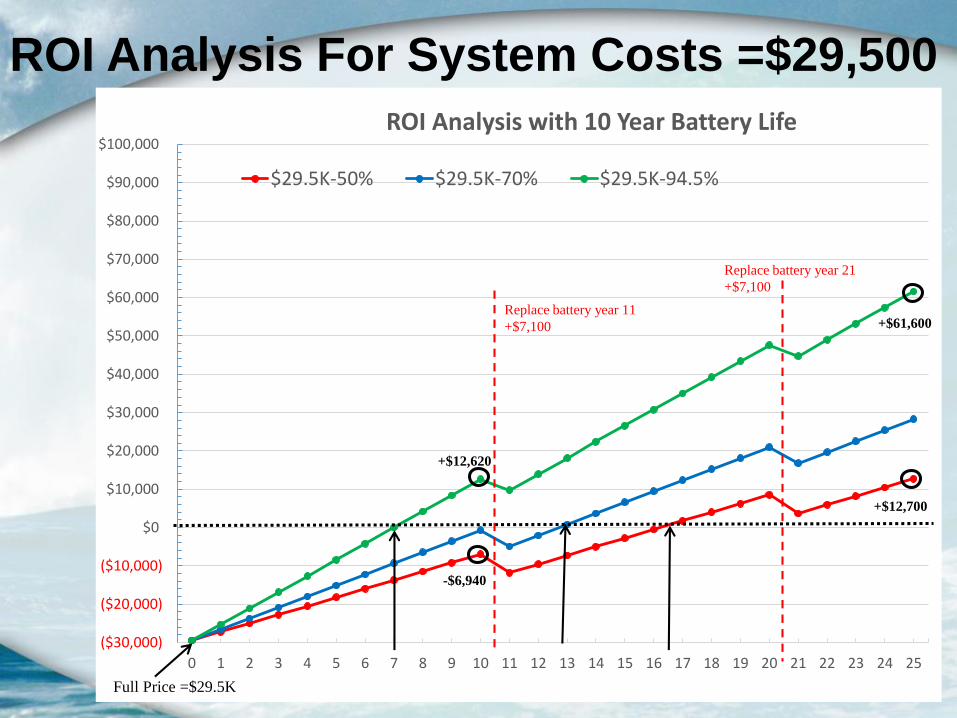
$29.5K-50% $29.5K-70% $29.5K-94.5%
Full Price =$29.5K
Replace battery year 11
+$7,100
Replace battery year 21
+$7,100
+$12,620
-$6,940
+$61,600
+$12,700
ROI Analysis For System Costs =$29,500
($30,000)
($20,000)
($10,000)
$0
$10,000
$20,000
$30,000
$40,000
$50,000
$60,000
$70,000
$80,000
$90,000
$100,000
0 1 2 3 4 5 6 7 8 9 10 11 12 13 14 15 16 17 18 19 20 21 22 23 24 25
ROI Analysis with 10 Year Battery Life
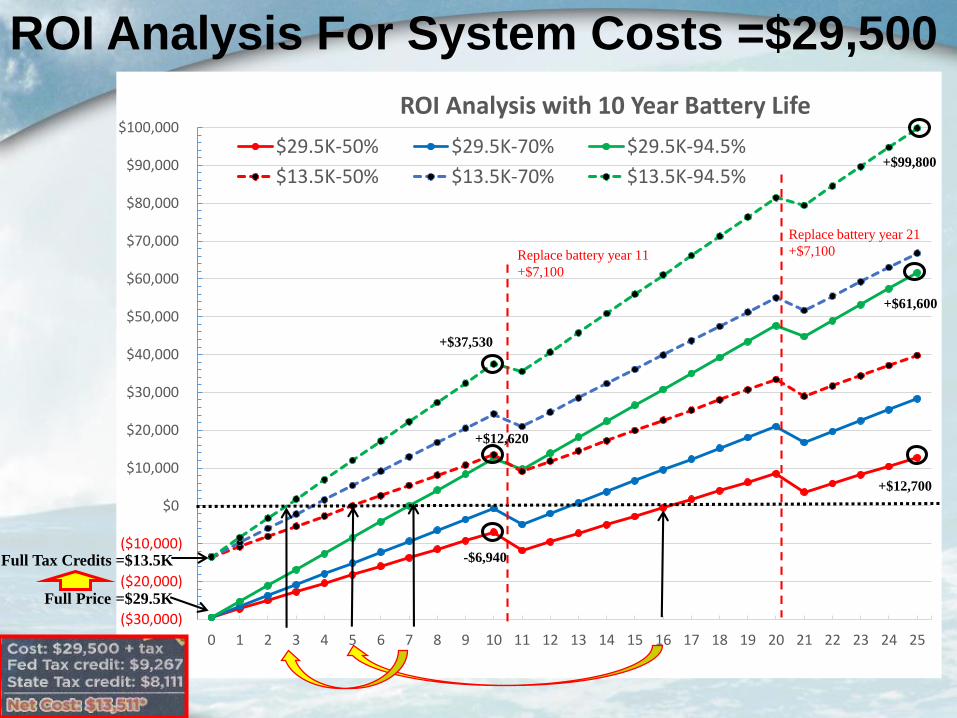
$29.5K-50% $29.5K-70% $29.5K-94.5%
$13.5K-50% $13.5K-70% $13.5K-94.5%
Full Tax Credits =$13.5K
Full Price =$29.5K
Replace battery year 11
+$7,100
Replace battery year 21
+$7,100
+$37,530
+$12,620
-$6,940
+$99,800
+$61,600
+$12,700
ROI Analysis For System Costs =$29,500
40
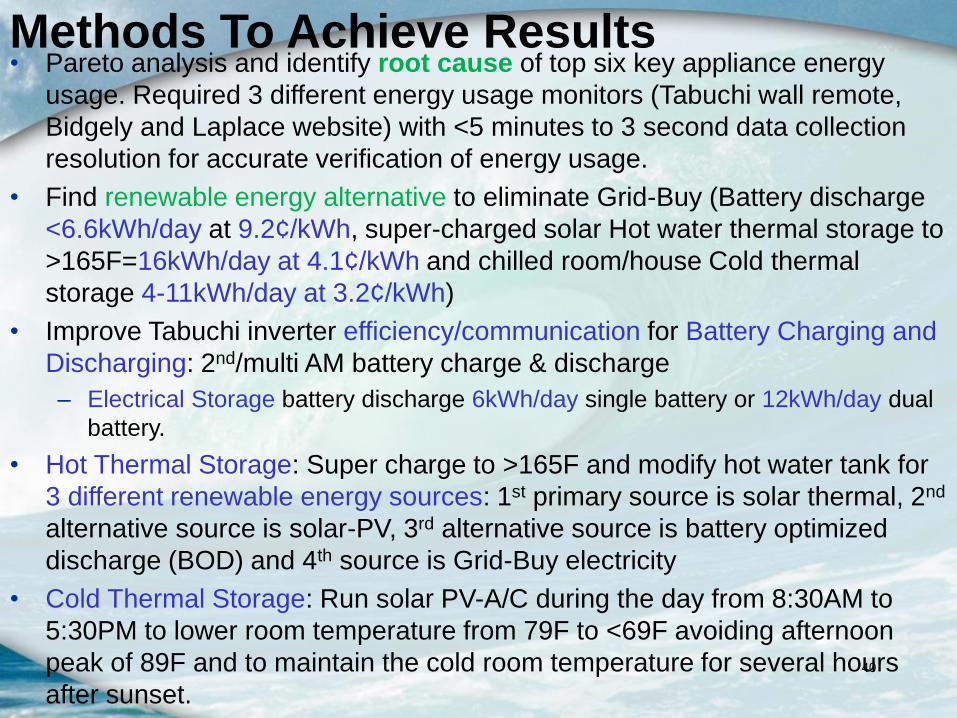
• Pareto analysis and identify root cause of top six key appliance energy
usage. Required 3 different energy usage monitors (Tabuchi wall remote,
Bidgely and Laplace website) with <5 minutes to 3 second data collection
resolution for accurate verification of energy usage.
• Find renewable energy alternative to eliminate Grid-Buy (Battery discharge
<6.6kWh/day at 9.2¢/kWh, super-charged solar Hot water thermal storage to
>165F=16kWh/day at 4.1¢/kWh and chilled room/house Cold thermal
storage 4-11kWh/day at 3.2¢/kWh)
• Improve Tabuchi inverter efficiency/communication for Battery Charging and
Discharging: 2nd/multi AM battery charge & discharge
– Electrical Storage battery discharge 6kWh/day single battery or 12kWh/day dual
battery.
• Hot Thermal Storage: Super charge to >165F and modify hot water tank for
3 different renewable energy sources: 1st primary source is solar thermal, 2nd
alternative source is solar-PV, 3rd alternative source is battery optimized
discharge (BOD) and 4th source is Grid-Buy electricity
• Cold Thermal Storage: Run solar PV-A/C during the day from 8:30AM to
5:30PM to lower room temperature from 79F to <69F avoiding afternoon
peak of 89F and to maintain the cold room temperature for several hours
after sunset.
Methods To Achieve Results
41
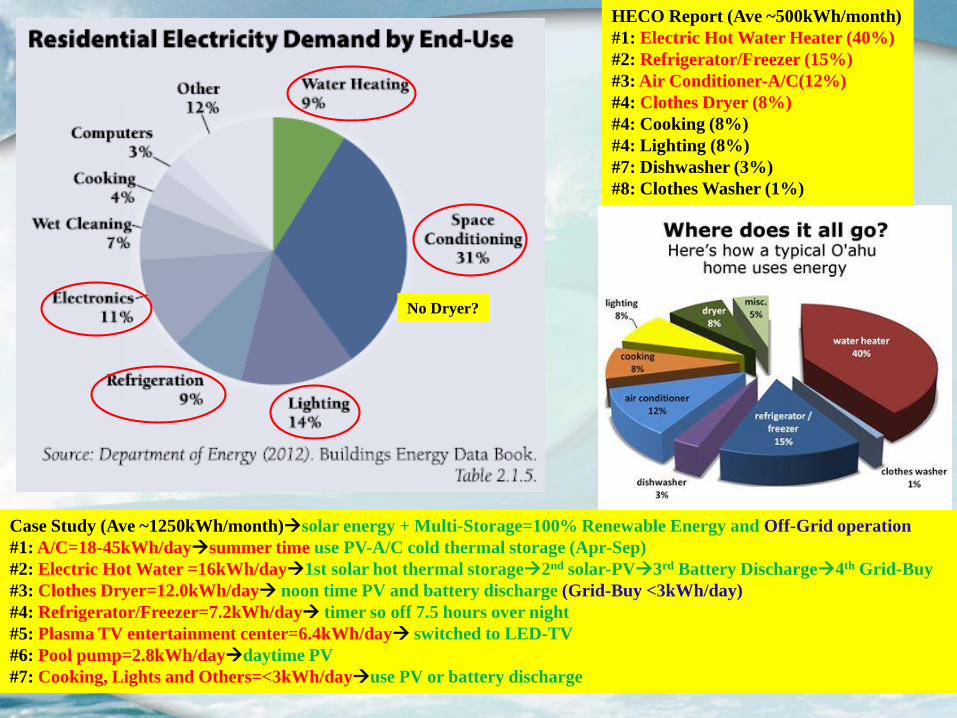
HECO Report (Ave ~500kWh/month)
#1: Electric Hot Water Heater (40%)
#2: Refrigerator/Freezer (15%)
#3: Air Conditioner-A/C(12%)
#4: Clothes Dryer (8%)
#4: Cooking (8%)
#4: Lighting (8%)
#7: Dishwasher (3%)
#8: Clothes Washer (1%)
Case Study (Ave ~1250kWh/month)solar energy + Multi-Storage=100% Renewable Energy and Off-Grid operation
#1: A/C=18-45kWh/daysummer time use PV-A/C cold thermal storage (Apr-Sep)
#2: Electric Hot Water =16kWh/day1st solar hot thermal storage2nd solar-PV3rd Battery Discharge4th Grid-Buy
#3: Clothes Dryer=12.0kWh/day noon time PV and battery discharge (Grid-Buy <3kWh/day)
#4: Refrigerator/Freezer=7.2kWh/day timer so off 7.5 hours over night
#5: Plasma TV entertainment center=6.4kWh/day switched to LED-TV
#6: Pool pump=2.8kWh/daydaytime PV
#7: Cooking, Lights and Others=<3kWh/dayuse PV or battery discharge
No Dryer?
J.O.B. Technologies (Strategic
Marketing, Sales &
Technology)
42
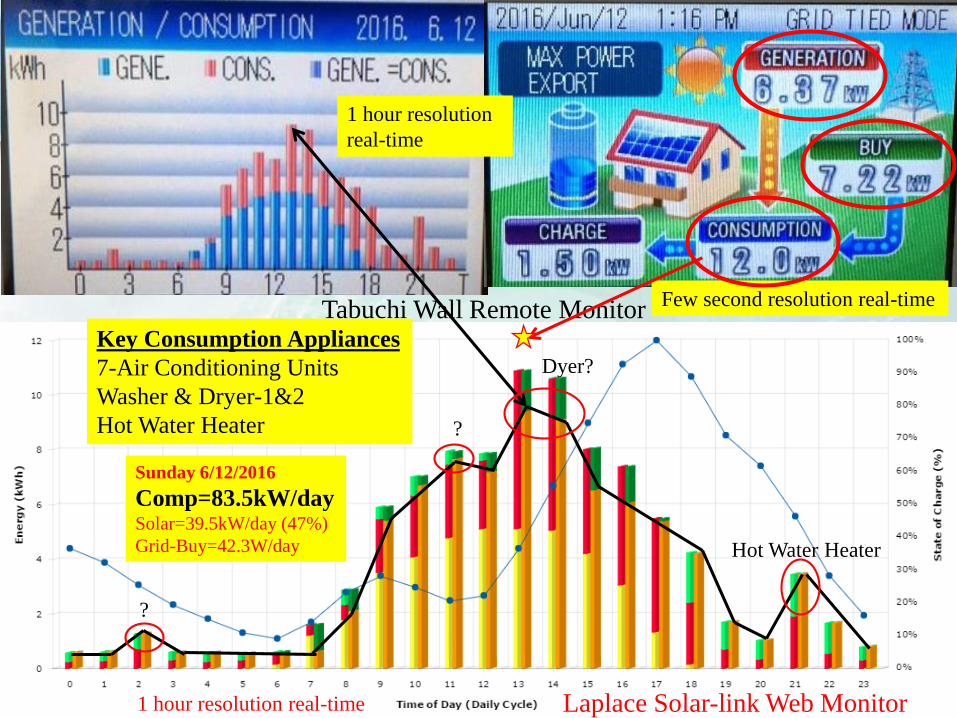
Tabuchi Wall Remote Monitor
Laplace Solar-link Web Monitor
1 hour resolution
real-time
1 hour resolution real-time
Few second resolution real-time
Sunday 6/12/2016
Comp=83.5kW/daySolar=39.5kW/day (47%)
Grid-Buy=42.3W/day
Key Consumption Appliances
7-Air Conditioning Units
Washer & Dryer-1&2
Hot Water Heater
?
?
Dyer?
Hot Water Heater
J.O.B. Technologies (Strategic
Marketing, Sales &
Technology)
43
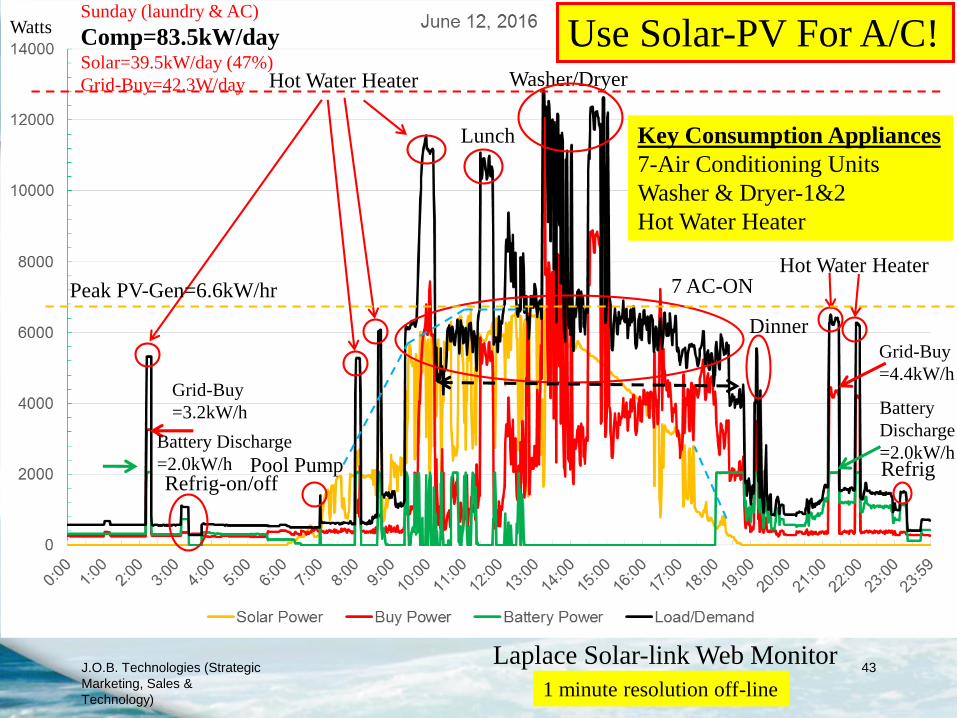
Sunday (laundry & AC)
Comp=83.5kW/daySolar=39.5kW/day (47%)
Grid-Buy=42.3W/day
7 AC-ON
Washer/Dryer
Hot Water Heater
Hot Water Heater
Pool PumpRefrig-on/off
Refrig
Lunch
Dinner
Use Solar-PV For A/C!
Laplace Solar-link Web Monitor
1 minute resolution off-line
Peak PV-Gen=6.6kW/hr
Grid-Buy
=4.4kW/h
Battery
Discharge
=2.0kW/hBattery Discharge
=2.0kW/h
Grid-Buy
=3.2kW/h
Key Consumption Appliances
7-Air Conditioning Units
Washer & Dryer-1&2
Hot Water Heater
Watts
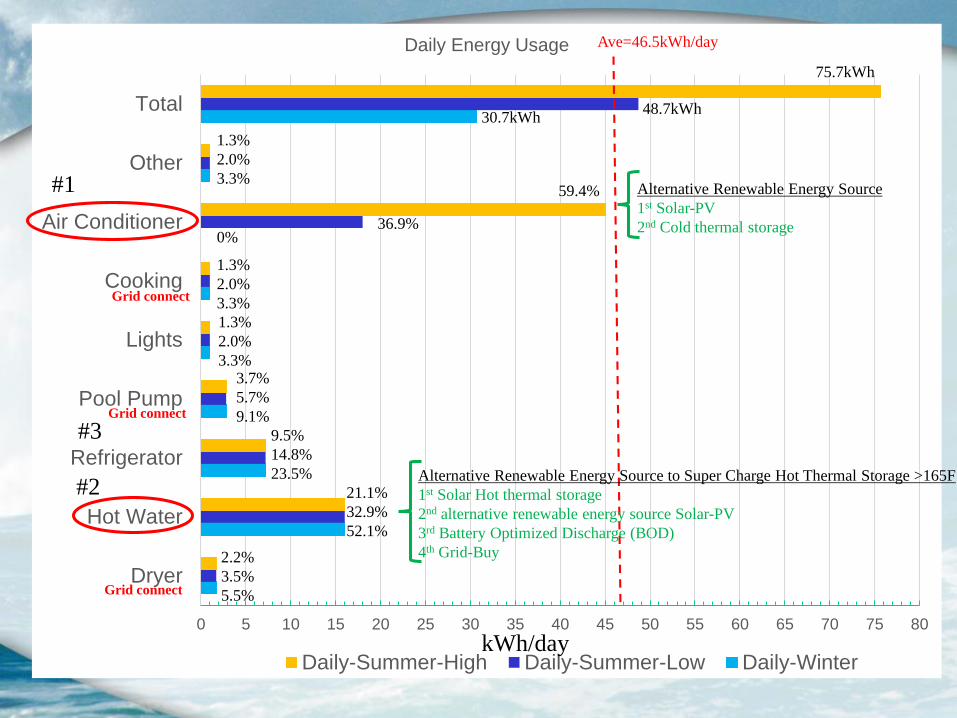
0 5 10 15 20 25 30 35 40 45 50 55 60 65 70 75 80
Dryer
Hot Water
Refrigerator
Pool Pump
Lights
Cooking
Air Conditioner
Other
Total
Daily Energy Usage
Daily-Summer-High Daily-Summer-Low Daily-WinterkWh/day
2.2%
3.5%
5.5%
21.1%
32.9%
52.1%
9.5%
14.8%
23.5%
3.7%
5.7%
9.1%
59.4%
75.7kWh
1.3%
2.0%
3.3%
1.3%
2.0%
3.3%
1.3%
2.0%
3.3%
48.7kWh30.7kWh
36.9%0%
Ave=46.5kWh/day
#1
#2
#3
Alternative Renewable Energy Source
1st Solar-PV
2nd Cold thermal storage
Alternative Renewable Energy Source to Super Charge Hot Thermal Storage >165F
1st Solar Hot thermal storage
2nd alternative renewable energy source Solar-PV
3rd Battery Optimized Discharge (BOD)
4th Grid-Buy
Grid connect
Grid connect
Grid connect
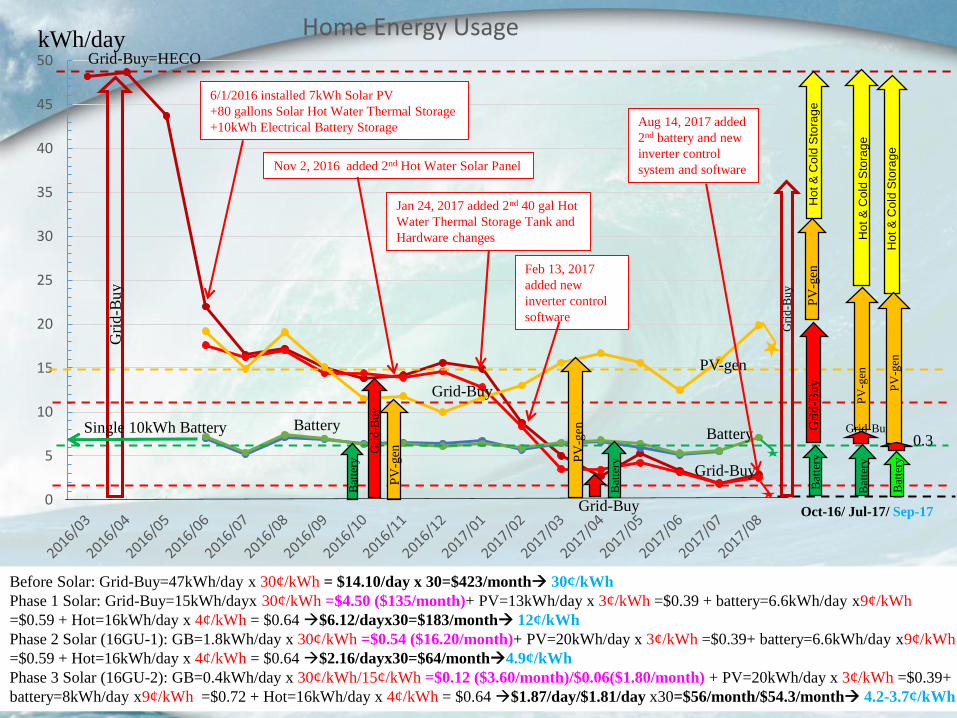
0
5
10
15
20
25
30
35
40
45
50
Home Energy Usage
HECO Grid-Buy PV-Gen Battery Charge Battery Discharge
kWh/day
Oct-16/ Jul-17/ Sep-17
Gri
d-B
uy
Gri
d-B
uy
Gri
d-B
uy
Gri
d-B
uy
Grid-Buy
PV
-gen
PV
-gen
PV
-gen
Bat
tery
Bat
tery
Bat
tery
Bat
tery
Battery
PV-gen
Grid-Buy
Grid-Buy
Hot &
Co
ld S
tora
ge
Hot &
Co
ld S
tora
ge
Hot &
Co
ld S
tora
ge
PV
-gen
Grid-Buy=HECO
Battery
Bat
tery
PV
-gen
Grid-Buy
Single 10kWh Battery
6/1/2016 installed 7kWh Solar PV
+80 gallons Solar Hot Water Thermal Storage
+10kWh Electrical Battery Storage
Nov 2, 2016 added 2nd Hot Water Solar Panel
Jan 24, 2017 added 2nd 40 gal Hot
Water Thermal Storage Tank and
Hardware changes
Feb 13, 2017
added new
inverter control
software
Aug 14, 2017 added
2nd battery and new
inverter control
system and software
Before Solar: Grid-Buy=47kWh/day x 30¢/kWh = $14.10/day x 30=$423/month 30¢/kWh
Phase 1 Solar: Grid-Buy=15kWh/dayx 30¢/kWh =$4.50 ($135/month)+ PV=13kWh/day x 3¢/kWh =$0.39 + battery=6.6kWh/day x9¢/kWh
=$0.59 + Hot=16kWh/day x 4¢/kWh = $0.64 $6.12/dayx30=$183/month 12¢/kWh
Phase 2 Solar (16GU-1): GB=1.8kWh/day x 30¢/kWh =$0.54 ($16.20/month)+ PV=20kWh/day x 3¢/kWh =$0.39+ battery=6.6kWh/day x9¢/kWh
=$0.59 + Hot=16kWh/day x 4¢/kWh = $0.64 $2.16/dayx30=$64/month4.9¢/kWh
Phase 3 Solar (16GU-2): GB=0.4kWh/day x 30¢/kWh/15¢/kWh =$0.12 ($3.60/month)/$0.06($1.80/month) + PV=20kWh/day x 3¢/kWh =$0.39+
battery=8kWh/day x9¢/kWh =$0.72 + Hot=16kWh/day x 4¢/kWh = $0.64 $1.87/day/$1.81/day x30=$56/month/$54.3/month 4.2-3.7¢/kWh
0.3
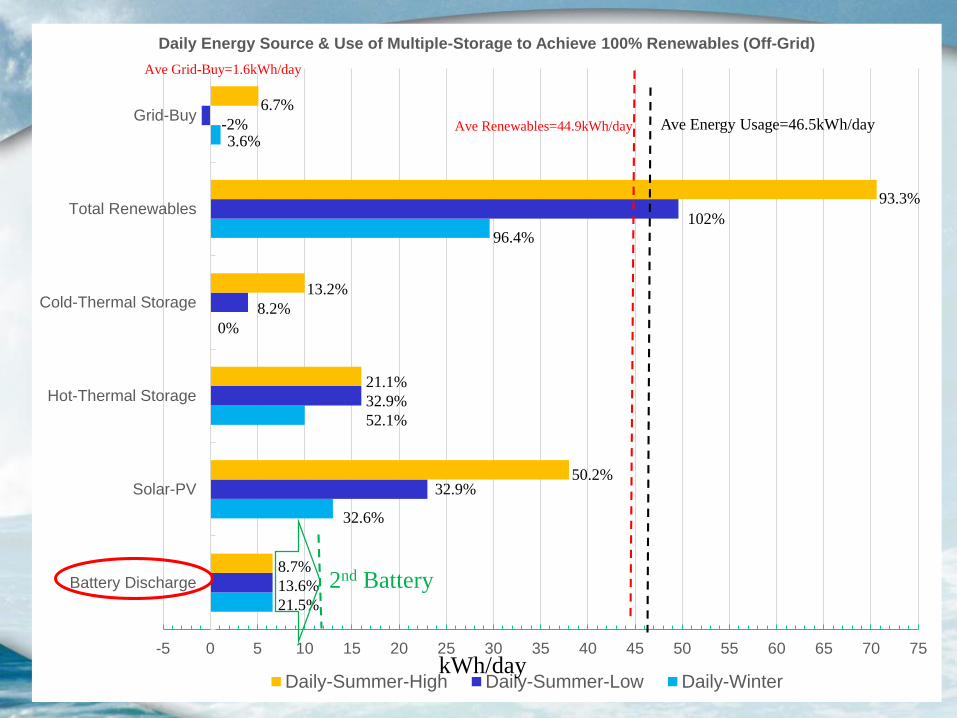
-5 0 5 10 15 20 25 30 35 40 45 50 55 60 65 70 75
Battery Discharge
Solar-PV
Hot-Thermal Storage
Cold-Thermal Storage
Total Renewables
Grid-Buy
Daily Energy Source & Use of Multiple-Storage to Achieve 100% Renewables (Off-Grid)
Daily-Summer-High Daily-Summer-Low Daily-WinterkWh/day
93.3%
102%
96.4%
8.7%
13.6%
21.5%
50.2%
21.1%
32.9%
52.1%
13.2%
6.7%
32.9%
32.6%
Ave Grid-Buy=1.6kWh/day
Ave Renewables=44.9kWh/day Ave Energy Usage=46.5kWh/day
2nd Battery
8.2%
0%
-2%3.6%
J.O.B. Technologies (Strategic
Marketing, Sales &
Technology)
47
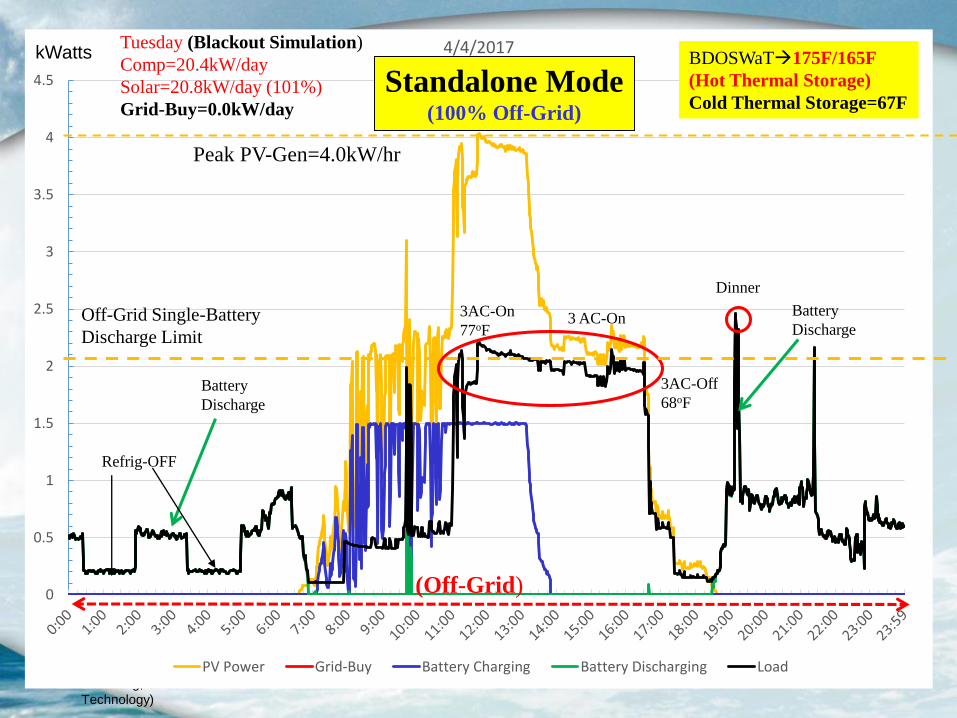
0
0.5
1
1.5
2
2.5
3
3.5
4
4.5
4/4/2017
PV Power Grid-Buy Battery Charging Battery Discharging Load
(Off-Grid)
Tuesday (Blackout Simulation)
Comp=20.4kW/day
Solar=20.8kW/day (101%)
Grid-Buy=0.0kW/day
BDOSWaT175F/165F
(Hot Thermal Storage)
Cold Thermal Storage=67F
Peak PV-Gen=4.0kW/hr
Dinner
3 AC-On
Battery
Discharge
Battery
Discharge
Refrig-OFF
Standalone Mode(100% Off-Grid)
3AC-On
77oF
3AC-Off
68oF
kWatts
Off-Grid Single-Battery
Discharge Limit
J.O.B. Technologies (Strategic
Marketing, Sales &
Technology)
48
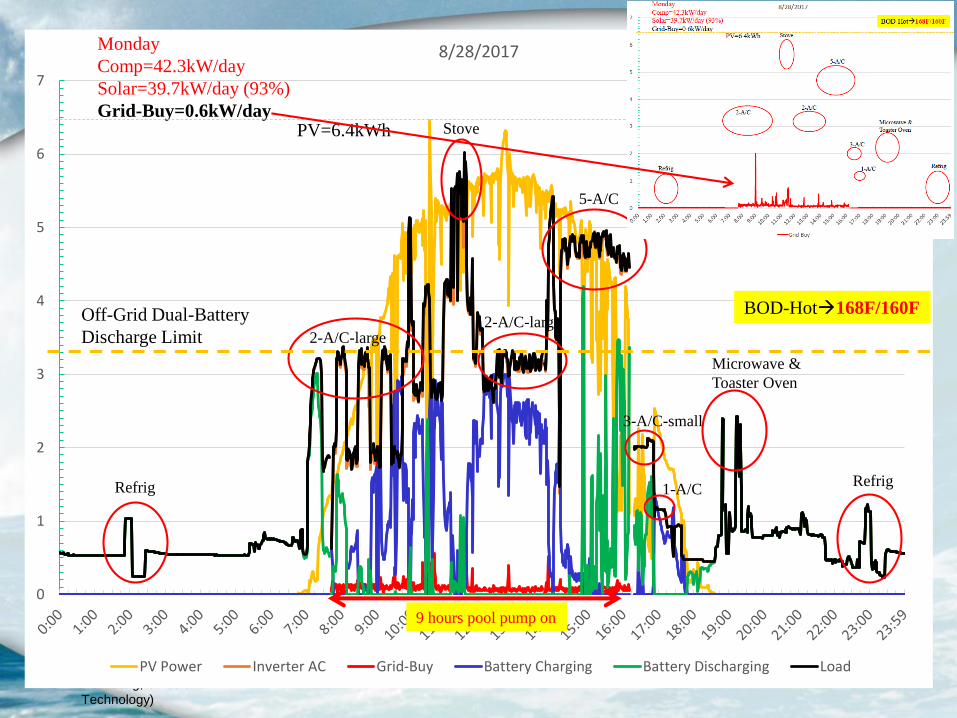
0
1
2
3
4
5
6
7
8/28/2017
PV Power Inverter AC Grid-Buy Battery Charging Battery Discharging Load
Monday
Comp=42.3kW/day
Solar=39.7kW/day (93%)
Grid-Buy=0.6kW/dayPV=6.4kWh
BOD-Hot168F/160F
Refrig Refrig
Microwave &
Toaster Oven
Stove
5-A/C
2-A/C-large2-A/C-large
3-A/C-small
1-A/C
9 hours pool pump on
Off-Grid Dual-Battery
Discharge Limit
J.O.B. Technologies (Strategic
Marketing, Sales &
Technology)
49
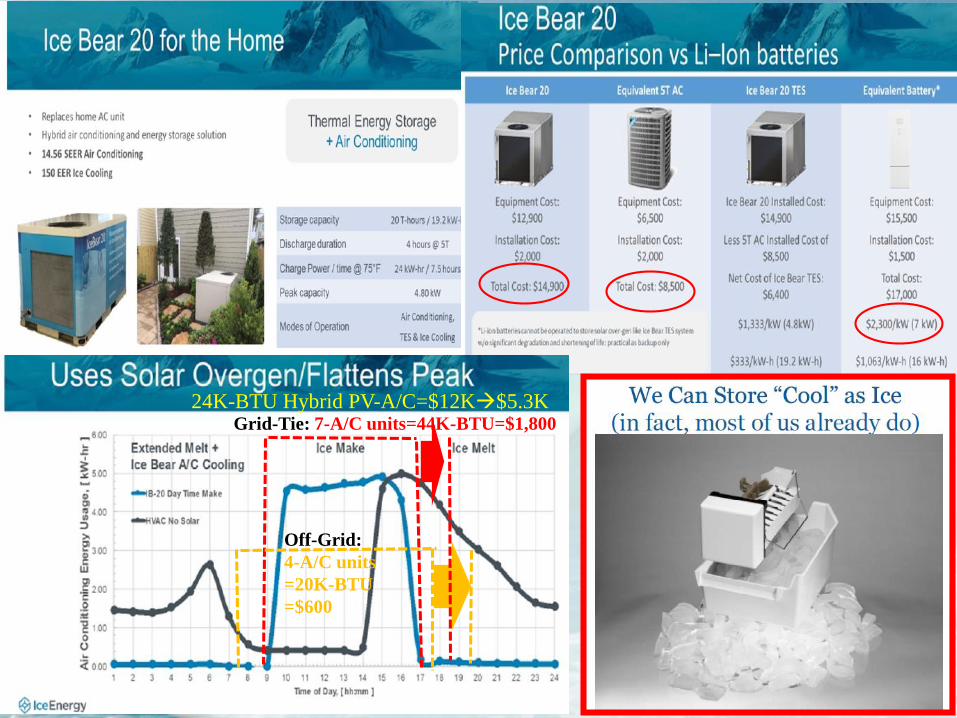
Grid-Tie: 7-A/C units=44K-BTU=$1,800
Off-Grid:
4-A/C units
=20K-BTU
=$600
24K-BTU Hybrid PV-A/C=$12K$5.3K
J.O.B. Technologies (Strategic
Marketing, Sales &
Technology)
50
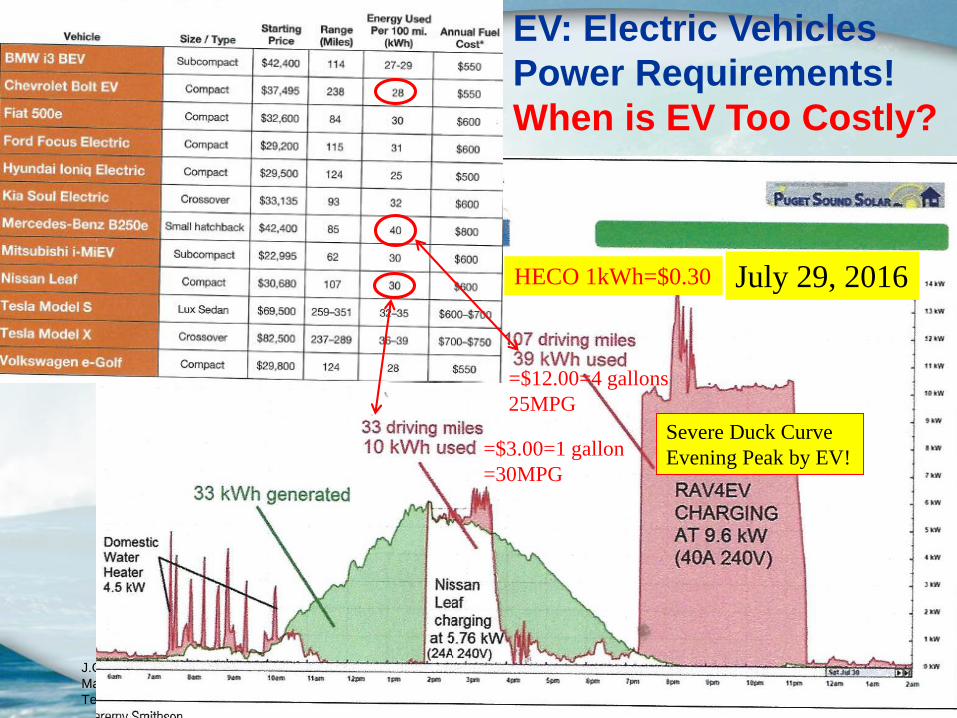
July 29, 2016
=$3.00=1 gallon
=30MPG
=$12.00=4 gallons
25MPG
HECO 1kWh=$0.30
EV: Electric Vehicles
Power Requirements!
When is EV Too Costly?
Severe Duck Curve
Evening Peak by EV!
51
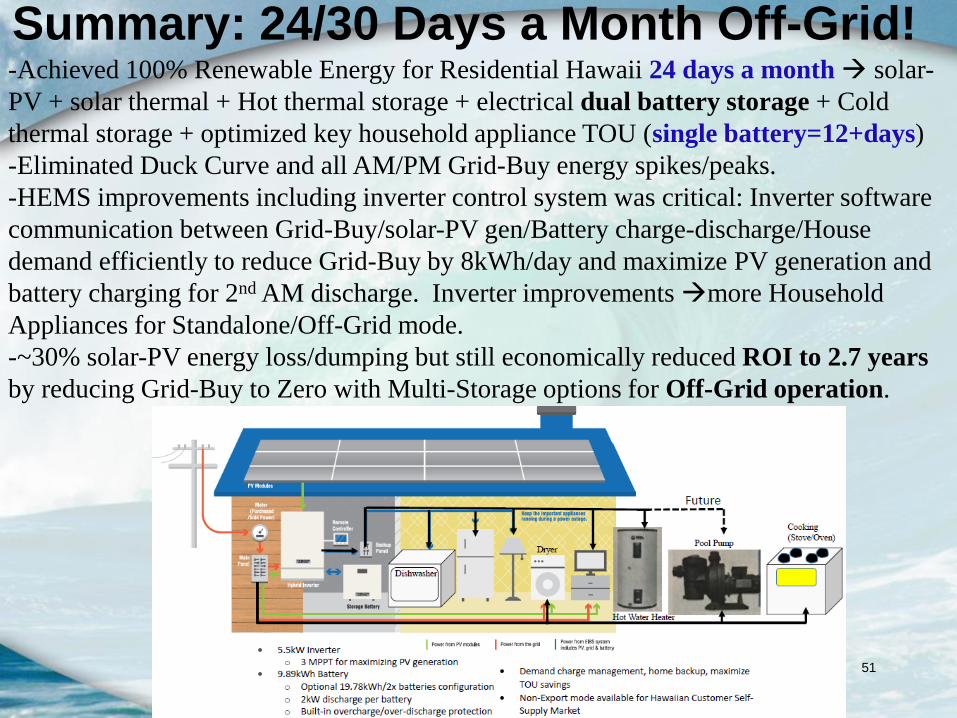
-Achieved 100% Renewable Energy for Residential Hawaii 24 days a month solar-
PV + solar thermal + Hot thermal storage + electrical dual battery storage + Cold
thermal storage + optimized key household appliance TOU (single battery=12+days)
-Eliminated Duck Curve and all AM/PM Grid-Buy energy spikes/peaks.
-HEMS improvements including inverter control system was critical: Inverter software
communication between Grid-Buy/solar-PV gen/Battery charge-discharge/House
demand efficiently to reduce Grid-Buy by 8kWh/day and maximize PV generation and
battery charging for 2nd AM discharge. Inverter improvements more Household
Appliances for Standalone/Off-Grid mode.
-~30% solar-PV energy loss/dumping but still economically reduced ROI to 2.7 years
by reducing Grid-Buy to Zero with Multi-Storage options for Off-Grid operation.
Summary: 24/30 Days a Month Off-Grid!
J.O.B. Technologies (Strategic
Marketing, Sales &
Technology)
52
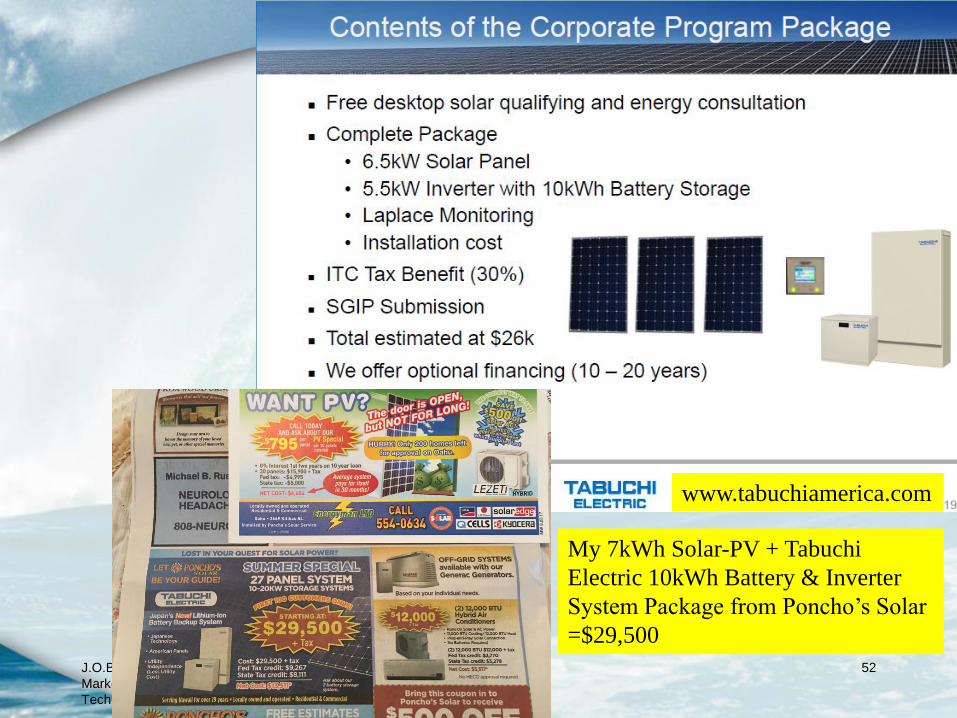
My 7kWh Solar-PV + Tabuchi
Electric 10kWh Battery & Inverter
System Package from Poncho’s Solar
=$29,500
www.tabuchiamerica.com