Embed Size (px)
Citation preview

Achievement Standard 2.6
Analysis & Interpretation
TYPE: ExternalCREDITS: 4

ACC 06/1/1 © NZCETA Curriculum & Membership Services
The Standard
Achievement Achievement with Merit
Achievement with Excellence
Analyse financial information.
Analyse a range of financial information.
Analyse a wide range of financial information.
Interpret information and make recommendation(s).
Interpret a range of information and make recommendation(s).
Interpret a wide range of information and make justified recommendation(s).

ACC 06/1/1 © NZCETA Curriculum & Membership Services
A wide range would typically involve nearly all of explanatory notes 3 and 6.
A recommendation details a strategy that will improve an identified weakness.
A justified recommendation explains how the recommendation will improve the identified weakness.
Explanatory Notes from the Standard

ACC 06/1/1 © NZCETA Curriculum & Membership Services
Analyse financial information means calculate analysis measures selected from:
measures of profitabilitymark-up percentagegross profit percentageexpenses percentagesnet profit percentagereturn on equity percentagerate of return on total assets percentage
measures of liquidityworking capitalcurrent ratio/working capital ratioliquid ratio/quick asset ratio
measures of financial stabilityequity ratio
measures of management effectivenessinventory turnoverage of accounts receivable.

ACC 06/1/1 © NZCETA Curriculum & Membership Services
• Formulae will be provided for analysis measures.
• Information will be selected from:- analysis measures- financial information presented as graphs, tables or financial statements- comparative figures- non-financial information.
• Interpret information will include using the context to:
- explain the analysis ratios - explain possible reasons for trends - explain possible consequences of a continued trend- provide links between analysis measures and other
information- provide links between related analysis measures- validly comment on an entity’s financial performance, and/or financial position, and/or cash flows, using comparative figures (including industry averages) and results of analysis- compare the financial and/or non-financial information
relating to the business, or to two sole proprietor businesses.

ACC 06/1/1 © NZCETA Curriculum & Membership Services
Subject Specification 2005
• Format of the paper– Series of Short Answer Questions– At least one PARAGRAPH question based
on a variety of resource information.
• Formulae WILL BE provided.
• A Resource Book WILL BE provided.
• RATIOS to be rounded to 2DP
• PERCENTAGES to be rounded to 1DP.

ACC 06/1/1 © NZCETA Curriculum & Membership Services

ACC 06/1/1 © NZCETA Curriculum & Membership Services
Teaching PointsAssessment Criteria Word
Possible meaning/requirement of the word(s)
Analyse •Calculate analysis measures
Interpret •Explain the analysis ratios, possible reasons for trends, possible consequences of a continued trend•Provide links between analysis measures and other information; between related analysis measures•Comment on the validity of an entity’s financial performance, and/or financial position, and/or cash flows, using comparative figures (including industry averages) and results of analysis•Compare the financial and/or non-financial information relating to the business, or to two sole proprietor businesses.
Recommendation •A Strategy that will improve an identified weakness
Justifiedrecommendation
•An explanation of how the recommendation(s) will improve the identified weakness

ACC 06/1/1 © NZCETA Curriculum & Membership Services
Three components of Business Health
Profitability
Stability Liquidity

ACC 06/1/1 © NZCETA Curriculum & Membership Services
Three Areas of Business Health
• Profitability– Am I making enough Net Profit
considering the efforts I am putting in and the money that I have tied up in business capital?
• Liquidity– Can I pay my bills as they fall due?
• Stability– Can I weather the storm if there is an
expected or unexpected downturn in profitability and/or liquidity?

ACC 06/1/1 © NZCETA Curriculum & Membership Services
Profitability Ratios

ACC 06/1/1 © NZCETA Curriculum & Membership Services
Gross Profit %Formula:
Gross Profit x 100
Net Sales
What does it tell us?• e.g. 30% this means for every $1 of Sales there is 30c of gross
profit.
• This tells us how much of our sales are returned as gross profit (the higher, the better) as expenses need to be covered.
How to Improve it?• Improve mark-up percentage.

ACC 06/1/1 © NZCETA Curriculum & Membership Services
Markup %Formula:
Gross Profit x 100
COGS
What does it tell us?• e.g. 25% this means that goods costing $1 will have 25c mark
up added to get the selling price of $1.25.
• This tells us the amount of profit added to the cost price to get the selling price.
How to Improve it?• Increase mark-up percentage.
• Change in sales mix.
• (A sales mix is a change in quantity sold of both high & low mark up goods).
• If Mark Up% increases, Gross Profit % increases or vice versa

ACC 06/1/1 © NZCETA Curriculum & Membership Services
Example of Markup % in Action
• e.g. Watches (50% MU) Earrings (15%)
• Sales Yr 1: 20 Watches 3 Earrings
• Sales Yr 2L 3 Watches 17 Earrings
• Year 2 will have a smaller profit because the business has sold less expensive items (watches) and more cheaper items (earrings).
• A business mark-up percentage depends on competitor’s mark up

ACC 06/1/1 © NZCETA Curriculum & Membership Services
Expense %Formula:
Expense Group x 100
Net Sales
What does it tell us?• e.g. SE% = 10%• This means for every $1 of sales, 10c goes towards paying selling
expenses. • This tells us the proportion of sales revenue that is spent on paying
expenses. It indicates how well expenses are being controlled.• e.g. Sales increases
Selling Expense increases• (more advertising, more sales’ person wages). However, SE% should
remain the same.• Administrative Expense = stay same. e.g. rent, therefore AE % decreases.
Because they will be less in proportion to sales.
How to Improve it?• Maintain better control over expenses.- Name the expense or expense
group that needs better control.

ACC 06/1/1 © NZCETA Curriculum & Membership Services
Net Profit %Formula:
Net Profit x 100
Net Sales
What does it tell us?e.g. 12% this means for every $1 of revenue, 12c is profit.
This tells us how much of sales is returned as net profit.
How to Improve it?• Decrease expense % by maintaining better control over
expenses.
• Increase GP% by increasing mark up%

ACC 06/1/1 © NZCETA Curriculum & Membership Services
Return on Equity (ROE or ROI)
Formula:
Net Profit x 100
Average OE
What does it tell us?• This measures the return on the owner’s investment in the
business.
• The return must be sufficient to compensate the owner for the risk taken by investing in the business.
• This return needs to be compared to alternative investment opportunities. e.g. interest rates, industry average return, return in other companies.
How to Improve it?• Increase net profit
Average OE =OE Beg + OE end 2

ACC 06/1/1 © NZCETA Curriculum & Membership Services
Return on Total Assets (ROTA)Formula:
Net Profit + Interest x 100
Average Total Assets
What does it tell us?• This measures how productive the assets we used are in earning
profit for the business. The business wants this to be as high possible.
• e.g. Old assets = Repairs/Maintenance increased
= NP decreased
= Return on Assets decreased
How to Improve it?• Improve Net Profit by maintaining better control over expenses
especially repairs & maintenance.
• Sell idle (unused) or obsolete (old) non-current assets.

ACC 06/1/1 © NZCETA Curriculum & Membership Services
Liquidity Ratios

ACC 06/1/1 © NZCETA Curriculum & Membership Services
Working CapitalFormula:
Current Assets – Current Liabilities
What does it tell us?E.g.: means the firm has $35,000 surplus of Current Assets over
Current Liabilities
How to Improve it?
• Borrow long term
• Invest more capital in form of cash.
• Sell idle non-current assets for cash
• Decrease drawings.

ACC 06/1/1 © NZCETA Curriculum & Membership Services
Current Ratio (Working Capital Ratio)
Formula:Current Assets
Current Liabilities = x : 1
What does it tell us?e.g. 2.5 : 1 means for every $1 of CL the firm has $2.5 of CA. This tells us
our ability to repay short-term debts (debts that are due in the next accounting period – 1 year).
Ratio should be at least 1:1. Problems of a high current ratio: High accounts receivable – Problem of bad debts, Too much inventory – may become obsolete (expired, out of fashion etc.), Too much cash -better invested in term deposit to earn interest.
How to Improve it?• Borrow long term • Invest more capital in form of cash.• Sell idle non-current assets for cash• Decrease drawings.
Optimal Current Ratio 2:1

ACC 06/1/1 © NZCETA Curriculum & Membership Services
Liquid Ratio (Quick Assets Ratio)
Formula:
• Inventory and Prepayments are subtracted from CA as there is no guarantee they can be turned into cash in 1-3 months.
• Secured bank overdraft is deducted as the bank has given the business permission to be in overdraft and does not need to be
repaid immediately.
CA-Inventory & Prepayment CL- Secured Bank OD = x :1
ACC 06/1/1 © NZCETA Curriculum & Membership Services
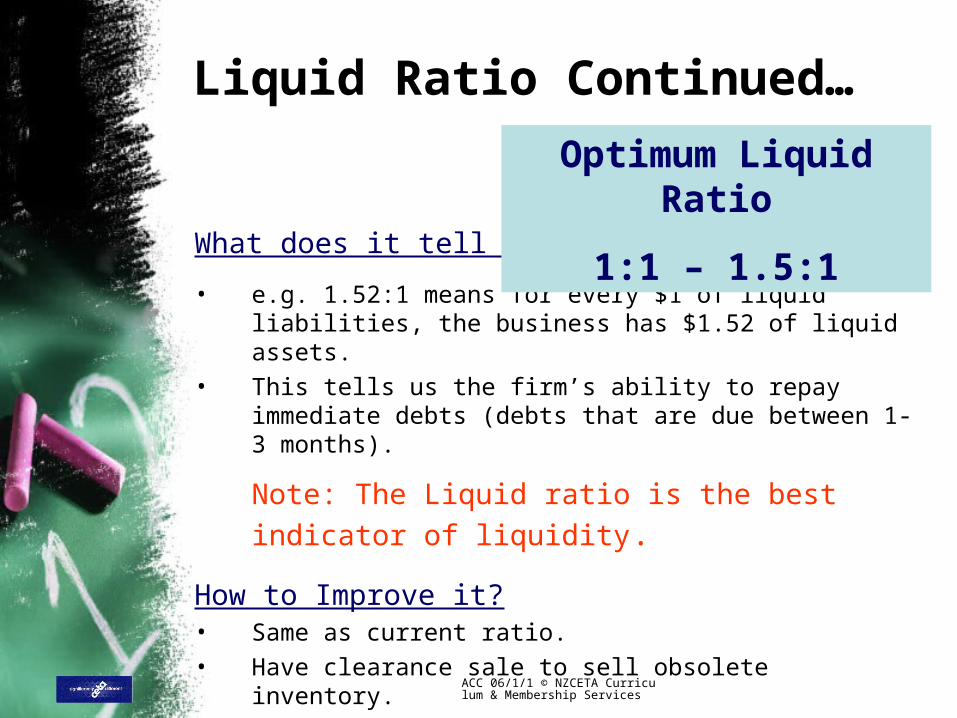
Liquid Ratio Continued…
What does it tell us?
• e.g. 1.52:1 means for every $1 of liquid liabilities, the business has $1.52 of liquid assets.
• This tells us the firm’s ability to repay immediate debts (debts that are due between 1- 3 months).
Note: The Liquid ratio is the best indicator of
liquidity.
How to Improve it?• Same as current ratio.• Have clearance sale to sell obsolete inventory.
Optimum Liquid Ratio
1:1 – 1.5:1

ACC 06/1/1 © NZCETA Curriculum & Membership Services
Financial Stability Ratios

ACC 06/1/1 © NZCETA Curriculum & Membership Services
Equity Ratio (Gearing Ratio)Formula:
Owner’s Equity = x : 1
Total Assets
What does it tell us?
• e.g. 0.6:1 means for every $1 of assets the owner has financed 60c.
• This tells us how much of the business assets has been financed by the owner.
• The ratio needs to be greater than 0.5:1
• If the ratio is less than 0.5:1, the creditors will force the business to sell the assets to repay them back.
• If the ratio is too high, this means the business is not making use of external funds (borrowing) to expand the business.
How to Improve it?
• If the ratio is low, the owner must invest more capital.
• If the ratio is high, borrow more long term funds.
Optimum Equity Ratio
0.6:1 – 0.8:1

ACC 06/1/1 © NZCETA Curriculum & Membership Services
Management Effectiveness Ratios

ACC 06/1/1 © NZCETA Curriculum & Membership Services
Inventory Turnover
Formula:
Cost of Goods Sold
Average Inventory
=_____times per year

ACC 06/1/1 © NZCETA Curriculum & Membership Services
Inventory Turnover Continued…
What does it tell us?e.g. 12 times per year means that the business is selling on average its entire stock 12 times per year.
Tells us how long an average inventory is in the store before it is sold and how many times the business sells its entire inventory.
The ideal inventory turnover depends on the type of business activity.
e.g. a jeweller may have 1 or 2 stock turns a year, a greengrocer 200 stock turns a year and a baker will have to have a daily turnover period otherwise the stock is stale and worthless.
•Each different business would have its own industry average.
•Goods with a higher mark-up% usually have a lower turnover.(interrelation). Lower mark-up made up for by greater sales, therefore a high stock turn..

ACC 06/1/1 © NZCETA Curriculum & Membership Services
Inventory Turnover Continued…
• Problems with a low inventory turnover:
– Money better invested elsewhere. – Higher insurance premiums– Store and warehousing cost– Greater risk of
deterioration/obsolescence (out of date)
– Stock items stolen

ACC 06/1/1 © NZCETA Curriculum & Membership Services
Inventory Turnover Continued…
How to Improve the Inventory Turnover Ratio
• Review purchasing procedure (why are we buying too much?)
• Have clearance sale to sell off obsolete stock.

ACC 06/1/1 © NZCETA Curriculum & Membership Services
Formula:
What does it tell us?• e.g. 35.4 = 36 days
35.8 = 36 days
35.001 = 36 days
• Note: ALWAYS round to the next full day. (general rounding rule does not apply)
• Means that the business is collecting its accounts receivable on an average every 36 days.
• Indicates how many days our customers take on average to pay their debts.
• Should be an average 35-40 days or better.
How to Improve it?• Write off long overdue a/c as Bad debts.
• Perform credit checks.
• Encourage payment of accounts by offering discounts or charge interest for overdue accounts.
• Review credit collection policies. i.e. send regular statements.
Age of Accounts Receivable
Average Accounts Receivable X 365Net credit sales + GST 1
Optimum Age of Accounts Receivable Ratio
35 – 40 days or LESS

ACC 06/1/1 © NZCETA Curriculum & Membership Services
Interpretation- What do all the
numbers mean???

ACC 06/1/1 © NZCETA Curriculum & Membership Services
Profitability• An increase in Mark Up Percentage will increase
Gross Profit Percentage and vice versa.
• Mark Up Percentage is linked to both sales and inventory turnover. A decrease in mark up should lead to an increase in sales, and an increase in inventory turnover as the sales volume has improved.
• An increase in Gross Profit Percentage should lead to an increase in Net Profit Percentage. If not, the firm has less control over expenses.
• A decrease in Expenses Percentage (better control over expenses) should lead to an increase in Net Profit Percentage.

ACC 06/1/1 © NZCETA Curriculum & Membership Services
Profitability Continued…
• A decrease in Net Profit Percentage is not necessarily detrimental for the firm as the net profit figure in the Statement of Financial Performance has increased. A higher net profit figure means that the firm is more profitable even though it may have a lower Net Profit Percentage.
• An increase in net profit figure will usually lead to an increase in the return on owner’s equity.
• If the capital figure in the Statement of Financial Position has increased, and Net Profit has remained constant the return on owner’s equity would decrease.

ACC 06/1/1 © NZCETA Curriculum & Membership Services
Liquidity/Management Effectiveness
Current Ratio
Liquid Ratio
Causes Recommendation
High High Too much cash Age of Accounts
Receivable slow
Better invested in interest bearing accounts
Write off bad debts, and check credit collection policies
High Low Decrease in Inventory turnover with the possibility of obsolete stock or overstocking
Clearance sale of obsolete stock or
Check procedures when purchasing stock or
write off any obsolete stock
Low High a large secured bank overdraft
Check assets have been financed by non current liabilities (long term sources)
Low Low Increase in unsecured bank overdraft
Assets financed from short term rather than long term sources
Owner invests cash or reduces amount of drawings
Check assets have been financed by non current liabilities (long term sources)

ACC 06/1/1 © NZCETA Curriculum & Membership Services
Stability
• If the Equity ratio is low and the liquid ratio is low, the owner should invest more capital
• If the Equity ratio is high and the liquid ratio is low, the firm should borrow from long term sources eg increase mortgage