Embed Size (px)
Citation preview

NCEE 2011-4001
Achievement Effects of Four Early Elementary School Math Curricula Findings for First and Second Graders

This page intentionally left blank for double-sided copying.
Achievement Effects of Four Early
Elementary School Math Curricula Findings for First and Second Graders
October 2010 Roberto Agodini Barbara Harris Melissa Thomas Mathematica Policy Research, Inc. Robert Murphy Lawrence Gallagher SRI International Audrey Pendleton Project Officer Institute of Education Sciences
NCEE 2011-4001 U.S. DEPARTMENT OF EDUCATION

U.S. Department of Education Arne Duncan Secretary Institute of Education Sciences John Q. Easton Director National Center for Education Evaluation and Regional Assistance Rebecca Maynard Commissioner October 2010
This report was prepared for the Institute of Education Sciences under Contract No. ED-04-CO-0112/0003. The project officer was Audrey Pendleton in the National Center for Education Evaluation and Regional Assistance.
IES evaluation reports present objective information on the conditions of implementation and impacts of the programs being evaluated. IES evaluation reports do not include conclusions or recommendations or views with regard to actions policymakers or practitioners should take in light of the findings in the reports.
This publication is in the public domain. Authorization to reproduce it in whole or in part is granted. While permission to reprint this publication is not necessary, the citation should be: Roberto Agodini, Barbara Harris, Melissa Thomas, Robert Murphy, and Lawrence Gallagher (2010). Achievement Effects of Four Early Elementary School Math Curricula: Findings for First and Second Graders (NCEE 2011-4001). Washington, DC: National Center for Education Evaluation and Regional Assistance, Institute of Education Sciences, U.S. Department of Education.
To order copies of this report,
• Write to ED Pubs, Education Publications Center, U.S. Department of Education, P.O.
Box 22207, Alexandria, VA 22304. • Call in your request toll free to 1-877-4ED-Pubs. If 877 service is not yet available in
your area, call 800-872-5327 (800-USA-LEARN). Those who use a telecommunications device for the deaf (TDD) or a teletypewriter (TTY) should call 800-437-0833.
• Fax your request to 703-605-6794. • Order online at www.edpubs.org.
This report also is available on the IES website at http://ies.ed.gov/ncee. Upon request, this report is available in alternate formats such as Braille, large print, audiotape, or computer diskette. For more information, please contact the Department’s Alternate Format Center at 202-260-9895 or 202-205-8113.
ACKNOWLEDGMENTS
This study was made possible by the collaboration and hard work of many individuals beyond the study authors. We appreciate the willingness of the participating districts, schools, and teachers to use the study’s curricula, and to respond to the data requests that are the basis for this report. We also appreciate the willingness of the curriculum publishers to take part in this evaluation. We benefited from useful comments of the study’s technical working group: Richard Askey, Douglas Clements, Thomas Cook, Lynn Fuchs, Tom Loveless, Kevin Miller, Donald Rock, and Hung-Hsi Wu.
We thank Sheila Heaviside for helping to direct initial phases of the student testing and other data collection efforts and for her continued guidance through the later phases. Sally Atkins-Burnett worked with ETS to develop the student assessment for second grade and led the effort to design the classroom observation protocol and train observers. Phil Vahey, Alix Gallagher, and Teresa Lara-Meloy reviewed curriculum materials and contributed to the development of the curriculum adherence measures. Tim Bruursema, Katherine Burnett, Leonard Brown, Melissa Cidade, Melissa Dugger, Kristina Rall, Jillian Stein, and Valerie Williams helped manage the data collection effort. Season Bedell-Boyle, Loring Funaki, and Richard Godwin coordinated the team of about 100 student testers. The classroom observation effort included nearly 60 individuals, whom we thank for their willingness to travel week after week. In addition to the many observers, Amy Hafter, Christopher Sanford, Reina Fuji, and Bowyee Gong coordinated the classroom observation effort. Bladimir Lopez-Prado, Ron Orpitelli, and Paul Hu processed the classroom observation and teacher survey data. Mark Brinkley, Andrew Frost, Douglas Dougherty, and Joel Zief provided systems support, Tong Li programmed the computer-assisted test instruments, and Donsig Jang provided sampling support. Annalisa Mastri helped to create the student achievement analysis files. We thank Timothy Novak, Anna Comerford, Andrew McGuirk, and Carol Razafindrakato, for their research programming expertise. Neil Seftor provided useful comments on an earlier version of the report. Marjorie Mitchell, Jill Miller, and William Garrett produced the report.
Last, but far from least, we thank the team of site recruiters who diligently worked to secure all of the participating districts and schools. The recruiters included several report authors, Raquel af Ursin, Alex Bogin, Larissa Campuzano, John Deke, Patricia Del Grosso, Josh Haimson, Kristin Hallgren, Sheila Heaviside, Benita Kim, Jeffrey Max, and Timothy Silman.
The Authors
v

This page intentionally left blank for double-sided copying.
DISCLOSURE OF POTENTIAL CONFLICTS OF INTEREST
The research team for this evaluation consists of a prime contractor, Mathematica Policy Research, and a main subcontractor, SRI International. Neither organization nor its key staff have financial interests that could be affected by the findings from the evaluation. None of the study’s Technical Working Group members, which were convened by the research team to provide advice on key features of the study, have financial interests that could be affected by the evaluation’s findings.
vii

This page intentionally left blank for double-sided copying.

CONTENTS
Chapter Page
EXECUTIVE SUMMARY ........................................................................................... xxi
I INTRODUCTION ..........................................................................................................1
A. RATIONALE FOR THE STUDY ...........................................................................2 B. RESEARCH QUESTIONS AND STUDY DESIGN ..............................................4 C. IMPLEMENTING THE STUDY AND SCHOOL CHARACTERISTICS ............5
1. Curricula Examined in the Study .....................................................................5 2. Recruiting Study Participants ..........................................................................9 3. Characteristics of Participating Districts and Schools ...................................11 4. Implementing the Randomized Controlled Trial and Statistical Power ........14
D. OUTCOME MEASURE AND OTHER DATA COLLECTION .........................18
1. Outcome Measure ..........................................................................................20 2. Other Data Collection ....................................................................................22
II CURRICULUM IMPLEMENTATION .......................................................................25
A. CURRICULUM IMPLEMENTATION WAS ASSESSED THROUGH TEACHER SURVEYS AND CLASSROOM OBSERVATIONS ...............26 1. Summary of Key Implementation Findings ...................................................26 2. Teacher Characteristics ..................................................................................27
B. TEACHER CURRICULUM TRAINING .............................................................33
1. Curriculum Training Provided by Publishers ................................................33 2. At Least 98 Percent of Teachers Attended at Least One Training
Session ...........................................................................................................38 3. Other Sources of Professional Development .................................................39
ix
CONTENTS (continued)
Chapter Page
C. INSTRUCTIONAL SUPPORT .............................................................................39
1. About Two-thirds of Teachers Had a Math Coach or Specialist Available ........................................................................................................41
2. Teachers Also Had Other Instructional Supports ..........................................41
D. TEACHER USE OF THE ASSIGNED CURRICULUM .....................................45
1. At Least 98 Percent of Teachers Reported Using Their Assigned Curriculum .....................................................................................................47
2. Rates of Supplementation with Other Materials Varied in Second Grade, but Not in First Grade ........................................................................47
3. The Fraction of Teachers Using the Expected Number of Lessons Varied Across the Curricula in First Grade, but Not in Second ....................54
4. Teachers’ Desire to Use Their Assigned Curriculum in the Future Varied ............................................................................................................54
5. Saxon Teachers Reported Spending More Time on Math Instruction ...........54 6. The Time Spent Practicing Math Facts and Procedures Varied in First
Grade, but Not in Second ...............................................................................55
E. MATH CONTENT COVERAGE AND CURRICULUM ADHERENCE ...........56
1. Coverage of Math Content Areas Varied Across the Curricula.....................56 2. Curriculum Adherence Was Measured Using Information from the
Spring Surveys and Classroom Observations ................................................60
III CURRICULUM EFFECTS ON FIRST- AND SECOND-GRADE ACHIEVEMENT ..........................................................................................................69
A. BASELINE EQUIVALENCE ...............................................................................70 B. METHODS USED TO CALCULATE RELATIVE CURRICULUM
EFFECTS ...............................................................................................................73 C. RELATIVE EFFECTS OF THE CURRICULA ...................................................74
1. In Both the First and Second Grades, the Math Curriculum Used by the Study Schools Mattered .................................................................................77
2. Curriculum Differentials Exist in About Three-Quarters of the Subgroups Examined .....................................................................................78
x
CONTENTS (continued)
Chapter Page
IV EXPLORATORY LOOK AT WHAT ACCOUNTS FOR THE RELATIVE CURRICULUM EFFECTS ..........................................................................................87
A. TEACHING APPROACHES AND PRACTICES MEASURED USING CLASSROOM OBSERVATIONS .......................................................................88
1. THE CLASSROOM OBSERVATION PROTOCOL ...................................88 2. APPROACH TO CONSTRUCTING SCALES ............................................90 3. SCALES CONSTRUCTED ...........................................................................90
B. CURRICULUM GROUP DIFFERENCES IN THE CLASSROOM OBSERVATION SCALES ...................................................................................93
C. CORRELATIONAL ANALYSES OF RELATIVE EFFECTS AND KEY
IMPLEMENTATION DIFFERENCES BETWEEN THE CURRICULA ...........97
REFERENCES ............................................................................................................103
APPENDIX A: DATA COLLECTION AND RESPONSE RATES ......................... A.1
APPENDIX B: TEACHER-REPORTED FREQUENCY OF IMPLEMENTING OTHER CURRICULUM- SPECIFIC ACTIVITIES ................................................................. B.1 APPENDIX C: GLOSSARY OF CURRICULUM-SPECIFIC TERMS ................. C.1
APPENDIX D: CONSTRUCTING THE ANALYSIS SAMPLES AND ESTIMATING CURRICULUM EFFECTS .......................... D.1
xi

This page intentionally left blank for double-sided copying.

TABLES
Table Page
I.1 CHARACTERISTICS OF U.S. DISTRICTS AND PARTICIPATING DISTRICTS .....................................................................................................................12
I.2 CHARACTERISTICS OF U.S. ELEMENTARY SCHOOLS AND
PARTICIPATING SCHOOLS ........................................................................................13 I.3 NUMBER OF SCHOOLS, CLASSROOMS, AND STUDENTS INCLUDED IN
THE FIRST- AND SECOND-GRADE ANALYSES, IN TOTAL AND BY CURRICULUM ..............................................................................................................15
I.4 FIRST-GRADE ANALYSIS SAMPLE: BASELINE SCHOOL
CHARACTERISTICS BY CURRICULUM ..................................................................16 I.5 SECOND-GRADE ANALYSIS SAMPLE: BASELINE SCHOOL
CHARACTERISTICS BY CURRICULUM ..................................................................17 I.6 RESEARCH QUESTIONS AND SUPPORTING DATA COLLECTION
EFFORTS ........................................................................................................................20 II.1 FIRST-GRADE TEACHER CHARACTERISTICS BY CURRICULUM ...................28 II.2 SECOND-GRADE TEACHER CHARACTERISTICS BY CURRICULUM ...............30 II.3 CURRICULA PREVIOUSLY USED BY TEACHERS ................................................34 II.4 FIRST-GRADE TEACHER TRAINING ON THE ASSIGNED CURRICULUM .......36 II.5 SECOND-GRADE TEACHER TRAINING ON THE ASSIGNED
CURRICULUM ..............................................................................................................37 II.6 NON-STUDY TEACHER PROFESSIONAL DEVELOPMENT IN MATH
DURING THE SCHOOL YEAR ....................................................................................40 II.7 INSTRUCTIONAL SUPPORT AT STUDY SCHOOLS ...............................................42 II.8 INSTRUCTIONAL CLIMATE AT FIRST-GRADE STUDY SCHOOLS ...................43 II.9 INSTRUCTIONAL CLIMATE AT SECOND-GRADE STUDY SCHOOLS ..............44 II.10 INSTRUCTIONAL MATERIALS AND PUBLISHER SUPPORT ..............................46
xiii

TABLES (continued)
II.11 TEACHER INSTRUCTION AS REPORTED IN THE FALL: FIRST GRADE ..........48 II.12 TEACHER INSTRUCTION AS REPORTED IN THE FALL: SECOND GRADE .....49 II.13 TEACHER INSTRUCTION AS REPORTED IN THE SPRING: FIRST GRADE ......50 II.14 TEACHER INSTRUCTION AS REPORTED IN THE SPRING: SECOND
GRADE ...........................................................................................................................52 II.15 AVERAGE NUMBER OF LESSONS IN VARIOUS MATH CONTENT
AREAS: FIRST GRADE ................................................................................................58 II.16 AVERAGE NUMBER OF LESSONS IN VARIOUS MATH CONTENT
AREAS: SECOND GRADE ...........................................................................................59 II.17 TEACHER-REPORTED CURRICULUM ADHERENCE BY GRADE ......................66 II.18 OBSERVED CURRICULUM ADHERENCE BY GRADE ON ESSENTIAL
DAILY CURRICULUM ACTIVITIES ..........................................................................67 III.1 BASELINE CHARACTERISTICS OF FIRST- AND SECOND-GRADE
LONGITUDINAL STUDENTS IN TOTAL AND BY CURRICULUM .....................71 III.2 DIFFERENCE BETWEEN PAIRS OF CURRICULA IN AVERAGE HLM-
ADJUSTED SPRING STUDENT MATH ACHIEVEMENT (IN EFFECT SIZES), FIRST AND SECOND-GRADE STUDENTS .................................................76
III.3 FIRST GRADERS: DIFFERENCE BETWEEN PAIRS OF CURRICULA IN
AVERAGE HLM-ADJUSTED SPRING MATH ACHIEVEMENT, BY SUBGROUPS AND IN EFFECT SIZES ........................................................................80
III.4 SECOND GRADERS: DIFFERENCE BETWEEN PAIRS OF CURRICULA IN
AVERAGE HLM-ADJUSTED SPRING MATH ACHIEVEMENT, BY SUBGROUPS AND IN EFFECT SIZES ........................................................................82
III.5 NUMBER OF STATISTICALLY SIGNIFICANT CURRICULUM
DIFFERENTIALS IN EACH FIRST- AND SECOND-GRADE SUBGROUP, UNADJUSTED STATISTICAL TESTS .................................................84 III.6 NUMBER OF STATISTICALLY SIGNIFICANT CURRICULUM
DIFFERENTIALS IN EACH FIRST- AND SECOND-GRADE SUBGROUP, ADJUSTED STATISTICAL TESTS ......................................................86
xiv
TABLES (continued)
IV.1 SECTIONS OF THE CLASSROOM OBSERVATION PROTOCOL THAT CONTAIN CROSS-CURRICULUM ITEMS ................................................................89
IV.2 OBSERVATION ITEMS IN EACH SCALE .................................................................91 IV.3 DIFFERENCE BETWEEN PAIRS OF CURRICULA IN AVERAGE HLM-ADJUSTED CLASSROOM OBSERVATION SCALES, IN EFFECT SIZES FOR FIRST- AND SECOND-GRADE CLASSROOMS ...................................94 IV.4 RELATIONSHIP BETWEEN SPRING STUDENT MATH ACHIEVEMENT OF
CURRICULUM GROUPS THAT HAVE SIGNIFICANTLY DIFFERENT ACHIEVEMENT, AND TEACHER BEHAVIORS THAT ARE SIGNIFICANTLY DIFFERENT ACROSS THE CURRICULUM GROUPS,
IN EFFECT SIZES ........................................................................................................101 A.1 PARTICIPATING SCHOOLS AND CLASSROOMS BY CURRICULUM. ............. A.5 A.2 NUMBER AND PERCENTAGE OF TEACHERS COMPLETING THE MATH
KNOWLEDGE ASSESSMENT AND FALL AND SPRING SURVEYS, BY GRADE AND CURRICULUM .................................................................................... A.9
A.3 NUMBER OF CLASSROOMS SAMPLED AND OBSERVED, BY GRADE
AND CURRICULUM ................................................................................................. A.11 A.4 NUMBER AND PERCENTAGE OF SAMPLED STUDENTS TESTED AND
TYPES OF NONRESPONSE ..................................................................................... A.15 A.5 NUMBER AND PERCENTAGE OF BASELINE STUDENTS AND NEW
ARRIVERS SAMPLED FOR TESTING, BY ROUND OF TESTING AND CURRICULUM .......................................................................................................... A.15
A.6 TESTING RATE FOR THE LONGITUDINAL SAMPLES ..................................... A.18
A.7 TESTING RATE FOR THE SPRING CROSS-SECTIONAL SAMPLES ................ A.19
A.8 NUMBER AND PERCENTAGE OF STUDENTS FOR WHOM
DEMOGRAPHIC RECORDS AND INDIVIDUAL DEMOGRAPHIC ITEMS WERE COLLECTED, BY GRADE ........................................................................... A.21
B.1 INVESTIGATIONS FIRST-GRADE SAMPLE: TEACHER-REPORTED
FREQUENCY OF IMPLEMENTING CURRICULUM ACTIVITIES ....................... B.6
B.2 INVESTIGATIONS: SECOND-GRADE SAMPLE: TEACHER-REPORTED FREQUENCY OF IMPLEMENTING CURRICULUM ACTIVITIES ....................... B.7
xv

TABLES (continued)
B.3 INVESTIGATIONS: TEACHER-REPORTED SUCCESS AT FACILITATING
DISCUSSIONS FOCUSED ON PROCESS ................................................................. B.8
B.4 INVESTIGATIONS FIRST-GRADE SAMPLE: OBSERVED FREQUENCY OF IMPLEMENTING CURRICULUM ACTIVITIES ................................................ B.9
B.5 INVESTIGATIONS SECOND-GRADE SAMPLE: OBSERVED FREQUENCY
OF IMPLEMENTING CURRICULUM ACTIVITIES ............................................. B.11 B.6 MATH EXPRESSIONS FIRST-GRADE SAMPLE: TEACHER-REPORTED
FREQUENCY OF IMPLEMENTING CURRICULUM ACTIVITIES ..................... B.13
B.7 MATH EXPRESSIONS SECOND-GRADE SAMPLE: TEACHER-REPORTED FREQUENCY OF IMPLEMENTING CURRICULUM ACTIVITIES ..................... B.14
B.8 MATH EXPRESSIONS: TEACHER-REPORTED SUCCESS AT
FACILITATING DISCUSSIONS FOCUSED ON PROCESS .................................. B.15
B.9 MATH EXPRESSIONS FIRST-GRADE SAMPLE: OBSERVED FREQUENCY OF IMPLEMENTING CURRICULUM ACTIVITIES .............................................. B.16
B.10 MATH EXPRESSIONS SECOND-GRADE SAMPLE: OBSERVED
FREQUENCY OF IMPLEMENTING CURRICULUM ACTIVITIES .................... B.18
B.11 SAXON FIRST-GRADE SAMPLE: TEACHER-REPORTED FREQUENCY OF IMPLEMENTING CURRICULUM ACTIVITIES .................................................... B.20
B.12 SAXON SECOND-GRADE SAMPLE: TEACHER-REPORTED FREQUENCY
OF IMPLEMENTING CURRICULUM ACTIVITIES .............................................. B.21
B.13 SAXON FIRST-GRADE SAMPLE: OBSERVED FREQUENCY OF IMPLEMENTING CURRICULUM ACTIVITIES .................................................... B.22
B.14 SAXON SECOND-GRADE SAMPLE: OBSERVED FREQUENCY OF
IMPLEMENTING CURRICULUM ACTIVITIES .................................................... B.24 B.15 SFAW FIRST-GRADE SAMPLE: TEACHER-REPORTED FREQUENCY OF
IMPLEMENTING CURRICULUM ACTIVITIES .................................................... B.26
B.16 SFAW SECOND-GRADE SAMPLE: TEACHER-REPORTED FREQUENCY OF IMPLEMENTING CURRICULUM ACTIVITIES .............................................. B.27
xvi
TABLES (continued)
B.17 SFAW FIRST-GRADE SAMPLE: OBSERVED FREQUENCY OF IMPLEMENTING CURRICULUM ACTIVITIES .................................................... B.28
B.18 SFAW SECOND-GRADE SAMPLE: OBSERVED FREQUENCY OF
IMPLEMENTING CURRICULUM ACTIVITIES .................................................... B.30 B.19 INTER-RATER RELIABILITY BY ITEM: ADHERENCE DATA ......................... B.32
C.1 INTER-RATER RELIABILITY BY ITEM: CROSS-CURRICULUM DATA ........... C.7 C.2 FACTOR LOADINGS FOR THE FOUR-FACTOR EFA RESULTS ...................... C.12 C.3 ITEMS INCLUDED IN THE STUDENT-CENTERED INSTRUCTION SCALE, CURRICULUM GROUP DIFFERENCES: FIRST-GRADE
CLASSROOMS .......................................................................................................... C.16 C.4 ITEMS INCLUDED IN THE STUDENT-CENTERED INSTRUCTION SCALE, CURRICULUM GROUP DIFFERENCES: SECOND-GRADE
CLASSROOMS .......................................................................................................... C.17 C.5 ITEMS INCLUDED IN THE TEACHER-DIRECTED INSTRUCTION SCALE, CURRICULUM GROUP DIFFERENCES: FIRST-GRADE
CLASSROOMS .......................................................................................................... C.18 C.6 ITEMS INCLUDED IN THE TEACHER-DIRECTED INSTRUCTION SCALE, CURRICULUM GROUP DIFFERENCES: SECOND-GRADE CLASSROOMS .......................................................................................................... C.19 C.7 ITEMS INCLUDED IN THE PEER COLLABORATION SCALE,
CURRICULUM GROUP DIFFERENCES: FIRST-GRADE CLASSROOMS .......................................................................................................... C.20 C.8 ITEMS INCLUDED IN THE PEER COLLABORATION SCALE,
CURRICULUM GROUP DIFFERENCES: SECOND-GRADE CLASSROOMS .......................................................................................................... C.21 D.1 MODEL-BASED IMPUTATION OF MISSING DATA, FIRST-GRADE
LONGITUDINAL SAMPLE ........................................................................................ D.6 D.2 MODEL-BASED IMPUTATION OF MISSING DATA, SECOND-GRADE
LONGITUDINAL SAMPLE ........................................................................................ D.7 D.3 MODEL-BASED IMPUTATION OF MISSING DATA, FIRST-GRADE
CROSS-SECTIONAL SAMPLE .................................................................................. D.8
xvii
TABLES (continued)
D.4 MODEL-BASED IMPUTATION OF MISSING DATA, SECOND-GRADE CROSS-SECTIONAL SAMPLE .................................................................................. D.9
D.5 AVERAGE UNADJUSTED STUDENT MATH SCORES, BY GRADE AND
CURRICULUM .......................................................................................................... D.11 D.6 HIERARCHICAL LINEAR MODEL ESTIMATES FOR THE FIRST-GRADE
LONGITUDINAL SAMPLE: OUTCOME IS SPRING MATH SCALE SCORE .... D.15
D.7 HIERARCHICAL LINEAR MODEL ESTIMATES FOR THE SECOND-GRADE LONGITUDINAL SAMPLE: OUTCOME IS SPRING MATH
SCALE SCORE ........................................................................................................... D.17
D.8 HIERARCHICAL LINEAR MODEL ESTIMATES FOR THE FIRST- AND SECOND-GRADE CROSS-SECTIONAL SAMPLES: OUTCOME IS SPRING MATH SCALE SCORE .............................................................................................. D.21
D.9 DIFFERENCE BETWEEN PAIRS OF CURRICULA IN AVERAGE HLM-
ADJUSTED SPRING STUDENT MATH ACHIEVEMENT FOR THE FIRST-AND SECOND-GRADE CROSS-SECTIONAL SAMPLES, IN EFFECT SIZES ........................................................................................................... D.23
D.10 SAMPLE SIZES USED IN FIRST-GRADE SUBGROUP ANALYSES .................. D.25
D.11 SAMPLE SIZES USED IN SECOND-GRADE SUBGROUP ANALYSES ............. D.26 D.12 P-VALUES FOR EFFECT SIZES REPORTED IN TABLE III.3 ............................. D.28 D.13 P-VALUES FOR EFFECT SIZES REPORTED IN TABLE III.4 ............................. D.31
xviii
FIGURES
Figure Page
I.1 DATA COLLECTION TIME LINE DURING THE FIRST YEAR OF CURRICULUM IMPLEMENTATION ..........................................................................19
III.1 AVERAGE HLM-ADJUSTED SPRING STUDENT MATH SCORE WITH
CONFIDENCE INTERVALS, BY CURRICULUM ....................................................75 IV.1 CONCEPTUAL MODEL LINKING EARLY ELEMENTARY SCHOOL MATH
CURRICULUM TO STUDENT MATH ACHIEVEMENT ..........................................98
A.1 FIRST-GRADE SAMPLE: FLOW OF DISTRICTS AND SCHOOLS THROUGH THE STUDY ............................................................................................ A.6
A.2 SECOND-GRADE SAMPLE: FLOW OF DISTRICTS AND SCHOOLS
THROUGH THE STUDY ............................................................................................ A.7
A.3 FLOW OF STUDENTS THROUGH THE STUDY: FIRST-GRADE SAMPLE ...... A.16 A.4 FLOW OF STUDENTS THROUGH THE STUDY: SECOND-GRADE
SAMPLE ..................................................................................................................... A.17
xix

This page intentionally left blank for double-sided copying.

ACHIEVEMENT EFFECTS OF FOUR EARLY ELEMENTARY SCHOOL MATH CURRICULA: FINDINGS FOR FIRST AND SECOND GRADERS
EXECUTIVE SUMMARY
National achievement data show that elementary school students in the United States, particularly those from low socioeconomic backgrounds, have weak math skills (National Center for Education Statistics 2009). In fact, data show that, even before they enter elementary school, children from disadvantaged backgrounds are behind their more advantaged peers in basic competencies such as number-line ordering and magnitude comparison (Rathburn and West 2004). Furthermore, after a year of kindergarten, disadvantaged students still have less extensive knowledge of mathematics than their more affluent peers (Denton and West 2002).
This study examines whether some early elementary school math curricula are more effective than others at improving student math achievement in disadvantaged schools.1 A small number of curricula, which are based on different approaches for developing student math skills, dominate elementary math instruction—7 curricula make up 91 percent of those used by K–2 educators, according to a 2008 survey (Resnick et al. 2010). Little rigorous evidence exists to support one approach over another, however, which means that research does not provide educators with much useful information when choosing a math curriculum to use.
This study helps to fill that knowledge gap by examining the relative student achievement effects of four elementary school math curricula during the first year of implementation in the first and second grades:
• Investigations in Number, Data, and Space (Investigations) is published by Pearson Scott Foresman (Wittenburg et al. 2008a) and uses a student-centered approach encouraging metacognitive reasoning and drawing on constructivist learning theory. The lessons focus on understanding, rather than on students answering problems correctly, and build on students’ knowledge and understanding. Students are engaged in thematic units of three to eight weeks in which they first investigate and then discuss and reason about problems and strategies.
• Math Expressions is published by Houghton Mifflin Harcourt (Fuson 2009a; Fuson 2009b) and blends student-centered and teacher-directed approaches to mathematics. Students question and discuss mathematics but are also explicitly taught effective procedures. There is an emphasis on using multiple specified objects, drawings, and
1 The context for the study is “disadvantaged” schools, which is defined as those that have a relatively high schoolwide Title I eligibility rate—57 percent of the study’s elementary schools are schoolwide Title I eligible, compared to 44 percent of U.S. elementary schools. The Title I program provides financial assistance to schools with high numbers or percentages of poor children to help all students meet state academic standards. Schools in which children from low-income families make up at least 40 percent of enrollment are eligible to use Title I funds for schoolwide programs that serve all children in the school.
xxi

language to represent concepts and also on learning through the use of real-world situations. Students are expected to explain and justify their solutions.
• Saxon Math (Saxon) is published by Harcourt Achieve (Larson 2008) and is a scripted curriculum that blends teacher-directed instruction of new material with daily distributed practice of previously learned concepts and procedures. The teacher introduces concepts or efficient strategies for solving problems. Students observe and then receive guided practice, followed by distributed practice. Students hear the correct answers and are explicitly taught procedures and strategies. Frequent monitoring of student achievement is built into the program. Daily routines are extensive and emphasize practice of number concepts and procedures and use of representations.
• Scott Foresman-Addison Wesley Mathematics (SFAW) is published by Pearson Scott Foresman (Charles et al. 2005a; Charles et al. 2005b) and is a basal curriculum that combines teacher-directed instruction with a variety of differentiated materials and instructional strategies. Teachers select the materials that seem most appropriate for their students, often with the help of the publisher. The curriculum is based on a consistent daily lesson structure, which includes direct instruction, hands-on exploration, the use of questioning, and practice of new skills.
Generally speaking, the curricula vary in the extent to which they emphasize student-centered or teacher-directed approaches.
A randomized controlled trial involving 110 elementary schools was implemented to determine the relative effects of the curricula—about a quarter of the schools were randomly assigned to each of the study’s four curricula. Random assignment of curricula to schools was conducted separately for each participating district, which established an experiment in each study district.
Among the 110 schools, 39 (cohort one) began study participation during the 2006–2007 school year and during that first year, curriculum implementation occurred only in the first grade. The remaining 71 schools (cohort two) began study participation during the 2007–2008 school year and during that first year, curriculum implementation occurred in both the first and second grades—except in one school, where curriculum implementation occurred only in the second grade.
The study’s first report examined first-grade effects during the first year of curriculum implementation among the 39 cohort-one schools (Agodini et al. 2009). Implementation analyses indicated that all teachers received training on their assigned curriculum and, according to teacher surveys, nearly all (99 percent in the fall, and 98 percent in the spring) reported using their assigned curriculum as their core curriculum. In terms of progress with the curricula, as of the spring survey, 88 percent of teachers reported completing at least 80 percent of their assigned curriculum’s lessons. This progress with the lessons is consistent with the timing of the spring survey, which was administered about 80 percent through the school year. There was one notable difference in math instruction between the curriculum groups—on average, Saxon teachers reported spending one more hour on math instruction per week than did teachers in the other curriculum groups. Analyses of first-grade math achievement indicated that there were
xxii
significant differences in achievement across the curriculum groups. In particular, after one year of study participation, average spring first-grade math achievement of Math Expressions and Saxon students was similar and higher than both Investigations and SFAW students. Achievement of the latter two groups (Investigations and SFAW) was similar.
The current report updates the first report in two ways. First, it examines first-grade effects during the first year of curriculum implementation among all study schools (cohort-one and cohort-two schools combined). Given the school-level curriculum implementations described above, this first-grade analysis is based on 109 schools—39 from cohort one and 70 from cohort two (as mentioned above, one of the 71 cohort-two schools did not implement its assigned curriculum in the first grade). The other way in which the current report updates the previous one is by examining second-grade effects during the first year of curriculum implementation among the 71 cohort-two schools (as mentioned above, the cohort-one schools did not implement the curricula in the second grade during their first year of study participation).2
The key findings in this report include the following:
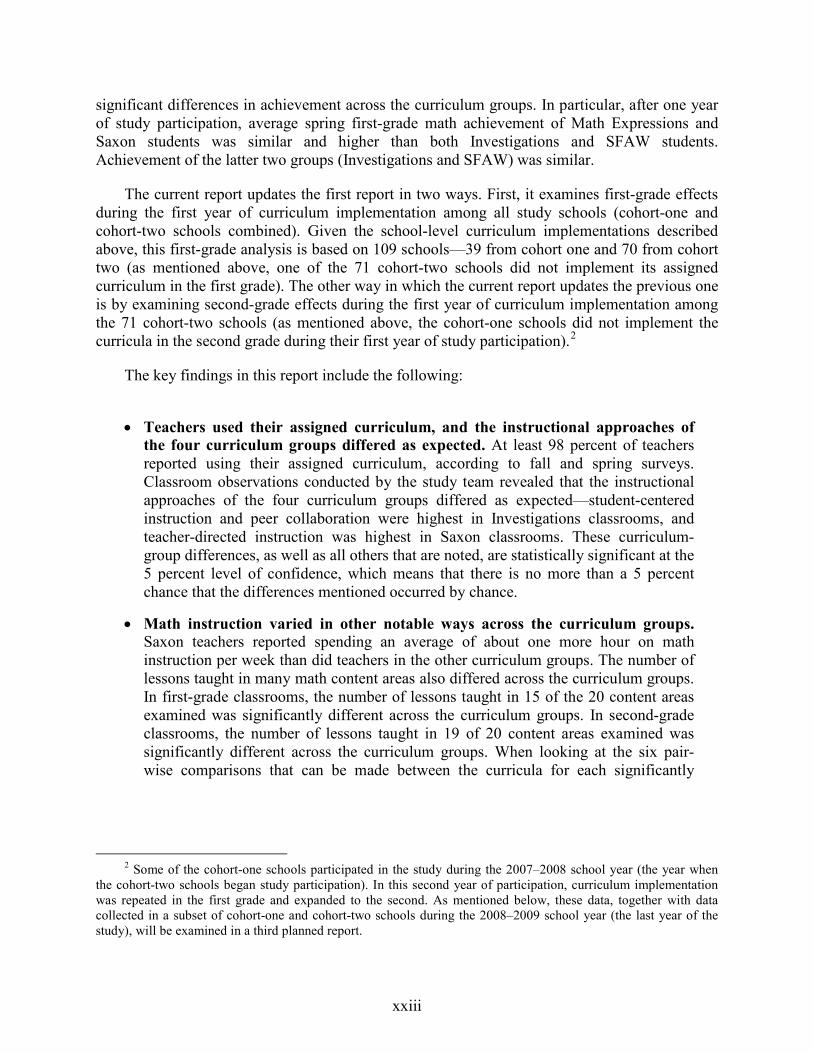
• Teachers used their assigned curriculum, and the instructional approaches of the four curriculum groups differed as expected. At least 98 percent of teachers reported using their assigned curriculum, according to fall and spring surveys. Classroom observations conducted by the study team revealed that the instructional approaches of the four curriculum groups differed as expected—student-centered instruction and peer collaboration were highest in Investigations classrooms, and teacher-directed instruction was highest in Saxon classrooms. These curriculum-group differences, as well as all others that are noted, are statistically significant at the 5 percent level of confidence, which means that there is no more than a 5 percent chance that the differences mentioned occurred by chance.
• Math instruction varied in other notable ways across the curriculum groups. Saxon teachers reported spending an average of about one more hour on math instruction per week than did teachers in the other curriculum groups. The number of lessons taught in many math content areas also differed across the curriculum groups. In first-grade classrooms, the number of lessons taught in 15 of the 20 content areas examined was significantly different across the curriculum groups. In second-grade classrooms, the number of lessons taught in 19 of 20 content areas examined was significantly different across the curriculum groups. When looking at the six pair-wise comparisons that can be made between the curricula for each significantly
2 Some of the cohort-one schools participated in the study during the 2007–2008 school year (the year when the cohort-two schools began study participation). In this second year of participation, curriculum implementation was repeated in the first grade and expanded to the second. As mentioned below, these data, together with data collected in a subset of cohort-one and cohort-two schools during the 2008–2009 school year (the last year of the study), will be examined in a third planned report.
xxiii

different content area,3 some curriculum pair differences are significant whereas others are not; there is no clear pattern to which curriculum pair differences are consistently significant across the content areas.
• In terms of student math achievement, the curriculum used by the study schools mattered. In first grade classrooms, average math achievement of Math Expressions students was 0.11 standard deviations higher than that of both Investigations and SFAW students; in second grade classrooms average math achievement of Math Expressions and Saxon students was 0.12 and 0.17 standard deviations higher than that of SFAW students, respectively. None of the other curriculum differentials are statistically significant. (As mentioned above, the study’s first report based on cohort-one schools showed that average spring first-grade math achievement of Math Expressions and Saxon students was similar and higher than both Investigations and SFAW students.)
• The curriculum used in different contexts also mattered, and some of these findings are consistent with findings based on all students whereas others are not. The study examined the relative effects of the curricula for subgroups of schools and teachers with different characteristics, and for the schools and teachers in each study district.4 Among the first-grade subgroups, 22 curriculum differentials are statistically significant, of which 14 are consistent with the findings based on all first graders—that is, average math achievement of Math Expressions students was higher than that of Investigations and SFAW students. Among the 8 statistically significant differentials that are not consistent, 4 of them indicate that average math achievement of Saxon students was higher than that of Investigations students, 3 indicate that average achievement of Saxon students was higher than SFAW students, and the last one indicates that achievement of Investigations students was higher than Saxon students. Among the second-grade subgroups, 23 curriculum differentials are statistically significant, of which 16 are consistent with the findings based on all second graders—that is, average math achievement of Math Expressions and Saxon students was higher than that of SFAW students. Among the 7 statistically significant differentials that are not consistent, 4 indicate that average math achievement of Saxon students was higher than Investigations students, 2 show that average achievement of Investigations students was higher than SFAW students, and the last
3 With the four curricula included in the study, six unique pair-wise comparisons of student achievement can be made: (1) Investigations relative to Math Expressions, (2) Investigations relative to Saxon, (3) Investigations relative to SFAW, (4) Math Expressions relative to Saxon, (5) Math Expressions relative to SFAW, and (6) Saxon relative to SFAW.
4 Subgroups were constructed separately for each grade. Baseline measures of school characteristics were used to create five subgroups that include students in schools with different math achievement (three subgroups), and different poverty status (two subgroups). Baseline measures of teacher characteristics were used to create eight subgroups that include students in classrooms led by teachers with different levels of education (two subgroups), experience (two subgroups), math content and pedagogical knowledge (two subgroups), and teachers who did and did not have prior experience with their assigned curriculum (two subgroups). Examining results for each study district is supported by the study’s design that created an experiment in each district, as mentioned above.
xxiv

one shows that achievement of Saxon students was higher than Math Expressions students.
Below we discuss features of the study that help establish the context for the findings. We also provide more details about the overall first- and second-grade student achievement results summarized above, including the size of the relative curriculum effects.
Study Participants
The 110 elementary schools included in the evaluation were recruited by the study team and are not a representative sample of all elementary schools in the United States, but they are geographically dispersed and they are in areas with different levels of urbanicity. The participating schools also serve a higher percentage of students eligible for free or reduced-price meals than the average U.S. elementary school. As the national achievement data mentioned earlier show, identifying ways to improve math achievement of students from low socioeconomic backgrounds is critical. Focusing on disadvantaged schools is also consistent with the policy interest that underlies Title I of the No Child Left Behind Act for studying effective approaches to help low-income children meet state standards for academic achievement.
Outcome Measure
To measure the achievement effects of the curricula, the study team tested students at the beginning and end of the school year using the math assessment developed for the Early Childhood Longitudinal Study-Kindergarten Class of 1998–99 (ECLS-K) (West et al. 2000). The ECLS-K assessment is a nationally normed test designed to measure achievement gains both within and across elementary grades. The first- and second-grade results are based on students who were tested in both the fall and spring in those respective grades.
The assessment includes questions in five math content areas: (1) number sense, properties, and operations; (2) measurement; (3) geometry and spatial sense; (4) data analysis, statistics, and probability; and (5) patterns, algebra, and functions. On the first-grade test, about three-quarters of the items can be classified as number sense, properties, and operations; the remaining items are predominantly related to data analysis, statistics, and probability and patterns, algebra, and functions. On the second-grade test, about half of the test is comprised of items pertaining to number sense, properties, and operations; the other half is predominantly related to measurement; geometry and spatial sense; and patterns, algebra, and functions.
Other Data Collection
To help interpret the measured achievement effects, teachers completed surveys about curriculum implementation, and the study team observed each first- and second-grade classroom once during the school year. Together, the survey and observation data are useful for assessing teacher participation in curriculum training, use of the assigned curriculum, and supplementation of the assigned curriculum with other materials. The data were also useful for assessing adherence to each curriculum’s specific features and for examining curriculum-group differences in teaching approaches and practices that could be measured consistently across the curricula.
xxv
Relative Effects of the Curricula
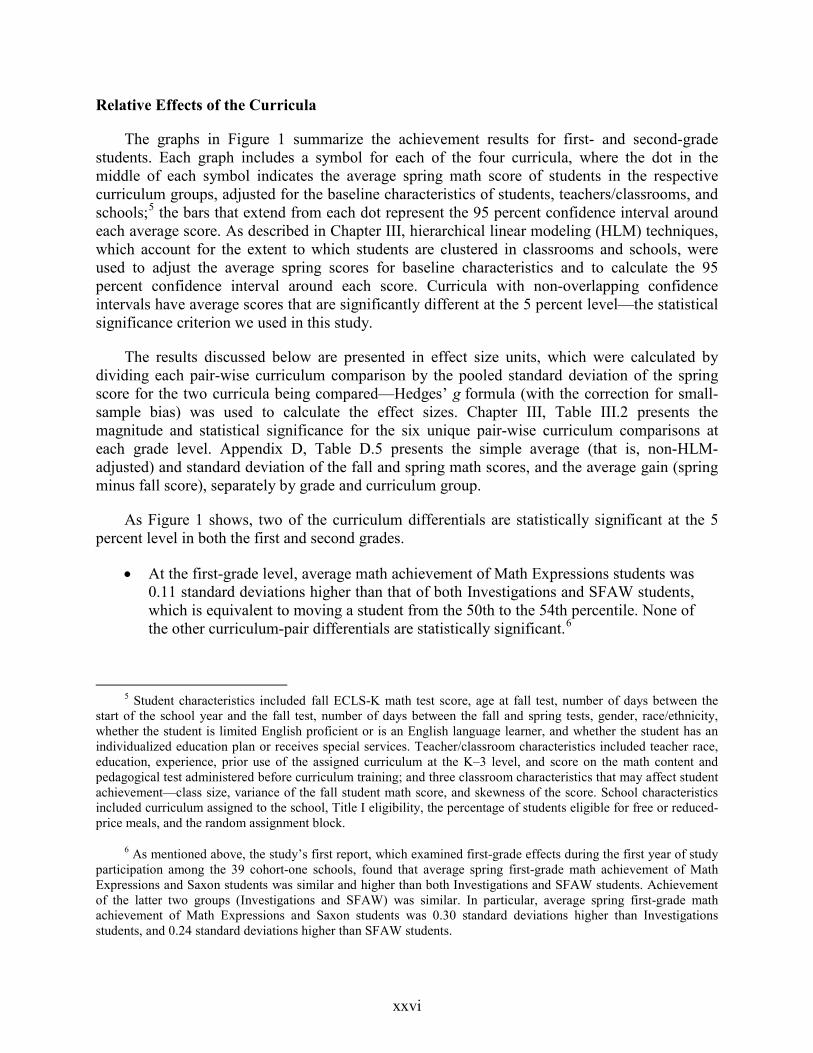
The graphs in Figure 1 summarize the achievement results for first- and second-grade students. Each graph includes a symbol for each of the four curricula, where the dot in the middle of each symbol indicates the average spring math score of students in the respective curriculum groups, adjusted for the baseline characteristics of students, teachers/classrooms, and schools;5 the bars that extend from each dot represent the 95 percent confidence interval around each average score. As described in Chapter III, hierarchical linear modeling (HLM) techniques, which account for the extent to which students are clustered in classrooms and schools, were used to adjust the average spring scores for baseline characteristics and to calculate the 95 percent confidence interval around each score. Curricula with non-overlapping confidence intervals have average scores that are significantly different at the 5 percent level—the statistical significance criterion we used in this study.
The results discussed below are presented in effect size units, which were calculated by dividing each pair-wise curriculum comparison by the pooled standard deviation of the spring score for the two curricula being compared—Hedges’ g formula (with the correction for small-sample bias) was used to calculate the effect sizes. Chapter III, Table III.2 presents the magnitude and statistical significance for the six unique pair-wise curriculum comparisons at each grade level. Appendix D, Table D.5 presents the simple average (that is, non-HLM-adjusted) and standard deviation of the fall and spring math scores, and the average gain (spring minus fall score), separately by grade and curriculum group.
As Figure 1 shows, two of the curriculum differentials are statistically significant at the 5 percent level in both the first and second grades.
• At the first-grade level, average math achievement of Math Expressions students was 0.11 standard deviations higher than that of both Investigations and SFAW students, which is equivalent to moving a student from the 50th to the 54th percentile. None of the other curriculum-pair differentials are statistically significant.6
5 Student characteristics included fall ECLS-K math test score, age at fall test, number of days between the start of the school year and the fall test, number of days between the fall and spring tests, gender, race/ethnicity, whether the student is limited English proficient or is an English language learner, and whether the student has an individualized education plan or receives special services. Teacher/classroom characteristics included teacher race, education, experience, prior use of the assigned curriculum at the K–3 level, and score on the math content and pedagogical test administered before curriculum training; and three classroom characteristics that may affect student achievement—class size, variance of the fall student math score, and skewness of the score. School characteristics included curriculum assigned to the school, Title I eligibility, the percentage of students eligible for free or reduced-price meals, and the random assignment block.
6 As mentioned above, the study’s first report, which examined first-grade effects during the first year of study participation among the 39 cohort-one schools, found that average spring first-grade math achievement of Math Expressions and Saxon students was similar and higher than both Investigations and SFAW students. Achievement of the latter two groups (Investigations and SFAW) was similar. In particular, average spring first-grade math achievement of Math Expressions and Saxon students was 0.30 standard deviations higher than Investigations students, and 0.24 standard deviations higher than SFAW students.
xxvi
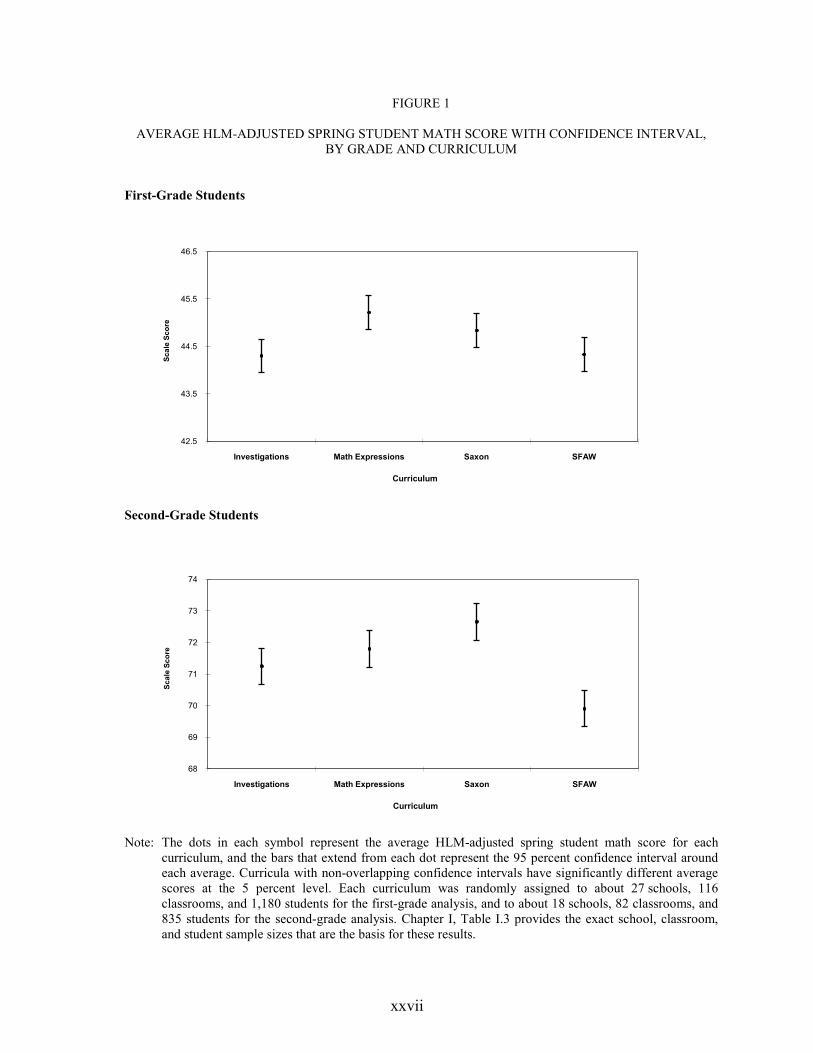
FIGURE 1
AVERAGE HLM-ADJUSTED SPRING STUDENT MATH SCORE WITH CONFIDENCE INTERVAL, BY GRADE AND CURRICULUM
First-Grade Students
Second-Grade Students
42.5
43.5
44.5
45.5
46.5
Investigations Math Expressions Saxon SFAW
Scal
e Sc
ore
Curriculum
68
69
70
71
72
73
74
Investigations Math Expressions Saxon SFAW
Scal
e Sc
ore
Curriculum
Note: The dots in each symbol represent the average HLM-adjusted spring student math score for each curriculum, and the bars that extend from each dot represent the 95 percent confidence interval around each average. Curricula with non-overlapping confidence intervals have significantly different average scores at the 5 percent level. Each curriculum was randomly assigned to about 27 schools, 116 classrooms, and 1,180 students for the first-grade analysis, and to about 18 schools, 82 classrooms, and 835 students for the second-grade analysis. Chapter I, Table I.3 provides the exact school, classroom, and student sample sizes that are the basis for these results.
xxvii
• At the second-grade level, average math achievement of Math Expressions and Saxon students was 0.12 and 0.17 standard deviations higher than that of SFAW students, respectively, which is equivalent to moving a student from the 50th to the 55th or 57th percentile. None of the other curriculum-pair differentials are statistically significant.
These findings are based on statistical tests that have not been adjusted for the six unique pair-wise curriculum comparisons that can be made. Results based on statistical tests that have been adjusted for the multiple comparisons made indicate that only the Saxon-SFAW differential of 0.17 standard deviations for second graders is statistically significant. There is a large literature that considers the issue of multiple comparison adjustments, but, to our knowledge, there is no consensus about whether statistical tests should or should not be adjusted (see, for example, Saville 1990 and Westfall et al. 1999). For this reason, we present both sets of results.
What the Relative Curriculum Effects Include
The relative effects of the curricula reflect all differences between the curricula, including differences in teacher training, instructional strategies, content coverage, and curriculum materials. Of course, the relative effects ultimately depend on how teachers implemented their curriculum, and actual implementation reflects what publishers and teachers achieved, not some level of implementation specified by the study.
What Accounts for the Relative Curriculum Effects Observed?
The four curriculum groups differ along several implementation measures, including the amount of teacher curriculum training, amount of time teachers spent on math instruction, number of lessons taught in various math content areas, and scales about instructional approaches. We conducted correlational analyses focusing on one curriculum pair at a time, for the curriculum pairs that had significantly different achievement. For those significant curriculum-pair differentials, we examined whether the teaching approaches and practices that are significantly different across the four curriculum groups are related to student achievement of the curriculum pairs with significantly different achievement.
For three of the four curriculum-pair differentials that are statistically significant across the two grade levels, the results show that the student achievement differences are related to differences in the teaching approaches and practices of these curriculum pairs. The curriculum differentials that are related to the implementation measures examined include both of the first-grade differentials (Math Expressions-Investigations and Math Expressions-SFAW) that are statistically significant, and one of the two second-grade differentials (Saxon-SFAW) that is statistically significant. The teaching approaches and practices that were related to the curriculum differentials include curriculum training, math instructional time, coverage in many math content areas, and at least one of the scales about instructional approaches. None of the teaching approaches and practices examined was related to the other second-grade differential that is statistically significant (Math Expressions-SFAW). It is important to note, however, that this part of the analysis was confined to identifying correlational patterns, which may not be causal.
xxviii
Next Steps for the Study
Some of the schools participated in the study for a second year, and a smaller number participated for a third (the last year of the study). In those subsequent years, curriculum implementation was repeated in grades where it began, and expanded to higher grades. For example, during the second year of participation for cohort-one schools, curriculum implementation was repeated in the first grade and expanded to the second. Data from these follow-up years can be used to examine the relative effects of the curricula among teachers and students that have two-to-three years of experience with them, and a future report is planned that will present results based on those data.
xxix

This page intentionally left blank for double-sided copying.

I. INTRODUCTION
This report presents results from a large-scale study aimed at understanding the relative student achievement effects of four elementary school math curricula: (1) Investigations in Number, Data, and Space (Investigations); (2) Math Expressions; (3) Saxon Math; and (4) Scott Foresman-Addison Wesley Mathematics (SFAW). The study uses randomized controlled-trial techniques to compare the effects of these curricula on math achievement of early elementary school students. The study is sponsored by the Institute of Education Sciences (IES) in the U.S. Department of Education, and is being conducted by Mathematica Policy Research and a main subcontractor, SRI International (SRI).
The study includes a total of 110 elementary schools. Of these, 39 schools (cohort one) participated during the 2006–2007 school year, and during that year, curriculum implementation occurred only in the first grade. The remaining 71 schools (cohort two) participated during the 2007–2008 school year, and during that year, curriculum implementation occurred in both the first and second grades—except in one school, where curriculum implementation occurred only in the second grade.
The study’s first report examined first-grade effects during the first year of curriculum implementation among the 39 cohort-one schools (Agodini et al. 2009). Implementation analyses indicated that all teachers received training on their assigned curriculum and, according to teacher surveys, nearly all (99 percent in the fall, and 98 percent in the spring) reported using their assigned curriculum as their core curriculum. In terms of progress with the curricula, as of the spring survey, 88 percent of teachers reported completing at least 80 percent of their assigned curriculum’s lessons. This progress with the lessons is consistent with the timing of the spring survey, which was administered about 80 percent through the school year. There was one notable difference in math instruction between the curriculum groups—on average, Saxon teachers reported spending one more hour on math instruction per week than did teachers in the other curriculum groups.
In the first report, analyses of first-grade math achievement indicated that there were significant differences in achievement across the curriculum groups. In particular, after one year of study participation, average spring first-grade math achievement of Math Expressions and Saxon students was similar and higher than both Investigations and SFAW students. Achievement of the latter two groups (Investigations and SFAW) was similar. In terms of effect sizes, average spring first-grade math achievement of Math Expressions and Saxon students was 0.30 standard deviations higher than Investigations students, and 0.24 standard deviations higher than SFAW students.
The current report updates the first report in two ways. First, it examines first-grade effects during the first year of curriculum implementation among all study schools—both cohort-one schools, which were examined in the first report mentioned above, combined with cohort-two schools. Given the school-level curriculum implementations described above, this analysis is based on 109 schools—39 from cohort one and 70 from cohort two (as mentioned above, one of the 71 cohort-two schools did not implement its assigned curriculum in the first grade). The other way in which the current report updates the previous one is by examining second-grade effects
1

during the first year of curriculum implementation among the 71 cohort-two schools (as mentioned above, the cohort-one schools did not implement the curricula in the second grade during their first year of study participation).7
The rest of this chapter provides the rationale for the study and describes its key features. The chapter draws heavily from Chapter I in Agodini et al. (2009) because the rationale for the study and its key features are the same as for that earlier study. Chapter II provides detailed information that is useful for understanding curriculum implementation, and Chapter III summarizes results about the relative effects of the curricula on first- and second-grade math achievement. Chapter IV—the final chapter—presents results from correlational analyses that examines factors that may account for the relative curriculum effects reported in Chapter III.
A. RATIONALE FOR THE STUDY
National achievement data show that elementary school students in the United States, particularly those from low socioeconomic backgrounds, have weak math skills. In the 2009 National Assessment of Educational Progress (NAEP), only 39 percent of all fourth graders were judged proficient in math, and 18 percent scored below basic (National Center for Education Statistics, 2009). The NAEP also showed substantial differences in average math scores between students from different socioeconomic backgrounds—minority students and those eligible for free or reduced-price meals had an average math scale score about 20 points (or 0.69 standard deviations) lower than their peers.8
Other national achievement data show that, even before they enter elementary school, children from disadvantaged backgrounds are behind their more advantaged peers in basic competencies such as number-line ordering and magnitude comparison (Rathburn and West 2004). After a year of kindergarten, disadvantaged students still have less extensive knowledge of mathematics than their more affluent peers (Denton and West 2002).
Federal legislation recognizes the importance of starting to develop math skills at an early age. Under Title I of the No Child Left Behind Act, schools must make adequate yearly progress (AYP) in student math and reading performance beginning in the third grade. AYP is a federally approved, state-specific standard that requires public schools to continuously and substantially improve student achievement in math and reading. The goal is to ensure that all students meet or exceed their state’s standards for proficiency in math and reading by 2014.
7 Some of the cohort-one and cohort-two schools also participated in the study for a second year, and a smaller number participated for a third (the last year of the study). In those subsequent years, curriculum implementation was repeated in grades where it began, and expanding to higher grades. For example, during the second year of participation for cohort-one schools, curriculum implementation was repeated in the first grade and expanded to the second. A future report is planned that will present results based data from these follow-up years, to examine the relative effects of the curricula among teachers and students that have two-to-three years of experience with them. Data from the follow-up years are not included in this report.
8 The standard deviation for the 2009 fourth grade math scale score is 29 points.
2
What is taught to students and how it is taught may be important factors in a school’s ability to improve student math achievement; however, as Hiebert and Grouws (2007) explain, research has not identified which specific features of teaching are most effective at developing math skills. As of October 2009, the What Works Clearinghouse (WWC) had reviewed 315 studies of interventions designed to improve math achievement of elementary school students (http://ies.ed.gov/ncee/wwc/). Only 10 of those studies (2 of which involved using an experimental design) were judged as providing evidence that was useful for assessing the effectiveness of the interventions examined. Other reports also point to the lack of rigorous evidence on the effectiveness of various instructional approaches (National Mathematics Advisory Panel 2008a; National Research Council 2004).
As Hiebert and Grouws (2007) also explain, although it would be useful to understand which features of teaching help develop student math skills, individual features typically function within a system, such as a curriculum, and the effects of each feature may depend on the system in which it functions. The potential interdependence among teaching features points to the need to study the effects of entire curricula, particularly comparing the effects of different approaches to packaging together the various teaching features.
Another reason for studying entire math curricula is that districts and schools tend to use a commercial math curriculum that provides not only content and resources for instruction but also specific pedagogical guidance for delivering the content to students (Stein et al. 2007). According to a 2008 survey conducted by Education Market Research (Resnick et al. 2010), 91 percent of K–2 educators reported using one of seven commercial math curricula. The seven curricula use different approaches to math instruction and include different bundles of content and resources for students and teachers.
The lack of research evidence and widespread use of different approaches for teaching math were recognized in discussions held at the U.S. Department of Education, which included the Title I Independent Review Panel, the Office of Elementary and Secondary Education, and a panel of curriculum experts. The discussions considered whether impact studies should be conducted to provide information on the effectiveness of math curricula. The group ultimately recommended that the Title I evaluation plan should include an evaluation of math curricula (IES 2007).
Early in 2005, a panel of experts in mathematics, mathematics instruction, and evaluation design was convened to provide advice on an impact evaluation of math curricula. The panel identified the early elementary grades as the most important level for the evaluation because, as mentioned earlier, economically disadvantaged children are behind more advantaged peers in basic competencies even before they enter elementary school (Rathburn and West 2004). The panel also recommended that the evaluation compare different approaches to teaching early elementary math through an evaluation of commercial curricula. It noted that many math curricula had been developed in recent years and are being widely used without evidence of effectiveness.
3

B. RESEARCH QUESTIONS AND STUDY DESIGN
The goal of this study is to examine the relative effects of widely used curricula that draw on different instructional approaches and that hold promise for improving student math achievement. In particular, the study helps to answer two main research questions about the four curricula mentioned above:
• What are the relative effects of the study’s four math curricula on math achievement of first- and second-graders in disadvantaged schools? There are two noteworthy aspects to this question. First, the study is examining the relative effects of curricula, which means comparing math achievement of students in the four curriculum groups. With the four curricula included in the study, six unique pair-wise comparisons of student achievement are made: (1) Investigations relative to Math Expressions, (2) Investigations relative to Saxon, (3) Investigations relative to SFAW, (4) Math Expressions relative to Saxon, (5) Math Expressions relative to SFAW, and (6) Saxon relative to SFAW. As such, the study does not compare student achievement of the curriculum groups to a group that does not receive math instruction—a design often used when studying supplemental education programs. The study also does not include a control group of schools that continued to use the math curriculum in use before the study began because it would be difficult to interpret effects of the study’s curricula compared to effects for the control group because of the variety of curricula in use in the participating districts. Such a control group design would even be difficult to interpret at the district level because schools in some districts have discretion in choosing their math curriculum. Second, the context for the study is disadvantaged schools—those that serve a relatively high percentage of students eligible for free or reduced-price meals—because math achievement of the students in these schools tends to be lower than that of their more advantaged peers. Because of these differences, identifying ways to improve math achievement in those schools is critical.
• Are the relative curriculum effects influenced by school and classroom characteristics, including teacher knowledge of math content and pedagogy? We address this question by examining whether relative curriculum effects differ for subgroups of students defined by the characteristics of their schools and teachers measured prior to curriculum implementation. Subgroup results could provide useful information for helping districts not involved in the study understand how the curricula would perform in their own settings. Since, as described below, a randomized controlled trial was implemented in each district, we also examine relative effects for students in each of the districts because these results could be useful for the study’s participants.
Experimental methods are used to answer the two questions described above. In particular, the evaluation is based on a schogol-level random-assignment design, in which participating schools in each participating district are randomly assigned to the curricula included in the study. Consider, for example, a district that has eight elementary schools interested in participating in the study. The study team randomly selected two schools to implement curriculum A, two schools to implement curriculum B, and so on. In each school, teachers at the target grade levels
4
received training from the curriculum publishers, and the publishers provided both teacher and student curriculum materials free of charge.
Relative effects of the curricula were calculated as differences in math achievement of students in the four curriculum groups. Hierarchical linear modeling (HLM) techniques, which account for the extent to which students are clustered in classrooms and schools, were used to calculate the relative curriculum effects.9
As Chapter III shows, two of the curriculum differentials in both the first and second grades are statistically significant, so we also conducted correlational analyses to help address a third research question:
• What accounts for curriculum differentials that are statistically significant? In particular, we examine whether the statistically significant curriculum differentials are related to teaching approaches and practices that differ across the curriculum groups, including differences in curriculum training, math instructional time, content coverage, and scales about instructional approaches that emerged from information collected through classroom observations conducted by the study team.
It is important to note that this part of the analysis is confined to identifying correlational patterns, which may not be causal.
C. IMPLEMENTING THE STUDY AND SCHOOL CHARACTERISTICS
1. Curricula Examined in the Study
A competitive process was used to select the study’s curricula. As part of that process, developers and publishers of early elementary math curricula were invited to submit a proposal to include their curricula in the evaluation. Early in December 2005, the study team issued a request for proposals in an education publication with wide circulation (Education Week) and also sent the announcement to all the major publishers of early elementary-school math curricula that could be identified. An organization that was interested in participating in the study was instructed to submit a proposal describing the theoretical and empirical support for its curriculum, the appropriateness of the curriculum for early elementary students in disadvantaged schools, and its qualifications and capacity for providing the curriculum training that would be offered to study teachers. Eight submissions were received.
A panel of outside experts in math and math instruction reviewed the submissions and recommended to IES curricula suitable for the study. Six criteria were used to review the submissions: research support for the curriculum’s conceptual framework; empirical evidence of effectiveness; objectives of the curriculum; quality of training and materials; institutional capability to train the number of teachers in the study; and appropriateness of the curriculum for students in grades one, two, and three in Title I schools.
9 See Raudenbush (2002) for a detailed description of the theory and use of HLM.
5

Late in February 2006, in-person meetings were held with those publishers whose curricula were considered strong candidates for the study. The meetings began with publishers providing an overview of their curriculum, including a discussion of its key principles, a first-grade lesson on estimation, and a discussion of how a second-grade lesson on estimation differs from one in the first grade. Publishers were also told in advance of the meeting that they should address two questions. (1) What math knowledge do you think need to be provided to teachers of first-, second-, and third-grade students? (2) What do you think are the best strategies for teaching students addition facts? The rest of the meeting was spent discussing those questions, as well as any other questions raised by IES, the study team, the panel that reviewed the curriculum proposals, and the publishers.
In June 2006, IES selected the following four curricula for the study:10
• Investigations in Number, Data, and Space (Investigations) published by Pearson Scott Foresman (Wittenburg et al. 2008a)
• Math Expressions published by the Houghton Mifflin Company (Fuson 2009a; Fuson 2009b)
• Saxon Math (Saxon) published by Harcourt Achieve (Larson 2008)
• Scott Foresman-Addison Wesley Mathematics (SFAW) published by Pearson Scott Foresman (Charles et al. 2005a; Charles et al. 2005b)
Generally speaking, these curricula vary in the extent to which they emphasize student-centered and teacher-directed instructional approaches. Each curriculum is described in more detail below.11
a. Investigations
Investigations is a kindergarten to fifth grade curriculum developed by TERC under a grant from the National Science Foundation. The curriculum is based on a student-centered instructional approach that emphasizes metacognition (thinking about one’s own reasoning and the reasoning of one’s peers); communicating about mathematics verbally, through writing, and drawings; and solving problems in multiple ways. Students tend to work on a smaller number of in-depth problems and are encouraged to choose from a variety of concrete materials and appropriate technology to help them solve problems as a regular part of their everyday work. Teachers spend much of their time facilitating conversations among students, helping students
10 Curricula that were submitted but not selected are not disclosed because the proposals were confidential.
11 The publishers’ descriptions of each curriculum were used to categorize each curriculum as student-centered or teacher-directed. Pearson Scott Foresman describes Investigations as a “child-centered approach to teaching mathematics” and SFAW as a “curriculum that focuses on developing students’ conceptual understanding and skills through step-by-step instruction” (www.pearsonschool.com). Houghton Mifflin describes Math Expressions as “combining the most powerful elements of reform mathematics with the best of traditional approaches” (www.eduplace.com/math/mthexp). Saxon describes the curriculum as using a distributed multisensory approach that emphasizes explicit instruction (Larson and Saxon Publishers 2006).
6
express their thoughts, and guiding students to a deeper understanding of the mathematical concepts they are working on.
Each grade level is organized into units that last two to five weeks and focus on the exploration of major mathematical ideas. Units may focus on a single subject or revolve around a couple of related subjects—for example, addition and subtraction.12 Within each unit, the curriculum is built on two or more investigations that offer different contexts in which students explore mathematical problems using hands-on activities, written activities, and class discussion. Some investigations last two or three days, others may last more than one week.
Classroom activities vary by day, and depend on the length and type of investigation. For example, during an investigation lasting one week, on the first day the teacher will introduce the investigation to the class, often through large group hands-on activities. During the next two to three days, students will work in pairs or small groups to explore the concept by working on a small number of in-depth problems each day or by playing mathematical games. On a daily basis, the teacher and students will discuss as a group what they worked on, what they learned, and the strategies they used to solve problems. At the end of the final day of the investigation, the teacher and students will discuss the work completed during the investigation to allow students to compare solutions and strengthen their understanding. A set of daily routines, which can occur during the lesson or at some other time of day, are recommended in each unit and provide computation and data analysis practice.
b. Math Expressions
Math Expressions is a kindergarten to fifth grade curriculum based on the research results of the Children’s Math Worlds (CMW) project conducted by Dr. Karen C. Fuson of Northwestern University and funded by the National Science Foundation. The curriculum uses a combination of teacher-directed and student-centered instructional approaches. Key aspects of the curriculum include specified algorithms; use of math language, math drawings and visual representations; an emphasis on in-depth, sustained learning of core grade-level concepts (rather than a spiral curriculum); and skill fluency. The curriculum encourages teachers to provide students with efficient and effective procedures while also promoting children’s natural solution methods.
In first- and second-grade Math Expressions classrooms, each day begins with a set of routines led by students involving the calendar, money, a number chart, counting, and time. The math lesson often occurs later in the day, and begins with a quick fluency activity. Afterwards, the teacher provides instruction to the whole class, introducing new information and encouraging students to discuss and demonstrate the new mathematical ideas. The teacher fosters this discussion while introducing efficient procedures; visual learning supports are used to help students link their knowledge to formal mathematical concepts. Students then practice the new skill or concept in pairs, small groups, or individually using worksheets. Homework is assigned daily.
12 In the first edition, units lasted two to eight weeks.
7

c. Saxon
Saxon’s primary program is a kindergarten to fourth-grade curriculum based on a teacher-directed instructional approach with scripted lesson plans.13 The program uses a multisensory approach with explicit instruction, hands-on activities, mathematical conversations, and practice. Each lesson integrates the mathematical strands, which are spiraled throughout the school year, so that concepts are developed, reviewed, and practiced over time rather than being taught during discrete periods of time, such as in chapters or units. New material is introduced gradually each day through explicit instruction and modeling by the teacher. Each lesson also includes daily distributed practice of previously learned concepts and procedures. The curriculum uses frequent and cumulative assessments to help teachers monitor student progress.
In both first and second grades, the Saxon curriculum is organized into five daily activities: morning routines, fact practice, an explicit lesson, guided class practice, and homework. The morning routines are a whole-class activity that reinforces previously learned skills, lays the foundation for new skill development, allows students to work on problems in real-world settings, and often involves a student leader. The other four activities typically occur later in the day. Fact practice can occur during the same time as the math lesson or at any other time; students work on fluency of number facts either orally or in writing with the support of self-correcting materials, manipulatives, fact cards, or worksheets. The lesson begins with a whole-class activity in which the teacher explicitly teaches the new concept using manipulatives and worksheets or overhead masters. After the lesson, the teacher guides practice while students work on a worksheet. At the end of each math lesson, the teacher asks a few students to summarize for the entire class what they learned that day. Homework is assigned daily, and every fifth day teachers should administer a written or oral assessment to students.
d. SFAW
SFAW is a pre-kindergarten to sixth-grade basal curriculum based on a teacher-directed approach that aims to develop math skills and understanding.14 The SFAW curriculum uses a consistent daily lesson structure that includes explicit instruction in essential mathematics skills and concepts and hands-on exploration using manipulatives and pictorial and abstract representations. Essential outcomes and conceptual understandings are clearly articulated to teachers and students, and lessons include questioning strategies to develop students’ higher-order thinking skills. Frequent and ongoing assessments and diagnosis are designed with strategic interventions to meet the individual needs of students, measure student understanding, and help guide instruction.
In both first and second grades, SFAW’s consistent daily lesson structure includes the following six activities: a brief review of previously learned material; hands-on exploration of
13 Saxon provides teachers with a script to follow throughout each math lesson. The script is intended to help teachers deliver consistent and clear instruction to students (Larson and Saxon Publishers 2006).
14 Basal curricula use a “hierarchical sequence of academic skills and corresponding instructional materials that are organized by learning objectives” (Erchul and Martens 2002).
8

the new concept; a brief activity to activate prior knowledge and connect it to the new lesson; explicit instruction of the new concept in a whole-group setting; individual, pair, or small group practice using a worksheet or manipulatives; and a closure activity to check student understanding of the new concept using worksheets, journal prompts, or questioning. The curriculum includes a variety of options for differentiating instruction within the consistent daily structure.
In terms of market share, Investigations, Saxon, and SFAW are among the seven most widely used curricula in the United States, making up 32 percent of the curricula used by K–2 educators (Resnick et al. 2010). Estimating usage of Math Expressions is difficult because it is a newer curriculum, and market share data are not yet available.
2. Recruiting Study Participants
As mentioned above, the first-grade findings are based on 109 schools and the second-grade findings are based on 71 schools. The study team identified and recruited districts and schools to participate in the study beginning either in the 2006–2007 or 2007–2008 school year. Below we summarize how schools were recruited.
Step #1: Identifying Suitable Districts. Districts suitable for the study had to be geographically dispersed and have Title I schools. Including districts that have Title I schools is consistent with the policy interest that underlies Title I for studying effective approaches to help low-income children meet state standards for academic achievement. Including districts that are geographically dispersed could be important because experience with, and philosophy about, the various instructional approaches that underlie each curriculum can vary geographically. By including geographically dispersed districts, the study can help to provide evidence about the effects of the curricula when implemented in various contexts.15
Suitable districts also needed to have at least four schools interested in study participation so that a randomized controlled trial involving all four curricula could be implemented in each district. Although only four schools are necessary to support implementation of the four curricula, the goal was to recruit districts with at least eight elementary schools, so that at least two schools could be assigned to each curriculum in each district. Having at least two schools per curriculum in each district helps reduce the potential confounding of school and curriculum effects when examining district-level results, and helps maintain each curriculum’s presence in every district should a school stop using its curriculum.
Various sources were used to identify sites that met these criteria, including national district data sets, the hundreds of districts Mathematica has worked with on previous studies, publisher nominations of districts that had expressed interest in using their curricula, and announcements about the study in national publications. National district data sets—including both the Common
15 For example, when site recruitment began in March 2006, California restricted state funds for school textbook purchases to a list of state-approved curricula that used a more teacher-directed instructional approach. Oregon also restricted the use of state funds for purchases of curricula, but Oregon’s approved list included both teacher-directed and student-centered curricula.
9
Core of Data (CCD; http://nces.ed.gov/ccd) and data from www.SchoolMatters.com—were used to rank districts by their schools’ eligibility for free or reduced-priced meals.16 The ranking was done from highest to lowest and only included districts with at least four elementary schools. Data from www.SchoolMatters.com were then used to examine math achievement of these districts, to further winnow the list to those with math proficiency scores below their state’s average. The goal was to include schools with a range of low math proficiency (for example, those just below the state average and those significantly lower than the state average), so the study could examine whether the relative effects of the curricula are related to the extent to which students are struggling in math.
Step #2: Recruiting Districts. A total of 473 districts identified through the first step were contacted to assess interest in participation. Two letters were sent to each district, one to the district superintendent and the other to the curriculum director. The letters briefly described the study and the benefits of participating. The study team followed up the letters with telephone calls to assess each district’s interest.
Site visits, further telephone conversations, or both followed for all districts that were interested in participating and that did not object to three critical elements of the study: (1) implementation of all four curricula, (2) random assignment of the curricula, and (3) the plan for data collection. Recruiters talked with district administrators and, if the administrators considered it appropriate at this stage of the recruiting process, with principals and teachers from elementary schools that might be interested in participating. In some districts where a small number of individuals were part of the initial meeting, recruiters were often asked to hold additional conference calls or make additional site visits to describe the study to other district or school staff. Sometimes, several followup conference calls or site visits took place so that recruiters could describe the study to all individuals who would be involved if the district participated.
During these visits, questions about the four curricula often arose. Because recruiters were not experts on the curricula, they answered only basic questions and relayed detailed questions to the appropriate publisher after the visit. If there was advance notice that detailed curriculum questions would arise, publisher representatives attended the meeting so that the questions could be answered immediately.
Step #3: Enrolling Schools and Teachers. Of the 473 districts contacted, 12 agreed to participate in the study—a recruitment rate of 2.5 percent. The final recruitment activity was to enroll schools, teachers, and any other relevant staff (such as math coordinators, math coaches, and supplemental teachers) that the schools or publishers indicated were important for curriculum implementation. Enrollment began by confirming that schools interested in participation clearly understood the study’s parameters. Most importantly, recruiters confirmed that schools were willing to use any of the four curricula and would support the study’s data collection.
16 Data from both the CCD and www.SchoolMatters.com were used because, collectively, they contain several pieces of information that were useful for identifying sites.
10

A school was considered a participant when the study team received consent forms from all teachers at the target grade levels in the school. Signing the consent form meant that a teacher agreed to attend training on whatever curriculum was assigned to the school, implement the curriculum to the best of his or her ability, and cooperate with student testing conducted by the study team.17 The consent form also asked teachers to agree to several other data collection efforts, including teacher surveys and classroom observations. Although the other data collection efforts were not a requirement for study participation, response rates to these efforts were high (see Appendix A).18
The study team recruited 110 schools from the 12 districts that agreed to participate.19 All teachers at each of the target grade levels in each school that had students who were eligible for testing consented to study participation. Three teachers were not included in the study, because those teachers worked with classrooms of high-needs students who were not eligible for testing.
3. Characteristics of Participating Districts and Schools
The characteristics of districts that agreed to participate are consistent with the study team’s recruitment goals. The 12 participating districts are geographically dispersed across 10 states (Connecticut, Florida, Kentucky, Minnesota, Mississippi, Missouri, New York, Nevada, South Carolina, and Texas) and in all four of the Census Bureau–designated regions of the country. The districts also differ in terms of urban status—3 districts are in an urban area, 5 are in a suburban area, and 4 are in a rural area.
Tables I.1 and I.2 present additional information useful for understanding the types of districts and schools that participated. As Table I.1 shows, when compared to the average U.S. district, those districts that agreed to participate have a higher fraction of schoolwide Title I eligible schools, students eligible for free or reduced-price meals, and minority students. A similar pattern exists when comparing U.S. elementary schools with those that agreed to participate—see Table I.2.
17 Other relevant staff, such as math coordinators, math coaches, and supplemental teachers, also signed consent forms prior to random assignment.
18 After schools and teachers were enrolled in the study, parental consent also was obtained to administer the study’s math assessment to students (see Appendix A).
19 As described in Appendix A, one cohort-one school (assigned to Math Expressions) withdrew from the study partway through the first year of participation and would not allow the study to test students in the spring. Because spring achievement is the outcome used to assess the relative effects of the curricula, the school—which contained 3 teachers and 32 students in the sample—had to be excluded from the analysis. We explored whether the relative curriculum effects are sensitive to the exclusion of this school and found that they are robust to our sensitivity analyses—see Appendix D for more details.
11

TABLE I.1
CHARACTERISTICS OF U.S. DISTRICTS AND PARTICIPATING DISTRICTS
U.S. Districts Participating Districts
Number of Elementary Schools (average) 6 67
Title I Eligible Schools (percentage)a 60.6 55.6
Schoolwide Title I Eligible Schools (percentage)a 24.9 43.3
Student Enrollment (average) 3,036 45,381
Students Eligible for Free or Reduced-Price Meals (percentage) 40.1 48.3
Student Gender (percentage) Male 52.0 51.4 Female 48.0 48.7
Student Race//Ethnicity (percentage) White 73.0 45.1 Non-Hispanic black 10.9 29.6 Hispanic 11.0 22.1 Asian 1.9 2.1 American Indian or Alaskan Native 3.2 1.1
Sample Size 17,017 12
Source: Author calculations using the 2005–2006 Common Core of Data (CCD). The “U.S. Districts” calculations include districts with at least one school with at least one student. The “Participating Districts” calculations include all cohort-one and cohort-two districts.
aThe Title I program provides financial assistance to schools with high numbers or percentages of poor children to help all students meet state academic standards. Title I-eligible schools have at least 35 percent of students from low-income families. Schools in which children from low-income families make up at least 40 percent of enrollment are eligible to use Title I funds for schoolwide programs that serve all children in the school.
12
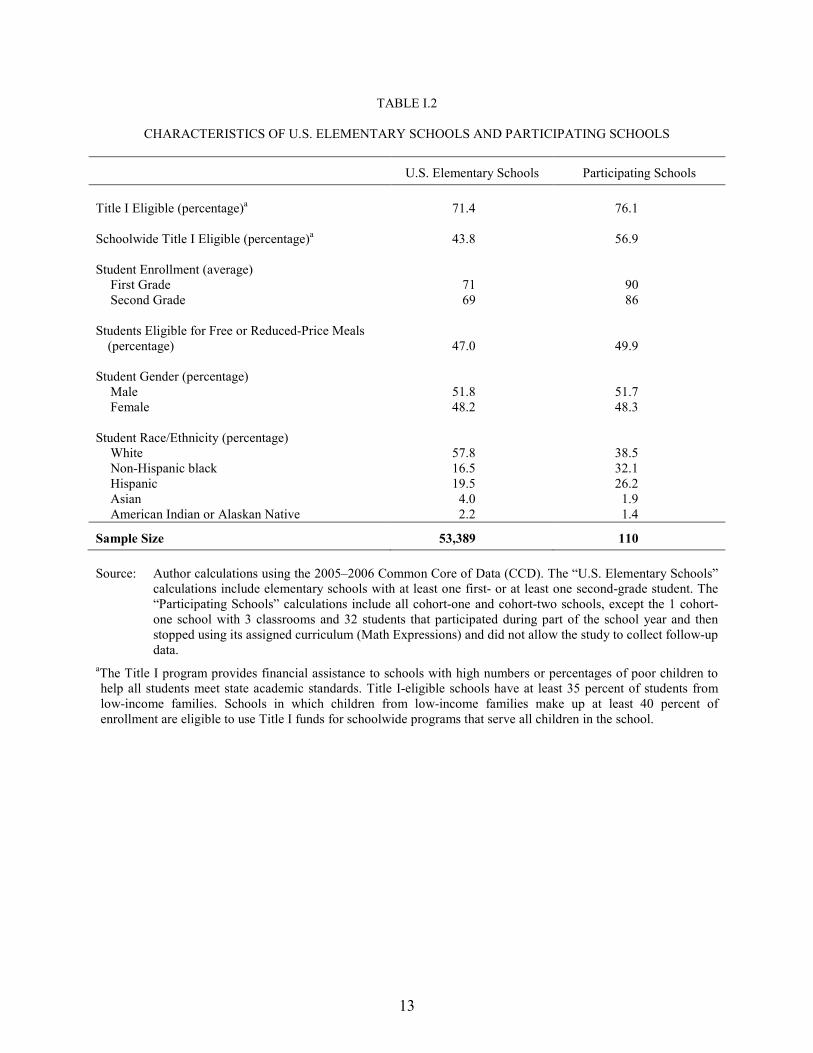
TABLE I.2
CHARACTERISTICS OF U.S. ELEMENTARY SCHOOLS AND PARTICIPATING SCHOOLS
U.S. Elementary Schools Participating Schools Title I Eligible (percentage)a 71.4 76.1 Schoolwide Title I Eligible (percentage)a 43.8 56.9 Student Enrollment (average)
First Grade 71 90 Second Grade 69 86
Students Eligible for Free or Reduced-Price Meals
(percentage) 47.0 49.9 Student Gender (percentage)
Male 51.8 51.7 Female 48.2 48.3
Student Race/Ethnicity (percentage)
White 57.8 38.5 Non-Hispanic black 16.5 32.1 Hispanic 19.5 26.2 Asian 4.0 1.9 American Indian or Alaskan Native 2.2 1.4
Sample Size 53,389 110
Source: Author calculations using the 2005–2006 Common Core of Data (CCD). The “U.S. Elementary Schools” calculations include elementary schools with at least one first- or at least one second-grade student. The “Participating Schools” calculations include all cohort-one and cohort-two schools, except the 1 cohort-one school with 3 classrooms and 32 students that participated during part of the school year and then stopped using its assigned curriculum (Math Expressions) and did not allow the study to collect follow-up data.
aThe Title I program provides financial assistance to schools with high numbers or percentages of poor children to help all students meet state academic standards. Title I-eligible schools have at least 35 percent of students from low-income families. Schools in which children from low-income families make up at least 40 percent of enrollment are eligible to use Title I funds for schoolwide programs that serve all children in the school.
13
As the recruiting process described earlier indicates, participating sites are not a representative sample of districts and schools and may be unique in ways that are not apparent in Tables I.1 and I.2. For example, interested districts had to be willing to implement four very different curricula, and each participating school had to be willing to use the curriculum randomly assigned by the study team. Sites that were comfortable with these participation requirements may value research evidence and be interested in obtaining direct evidence for their district to inform a future curriculum adoption decision. These participation requirements also may be acceptable to districts with tight budgets, because the free curriculum training and materials provided by the study could free funds for other uses. Of course, districts may have participated for other reasons. For example, an influential district leader who believed the study would be a valuable experience may have promoted the study to key individuals in the district that otherwise could be difficult for outsiders, such as members of the study team, to identify and contact. An open issue, which cannot be examined with the study’s data, is whether the potential differences between participating and nonparticipating sites are related to the study’s findings.
4. Implementing the Randomized Controlled Trial and Statistical Power
As mentioned earlier, random assignment of curricula to schools was conducted separately for each participating district and only took place after all teacher consent forms for all participating schools in a district were received. Obtaining teacher consent before random assignment helps to identify schools willing to participate regardless of the curriculum assigned to each school.
The study team used a blocked random assignment procedure that allocates similar numbers and types of schools, teachers, and students to each curriculum. The procedure divided schools in each district into blocks, where each block contained from four to seven schools with similar baseline characteristics.20 Random assignment of curricula to schools was then conducted within each block. This procedure helped minimize chance differences in school characteristics and sample sizes across curriculum groups, which helps to increase the face validity and statistical power of the design. Agodini et al. (2008) provides more details about the blocked random assignment procedure used by the study. The way in which the procedure was implemented with the current sample is described in Appendix A.
The study’s main results are based on students who were tested in both the fall and spring. Fall and spring class rosters were collected to identify students who should be tested at both points. The fall rosters were used to identify the students to whom parent consent forms should be distributed and to select the student sample. An average of 11 students per classroom was randomly selected in the fall for study participation, which assumed that fall and spring tests could be administered to an average of 10 students per classroom. Given the number of schools and classrooms involved in the study, the statistical power benefits of fall and spring testing
20 For example, if a district contained eight schools, two blocks with four schools each were constructed. If the number of schools in a district was not divisible by four, one block would contain from five to seven schools. For example, if a district contained five schools, only one block was constructed, and it contained all five schools. If a district contained eleven schools, two blocks were constructed, with one block containing four schools and the other having seven. The goal was to ensure that all four curricula were represented in each block.
14
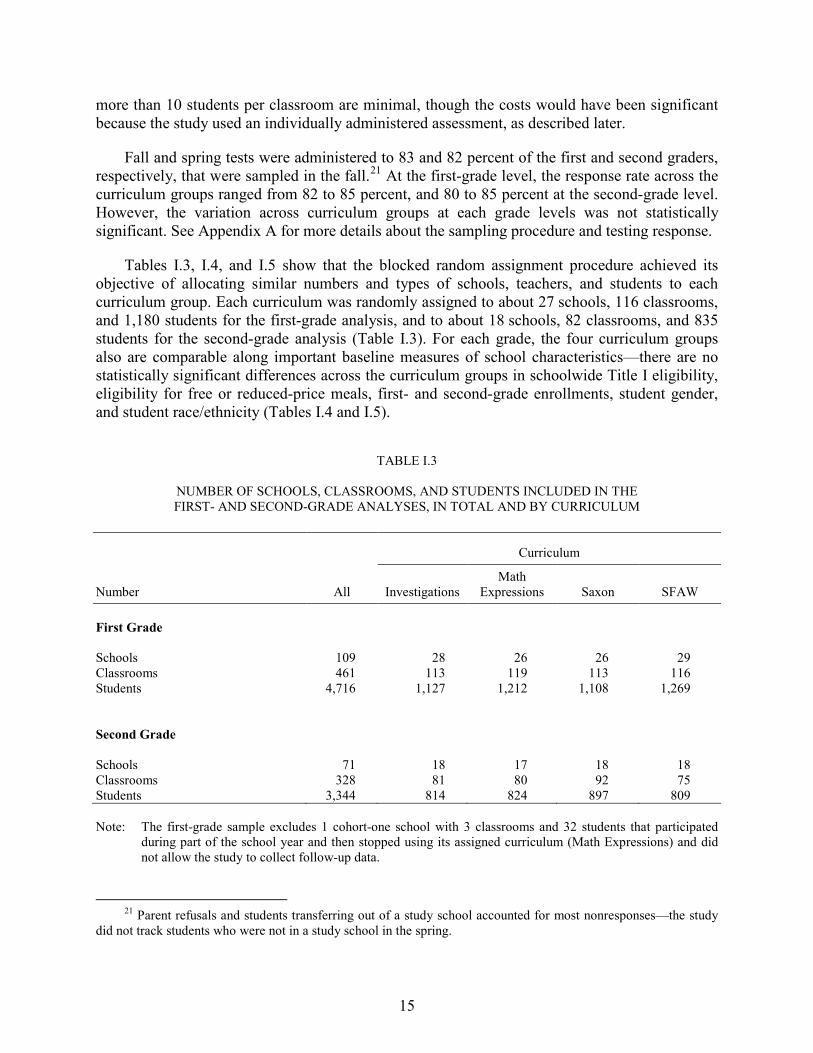
more than 10 students per classroom are minimal, though the costs would have been significant because the study used an individually administered assessment, as described later.
Fall and spring tests were administered to 83 and 82 percent of the first and second graders, respectively, that were sampled in the fall.21 At the first-grade level, the response rate across the curriculum groups ranged from 82 to 85 percent, and 80 to 85 percent at the second-grade level. However, the variation across curriculum groups at each grade levels was not statistically significant. See Appendix A for more details about the sampling procedure and testing response.
Tables I.3, I.4, and I.5 show that the blocked random assignment procedure achieved its objective of allocating similar numbers and types of schools, teachers, and students to each curriculum group. Each curriculum was randomly assigned to about 27 schools, 116 classrooms, and 1,180 students for the first-grade analysis, and to about 18 schools, 82 classrooms, and 835 students for the second-grade analysis (Table I.3). For each grade, the four curriculum groups also are comparable along important baseline measures of school characteristics—there are no statistically significant differences across the curriculum groups in schoolwide Title I eligibility, eligibility for free or reduced-price meals, first- and second-grade enrollments, student gender, and student race/ethnicity (Tables I.4 and I.5).
TABLE I.3
NUMBER OF SCHOOLS, CLASSROOMS, AND STUDENTS INCLUDED IN THE FIRST- AND SECOND-GRADE ANALYSES, IN TOTAL AND BY CURRICULUM
Curriculum
Number All Investigations Math
Expressions Saxon SFAW First Grade Schools 109 28 26 26 29 Classrooms 461 113 119 113 116 Students 4,716 1,127 1,212 1,108 1,269 Second Grade Schools 71 18 17 18 18 Classrooms 328 81 80 92 75 Students 3,344 814 824 897 809 Note: The first-grade sample excludes 1 cohort-one school with 3 classrooms and 32 students that participated
during part of the school year and then stopped using its assigned curriculum (Math Expressions) and did not allow the study to collect follow-up data.
21 Parent refusals and students transferring out of a study school accounted for most nonresponses—the study did not track students who were not in a study school in the spring.
15

TABLE I.4
FIRST-GRADE ANALYSIS SAMPLE: BASELINE SCHOOL CHARACTERISTICS BY CURRICULUM
Schools by Curriculum
All
Schools Investigations Math
Expressions Saxon SFAW p-value
Title I Eligible (percentage) 76.9 75.0 80.0 80.8 72.4 0.93
Schoolwide Title I Eligible (percentage) 57.4 57.1 56.0 57.7 58.6 0.87
Students Eligible for Free or Reduced-Price Meals (percentage) 50.0 55.0 49.2 44.4 51.0 0.15
Student Enrollment (average) First grade 90 89 96 87 88 0.99 Second grade 86 85 89 85 85 0.99
Student Gender (percentage) Male 51.7 51.9 51.3 51.5 52.2 0.79 Female 48.3 48.1 48.7 48.5 47.8 0.79
Student Race/Ethnicity (percentage) White 38.3 39.8 38.9 36.0 38.3 0.91 Non-Hispanic black 32.1 34.6 35.9 28.2 30.1 0.87 Hispanic 26.3 23.0 22.2 33.8 26.4 0.52 Asian 1.9 2.2 2.6 1.4 1.3 0.27 American Indian or Alaskan
Native 1.4 0.4 0.4 0.6 3.9 0.34
Sample Size 109 28 26 26 29 Source: Author calculations using the 2005–2006 Common Core of Data (CCD). The sample includes all cohort-
one and cohort-two schools, except the 1 cohort-one school with 3 classrooms and 32 students that participated during part of the school year and then stopped using its assigned curriculum (Math Expressions) and did not allow the study to collect follow-up data.
Note: The p-values are results from statistical tests that examine the joint equality of each school characteristic
across the curriculum groups. The statistical tests were conducted using regression models. The model regressed each school characteristic on an intercept, binary indicators for three of the four curricula, binary indicators for all but one of the blocks to which the schools were assigned during random assignment, and an error term. By including indicators for the blocks, the degrees of freedom used to calculate the statistical significance of the results are adjusted to reflect the information (number of blocks constructed) used when conducting random assignment. Given the relatively small number of schools that were assigned to each curriculum group, nonparametric statistical tests (including the Kolmogorov-Smirnov and Wilcoxon tests) also were conducted for each continuous school characteristic. In results not reported above, the findings of these nonparametric tests show that we cannot reject the null hypothesis that the curriculum groups are baseline equivalent along the school characteristics.
16
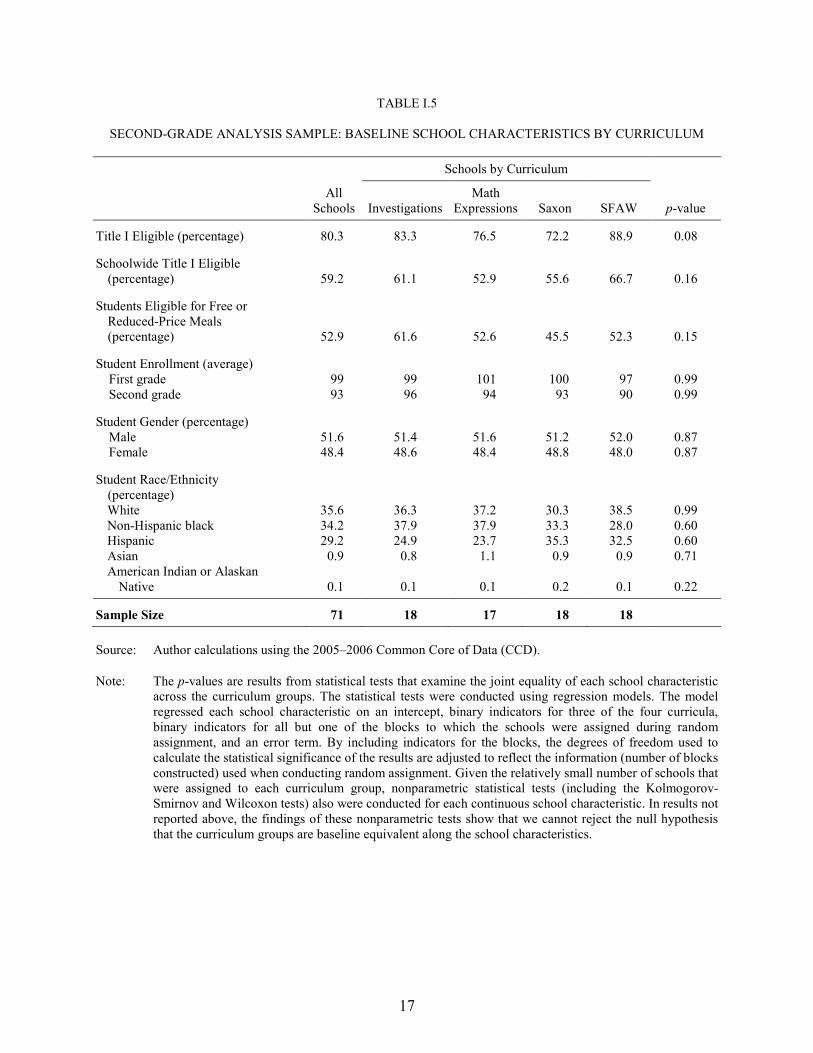
TABLE I.5
SECOND-GRADE ANALYSIS SAMPLE: BASELINE SCHOOL CHARACTERISTICS BY CURRICULUM
Schools by Curriculum
All
Schools Investigations Math
Expressions Saxon SFAW p-value
Title I Eligible (percentage) 80.3 83.3 76.5 72.2 88.9 0.08
Schoolwide Title I Eligible (percentage) 59.2 61.1 52.9 55.6 66.7 0.16
Students Eligible for Free or Reduced-Price Meals (percentage) 52.9 61.6 52.6 45.5 52.3 0.15
Student Enrollment (average) First grade 99 99 101 100 97 0.99 Second grade 93 96 94 93 90 0.99
Student Gender (percentage) Male 51.6 51.4 51.6 51.2 52.0 0.87 Female 48.4 48.6 48.4 48.8 48.0 0.87
Student Race/Ethnicity (percentage) White 35.6 36.3 37.2 30.3 38.5 0.99 Non-Hispanic black 34.2 37.9 37.9 33.3 28.0 0.60 Hispanic 29.2 24.9 23.7 35.3 32.5 0.60 Asian 0.9 0.8 1.1 0.9 0.9 0.71 American Indian or Alaskan
Native 0.1 0.1 0.1 0.2 0.1 0.22
Sample Size 71 18 17 18 18 Source: Author calculations using the 2005–2006 Common Core of Data (CCD).
Note: The p-values are results from statistical tests that examine the joint equality of each school characteristic across the curriculum groups. The statistical tests were conducted using regression models. The model regressed each school characteristic on an intercept, binary indicators for three of the four curricula, binary indicators for all but one of the blocks to which the schools were assigned during random assignment, and an error term. By including indicators for the blocks, the degrees of freedom used to calculate the statistical significance of the results are adjusted to reflect the information (number of blocks constructed) used when conducting random assignment. Given the relatively small number of schools that were assigned to each curriculum group, nonparametric statistical tests (including the Kolmogorov-Smirnov and Wilcoxon tests) also were conducted for each continuous school characteristic. In results not reported above, the findings of these nonparametric tests show that we cannot reject the null hypothesis that the curriculum groups are baseline equivalent along the school characteristics.
17
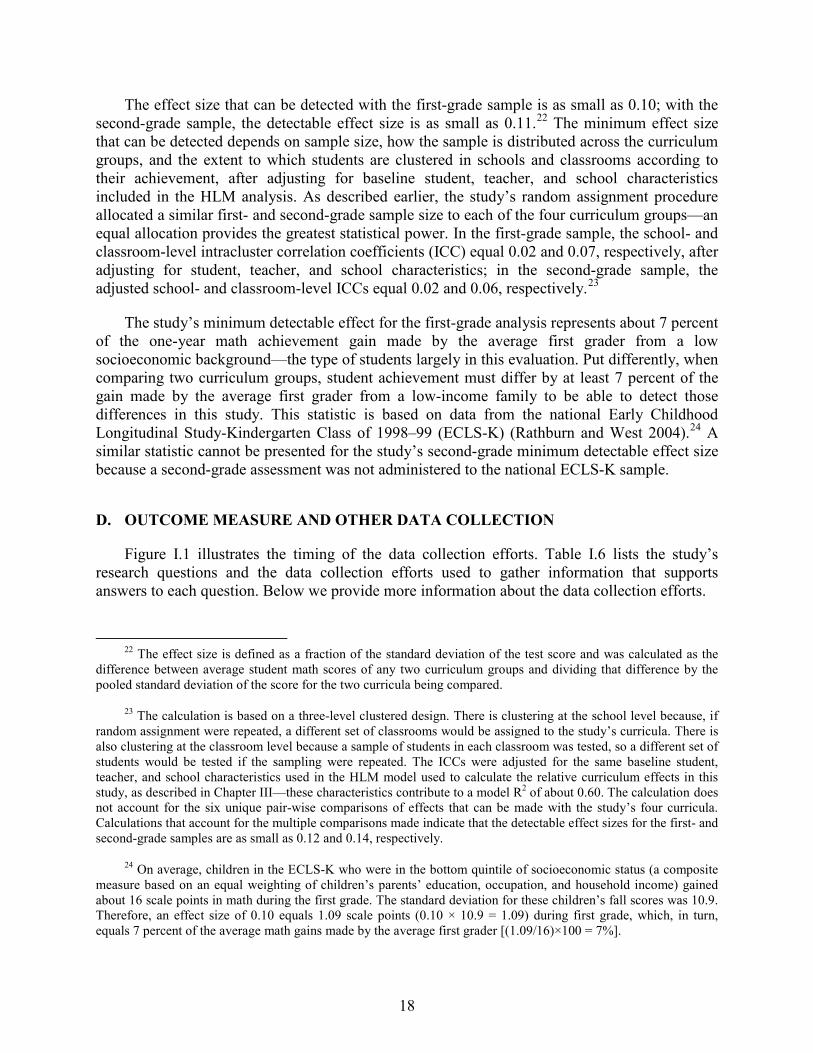
The effect size that can be detected with the first-grade sample is as small as 0.10; with the second-grade sample, the detectable effect size is as small as 0.11.22 The minimum effect size that can be detected depends on sample size, how the sample is distributed across the curriculum groups, and the extent to which students are clustered in schools and classrooms according to their achievement, after adjusting for baseline student, teacher, and school characteristics included in the HLM analysis. As described earlier, the study’s random assignment procedure allocated a similar first- and second-grade sample size to each of the four curriculum groups—an equal allocation provides the greatest statistical power. In the first-grade sample, the school- and classroom-level intracluster correlation coefficients (ICC) equal 0.02 and 0.07, respectively, after adjusting for student, teacher, and school characteristics; in the second-grade sample, the adjusted school- and classroom-level ICCs equal 0.02 and 0.06, respectively.23
The study’s minimum detectable effect for the first-grade analysis represents about 7 percent of the one-year math achievement gain made by the average first grader from a low socioeconomic background—the type of students largely in this evaluation. Put differently, when comparing two curriculum groups, student achievement must differ by at least 7 percent of the gain made by the average first grader from a low-income family to be able to detect those differences in this study. This statistic is based on data from the national Early Childhood Longitudinal Study-Kindergarten Class of 1998–99 (ECLS-K) (Rathburn and West 2004).24 A similar statistic cannot be presented for the study’s second-grade minimum detectable effect size because a second-grade assessment was not administered to the national ECLS-K sample.
D. OUTCOME MEASURE AND OTHER DATA COLLECTION
Figure I.1 illustrates the timing of the data collection efforts. Table I.6 lists the study’s research questions and the data collection efforts used to gather information that supports answers to each question. Below we provide more information about the data collection efforts.
22 The effect size is defined as a fraction of the standard deviation of the test score and was calculated as the difference between average student math scores of any two curriculum groups and dividing that difference by the pooled standard deviation of the score for the two curricula being compared.
23 The calculation is based on a three-level clustered design. There is clustering at the school level because, if random assignment were repeated, a different set of classrooms would be assigned to the study’s curricula. There is also clustering at the classroom level because a sample of students in each classroom was tested, so a different set of students would be tested if the sampling were repeated. The ICCs were adjusted for the same baseline student, teacher, and school characteristics used in the HLM model used to calculate the relative curriculum effects in this study, as described in Chapter III—these characteristics contribute to a model R2 of about 0.60. The calculation does not account for the six unique pair-wise comparisons of effects that can be made with the study’s four curricula. Calculations that account for the multiple comparisons made indicate that the detectable effect sizes for the first- and second-grade samples are as small as 0.12 and 0.14, respectively.
24 On average, children in the ECLS-K who were in the bottom quintile of socioeconomic status (a composite measure based on an equal weighting of children’s parents’ education, occupation, and household income) gained about 16 scale points in math during the first grade. The standard deviation for these children’s fall scores was 10.9. Therefore, an effect size of 0.10 equals 1.09 scale points (0.10 × 10.9 = 1.09) during first grade, which, in turn, equals 7 percent of the average math gains made by the average first grader [(1.09/16)×100 = 7%].
18

FIGURE I.1
DATA COLLECTION TIME LINE DURING THE FIRST YEAR OF CURRICULUM IMPLEMENTATION
Note: First-grade classroom observations were conducted in both cohort-one and cohort-two schools because all of the study schools implemented the curricula in the first grade during their first year of study participation. In contrast, second-grade classroom observations were conducted only in cohort-two schools because only those schools implemented the curricula in the second grade (in addition to the first grade) during their first year of study participation.
19

TABLE I.6
RESEARCH QUESTIONS AND SUPPORTING DATA COLLECTION EFFORTS
Research Question Supporting Data Collection Effort
1. What are the relative effects of the four math curricula on math achievement of first- and second-graders in disadvantaged schools?
► Fall and spring math tests of first- and second-grade students conducted by the study team. Student characteristics from school records and teacher characteristics from a fall survey administered by the study are used in the analysis.
2. Are the relative curriculum effects influenced by school and classroom characteristics, including teacher knowledge of math content and pedagogy?
► School and classroom characteristics were measured before curriculum implementation began. They included teacher scores on the study-administered assessment of math content and pedagogical knowledge.
3. What accounts for the relative curriculum effects observed?
► This analysis includes the amount of time teachers spent on math instruction and the math content covered, as collected through the spring teacher surveys. It also includes scales about teaching approaches and practices created from the classroom observations conducted by the study team.
1. Outcome Measure
To measure the relative effects of the curricula, the study team assessed student math achievement using the assessment developed for the National Center for Education Statistics’ Early Childhood Longitudinal Study-Kindergarten Class of 1998–99 (ECLS-K). The goal was to use an assessment that had already been developed and that assesses the knowledge and skills mathematicians and math educators feel are important for early elementary-school students to develop. The ECLS-K assessment meets these requirements as well as accepted standards of validity and reliability. The assessment also meets other important requirements, including individual administration, nationally normed, ability to measure achievement gains over the study’s grade range (which ultimately will include the first, second, and third grades), and accuracy in capturing achievement of students from a wide range of backgrounds and ability levels.25
Another important feature of the ECLS-K assessment is that it is an adaptive test—an approach to measuring achievement that is tailored to a student’s achievement level. In particular, the test begins by administering to each student a short, first-stage routing test used to broadly measure each student’s achievement level. Depending on the score on this routing test, the student is then assigned to one of three longer second-stage tests: (1) an easy test, (2) a middle-difficulty test, or (3) a difficult test. Some of the items on the second-stage tests overlap,
25 Rock and Pollack (2002) provide information about the assessment’s validity and reliability based on the national ECLS-K sample. We provide information about the assessment’s reliability for this study’s first- and second-grade samples later in this section.
20
and this overlap is used by item response theory (IRT) techniques (Lord 1980) to place scores on the different tests on the same scale. IRT estimates the number of items students would have answered correctly if they had taken all of the questions on all three of the second-stage tests. The analysis is based on these scale scores, which, according to the test developers, are the correct scores to analyze for our purposes (Rock and Pollack 2002). Adaptive tests are useful for measuring achievement because they limit the amount of time children are away from their classrooms and reduce the risk of ceiling or floor effects in the test score distribution, which can have adverse effects on measuring achievement gains.
The assessment includes questions in the five math content areas used in the Mathematics Framework for the 1996 National Assessment of Educational Progress (National Assessment Governing Board 1996):
1. Number sense, properties, and operations
2. Measurement
3. Geometry and spatial sense
4. Data analysis, statistics, and probability
5. Patterns, algebra, and functions
The assessment includes both open-ended and multiple-choice questions that measure conceptual understanding, procedural knowledge, and problem solving in these content areas. On the first-grade test, about three-quarters of the items can be classified as number sense, properties, and operations; the remaining items are predominantly related to data analysis, statistics, and probability and patterns, algebra, and functions. On the second-grade test, about half of the test is comprised of items pertaining to number sense, properties, and operations; the other half is predominantly related to measurement; geometry and spatial sense; and patterns, algebra, and functions. Specific items included on the assessment are not provided because it is copyrighted.26
The study team administered the student assessment. Testers took students one at a time to a quiet place (such as the school library) to administer the assessment. The total time required for taking a student from the classroom, testing, and returning the student to class was about 45 minutes.
For both first and second graders, the fall test was administered within four weeks of the first day of classes, and the spring test from one to six weeks prior to the end of the school year. This timing was based on the goals of administering the fall test as close to the beginning of the school year and the spring test as close as possible to the end of the school year, and of keeping the average number of days between the two tests comparable across the curriculum groups.
26 See Rock and Pollack (2002) for more information about the process used to develop the ECLS-K assessment.
21

Within district, the timing of the assessment was similar across the curriculum groups. As Table III.1 in Chapter III shows, the fall test was administered an average of about 21 calendar days after the start of the school year for both first and second graders and was not significantly different across the curriculum groups (p-value of 0.65 for first graders and 0.87 for second graders). The spring test was administered an average of 237 calendar days after the fall test for both first and second graders and was not significantly different across the curriculum groups (p-value of 0.63 for first graders and 0.88 for second graders).
Student answers on the assessment were sent to the Educational Testing Service for scoring.27 A three-parameter IRT model was used to place scores from the different tests students took on the same scale. Reliabilities for the study’s first-grade sample equal 0.91 for the fall score and 0.93 for the spring score, and are consistent with the national ECLS-K sample (Rock and Pollack 2002, pp. 5–7 through 5–9).28 Reliabilities for the study’s second-grade sample equal 0.88 for the fall score, and 0.91 for the spring score—these reliabilities cannot be compared to the ECLS-K national sample because a second-grade assessment was not administered to the national sample. There were no floor or ceiling effects observed in either the fall or spring scores for either grade.
2. Other Data Collection
To help interpret measured effects, the study team conducted other data collection efforts:
• Assessment of Teacher Knowledge of Math Content and Pedagogy. Teacher math content knowledge and pedagogical knowledge were assessed at the initial teacher training sessions before the curricula were introduced, using an assessment developed by researchers at the University of Michigan.29 Scores on this test are included in the analysis of student achievement to examine the relationship between teacher math content and pedagogical knowledge and the effects of the curricula.
• Curriculum Training Received by Teachers. The study team took attendance at the initial teacher training sessions the publishers conducted before the start of the school year. Attendance at the followup sessions that occurred during the school year was recorded and provided by the publishers and was collected from teachers through the surveys described next.
27 Educational Testing Service was a developer of the ECLS-K Mathematics Assessment.
28 Reliabilities are based on the internal consistency (alpha) coefficients.
29 The teacher assessment includes items about teacher pedagogical content knowledge in two major domains: (1) knowledge of mathematics for teaching and (2) knowledge of students and mathematics. Items focus on numbers, operations, and patterns; functions; and algebra—the three content areas most frequently covered in the elementary grades. Mathematicians, math educators, professional developers, former teachers and the authors themselves (who had experience teaching and observing elementary classrooms) wrote items. Hill et al. (2004) provides details about the assessment’s development process. The reliability of the teacher test score for the study’s sample equals 0.75.
22
• Teacher Surveys. Two surveys were administered to teachers. The first was conducted in the fall and focused on background information about the teacher, classroom characteristics, curriculum training provided by the publishers up to that point, and math instruction approaches used before joining the study. The second survey, administered in the spring, gathered information on followup training provided by the publishers; use of the assigned curriculum and any other math curricula; and math instructional practices used during the year, including specific information about adherence to the teacher’s assigned curriculum.
• Classroom Observations. About 80 percent of the first- and second-grade classrooms were observed once by the study team.30 Observers used a protocol developed by the study team that included items that could be recorded regardless of the curriculum in use as well as items designed to measure features of the specific curriculum in use. Generally speaking, the cross-curriculum items measure types of teacher-student interactions, the kinds of activities students engaged in, and the instructional materials used; the curriculum-specific items measure adherence to specific activities and materials of the assigned curriculum. All the first-grade observations were conducted in the spring (March through April). The second-grade observations were randomly distributed across three time periods—fall (October through November), winter (January through February), and spring (March through April). The second-grade observations were distributed across three time periods to help capture any variation in instruction during the school year. First-grade observations were all conducted in the spring because, during the first year of the study when the only observations that were conducted were at the first-grade level for cohort-one schools, the protocol was not finalized until the spring. To maintain consistency, the first-grade observations for cohort-two schools also were conducted in the spring.
• Student Characteristics from Class Rosters. The study team collected rosters for each classroom in the study to select the student sample. Student demographic information was requested as part of this process so that these demographics could be included in the analysis to help increase the study’s statistical power. The request included student gender, date of birth, race/ethnicity, eligibility for free or reduced-price meals, whether the student had limited English proficiency or was an English language learner, and whether the student had an individualized education plan (IEP) or received special services (for students with a disability).
30 First-grade classroom observations were conducted in both cohort-one and cohort-two schools because all of the study schools implemented the curricula in the first grade during their first year of study participation. In contrast, second-grade classroom observations were conducted only in cohort-two schools because only those schools implemented the curricula in the second grade (in addition to the first grade) during their first year of study participation. Random samples of 82 and 90 percent of the first- and second-grade classrooms, respectively, were selected for observations by the study team. The fraction of sampled classrooms that could be observed by the study team was high (96 and 91 percent of first- and second-grade classrooms, respectively), which resulted in 79 and 82 percent of all first- and second-grade classrooms being observed. Appendix A describes observer training that was conducted, and Appendices B and C provide information about inter-rater reliability for each item on the observation protocol. Chapter IV provides information about the four scales that were constructed from the observation data and reliability of the scales, which ranges from 0.72 to 0.92.
23

Appendix A provides more details about the data collection forms and response rates. The actual data collection forms are contained in Agodini et al. (2008), with the exception of the student math assessment and teacher knowledge assessment. Those instruments are copyrighted.
24
II. CURRICULUM IMPLEMENTATION
A key consideration for interpreting the relative curriculum effects is the context and way in which the curricula were implemented. Ordinarily, when a district adopts a new curriculum, they work directly with publishers from the outset. In the study, on the other hand, districts first came into contact with the study team to discuss participation and did not meet with the publishers until random assignment of curricula to schools was completed. As described in Chapter I, the study team sought buy-in for all four of the study’s curricula from all relevant school staff before random assignment was conducted to ensure that schools were willing to use the curriculum that ultimately was assigned to them. After random assignment was completed, the team introduced the school staff to the publishers of their assigned curriculum. Publishers then worked with the schools to deliver curriculum materials before the school year began and to schedule training days for teachers.
The study team provided some logistical and financial support for the teacher training. When a district adopts a curriculum, it typically sets aside in-service days for teachers to attend training sessions on the new curriculum. Because the districts were piloting the curricula as part of the study, they typically did not set aside such in-service days. As a result, study teachers frequently received training during times not covered by contracts, such as during the summer, during evenings after school, or on weekends. The study team helped coordinate training sessions and, for training that occurred during hours not covered by contracts, compensated teachers for their time at district salary rates, as required by teacher unions. The study team provided one other type of support—teachers occasionally contacted the study team with an implementation question that should have been directed to the publishers; in those cases the study team immediately notified the publishers to contact the teachers.31
Although the study team provided this basic support, they did not mandate a minimum or maximum level of implementation, nor were they responsible for ensuring that a particular level of implementation was achieved. Instead, the study team sought to support implementation in ways consistent with typical district and publisher practices. As such, implementation ultimately reflects what publishers and districts achieved while working together.
Statistical tests were used to identify implementation measures that differ significantly across the curriculum groups. The statistical tests were conducted using two-level hierarchical linear models (HLMs). The first (teacher-level) equation regressed each implementation measure on an intercept and a teacher-level error term. The second (school-level) equation regressed the intercept from the first equation on an intercept, binary indicators for three of the four curricula, binary indicators for all but one of the blocks to which the schools were assigned during random assignment, and a school-level error term. By including indicators for the blocks, the degrees of freedom used to calculate the statistical significance of the results are adjusted to reflect the information (number of blocks constructed) used when conducting random assignment.
31 The extent to which the study team’s support differed from typical support is unclear, as is the effect of the team’s support on the generalizability of the results.
25

For measures that were significantly different at the 5 percent level across the groups, we discuss the range of values for the curriculum groups.32 For measures that were not significantly different across the groups, we discuss the average value for all teachers.
A. CURRICULUM IMPLEMENTATION WAS ASSESSED THROUGH TEACHER SURVEYS AND CLASSROOM OBSERVATIONS
As described in Chapter I, the study team used teacher surveys and classroom observations to collect information about several aspects of curriculum implementation.33 The information collected through the teacher surveys and classroom observations are presented in this chapter to describe how the curricula were implemented within the context of this study. Surveys in the fall and spring asked teachers to report on several basic questions about their use of the assigned curriculum, such as whether they used it, whether they liked it, and whether they used any supplemental math materials. The surveys asked teachers to reflect back across the year up to the time of the survey. On the fall survey, teachers were asked to reflect back on the year to that point (the surveys were administered about one to two months into the school year). The spring surveys asked teachers to reflect back across the entire school year (the surveys were administered about eight months into the school year).
Classroom observations collected information on the instructional approaches and activities used during math instruction, such as the frequency of various teacher and student behaviors, the types of materials and representations used, and ratings of how evident behaviors or characteristics are in the classroom. The observations collected information about all math instruction that occurred during a single day. The study’s curricula typically included some math instruction during a morning meeting that was the first activity of the day and a math lesson that took place later in the day. Some of the curricula also included math instructional activities for learning centers, which could occur in the morning or afternoon, and some curricula included quick math fluency activities that could occur at varying points during the day, such as just before or after lunch.
1. Summary of Key Implementation Findings
The data described in the following sections indicate that nearly all teachers used their assigned curriculum in both the fall and spring, nearly all teachers received training on their assigned curriculum, and about one-third of all teachers supplemented their assigned curriculum with other materials.
32 The 5 percent level of confidence means there is no more than a 5 percent chance that any finding discussed occurred by chance.
33 All data presented in Chapter II pertain to implementation during the first year that each school participated in the study. As described in Chapter I, data on first-grade classrooms include both the 39-cohort one schools and 70-cohort two schools. Data on second-grade classrooms include only the 71 cohort-two schools.
26
Some aspects of implementation varied significantly across the curriculum groups.34 In the first-grade sample, teacher training on the assigned curriculum, instructional time, percent of lessons used from the assigned curriculum, teacher desire to use their assigned curriculum again, and content covered varied by curricula. In the second-grade sample, these same aspects of implementation varied by curricula, with the exception of the percentage of lessons used. In addition, supplementation rates in the fall varied by curricula.
There was variation in adherence within each curriculum. Within each curriculum group, some teachers implemented nearly all of the essential features of their assigned curriculum, whereas other teachers implemented fewer essential features. Because random assignment created four groups of similar teachers (as described below), these results are useful for understanding the extent to which the average study teacher adhered to each curriculum. However, as discussed in Section E, comparisons across the curriculum groups should not be made because the number and types of items used to define adherence to each curriculum varies across the groups.
In the following sections we summarize information useful for understanding curriculum implementation. The information includes a description of the study teachers’ characteristics, including their demographics, education, and teaching experience. The information also includes measures of curriculum training provided to teachers, curriculum use during the school year, the math content covered during the year, and the extent to which teachers adhered to various features of their assigned curriculum.
2. Teacher Characteristics
The characteristics of the study’s districts and schools are important for understanding the context for curriculum implementation, as are the characteristics of the first- and second-grade teachers who were assigned to use the curricula (see Tables II.1 and II.2). In terms of demographics, the first- and second-grade teachers have many similar characteristics. The first-grade teachers are, on average, 40 years of age,35 96 percent female, 87 percent white, and 20 percent Hispanic.36 Among the second-grade teachers, 97 percent are female, 82 percent are white, and 30 percent are Hispanic. Second grade teachers range in age, on average, from 37 to 42 years old.37 Along other important dimensions, we see that:
34 The extent to which implementation of the four curricula within the study context differed from typical implementation of these curricula is unclear, as is the effect of this variability on the generalizability of the results concerning relative effectiveness of the four curricula.
35 The standard deviation for age among first-grade teachers is 11.1 years.
36 The survey asked teachers to report separately their race and ethnicity.
37 The standard deviation for age among second-grade teachers is 10.8 years.
27

TABLE II.1
FIRST-GRADE TEACHER CHARACTERISTICS BY CURRICULUM (Percentages Unless Stated Otherwise)
Teachers by Curriculum
All
Teachers Investigations Math
Expressions Saxon SFAW p-value Demographics
Average age 40.1 41.3 40.3 39.4 39.3 0.34 Female 95.8 93.8 97.4 96.4 95.7
0.64
Race
White 87.4 85.8 88.6 89.9 85.4 0.91 Other 12.6 14.2 11.4 10.1 14.6
Hispanic 20.1 13.3 14.2 34.0 19.1
0.32
Experience
Average years of teaching experience 12.1 12.2 13.4 12.1 10.8 0.17 Type of teaching certificate
Regular or standard 90.6 91.1 91.2 91.7 88.6 0.88 Other 9.4 9.0 8.8 8.4 11.5
Content area of teaching certificate
Elementary education 83.7 88.4 88.2 79.6 78.4 0.54 Early childhood 11.1 8.0 9.1 13.9 13.5 Other 5.2 3.6 2.7 6.5 8.1
Grade range for teaching certificate
Elementary grades 84.1 82.1 78.9 82.4 92.7 0.16 Elementary and secondary grades 16.0 17.9 21.1 17.6 7.3
Education
Highest degree earned
Bachelor’s degree 51.4 49.5 54.1 48.6 53.1 0.89 Master’s degree or higher 48.7 50.4 45.9 51.4 46.9
Field for bachelor’s degree
Elementary education 68.1 72.0 74.3 67.6 58.7 0.12 Early childhood or K–12 education 11.9 5.6 9.2 15.2 17.4
Mathematics 0.0 0.0 0.0 0.0 0.0 Other 20.0 22.4 16.5 17.1 23.9
Has second major field of study* 25.4 33.3 25.7 26.5 16.4 0.02 Second field of study (among those with a second field)
Elementary education, general 15.7 9.1 22.2 12.0 23.5 0.48 Early childhood or K–12 14.7 9.1 11.1 20.0 23.5 Mathematics 0.0 0.0 0.0 0.0 0.0 Other 69.6 81.8 66.7 68.0 52.9
28

TABLE II.1 (continued)
Teachers by Curriculum
All
Teachers Investigations Math
Expressions Saxon SFAW p-value Has any education degree 93.9 90.8 94.6 98.1 92.0 0.21 Number of advanced math courses taken
None 43.8 47.6 47.7 34.9 45.0 0.61 1 or 2 43.8 40.0 43.0 49.1 43.1 3 or more 12.4 12.4 9.3 16.0 11.9
Number of math education courses taken
None 4.0 2.9 3.7 2.8 6.4 0.42 1 or 2 54.0 59.6 60.7 50.9 45.0 3 or more 42.0 37.5 35.5 46.2 48.6
Professional Development (PD) participation in the 12 Months Prior to the 2006–2007 School Year Math instruction 30.3 30.6 29.5 29.1 32.1 0.77 Math content 28.7 28.0 30.4 26.0 30.3 0.69 Performance standards in math 26.8 29.9 31.5 23.0 22.4 0.42 Other math-focused PD 24.0 24.8 31.5 16.8 22.0 0.20 Participated in any of the above 42.3 45.0 45.9 40.0 38.2 0.64 Math Content/Pedagogical Knowledge Teacher assessment (IRT scale score)
Overall -0.54 -0.50 -0.54 -0.60 -0.53 0.62 Content knowledge -0.79 -0.74 -0.79 -0.83 -0.78 0.66 Pedagogical knowledge -0.33 -0.29 -0.32 -0.39 -0.32 0.55
Sample Size 454 113 115 111 115
Source: Author calculations using fall teacher survey data and the study-administered assessment of teacher math content and pedagogical knowledge for cohort-one and cohort-two teachers. The sample excludes one Math Expressions school (with 3 classrooms) that participated during part of 2006–2007 the school year and then stopped using the curriculum and did not allow the study to collect follow-up data.
*Statistically significant at the 5 percent level. The statistical tests were conducted using two-level HLMs, and HLMs that are appropriate for continuous, binary, and categorical variables were used accordingly. A single p-value is reported for binary and multinomial variables and indicates whether the fraction of teachers in each category of the variable differs across the curriculum groups.
29

TABLE II.2
SECOND-GRADE TEACHER CHARACTERISTICS BY CURRICULUM (Percentages Unless Stated Otherwise)
Teachers by Curriculum
All
Teachers Investigations Math
Expressions Saxon SFAW p-value Demographics
Average age* 40.1 42.2 37.0 40.7 40.3 0.03 Female 96.9 97.5 97.4 96.6 95.9
0.97
Race
White 82.5 81.1 85.5 80.8 82.8 0.91 Other 17.5 18.9 14.5 19.2 17.2
Hispanic 30.4 21.8 23.0 45.3 29.6
0.79
Experience
Average years of teaching experience 12.3 13.7 10.0 12.2 13.1 0.06 Type of teaching certificate
Regular or standard 94.6 — — — — 0.08 Other 5.4 — — — —
Content area of teaching certificate
Elementary education 82.4 82.3 78.4 83.9 84.7 0.54 Early childhood 8.7 8.9 5.4 10.3 9.7 Other 9.0 8.9 16.2 5.7 5.6
Grade range for teaching certificate
Elementary grades 81.7 79.7 74.3 87.2 84.7 0.16 Elementary and secondary grades 18.3 20.3 25.7 12.8 15.3
Education
Highest degree earned Bachelor’s degree 59.2 52.5 64.0 58.3 62.5 0.92 Master’s degree or higher 40.8 47.5 36.0 41.7 37.5
Field for bachelor’s degree
Elementary education 72.2 61.5 74.7 74.4 78.9 0.12 Early childhood or K–12 education 11.4 10.3 10.7 12.2 12.7 Mathematics — — — — — Other 16.0 28.2 13.3 13.4 8.5
Has second major field of study 28.2 24.4 25.7 30.5 32.4 0.90 Second field of study (among those with a second field)
Elementary education, general 20.0 — — — — 0.75 Early childhood or K–12 10.6 — — — — Mathematics 4.7 — — — — Other 64.7 — — — —
30

TABLE II.2 (continued)
Teachers by Curriculum
All
Teachers Investigations Math
Expressions Saxon SFAW p-value Has any education degree 91.0 83.8 93.3 92.9 94.4 0.09 Has any math degree 2.6 — — — — 1.00 Number of advanced math courses taken
None 46.7 50.0 41.9 55.4 37.7 0.61 1 or 2 36.5 32.1 39.2 30.1 46.4 3 or more 16.8 17.9 18.9 14.5 15.9
Number of math education courses taken
None 5.2 — — — — 0.42 1 or 2 41.8 — — — — 3 or more 52.9 — — — —
Professional Development (PD) participation in the 12 Months Prior to the 2006–2007 School Year Math instruction 27.9 19.7 36.6 32.5 22.9 0.22 Math content 26.1 22.7 30.0 28.8 22.9 0.69 Performance standards in math 26.4 31.2 23.3 25.3 25.7 0.55 Other math-focused PD 23.8 25.0 21.1 28.4 20.0 0.66 Participated in any of the above 42.9 41.6 48.6 46.3 34.3 0.29 Math Content/Pedagogical Knowledge Teacher assessment (IRT Scale Score)
Overall -0.59 -0.51 -0.67 -0.66 -0.50 0.29 Content knowledge -0.86 -0.78 -0.96 -0.94 -0.76 0.27 Pedagogical knowledge -0.33 -0.25 -0.41 -0.41 -0.25 0.31
Sample Size 320 80 76 90 74
Source: Author calculations using fall teacher survey data and the study-administered assessment of teacher math content and pedagogical knowledge for cohort-two teachers.
*Statistically significant at the 5 percent level. The statistical tests were conducted using two-level HLMs, and HLMs that are appropriate for continuous, binary, and categorical variables were used accordingly. A single p-value is reported for binary and multinomial variables and indicates whether the fraction of teachers in each category of the variable differs across the curriculum groups.
— Value suppressed to protect respondent confidentiality.
31

32
• Teacher Experience and Certification. Both first- and second-grade teachers have an average of 12 years teaching experience.38
• Teacher Education. All teachers have at least a bachelor’s degree; 49 percent of the first-grade teachers and 41 percent of the second-grade teachers also have a master’s degree or higher.
More than 90 percent of teachers (91 and 95 percent in first- and second-grade, respectively) have a regular or standard teaching certificate, most of which (95 and 91 percent in first- and second-grade, respectively) are in an elementary or early childhood education content area.
39
• Math Education. Very few teachers had any degree in mathematics; less than 3 percent of second-grade teachers reported mathematics as a major field for any degree earned.
Eighty percent of first-grade teachers’ and 84 percent of second-grade teachers’ bachelor’s degrees are in education (elementary, early childhood, or K–12 education); the remaining degrees are in other fields. Looking across all degrees earned by teachers, more than 90 percent of teachers (94 and 91 percent in first- and second-grade, respectively) reported education as a major field of study for any degrees earned.
40
• Prior Professional Development. During the 12 months prior to joining the study, 42 and 43 percent of first- and second-grade teachers, respectively, participated in non-study math professional development, including topics such as math instruction, math content, performance standards, and other math-focused topics.
While few teachers had a degree in mathematics, 96 and 95 percent of first- and second-grade teachers, respectively, took at least one math education course. In addition, 56 and 53 percent of first- and second-grade teachers, respectively, took at least one advanced math course such as trigonometry, calculus, or statistics.
• Teacher Knowledge. At each initial curriculum training session (described later), the study team administered an assessment of math content and pedagogical knowledge to teachers as the first activity of the day.41
The test covers kindergarten through fifth grade knowledge.
38 The standard deviation for teaching experience is 9.9 years for first-grade teachers and 9.4 years for second-grade teachers.
39 Six percent of first-grade teachers and 8 percent of second-grade teachers held advanced certificates in a subject area or Ph.Ds.
40This statistic is not reported for first-grade teachers in Table II.1 because fewer than three first-grade teachers reported mathematics as a major field for any degree earned. The value is suppressed to protect respondent confidentiality.
41 The teacher assessment is included in the analysis of student achievement. As mentioned in Chapter I, the reliability of the teacher test score for the study’s sample equals 0.75, and the reliabilities of the two subscales (pedagogical knowledge and content knowledge) equal 0.68 and 0.75, respectively.

33
• Prior Use of the Assigned Curriculum. The proportion of first-grade teachers who reported using their assigned curriculum in the early grades (K–3) at some point prior to the study was significantly different across the curriculum groups, ranging from 4 to 21 percent (see Table II.3). Among second-grade teachers, 10 percent reported using their assigned curriculum prior to the study; this proportion was not significantly different across the curriculum groups.42 Table II.3 also provides information about the percentage of teachers who taught in kindergarten through third grade in the year before the study and which curriculum those teachers used.
B. TEACHER CURRICULUM TRAINING
A key component of curriculum implementation involved training teachers to use their assigned curriculum. The publishers provided initial training sessions before the start of the school year and follow-up training and support during the year. The publishers proposed plans for training during the curriculum selection process and in some cases modified those plans after the initial training in response to teacher needs (publisher plans are described below in Section 2). Some districts or schools asked publishers for additional training, and the publishers agreed to do so if they considered it appropriate. The study team did not mandate any minimum or maximum amount of training, and instead supported any level of training the publishers indicated was appropriate.
1. Curriculum Training Provided by Publishers
The initial trainings were group sessions held in each district, with separate trainings held for each curriculum. Training typically occurred two to four weeks before the first day of school. Due to the large number of trainings required to support the study schools and teachers, however, some trainings were offered earlier in the summer.43
The initial trainings lasted one to two days, depending on the curriculum. Investigations, Saxon, and SFAW offered one day of initial training; Math Expressions offered two. Investigations and Math Expressions offered training separately to first- and second-grade
42 Three of the 12 study districts used one of the study’s curricula district-wide prior to the study (two used
Saxon and one used SFAW). A fourth district reported using one of the study’s curricula (SFAW) district-wide prior to the study; however, survey data indicate that three of the participating schools used another curriculum (Harcourt Math) before the study. Two additional districts allowed schools to select their curriculum, and within those districts a few schools reported using Saxon or SFAW before the study. The remaining six districts reported implementing a variety of curricula district-wide, including Math in My World, Everyday Math, Harcourt Math, Houghton Mifflin Math, Silver Burdett Ginn, and Macmillan/McGraw-Hill Math. Teachers were asked to report the math curriculum they used before the study, and many teachers reported using a curriculum other than the one used in their schools. The overall relative effects presented in Chapter III are adjusted for teacher-reported prior use of their assigned curriculum at the K-3 level, and relative effects are presented separately for teachers who did and did not report prior use of their assigned curriculum.
43 Training dates were selected on the basis of district schedules, teacher availability, and trainer availability.

34
TABLE II.3
CURRICULA PREVIOUSLY USED BY TEACHERS (Percentages)
Teachers by Curriculum
All Teachers Investigations
Math Expressions Saxon SFAW p-value
First-Grade Teachers Used the Assigned Curriculum at the K–3 Level Before the Study* 11.5 5.5 3.6 16.2 21.1 0.01
Taught Math in K–3 Previous Year 87.8 91.6 85.7 84.8 89.0 0.50
Curriculum Used Previous Year (among those who taught K–3 previous year)a
Everyday Math 5.3 5.2 5.3 6.8 4.2 0.98 Harcourt Math 9.6 16.7 4.2 13.6 4.2 Houghton Mifflin Math 7.0 6.3 7.4 9.1 5.3 Macmillan/McGraw-Hill Math 7.5 13.5 5.3 4.5 6.3 Math in My World 8.3 4.2 5.3 17.0 7.4 Saxon Math 24.9 20.8 33.7 14.8 29.5 SFAW Math 20.1 12.5 21.1 26.1 21.1 Other 17.1 20.9 16.9 8.0 22.1
Number of Years Used Previous Year’s Curriculum (among those who taught K–3 previous year) 4.2 3.9 4.4 4.4 4.1 0.56
Sample Size 454 113 115 111 115
Second-Grade Teachers Used the Assigned Curriculum at the K–3 Level Prior to the Study 10.4 — — — — 0.10
Taught Math in K–3 Previous Year 87.3 87.8 94.3 83.3 84.1 0.22
Curriculum Used Previous Year (among those who taught K–3 previous year)a
Harcourt Math 16.1 28.6 6.2 13.8 16.1 0.92 Macmillan/McGraw-Hill Math 8.7 6.3 6.2 12.1 10.7 Math in My World 12.0 6.3 10.8 17.2 14.3 Saxon Math 24.4 23.8 35.4 13.8 23.2 SFAW Math 27.3 22.2 27.7 32.8 26.8 Other 11.5 12.6 13.8 10.3 8.9
Number of Years Used Previous Year’s Curriculum (among those who taught K–3 previous year) 3.8 4.1 3.8 3.3 4.1 0.33
Sample Size 320 80 76 90 74
Source: Author calculations using fall teacher survey data. The first-grade sample excludes one Math Expressions school (with 3 classrooms) that participated during part of the 2006–2007 school year and then stopped using the curriculum and did not allow the study to collect follow-up data. The first grade data include cohort-one and cohort-two teachers; the second grade data include only cohort-two teachers.
*Statistically significant at the 5 percent level. The statistical tests were conducted using two-level HLMs, and HLMs that are appropriate for binary and categorical variables were used accordingly. A single p-value is reported for binary and multinomial variables and indicates whether the fraction of teachers in each category of the variable differs across the curriculum groups. sA small fraction reported more than one curriculum and were instructed to indicate the curriculum used most frequently, which is reported above.
— Value suppressed to protect respondent confidentiality.

35
teachers. Saxon and SFAW trainers provided training to both groups of teachers together, as long as the group size did not become excessive, in which case these trainers offered training separately by grade level.44
Two sources of data were used to document attendance at the initial training. First, attendance forms were collected by study team members who also attended. These forms documented each attendee’s name, school affiliation, position, and arrival and departure time. The second source of data was the fall teacher survey, which asked teachers if they attended initial training.
The two sources of data on initial training are consistent. They show that most teachers attended the initial training on their assigned curriculum, but attendance rates varied by curricula among second-grade teachers. Among first-grade teachers, 94 percent attended initial training and this was not significantly different across the curriculum groups (see Table II.4). Among second-grade teachers, attendance rates at the initial training sessions ranged from 80 to 97 percent (see Table II.5). Although teachers were encouraged by the publishers and study team to attend training, attendance was voluntary.
In the fall survey, teachers were asked how well the initial training prepared them to use their assigned curriculum. Among first-grade teachers, Math Expressions and Investigations teachers reported feeling less prepared to use their assigned curriculum after initial training, than teachers assigned to Saxon and SFAW.45
In second-grade, Math Expressions teachers reported feeling less prepared to use their assigned curriculum than teachers in all three other curriculum groups (p-values ranged from 0.00 to 0.02). In addition, Investigations teachers reported feeling less prepared to use their assigned curriculum than Saxon and SFAW teachers (p-values = 0.05 and 0.01, respectively). Forty-four percent of teachers assigned to Math Expressions felt adequately or very well prepared to use their assigned curriculum after initial training, compared to 77 percent of Investigations teachers, 84 percent of Saxon teachers, and 94 percent of SFAW teachers (Table II.5). There were no significant differences between the Saxon and SFAW teachers (p-value > 0.50).
Math Expressions and Investigations were not significantly different from one another (p-value > 0.50), and Saxon and SFAW were not significantly different from one another (p-value = 0.20). Sixty-six percent of Math Expressions teachers and 77 percent of Investigations teachers reported feeling adequately or very well prepared to use their assigned curriculum after initial training, compared to 84 percent of Saxon teachers and 90 percent of SFAW teachers (Table II.4).
44 In the 2006–2007 school year, only first-grade teachers participated in the study; therefore, initial trainings
for Saxon and SFAW in summer 2006 included only first-grade teachers.
45 Statistical tests that compare pairs of curricula indicate that p-values for each of the following comparisons were less than 0.01: Investigations and Saxon, Investigations and SFAW, Math Expressions and Saxon, and Math Expressions and SFAW.

36
TABLE II.4
FIRST-GRADE TEACHER TRAINING ON THE ASSIGNED CURRICULUM (Percentages Unless Stated Otherwise)
Teachers by Curriculum
All Teachers Investigations
Math Expressions Saxon SFAW p-value
Initial Training Attended Training 94.3 97.2 95.5 92.4 91.9 0.30
Publisher-Specified Training Length 1–2 days 1 day 2 days 1 day 1 day
Number of Days Attended* (among those who attended) 1.2 1.0 1.9 1.0 1.0 0.00
How Well Prepared After Training* (among those who attended)
Very well 39.4 23.3 22.8 60.6 53.0 0.00 Adequate 39.7 53.4 43.6 23.4 37.0 Somewhat or not at all 20.9 23.3 33.7 16.0 10.0
Follow-Up Training Reported on Fall Survey Training Available as of Fall Survey* 75.8 96.3 41.7 64.8 99.1 0.00
Participated in Follow-Up Training* 70.1 96.2 30.6 55.8 98.2 0.00
Sample Size 454 113 115 111 115
Follow-Up Training Reported on Spring Survey Training Available as of Spring Survey* 93.6 97.3 93.4 84.0 99.1 0.04
Participated in Follow-Up Training* 89.9 95.5 90.5 74.3 99.0 0.00
Number of Days Attended Follow-Up Training* (among those who attended) 1.5 2.6 0.6 0.4 2.1 0.00
Sample Size 432 112 106 107 107
Total Training Attended Any Training* 99.6 100.0 100.0 98.1 100.0 0.00
Total Days Attended* (among those who attended) 2.2 3.1 2.0 1.1 2.6 0.00
Sample Size 454 113 115 111 115
Source: Author calculations using data from the fall and spring teacher surveys, and study records on training attendance for cohort-one and cohort-two teachers. The sample excludes one Math Expressions school (with 3 classrooms) that participated during part of the 2006–2007 school year and then stopped using the curriculum and did not allow the study to collect follow-up data.
Notes: Initial training was conducted by the publishers in the summer. Follow-up training was conducted during the school year. Fall information reflects follow-up training that occurred by October or early November; spring information reflects all follow-up up training during the year up to the time of the spring survey.
*Statistically significant at the 5 percent level. The statistical tests were conducted using two-level HLMs, and HLMs that are appropriate for binary and categorical variables were used accordingly. A single p-value is reported for multinomial variables and indicates whether the fraction of teachers in each category of the variable differs across the curriculum groups.

37
TABLE II.5
SECOND-GRADE TEACHER TRAINING ON THE ASSIGNED CURRICULUM (Percentages Unless Stated Otherwise)
Teachers by Curriculum
All Teachers Investigations
Math Expressions Saxon SFAW p-value
Initial Training Attended Training* 89.8 91.1 97.2 90.2 80.3 0.05
Publisher-Specified Training Length 1-2 days 1 day 2 days 1 day 1 day
Number of Days Attended* (among those who attended) 1.2 1.0 1.9 1.0 1.0 0.00
How Well Prepared After Training* (among those who attended)
Very well 29.7 18.8 15.2 38.4 49.1 0.00 Adequate 43.7 58.0 28.8 45.2 41.8 Somewhat or not at all 26.6 23.2 56.1 16.4 9.1
Follow-Up Training Reported on Fall Survey Training Available as of Fall Survey* 77.3 98.7 41.4 71.3 95.8 0.00
Participated in Follow-Up Training* 71.2 97.4 31.9 65.4 90.0 0.00
Sample Size 320 80 76 90 74
Follow-Up Training Reported on Spring Survey Training Available as of Spring Survey* 89.5 98.7 89.0 75.3 96.7 0.01
Participated in Follow-Up Training* 84.2 97.4 82.4 66.7 91.9 0.00
Number of Days Attended Follow-Up Training* (among those who attended) 1.4 2.3 0.5 0.4 2.0 0.00
Sample Size 296 77 75 82 62
Total Training Attended Any Training* 99.0 100.0 100.0 97.6 98.6 0.00
Total Days Attended* (among those who attended) 2.0 2.8 1.9 1.1 2.3 0.00
Sample Size 320 80 77 90 74
Source: Author calculations using data from the fall and spring teacher surveys and study records on training attendance for cohort-two teachers.
Notes: Initial training was conducted by the publishers in the summer. Follow-up training was conducted during the school year. Fall information reflects follow-up training that occurred by October or early November; spring information reflects all follow-up training during the year up to the time of the spring survey.
*Statistically significant at the 5 percent level. The statistical tests were conducted using two-level HLMs, and HLMs that are appropriate for continuous, binary, and categorical variables were used accordingly. A single p-value is reported for multinomial variables and indicates whether the fraction of teachers in each category of the variable differs across the curriculum groups.

38
2. At Least 98 Percent of Teachers Attended at Least One Training Session
Each publisher also provided follow-up training and support to teachers during the school year. Most trainers attempted to provide the first round of follow-up support within the first six weeks of school. Additional support was provided at different intervals for each curriculum.
Unlike the initial training, follow-up training was often provided one school or one teacher at a time, and the structure of the training differed across and within curricula. Each publisher provided information about this in-person support.
• Investigations. Trainers offered group follow-up sessions about every four to six weeks. Sessions were typically three to four hours long and held after school.
• Math Expressions. Trainers attempted to meet with teachers twice during the school year – once in the fall and again in the spring. Most follow-up support consisted of classroom observations followed by brief feedback sessions with teachers.
• Saxon. Trainers provided one follow-up session in the fall tailored to the needs of each district. In some schools, trainers conducted demonstration lessons, after which trainers met with teachers to debrief. In other schools, trainers observed teachers and provided them with feedback, or met with teachers in workshop settings.
• SFAW. Trainers offered group follow-up sessions about every four to six weeks. Sessions were typically three to four hours long and held after school.
Training was provided by numerous representatives from each publisher. In addition to in-
person support, trainers were available for email and phone support throughout the school year.
Two sources of data on teacher participation in follow-up training were collected. Unlike the initial training, the study team did not attend each follow-up session. Instead, each publisher received attendance forms to use at these sessions and was asked to return the completed forms to the study team within a week of each training session. The study team was aware of all follow-up sessions that required study support but may not have known about those that did not. The fall and spring teacher surveys provided an opportunity to obtain comprehensive information about follow-up training. On each survey, teachers were asked to report whether they had participated in any follow-up training to date and the number of hours spent participating in such training.
The publisher- and teacher-supplied sources of data on follow-up training are generally consistent. They show that the percentage of teachers who attended follow-up training, as well as the total amount of time spent in follow-up training, varied by curricula.46
46 Math Expressions and Saxon teachers reported more follow-up training than indicated in the study records.
This difference is not surprising because Math Expressions and Saxon trainers offered most follow-up training through individual meetings with teachers that did not require study support. In addition, publishers did not often take attendance on behalf of the study for these individual meetings.
Based on the spring survey, the percentage of first-grade teachers who attended follow-up training ranged from 74

39
(Saxon) to 99 (SFAW) percent (Table II.4). Among second-grade teachers, the percentage who attended follow-up training ranged from 67 (Saxon) to 97 (Investigations) percent (Table II.5). Among first- and second-grade teachers who attended follow-up training, the total amount of follow-up received ranged from about half a day (Saxon and Math Expressions) to about 2.5 days (Investigations).
Although not all teachers attended both the initial and follow-up trainings, nearly all teachers attended at least one training session. Among both first- and second-grade teachers, at least 98 percent in each curriculum group reported attending training at some point. Among first-grade teachers who attended at least one training session, the total days attended ranged from 1.1 days (Saxon) to 3.1 days (Investigations); among second-grade teachers total days ranged from 1.1 days (Saxon) to 2.8 days (Investigations).
The total amount of training provided to teachers appears to be at least as much as publishers proposed. Investigations proposed one day of initial training and two-hour follow-up sessions prior to the beginning of each unit, which should occur every three to six weeks. Math Expressions proposed two-days of initial training and follow-up support tailored to the needs of each school. Math Expressions trainers intended to observe all study teachers within six to eight weeks of the first day of school to assess the need for additional support. In-person follow-up support would be provided up to two times per semester, and could involve coaching, demonstration lessons, in-service workshops, or technical assistance. Saxon proposed one day of initial training and one follow-up visit per school to observe classroom instruction and provide teachers with feedback. SFAW proposed three hours of initial training. Follow-up support was proposed through a train-the-trainer model, in which SFAW trainers would provide two six-hour sessions per year to designated ‘lead teachers’ for each school or district. The ‘lead teacher’ would provide ongoing professional development to their school.
3. Other Sources of Professional Development
On the spring survey, teachers were asked to report about non-study professional development received during the school year. Twenty-eight percent of first-grade teachers and 25 percent of second-grade teachers reported receiving additional non-study professional development in math (see Table II.6). Three to four percent of first- and second-grade teachers reported attending eight hours or more of non-study professional development. Teachers participated in professional development related to math instruction, math content, performance standards, and other math-focused professional development.
C. INSTRUCTIONAL SUPPORT
As mentioned earlier, the study team did not mandate a particular level of implementation but instead sought to establish a supportive environment that could facilitate any level of implementation that publishers and districts set out to achieve. Consistent with that goal, the study team encouraged all staff identified by districts, schools, or publishers to be important for curriculum implementation to participate in training and take an active role in the implementation. Some study schools employed math specialists, such as math coaches and pull-

40
TABLE II.6
NON-STUDY TEACHER PROFESSIONAL DEVELOPMENT IN MATH DURING THE SCHOOL YEAR (Percentages)
Teachers by Curriculum
All Teachers Investigations Math
Expressions Saxon SFAW p-value
First-Grade Teachers
Participated in the Following Types of Non-Study Math PD
Math instruction 17.1 9.4 20.6 21.4 17.5 0.22 Math content 17.1 10.3 19.8 22.3 16.3 0.24 Performance standards in math education 12.0 9.3 17.0 9.9 11.8 0.38 Other math-focused PD 13.0 8.4 18.0 14.0 11.9 0.29
Participated in Any Non-Study Math PD 28.2 22.3 31.1 35.2 24.5 0.33 Participated in More Than 8 Hours of Any Non-Study Math PD 3.9 — — — — 0.54
Sample Size 432 112 106 107 107
Second-Grade Teachers Participated in the Following Types of Non-Study Math PD
Math instruction 13.3 9.5 15.3 18.2 9.7 0.51 Math content 13.0 6.8 13.9 20.8 9.7 0.12 Performance standards in math education 6.4 5.4 5.8 9.1 4.8 0.73 Other math-focused PD 9.9 9.3 12.3 9.5 8.1 0.88
Participated in Any Non-Study Math PD 25.3 16.9 26.7 32.9 24.2 0.55 Participated in More Than 8 Hours of Any Non-Study Math PD 3.4 — — — — 0.66
Sample Size 296 77 75 82 62
Source: Author tabulations using data from spring teacher surveys. The first-grade sample excludes one Math Expressions school (with 3 classrooms) that participated during part of the 2006–2007 school year and then stopped using the curriculum and did not allow the study to collect follow-up data. The first-grade data include teachers from cohorts-one and-two; the second-grade data include teachers from cohort-two.
Note: The statistical tests were conducted using two-level HLMs that are appropriate for binary variables.
— Value suppressed to protect respondent confidentiality.
41
out program teachers. Math coaches typically provided support to teachers; pullout program teachers usually work directly with students.
1. About Two-thirds of Teachers Had a Math Coach or Specialist Available
Many teachers reported having a school math coach or district specialist available to assist them in teaching math, although there were some inconsistencies in teacher reporting within individual schools. For example, 66 percent of all first-grade teachers and 60 percent of all second-grade teachers reported having a coach or specialist available to help with math instruction (see Table II.7). Within an individual school, however, some teachers occasionally reported having a coach or specialist available while other teachers reported having none. When looking at the percentage of first-grade teachers who were in a school where at least one teacher reported having a math coach or specialist available, the percentage varies by curriculum, ranging from 66 percent (Math Expressions) to 92 percent (Investigations) (not shown in Table II.7). This percentage did not vary across curriculum among second-grade teachers, and 88 percent of second-grade teachers were in a school where at least one teacher reporting having a math coach or specialist available (not shown).
Teachers who reported having a math coach or district specialist available were also asked about the accessibility of that professional and whether that individual was knowledgeable about the school’s assigned curriculum. These two measures differed across the curriculum groups among first-grade teachers but not second-grade teachers. Among first-grade teachers who reported having a math coach or district specialist available, the percentage of teachers who reported that a math coach or district specialist was accessible sometimes or almost always ranged from 67 percent (Investigations) to 90 percent (Math Expressions) (Table II.7). The percentage of teachers who reported their math coach or district specialist was knowledgeable about the assigned curriculum ranged from 54 percent (SFAW) to 73 percent (Saxon). Among second-grade teachers who reported having a math coach or district specialist, 79 percent reported the math coach or district specialist was accessible sometimes or almost always, and 54 percent reported the math coach or district specialist was knowledgeable about the assigned curriculum.
2. Teachers Also Had Other Instructional Supports
Some teachers also had another teacher assist them with math instruction. Fifteen percent of first-grade teachers and 11 percent of second-grade teachers reported having another teacher, such as a resource or special education teacher, who routinely helped with math instruction (Table II.7). In addition, 32 percent of first-grade teachers and 28 percent of second-grade teachers reported having another adult, such as an aide, assistant, or volunteer, who routinely assisted with math instruction.
Teachers reported having collaborative instructional environments in their schools, and there were no significant differences across the curriculum groups on any of the aspects of the instructional environment. As shown in Tables II.8 and II.9, about 90 percent of teachers (92 and 89 percent in first and second grades, respectively) agreed or strongly agreed that they felt supported by other teachers to try out new ideas in teaching math and that administrators promote innovations in math education (91 and 92 in first- and second-grades, respectively). In addition, about 80 percent (79 and 81 in first and second grades, respectively) of teachers

42
TABLE II.7
INSTRUCTIONAL SUPPORT AT STUDY SCHOOLS (Percentages)
Teachers by Curriculum
All Teachers Investigations Math Expressions Saxon SFAW p-value
First-Grade Teachers Math Coach or Specialist Available 66.3 63.2 65.3 69.7 67.3 0.93 Accessibility of Math Coach/Specialist*a
Almost always 39.8 36.4 37.1 43.5 41.7 0.04 Sometimes 40.9 30.3 53.2 39.1 41.7 Rarely or not at all 13.4 — — — — Don’t know 5.9 — — — —
Math Coach or Specialist’s Knowledge About the Assigned Curriculum*a
Knowledgeable 63.2 65.2 60.7 72.9 54.2 0.02 Not knowledgeable 7.4 — — — — Don’t know 29.4 — — — —
Another Teacher Routinely Assists with Math Instructionb 15.1 15.9 7.9 19.3 17.7 0.13 Another Adult Routinely Assists with Math Instruction 32.1 27.4 36.0 26.6 38.4 0.23
Sample Size 454 113 115 111 115
Second-Grade Teachers Math Coach or Specialist Available 59.7 56.9 53.2 62.0 66.7 0.84 Accessibility of Math Coach or Specialista
Almost always 45.3 50.0 50.0 40.0 43.6 0.31 Sometimes 33.5 37.5 40.6 24.0 35.9 Rarely or not at all 13.7 — — — — Don’t know 7.5 — — — —
Math Coach or Specialist’s Knowledgea About the Assigned Curriculum
Knowledgeable 54.0 51.2 65.6 50.0 52.5 0.89 Not knowledgeable 6.7 — — — — Don’t know 39.3 — — — —
Another Teacher Routinely Assists with Math Instructionb 11.1 9.0 15.8 6.7 14.1 0.30 Another Adult Routinely Assists with Math Instruction 28.0 29.5 32.9 19.1 32.4 0.73
Sample Size 320 80 76 90 74 Source: Author calculations using fall teacher survey data. The first-grade sample excludes one Math Expressions school (with 3 classrooms)
that participated during part of the 2006–2007 school year and then stopped using the curriculum and did not allow the study to collect follow-up data. The first-grade data include teachers from cohorts one and two; the second-grade data include teachers from cohort two.
*Statistically significant at the 5 percent level. The statistical tests were conducted using two-level HLMs (see the text at the beginning of Chapter II for details), and HLMs that are appropriate for binary and categorical variables were used accordingly. A single p-value is reported for multinomial variables and indicates whether the fraction of teachers in each category of the variable differs across the curriculum groups. aAmong teachers who indicated a math coach or district specialist was available to assist in teaching math. bOther teachers include pullout program teachers such as resource, special education, and English language learner teachers.
— Value suppressed to protect respondent confidentiality.

43
TABLE II.8
INSTRUCTIONAL CLIMATE AT FIRST-GRADE STUDY SCHOOLS (Percentages)
Teachers by Curriculum
All
Teachers Investigations Math
Expressions Saxon SFAW p-value
Teachers Agree or Strongly Agree with the Following Statements Regarding Conditions for Teaching Math in Their School:
Supported by other teachers to try out new ideas in teaching math 91.7 90.7 98.2 89.5 88.1 0.08 Administrators promote innovations in math education 91.0 92.7 94.6 86.7 89.9 0.33 Teachers regularly share ideas about math instruction 78.7 81.7 79.3 78.1 75.7 0.82 Teachers disagree about how to teach math 10.9 14.8 13.5 8.6 6.5 0.36 Teachers regularly work with one another on math curriculum and instruction 75.3 73.4 70.3 84.8 73.4 0.06 A specialist in math education regularly works with teachers 21.6 22.2 19.8 25.0 19.6 0.94 Most curriculum changes gain little support among teachers 16.0 20.4 15.3 12.4 15.7 0.54
Most or All Teachers Within a School Interact in the Following Ways: Work together to develop curriculum
and instructional materials 60.4 53.4 68.5 67.3 52.4 0.43 Offer advice or help to each other 76.8 72.5 83.0 79.0 72.5 0.41 Share ideas on teaching 78.6 76.1 83.8 82.9 71.6 0.37 Promote new or innovative teaching practices 60.1 54.7 64.9 68.3 52.8 0.14
Sample Size 454 113 115 111 115 Source: Author calculations using fall teacher survey data for cohort-one and cohort-two teachers. The sample
excludes one Math Expressions school (with 3 classrooms) that participated during part of the 2006–2007 school year and then stopped using the curriculum and did not allow the study to collect follow-up data.
Note: The statistical tests were conducted using two-level HLMs that are appropriate for binary variables.
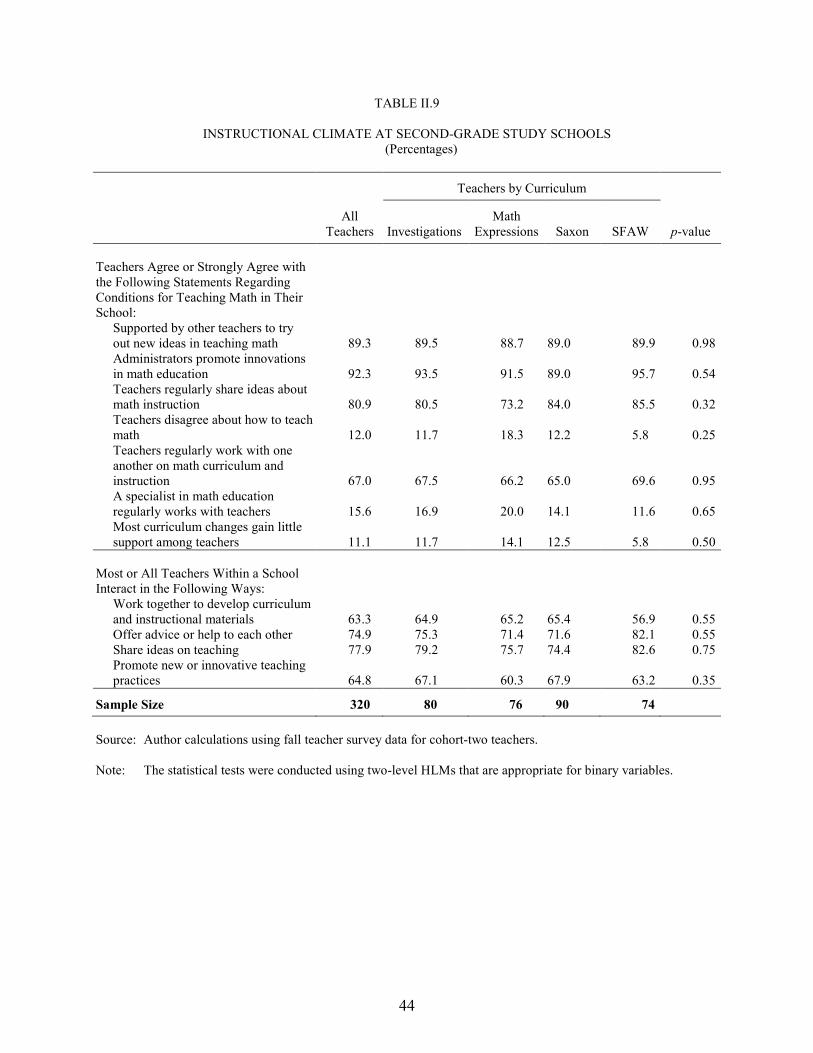
44
TABLE II.9
INSTRUCTIONAL CLIMATE AT SECOND-GRADE STUDY SCHOOLS (Percentages)
Teachers by Curriculum
All
Teachers Investigations Math
Expressions Saxon SFAW p-value Teachers Agree or Strongly Agree with the Following Statements Regarding Conditions for Teaching Math in Their School:
Supported by other teachers to try out new ideas in teaching math 89.3 89.5 88.7 89.0 89.9 0.98 Administrators promote innovations in math education 92.3 93.5 91.5 89.0 95.7 0.54 Teachers regularly share ideas about math instruction 80.9 80.5 73.2 84.0 85.5 0.32 Teachers disagree about how to teach math 12.0 11.7 18.3 12.2 5.8 0.25 Teachers regularly work with one another on math curriculum and instruction 67.0 67.5 66.2 65.0 69.6 0.95 A specialist in math education regularly works with teachers 15.6 16.9 20.0 14.1 11.6 0.65 Most curriculum changes gain little support among teachers 11.1 11.7 14.1 12.5 5.8 0.50
Most or All Teachers Within a School Interact in the Following Ways:
Work together to develop curriculum and instructional materials 63.3 64.9 65.2 65.4 56.9 0.55 Offer advice or help to each other 74.9 75.3 71.4 71.6 82.1 0.55 Share ideas on teaching 77.9 79.2 75.7 74.4 82.6 0.75 Promote new or innovative teaching practices 64.8 67.1 60.3 67.9 63.2 0.35
Sample Size 320 80 76 90 74 Source: Author calculations using fall teacher survey data for cohort-two teachers. Note: The statistical tests were conducted using two-level HLMs that are appropriate for binary variables.
45
reported that all or most teachers within their school share ideas on teaching, and about 75 percent (77 and 75 in first and second grades, respectively) reported that all or most teachers within their school offer advice or help to one another.
Teachers also reported receiving a variety of materials from the publisher of their assigned curriculum to use with their students. More than 94 percent of first- and second-grade teachers reported having each of the following materials dedicated for use with their students: teacher’s manual; student textbooks, workbooks, or worksheets; and manipulatives (Table II.10). The availability of student textbooks, workbooks, or worksheets did not vary by curriculum among second-grade teachers, but it did among first-grade teachers, ranging from 94 percent (Investigations) to 100 percent (Math Expressions). In addition, publisher-supplied supplemental student and class materials varied by curricula among both first- and second-grade teachers. Supplemental student materials were reported by a range of 22 percent (Math Expressions) to 68 percent (Investigations) of first-grade teachers and a range of 33 percent (Math Expressions) to 80 percent (Investigations) of second-grade teachers. Supplemental classroom materials were reported by a range from 66 percent (SFAW) to 87 percent (Investigations) of first-grade teachers, and a range of 50 percent (Math Expressions) to 92 percent (Saxon) of second-grade teachers.
Teachers were asked to report on the types of support they had available from the publisher. Among first-grade teachers, 90 percent reported having online support available and 18 percent reported other support was available (see Table II.10) First-grade teachers reported varying access to phone support and reference material support (through CDs, DVDs, or print materials). The percentage of teachers who reported having phone support available ranged from 71 (Investigations) to 94 (SFAW). The percentage of teachers who reported having support through reference materials ranged from 63 (Investigations) to 91 (SFAW).
Among second-grade teachers, 84 percent reported having phone support available, and 18 percent reported other support was available (Table II.10). Second-grade teachers reported varying access to online support and reference material support. The percentage of teachers who reported the availability of online support ranged from 74 (Saxon) to 94 (Investigations). The percentage of teachers who reported the availability of reference material support ranged from 60 (Math Expression) to 92 (Investigations).
D. TEACHER USE OF THE ASSIGNED CURRICULUM
In the fall and spring surveys, teachers were asked to report on their use of the assigned curriculum. The survey questions included basic curriculum use (such as, “Are you using your assigned curriculum?”) and more detailed questions about content coverage and adherence to the core features of the curriculum. The section below presents basic information on curriculum implementation; Section E presents more detailed discussion about content coverage and curriculum adherence.

46
TABLE II.10
INSTRUCTIONAL MATERIALS AND PUBLISHER SUPPORT
(Percentages)
Teachers by Curriculum
All Teachers Investigations
Math Expressions Saxon SFAW p-value
First-Grade Teachers Have Following Materials from the Assigned Curriculum Dedicated for Each Teacher
Teacher’s manual 96.1 94.5 99.1 96.2 94.4 0.34 Student textbooks, workbooks, or worksheets* 97.5 93.6 100.0 99.0 97.2 0.00 Manipulatives 97.0 94.5 99.1 98.0 96.3 0.31 Supplemental student materials* 50.0 67.9 22.2 51.9 57.4 0.00 Supplemental classroom materials* 78.2 88.6 68.3 88.0 66.3 0.00
Following Types of Support Available from Publisher
Phone support* 84.5 70.9 84.7 90.5 93.6 0.00 Online support 90.1 87.6 91.1 87.8 93.5 0.64 CD, DVD, or print reference materials* 76.8 63.0 73.1 80.0 90.5 0.00 Other 17.7 21.4 17.9 13.5 17.3 0.57
Sample Size 432 112 106 107 107
Second-Grade Teachers Have Following Materials from the Assigned Curriculum Dedicated for Each Teacher
Teacher’s manual 94.0 96.2 91.4 94.9 92.9 0.80 Student textbooks, workbooks, or worksheets 97.3 97.5 98.6 98.7 94.3 0.39 Manipulatives 94.9 97.4 88.6 97.4 95.7 0.40 Supplemental student materials* 56.0 79.5 32.8 52.2 52.4 0.00 Supplemental classroom materials* 74.8 85.9 50.0 92.4 62.3 0.00
Following Types of Support Available from Publisher
Phone support 84.1 93.4 84.1 78.6 77.5 0.39 Online support* 85.6 93.8 88.5 73.5 84.0 0.05 CD, DVD, or print reference materials* 78.9 91.8 60.4 79.4 83.7 0.02 Other 18.0 25.4 13.3 14.5 17.0 0.41
Sample Size 296 77 75 82 62
Source: Author calculations using fall teacher survey data. The first-grade sample excludes one Math Expressions school (with 3 classrooms) that participated during part of the 2006–2007 school year and then stopped using the curriculum and did not allow the study to collect follow-up data. The first-grade data include teachers from cohorts one and two; the second-grade data include teachers from cohort two.
*Statistically significant at the 5 percent level. The statistical tests were conducted using two-level HLMs that are appropriate for binary variables.
47
1. At Least 98 Percent of Teachers Reported Using Their Assigned Curriculum
In both the fall and spring surveys, all Math Expressions, Saxon, and SFAW teachers reported using their assigned curriculum as the core curriculum (see Tables II.11 through II.14). Among first-grade Investigations teachers, 99 percent reported using the curriculum in the fall and 98 percent reported using it in the spring. Among second-grade Investigations teachers, all of them reported using it in the fall and 99 percent reported using it in the spring.
2. Rates of Supplementation with Other Materials Varied in Second Grade, but Not in First Grade
Although reported usage rates of the study’s curricula were high, some teachers also reported supplementing with other materials. Among first-grade teachers, 25 percent in the fall and 35 percent in the spring reported supplementing their curriculum, and the supplementation rates did not significantly vary across the curriculum groups (see Tables II.11 and II.13). Among teachers who supplemented the curriculum, about three quarters reported supplementing frequently (77 percent supplementing at least once a week in the fall; 76 percent supplementing at least once a week in the spring). Teachers reported various and multiple reasons for supplementation, including remediation, enrichment, and supplementing units or lessons in the assigned curriculum. Most of these reasons did not significantly vary by curricula, except for remediation with a small group in the fall. Supplemental materials used by teachers varied widely; however, the largest percentage (29 percent in the fall; 31 percent in the spring) of teachers reported using teacher-created supplemental materials. Teachers also reported using an assortment of commercially available materials.
Among second-grade teachers, there were significant differences in supplementation rates in the fall but not in the spring. In the fall, the percentage of teachers who reported supplementing their curriculum with other materials ranged from 12 percent (Investigations) to 56 percent (Math Expressions) (Table II.12). Among second-grade teachers who supplemented in the fall, the frequency of supplementation varied across curricula–the percentage of teachers who reported supplementing at least once a week ranged from 77 percent (SFAW) to 100 percent (Investigations). Teachers reported various and multiple reasons for supplementation, and two of the reasons varied by curricula in the fall—remediation with a small group and in order to replace units or lessons. In the spring, 35 percent of all second-grade teachers reported supplementing their assigned curriculum, but supplementation rates, frequency of supplementation, and materials used did not significantly vary across curricula (Table II.14). Six of the seven reasons for supplementation did not significantly vary across curricula, but one reason, the ‘other’ category, varied.
A national survey of the math market indicates that, among classroom teachers, teacher-created materials are among the most commonly used supplemental materials—22 percent of teachers in the survey reported using teacher-created materials (Resnick et al. 2010). The survey also found that teachers used a wide variety of commercially available supplementary materials, including materials from supplemental products and full curricula, similar to what we observed in this study.
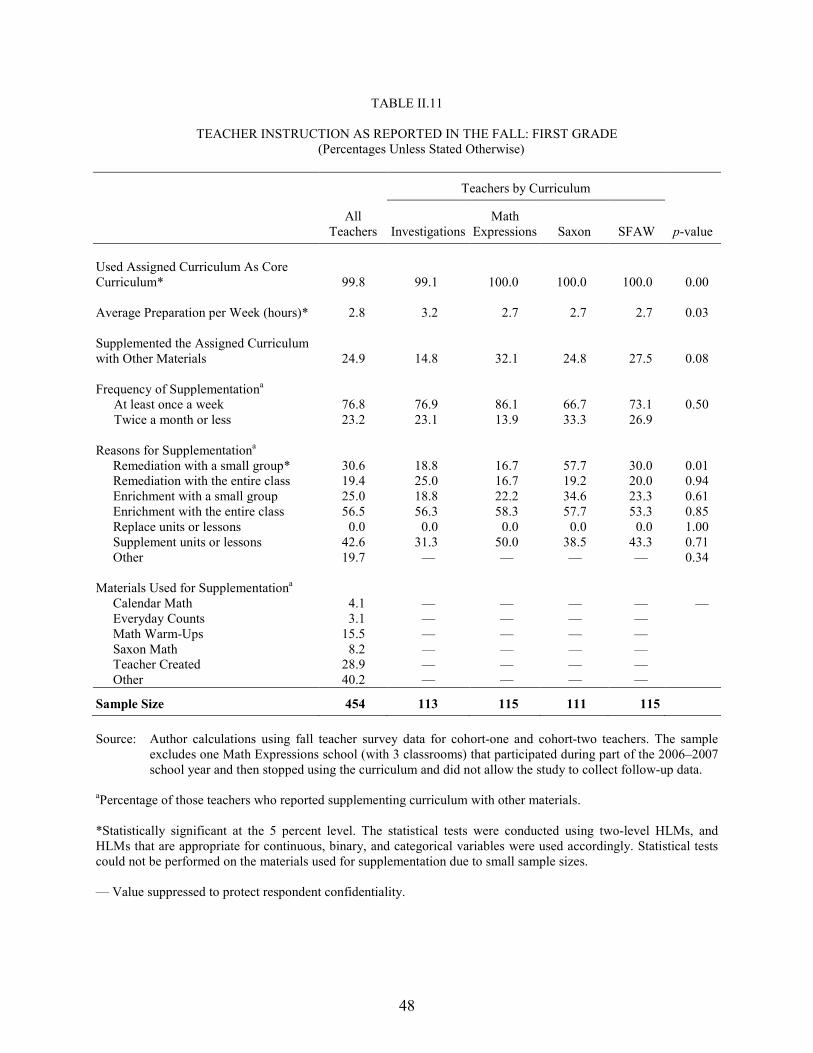
48
TABLE II.11
TEACHER INSTRUCTION AS REPORTED IN THE FALL: FIRST GRADE (Percentages Unless Stated Otherwise)
Teachers by Curriculum
All
Teachers Investigations Math
Expressions Saxon SFAW p-value
Used Assigned Curriculum As Core Curriculum* 99.8 99.1 100.0 100.0 100.0 0.00
Average Preparation per Week (hours)* 2.8 3.2 2.7 2.7 2.7 0.03
Supplemented the Assigned Curriculum with Other Materials 24.9 14.8 32.1 24.8 27.5 0.08
Frequency of Supplementationa
At least once a week 76.8 76.9 86.1 66.7 73.1 0.50 Twice a month or less 23.2 23.1 13.9 33.3 26.9
Reasons for Supplementationa
Remediation with a small group* 30.6 18.8 16.7 57.7 30.0 0.01 Remediation with the entire class 19.4 25.0 16.7 19.2 20.0 0.94 Enrichment with a small group 25.0 18.8 22.2 34.6 23.3 0.61 Enrichment with the entire class 56.5 56.3 58.3 57.7 53.3 0.85 Replace units or lessons 0.0 0.0 0.0 0.0 0.0 1.00 Supplement units or lessons 42.6 31.3 50.0 38.5 43.3 0.71 Other 19.7 — — — — 0.34
Materials Used for Supplementationa
Calendar Math 4.1 — — — — — Everyday Counts 3.1 — — — — Math Warm-Ups 15.5 — — — — Saxon Math 8.2 — — — — Teacher Created 28.9 — — — — Other 40.2 — — — —
Sample Size 454 113 115 111 115
Source: Author calculations using fall teacher survey data for cohort-one and cohort-two teachers. The sample excludes one Math Expressions school (with 3 classrooms) that participated during part of the 2006–2007 school year and then stopped using the curriculum and did not allow the study to collect follow-up data.
aPercentage of those teachers who reported supplementing curriculum with other materials.
*Statistically significant at the 5 percent level. The statistical tests were conducted using two-level HLMs, and HLMs that are appropriate for continuous, binary, and categorical variables were used accordingly. Statistical tests could not be performed on the materials used for supplementation due to small sample sizes. — Value suppressed to protect respondent confidentiality.

49
TABLE II.12
TEACHER INSTRUCTION AS REPORTED IN THE FALL: SECOND GRADE
(Percentages Unless Stated Otherwise)
Teachers by Curriculum
All
Teachers Investigations Math
Expressions Saxon SFAW p-value Used Assigned Curriculum As Core Curriculum 100.0 100.0 100.0 100.0 100.0 1.00 Average Preparation per Week (hours) 2.9 3.5 2.8 2.9 2.2 0.13 Supplemented the Assigned Curriculum with Other Materials* 30.3 11.7 55.6 30.5 24.6 0.00 Frequency of Supplementation*a
At least once a week 83.7 100.0 84.6 82.6 76.5 0.00 Twice a month or less 16.3 0.0 15.4 17.4 23.5
Reasons for Supplementationa
Remediation with a small group* 20.9 0.0 22.5 16.0 35.3 0.00 Remediation with the entire class 17.6 22.2 22.5 8.0 17.6 0.54 Enrichment with a small group 19.8 11.1 12.5 28.0 29.4 0.58 Enrichment with the entire class 48.4 11.1 50.0 68.0 35.3 0.11 Replace units or lessons* 5.5 0.0 7.5 8.0 0.0 0.00 Supplement units or lessons 40.7 22.2 47.5 40.0 35.3 0.72 Other 19.8 55.6 17.5 12.0 17.6 0.28
Materials Used for Supplementationa
Math In My World 3.4 — — — — — Math Warm-Ups 28.1 — — — — Saxon Math 7.9 — — — — Teacher Created 21.3 — — — — Other 40.8 — — — —
Sample Size 320 80 76 90 74
Source: Author calculations using fall teacher survey data for cohort-two teachers.
aPercentage of those teachers who reported supplementing curriculum with other materials.
*Statistically significant at the 5 percent level. The statistical tests were conducted using two-level HLMs, and HLMs that are appropriate for continuous, binary, and categorical variables were used accordingly. Statistical tests could not be performed on the materials used for supplementation due to small sample sizes. — Value suppressed to protect respondent confidentiality.
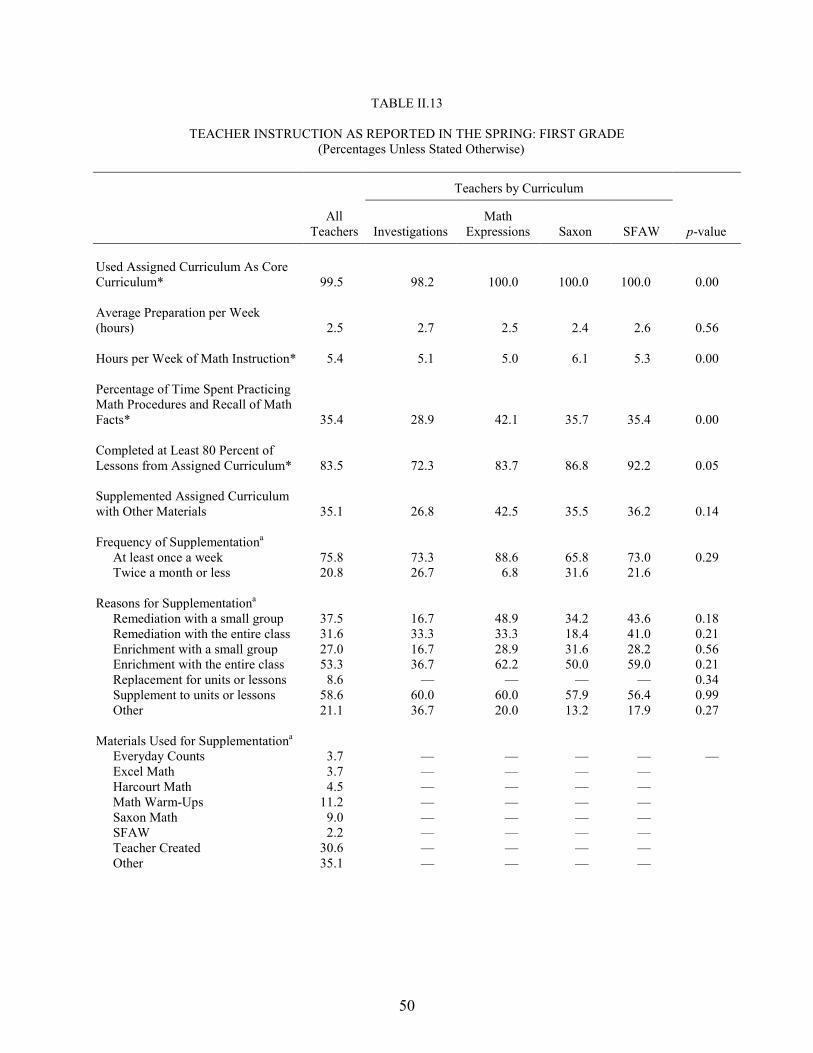
50
TABLE II.13
TEACHER INSTRUCTION AS REPORTED IN THE SPRING: FIRST GRADE (Percentages Unless Stated Otherwise)
Teachers by Curriculum
All
Teachers Investigations Math
Expressions Saxon SFAW p-value Used Assigned Curriculum As Core Curriculum* 99.5 98.2 100.0 100.0 100.0 0.00 Average Preparation per Week (hours) 2.5 2.7 2.5 2.4 2.6 0.56 Hours per Week of Math Instruction* 5.4 5.1 5.0 6.1 5.3 0.00 Percentage of Time Spent Practicing Math Procedures and Recall of Math Facts* 35.4 28.9 42.1 35.7 35.4 0.00 Completed at Least 80 Percent of Lessons from Assigned Curriculum* 83.5 72.3 83.7 86.8 92.2 0.05 Supplemented Assigned Curriculum with Other Materials 35.1 26.8 42.5 35.5 36.2 0.14 Frequency of Supplementationa
At least once a week 75.8 73.3 88.6 65.8 73.0 0.29 Twice a month or less 20.8 26.7 6.8 31.6 21.6
Reasons for Supplementationa
Remediation with a small group 37.5 16.7 48.9 34.2 43.6 0.18 Remediation with the entire class 31.6 33.3 33.3 18.4 41.0 0.21 Enrichment with a small group 27.0 16.7 28.9 31.6 28.2 0.56 Enrichment with the entire class 53.3 36.7 62.2 50.0 59.0 0.21 Replacement for units or lessons 8.6 — — — — 0.34 Supplement to units or lessons 58.6 60.0 60.0 57.9 56.4 0.99 Other 21.1 36.7 20.0 13.2 17.9 0.27
Materials Used for Supplementationa
Everyday Counts 3.7 — — — — — Excel Math 3.7 — — — — Harcourt Math 4.5 — — — — Math Warm-Ups 11.2 — — — — Saxon Math 9.0 — — — — SFAW 2.2 — — — — Teacher Created 30.6 — — — — Other 35.1 — — — —

TABLE II.13 (continued)
51
Teachers by Curriculum
All
Teachers Investigations Math
Expressions Saxon SFAW p-value Likelihood of Using Assigned Curriculum Again, If Given Choice
Very likely 37.6 25.2 27.2 56.6 41.5 0.00 Likely 31.5 27.0 30.1 23.6 45.3 Not at all likely 31.0 47.7 42.7 19.8 13.2
Sample Size 432 112 106 107 107
Source: Author calculations using spring teacher survey data for cohort-one and cohort-two teachers. The sample excludes one Math Expressions school (with 3 classrooms) that participated during part of the 2006–2007 school year and then stopped using the curriculum and did not allow the study to collect follow-up data.
aPercentage of those teachers who reported supplementing curriculum with other materials.
*Statistically significant at the 5 percent level. The statistical tests were conducted using two-level HLMs, and HLMs that are appropriate for continuous, binary, and categorical variables were used accordingly. A single p-value is reported for multinomial variables and indicates whether the fraction of teachers in each category of the variable differs across the curriculum groups. Statistical tests could not be performed on the materials used for supplementation due to small sample sizes.
— Value suppressed to protect respondent confidentiality.

52
TABLE II.14
TEACHER INSTRUCTION AS REPORTED IN THE SPRING: SECOND GRADE (Percentages Unless Stated Otherwise)
Teachers by Curriculum
All
Teachers Investigations Math
Expressions Saxon SFAW p-value Used Assigned Curriculum As Core Curriculum* 99.7 98.7 100.0 100.0 100.0 0.00 Average Preparation per Week (hours) 2.7 3.1 2.5 2.5 2.6 0.25 Hours per Week of Math Instruction* 5.9 5.4 5.5 6.9 5.5 0.00 Percentage of Time Spent Practicing Math Procedures and Recall of Math Facts 39.0 35.6 43.4 37.4 39.6 0.15 Completed at Least 80 Percent of Lessons from Assigned Curriculum 83.7 80.0 80.0 87.2 88.3 0.38 Supplemented Assigned Curriculum with Other Materials 35.4 27.3 49.3 35.0 29.0 0.27 Frequency of Supplementationa
At least once a week 71.6 75.0 75.0 75.0 55.6 0.45 Twice a month or less 22.5 15.0 22.2 14.3 44.4
Reasons for Supplementationa
Remediation with a small group 26.7 14.3 29.7 20.7 44.4 0.27 Remediation with the entire class 30.5 28.6 45.9 17.2 22.2 0.08 Enrichment with a small group 24.8 14.3 21.6 31.0 33.3 0.47 Enrichment with the entire class 46.7 23.8 59.5 48.3 44.4 0.09 Replacement for units or lessons 7.6 — — — — 0.77 Supplement to units or lessons 40.0 33.3 43.2 41.4 38.9 0.87 Other* 9.5 — — — — 0.00
Materials Used for Supplementationa
Harcourt Math 5.4 — — — — — Macmillan/McGraw-Hill 4.3 — — — — Math Warm-Ups 22.8 — — — — Saxon Math 4.3 — — — — SFAW Math 4.3 — — — — Teacher Created 12.0 — — — — Other 46.8 — — — —
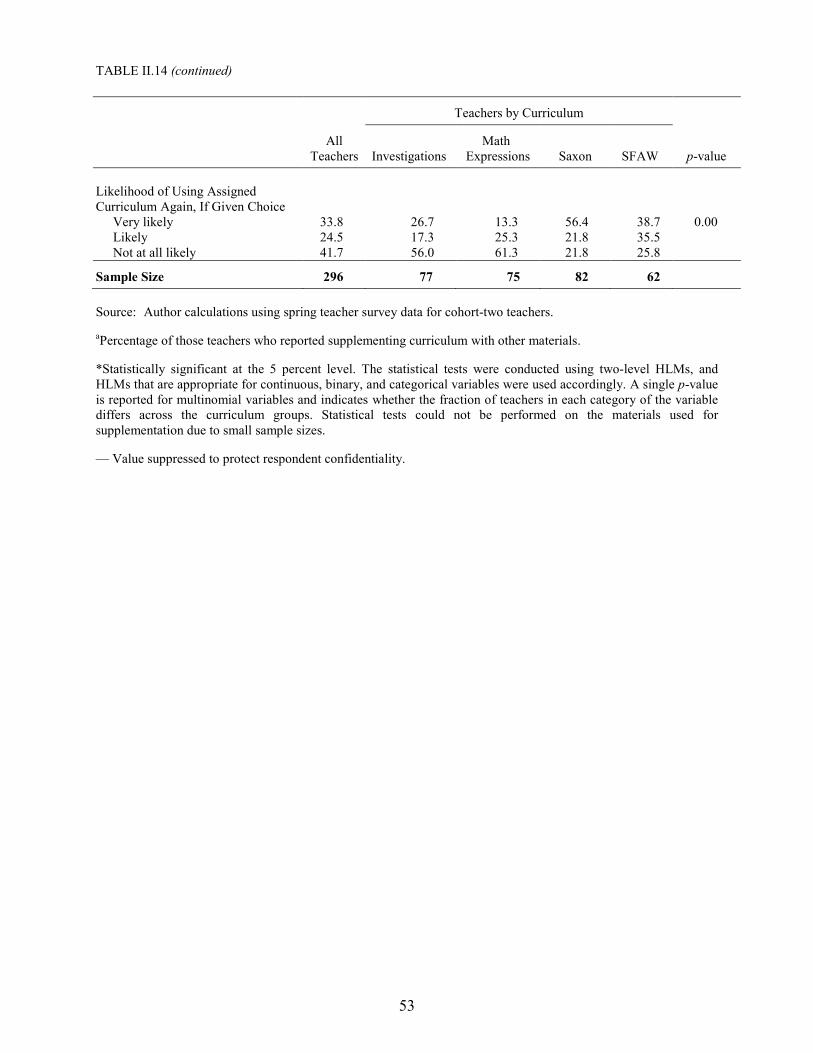
TABLE II.14 (continued)
53
Teachers by Curriculum
All
Teachers Investigations Math
Expressions Saxon SFAW p-value Likelihood of Using Assigned Curriculum Again, If Given Choice
Very likely 33.8 26.7 13.3 56.4 38.7 0.00 Likely 24.5 17.3 25.3 21.8 35.5 Not at all likely 41.7 56.0 61.3 21.8 25.8
Sample Size 296 77 75 82 62
Source: Author calculations using spring teacher survey data for cohort-two teachers.
aPercentage of those teachers who reported supplementing curriculum with other materials.
*Statistically significant at the 5 percent level. The statistical tests were conducted using two-level HLMs, and HLMs that are appropriate for continuous, binary, and categorical variables were used accordingly. A single p-value is reported for multinomial variables and indicates whether the fraction of teachers in each category of the variable differs across the curriculum groups. Statistical tests could not be performed on the materials used for supplementation due to small sample sizes.
— Value suppressed to protect respondent confidentiality.

54
3. The Fraction of Teachers Using the Expected Number of Lessons Varied Across the Curricula in First Grade, but Not in Second
In the spring survey, teachers were asked to report the percentage of lessons from the assigned curriculum used with their class. Considering that the school year lasted 10 months in each district and teachers completed the spring survey 8 months (or 80 percent) into the school year, we would expect teachers to report using at least 80 percent of the lessons if they were regularly using the curricula.
Among first-grade teachers, the percentage of teachers who reported regularly using their assigned curriculum varied across curriculum groups, and ranged from 72 percent of Investigations to 92 percent of SFAW teachers (Table II.13). Among second grade teachers, 84 percent reported using at least 80 percent of their curriculum’s lessons, and the percentage did not significantly vary across curricula (Table II.14).
4. Teachers’ Desire to Use Their Assigned Curriculum in the Future Varied
Teachers were asked to state their interest in using their assigned curriculum in the future, if they were given a choice. Expressed interest varied across the curriculum groups among both first and second grade teachers. Among first-grade teachers, the fraction that were likely or very likely to use their curriculum again, if given a choice, was highest among SFAW teachers (87 percent), followed by Saxon teachers (80 percent), followed by Math Expressions and Investigations teachers (57 and 52 percent, respectively) – the latter two were not significantly different from one another (Table II.13).47 Among second-grade teachers, the percentage of teachers who said they would be likely or very likely to use their assigned curriculum again was similar and highest among Saxon and SFAW teachers (78 and 74 percent, respectively); interest was similar and lower among Investigations and Math Expressions teachers (44 and 39 percent, respectively) (Table II.14).48
5. Saxon Teachers Reported Spending More Time on Math Instruction
In the spring survey, teachers reported the number of days per week and number of minutes per day devoted to math instruction. This information was used to construct a measure of the hours per week spent on math instruction.
Among first-grade teachers, Saxon teachers reported an average of 6.1 hours per week on math instruction compared to an average of 5.1 hours across the Investigations, Math
47 When looking at the six pair-wise comparisons that can be made between the four curriculum groups in first-grade, all comparisons were significantly different (p-values ranged from 0.00 to 0.03) except for the comparison of Investigations and Math Expressions (p-value > 0.50).
48 When looking at the six pair-wise comparisons that can be made between the four curriculum groups in second-grade, two comparisons were not significantly different: Investigations compared to Math Expressions (p-value = 0.25) and Saxon compared to SFAW (p-value = 0.25). All other comparisons were significantly different (p-values ranged from 0.00 to 0.03).
55
Expressions, and SFAW teachers (Table II.13). The instructional time reported by Saxon teachers was significantly higher than the instructional time in Investigations, Math Expressions, and SFAW (p-values = 0.01, 0.00, and 0.00, respectively, for each comparison to Saxon), and there were no significant differences in instructional time between the other three curriculum groups (p-values ranged from 0.19 to 0.95 for each comparison). Among second-grade teachers, Saxon teachers reported an average of 6.9 hours per week on math instruction compared to an average of 5.5 hours across the Investigations, Math Expressions, and SFAW teachers (Table II.14). Once again, the instructional time reported by Saxon teachers was significantly higher than the instructional time in Investigations, Math Expressions, and SFAW (p-values = 0.00 for each comparison to Saxon), and there were no significant differences in instructional time between the other three curriculum groups (p-values ranged from 0.64 to 0.99 for each comparison).
The additional time that Saxon teachers reported spending on math instruction relative to teachers in the other curriculum groups appears to be consistent with the publisher recommendations for instructional time. Saxon recommends that first-grade teachers spend 60 to 85 minutes per day on math instruction and that second-grade teachers spend 60 to 90 minutes per day (Larson and Heisserer 2008; Larson 2004). Investigations recommended 60 minutes of math instruction per day for both grades in the first edition of the program and 60 to 70 minutes per day in each grade level in the second edition (Russell et al. 2004; Wittenburg et al. 2008b; Wittenburg et al. 2008c). Math Expressions and SFAW each recommend about 60 minutes per day on math for both grade levels (Fuson 2006; Fuson 2009a; Fuson 2009b; Charles et al. 2005a; Charles et al. 2005b).49
6. The Time Spent Practicing Math Facts and Procedures Varied in First Grade, but Not in Second
The four curricula include different approaches to developing student fluency of math facts and procedures. For example, Saxon and Math Expressions both emphasize daily activities (Fact Practice in Saxon and Quick Practice in Math Expressions). Investigations also considers computational fluency a key focus in the elementary grades but imbeds computational practice within a set of daily routines that includes other focuses, such as data analysis.
In the spring survey, teachers were asked to report the percentage of time spent practicing math procedures and the recall of math facts. In the first grade, the percentage of time spent practicing math procedures and the recall of math facts ranged from 29 percent (Investigations) to 42 percent (Math Expressions) (Table II.13). In the second grade, the average teacher reported spending 39 percent of his or her time on practicing math procedures and recall of math facts (Table II.14).
49 Each publisher also provides a recommended pacing guide indicating the number of days required to
complete the curriculum. Saxon and Math Expressions each suggest that 160 days are needed to complete each grade level. SFAW suggests that 180 days are needed in each grade level. Investigations’ first edition, used by schools in the 2006–2007 school year, suggested 171 days for completion. The second edition, used by schools in the 2007–2008 school year, suggested 159 days in first grade and 165 in second grade. The change in editions will be described in further detail in the next section.
56
E. MATH CONTENT COVERAGE AND CURRICULUM ADHERENCE
Content coverage was collected through the spring teacher survey, which asked teachers to reflect back on the year and indicate the number of lessons taught in various content areas. Information about curriculum adherence was collected through the spring teacher surveys and classroom observations, and these two sources of data provide complementary information.
1. Coverage of Math Content Areas Varied Across the Curricula
The content that should be introduced to children has been a topic of discussion among educators. The National Council of Teachers of Mathematics (NCTM 2006) released Curriculum Focal Points (CFP) to offer guidance on coherent and focused mathematics instruction by grade level. However, the National Mathematics Advisory Panel (2008a, p. 21) noted that CFP calls for time devoted to some topics that do not receive emphasis in the early grades in the highest-achieving countries identified in the Trends in International Mathematics and Science Study (Ginsburg et al. 2005). Although all four curricula in this study provide information on their alignment to the NCTM standards, each curriculum approaches the introduction of content in varied ways, with some curricula (such as Investigations) using a more focused, thematic approach and others (such as Saxon) spiraling content throughout the year.
In the spring survey, teachers were asked to indicate the number of lessons they taught in each of 20 math content areas by responding to a series of questions with the following categorical answers: 0 (none; I did not teach this topic), 1 (1–5 lessons), 2 (6–10 lessons), 3 (11–15 lessons), or 4 (more than 15 lessons).50
Tables II.15 and II.16 present the mean response for each content area for all first- and second-grade teachers, respectively, and the same measure by curriculum group. A mean of 3, for example, indicates that 11 to 15 lessons were focused on that content. The items in each table are arranged from the topics most frequently taught when all the curriculum groups are pooled together, to those least frequently taught.
Teachers reported the number of lessons taught in each content area regardless of whether they used their assigned curriculum or other materials.
In both grades and across the curricula, teachers reported most frequently teaching lessons on adding and subtracting with whole numbers, addition and subtraction facts with whole numbers, word problems, and counting with whole numbers. In each of these areas, the average teacher taught 11 to 15 lessons. This is consistent with the recommendation of the National Mathematics Advisory Panel (2008b) and with CFP, which lists as the first focal point for first grade “Developing understandings of addition and subtraction and strategies for basic addition facts and related subtraction facts” and states as the second focal point for second grade “Developing quick recall of addition facts and related subtraction facts and fluency with multi-digit addition and subtraction” (NCTM 2006).
In first-grade classrooms, coverage in 15 of the 20 content areas was significantly different across the curriculum groups (Table II.15). When we look at the six pair-wise comparisons that
50 A lesson is a set of activities intended to be completed in one math class.

57
can be made between the four curricula for each of these 15 content areas, some curriculum group differences are significant and others are not. However, there is no clear pattern to which curriculum differences are significant. For example, SFAW teachers reported teaching significantly fewer lessons on counting with whole numbers than Investigations, Math Expressions, and Saxon teachers (p-values were 0.02, 0.02, and 0.00, respectively) and there were no significant differences between Investigations, Math Expressions, and Saxon teachers (p-values ranged from 0.42 to 0.99). However, on another content area (measurement with standard tools), Saxon teachers reported teaching significantly more lessons than Investigations, Math Expressions, and SFAW teachers (p-values were 0.00, 0.02, and 0.00, respectively), and there were no significant differences between Investigations, Math Expressions, and Saxon teachers (p-values ranged from 0.17 to 0.87). On a third content area (fractions), Investigations teachers reported teaching significantly fewer lessons than Math Expressions, Saxon, and SFAW teachers (p-value = 0.00 for each comparison) and there were no differences between Math Expressions, Saxon, and SFAW teachers (p-values ranged from 0.09 to 0.96).
In second-grade classrooms, coverage in 19 of the 20 content areas is significantly different across the curriculum groups (Table II.16). Once again, when we looked at the six pair-wise comparisons that can be made between the four curricula for each of these 19 content areas, some curriculum group differences were significant and others were not. There was no clear pattern to which curriculum differences are significant.
In Section D, we saw that math instructional time differs across the curricula, with Saxon teachers spending more time per week than the other groups. The differences in instructional time could affect the observed content coverage differences across the groups. Therefore, we also examined whether there were any significant curriculum group differences in content coverage when controlling for instructional time—that is, by including instructional time in the teacher-level equation of the two-level HLM used to test curriculum group differences.
Because instructional time differed across curricula, the amount of time teachers devote to math appears to be unspecified by at least some districts or schools. If math instructional time is set by the teacher, instructional time should be considered an outcome of the curriculum assignment, in which case it should not be controlled for in the analysis. However, this may not be the case in all districts or schools. Some districts or schools might specify the amount of time that can be devoted to math, independently of the curriculum assignment. If this latter situation is the case, instructional time would not be an outcome of the curriculum assignment. Therefore, as a robustness check, we also looked at results using a model that controlled for instructional time. The results are robust across the analyses that included and excluded instructional time, and the results discussed earlier (and presented in Tables II.15 and II.16) are based on the model that excludes instructional time.

58
TABLE II.15
AVERAGE NUMBER OF LESSONS IN VARIOUS MATH CONTENT AREAS: FIRST GRADE Teachers by Curriculum
Number of Lessons on:a All
Teachers Investigations Math
Expressions Saxon SFAW p-Value Adding and subtracting with whole numbers* 3.57 3.53 3.66 3.83 3.25 0.00 Addition and subtraction facts with whole numbers* 3.47 3.22 3.60 3.87 3.19 0.00 Word problems* 3.46 3.51 3.70 3.68 2.91 0.00 Counting with whole numbers* 3.41 3.44 3.53 3.72 2.94 0.00 Understanding numbers less than 10* 3.02 3.07 3.00 3.45 2.52 0.00 Creating, continuing, or predicting patterns* 2.88 2.93 2.75 3.45 2.38 0.00 Collecting or analyzing data* 2.69 2.93 2.63 2.87 2.32 0.01 Graphs* 2.67 2.41 2.76 3.15 2.34 0.00 Money* 2.52 1.46 3.08 3.30 2.30 0.00 Place value with whole numbers* 2.42 1.41 2.67 3.23 2.42 0.00 Geometric shapes or spatial relationships* 2.37 2.79 1.89 2.60 2.18 0.00 Time* 2.11 1.29 1.91 2.90 2.38 0.00 Measurement with standard tools* 1.86 1.44 1.92 2.50 1.58 0.00 Nonstandard measurement* 1.65 1.91 1.44 1.93 1.30 0.00 Fractions* 1.63 0.84 1.72 2.22 1.78 0.00 Probability 1.33 1.17 1.36 1.42 1.37 0.70 Multiplying and dividing with whole numbers 0.25 0.20 0.25 0.38 0.18 0.38 Decimals 0.17 0.15 0.23 0.21 0.07 0.20 Multiplication and division facts with whole numbers 0.13 0.11 0.14 0.18 0.08 0.73 Percents 0.10 0.09 0.16 0.10 0.06 0.43
Sample Size 428 112 106 107 103
Source: Author tabulations using data from the spring teacher surveys for cohort-one and cohort-two teachers. The sample excludes one Math Expressions school (with 3 classrooms) that participated during part of the school year and then stopped using its assigned curriculum and did not allow the study to collect follow-up data.
aPossible responses: 0 (none), 1 (1–5 lessons), 2 (6–10 lessons), 3 (11–15 lessons), and 4 (more than 15 lessons). A mean of 4 indicates that teachers covered at least 15 lessons in the content area. *Statistically significant at the 5 percent level. The statistical tests were conducted using two-level (classroom and school) HLMs. The p-values were not adjusted for the multiple outcomes (topics) tested.

59
TABLE II.16
AVERAGE NUMBER OF LESSONS IN VARIOUS MATH CONTENT AREAS: SECOND GRADE
Teachers by Curriculum
Number of Lessons on:a All
Teachers Investigations Math
Expressions Saxon SFAW p-Value Word problems* 3.47 3.53 3.60 3.72 2.90 0.00 Adding and subtracting with whole numbers* 3.45 3.55 3.51 3.62 3.02 0.01 Addition and subtraction facts with whole numbers* 3.37 3.33 3.43 3.67 2.98 0.05 Counting with whole numbers* 3.02 3.39 3.07 3.34 2.08 0.00 Money* 2.90 3.00 2.68 3.37 2.45 0.00 Time* 2.74 2.91 2.31 3.32 2.34 0.00 Place value with whole numbers* 2.68 2.68 2.64 3.08 2.23 0.00 Collecting or analyzing data* 2.66 2.61 2.51 3.11 2.29 0.00 Creating, continuing, or predicting patterns* 2.57 2.75 1.99 3.46 1.90 0.00 Graphs* 2.52 2.21 2.47 3.13 2.21 0.00 Understanding numbers less than 10* 2.39 2.91 2.15 2.86 1.47 0.00 Geometric shapes or spatial relationships* 2.32 2.70 1.80 2.80 1.85 0.00 Measurement with standard tools* 1.96 1.26 1.70 2.94 1.89 0.00 Fractions* 1.94 1.79 1.19 3.00 1.68 0.00 Nonstandard measurement* 1.49 1.16 1.32 2.04 1.40 0.00 Probability 1.46 1.32 1.31 1.83 1.35 0.08 Multiplying and dividing with whole numbers* 1.18 1.09 0.95 2.01 0.55 0.00 Multiplication and division facts with whole numbers* 1.10 0.79 0.88 2.01 0.58 0.00 Decimals* 0.83 0.45 0.75 1.73 0.29 0.00 Percents* 0.32 0.32 0.27 0.56 0.08 0.02
Sample Size 292 76 75 79 62
Source: Author tabulations using data from the spring teacher survey from cohort-two teachers.
aPossible responses: 0 (none), 1 (1–5 lessons), 2 (6–10 lessons), 3 (11–15 lessons), and 4 (more than 15 lessons). A mean of 4 indicates that teachers covered at least 15 lessons in the content area.
*Statistically significant at the 5 percent level. The statistical tests were conducted using two-level (classroom and school) HLMs. The p-values were not adjusted for the multiple outcomes (topics) tested.

60
2. Curriculum Adherence Was Measured Using Information from the Spring Surveys and Classroom Observations
All of the data discussed to this point has been collected consistently from classrooms in all four curriculum groups. However, the study also collected unique data from each curriculum group. Although the results discussed so far indicate that nearly all teachers used their assigned curriculum, the curriculum-specific data help us understand the extent to which teachers adhered to their assigned curriculum.
We sought to examine the extent to which teachers adhered to a variety of features of their assigned curriculum. Research by Stein et al. (2007) demonstrates the importance of assessing adherence. These authors reviewed a variety of student-centered and teacher-directed curricula used in the United States and found that the curricula were implemented in classrooms in ways that differed from the written curriculum.
In order to assess the extent to which teachers in this study implemented the curricula as written, the study team began by reviewing the curriculum materials in depth to identify essential features of each curriculum. The materials were also reviewed to identify the recommended frequency with which each activity or practice should be implemented as indicated in the curriculum materials. The study team used these findings to define what constitutes adherence to each curriculum, and used the spring teacher survey and classroom observations to collect information that could be used to assess adherence to each curriculum.
To understand the process used to assess adherence, we begin by briefly reviewing the four curricula and their multiple components. We then provide more details of the approach used to assess adherence. In the final section, we summarize our findings about adherence.
a. Curriculum Descriptions
As described in Chapter I, the curricula vary in the extent to which they emphasize student-centered or teacher-directed approaches, though all four curricula include at least one component of each of these two approaches. The number of components in each curriculum is extensive, which means there are many specific differences between the curricula. For example, Saxon and SFAW emphasize teacher-directed instructional approaches such as explicit instruction, but also include some student-centered activities such as peer collaboration. Investigations and Math Expressions emphasize student-centered activities such as peer collaboration, but also include, to varying degrees, some explicit instruction. All four curricula use formative assessments but in different ways and with different frequencies.51
51 For three of the four curricula, the edition used in first-grade classrooms that participated during the 2006–
2007 school year differed from the edition used in first- and second-grade classrooms that participated during the 2007–2008 school year. The first edition of Investigations was used during the 2006–2007 school year, and the second edition was used in the 2007–2008 school year. The 2005 copyright of Math Expressions was used in 2006–2007, and the 2008 copyright was used in 2007–2008. The 2005 copyright of Saxon was used in 2006–2007, and the 2008 copyright was used in 2007–2008. Information about differences between the editions can be found on the publisher or developer websites at http://investigations.terc.edu, http://www.eduplace.com/math/mthexp/, and http://saxonpublishers.hmhco.com/en/sxnm_home.htm. The curriculum descriptions provided in this report apply to both editions used in the study.

61
• Investigations (Wittenburg et al. 2008a) uses a student-centered approach encouraging metacognitive reasoning and drawing on constructivist learning theory. The lessons focus on understanding, rather than on students answering problems correctly, and build on students’ knowledge and understanding. Students are engaged in thematic units of three to eight weeks in which they first investigate and then discuss and reason about problems and strategies.
• Math Expressions (Fuson 2009a; Fuson 2009b) blends student-centered and teacher-directed approaches to mathematics. Students question and discuss mathematics but are also explicitly taught effective procedures. There is an emphasis on using multiple specified objects, drawings, and language to represent concepts and also on learning through the use of real-world situations. Students are expected to explain and justify their solutions.
• Saxon (Larson 2008) is a scripted curriculum that blends teacher-directed instruction of new material with daily distributed practice of previously learned concepts and procedures. The teacher introduces concepts or efficient strategies for solving problems. Students observe and then receive guided practice, followed by distributed practice. Students hear the correct answers and are explicitly taught procedures and strategies. Frequent monitoring of student achievement is built into the program. Daily routines are extensive and emphasize practice of number concepts and procedures and use of representations.
• SFAW (Charles et al. 2005a; Charles et al. 2005b) is a basal curriculum that combines teacher-directed instruction with a variety of differentiated materials and instructional strategies. Teachers select the materials that seem most appropriate for their students, often with the help of the publisher. The curriculum is based on a consistent daily lesson structure, which includes direct instruction, hands-on exploration, the use of questioning, and practice of new skills.
b. Approach Used to Assess Adherence
Before we summarize the approach used to measure adherence using the survey and observation data and summarize the findings from each data source, there are four caveats that are important to consider. First, the measure of adherence to each curriculum was defined by the study team after carefully reviewing the curriculum materials. The team discussed definitions with the publishers, and the publishers’ comments were considered as they developed final definitions.
Second, the data collected through the survey and observation data vary to some extent because some aspects of adherence were difficult to determine through direct questions to the teachers and others were difficult to determine through observation. As such, the two sources of adherence data complement each other.52
52 With some items, there are similarities across the two data sources. The study’s third report, described in Chapter I, plans to explore the comparability of these similar items.
62
Third, some features of the four curricula were not expected to occur on a daily basis. Because we observed each classroom only once during the school year, these nondaily activities may not have taken place on the day of the observation. For example, on the Investigations observation form, observers are asked to code whether each of many potential routine activities occurred. However, all the routine activities are not meant to be used on a daily basis (only one or two would be expected). To account for this difference between ongoing practice and one-time observation, the study team created a construct for this particular set of items to indicate whether any routine activity occurred. The adherence measure based on observations includes the construct, but not each individual routine item. Items on the observation protocol that were not expected to occur on a daily basis and that could not be combined into a daily construct were excluded from the adherence measures based on observation. The teacher survey helps to provide information on these nondaily activities since teachers were asked to reflect back across the entire school year when responding to the survey.
Fourth, because the adherence measures for the curricula include different numbers and types of features, it is not appropriate to compare adherence across the curricula. As a result, we have not conducted statistical tests for curriculum differences in adherence. However, because random assignment created four groups of similar teachers, these adherence results are useful for understanding the extent to which the average study teacher reported adhering to each of the four curricula.53
c. Measuring Adherence Using the Survey Data
In the spring survey, teachers were asked to reflect back on the school year and report how often they implemented each essential feature of their assigned curriculum. Teachers reported the frequency of implementing each feature on a six-point ordinal scale that included 0 (never), 1 (less than once a month), 2 (once or twice a month), 3 (one to two times per week), 4 (three to four times per week), and 5 (daily). Investigations and Math Expressions teachers also reported on the degree of success they had in facilitating the types of discussions called for in the respective curriculum. A four-point ordinal scale from 1 (not at all successful) to 4 (very successful) was used for those questions. Teachers only received questions relevant for their assigned curriculum.
Although daily implementation of most practices generally might be interpreted to mean stronger implementation, not all curricula encourage implementation of all activities every day, and some activities (such as some assessments) should occur less frequently. The curriculum materials are not always clear on how frequently activities or practices should be implemented, and some activities and practices depend on the strengths and needs of individual students or the class as a whole. For example, implementing an error intervention is dependent on students making errors. Activities without a clearly specified expected frequency were excluded from the adherence measure.
53 We considered the possibility of creating a weighted scale that would permit comparisons across curricula.
However, a transparent criterion could not be determined for establishing the relative weights or values of the different items in each adherence measure.
63
Using the survey data to measure adherence, we compared the teacher response to the expected frequency for each feature with a clearly defined expected frequency. We then looked across responses to the adherence questions for each teacher to determine the percentage of features that were implemented at the expected frequency. For example, if a curriculum had 10 essential features and a teacher assigned to that curriculum reported implementing 8 of them with the expected frequency, the teacher was coded as adhering to 80 percent of their curriculum’s essential features. For each curriculum, we then calculated the average percent of features that teachers implemented with the expected frequency. In general, stronger adherence would be expected when a large percentage of the essential activities are implemented with the expected frequency.
Adherence to each individual curriculum feature measured in the survey data is provided in Appendix B in Tables B.1 through B.3, B.6 through B.8, B.11 through B.12, and B.15 through B.16. In these tables, adherence is defined as the percentage of teachers who implemented each essential activity with the expected frequency.
d. Measuring Adherence Using the Observation Data
When observing classrooms, observers used a curriculum-specific form to collect information on the curriculum’s routine activities and the essential features of math instruction. In one section of the form, observers used yes or no responses to indicate if specified routine or essential features of the lesson were used.54
To help observers code curriculum adherence, they reviewed the lesson to be taught prior to entering the classroom and had a copy of it with them during the observation for reference. These steps helped to ensure that observers were prepared to make accurate assessments.
In a second section, observers considered the extent to which various features of the curricula were used during math instruction and rated each feature using a four-point ordinal scale that included 1 (not at all characteristic), 2 (minimally characteristic), 3 (strongly characteristic), and 4 (extremely characteristic). The observation protocol also included cross-curriculum items, which are described in Appendix C.
55
The approach used to assess adherence based on the observation data was similar to the approach using the survey data, except all features included in the observation adherence measures were expected to occur daily. The observation measure was limited to daily features or constructs that capture a daily activity (such as the occurrence of a routine for Investigations, as mentioned earlier), because only one observation was conducted per classroom. We compared the coded value in each observation to the expected value for each feature in the adherence measure. For example, if an activity was expected to be strongly characteristic during the math lesson and the observer rated that activity as a 3 (strongly characteristic), then the teacher was
54 On the Math Expressions adherence form, observers also indicated on a four-point scale the number of
activities completed (none, some, most, or all). On the Saxon and Investigations adherence forms, observers were also asked to indicate the number of students involved in the closing activity.
55 Information about inter-rater reliability of the adherence items on observation protocol is provided in Appendix B.

64
coded as adhering to that activity. We looked across all items to determine the percentage of daily curriculum features that were implemented with the expected value. For example, if a curriculum had 10 essential daily features and 8 of them were implemented with the expected value, the teacher was coded as adhering to 80 percent of their curriculum’s essential features. For each curriculum, we then calculated the average percentage of daily features that teachers implemented with the expected value. In general, stronger adherence would be expected when a large percentage of the essential activities are implemented with the expected value. Within each curriculum, the number and type of features are generally consistent across grades, but some features are grade specific; therefore the specific features and number of features in each grade-level adherence measure can vary. Adherence to each individual curriculum feature that was observed is provided in Appendix B in Tables B.4 through B.5, B.9 through B.10, B.13 through B.14, and B.17 through B.18.
e. Adherence Findings
There was variation in adherence within each curriculum, and this variation was evident in both the teacher survey and observation data. The two sources of data are generally consistent and show similar patterns in adherence, although the teacher-reported adherence was slightly higher than adherence in the observation data.56
One possible explanation for the difference in adherence levels in the observation and survey data is the differences in the types of items recorded in these two methods. For example, there are more items that measure adherence to features of each curriculum’s pedagogy in the observation data, and more items that measure adherence to each curriculum’s materials in the survey data. In addition, some items in the observation data measure the quality with which particular features were implemented, whereas all items in the survey data measure simply whether the features were implemented. Also, the survey data measure features expected to be implemented on both a daily and nondaily basis, whereas the observation adherence measures are limited to daily features only. This restriction in the observation data should be kept in mind when considering the adherence measures based on observation data, since some non-daily features, such as the use of formative assessments, are an essential feature of each curriculum. However, because formative assessments are not expected to occur on a daily basis, adherence to formative assessments was not measured through the observation data.
57
56 When interpreting these adherence measures, it is important to keep in mind the fact these adherence
measures were created for this evaluation by the study team. The measures have not been used in non-study classrooms, so it is unclear how teachers outside the study would adhere to each curriculum based on these measures.
57 Some essential activities in each curriculum are not expected to occur daily, but were coded in the observation data. However, when these activities were not observed, it is unclear if they were not observed because they were not part of the lesson on the day of the observation, or because a teacher did not adhere to that feature on the day of the observation. Since each classroom was observed once during the school year, the adherence measure based on observation data is restricted to activities that were expected to occur daily and therefore should have occurred on the day of the observation. More information about non-daily activities in the observation data are provided in Appendix B.
65
Based on the survey data, adherence to each curriculum’s essential features in first-grade classrooms ranged from 60 to 76 percent (see Table II.17). Adherence to Saxon’s features was at 76 percent. This was followed by SFAW at 70 percent, Investigations at 66 percent, and Math Expressions at 60 percent. In second-grade classrooms, adherence to each curriculum’s essential features ranged from 54 to 76 percent, with adherence to Saxon’s features at 76 percent, adherence to SFAW at 68 percent, Investigations at 67 percent, and Math Expressions at 54 percent. In each grade, adherence within each curriculum varied, with some teachers reporting that they implemented 50 percent or fewer of their curriculum’s features with the expected frequency and others reporting implementing 76 percent or more features with the expected frequency.
Based on the daily essential features of each curriculum measured in the observation data, adherence ranged from 48 to 63 percent of the essential features in first-grade classrooms and 47 to 65 percent in second-grade classroom (see Table II.18). Among first-grade classrooms, adherence to Saxon’s features was at 63 percent, Investigations at 56 percent, SFAW at 54 percent and Math Expressions at 48 percent. Among second-grade classrooms, adherence to Saxon’s features was at 65 percent, SFAW and Investigations were each at 53 percent, and Math Expressions was at 47 percent. Once again, there was variation within each curriculum, with some teachers implementing 50 percent or fewer of their curriculum’s features with the expected value and others implementing 76 percent or more features with the expected value.

66
TABLE II.17
TEACHER-REPORTED CURRICULUM ADHERENCE BY GRADE
Curriculum
Investigations Math Expressions Saxon SFAW
First-Grade Teachers Number of Features in Adherence Measure 15 14 12 8 Percentage of Features Implemented by Teacher with Expected Frequency
0 – 50 31.4 41.7 14.9 23.7 51 – 75 27.5 32.0 32.7 39.6 76 – 100 41.2 26.2 52.5 36.6
Average Percentage of Features Implemented by Teacher with Expected Frequency 66.3 59.9 75.5 69.6
Sample Size 102 103 101 101
Second-Grade Teachers Number of Features in Adherence Measure 15 14 12 8 Percentage of Features Implemented by Teacher with Expected Frequency
0 – 50 30.0 52.1 16.3 32.3 51 – 75 30.0 26.1 28.4 37.3 76 – 100 40.0 21.7 55.4 30.5
Average Percentage of Features Implemented by Teacher with Expected Frequency 67.0 53.9 75.9 67.8
Sample Size 70 69 74 59
Source: Author calculations using spring teacher survey data. The first-grade sample excludes one Math Expressions school (with 3 classrooms) that participated during part of the 2006–2007 school year and then stopped using the curriculum and did not allow the study to collect follow-up data. The first-grade data include teachers from cohorts one and two; the second-grade data include teachers from cohort two.

67
TABLE II.18
OBSERVED CURRICULUM ADHERENCE BY GRADE ON ESSENTIAL DAILY CURRICULUM ACTIVITIES
Curriculum
Investigations Math Expressions Saxon SFAW
First-Grade Teachers Number of Features in Adherence Measure 10 11 12 10 Percentage of Features Implemented by Teacher with Expected Value
0–50 43.8 50.7 22.0 50.5 51–75 38.2 42.2 48.4 31.7 76–100 18.0 7.2 29.7 17.8
Average Percentage of Features Implemented with Expected Value (by classroom) 56.2 47.6 63.3 54.3
Sample Size 89 83 91 101 Second-Grade Teachers
Number of Features in Adherence Measure 12 11 12 10 Percentage of Features Implemented by Teachers with Expected Value
0–50 47.0 56.5 17.6 58.2 51–75 45.5 38.7 46.0 28.4 76–100 7.6 4.8 36.5 13.4
Average Percentage of Features Implemented with Expected Value (by classroom) 52.9 46.8 65.2 53.0
Sample Size 66 62 74 67
Source: Author calculations using classroom observation data. The first-grade sample excludes one Math Expressions school (with 3 classrooms) that participated during part of the 2006–2007 school year and then stopped using the curriculum and did not allow the study to collect follow-up data. The first-grade data include teachers from cohorts one and two; the second-grade data include teachers from cohort two.

This page intentionally left blank for double-sided copying.
69
III. CURRICULUM EFFECTS ON FIRST- AND SECOND-GRADE ACHIEVEMENT
The implementation analysis in Chapter II showed that nearly all teachers reported using their assigned curriculum, nearly all teachers received training on their curriculum, and about one-third of teachers supplemented their assigned curriculum with other materials. Some aspects of implementation varied significantly across the curriculum groups, including the amount of teacher training on the assigned curriculum, math instructional time, teacher desire to use the assigned curriculum again, and coverage in many math content areas. In first-grade classrooms, percent of lessons used also varied across the curriculum groups, but not in second-grade classrooms. In terms of adherence to each curriculum’s essential features, there was variation within each curriculum. Generally speaking, adherence to Saxon’s features was on the higher end of the adherence range and adherence to Math Expressions’ features was on the lower end of the range. Investigations and SFAW fell in between.
This chapter presents the relative effects of the curricula on first- and second-grade math achievement. For both grades, both students and teachers were in their first year of study participation. For most teachers, this first year of participation represents the first time they used their assigned curriculum. As shown in Chapter II, however, some teachers had previously used their assigned curriculum. We assess the implications of this prior usage on the relative effects of the curricula on student achievement in two ways: (1) when computing results for all students, we adjust for teacher’s prior usage of the curriculum; and (2) we compute separate results for teachers that did and did not report prior usage.
Results are based on a sample of students in each classroom who were selected in the fall and tested in both the fall and spring. The goal was to administer both a fall and spring test to an average of 10 students per classroom—given the number of schools and classrooms in the study, the statistical power benefits of testing more than 10 students per classroom are minimal, though the costs would have been significant because the study used an individually administered assessment. Appendix A provides details about the process for sampling students, but the general approach was the following.
• If a school had only one first- or second-grade classroom, all students in that classroom were selected for testing.
• If a school had two classrooms at a target grade level, a random sample of about three-quarters of the students in each classroom were selected for testing.
• For a school with three or more classrooms at a target grade level, about half of the students in each classroom were randomly selected for testing.
As shown in Chapter I, Table I.3, the student sampling and testing process resulted in 4,716 first graders from 461 classrooms and 3,344 second graders from 328 classrooms—an average of about 10 students tested per classroom in both grades.

70
The relative effects of the curricula presented in this chapter reflect all differences between the curricula, including differences in teacher training, instructional strategies, content coverage, and curriculum materials. Of course, the relative effects ultimately depend on how teachers implemented their curriculum, and actual implementation reflects what publishers and teachers achieved, not some level of implementation specified by the study. Also, the relative effects of the curricula are based only on the ECLS-K math assessment. Last, because the participating sites are not a representative sample of districts and schools, the design does not support making statements about effects for districts and schools outside of the study.
A. BASELINE EQUIVALENCE
The study’s experimental design supports making causal statements about the relative effects of the curricula, provided that random assignment achieved its objective of creating curriculum groups with similar baseline characteristics. As Chapter I, Tables I.4 and I.5 showed, the study’s blocked random assignment procedure created four curriculum groups that are similar (that is, not significantly different) across several school baseline characteristics. These results were expected because (as described in Chapter I) a blocked random assignment procedure was used to allocate the curricula to schools.
Although the study team randomly assigned curricula to schools, it did not randomly assign teachers to schools or students to teachers. Nevertheless, Chapter II, Tables II.1 through II.3 show that nearly all measures of teacher demographics, education, experience, and scores on the teacher assessment administered by the study team are not significantly different across the curriculum groups, with three exceptions. Two of these characteristics with significant differences are among first-grade teachers: whether they have a second major field of study for their bachelor’s degrees (Table II.1) and prior use of their assigned curriculum at the K–3 level (Table II.3). The third is among second-grade teachers, where average age is significantly different across the curriculum groups (Table II.2). Given the number of teacher characteristics examined (a total of 48 characteristics, 24 for both first- and second-grade teachers), our 5 percent threshold for statistical significance means that about two and a half of the characteristics could be significantly different across the curriculum groups by chance. Nevertheless, as described later, the approach for calculating curriculum effects adjusts for these three teacher characteristics.
Table III.1 shows that none of the student characteristics examined are significantly different across the curriculum groups for first graders, but one characteristic of second graders is significantly different. The exception is the average age of second graders at the time of the fall test, which equals 7.7 years for Investigations and Math Expressions students and 7.6 years for Saxon and SFAW students. As above, given the number of student characteristics examined (a total of 20 characteristics, 10 for both first- and second-grade students), our 5 percent threshold for statistical significance means that one characteristic could be significantly different across the curriculum groups by chance. Nevertheless, as described later, the approach for calculating curriculum effects adjusts for student age at fall testing.
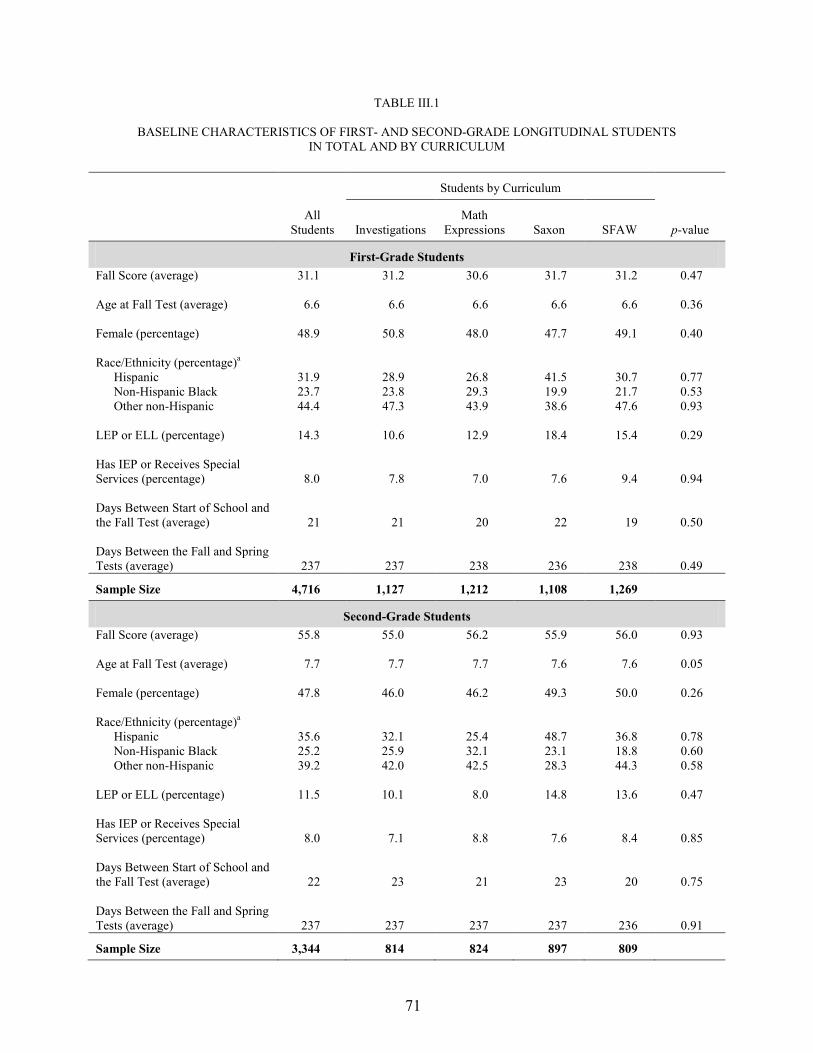
71
TABLE III.1
BASELINE CHARACTERISTICS OF FIRST- AND SECOND-GRADE LONGITUDINAL STUDENTS IN TOTAL AND BY CURRICULUM
Students by Curriculum
All Students Investigations
Math Expressions Saxon SFAW p-value
First-Grade Students Fall Score (average) 31.1 31.2 30.6 31.7 31.2 0.47 Age at Fall Test (average) 6.6 6.6 6.6 6.6 6.6 0.36 Female (percentage) 48.9 50.8 48.0 47.7 49.1 0.40 Race/Ethnicity (percentage)a
Hispanic 31.9 28.9 26.8 41.5 30.7 0.77 Non-Hispanic Black 23.7 23.8 29.3 19.9 21.7 0.53 Other non-Hispanic 44.4 47.3 43.9 38.6 47.6 0.93
LEP or ELL (percentage) 14.3 10.6 12.9 18.4 15.4 0.29 Has IEP or Receives Special Services (percentage) 8.0 7.8 7.0 7.6 9.4 0.94 Days Between Start of School and the Fall Test (average) 21 21 20 22 19 0.50 Days Between the Fall and Spring Tests (average) 237 237 238 236 238 0.49
Sample Size 4,716 1,127 1,212 1,108 1,269
Second-Grade Students Fall Score (average) 55.8 55.0 56.2 55.9 56.0 0.93 Age at Fall Test (average) 7.7 7.7 7.7 7.6 7.6 0.05 Female (percentage) 47.8 46.0 46.2 49.3 50.0 0.26 Race/Ethnicity (percentage)a
Hispanic 35.6 32.1 25.4 48.7 36.8 0.78 Non-Hispanic Black 25.2 25.9 32.1 23.1 18.8 0.60 Other non-Hispanic 39.2 42.0 42.5 28.3 44.3 0.58
LEP or ELL (percentage) 11.5 10.1 8.0 14.8 13.6 0.47 Has IEP or Receives Special Services (percentage) 8.0 7.1 8.8 7.6 8.4 0.85 Days Between Start of School and the Fall Test (average) 22 23 21 23 20 0.75 Days Between the Fall and Spring Tests (average) 237 237 237 237 236 0.91
Sample Size 3,344 814 824 897 809
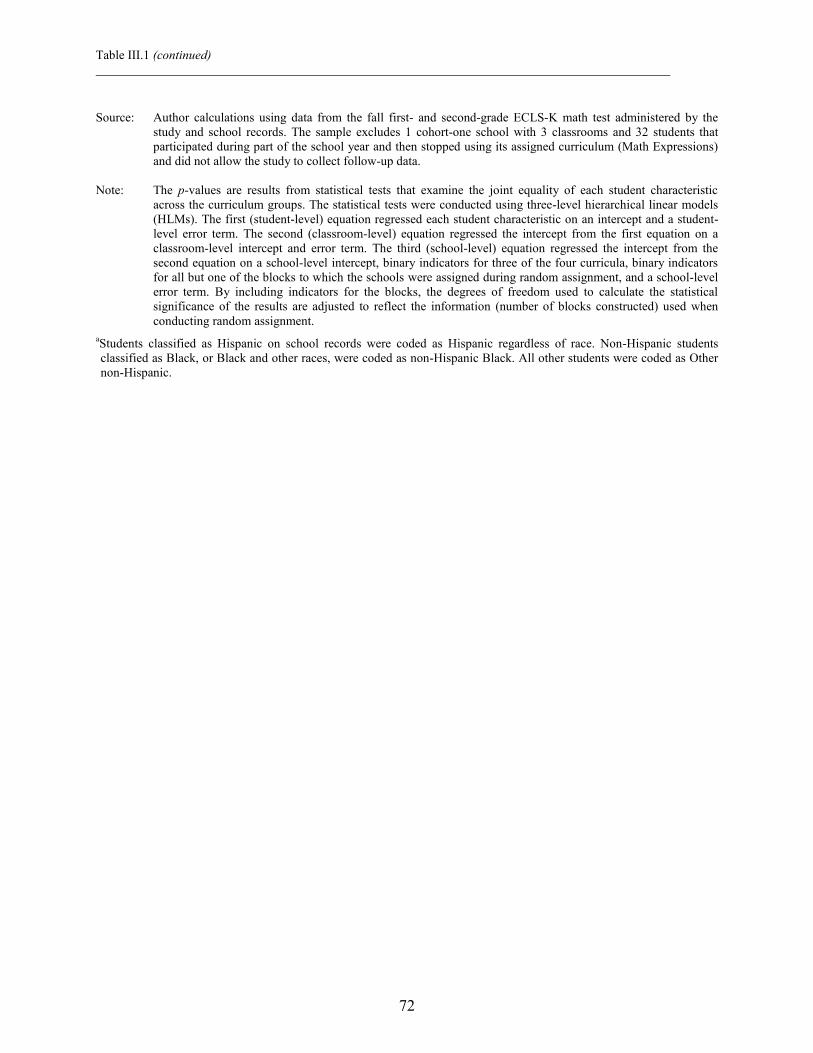
Table III.1 (continued)
72
Source: Author calculations using data from the fall first- and second-grade ECLS-K math test administered by the
study and school records. The sample excludes 1 cohort-one school with 3 classrooms and 32 students that participated during part of the school year and then stopped using its assigned curriculum (Math Expressions) and did not allow the study to collect follow-up data.
Note: The p-values are results from statistical tests that examine the joint equality of each student characteristic
across the curriculum groups. The statistical tests were conducted using three-level hierarchical linear models (HLMs). The first (student-level) equation regressed each student characteristic on an intercept and a student-level error term. The second (classroom-level) equation regressed the intercept from the first equation on a classroom-level intercept and error term. The third (school-level) equation regressed the intercept from the second equation on a school-level intercept, binary indicators for three of the four curricula, binary indicators for all but one of the blocks to which the schools were assigned during random assignment, and a school-level error term. By including indicators for the blocks, the degrees of freedom used to calculate the statistical significance of the results are adjusted to reflect the information (number of blocks constructed) used when conducting random assignment.
aStudents classified as Hispanic on school records were coded as Hispanic regardless of race. Non-Hispanic students classified as Black, or Black and other races, were coded as non-Hispanic Black. All other students were coded as Other non-Hispanic.

73
The student baseline equivalence results in Table III.1, as well as the relative curriculum effects reported in this chapter, were computed using a student-level weight that sums to the number of students in each classroom who were eligible for fall testing. This weight was also adjusted for testing nonresponse. In particular, the 83 percent of first graders and 82 percent of second graders sampled for testing in the fall and given both the fall and spring test were weighted to represent all students selected in the fall for study participation. Appendix D provides more details about the process used to create the weight.
B. METHODS USED TO CALCULATE RELATIVE CURRICULUM EFFECTS
A three-level hierarchical linear model (HLM)58
The HLM incorporates the nested structure of the data, which includes students clustered in classrooms and classrooms clustered in schools, when calculating the statistical significance of the results.
was used to calculate the relative effects of the curricula on student math achievement, as measured by the spring ECLS-K math scale scores. A separate model was estimated for first- and second-grade students.
59
To help offset the losses in precision resulting from clustering, the following baseline measures related to student achievement were included in the model:
Clustering tends to reduce the precision of the results because outcomes of students within the same classroom and within the same school are often similar.
• 8 student-level measures: Fall ECLS-K math scale score, age at fall test, number of days between the start of the school year and the fall test, number of days between the fall and spring tests, gender, race/ethnicity, whether the student is limited English proficient or is an English language learner (LEP/ELL), and whether the student has an individualized education plan (IEP) or receives special services.
• 8 classroom-level measures: Five teacher characteristics—race, education, experience, prior use of the assigned curriculum at the K–3 level, and score on the math content and pedagogical test administered before curriculum training—and three classroom characteristics that may affect student achievement—class size, variance of the fall student math score, and skewness of the score.60
58 See Raudenbush (2002) for a detailed description of the theory and use of HLM.
59 There is clustering at the school level because, if random assignment were repeated, a different set of classrooms would be assigned to the study’s curricula. There also is clustering at the classroom level because (as mentioned above) a sample of students in each classroom was tested, so a different set of students would be tested if the sampling were repeated.
60 A classroom-level measure of the variance of the fall student math score was included in the HLM to account for the heterogeneity of students in each class, and a classroom-level measure of the skewness of the score was included to account for the types of students (lower or higher achievers) that primarily comprise each class.
74
• 4 school-level measures: Curriculum assigned to the school, Title I eligibility, the percentage of students eligible for free or reduced-price meals, and the random assignment block.61
In the remainder of the chapter, we present only those results from the model that indicate the relative effects of the curricula. Appendix D presents all parameter estimates of the model, along with details about the variables included in the model and details about model estimation. That appendix also presents the simple average (that is, non-HLM-adjusted) fall and spring math achievement, and the average gain (spring minus fall score) separately by grade and curriculum group (see Table D.5).
C. RELATIVE EFFECTS OF THE CURRICULA
The graphs in Figure III.1 summarize the results based on the HLMs for first- and second-grade students. Each graph includes a symbol for each of the four curricula, where the dot in the middle of each symbol indicates the average spring math score of students in the respective curriculum groups, adjusted for the student, teacher/classroom, and school characteristics listed above. The bars that extend from each dot represent the 95 percent confidence interval around each average score. Curricula with non-overlapping confidence intervals have average scores that are significantly different at the 5 percent level, which means that there is no more than a 5 percent chance that the average scores differ by chance.
Table III.2 presents the magnitude and statistical significance for the six pair-wise curriculum comparisons at each grade level that are unique. For example, the table presents the difference in average HLM-adjusted spring achievement between Investigations and Math Expressions students but not the opposite comparison because the latter equals the same magnitude as the former, just with the opposite sign. The results are presented in effect size units, which were calculated by dividing each pair-wise curriculum comparison by the pooled standard deviation of the spring score for the two curricula being compared—Hedges’ g formula (with the correction for small-sample bias) was used to calculate the effect sizes.
The statistical significance or p-value for each result was calculated in two different ways. The first approach does not adjust for the six unique pair-wise curriculum comparisons that can be made. The second approach uses the Tukey-Kramer method to adjust for the comparisons made (Tukey 1952, 1953; Kramer 1956).62
Only results with p-values less than or equal to 0.05, or a 5 percent level, are considered statistically significant.
61 Including the random assignment blocks adjusts the degrees of freedom used to calculate the statistical
significance of the results for the information (number of blocks constructed) used when conducting random assignment.
62 There is a large literature that considers the issue of multiple comparison adjustments, but, to our knowledge, there is no consensus about whether statistical tests should or should not be adjusted (see, for example, Saville 1990 and Westfall et al. 1999). For this reason, both sets of results are summarized below.

75
FIGURE III.1
AVERAGE HLM-ADJUSTED SPRING STUDENT MATH SCORE WITH CONFIDENCE INTERVALS, BY CURRICULUM
First-Grade Students
Second-Grade Students
68
69
70
71
72
73
74
Investigations Math Expressions Saxon SFAW
Scal
e Sc
ore
Curriculum
42.5
43.5
44.5
45.5
46.5
Investigations Math Expressions Saxon SFAW
Scal
e Sc
ore
Curriculum
Note: The dots in each symbol represent the average HLM-adjusted spring math score for each
curriculum, and the bars that extend from each dot represent the 95 percent confidence interval around each average. Curricula with nonoverlapping confidence intervals have significantly different average scores at the 5 percent level. Chapter I, Table I.3 provides the school, classroom, and student sample sizes that are the basis for these results.
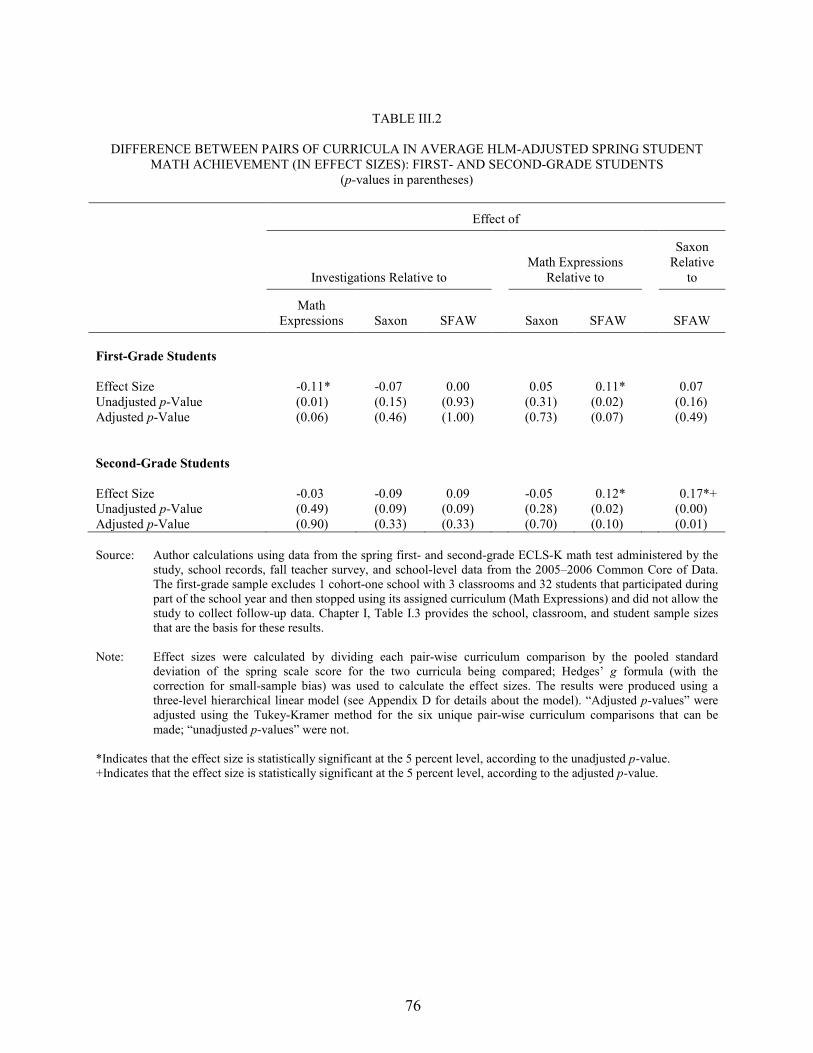
76
TABLE III.2
DIFFERENCE BETWEEN PAIRS OF CURRICULA IN AVERAGE HLM-ADJUSTED SPRING STUDENT
MATH ACHIEVEMENT (IN EFFECT SIZES): FIRST- AND SECOND-GRADE STUDENTS (p-values in parentheses)
Effect of
Investigations Relative to Math Expressions
Relative to
Saxon Relative
to
Math Expressions Saxon SFAW Saxon SFAW SFAW
First-Grade Students
Effect Size -0.11* -0.07 0.00 0.05 0.11* 0.07 Unadjusted p-Value (0.01) (0.15) (0.93) (0.31) (0.02) (0.16) Adjusted p-Value (0.06) (0.46) (1.00) (0.73) (0.07) (0.49) Second-Grade Students Effect Size -0.03 -0.09 0.09 -0.05 0.12* 0.17*+ Unadjusted p-Value (0.49) (0.09) (0.09) (0.28) (0.02) (0.00) Adjusted p-Value (0.90) (0.33) (0.33) (0.70) (0.10) (0.01) Source: Author calculations using data from the spring first- and second-grade ECLS-K math test administered by the
study, school records, fall teacher survey, and school-level data from the 2005–2006 Common Core of Data. The first-grade sample excludes 1 cohort-one school with 3 classrooms and 32 students that participated during part of the school year and then stopped using its assigned curriculum (Math Expressions) and did not allow the study to collect follow-up data. Chapter I, Table I.3 provides the school, classroom, and student sample sizes that are the basis for these results.
Note: Effect sizes were calculated by dividing each pair-wise curriculum comparison by the pooled standard
deviation of the spring scale score for the two curricula being compared; Hedges’ g formula (with the correction for small-sample bias) was used to calculate the effect sizes. The results were produced using a three-level hierarchical linear model (see Appendix D for details about the model). “Adjusted p-values” were adjusted using the Tukey-Kramer method for the six unique pair-wise curriculum comparisons that can be made; “unadjusted p-values” were not.
*Indicates that the effect size is statistically significant at the 5 percent level, according to the unadjusted p-value. +Indicates that the effect size is statistically significant at the 5 percent level, according to the adjusted p-value.

77
1. In Both the First and Second Grades, the Math Curriculum Used by the Study Schools Mattered
Based on the unadjusted statistical tests, two of the curriculum differentials are statistically significant in both the first and second grades. At the first-grade level, average math achievement of Math Expressions students was 0.11 standard deviations higher than achievement of both Investigations and SFAW students. For a first grader at the 50th percentile in math achievement, these results mean that the student’s percentile rank would be 4 points higher if the school used Math Expressions instead of Investigations or SFAW.63
At the second-grade level, average math achievement of Math Expressions and Saxon students was 0.12 and 0.17 standard deviations higher than that of SFAW students, respectively. For a second grader at the 50th percentile in math achievement, these results mean that the student’s percentile rank would be 5 and 7 points higher if the school used Math Expressions or Saxon, respectively, instead of SFAW. None of the other curriculum differentials are statistically significant.
None of the other curriculum differentials are statistically significant.
Based on the statistical tests that have been adjusted for the six unique pair-wise curriculum comparisons, only the Saxon-SFAW differential of 0.17 standard deviations for second graders is statistically significant. None of the other curriculum differentials in both the first and second grades are statistically significant when the multiple curriculum comparison adjustment is made.64
Our review of previous research on early elementary-school math curricula identified only one other study that compared two of the curricula—Saxon and SFAW—included in this study, and the findings of that prior study are, generally speaking, the opposite of our Saxon versus SFAW finding.
65
63 Translating standard deviations to percentile ranks required the assumption of a normal distribution.
Bhatt and Koedel (2009) used a nonexperimental design to evaluate the relative effects of three curricula, two of which were Saxon and SFAW. They found that math achievement of Saxon students was 0.09 standard deviations lower than SFAW students compared to our finding that achievement of Saxon students was 0.17 standard deviations higher
64 Relative curriculum effects were also examined for a cross-sectional sample of students who were in a study school during spring testing—this sample includes all students examined in the analysis above (that is, students that were tested in both the fall and spring) plus students that were only tested in the spring because they enrolled in a study school after fall testing. Results based on this sample help us understand the effects of the curricula along a measure (achievement of all students in the spring) often used to judge school performance, such as Title I Adequate Yearly Progress. Results based on the cross-sectional sample are reported in Appendix D, Table D.9, and lead to the same main conclusion as the one based on the longitudinal sample—that is, in both the first and second grade, the math curriculum used by the study schools mattered.
65 Although we could not identify any previous studies that examined the effectiveness of Math Expressions, other studies have examined the effectiveness of Investigations, Saxon, and SFAW—see the What Works Clearinghouse (WWC) reviews for the Elementary School Math topic area at the website http://ies.ed.gov/ncee/wwc/. However, as the WWC reviews show, the other studies that examined the latter three curricula are based on a design that does not meet evidence standards or made curriculum comparisons that differ from the ones made in this study.
78
than SFAW students in the second grade. What accounts for the difference in results between the Bhatt and Koedel study and this one is an open question.66
2. Curriculum Differentials Exist in About Three-Quarters of the Subgroups Examined
Examining relative effects for subgroups of students could provide useful information for helping district and school administrators understand how the study’s curricula would perform in their own settings. For example, although the study team’s goal was to recruit schools with students struggling in math, participating schools contained a range of math achievement scores, albeit all on the lower end of achievement. This variation makes it possible to examine relative curriculum effects for schools with different levels of student math achievement, which may be useful for educators who work in different school settings.
We examined whether relative curriculum effects differ among subgroups of students defined using baseline measures of two school characteristics and four teacher characteristics. The school characteristics were used to create five subgroups that include students in schools with different math achievement (two subgroups), and different poverty status (two subgroups); the teacher characteristics were used to create eight subgroups that include students in classrooms led by teachers with different levels of education (two subgroups), experience (two subgroups), and math content and pedagogical knowledge (two subgroups), and teachers who did and did not have prior experience with their assigned curriculum (two subgroups).67
We also examined curriculum differentials in each district, but only those differentials where the two curricula being compared were each assigned at least two schools. For example, for the first-grade results in District 2, we do not examine the three curriculum differentials that include Math Expressions because only one school used Math Expressions in that district (see Appendix A, Figure A.1). As another example, for Districts 4, 5, and 9, we do not examine any of the six curriculum comparisons for both the first- and second-grade results because only one school was assigned to each of the study’s curricula (see Appendix A, Figures A.1 and A.2). For any curriculum differential that had only one school assigned to at least one of the two curricula being compared, we cannot separate the relative curriculum effects from the relative school effects.
66 Possible explanations include, but are not limited to, differences in study design (Bhatt and Koedel’s study is
based on a nonexperimental design that used falsification tests to assess whether their results are biased, whereas this study is based on a randomized controlled trial), sites studied (Bhatt and Koedel examined all school districts in the state of Indiana, whereas this study is based on 12 districts spread across 10 different states), grades studied (Bhatt and Koedel focused on third graders, whereas this study examined first and second graders), outcome measures (Bhatt and Koedel used school-level scores on the Indiana state test, whereas this study used student-level scores on the ECLS-K), and versions of the curricula examined (Bhatt and Koedel examined earlier versions of Saxon and SFAW, whereas this study examined more recent editions of both curricula).
67 As described above, our approach for calculating the relative effects for all students adjusts for teacher prior use of the assigned curriculum because, as shown in Chapter II, Table II.3, there are statistically significant curriculum-group differences in prior use among first-grade teachers. We examine the sensitivity of our model-based approach for adjusting for these baseline differences by also calculating relative effects separately for students whose teachers did and did not report prior experience with the assigned curriculum.

79
Subgroup effects were calculated by estimating a separate HLM for each subgroup. The model builds on the one already described for calculating results for all students, adding to that model interactions between the curriculum indicators and the subgroups. For example, to examine the relative effects of the curricula in schools with different levels of math achievement in the fall, we added variables to the HLM that interact the curriculum indicators with indicators for students in schools with average fall math scores in the lowest, middle, and highest third of the study’s school-level score distribution. Appendix D provides more details about our approach for calculating subgroup effects, and presents sample sizes for each subgroup and the minimum detectable effect size for each subgroup.
Tables III.3 and III.4 report the relative curriculum effects for the first- and second-grade subgroups, respectively. We calculated the statistical significance of each result in two different ways. The first approach does not adjust for the number of curriculum comparisons made within and across subgroups. In particular, the p-values were not adjusted for the 124 curriculum comparisons presented in Table III.3 or the 105 curriculum comparisons presented in Table III.4. The second set of p-values were adjusted for the number of curriculum comparisons that can be made among subgroups defined by each characteristic, but not for the number made in other subgroups. For example, the p-values for the school fall achievement results were adjusted for the 18 curriculum comparisons that can be made across those subgroups (that is, 6 curriculum comparisons were made in each of the 3 fall achievement subgroups). Appendix D presents the unadjusted and adjusted p-values for each effect size in the tables. Because the study was not designed to have sufficient statistical power for the subgroup analyses, these results are best viewed as exploratory analyses that could raise policy-relevant questions that could be examined by other studies designed to have sufficient statistical power to address the questions.
Table III.5 summarizes the results in Tables III.3 and III.4 by presenting the number of curriculum differentials that are statistically significant in each subgroup for each grade based on the unadjusted statistical tests. Table III.6, which is discussed later, presents the same information based on the adjusted statistical tests.
Subgroups with Statistically Significant Curriculum Differentials. Based on the unadjusted statistical tests, 11 of the 13 nondistrict subgroups have at least one curriculum differential that is statistically significant in at least one grade. The 2 nondistrict subgroups that do not have any statistically significant curriculum differentials in either grade include students in schools with 40 percent or less free/reduced-price meals eligibility, and students taught by teachers who scored in the lowest quintile on the math content and pedagogical knowledge assessment.
When we consider results for the four cohort-one districts, which implemented the curricula only in the first grade (Districts 2, 7, 8, and 11), three of them have at least one statistically significant curriculum differential. Although District 2 does not have any significant curriculum differentials, three of the differentials in that district cannot be examined because one curriculum was implemented in only one school.

80
TABLE III.3
FIRST GRADERS: DIFFERENCE BETWEEN PAIRS OF CURRICULA IN AVERAGE HLM-ADJUSTED SPRING MATH ACHIEVEMENT, BY SUBGROUPS AND IN EFFECT SIZES
Effect of
Investigations Relative to Math Expressions
Relative to
Saxon Relative
to
Math Expressions Saxon SFAW Saxon SFAW SFAW
School Fall Achievement Lowest third -0.11 -0.28*+ 0.11 -0.16 0.22* 0.39*+ Middle third -0.02 0.07 -0.02 0.09 0.00 -0.09 Highest third -0.19* -0.05 -0.02 0.15 0.17* 0.02
School Free/Reduced-Price Meals Eligibility Up to 40% eligibility -0.16 -0.10 -0.04 0.07 0.13 0.06 Greater than 40% eligibility -0.08 -0.08 0.02 0.01 0.10 0.10
Teacher Education Less than master’s degree -0.02 0.01 0.03 0.03 0.05 0.02 Master’s degree or more -0.18*+ -0.14* -0.02 0.05 0.16* 0.13
Teacher Experience Up to 5 years -0.13 -0.03 0.00 0.11 0.13 0.03 More than 5 years -0.10 -0.09 0.01 0.02 0.11* 0.10
Teacher Math Content/Pedagogical Knowledge First (lowest) quintile -0.05 -0.02 0.06 0.04 0.11 0.08 2nd through 5th quintiles -0.11* -0.08 -0.01 0.04 0.10* 0.07
Teacher Previously Used Assigned Curriculum No prior use -0.11* -0.06 0.03 0.06 0.14* 0.09 Previously used at K–3 level 0.09 -0.18 -0.12 -0.27 -0.21 0.05
Participating Districts District 1 0.03 0.15 0.13 0.12 0.10 -0.02 District 2 — -0.04 0.03 — — 0.08 District 3 -0.18 -0.14 -0.01 0.05 0.18 0.13 District 4 — — — — — — District 5 — — — — — — District 6 0.06 0.22* 0.19 0.15 0.13 -0.02 District 7 -0.47* -0.72*+ -0.26 -0.20 0.21 0.44* District 8 -0.23 -0.22 0.04 0.03 0.27* 0.26 District 9 — — — — — — District 10 0.11 -0.01 0.02 -0.13 -0.09 0.03 District 11 -0.45*+ -0.43*+ -0.15 0.05 0.30* 0.27* District 12 -0.03 — — — — — Source: Author calculations using data from the first-grade ECLS-K math tests administered by the study team,
school record, fall teacher survey, and school-level data from the 2005–2006 Common Core of Data. The sample excludes 1 cohort-one school with 3 classrooms and 32 students that participated during part of the school year and then stopped using its assigned curriculum (Math Expressions) and did not allow the study to collect follow-up data. Appendix D, Table D.10 provides the school, classroom, and student sample sizes that are the basis for these results.
Table III.3 (continued)
81
Note: The results were produced using a three-level hierarchical linear model (see Appendix D for details about the model). Effect sizes were calculated by dividing each pair-wise curriculum comparison by the pooled standard deviation of the spring scale score for the two curricula being compared; Hedges’ g formula (with the correction for small-sample bias) was used to calculate the effect sizes. Appendix D presents the unadjusted and adjusted p-values for each effect size.
— Indicates that the curriculum differential is not examined because at least one curriculum had only one school. *Indicates that the effect size is statistically significant at the 5 percent level, according to the unadjusted p-value. +Indicates that the effect size is statistically significant at the 5 percent level, according to the adjusted p-value.

82
TABLE III.4
SECOND GRADERS: DIFFERENCE BETWEEN PAIRS OF CURRICULA IN AVERAGE HLM-ADJUSTED SPRING MATH ACHIEVEMENT, BY SUBGROUPS AND IN EFFECT SIZES
Effect of
Investigations Relative to Math Expressions
Relative to
Saxon Relative
to
Math Expressions Saxon SFAW Saxon SFAW SFAW
School Fall Achievement Lowest third -0.05 -0.01 -0.04 0.04 0.02 -0.03 Middle third -0.06 -0.08 0.17 -0.03 0.23* 0.26* Highest third -0.05 -0.15 0.11 -0.09 0.16 0.25*
School Free/Reduced-Price Meals Eligibility Up to 40% eligibility -0.17 -0.15 -0.05 0.02 0.12 0.10 Greater than 40% eligibility -0.03 -0.14* 0.09 -0.11 0.12 0.23*+
Teacher Education Less than master’s degree -0.03 -0.06 0.14* -0.02 0.17* 0.20*+ Master’s degree or more -0.07 -0.17* -0.04 -0.09 0.04 0.13
Teacher Experience Up to 5 years -0.06 0.00 0.17 0.06 0.22* 0.16 More than 5 years -0.05 -0.13* 0.04 -0.08 0.08 0.17*
Teacher Math Content/Pedagogical Knowledge First (lowest) quintile 0.03 -0.05 0.07 -0.09 0.04 0.13 2nd through 5th quintiles -0.06 -0.11 0.07 -0.04 0.13* 0.17*
Teacher Previously Used Assigned Curriculum No prior use -0.05 -0.10 0.06 -0.05 0.11 0.16* Previously used at K–3 level -0.36 -0.22 0.01 0.14 0.37 0.23*
Participating Districts District 1 -0.09 0.04 0.23 0.13 0.31* 0.18 District 3 -0.05 -0.41*+ -0.04 -0.35* 0.01 0.37* District 4 — — — — — — District 5 — — — — — — District 6 -0.12 0.05 0.39*+ 0.16 0.50*+ 0.34*+ District 9 — — — — — — District 10 -0.04 0.05 -0.08 0.09 -0.04 -0.13 District 12 0.12 -0.01 — -0.12 — — Source: Author tabulations using data from the second-grade ECLS-K math tests administered by the study
teams, school record, fall 2006 teacher survey, and school-level data from the 2005–2006 Common Core of Data. Appendix D, Table D.11 provides the school, classroom, and student sample sizes that are the basis for these results.
Note: The results were produced using a three-level hierarchical linear model (see Appendix D for details
about the model). Effect sizes were calculated by dividing each pair-wise curriculum comparison by the pooled standard deviation of the spring scale score for the two curricula being compared; Hedges’ g formula (with the correction for small-sample bias) was used to calculate the effect sizes. Appendix D presents the unadjusted and adjusted p-values for each effect size.

Table III.4 (continued)
83
— Indicates that the curriculum differential is not examined because at least one curriculum had only one school. *Indicates that the effect size is statistically significant at the 5 percent level, according to the unadjusted p-value. +Indicates that the effect size is statistically significant at the 5 percent level, according to the adjusted p-value.
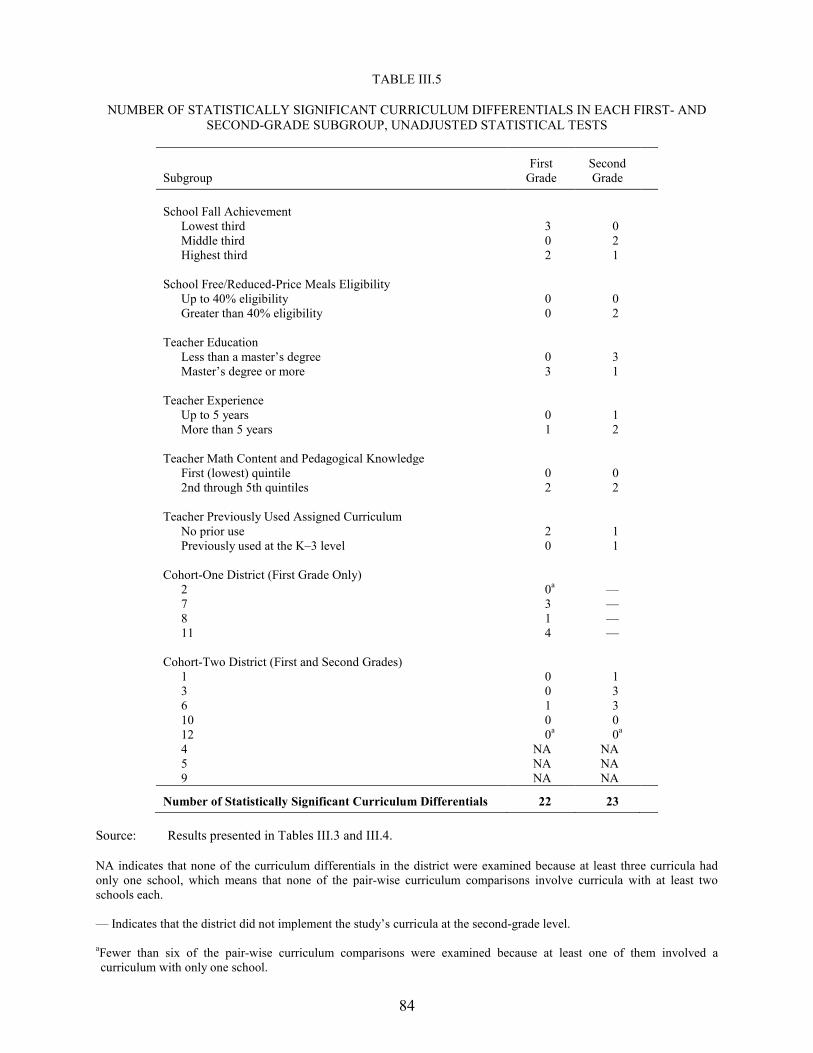
84
TABLE III.5
NUMBER OF STATISTICALLY SIGNIFICANT CURRICULUM DIFFERENTIALS IN EACH FIRST- AND SECOND-GRADE SUBGROUP, UNADJUSTED STATISTICAL TESTS
Subgroup First
Grade Second Grade
School Fall Achievement
Lowest third 3 0 Middle third 0 2 Highest third 2 1
School Free/Reduced-Price Meals Eligibility
Up to 40% eligibility 0 0 Greater than 40% eligibility 0 2
Teacher Education
Less than a master’s degree 0 3 Master’s degree or more 3 1
Teacher Experience
Up to 5 years 0 1 More than 5 years 1 2
Teacher Math Content and Pedagogical Knowledge
First (lowest) quintile 0 0 2nd through 5th quintiles 2 2
Teacher Previously Used Assigned Curriculum
No prior use 2 1 Previously used at the K–3 level 0 1
Cohort-One District (First Grade Only)
2 0a — 7 3 — 8 1 — 11 4 —
Cohort-Two District (First and Second Grades)
1 0 1 3 0 3 6 1 3 10 0 0 12 0a 0a 4 NA NA 5 NA NA 9 NA NA
Number of Statistically Significant Curriculum Differentials 22 23 Source: Results presented in Tables III.3 and III.4. NA indicates that none of the curriculum differentials in the district were examined because at least three curricula had only one school, which means that none of the pair-wise curriculum comparisons involve curricula with at least two schools each. — Indicates that the district did not implement the study’s curricula at the second-grade level.
aFewer than six of the pair-wise curriculum comparisons were examined because at least one of them involved a curriculum with only one school.
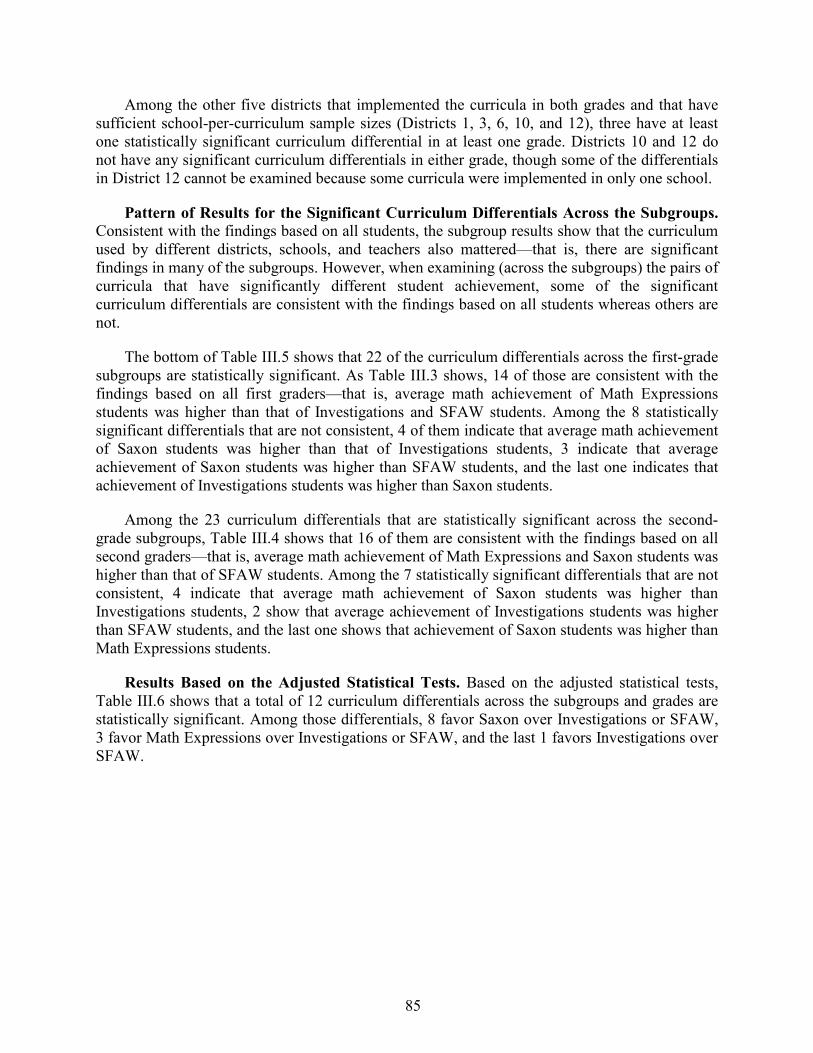
85
Among the other five districts that implemented the curricula in both grades and that have sufficient school-per-curriculum sample sizes (Districts 1, 3, 6, 10, and 12), three have at least one statistically significant curriculum differential in at least one grade. Districts 10 and 12 do not have any significant curriculum differentials in either grade, though some of the differentials in District 12 cannot be examined because some curricula were implemented in only one school.
Pattern of Results for the Significant Curriculum Differentials Across the Subgroups. Consistent with the findings based on all students, the subgroup results show that the curriculum used by different districts, schools, and teachers also mattered—that is, there are significant findings in many of the subgroups. However, when examining (across the subgroups) the pairs of curricula that have significantly different student achievement, some of the significant curriculum differentials are consistent with the findings based on all students whereas others are not.
The bottom of Table III.5 shows that 22 of the curriculum differentials across the first-grade subgroups are statistically significant. As Table III.3 shows, 14 of those are consistent with the findings based on all first graders—that is, average math achievement of Math Expressions students was higher than that of Investigations and SFAW students. Among the 8 statistically significant differentials that are not consistent, 4 of them indicate that average math achievement of Saxon students was higher than that of Investigations students, 3 indicate that average achievement of Saxon students was higher than SFAW students, and the last one indicates that achievement of Investigations students was higher than Saxon students.
Among the 23 curriculum differentials that are statistically significant across the second-grade subgroups, Table III.4 shows that 16 of them are consistent with the findings based on all second graders—that is, average math achievement of Math Expressions and Saxon students was higher than that of SFAW students. Among the 7 statistically significant differentials that are not consistent, 4 indicate that average math achievement of Saxon students was higher than Investigations students, 2 show that average achievement of Investigations students was higher than SFAW students, and the last one shows that achievement of Saxon students was higher than Math Expressions students.
Results Based on the Adjusted Statistical Tests. Based on the adjusted statistical tests, Table III.6 shows that a total of 12 curriculum differentials across the subgroups and grades are statistically significant. Among those differentials, 8 favor Saxon over Investigations or SFAW, 3 favor Math Expressions over Investigations or SFAW, and the last 1 favors Investigations over SFAW.
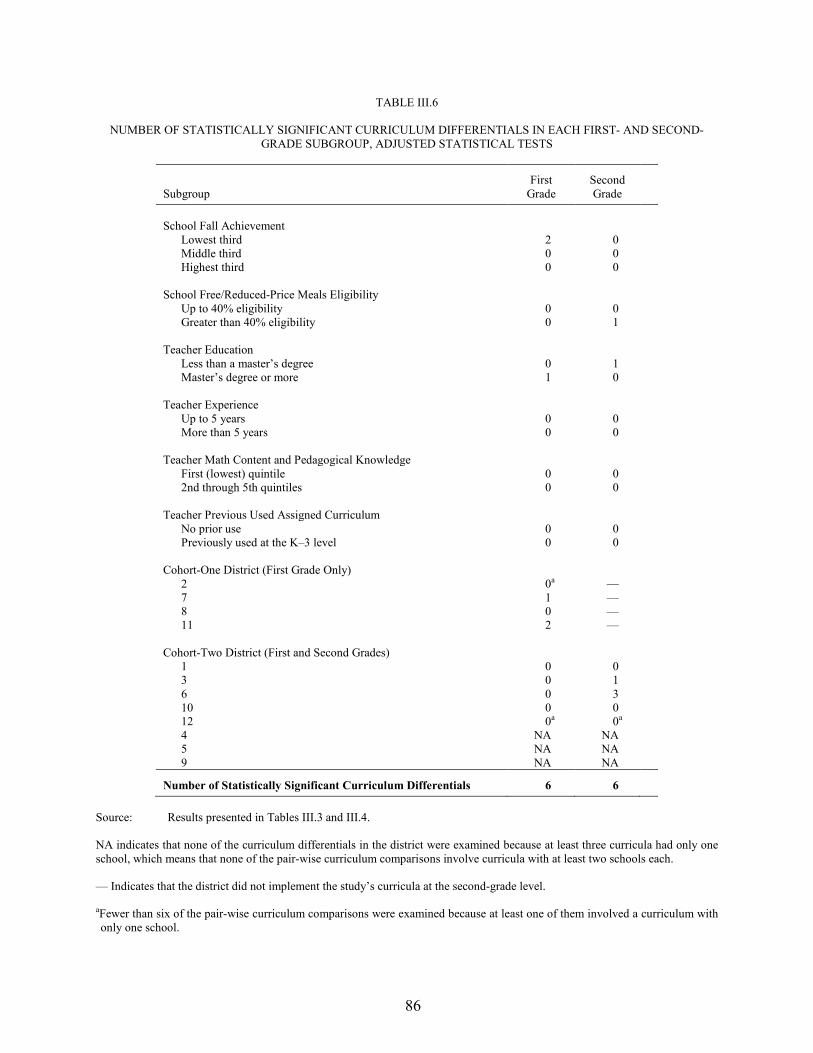
86
TABLE III.6
NUMBER OF STATISTICALLY SIGNIFICANT CURRICULUM DIFFERENTIALS IN EACH FIRST- AND SECOND-GRADE SUBGROUP, ADJUSTED STATISTICAL TESTS
Subgroup First
Grade Second Grade
School Fall Achievement
Lowest third 2 0 Middle third 0 0 Highest third 0 0
School Free/Reduced-Price Meals Eligibility
Up to 40% eligibility 0 0 Greater than 40% eligibility 0 1
Teacher Education
Less than a master’s degree 0 1 Master’s degree or more 1 0
Teacher Experience
Up to 5 years 0 0 More than 5 years 0 0
Teacher Math Content and Pedagogical Knowledge
First (lowest) quintile 0 0 2nd through 5th quintiles 0 0
Teacher Previous Used Assigned Curriculum
No prior use 0 0 Previously used at the K–3 level 0 0
Cohort-One District (First Grade Only)
2 0a — 7 1 — 8 0 — 11 2 —
Cohort-Two District (First and Second Grades)
1 0 0 3 0 1 6 0 3 10 0 0 12 0a 0a 4 NA NA 5 NA NA 9 NA NA
Number of Statistically Significant Curriculum Differentials 6 6 Source: Results presented in Tables III.3 and III.4. NA indicates that none of the curriculum differentials in the district were examined because at least three curricula had only one school, which means that none of the pair-wise curriculum comparisons involve curricula with at least two schools each. — Indicates that the district did not implement the study’s curricula at the second-grade level.
aFewer than six of the pair-wise curriculum comparisons were examined because at least one of them involved a curriculum with only one school.

87
IV. EXPLORATORY LOOK AT WHAT ACCOUNTS FOR THE RELATIVE CURRICULUM EFFECTS
This chapter examines factors that may account for the relative curriculum effects reported in Chapter III. The factors we consider are measures of teaching approaches and practices obtained through the classroom observations conducted by the study team, and information about teacher curriculum training, math instructional time, and math content coverage collected through the spring teacher surveys. Chapter II showed that curriculum training, instructional time, and the number of lessons taught in many math content areas differed across the curriculum groups. In this chapter, we begin by examining teaching approaches and practices measured through classroom observations.68 Then, we examine whether the teaching approaches and practices that differ across the four curriculum groups (measured through both observations and teacher surveys) are related to student math achievement of the curriculum pairs with different student achievement. Put differently, we focus on each curriculum pair that resulted in significantly different student achievement, and we examine whether differences in teaching approaches and practices could be related to those differences in student achievement.69
An important issue to consider when interpreting the mediation results is that the study did not randomly assign teachers to implement a specific set of activities within each curriculum, nor were they assigned to implement each activity in a specified way. In fact, as the curriculum-specific measures of adherence presented in Chapter II show, teachers in each curriculum group varied in the ways they implemented their assigned curriculum. Implementation may have varied due to an unmeasured variable that affects both the way in which teachers use each curriculum and student achievement, or even because student achievement during the year affected implementation (reverse causation). As a result, correlations between the implementation measures examined and student achievement do not necessarily provide rigorous evidence of the factors that account for the significant differences in student achievement between some of the curriculum groups.
We attempt to address this issue by using a nonexperimental technique that, under the conditions described later in this chapter, provides consistent results about mediation. The results indicate how the average causal effect of the curricula on the potential mediators (which has a
68 The classroom observation measures we examine are limited to ones that can be measured consistently across curricula.
69 While the mediational analyses are limited to curriculum pairs that have significantly different student achievement, the teaching approaches and practices examined in these analyses include those that are significantly different across the curriculum groups, according to a statistical test of joint equality. In other words, these analyses are not limited to teaching approaches and practices that (in addition to the joint equality test) also differ across the specific pairs of curricula examined, according to statistical tests of pair-wise curriculum comparisons. Because our goal in this chapter is to examine factors that may account for the relative curriculum effects on student achievement, our strategy is to be more inclusive with the teaching approaches and practices. This is accomplished by examining all approaches and practices that are significantly different according to the joint equality test, rather than limiting the analysis to those that are significantly different according to both the joint equality test and pair-wise curriculum comparisons.
88
causal interpretation because of the study’s design) is related to student achievement that is significantly different across pairs of curricula. For example, suppose two curricula with different student achievement also differ along a teaching approach or practice. With this method, the results tell us how the curriculum-group difference on the teaching approach or practice is related to the curriculum-pair difference on student achievement. As such, the results help us understand which features of the study’s curricula may account for the relative curriculum effects.
Because we cannot prove that the necessary conditions of the technique hold, we refer to the mediation results using terms such as “correlations” and “relationships.” While the technique does not necessarily provide causal evidence, we believe the results could be useful for guiding future efforts aimed at designing a study that provides rigorous evidence of mediation.
A. TEACHING APPROACHES AND PRACTICES MEASURED USING CLASSROOM OBSERVATIONS
The classroom observations conducted by the study team collected two types of information. The first type (discussed in Chapter II) involved adherence to each curriculum. The second type includes information about teaching approaches and practices used by teachers regardless of the curriculum in use.
This section describes that second type, the cross-curriculum information. It also describes
the process used to explore whether any constructs underlie the information that was collected, and the scales about teaching approaches and practices that emerged. We begin with a description of the protocol used for the classroom observations.
1. The Classroom Observation Protocol
The protocol for conducting classroom observations was developed specifically for this study. In designing the protocol, we began by reviewing the study’s curricula in depth. Next, keeping the features of each study curriculum in mind, we reviewed the literature to identify methods previously used for assessing quality of instruction. We looked at literature that spanned the range of grades from preschool to high school and across different academic areas, paying special attention to protocols pertaining to mathematics (Clements and Sarama 2004; Good and Brophy 2004; National Research Council 2004; Waxman et al. 2004). We also reviewed other classroom observation protocols, such as the Classroom Assessment Scoring System (CLASS) and Vermont Classroom Observation Tool (VCOT) (Pianta et al. 2006; Horizon, Inc. 2006).
Based on our review, we developed an observation protocol that uses both interactive coding
(coding and then counting clearly defined behaviors as they occur) and ratings completed at the end of the observation (using a Likert scale to rate how evident different behaviors or characteristics are). Combining these approaches enables an observer to focus on the teacher-student interactions that occur, and to capture information about the frequency of those clearly defined interactions and information about how evident or characteristic different behaviors are in the classroom. The goal was to measure, in a consistent manner across curricula, teaching
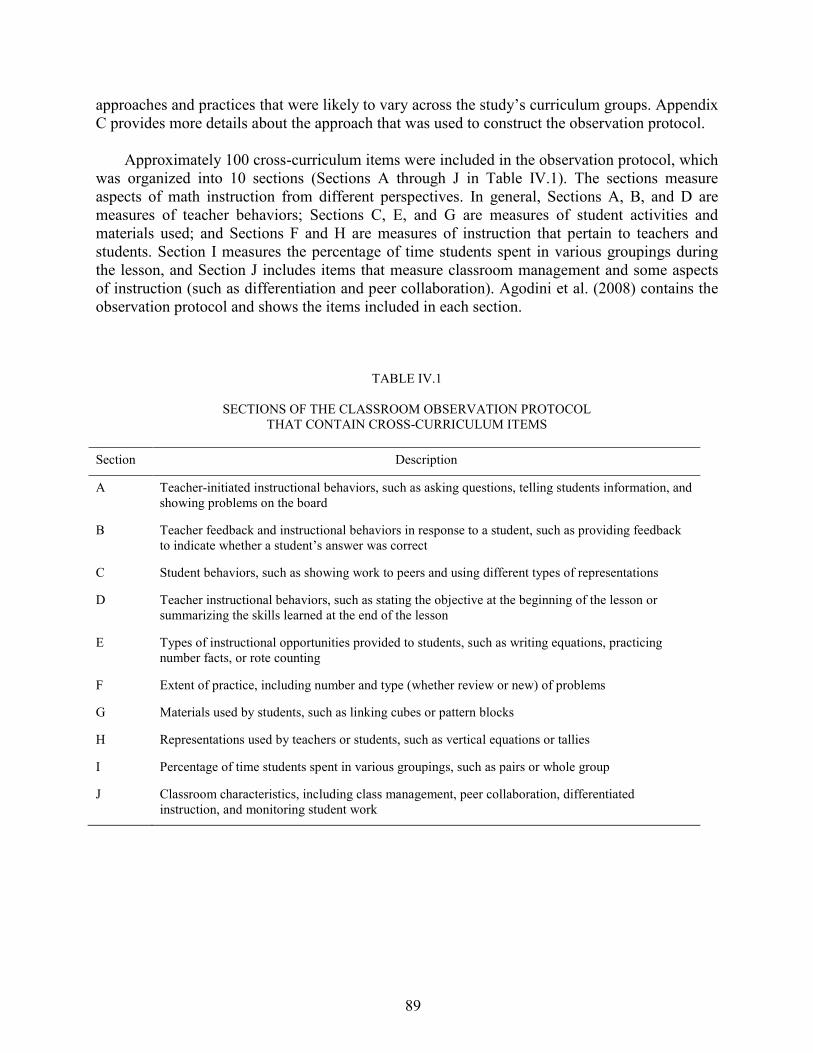
89
approaches and practices that were likely to vary across the study’s curriculum groups. Appendix C provides more details about the approach that was used to construct the observation protocol.
Approximately 100 cross-curriculum items were included in the observation protocol, which
was organized into 10 sections (Sections A through J in Table IV.1). The sections measure aspects of math instruction from different perspectives. In general, Sections A, B, and D are measures of teacher behaviors; Sections C, E, and G are measures of student activities and materials used; and Sections F and H are measures of instruction that pertain to teachers and students. Section I measures the percentage of time students spent in various groupings during the lesson, and Section J includes items that measure classroom management and some aspects of instruction (such as differentiation and peer collaboration). Agodini et al. (2008) contains the observation protocol and shows the items included in each section.
TABLE IV.1
SECTIONS OF THE CLASSROOM OBSERVATION PROTOCOL THAT CONTAIN CROSS-CURRICULUM ITEMS
Section Description
A Teacher-initiated instructional behaviors, such as asking questions, telling students information, and showing problems on the board
B Teacher feedback and instructional behaviors in response to a student, such as providing feedback to indicate whether a student’s answer was correct
C Student behaviors, such as showing work to peers and using different types of representations
D Teacher instructional behaviors, such as stating the objective at the beginning of the lesson or summarizing the skills learned at the end of the lesson
E Types of instructional opportunities provided to students, such as writing equations, practicing number facts, or rote counting
F Extent of practice, including number and type (whether review or new) of problems
G Materials used by students, such as linking cubes or pattern blocks
H Representations used by teachers or students, such as vertical equations or tallies
I Percentage of time students spent in various groupings, such as pairs or whole group
J Classroom characteristics, including class management, peer collaboration, differentiated instruction, and monitoring student work

90
2. Approach to Constructing Scales
Our first step in working with these data was to conduct an exploratory factor analysis (EFA) to determine if any constructs underlie the many cross-curriculum items in the protocol.70
In exploring whether meaningful constructs exist, an important consideration was the reliability of the constructs because they ultimately would be used in the mediation analysis. We varied parameters of the EFA to help us identify the solution that balanced our goals of creating scales that are meaningful and reliable. Appendix C describes the parameters that were varied.
For example, the curricula differ in the extent to which they emphasize student-centered or teacher-directed instructional approaches. The protocol contains many items that measure whether aspects of student-centered instruction occurred, such as the teacher posing open-ended questions, accepting multiple answers or solutions, or probing students for the reasoning or justification of their answers. Similarly, the protocol has many items that measure aspects of teacher-directed instruction, such as the teacher asking close-ended questions with only one acceptable answer, students practicing number facts or procedures, or the class working in a whole-group environment. Working with a smaller number of constructs than the many items in the protocol would make the resulting mediation analysis more tractable.
After reviewing the possible solutions, the potential interpretability of the solutions, and the
reliability of each solution, we ultimately selected a four-factor solution that has been labeled: (1) student-centered instruction, (2) teacher-directed instruction, (3) peer collaboration, and (4) classroom environment. Each factor is described in more detail in the next section. Appendix C provides more details about our choice of these four factors, and details about how the scale scores were constructed.
Our last step in constructing scales was to determine if any refinements could be made to
increase the reliability of any scale that fell below our reliability threshold. If the initial reliability (alpha) of a scale was below 0.80, we examined if it could be increased by dropping items. We dropped items until the scale reliability reached at least 0.80 or the highest possible value below 0.80. For example, if the initial reliability of a scale was 0.72 and dropping one item increased it to 0.77, we would drop the item. If dropping a second item led to no increase in reliability—or caused a decrease—only the first item was dropped. Alternatively, if dropping the second item increased reliability to 0.82, then the second item was dropped. No efforts were made to drop a third item, however, because the scale surpassed our reliability goal of 0.80.
3. Scales Constructed
The resulting four scales measure teaching practices and approaches in the study classrooms (Table IV.2). Simple labels have been assigned to each scale, and a comprehensive description of the items within each scale is also provided.
70 As described in Appendix C, one item on the observation protocol (students participated in curricula specific activities) was excluded from the EFA because it failed to meet an inter-rater reliability threshold of 75 percent agreement (see Table C.1).

91
TABLE IV.2
OBSERVATION ITEMS IN EACH SCALE
Scale and Items Scale Reliability
Student-Centered Instruction 0.72 Teacher poses open-ended questions Teacher elicits multiple strategies or solutions Teacher tells student strategy to use Teacher elicits other students’ questions about a student’s response Teacher labels math strategy, problem, or concept Teacher repeats student answer in a neutral way Teacher probes for reasoning or justification Teacher provides hint to students Teacher clarifies what student says or does Teacher extends what student says or does Teacher uses praise or makes positive comments focused on content Teacher highlights student work or solution to class Number of different types of visual or 3D representations created by students Teacher differentiated curriculum for children who were above level
Teacher-Directed Instruction 0.77 Teacher asks close-ended questions Teacher guides practice on problems Teacher uses representations Teacher indicates if correct without elaborating Teacher calls on other students until the correct answer is given Teacher asks class if they agree or disagree with student’s response Teacher prompts student to guide practice or lead class in a routine Students practiced number facts or procedures Students provided choral or group responses to questions Rote counting occurred in the lesson Number of types of rote counting that occurred Number of problems focused on review of previously learned material Number of materials used by children Number of types of representations Percentage of time spent in large group
Peer Collaboration 0.85
Teacher demonstrates how to play a game Teacher directs or encourages students to help one another with math Students played math games Students asked peers questions about math Students discussed strategies or solutions with partner or small group Percentage of time spent in small group Percentage of time spent in pairs Teacher encourages students to help one another understand math Students help one another understand math concepts or procedures Peer-to-peer interaction about math occurs
Classroom Environment 0.92 Students are cooperative and attentive to the lesson Teacher spends a lot of time managing behavior (reverse coded) Student behavior disrupts the classroom (reverse coded) Students are perfectly behaved
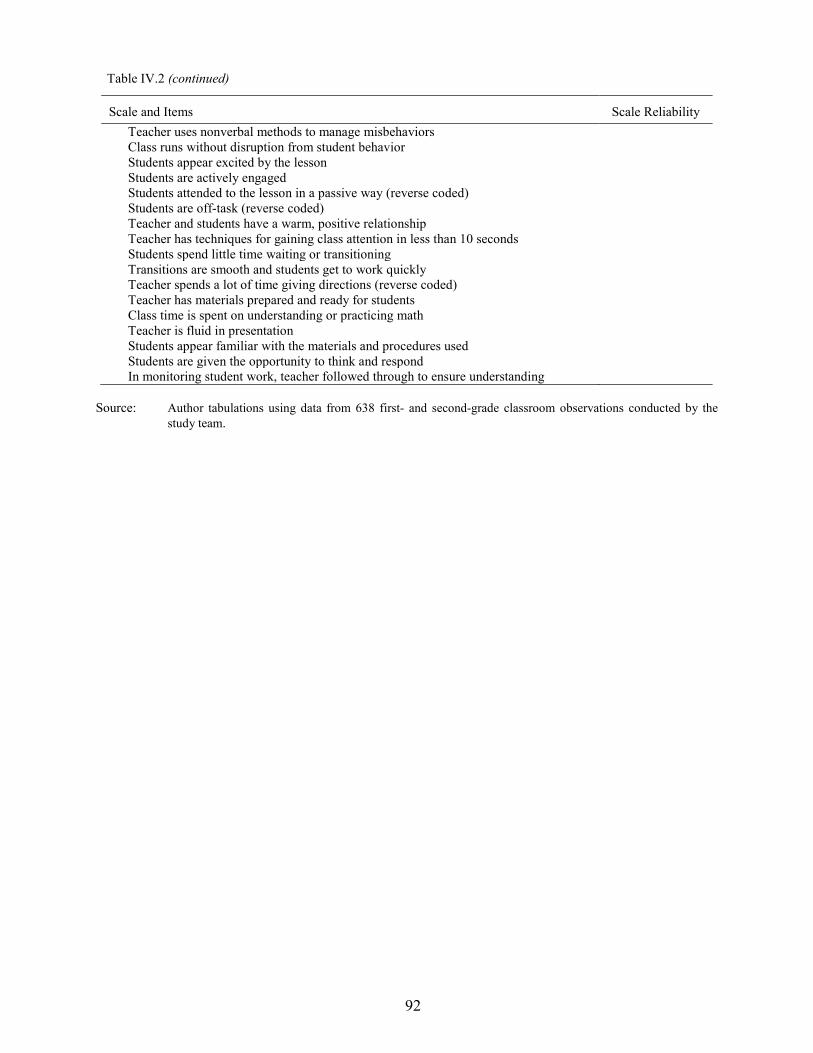
92
Scale and Items Scale Reliability Teacher uses nonverbal methods to manage misbehaviors Class runs without disruption from student behavior Students appear excited by the lesson Students are actively engaged Students attended to the lesson in a passive way (reverse coded) Students are off-task (reverse coded) Teacher and students have a warm, positive relationship Teacher has techniques for gaining class attention in less than 10 seconds Students spend little time waiting or transitioning Transitions are smooth and students get to work quickly Teacher spends a lot of time giving directions (reverse coded) Teacher has materials prepared and ready for students Class time is spent on understanding or practicing math Teacher is fluid in presentation Students appear familiar with the materials and procedures used Students are given the opportunity to think and respond In monitoring student work, teacher followed through to ensure understanding
Source: Author tabulations using data from 638 first- and second-grade classroom observations conducted by the
study team.
Table IV.2 (continued)
93
1. Student-Centered Instruction. This scale includes 14 items that measure instructional practices expected in a student-centered instructional setting, including the extent to which teachers build on student thinking and elicit metacognitive understanding.
2. Teacher-Directed Instruction. This scale includes 15 items that measure instructional practices expected in a teacher-directed instructional setting, including the frequency of math practice and use of representations.
3. Peer Collaboration. This scale includes 10 items that measure student interactions during math instruction, including teacher encouragement of student interactions, the types of interactions, the use of game playing, and the percentage of time spent in small groups or pairs.
4. Classroom Environment. This scale is an overarching measure of the quality of the classroom environment, including 21 items that measure the teacher’s ability to manage student behavior, use instructional time productively, create a warm or positive instructional climate, and actively or passively engage students.
These constructs are consistent with the framework used in the design effort for the protocol. The protocol included items to measure student-centered and teacher-directed instructional approaches because the study included curricula that emphasize both types of instruction and the goal was to see if the different approaches have different relationships with student achievement. The protocol also included items to measure peer collaboration and the classroom environment because prior research has indicated both aspects of the classroom climate can have an effect on student achievement.
B. CURRICULUM GROUP DIFFERENCES IN THE CLASSROOM OBSERVATION SCALES
A two-level hierarchical linear model (HLM) was used to calculate curriculum-group differences on the teaching approaches and practices scales. The first (teacher-level) equation regressed each scale on an intercept and a teacher-level error term. The second (school-level) equation regressed the intercept from the first equation on an intercept, binary indicators for three of the four curricula, binary indicators for all but one of the blocks to which the schools were assigned during the random assignment, and a school-level error term. Separate models were estimated for first- and second-grade teachers.71
71 Two other HLM specifications were estimated for both first- and second-grade teachers. One specification
included in the teacher-level equation a measure that indicates whether the teacher reported prior use of the assigned curriculum at the K–3 level. The other further expanded on the measures included in the teacher-level equation and added some measures to the school-level equations. With this second specification, along with prior use of the assigned curriculum at the K–3 level, the teacher-level equation included teacher education, experience, score on the math content and pedagogical test administered before curriculum training, class size, variance of the fall student math score, and skewness of the score. In addition to the curriculum assigned to the school and random assignment block indicators mentioned in the text, the school-level equation also included Title I eligibility and the percentage of students eligible for free or reduced-price meals. The results based on these alternate HLM specifications are not reported but are similar to those based on the specification described above.
Table IV.3 presents the results for each

94
TABLE IV.3
DIFFERENCE BETWEEN PAIRS OF CURRICULA IN AVERAGE HLM-ADJUSTED CLASSROOM OBSERVATION SCALES, IN EFFECT SIZES FOR
FIRST- AND SECOND-GRADE CLASSROOMS (p-values are in parentheses)
Effect of
Investigations Relative to Math Expressions
Relative to
Saxon Relative
to
Math Expressions Saxon SFAW Saxon SFAW SFAW
First-Grade Classrooms
Student-Centered Instruction
Effect size 0.25*+ 0.34*+ 0.22*+ 0.10 -0.03 -0.12 Unadjusted p-value (0.00) (0.00) (0.00) (0.24) (0.74) (0.12) Adjusted p-value (0.01) (0.00) (0.02) (0.65) (0.99) (0.40)
Teacher-Directed Instruction Effect size -0.27*+ -0.75*+ -0.25*+ -0.48*+ 0.02 0.50*+ Unadjusted p-value (0.00) (0.00) (0.00) (0.00) (0.77) (0.00) Adjusted p-value (0.00) (0.00) (0.00) (0.00) (0.99) (0.00)
Peer Collaboration Effect size 0.58*+ 0.85*+ 0.58*+ 0.27* 0.00 -0.27* Unadjusted p-value (0.00) (0.00) (0.00) (0.02) (0.99) (0.02) Adjusted p-value (0.00) (0.00) (0.00) (0.10) (1.00) (0.07)
Classroom Environment Effect size 0.06 0.06 -0.02 -0.00 -0.08 -0.08 Unadjusted p-value (0.54) (0.55) (0.82) (0.98) (0.39) (0.40) Adjusted p-value (0.93) (0.93) (1.00) (1.00) (0.83) (0.83)
Second-Grade Classrooms Student-Centered Instruction
Effect size 0.29*+ 0.43*+ 0.31*+ 0.13 0.02 -0.12 Unadjusted p-value (0.00) (0.00) (0.00) (0.12) (0.84) (0.17) Adjusted p-value (0.01) (0.00) (0.00) (0.40) (1.00) (0.51)
Teacher-Directed Instruction
Effect size -0.41*+ -1.01*+ -0.26*+ -0.60*+ 0.15* 0.75*+ Unadjusted p-value (0.00) (0.00) (0.00) (0.00) (0.02) (0.00) Adjusted p-value (0.00) (0.00) (0.00) (0.00) (0.09) (0.00)
Peer Collaboration
Effect size 0.45*+ 0.66*+ 0.55*+ 0.21* 0.11 -0.11 Unadjusted p-value (0.00) (0.00) (0.00) (0.03) (0.28) (0.26) Adjusted p-value (0.00) (0.00) (0.00) (0.13) (0.69) (0.67)
Classroom Environment
Effect size 0.06 -0.04 -0.08 -0.09 -0.14 -0.04 Unadjusted p-value (0.58) (0.71) (0.43) (0.36) (0.18) (0.65) Adjusted p-value (0.94) (0.98) (0.85) (0.79) (0.54) (0.97)
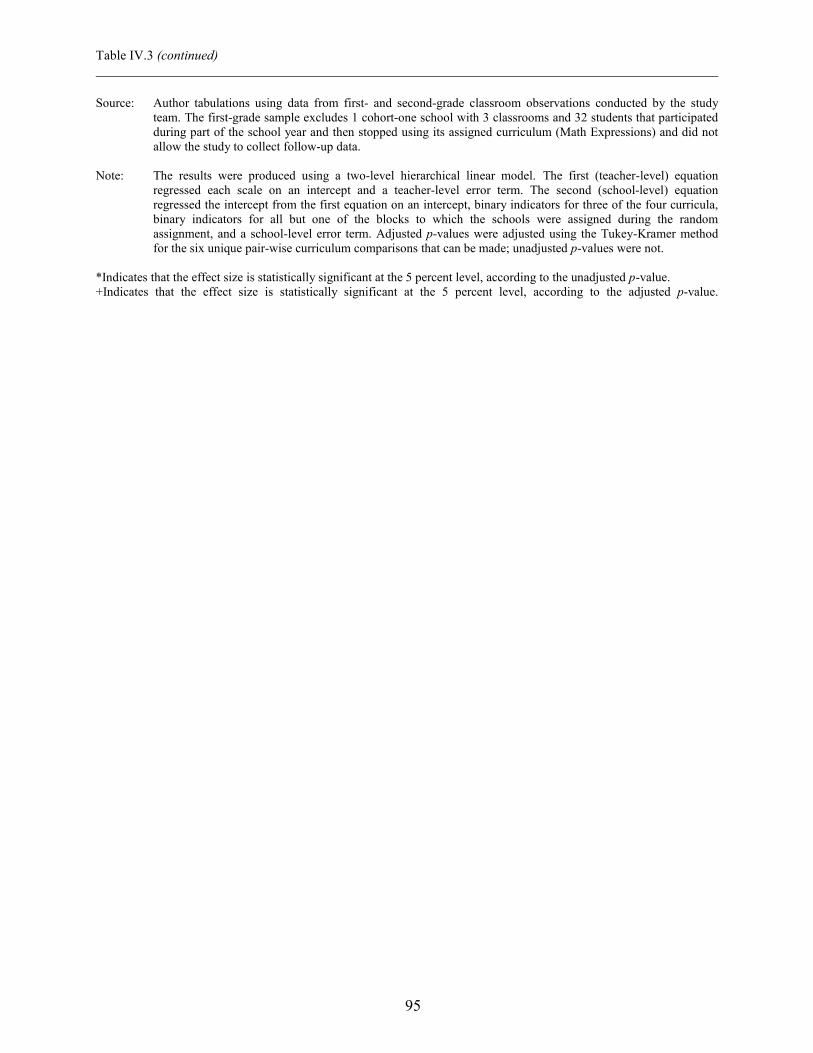
Table IV.3 (continued)
95
Source: Author tabulations using data from first- and second-grade classroom observations conducted by the study team. The first-grade sample excludes 1 cohort-one school with 3 classrooms and 32 students that participated during part of the school year and then stopped using its assigned curriculum (Math Expressions) and did not allow the study to collect follow-up data.
Note: The results were produced using a two-level hierarchical linear model. The first (teacher-level) equation
regressed each scale on an intercept and a teacher-level error term. The second (school-level) equation regressed the intercept from the first equation on an intercept, binary indicators for three of the four curricula, binary indicators for all but one of the blocks to which the schools were assigned during the random assignment, and a school-level error term. Adjusted p-values were adjusted using the Tukey-Kramer method for the six unique pair-wise curriculum comparisons that can be made; unadjusted p-values were not.
*Indicates that the effect size is statistically significant at the 5 percent level, according to the unadjusted p-value. +Indicates that the effect size is statistically significant at the 5 percent level, according to the adjusted p-value.

96
scale, separately for first- and second-grade teachers. The results include the magnitude and statistical significance of the six unique pair-wise curriculum comparisons that can be made for each scale at each grade level. The results are presented in effect size units. Consistent with the approach used in Chapter III, two p-values were calculated for each result, where the first does not adjust for the six unique pair-wise curriculum comparisons that can be made, and the second does adjust for the comparisons using the Tukey-Kramer method (Tukey 1952, 1953; Kramer 1956).72
When examining the curriculum-group differences on the scales, we focus on the statistical significance of the differences, rather than the magnitude of the differences. The differences, or effect sizes, depend on the alignment of the scale definitions with each curriculum, and the dispersion of the observation scale scores. For example, observation scales that correspond closely with the defining characteristics of one or more curricula will show strong effect contrasts, provided that teachers adhered to their assigned curriculum. Whatever the case, the effects on the teaching behavior scales are of less interest than whether those effects account for the relative effects of the curricula on student achievement, as reported in Chapter III. The goal of this chapter is to examine the latter issue and, as mentioned below, the first step in that analysis is to examine whether there are curriculum-group differences in teaching approaches and practices.
Given our focus on significant curriculum-group differences on the scales, three main findings emerge from the results based on the unadjusted statistical tests:
1. Student-centered instruction and peer collaboration were significantly higher in Investigations classrooms than in classrooms using the other three curricula. Although the other three curricula had significantly lower levels of student-centered instruction than Investigations, the differentials between Math Expressions, Saxon, and SFAW classrooms are not statistically significant. In terms of peer collaboration at the first-grade level, Math Expressions and SFAW classrooms were not significantly different from each other, and they were second to Investigations on this measure, followed by Saxon classrooms. At the second-grade level, peer collaboration was significantly higher in Math Expressions classrooms than in Saxon classrooms, but none of the other curriculum differentials (Math Expressions-SFAW and Saxon-SFAW) were statistically significant.
2. Teacher-directed instruction was significantly higher in Saxon classrooms than in classrooms using the other three curricula. For the other three curricula, in the first grade, Math Expressions and SFAW classrooms were not significantly different from each other and were second to Saxon in teacher-directed instruction, followed by Investigations classrooms. In the second grade, the levels of teacher-directed instruction were significantly different across the other three curricula, with Math
72 When making multiple comparison adjustments, the p-values also are typically adjusted for the number of
outcomes in the same domain that are analyzed—in this case, for the number of scales in the same domain. These adjustments were not made in this analysis because, as described earlier, the protocol was developed for this study and therefore we could not specify during the design phase what scales would emerge and the domains to which they belong.

97
Expressions classrooms having the second-highest level, followed by SFAW classrooms and Investigations classrooms.
3. The classroom environment did not differ across curricula. This was true in both first- and second-grade classrooms.
Results based on the adjusted statistical tests support the main findings: student-centered instruction and peer collaboration were highest in Investigations classrooms, and teacher-directed instruction was highest in Saxon classrooms. Results based on the adjusted statistical tests also support the main findings for the classroom environment scale, which show no significant differences across curricula.
The curriculum differentials on the scales are consistent with the differences in the instructional approaches of the four curricula. Although all four curricula include some aspects of both teacher-directed and student-centered instructional approaches and some peer collaboration, they differ in the extent to which they emphasize these approaches.
Investigations emphasizes student-centered approaches more than the other three curricula, and our results are consistent with this difference. Compared to teachers using the other curricula, Investigations teachers should pose more open-ended questions to students, repeat student answers in a neutral way, and probe students for reasoning or justification for their answers. Similarly, students in Investigations classrooms should use numerous types of visual or three-dimensional representations. The data show that Investigations teachers and students do have the highest values for these items (see Appendix C, Tables C.3 and C.4, which present the items underlying our student-centered instruction scale).
Saxon emphasizes teacher-directed instructional approaches more than the other three curricula, and our findings are consistent with this difference. Saxon’s design calls for the teacher to guide practice on numerous problems, use multiple representations while modeling procedures, and provide students with numerous practice problems on both new and review material. Saxon students should use choral or group responses and they should practice number facts and procures. As Appendix C, Tables C.5 and C.6 show, Saxon teachers and students had the highest values for these items.
Investigations and Math Expressions more strongly emphasize peer collaboration than Saxon or SFAW, and our findings are consistent with this difference. As Appendix C, Tables C.7 and C.8 show, Investigation and Math Expressions teachers were more likely to encourage students to help one another understand math. In addition, the Investigations curriculum is designed to regularly have students participate in math games, spend time working in pairs, and interact with one another about math. Investigations students had the highest values for each of these activities.
C. CORRELATIONAL ANALYSES OF RELATIVE EFFECTS AND KEY IMPLEMENTATION DIFFERENCES BETWEEN THE CURRICULA
Figure IV.1 presents our conceptual model for assessing whether the differences among the four curriculum groups in teaching approaches and practices just described, and in curriculum training, math instructional time, and math content coverage presented in Chapter II mediate the
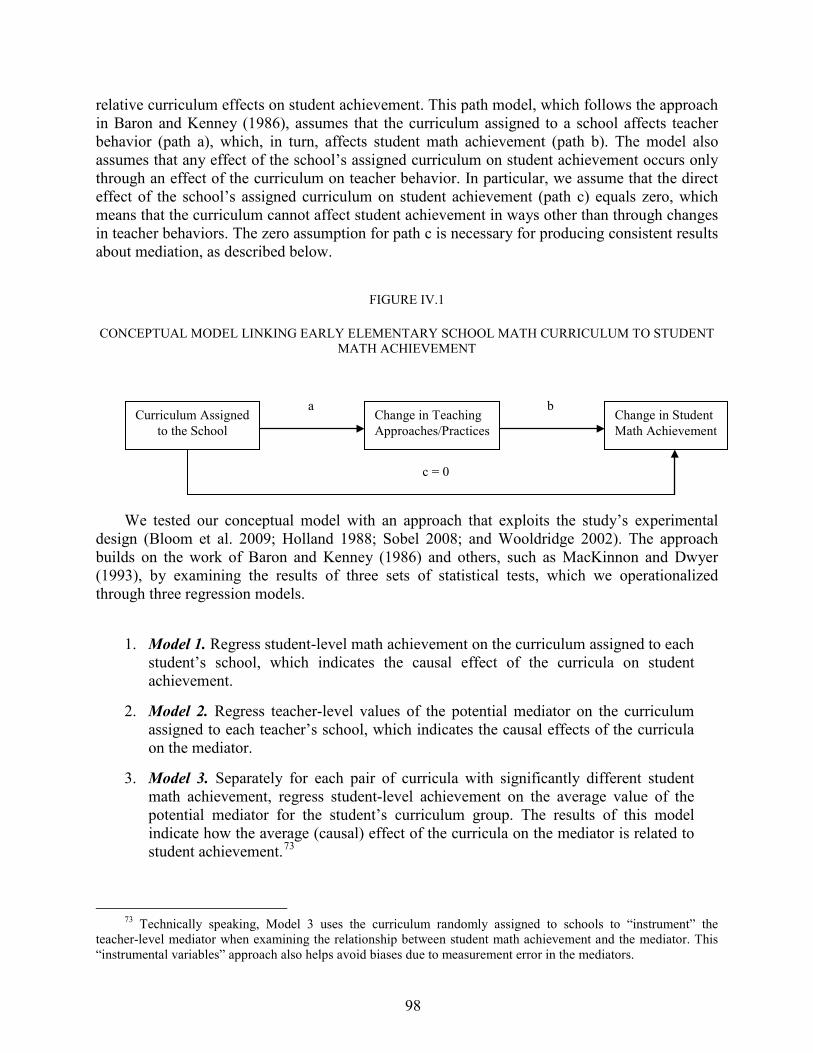
98
relative curriculum effects on student achievement. This path model, which follows the approach in Baron and Kenney (1986), assumes that the curriculum assigned to a school affects teacher behavior (path a), which, in turn, affects student math achievement (path b). The model also assumes that any effect of the school’s assigned curriculum on student achievement occurs only through an effect of the curriculum on teacher behavior. In particular, we assume that the direct effect of the school’s assigned curriculum on student achievement (path c) equals zero, which means that the curriculum cannot affect student achievement in ways other than through changes in teacher behaviors. The zero assumption for path c is necessary for producing consistent results about mediation, as described below.
FIGURE IV.1
CONCEPTUAL MODEL LINKING EARLY ELEMENTARY SCHOOL MATH CURRICULUM TO STUDENT
MATH ACHIEVEMENT
73
Curriculum Assigned to the School
Change in Teaching Approaches/Practices
Change in Student Math Achievement
a b
c = 0
We tested our conceptual model with an approach that exploits the study’s experimental design (Bloom et al. 2009; Holland 1988; Sobel 2008; and Wooldridge 2002). The approach builds on the work of Baron and Kenney (1986) and others, such as MacKinnon and Dwyer (1993), by examining the results of three sets of statistical tests, which we operationalized through three regression models.
1. Model 1. Regress student-level math achievement on the curriculum assigned to each student’s school, which indicates the causal effect of the curricula on student achievement.
2. Model 2. Regress teacher-level values of the potential mediator on the curriculum assigned to each teacher’s school, which indicates the causal effects of the curricula on the mediator.
3. Model 3. Separately for each pair of curricula with significantly different student math achievement, regress student-level achievement on the average value of the potential mediator for the student’s curriculum group. The results of this model indicate how the average (causal) effect of the curricula on the mediator is related to student achievement.
73 Technically speaking, Model 3 uses the curriculum randomly assigned to schools to “instrument” the teacher-level mediator when examining the relationship between student math achievement and the mediator. This “instrumental variables” approach also helps avoid biases due to measurement error in the mediators.
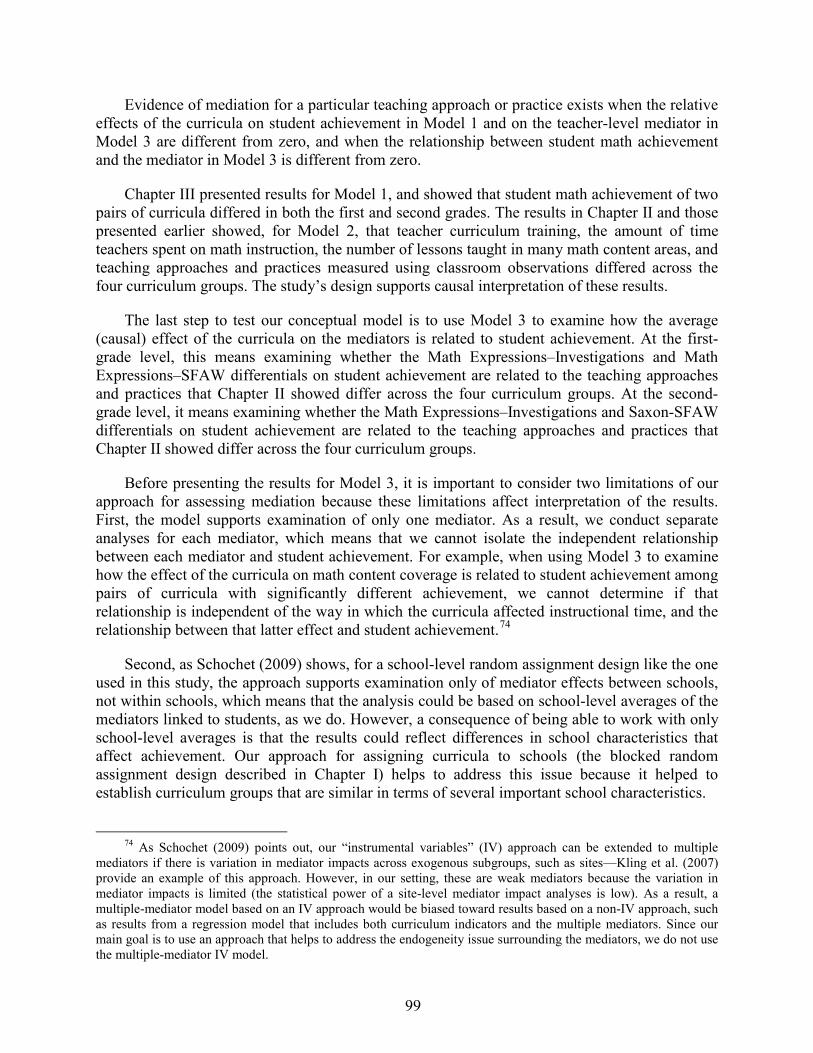
99
Evidence of mediation for a particular teaching approach or practice exists when the relative effects of the curricula on student achievement in Model 1 and on the teacher-level mediator in Model 3 are different from zero, and when the relationship between student math achievement and the mediator in Model 3 is different from zero.
Chapter III presented results for Model 1, and showed that student math achievement of two pairs of curricula differed in both the first and second grades. The results in Chapter II and those presented earlier showed, for Model 2, that teacher curriculum training, the amount of time teachers spent on math instruction, the number of lessons taught in many math content areas, and teaching approaches and practices measured using classroom observations differed across the four curriculum groups. The study’s design supports causal interpretation of these results.
The last step to test our conceptual model is to use Model 3 to examine how the average (causal) effect of the curricula on the mediators is related to student achievement. At the first-grade level, this means examining whether the Math Expressions–Investigations and Math Expressions–SFAW differentials on student achievement are related to the teaching approaches and practices that Chapter II showed differ across the four curriculum groups. At the second-grade level, it means examining whether the Math Expressions–Investigations and Saxon-SFAW differentials on student achievement are related to the teaching approaches and practices that Chapter II showed differ across the four curriculum groups.
Before presenting the results for Model 3, it is important to consider two limitations of our approach for assessing mediation because these limitations affect interpretation of the results. First, the model supports examination of only one mediator. As a result, we conduct separate analyses for each mediator, which means that we cannot isolate the independent relationship between each mediator and student achievement. For example, when using Model 3 to examine how the effect of the curricula on math content coverage is related to student achievement among pairs of curricula with significantly different achievement, we cannot determine if that relationship is independent of the way in which the curricula affected instructional time, and the relationship between that latter effect and student achievement.74
Second, as Schochet (2009) shows, for a school-level random assignment design like the one used in this study, the approach supports examination only of mediator effects between schools, not within schools, which means that the analysis could be based on school-level averages of the mediators linked to students, as we do. However, a consequence of being able to work with only school-level averages is that the results could reflect differences in school characteristics that affect achievement. Our approach for assigning curricula to schools (the blocked random assignment design described in Chapter I) helps to address this issue because it helped to establish curriculum groups that are similar in terms of several important school characteristics.
74 As Schochet (2009) points out, our “instrumental variables” (IV) approach can be extended to multiple
mediators if there is variation in mediator impacts across exogenous subgroups, such as sites—Kling et al. (2007) provide an example of this approach. However, in our setting, these are weak mediators because the variation in mediator impacts is limited (the statistical power of a site-level mediator impact analyses is low). As a result, a multiple-mediator model based on an IV approach would be biased toward results based on a non-IV approach, such as results from a regression model that includes both curriculum indicators and the multiple mediators. Since our main goal is to use an approach that helps to address the endogeneity issue surrounding the mediators, we do not use the multiple-mediator IV model.

100
A separate regression was run for each grade, curriculum-pair differential, and mediator combination of interest. For example, to examine how the statistically significant difference in first-grade achievement of Math Expressions and Investigations students is related to differences in the approaches and practices of first-grade teachers of these two curricula, a separate regression (of first-grade achievement of Math Expressions and Investigations students) was run for each approach or practice that is significantly different across the four curricula at this grade level. The results for each mediator are based on students in classrooms that have data for that mediator; that analysis uses the school-level averages of the mediators, for the reason just given. The model also includes student fall achievement to increase the precision of the results and includes the random assignment block of the student’s school to adjust the degrees of freedom when calculating the statistical significance of the results.
Table IV.4 presents the results of the regressions described above—that is, separate regressions that were estimated to examine the relationship between spring student math achievement of pairs of curriculum groups that have significantly different achievement, and each teacher behavior that is significantly different across the curriculum groups. We do not focus on the magnitude of the results, which are presented in effect sizes, because the study was not designed to provide rigorous evidence of mediation. Instead, our goal is to explore whether any statistically significant relationships exist, which (as mentioned earlier) could be useful for future efforts aimed at designing a study that provides rigorous evidence of mediation. For the same reason, the p-values used to determine the statistical significance of each relationship were not adjusted for the multiple teaching approaches and practices examined.
For three of the four curriculum-pair differentials that are statistically significant (as described in Chapter III), the results show that the student achievement differences are related to differences in the teaching approaches and practices of these curriculum groups. The curriculum differentials in student achievement that are related to the teaching approaches and practices include both of the first-grade differentials (Math Expressions-Investigations and Math Expressions-SFAW) and the Saxon-SFAW differential in the second grade. The teaching approaches and practices that are related to these differentials include curriculum training, math instructional time, coverage in many math content areas, and at least one of the scales about instructional approaches. Interestingly, although the results suggest that most of the teaching practices and approaches examined mediate the Math Expressions–SFAW differential on first-grade achievement, none of these measures mediate the same differential on second-grade achievement.
An important issue is the extent to which the mediators are correlated because, as mentioned earlier, our approach for assessing mediation supports examination of only one mediator at a time. An implication of that approach is that a high degree of correlation among the potential mediators could explain why, for example, the results indicate that all of them mediate the Saxon-SFAW differential.
101
TABLE IV.4
RELATIONSHIP BETWEEN SPRING STUDENT MATH ACHIEVEMENT OF CURRICULUM GROUPS THAT HAVE SIGNIFICANTLY DIFFERENT ACHIEVEMENT, AND TEACHER BEHAVIORS THAT ARE
SIGNIFICANTLY DIFFERENT ACROSS THE CURRICULUM GROUPS, IN EFFECT SIZES (p-values are in parentheses)
Curriculum Differential
First-Grade Classrooms Second-Grade Classrooms
Math Expressions–Investigations
Math Expressions–
SFAW
Math Expressions–
SFAW Saxon-SFAW
Teaching Approach or Practice
Curriculum Training 0.09*(0.00) -0.15*(0.00) -0.06 (0.41) -0.13*(0.00) Math Instructional Time -0.05*(0.02) -0.02*(0.01) 0.01 (0.75) 0.01*(0.00) Coverage in Math Content Areas
Counting with whole numbers -6.59 (0.76) 0.15*(0.01) -0.01 (0.73) 0.10*(0.00) Understanding numbers less than 10 -0.40*(0.02) 0.19*(0.01) -0.01 (0.81) 0.10*(0.00) Adding and subtracting with whole numbers 0.89*(0.04) 0.19*(0.01) -0.05 (0.51) 0.24*(0.00) Addition and subtraction facts with whole numbers 0.22*(0.01) 0.22*(0.01) -0.03 (0.74) 0.21*(0.00) Multiplying and dividing with whole numbers — — -0.04 (0.74) 0.11*(0.00) Multiplication & division facts with whole numbers — — -0.06 (0.74) 0.10*(0.00) Place value with whole numbers 0.07*(0.00) 0.34*(0.02) -0.02 (0.86) 0.17*(0.00) Fractions 0.10*(0.00) -1.05 (0.18) 0.02 (0.73) 0.11*(0.00) Decimals — — -0.02 (0.74) 0.09*(0.00) Percents — — -0.04 (0.82) 0.27*(0.00) Geometric shapes or spatial relationships -0.10*(0.00) -0.29*(0.01) 0.10 (0.73) 0.16*(0.00) Creating, continuing, or predicting patterns -0.55*(0.02) 0.20*(0.01) -0.20 (0.77) 0.09*(0.00) Word problems 0.53*(0.01) 0.11*(0.01) -0.02 (0.74) 0.16*(0.00) Collecting or analyzing data -0.28*(0.00) 0.27*(0.01) -0.13 (0.52) 0.16*(0.00) Graphs 0.33*(0.01) 0.19*(0.01) -0.04 (0.74) 0.14*(0.00) Measurement with standard tools 0.20*(0.00) 0.33*(0.00) 0.04 (0.73) 0.14*(0.00) Nonstandard measurement -0.18*(0.00) 0.67*(0.05) 0.07 (0.73) 0.23*(0.00) Time 0.14*(0.00) -0.15*(0.01) 0.12 (0.74) 0.15*(0.00) Money 0.05*(0.00) 0.11*(0.01) -0.05 (0.74) 0.15*(0.00)
Classroom Observation Scales
Student-centered instruction -0.51*(0.00) -1.44*(0.02) -5.36 (0.68) -1.27*(0.00) Teacher-directed instruction 0.57*(0.00) 4.28 (0.16) 0.22 (0.32) 0.23*(0.00) Peer collaboration -0.25*(0.00) 17.29 (0.78) 0.24 (0.32) -2.06*(0.00)
Source: Author calculations using data from the spring ECLS-K math test administered by the study team, spring teacher surveys, and classroom observations conducted by the study team. The first-grade sample excludes 1 cohort-one school with 3 classrooms and 32 students that participated during part of the school year and then stopped using its assigned curriculum (Math Expressions) and did not allow the study to collect follow-up data. Samples sizes for the analyses varied across the curriculum differential and mediator examine. For the first-grade Math Expressions-Investigations differential analysis, the sample size ranged from 1,770 to 2,317; for the first-grade Math Expressions-SFAW differential analysis, it ranged from 1,979 to 2,442; for the second-grade Math Expressions-SFAW differential analysis, it ranged from 1,389 to 1,632; and for the second-grade Saxon-SFAW differential analysis, it ranged from 1,413 to 1,705.
— Indicates that the number of lessons taught in the math content area was not significantly different across the curriculum groups at the 5 percent level.
*Indicates that the relationship between the teacher behavior and student achievement is statistically significant at the 5 percent level.

102
Coverage in the various math content areas is highly correlated (Cronbach’s alpha = 0.88 for first grade and 0.92 for second grade). However, math instructional time is not highly correlated with each of the math content areas—the alpha between instructional time and each content area across the two grades ranges from 0.02 to 0.35 Also, the three classroom observation scales examined are not highly correlated (Cronbach’s alpha = 0.49 for both first and second grade), as we would expect because a goal for the scale construction process was to develop scales that are unrelated but that collectively help us understand the differences between the curricula in terms of teaching approaches and practices. Although the mediators examined are not highly correlated, which suggests that at least some could have independent relationships with student achievement, a study that is designed to provide rigorous evidence of mediation would be more useful for understanding which mediators, in fact, account for relative curriculum effects.
D. SUMMARY
As described in Chapter I, this study was designed to rigorously evaluate the relative effects of four curricula. Each curriculum includes a bundle of teaching approaches and practices, and the relative effects of the curricula reflect all differences between the curricula, including differences in teacher training, instructional strategies, content coverage, and curriculum materials.
In this chapter, we sought to examine whether some of the specific teaching approaches and practices of the curricula are related to the relative curriculum effects reported in Chapter III. The approaches and practices we considered are measures of student-centered instruction, teacher-directed instruction, and peer collaboration obtained through classroom observations conducted by the study team, and information about teacher curriculum training, math instructional time, and math content coverage collected through spring teacher surveys.
The results suggest evidence of mediation for three of the four curriculum-pair differentials that are statistically significant (Math Expressions-Investigations in first grade; Math Expressions-SFAW in first-grade; and Saxon-SFAW in second grade). However, there is no evidence of mediation for the fourth statistically significant curriculum-pair differential (Math Expressions–SFAW differential in second grade).
As previously mentioned, these analyses are based on correlations between the implementation measures and student achievement. Therefore, they do not necessarily provide rigorous evidence of the factors that account for the significant differences in student achievement between some of the curriculum pairs. Also, these analyses were limited to examining the implementation measures one at a time, which does not allow us to examine the independent effect of each measure and the potential interdependence among the measures. For these reasons, the results are best viewed as informative for helping to shape future studies designed to provide rigorous evidence of mediation.

103
REFERENCES
Agodini, Roberto, John Deke, Sally Atkins-Burnett, Barbara Harris, and Robert Murphy. “Design for the Evaluation of Early Elementary School Mathematics Curricula.” Report submitted to the U.S. Department of Education, Institute of Education Sciences. Princeton, NJ: Mathematica Policy Research, January 2008.
Agodini, Roberto, Barbara Harris, Sally Atkins-Burnett, Sheila Heaviside, Timothy Novak, and Robert Murphy. “Achievement Effects of Four Early Elementary School Math Curricula: Findings from First Graders in 39 Schools.” Report submitted to the U.S. Department of Education, Institute of Education Sciences. Princeton, NJ: Mathematica Policy Research, February 2009.
Baker, Jean A. “Teacher-Student Interaction in Urban At-Risk Classrooms: Differential Behavior, Relationship Quality, and Student Satisfaction with School.” The Elementary School Journal, vol. 100, no. 1, 1999, pp. 57–70.
Baron, Rueben M., and David Kenney. “The Moderator-Mediator Variable Distinction in Social Psychological Research: Conceptual, Strategic, and Statistical Considerations.” Journal of Personality and Social Psychology, vol. 51, no. 6, 1986, pp. 1173–1182.
Baxter, J., J. Woodward, and D. Olson. “Effects of Reform-Based Mathematics Instruction on Low-Achievers in Five Third-Grade Classrooms.” The Elementary School Journal, vol. 101, no. 5, 2001, pp. 529–547.
Bhatt, Rachana R., and Cory Koedel. A Non-Experimental Evaluation of Curricular Effectiveness in Math. Andrew Young School of Policy Studies Research Paper Series No. 09-12. December 2009.
Bloom, H., P. Zhu, and F. Unlu. “Finite Sample Bias from Instrumental Variables Analysis in Randomized Trials.” MDRC Working Paper. New York: MDRC, 2009.
Charles, Randall, Warren Crown, Francis (Skip) Fennell, Janet H. Caldwell, Mary Cavanagh, Dinah Chancellor, Alma B. Ramirez, Jeanne F. Ramos, Kay Sammons, Jane F. Schielack, William Tate, Mary Thompson, and John A. Van de Walle. Scott Foresman-Addison Wesley Mathematics. Grade 1. Glenview, IL: Pearson Scott Foresman, 2005a.
Charles, Randall, Warren Crown, Francis (Skip) Fennell, Janet H. Caldwell, Mary Cavanagh, Dinah Chancellor, Alma B. Ramirez, Jeanne F. Ramos, Kay Sammons, Jane F. Schielack, William Tate, Mary Thompson, and John A. Van de Walle. Scott Foresman-Addison Wesley Mathematics. Grade 2. Glenview, IL: Pearson Scott Foresman, 2005b.
Clements, Douglas H., and Julie Sarama. Engaging Young Children in Mathematics: Standards for Early Childhood Mathematics Education. Mahwah, NJ: Lawrence Earlbaum Associates, Inc., 2004.

104
Dane, A.V., and B.H. Schneider. “Program Integrity in Primary and Early Secondary Prevention: Are Implementation Effects Out of Control?” Clinical Psychological Review, vol. 18, 1998, pp. 23–45.
Denton, K., and Jerry West. Children’s Reading and Mathematics Achievement in Kindergarten and First Grade. Publication No. NCES 2002-125. Washington, DC: U.S. Department of Education, National Center for Education Statistics, 2002.
Dusenbury, L., R. Brannigan, M. Falco, and W.B. Hansen. “A Review of Research on Fidelity of Implementation: Implications for Drug Abuse Prevention in School Settings.” Health Education Research Theory and Practice, vol. 18, no. 2, 2003, pp. 237–256.
Erchul, William P., and Brian K. Martens. School Consultation: Conceptual and Empirical Bases of Practice: Second Edition. New York, NY: Springer, 2002.
Fuson, Karen C. Math Expressions. Grade 1. Boston, MA: Houghton Mifflin Company, 2006.
Fuson, Karen C. Math Expressions. Grade 1. Orlando, FL: Houghton Mifflin Harcourt Publishing Company, 2009a.
Fuson, Karen C. Math Expressions. Grade 2. Orlando, FL: Houghton Mifflin Harcourt Publishing Company, 2009b.
Ginsburg, A., G. Cooke, S. Leinwand, J. Noell, and E. Pollock. “Reassessing U.S. International Mathematics Performance: New Findings from the 2003 TIMSS and PISA.” Washington, DC: American Institutes for Research, 2005.
Good, Thomas L., and Jere E. Brophy. Looking in Classrooms. 9th ed. Allyn and Bacon, 2004.
Hiebert, J.C., and D.A. Grouws. “The Effects of Classroom Mathematics Teaching on Students’ Learning. In Second Handbook of Research on Mathematics Teaching and Learning, edited by F.K. Lester, Jr. (vol. 1, pp. 371–404). New York: Information Age Publishing, 2007.
Hill, Heather, Stephen G. Schilling, and Deborah Loewenberg Ball. “Developing Measures of Teachers’ Mathematics Knowledge for Teaching.” The Elementary School Journal, vol. 105, no. 1, 2004, pp. 11–30.
Holland, P. W. “Causal Inference, Path Analysis, and Recursive Structural Equation Models.” In Sociological Methodology, edited by C.C. Clogg. Washington, DC: American Sociological Association, 1988.
Horizon, Inc. Vermont Classroom Observation Tool: Math Observation Scoring Booklet.
Huntley, Mary Ann. “Operationalizing the Concept of ‘Fidelity of Implementation’ for NSF-Funded Mathematics Curricula.” Presentation at the National Science Foundation K–12 Mathematics, Science, and Technology Curriculum Developers Conference, Alexandria, VA, 2005. Retrieved from http://www.agiweb.org/education/nsf2005/speakers.html on November 1, 2006.

105
Institute of Education Sciences. “Final Report on the National Assessment of Title I: Summary of Key Findings.” Washington, DC: U.S. Department of Education, National Center for Education Evaluation and Regional Assistance, 2007.
Kim, Jae-On, and Charles W. Mueller. Factor Analysis: Statistical Methods and Practical Issues. Beverly Hills, CA: Sage Publications, 1978.
Kling, J., J. Liebman, and L. Katz. “Experimental Analysis of Neighborhood Effects.” Econometrica, vol. 75, no. 1, 2007, pp. 83–119.
Kramer, C.Y. “Extension of Multiple Range Tests to Group Means with Unequal Numbers of Replications.” Biometrica, 12, 1956, pp. 307–10.
Larson, Nancy. Saxon Math. Austin, TX: Harcourt Achieve, 2004.
Larson, Nancy. Saxon Math. Orlando, FL: Harcourt Achieve Inc., 2008.
Larson, Nancy, and Margaret Heisserer. Saxon Math K–4: Teacher’s Resource Handbook. Orlando, FL: Harcourt Achieve, Inc., 2008.
Larson, Nancy and Saxon Publishers. Saxon Math 1 Lesson Sampler. Austin, TX: Harcourt Achieve, 2006.
Lord, F.M. Applications of Item Response Theory to Practical Testing Problems. Hillsdale, NJ: Lawrence Erlbaum Publishers, 1980.
Lynch, Sharon, and Carol O’Donnell. “Examining the Fidelity of Implementation of Highly Rated Middle School Science Curriculum Materials.” Paper presented at the Annual Meeting of the American Educational Research Association, Montreal, Canada, April 2005.
MacKinnon, D., and J. Dwyer. “Estimating Mediated Effects in Prevention Studies.” Evaluation Review, 17, 1993, pp. 141–158.
National Assessment Governing Board. Mathematics Framework for the 1996 National Assessment of Educational Progress. Washington, DC: Government Printing Office, 1996.
National Center for Education Statistics (NCES). The Nation’s Report Card: Mathematics 2009. Publication No. NCES-2010-451. Washington, DC: Institute of Education Sciences, U.S. Department of Education, 2009.
National Council of Teachers of Mathematics (NCTM). Curriculum Focal Points for Prekindergarten Through Grade 8 Mathematics: A Quest for Coherence. Reston, VA: NCTM, 2006.
National Mathematics Advisory Panel. Foundations for Success: The Final Report of the National Mathematics Advisory Panel. Washington, DC: U.S. Department of Education, 2008a.

106
National Mathematics Advisory Panel. Foundations for Success: Reports of the Task Groups and Subcommittees of the National Mathematics Advisory Panel. Washington, DC: U.S. Department of Education, 2008b.
National Research Council. On Evaluating Curricular Effectiveness: Judging the Quality of K–12 Mathematics Evaluations. Washington, DC: National Academies Press, 2004.
Padron, Y.N., and H.C. Waxman. “Classroom Observations of the Five Standards of Effective Teaching in Urban Classrooms with ELLs.” Teaching and Change, vol. 7, no. 1, 1999, pp. 79–100.
Pianta, Robert C., Karen M. LaParo, and Bridget K. Hamre. Classroom Assessment Scoring System: K–3 Version. Charlottesville, VA: Center for Advanced Study of Teaching and Learning, 2006.
Pollack, J., S. Atkins-Burnett, D. Rock, and M. Weiss. “Early Childhood Longitudinal Study—Kindergarten Class of 1998–99 (ECLS-K), Psychometric Report for the Third Grade.” Publication No. NCES 2005–062. Washington, DC: U.S. Department of Education, National Center for Education Statistics, 2005.
Rathburn, A., and J. West. From Kindergarten Through Third Grade: Children’s Beginning School Experiences. Publication no. NCES-2004-007. U.S. Department of Education, National Center for Education Statistics. Washington, DC: U.S. Government Printing Office, 2004.
Raudenbush, Stephen W. Hierarchical Linear Models: Applications and Data Analysis Methods. Newbury Park, CA: Sage Publications, 2002.
Resnick, Robert M., Glenn Sanislo, and Stephanie Oda. The Complete K–12 Report: Market Facts and Segment Analyses. Rockaway Park, NY: Education Market Research, 2010.
Rock, Donald A., and Judith M. Pollack. “Early Childhood Longitudinal Study—Kindergarten Class of 1998-99 (ECLS-K), Psychometric Report for Kindergarten Though First Grade.” Publication No. NCES 2002-05. Washington, DC: U.S. Department of Education, National Center for Education Statistics, 2002.
Russell, Susan J., Karen Economopoulos, Megan Murray, Jan Mokros, and Anne Goodrow. Implementing the Investigations in Number, Data, and Space Curriculum: Grades K, 1, and 2. Glenview IL: Pearson Scott Foresman, 2004.
Saville, D.J. “Multiple Comparison Procedures: The Practical Solution.” The American Statistician, vol. 44, 1990, pp. 174–180.
Schochet, Peter Z. “Do Typical RCTs of Education Interventions Have Sufficient Statistical Power for Linking Impacts on Teacher Practice and Student Achievement Outcomes?” Washington, DC: National Center for Education Evaluation and Regional Assistance, Institute of Education Sciences, U.S. Department of Education, October 2009.

107
Sobel, M. “Identification of Causal Parameters in Randomized Studies with Mediating Variables.” Journal of Educational and Behavioral Statistics, vol. 33, no. 2, 2008, 230–251.
Stein, M.K., J. Remillard, and M.S. Smith. “How Curriculum Influences Student Learning.” In. Second Handbook of Research on Mathematics Teaching and Learning, edited by F. K. Lester, Jr. (vol. 1, pp. 319–369). New York: Information Age Publishing, 2007.
Tukey, J.W. “Allowances for Various Types of Error Rates.” Unpublished Institute of Mathematical Statistics address, Chicago, 1952.
Tukey, J.W. “The Problem of Multiple Comparisons.” Unpublished manuscript, 1953.
Waxman, Hersh C., Roland G. Tharp, and R. Soleste Hilberg (eds.). Observational Research in U.S. Classrooms: New Approaches for Understanding Cultural and Linguistic Diversity. Cambridge, UK: Cambridge University Press, 2004.
West, Jerry, Kristin Denton, and Elvira Germino-Hausken. America’s Kindergartners. Publication No. NCES 2000-070. Washington, DC: U.S. Department of Education, National Center for Education Statistics, 2000.
Westfall, P.H., R. Tobias, D. Rom, R. Wolfinger, and Y. Hochberg. Multiple Comparisons and Multiple Tests Using SAS. Cary, NC: SAS Institute, Inc., 1999.
Wittenberg, Lucy, K. Economopoulos, V. Bastable, K.H. Bloomfield, K. Cochran, D. Earnest, A. Hollister, N. Horowitz, E. Leidl, M. Murray, Y. Oh, B.W. Perry, S.J. Russell, D. Schifter, and K. Sillman. Investigations in Number, Data, and Space. 2nd ed. Glenview, IL: Pearson Scott Foresman, 2008a.
Wittenberg, Lucy, K. Economopoulos, V. Bastable, K.H. Bloomfield, K. Cochran, D. Earnest, A. Hollister, N. Horowitz, E. Leidl, M. Murray, Y. Oh, B.W. Perry, S.J. Russell, D. Schifter, and K. Sillman. Implementing Investigations in Grade 1. Glenview, IL: Pearson Education, Inc, 2008b.
Wittenberg, Lucy, K. Economopoulos, V. Bastable, K.H. Bloomfield, K. Cochran, D. Earnest, A. Hollister, N. Horowitz, E. Leidl, M. Murray, B.W. Perry, S.J. Russell, D. Schifter, K. Sillman, and Y. Oh. Implementing Investigations in Grade 2. Glenview, IL: Pearson Education, Inc, 2008c.
Woodward, J., and J. Baxter. “The Effects of an Innovative Approach to Mathematics on Academically Low-Achieving Students in Inclusive Settings.” Exceptional Children, vol. 63 no. 3, 1997, pp. 373–388.
Wooldridge, J. Econometric Analysis of Cross Section and Panel Data. Boston: MIT Press, 2002.

This page intentionally left blank for double-sided copying.

APPENDIX A
SCHOOL RANDOM ASSIGNMENT, DATA COLLECTION, AND RESPONSE RATES
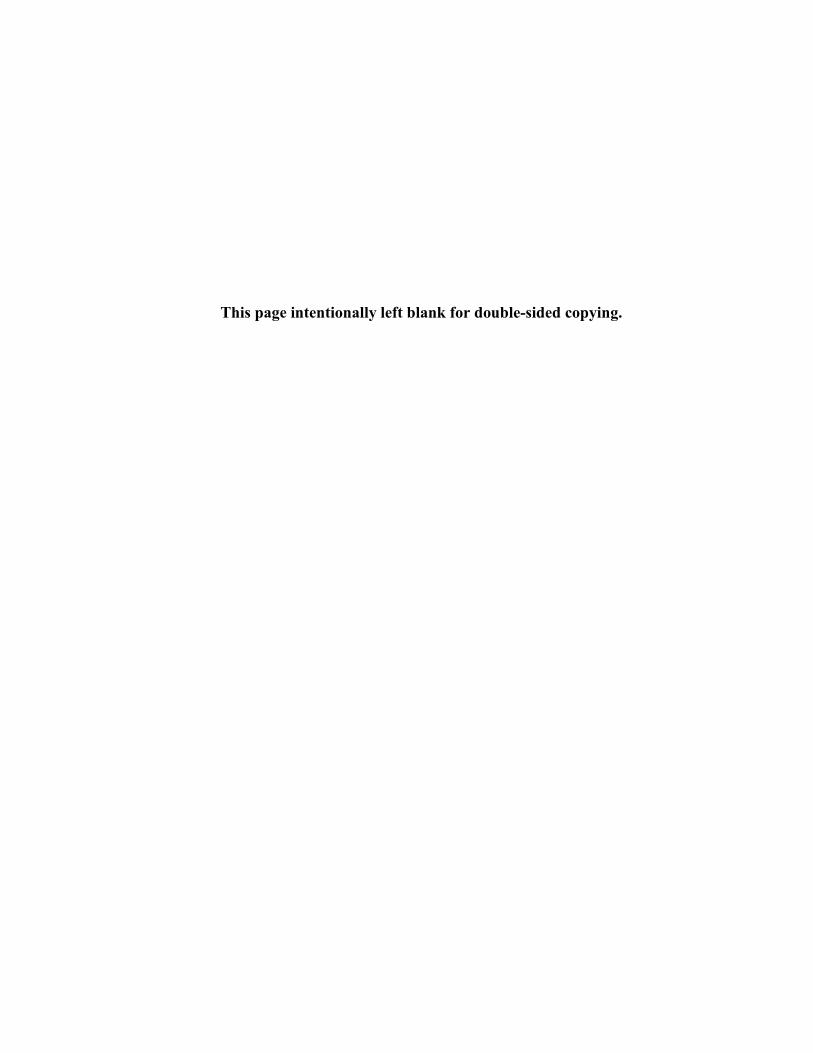
This page intentionally left blank for double-sided copying.

A.3
This appendix provides details about the random assignment of curricula to schools, the enrollment of teachers in the study, and school and teacher participation. It also provides information about data collection activities and response rates. The data collection instruments can be found in the study’s design report (Agodini et al. 2008).
A. OVERVIEW OF SCHOOL RANDOM ASSIGNMENT AND TEACHER ENROLLMENT
A total of 111 schools from 12 districts began study participation in either the 2006–2007 or 2007–2008 school year. Forty schools from 4 districts (cohort one) entered the study during the 2006–2007 school year, when curriculum implementation occurred only in the first grade. An additional 71 schools from 8 other districts (cohort two) began participating during the 2007–2008 school year, when curricula were implemented in both the first and second grades except in one school, in which curriculum implementation occurred only in the second grade. 1. Random Assignment of Curricula to Schools
As described in Chapter I, a randomized controlled trial was established in each district involving all four of the curricula being studied. In particular, a blocked random assignment procedure was used to randomly assign schools within each district to one of the four curricula.
To illustrate the idea behind the blocked random assignment procedure, consider a district
with eight schools. Suppose that the only difference between the schools is the number of first-grade students, where four schools have a small number of first graders and the other four have a large number. In this case, the blocked random assignment procedure creates two blocks, with the first containing the four small schools and the second containing the four large schools. The four curricula are then randomly assigned (without replacement) to the four schools in each block. As a result, each curriculum has the same sample size and characteristics.
The study team used a more complex procedure because several school characteristics were
used to create the blocks and the number of schools in some districts was not a multiple of four. Blocking variables included first- and second-grade student enrollment; the percentage of students eligible for free or reduced-price meals; math proficiency; the percentage of white students in the school; and the percentage of Hispanic students in the school. These data were obtained from publicly available sources such as the Common Core of Data (CCD), GreatSchools.net, and SchoolMatters.com.
In addition, any special conditions within a district were also taken into account when
placing the schools into blocks. In one districts with 12 schools, for example, the district indicated that 4 groups of 3 schools each fed into the district’s four middle schools. It was important to the district that all students feeding into the same middle school use the same curriculum in the early grades. In this district, then, the same curriculum was assigned to all schools in each feeder group. In another 12-school district, it contained 4 magnet schools; the 4 magnets were grouped into one block, so that each was assigned to one of the four curricula. Finally, in the district that contained 17 schools, 4 of them were on a year-round schedule. They were placed into one block so that each was assigned to one of the four curricula.

A.4
To understand the random assignment process used for districts containing a number of schools that was not a multiple of four, consider two districts with 6 schools each. To provide each curriculum with the same number of schools, the districts were treated together, with three schools out of the total of 12 assigned to each curriculum. Agodini et al. (2008) provides more details about the blocked random assignment procedure. 2. Enrollment of Teachers
The process of enrolling teachers began with the study team requesting lists from districts or schools of any teachers at the target grade levels that taught math to students. Informational packets were sent to those teachers. The packets included both a letter describing the purpose of the study and outlining the study’s data collection activities and an agreement form asking teachers to acknowledge that they understood the data collection requirements, agreed to participate in the curriculum training provided by the publishers, and would use the curriculum assigned to their school.
In 110 of the 111 schools that were randomly assigned, all first-grade teachers enrolled in
the study.75
This included all 40 cohort-one schools, in which curriculum implementation occurred only in the first grade, and 70 of the 71 cohort-two schools, in which curriculum implementation occurred in both the first and second grades.
All second-grade teachers in the 71 cohort-two schools enrolled in the study. There were no second-grade classrooms in cohort one during their first year of study participation. B. SCHOOL AND TEACHER PARTICIPATION
Table A.1 shows the number of participating schools and classrooms by grade and curriculum. Figure A.1 shows the flow of districts and schools through the study for the first-grade sample, and Figure A.2 shows the same information for the second-grade sample.
As Table A.1 shows, the fall first-grade sample includes 110 schools and 466 classrooms
(40 schools with 134 classrooms from cohort one, and 70 schools with 332 classrooms from cohort two). One cohort-one school with 3 classrooms assigned to Math Expressions withdrew from the study and no follow-up data were collected. Therefore, follow-up data for the first-grade sample were collected in 109 schools with 463 classrooms, and these schools and classrooms serve as the basis for the first-grade analysis.76
75 Three special education classes did not participate in the study because their students were not eligible for testing.
76 Of the 463 first-grade classrooms in which baseline and follow-up data were collected, 2 classrooms did not contain a sufficient number of students to calculate two classroom measures—variance and skewness of the fall math score—included in the HLM described in Chapter III used to calculate the relative effects of the curricula on student achievement.

A.5
TABLE A.1
PARTICIPATING SCHOOLS AND CLASSROOMS BY CURRICULUM
First Grade Second Grade
Schools Classrooms Schools Classrooms
Curriculum Fall Spring Fall Spring Fall Spring Fall Spring
All Curricula 110 109 466 463 71 71 330 330
Investigations 28 28 113 113 18 18 83 83
Math Expressions 27 26 123 120 17 17 80 80
Saxon 26 26 113 113 18 18 92 92
SFAW 29 29 117 117 18 18 75 75
As Table A.2 shows, the second-grade sample includes all 71 schools and 330 classrooms from cohort two.77
None of the second-grade classrooms from the cohort-two schools dropped from the study.
Within each grade, analyses were conducted on both a longitudinal sample and a cross-sectional sample. The longitudinal sample, the focus of this report, includes students who were tested in both fall and spring of their first year of study participation. The cross-sectional sample includes all students tested in the spring, regardless of whether they were tested in the fall. This includes students in the longitudinal sample as well as “new arrivers”—those who enrolled at a school between the two testings and who were tested in the spring. See Appendix D for results of impact analyses on the cross-sectional sample. C. DATA COLLECTION ACTIVITIES AND RESPONSE RATES
Data were collected at the classroom, teacher, and student level. Teacher data included scores on the assessment of math content and pedagogical knowledge as well as survey data on teacher background characteristics and teaching practices. At the classroom level, data were collected from class rosters and the study team’s observations. At the student level, data were collected from the math tests administered by the study team and demographic information obtained from school records. Below we provide more information about these data collection activities and response rates—Appendix D describes how these data were used to construct analysis files and weights that account for sampling and nonresponse.
77 Of the 330 second-grade classrooms in which baseline and follow-up data were collected, 2 classrooms did not contain a sufficient number of students to calculate two classroom measures—variance and skewness of the fall math score—included in the HLM described in Chapter III used to calculate the relative effects of the curricula on student achievement.

A.6
FIGURE A.1
FIRST-GRADE SAMPLE: FLOW OF DISTRICTS AND SCHOOLS THROUGH THE STUDY
(Sample Includes Both Cohorts One and Two)
Districts Participating in the Study (N = 12)
Schools Enrolled in the Study (N = 110)
District 1: N = 11 District 2: N = 8
District 3: N = 17 District 4: N = 4 District 5: N = 5
District 6: N = 12 District 7: N = 8
District 8: N = 12 District 9: N = 4
District 10: N = 11 District 11: N = 12 District 12: N = 6
Schools Assigned
to Investigations (N = 28)
District 1: N = 2 District 2: N = 2 District 3: N = 5 District 4: N = 1 District 5: N = 1 District 6: N = 3 District 7: N = 2 District 8: N = 3 District 9: N = 1
District 10: N = 3 District 11: N = 3 District 12: N = 2
Schools Assigned to Math Expressions
(N = 26) District 1: N = 2 District 2: N = 1 District 3: N = 4 District 4: N = 1 District 5: N = 1 District 6: N = 3 District 7: N = 2 District 8: N = 3 District 9: N = 1
District 10: N = 3 District 11: N = 3 District 12: N = 2
Schools Assigned to Saxon (N = 26)
District 1: N = 4 District 2: N = 2 District 3: N = 4 District 4: N = 1 District 5: N = 1 District 6: N = 3 District 7: N = 2 District 8: N = 2 District 9: N = 1
District 10: N = 2 District 11: N = 3 District 12: N = 1
Schools Assigned to SFAW (N = 29)
District 1: N = 3 District 2: N = 2 District 3: N = 4 District 4: N = 1 District 5: N = 2 District 6: N = 3 District 7: N = 2 District 8: N = 4 District 9: N = 1
District 10: N = 3 District 11: N = 3 District 12: N = 1
Stopped Implementing Curriculuma
(N = 1) District 2: N = 1
a One school stopped implementing the assigned curriculum during the school year and did not permit follow-up data collection.
A.7
FIGURE A.2
SECOND-GRADE SAMPLE: FLOW OF DISTRICTS AND SCHOOLS THROUGH THE STUDY (Sample Includes Only Cohort Two)
Districts Participating in the Study (N = 8)
Schools Enrolled in the Study (N=71)
District 1: N = 11 District 3: N = 17 District 4: N = 4 District 5: N = 5
District 6: N = 12 District 9: N = 4
District 10: N = 11 District 12: N = 7
Schools Assigned to
Investigations (N = 18)
District 1: N = 2 District 3: N = 5 District 4: N = 1 District 5: N = 1 District 6: N = 3 District 9: N = 1
District 10: N = 3 District 12: N = 2
Schools Assigned to
Math Expressions (N = 17)
District 1: N = 2 District 3: N = 4 District 4: N = 1 District 5: N = 1 District 6: N = 3 District 9: N = 1
District 10: N = 3 District 12: N = 2
Schools Assigned to
Saxon (N = 18)
District 1: N = 4 District 3: N = 4 District 4: N = 1 District 5: N = 1 District 6: N = 3 District 9: N = 1
District 10: N = 2 District 12: N = 2
Schools Assigned to
SFAW (N = 18)
District 1: N = 3 District 3: N = 4 District 4: N = 1 District 5: N = 2 District 6: N = 3 District 9: N = 1
District 10: N = 3 District 12: N = 1
A.8
1. Teacher Training and Math Knowledge Assessment
In the summer prior to the school year, publishers provided initial training on the assigned curriculum to teachers. In many districts, publishers scheduled more than one training session for each curriculum to accommodate the large number of teachers involved. For those teachers unable to attend the scheduled training sessions, publishers often scheduled make-up sessions just before or just after the first day of school.
A total of 78 initial training sessions were held for first- and second-grade teachers—20
such sessions for the first-grade teachers in cohort one and 58 for the first- and second-grade teachers in cohort two. First- and second-grade teachers in the cohort-two schools were trained together, except for those assigned to Investigations, who were trained separately.
Prior to receiving any training, teachers were asked to complete an assessment designed to
measure math content and pedagogical knowledge. The assessment was voluntary and administered by study team members at the beginning of training sessions. Assessments were completed by 96 percent of first-grade teachers and 95 percent of second-grade teachers (Table A.2). The response rates for the curriculum groups ranged from 93 to 98 percent at the first-grade level and from 94 to 95 percent at the second-grade level.78
2. Teacher Surveys
Fall Survey. In late October through early November, a questionnaire was mailed to all teachers at the target grade levels in each school. Items addressed the teacher’s background, curriculum training, prior professional development in math, approaches to teaching, and the school’s instructional climate. Local field staff conducted weekly, in-person followups with teachers at the schools and had copies of the survey on hand to give to anyone requesting one. A second mailing was sent to the teacher’s home address if a response was not received by December. Fall surveys were received from 99 percent of first-grade teachers and 97 percent of second-grade teachers (Table A.2). The response rates for the curriculum groups ranged from 97 to 100 percent at the first-grade level and from 95 to 99 percent at the second-grade level.
Spring Survey. In late March through early April, a follow-up questionnaire was mailed to all teachers at the target grade levels in each school. Items on the spring survey addressed the number and content of math lessons covered to date, teacher pedagogy, and frequency of math activities. The spring survey also included an item that indicated the frequency with which teachers used curriculum-specific materials and activities in their math class. As with the fall
78 The number of classrooms presented in Table A.2 differs slightly from the number of classrooms in Table
A.1 because, as described earlier, two first-grade and two second-grade classrooms initially included in the study did not contain a sufficient number of students to calculate two classroom measures—variance and skewness of the fall math score—included in the HLM described in Chapter III used to calculate the relative effects of the curricula on student achievement. Teacher assessments and surveys were not recorded for teachers in those classrooms since students in those classrooms were not in either the longitudinal or cross-sectional analysis samples.

A.9
TABLE A.2
NUMBER AND PERCENTAGE OF TEACHERS COMPLETING THE MATH KNOWLEDGE ASSESSMENT AND FALL AND SPRING SURVEYS, BY GRADE AND CURRICULUM
Teachers Completing
Teacher Knowledge Assessment
Fall Teacher Survey
Spring Teacher Survey
Curriculum Classroomsa Number Percentage Number Percentage Classroomsa Number Percentage
First-Grade Teachers
All Curricula 461 442 96% 454 99% 468 432 92%
Investigations 113 108 96% 113 100% 118 112 95%
Math Expressions 119 116 98% 115 97% 122 106 87%
Saxon 113 105 93% 111 98% 112 107 96%
SFAW 116 113 97% 115 99% 116 107 92%
Second-Grade Teachers
All Curricula 328 310 95% 319 97% 335 296 88%
Investigations 81 77 95% 79 98% 84 77 92%
Math Expressions 80 76 95% 76 95% 83 75 90%
Saxon 92 86 94% 90 98% 92 82 89%
SFAW 75 71 95% 74 99% 76 62 82% aFirst-grade response rates for the teacher knowledge assessment and the fall survey are based on the 461 classrooms that began the study in the fall; response rates for the spring survey are based on the 468 classrooms in the study in the spring. Second-grade response rates for the teacher knowledge assessment and the fall survey are based on the 328 classrooms that began the study in the fall; response rates for the spring survey are based on the 335 classrooms in the study in the spring.

A.10
survey, local field staff conducted weekly, in-person followups with teachers throughout the remainder of the school year and distributed additional copies of the survey to any teacher requesting one. A second mailing was sent to teachers at their homes at the end of the school year. Spring surveys were received from 92 percent of first-grade teachers and 88 percent of second-grade teachers (Table A.2). The response rates for the curriculum groups ranged from 87 to 96 percent at the first-grade level and from 82 to 92 percent at the second-grade level.79
3. Classroom Observations
Members of the study team were trained to use a classroom observation protocol that captures elements of teacher instruction, student behavior, student-teacher interactions, and classroom activities related to math instruction. Observers were trained to use the protocol by watching multiple classroom videos and coding these behaviors, interactions, and activities. After coding each video, a master coder led a group discussion of the results to bring observers to a consensus on how to code each item. The protocol also included curriculum-specific items that examined teachers’ level of adherence to their assigned curricula. Observers were required to pass a certification test on the entire protocol prior to conducting observations in the field. To become certified, an observer had to code within one category of the master observer on 85 percent of the items in the protocol.
When the observations took place, all math instruction throughout the day was observed,
including any morning meeting or calendar time, the math lesson, and any subsequent math instruction, such as drills or activity at math centers. Observers worked with teachers to schedule observations and asked teachers to identify all points in time during the observation day when students were involved in math instruction. The observers then entered and exited the class as needed so that they could be on hand at all times math instruction took place. In some classrooms, observers were in the classroom for a single block of time; in others, they were in and out of the classroom numerous times throughout the day.
Table A.3 shows the number of classrooms sampled and observed by grade and curriculum.
For first-grade classrooms, all observations took place in the spring (March–April). In cohort-one schools, attempts were made to observe all classrooms. In cohort-two schools, attempts were made to observe all English-speaking classrooms in schools with four or fewer classrooms. In cohort-two schools with more than four English-speaking classrooms, four were randomly sampled for observation. This sampling was conducted in order to keep the average number of observations per school consistent between cohorts one and two. In cohort-two schools, attempts were also made to observe all Spanish-speaking classrooms. In total, observations were conducted in 364 of the sampled 381 first-grade classrooms, for a response rate of 96 percent that ranged from 90 to 99 percent across the curriculum groups.
79 The number of classrooms varied from fall to spring because, after the fall testing, several classes that had
been large in the fall were split into two classrooms with two different teachers.
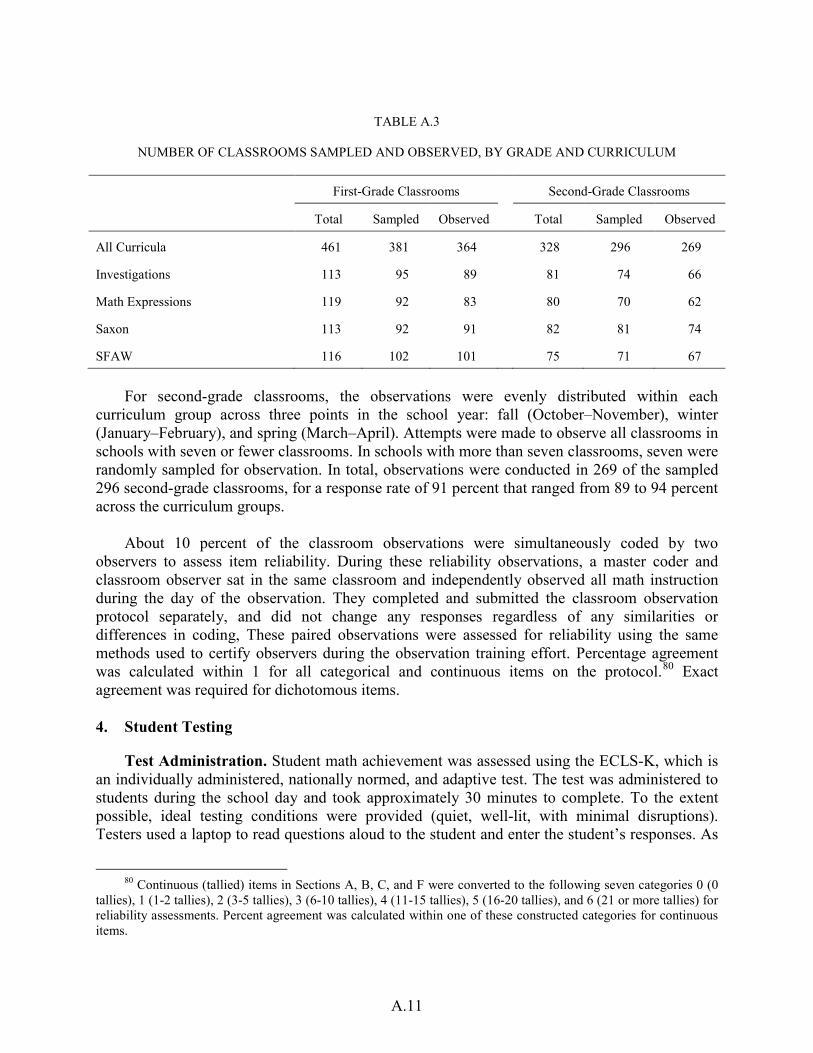
A.11
TABLE A.3
NUMBER OF CLASSROOMS SAMPLED AND OBSERVED, BY GRADE AND CURRICULUM
First-Grade Classrooms Second-Grade Classrooms
Total Sampled Observed Total Sampled Observed
All Curricula 461 381 364 328 296 269
Investigations 113 95 89 81 74 66
Math Expressions 119 92 83 80 70 62
Saxon 113 92 91 82 81 74
SFAW 116 102 101 75 71 67
For second-grade classrooms, the observations were evenly distributed within each
curriculum group across three points in the school year: fall (October–November), winter (January–February), and spring (March–April). Attempts were made to observe all classrooms in schools with seven or fewer classrooms. In schools with more than seven classrooms, seven were randomly sampled for observation. In total, observations were conducted in 269 of the sampled 296 second-grade classrooms, for a response rate of 91 percent that ranged from 89 to 94 percent across the curriculum groups.
About 10 percent of the classroom observations were simultaneously coded by two
observers to assess item reliability. During these reliability observations, a master coder and classroom observer sat in the same classroom and independently observed all math instruction during the day of the observation. They completed and submitted the classroom observation protocol separately, and did not change any responses regardless of any similarities or differences in coding, These paired observations were assessed for reliability using the same methods used to certify observers during the observation training effort. Percentage agreement was calculated within 1 for all categorical and continuous items on the protocol.80
Exact agreement was required for dichotomous items.
4. Student Testing
Test Administration. Student math achievement was assessed using the ECLS-K, which is an individually administered, nationally normed, and adaptive test. The test was administered to students during the school day and took approximately 30 minutes to complete. To the extent possible, ideal testing conditions were provided (quiet, well-lit, with minimal disruptions). Testers used a laptop to read questions aloud to the student and enter the student’s responses. As
80 Continuous (tallied) items in Sections A, B, C, and F were converted to the following seven categories 0 (0
tallies), 1 (1-2 tallies), 2 (3-5 tallies), 3 (6-10 tallies), 4 (11-15 tallies), 5 (16-20 tallies), and 6 (21 or more tallies) for reliability assessments. Percent agreement was calculated within one of these constructed categories for continuous items.
A.12
the questions were read, the student looked at a desk-top easel that contained a separate page for each item. Each page included pictures and other information to help the student answer the question. The ECLS-K begins with a routing section that is administered to all students. The routing section is designed to assess a student’s achievement level and to direct the child to the most appropriate test level (easy, middle-difficulty, or hard). As the tester entered a student’s responses to the routing section, the computer’s test program tracked the number of correct and incorrect responses and automatically directed students to the appropriate level math assessment, thus eliminating the possibility of field tester scoring errors.
The ECLS-K K–1 math assessment was administered to first graders. An ECLS-K math assessment for the second grade did not exist, so Mathematica worked with the developer of the ECLS-K, Educational Testing Service (ETS), to select appropriate items from existing ECLS-K math assessments (including the K–1, third-, and fifth-grade instruments). ETS used information from the ECLS-K bridge study,81
which included a small sample of second graders, combined with information about this current study’s sample, to assure that the administered items would appropriately target the estimated range of ability levels of second graders in this study. This study has a relatively high proportion of low SES children, and test results for this study’s fall 2006 first-grade sample showed mean math ability slightly below the national ECLS-K fall first graders, by about 1/8 of a standard deviation. The selection of items included in the second grade test accounted for these factors. The study also used a Spanish version of the assessment for any classes where math instruction was conducted entirely in Spanish.
ETS conducted reliability tests and found the raw score reliabilities for the second grade routing section met criteria (α ≥ .78). 82
The reliability of the theta for the third grade test is 0.94; a high reliability in previous administrations combined with the raw score for the second grade routing suggests that the reliability is also high for the second grade form. Consistent with the ECLS-K, we found no differential item functioning (DIF) by gender on any of the second grade items. In the ECLS-K study, evidence of concurrent validity was obtained with the Mini-Battery of Achievement (MBA) (r = 0.84, grade 3) and with teacher reports of students’ mathematics ability (r = 0.61 and 0.59 at grades 1 and 3, respectively).
The tests were administered by the study’s field testers, who attended a four-day training on the process for sampling students and actual testing. Field staff members were required to pass certification tests in field sampling and assessment prior to the fall testing effort, and only certified assessors were used to collect data. Testing staff also received refresher training before the spring testing effort. Bilingual field staff were trained to administer the test in Spanish for the 35 classrooms in which math instruction was conducted entirely in Spanish.83
81 The ECLS-K bridge study was conducted to ensure that item overlap between the ECLS-K, K-1 and ECLS-
K third-grade items was adequate to place student achievement in a longitudinal scale (Pollack et al. 2005).
82 Additional information on reliability and validity of the ECLS-K assessment items are found in the K-1 and third-grade psychometric reports: Rock and Pollack (2002) and Pollack et al. (2005).
83 The ECLS-K Spanish assessment was administered to 328 students in the fall (204 first graders and 124 second graders) and 256 students in the spring (141 first graders and 115 second graders).

A.13
Student Sampling. Class rosters were collected in the fall from each participating
classroom. Prior to student testing, trained field staff reviewed the rosters with teachers to confirm that all students enrolled in the class were listed on the roster and to delete from the roster the names of any students no longer enrolled. The rosters were also reviewed with teachers to identify students with language or other barriers (including physical and cognitive ones) that would make them ineligible for testing.
Using the updated rosters, field staff implemented a random selection algorithm to
determine which eligible students in each classroom would be selected for testing. Student sampling was conducted separately for each classroom using a unique sampling matrix with a table of random numbers aligned to the class size.
Classroom matrices were developed to sample an average of 11 students per classroom,
under the assumption that fall and spring tests could be administered to an average of 10 students per classroom. Given the number of schools and classrooms involved in the study, the statistical power benefits of testing more than 10 students per classroom are minimal, though the costs would have been significant because the student assessment is individually administered.
To meet our goal of testing an average of 10 students per classroom in both fall and spring,
the following rules were used to develop the classroom sampling matrices: • If a school had only one classroom at the first- or second-grade level, the matrix
selected all eligible students in the classroom.
• If a school had two classrooms at a target grade level, up to 16 students per classroom were selected.
• If a school had three or more classrooms at a target grade level, up to 11 students per classroom were selected.
These sampling rates were used for districts that allowed passive parental consent. For the two districts that required active parental consent, sampling rates were higher to ensure that we could meet our goal of testing an average of 10 students per classroom in both fall and spring.
Class rosters were collected again in the spring to identify any new arrivers who had
enrolled in classrooms after fall testing. New arrivers who were eligible for testing were added to the sample for spring testing.

A.14
Obtaining Consent. Parental consent was not a factor in determining whether or not a student could be sampled for testing. As a result, some students were selected for testing who were ultimately not tested due to parental refusal to permit the testing.
In the fall, consent packets were distributed to parents of all students in participating classrooms. The packet included a letter and brochure describing the study and a consent form requesting permission to test the child and collect demographic data. Ten districts required passive consent, meaning a signed form had to be returned only if a parent refused permission for participation. The other two districts required active consent, meaning parents had to return signed permission forms indicating their consent or refusal to their child’s participation. Parents were given at least one week to return forms to the school before testing began.
In the spring, consent packets were distributed to the parents of new arrivers. In addition,
consent packets were sent out again to any parent who had not returned the form in the fall. Response Rates. Table A.4 presents response rates based on the full set of eligible and
sampled students and indicates the overall success of the testing effort. The table shows eligible students’ consent and testing status during both fall and spring testing and provides consent and testing data separately for new arrivers.
For the fall testing, response rates of 92 percent and 90 percent were achieved for the first- and second-grade samples, respectively. Parent refusals accounted for approximately two-thirds of student nonresponse in the fall among both first and second graders. These refusals did not differ by more than 3 percentage points across the curriculum groups. If we consider the response rate among consenting students, 97 percent of first and second graders were tested in the fall (derived from Table A.4).
For the spring follow-up testing, 84 to 88 percent of students were tested in both the first-
and second-grade samples. This response rate includes the rates for both students sampled in the fall and new arrivers. Among students sampled in the fall, most spring nonresponse was due to students moving out of the study school subsequent to the fall assessment. In addition, follow-up data could not be collected for 32 students in the first-grade sample whose school withdrew from the study. A few students sampled in the fall and still enrolled in a study school changed to a grade where the study’s curricula were not implemented, and thus were not tested. If we consider students who were sampled in the fall, provided consent, and were still in a study school in the spring, the spring testing response rate was 98 percent for both first and second graders (derived from Table A.4).
Table A.5 presents condensed information on response rates by curriculum. Student
response rates at baseline were similar across curricula, ranging from 91 to 93 percent for first graders and 88 to 94 percent for second graders. Response rates for the spring testing among students who had been sampled in the fall were also similar across the curricula, ranging from 82 to 86 percent across both grades. Among new arrivers, spring response rates were similar for first graders—ranging from 86 to 91 percent—but varied more widely—from 78 to 93 percent—among second graders.
Figures A.3 and A.4 summarize the flow of students through the study.

A.15
TABLE A.4
NUMBER AND PERCENTAGE OF SAMPLED STUDENTS TESTED AND TYPES OF NONRESPONSE
Number
of Sampled Students
Number of
Students Tested
Percentage of
Students Tested
Number of Students
with Parent Refusals
Number of Students
from Withdrawn
School
Number of
Students Who
Moved
Number of Students
Who Changed
Grade
Number of Students
with Other Nonresponse
First-Grade Students
Fall Initial Sample 5,652 5,193 92 318 — — — 141
Spring Initial Sample 5,652 4,797 85 284 32 435 13 91
Spring New Arrivers 705 622 88 48 — — — 35
Second-Grade Students
Fall Initial Sample 4,060 3,673 90 283 — — — 104
Spring Initial Sample 4,060 3,395 84 263 — 329 3 70
Spring New Arrivers 552 475 86 26 — — — 51
TABLE A.5
NUMBER AND PERCENTAGE OF BASELINE STUDENTS AND NEW ARRIVERS SAMPLED FOR TESTING, BY ROUND OF TESTING AND CURRICULUM
Students Sampled at Baseline Students Added As New Arrivers
in Spring
Tested in Fall Tested in Spring Tested in Spring
Total Number Percentage Number Percentage Total Number Percentage
First-Grade Students
All Curricula 5,652 5,193 92 4,797 85 705 622 88
Investigations 1,349 1,239 92 1,149 85 167 143 86
Math Expressions 1,476 1,348 91 1,235 84 171 156 91
Saxon 1,338 1,226 92 1,130 84 162 143 88
SFAW 1,489 1,380 93 1,283 86 205 180 88
Second-Grade Students
All Curricula 4,060 3,673 90 3,395 84 552 475 86
Investigations 1,018 895 88 832 82 174 135 78
Math Expressions 995 906 91 833 84 114 97 85
Saxon 1,057 990 94 908 86 115 107 93
SFAW 990 882 89 822 83 149 136 91

A.16
FIGURE A.3
FLOW OF STUDENTS THROUGH THE STUDY: FIRST-GRADE SAMPLE
Students Eligible and Sampled at Baseline
(N = 5,652)
Consenting Students (N = 5,334)
Nonconsenting Students (N = 318)
Students Tested at Baseline (N = 5,193)
Students Tested at Follow-Up (N = 5,419)
Baseline Sample = 4,797 New Arrivers = 622
New Arrivers (N = 705)
Consenting Students (N = 657)
Nonconsenting Students (N = 48)
Students Not Tested (N = 606)
Nonresponse = 126 School Withdrew = 32b
Moved = 435 Changed Grade = 13
Students Eligible, Sampled, and Consenting at Follow-Up
(N = 6,025) a
Students Not Tested Due to Nonresponse
(N = 141)
aDoes not sum to number of consenting students at baseline plus the number of consenting new arrivers because 34 students who were present but not eligible at baseline became eligible at follow-up.
bOne school withdrew from the study during the school year and did not permit follow-up testing.

A.17
FIGURE A.4
FLOW OF STUDENTS THROUGH THE STUDY: SECOND-GRADE SAMPLE
Students Eligible and Sampled at Baseline
(N = 4,060)
Consenting Students (N = 3,777)
Nonconsenting Students (N = 283)
Students Tested at Baseline (N = 3,673)
Students Not Tested Due to Nonresponse
(N = 104)
Students Tested at Follow-Up (N = 3,870)
Baseline Sample = 3,395 New Arrivers = 475
New Arrivers (N = 552)
Consenting Students (N = 526)
Nonconsenting Students (N = 26)
Students Not Tested (N = 453)
Nonresponse = 121 Moved = 329
Changed Grade = 3
Students Eligible, Sampled, and Consenting at Follow-Up
(N = 4,323) a
a Does not sum to number of consenting students at baseline plus the number of consenting new arrivers because 20 students who were present but not eligible at baseline became eligible at follow-up.

A.18
Response Rates for the Longitudinal and Cross-sectional Samples. Table A.6 focuses on the response rates for students included in the longitudinal analysis sample that was the basis for the results in Chapter III. As the table shows, 83 percent of first graders who were sampled for testing in the fall were tested in both fall and spring, and this ranged from 82 to 85 percent across the curriculum groups. Similarly, 82 percent of second graders sampled for testing in the fall were tested in both fall and spring, with a range of 80 to 85 percent across the curriculum groups.
TABLE A.6
TESTING RATE FOR THE LONGITUDINAL SAMPLES
Curriculum Students Sampled for Testing in Fall
Number Tested in Fall
Number Tested in Both Fall and
Spring
Percentage Tested in Both Fall and
Spring First-Grade Sample All Curricula 5,652 5,193 4,716 83 Investigations 1,349 1,239 1,127 84 Math Expressions 1,476 1,348 1,212 82 Saxon 1,338 1,226 1,108 83 SFAW 1,489 1,380 1,269 85 Second-Grade Sample All Curricula 4,060 3,673 3,344 82 Investigations 1,018 895 814 80 Math Expressions 995 906 824 83 Saxon 1,057 990 897 85 SFAW 990 882 809 82
Table A.7 presents response rates for students included in the spring cross-sectional analysis sample examined in Appendix D. Results based on this sample help us understand the effects of the curricula along a measure (achievement of all students in the spring) often used to judge school performance, such as the adequate yearly progress (AYP) measure of Title I of the No Child Left Behind Act.
The table provides the number of students sampled for testing in the spring, and the
percentage of students that completed the spring test. The results are presented separately for grades one and two. At each grade level, the results are presented separately for all students, for those sampled during the fall and still in a classroom in the spring (that is, longitudinal students), and new arrivers. All new arrivers were sampled for spring testing.
As the table shows, 92 and 90 percent of all first and second graders, respectively, who were
sampled for testing in the spring were tested at that time. Among first graders, the response rate

A.19
varied from 92 to 93 percent across the curriculum groups; among second graders it varied from 88 to 93 percent across the groups.84
TABLE A.7
TESTING RATE FOR THE SPRING CROSS-SECTIONAL SAMPLES
Students Sampled for Testing in Spring
All Longitudinal New Arrivers
Tested Tested Tested
Curriculum Total Number Percentage Total Number Percentage Total Number Percentage
First-Grade Cross-Sectional Sample
All Curricula 5,873 5,413 92 5,168 4,792 93 705 621 88
Investigations 1,408 1,290 92 1,241 1,148 93 167 142 85
Math Expressions 1,498 1,388 93 1,327 1,232 93 171 156 91
Saxon 1,379 1,270 92 1,217 1,127 93 162 143 88
SFAW 1,588 1,465 92 1,383 1,285 93 205 180 88
Second-Grade Cross-Sectional Sample
All Curricula 4,283 3,869 90 3,731 3,395 91 552 474 86
Investigations 1,107 970 88 933 836 90 174 134 77
Math Expressions 1,029 926 90 915 829 91 114 97 85
Saxon 1,086 1,015 93 971 908 94 115 107 93
SFAW 1,061 958 90 912 822 90 149 136 91
84 The cross-sectional samples contains 106 first graders and 48 second graders who were present in both the
fall and spring but were not included in the longitudinal analysis sample. This is due to (1) students in classrooms with too few students to be included in the analysis based on the longitudinal sample, as mentioned earlier, but those classrooms had enough students in the spring to be included in the cross-sectional analysis; (2) students who had not been eligible for testing in the fall but were eligible in the spring; and (3) students selected for testing in the fall but who could not be tested then but were tested in the spring. Finally, the cross-sectional sample sizes differ slightly from the numbers reflected in Figures A.3 and A.4 due to students moving into classrooms that were excluded from the cross-sectional analysis because their classroom did not have a sufficient number of students tested. As mentioned earlier, to support estimation of HLMs used to calculate the relative effects of the curricula on student achievement, the goal was to include classrooms with at least three students that were tested.

A.20
Timing of the Tests. Fall tests were administered in each school within four weeks of the first day of classes, and spring tests were administered one to six weeks before the end of the academic year. The goal was to administer the fall test as close to the beginning of the school year as possible and the spring test as close to the end of the school year as possible while keeping the average number of days between the fall and spring test comparable across the curriculum groups.
As Chapter III, Table III.1 showed, the fall test was administered an average of about 21 calendar days after the start of the school year for both first and second graders, and this timing was not significantly different across the curriculum groups. The spring test was administered an average of 237 calendar days after the fall test for both first and second graders. This average was not also significantly different across the curriculum groups.
Test Processing and Scoring. Cleaned electronic test files were sent to Educational Testing Service (ETS), a developer of the assessment, for item response theory (IRT) scoring. For further information, see the methodology report prepared by ETS and the National Center for Education Statistics (NCES) describing in detail the psychometric properties of the ECLS-K mathematics assessment. The report is available through NCES and is posted on their website (Rock and Pollack 2002). 5. Student Demographic Data
Student demographic data were requested from schools in late spring of each school year.85
The study team requested the following student demographic data for all students with parental consent: gender, date of birth, race/ethnicity, whether the student had limited English proficiency or was an English language learner (LEP/ELL), eligibility for free or reduced-price lunch, and whether the student had an individualized education plan (IEP) or received special services.
The study team obtained student records for 95 percent of first graders and 93 percent of second graders in the longitudinal sample (Table A.8). Data on student gender were also collected by testing staff and were available for 99 percent of students.
Item nonresponse varied, with eligibility for free or reduced-price meals having the highest nonresponse rate, followed by being the recipient of an IEP or special services and ELL status. In the longitudinal sample, eligibility for free or reduced-price meals was reported for 76 percent of first graders and 73 percent of second graders. IEPs or special services was reported for 83 and 78 percent of first and second graders, respectively; and ELL status was reported for 84 and 79 percent of first and second graders, respectively. The study team obtained item response rates for all other student characteristics of 89 percent or higher for the first-grade sample and 85 percent or higher for the second-grade sample.
85 Initially, forms for collection of demographic data were mailed to schools and school personnel were asked
to fill them out. Field staff followed up in person in the schools that failed to return demographic data. Collection of missing data continued through December 2008.

A.21
TABLE A.8
NUMBER AND PERCENTAGE OF STUDENTS FOR WHOM STUDENT DEMOGRAPHIC RECORDS AND INDIVIDUAL DEMOGRAPHIC ITEMS WERE COLLECTED, BY GRADE
Longitudinal New Arrivers
Total Response Rate Total Response Rate
Data Forms and Items Number Percentage Number Percentage
First-Grade Students Sample
5,170 705
Forms
4,914 95 378 54
Items
Age 4,603 89 361 51 Free or reduced-price meals 3,924 76 299 42 Gender 5,139 99 691 98 IEP for disability or remediation 4,319 84 332 47 IEP for gifted and talented students 4,280 83 332 47 LEP/ELL 4,354 84 349 50 Race/ethnicity 4,577 89 355 50
Second-Grade Students Sample
3,728 552
Forms
3,480 93 237 43
Items
Age 3,176 85 208 38 Free or reduced-price meals 2,734 73 173 31 Gender 3,704 99 547 99 IEP for disability or remediation 2,943 79 189 34 IEP for gifted and talented students 2,903 78 189 34 LEP/ELL 2,954 79 202 37 Race/ethnicity 3,307 89 227 41
Note: Item response is equal to the percentage of students for whom we have data for the individual item divided
by the sample size.

This page intentionally left blank for double-sided copying.

APPENDIX B
TEACHER IMPLEMENTATION OF CURRICULUM-SPECIFIC ACTIVITIES

This page intentionally left blank for double-sided copying.

B.3
Chapter II presented summary information about adherence. The summaries showed variation in adherence within each curriculum, and this variation was evident in both the teacher survey and observation data. The two sources of data were generally consistent and showed similar patterns in adherence, although the teacher-reported adherence to curriculum features listed on the surveys was slightly higher than adherence obtained in the observation data. In this appendix, we provide information about adherence to each item or feature included in the summary measures, along with information about adherence to other features of each curriculum.
A. OVERVIEW OF ADHERENCE MEASURES
Before discussing the item-specific adherence, it is worth revisiting a few caveats about the adherence definitions. As discussed in Chapter II, the measure of adherence (the frequency with which an activity is expected to occur) was defined by the study team after careful review of the curriculum materials. The expected frequencies and values represent the ideal level of adherence as indicated in the curriculum materials and as determined by the study team.
Second, the data collected through the survey and observation data vary to some extent
because some aspects of adherence were difficult to determine through direct questions to the teachers and others were difficult to determine through observation. As such, the two sources of adherence data complement each other.86
Third, some features of the study’s four curricula were not expected to occur on a daily basis, and, because we observed each classroom only once during the school year, these nondaily activities may not have taken place on the day of the observation. Observers were expected to code whether or not many activities occurred during the lesson, including both daily and non-daily activities. Some items on the observation protocol were not expected to occur on a daily basis, but were considered essential features of the curricula. When possible, these essential non-daily activities were combined into a construct that could be expected to occur daily (for example, see “Conducted at least 1 routine activity” in Tables B.4 and B.5). Other nondaily items were excluded from the observation adherence measures. The teacher survey helps to provide information on nondaily activities, since teachers were asked to reflect back across the entire school year.
Fourth, because random assignment created four groups of similar teachers, as described in
Chapter II, these results are useful for understanding the extent to which the average study teacher reported adhering to each of the study’s four curricula. However, because the adherence measures for the curricula include different numbers and types of features, it is not appropriate to compare adherence across the curricula. As a result, statistical tests for curriculum differences in adherence were not conducted.
86 In some cases, there are similarities in items across the two data sources. The study’s third report, described
in Chapter I, plans to explore the comparability of these similar items.
B.4
1. Measuring Adherence Using the Survey Data
In the tables that follow, we present adherence to each feature of each curriculum as measured by both the teacher survey data and observation data. Teachers were asked to reflect back across the school year and report the frequency of implementing each feature on a six-point ordinal scale that included 0 (never), 1 (less than once a month), 2 (once or twice a month), 3 (one to two times per week), 4 (three to four times per week), and 5 (daily). Investigations and Math Expressions teachers also reported on the frequency with which students in their classroom engaged in various instructional activities and on the degree of success they had in facilitating mathematical discussions among students. A four-point ordinal scale from 1 (not at all successful) to 4 (very successful) was used for the discussion items. Teachers only received questions that were relevant for their curriculum.
2. Measuring Adherence Using the Observation Data
When observing classrooms, observers used a curriculum-specific form to collect information on the curriculum’s routine activities and the essential features of math instruction. In one section of the form (Section A) observers used a yes or no to indicate if specific routine or instructional features of the lesson were used.87
In a second section of the form (Section B), observers considered the extent to which various features of the curricula were used during math instruction and rated each feature using a four-point ordinal scale that included 1 (not at all characteristic), 2 (minimally characteristic), 3 (strongly characteristic), and 4 (extremely characteristic). The observation protocols are available in Agodini et al. (2008).
The activities coded on the observation protocol include some activities that would be expected to occur on a daily basis, and some activities that were expected to occur less frequently, such as formative assessments. Since each classroom was observed once during the school year, the adherence measures based on observation data (described in Chapter II) is restricted to activities that were expected to occur daily and therefore should have occurred on the day of the observation.
Nondaily activities may not have been observed because they were not part of the lesson on
the day of the observation, or they may not have been observed because the teacher did not adhere to that feature of the curriculum. In some cases, these non-daily features could be rated as “not applicable” when the lesson did not require a particular instructional activity. Observation items rated not applicable are excluded from the means presented in the tables. For example, some activities, such as scenarios in Math Expressions, were not required in all lessons. Other activities, such as “teacher asked students to explain reasoning or thinking for incorrect responses” in Investigations, were only required if students responded to the teacher with an incorrect response. For these items, we report the average value among observations where the activity was conducted.
87 For one Investigations item in Section A (number of children who shared during the closing activity), observers used a four-point ordinal scale that included 1 (no students), 2 (1–2 students), 3 (3–4 students), and 4 (5 or more students). On a few Math Expressions questions in Section A, observers indicated the extent to which sections of the curriculum were implemented by using a four-point ordinal scale that included 1 (none), 2 (some), 3 (most), and 4 (all).

B.5
To help observers code curriculum adherence, they reviewed the lesson to be taught prior to entering the classroom and had a copy of it with them during the observation for reference. These steps helped to ensure that observers were prepared to make accurate assessments. Inter-rater reliability on each adherence item is provided in Table B.19.
Observers worked with teachers to schedule observations in advance, and observers asked
teachers to identify all points in time during the day when students were involved in math instruction. The observers then entered and exited the class as necessary to be present for all math instruction. In some classrooms, observers were in the classroom for a single block of time. In others, observers were in and out of the classroom numerous times throughout the day. More information about the classroom observation data collection effort is included in Appendix A.
B. ADHERENCE TO CURRICULUM-SPECIFIC ACTIVITIES
The tables in this section present information about teacher adherence to each individual feature measured through the observation and survey data.
In Tables B.1 through B.3, B.6 through B.8, B.11 through B.12, and B.15 through B.16, we
provide adherence information based on the survey data. These tables provide the expected frequency of implementing each feature, the percentage of teachers who reported meeting the expected frequency, and the mean teacher response. The features are categorized as essential features, which were included in the summary measures discussed in Chapter II, and other features, which are not included in those summary measures. Essential items in Investigations and Math Expressions are divided into teacher and student activities, and both types of items were included in the adherence measure. Essential activities without a clearly specified expected frequency were excluded from the summary adherence measures, and for these items, only the mean teacher response is provided in the tables. The activities in each table are listed by type (essential or other) and in order of average frequency, from highest to lowest.
In Tables B.4 through B.5, B.9 through B.10, B.13 through B.14, and B.17 through B.18, we
provide adherence information based on the observation data. These tables include the expected value of implementation for each feature, the percentage of observations in which the expected value was met, and the mean observation value. The features are categorized as essential daily features, which were included in the summary measures discussed in Chapter II, essential nondaily features, and other features. These latter two categories are not included in the Chapter II summary measures and expected values are not provided for them.88
The activities in each table are listed by type (essential daily for teachers and/or students, essential non-daily or other) and in order of average frequency, from highest to lowest.
88 Expected values could be determined in the curriculum materials for some items, but they are not provided
in this report because they could be misleading. For example, in Math Expressions classrooms, teachers should use errors as opportunities for learning, and we would expect this to be strongly characteristic when errors are made.

B.6
TABLE B.1
INVESTIGATIONS FIRST-GRADE SAMPLE: TEACHER-REPORTED FREQUENCY OF IMPLEMENTING CURRICULUM ACTIVITIES (N = 112)
Activity (Scale) Expected
Frequency
Met Expected Frequency
(Percentage) Mean Response
Essential Teacher Activities Make manipulatives accessible to students at all times
during the lesson 5 76.4 4.67 Conduct at least one activity from the current Investigation 5 70.1 4.59 Prompt students to explain their answers 5 42.0 4.25 Invite students to use multiple strategies or solutions to a
problem 5 37.5 4.15 Allow students to choose manipulatives for use during the
activity 5 55.7 4.02 Refer to the “100 Chart” NS NS 3.95 Ask students to demonstrate a procedure or concept to
other students 4 68.8 3.86 End each lesson by asking students to share their thinking 4-5 59.8 3.59 Do “Choice Time” activities 3 72.4 2.95 Ask students to explore a concept or procedure before it is
modeled 3-4 74.1 2.93 Use “Teacher Checkpoints” and “Embedded Assessments” 2-3 86.0 2.67
Essential Student Activities Use manipulatives, pictures, or diagrams to solve problems 5 65.8 4.57 Discuss different ways of solving a problem 4-5 75.7 4.20 Explain a math concept or procedure to other students 4-5 61.3 3.79 Do problems that have more than one correct solution 3-4 66.4 3.14 Write about how to solve a problem 3 74.8 3.12
Other Activities Introduce the tasks for the session 5 75.7 4.62 Do the “Classroom Routines” 5 57.0 4.19 Use students’ correct responses as a basis for discussion 4-5 75.7 4.18 Use students’ incorrect responses as a basis for discussion 4-5 65.4 3.84 Use guidelines in the lesson for individualizing instruction
for struggling students NS NS 3.50 End each lesson by explaining the day’s math objective NS NS 3.31 Introduce the homework 2-3 86.8 3.20 Communicate with parents about math activities 2-3 92.5 2.53 Review homework with the class NS NS 2.34 Ask students to do drill-and-practice worksheets NS NS 1.69
Source: Author tabulations using cohort-one and cohort-two teacher survey data.
Note: Teachers indicated how frequently they implemented the activities on the following scale: 0 (never), 1 (less than once a month), 2 (once or twice a month), 3 (one to two times a week), 4 (three to four times a week), and 5 (daily). A mean of 4 indicates that teachers implemented an activity an average of three to four times a week.
NS indicates the expected frequency was not specified.
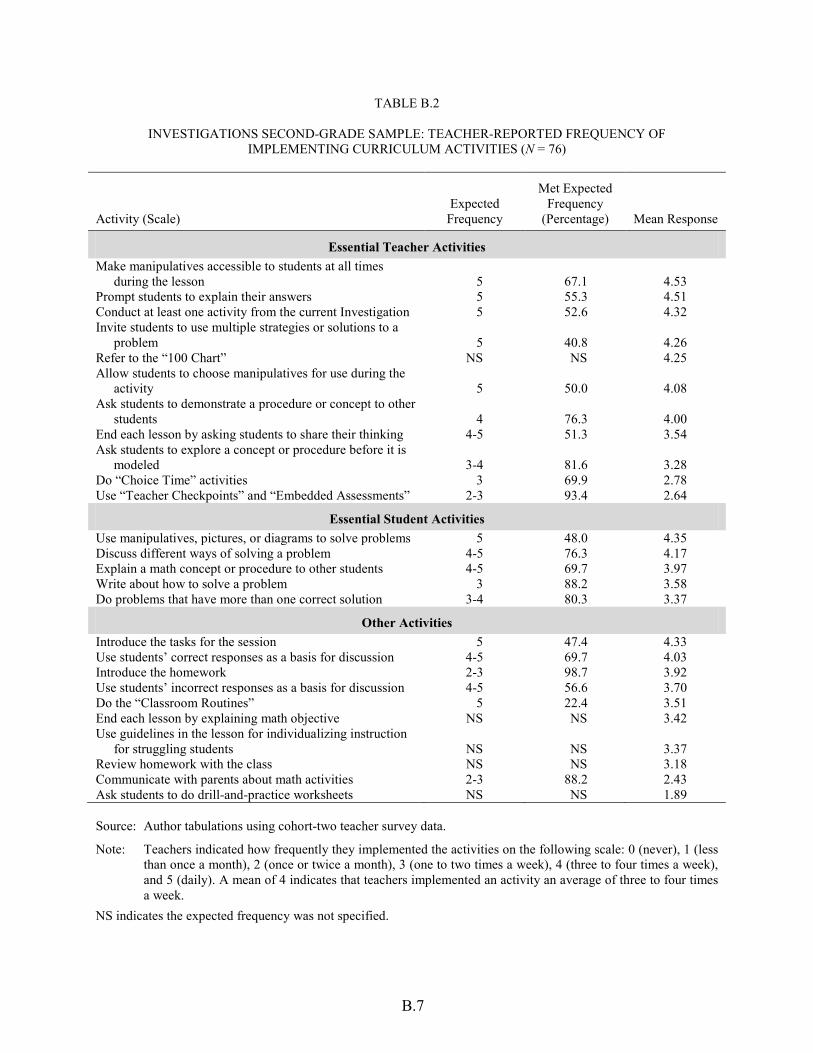
B.7
TABLE B.2
INVESTIGATIONS SECOND-GRADE SAMPLE: TEACHER-REPORTED FREQUENCY OF IMPLEMENTING CURRICULUM ACTIVITIES (N = 76)
Activity (Scale) Expected
Frequency
Met Expected Frequency
(Percentage) Mean Response
Essential Teacher Activities Make manipulatives accessible to students at all times
during the lesson 5 67.1 4.53 Prompt students to explain their answers 5 55.3 4.51 Conduct at least one activity from the current Investigation 5 52.6 4.32 Invite students to use multiple strategies or solutions to a
problem 5 40.8 4.26 Refer to the “100 Chart” NS NS 4.25 Allow students to choose manipulatives for use during the
activity 5 50.0 4.08 Ask students to demonstrate a procedure or concept to other
students 4 76.3 4.00 End each lesson by asking students to share their thinking 4-5 51.3 3.54 Ask students to explore a concept or procedure before it is
modeled 3-4 81.6 3.28 Do “Choice Time” activities 3 69.9 2.78 Use “Teacher Checkpoints” and “Embedded Assessments” 2-3 93.4 2.64
Essential Student Activities Use manipulatives, pictures, or diagrams to solve problems 5 48.0 4.35 Discuss different ways of solving a problem 4-5 76.3 4.17 Explain a math concept or procedure to other students 4-5 69.7 3.97 Write about how to solve a problem 3 88.2 3.58 Do problems that have more than one correct solution 3-4 80.3 3.37
Other Activities Introduce the tasks for the session 5 47.4 4.33 Use students’ correct responses as a basis for discussion 4-5 69.7 4.03 Introduce the homework 2-3 98.7 3.92 Use students’ incorrect responses as a basis for discussion 4-5 56.6 3.70 Do the “Classroom Routines” 5 22.4 3.51 End each lesson by explaining math objective NS NS 3.42 Use guidelines in the lesson for individualizing instruction
for struggling students NS NS 3.37 Review homework with the class NS NS 3.18 Communicate with parents about math activities 2-3 88.2 2.43 Ask students to do drill-and-practice worksheets NS NS 1.89 Source: Author tabulations using cohort-two teacher survey data.
Note: Teachers indicated how frequently they implemented the activities on the following scale: 0 (never), 1 (less than once a month), 2 (once or twice a month), 3 (one to two times a week), 4 (three to four times a week), and 5 (daily). A mean of 4 indicates that teachers implemented an activity an average of three to four times a week.
NS indicates the expected frequency was not specified.

B.8
TABLE B.3
INVESTIGATIONS: TEACHER-REPORTED SUCCESS AT FACILITATING DISCUSSIONS FOCUSED ON PROCESS
Mean Response
Type of Discussion First-Grade Sample Second-Grade Sample
Discussions that allow students to explain their answers 3.16 3.31
Discussions that enable students to offer or share multiple approaches to solving a problem 3.16 3.36
Discussions that enable students to raise mathematical questions or discuss mathematical concepts or both 2.85 3.04
Discussions that encourage students to reference other students’ ideas 2.81 2.97
Sample Size 109 75 Source: Author tabulations using cohort-one and cohort-two teacher survey data.
Note: Teachers rated their success at facilitating discussions on the following scale: 1 (not at all successful), 2 (somewhat successful), 3 (moderately successful), and 4 (very successful).
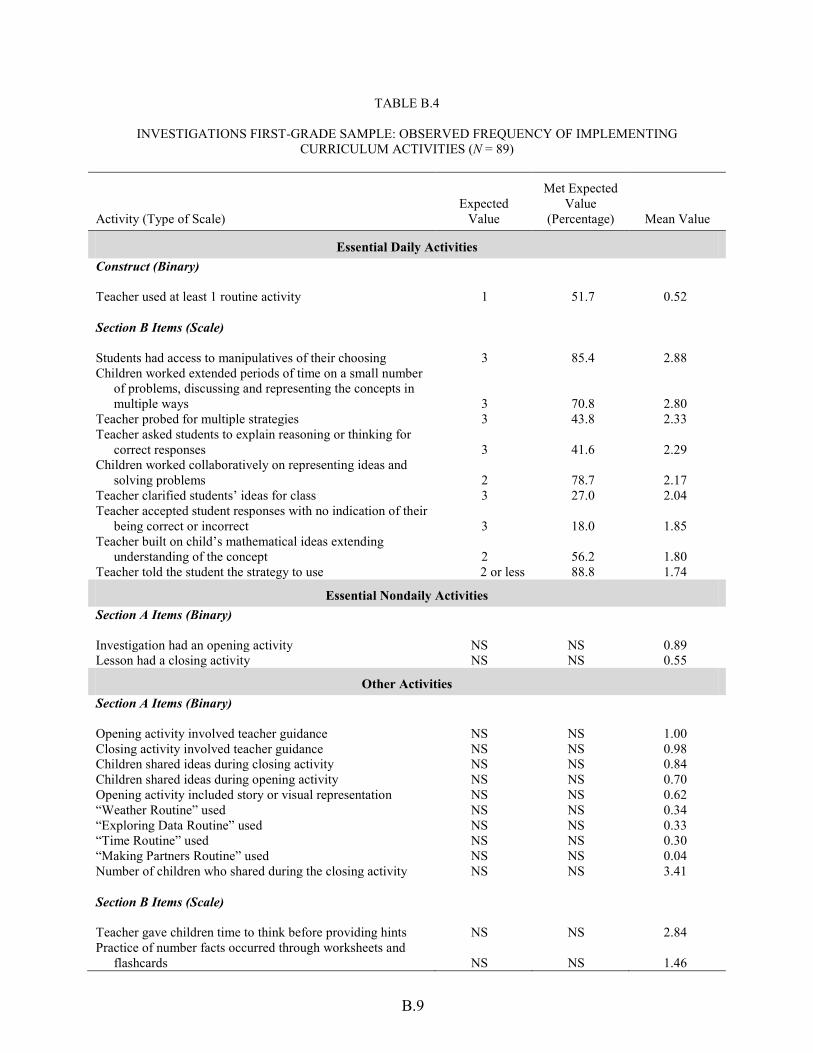
B.9
TABLE B.4
INVESTIGATIONS FIRST-GRADE SAMPLE: OBSERVED FREQUENCY OF IMPLEMENTING CURRICULUM ACTIVITIES (N = 89)
Activity (Type of Scale) Expected
Value
Met Expected Value
(Percentage) Mean Value
Essential Daily Activities Construct (Binary) Teacher used at least 1 routine activity 1 51.7 0.52 Section B Items (Scale) Students had access to manipulatives of their choosing 3 85.4 2.88 Children worked extended periods of time on a small number
of problems, discussing and representing the concepts in multiple ways 3 70.8 2.80
Teacher probed for multiple strategies 3 43.8 2.33 Teacher asked students to explain reasoning or thinking for
correct responses 3 41.6 2.29 Children worked collaboratively on representing ideas and
solving problems 2 78.7 2.17 Teacher clarified students’ ideas for class 3 27.0 2.04 Teacher accepted student responses with no indication of their
being correct or incorrect 3 18.0 1.85 Teacher built on child’s mathematical ideas extending
understanding of the concept 2 56.2 1.80 Teacher told the student the strategy to use 2 or less 88.8 1.74
Essential Nondaily Activities Section A Items (Binary) Investigation had an opening activity NS NS 0.89 Lesson had a closing activity NS NS 0.55
Other Activities Section A Items (Binary) Opening activity involved teacher guidance NS NS 1.00 Closing activity involved teacher guidance NS NS 0.98 Children shared ideas during closing activity NS NS 0.84 Children shared ideas during opening activity NS NS 0.70 Opening activity included story or visual representation NS NS 0.62 “Weather Routine” used NS NS 0.34 “Exploring Data Routine” used NS NS 0.33 “Time Routine” used NS NS 0.30 “Making Partners Routine” used NS NS 0.04 Number of children who shared during the closing activity NS NS 3.41 Section B Items (Scale) Teacher gave children time to think before providing hints NS NS 2.84 Practice of number facts occurred through worksheets and
flashcards NS NS 1.46
Table B.4 (continued)
B.10
Source: Author tabulations using classroom observation data. Note: For all Section A items but one, observers indicated whether or not an activity occurred. For that item
(Number of children who shared during the closing activity), observers used a four-point ordinal scale that included 1 (no students), 2 (1–2 students), 3 (3–4 students), and 4 (5 or more students). For Section B items, observers considered the extent to which various features of the curricula were used during math instruction and rated each feature using a four-point ordinal scale that included 1 (not at all characteristic), 2 (minimally characteristic), 3 (strongly characteristic), and 4 (extremely characteristic). Some features could be rated as not applicable (NA) when the lesson did not require a particular instructional activity. Some activities were not expected to occur daily. For these items, the expected frequency is not specified because the activity may not have been expected on the day of the single classroom observation.
NS indicates the expected frequency was not specified.
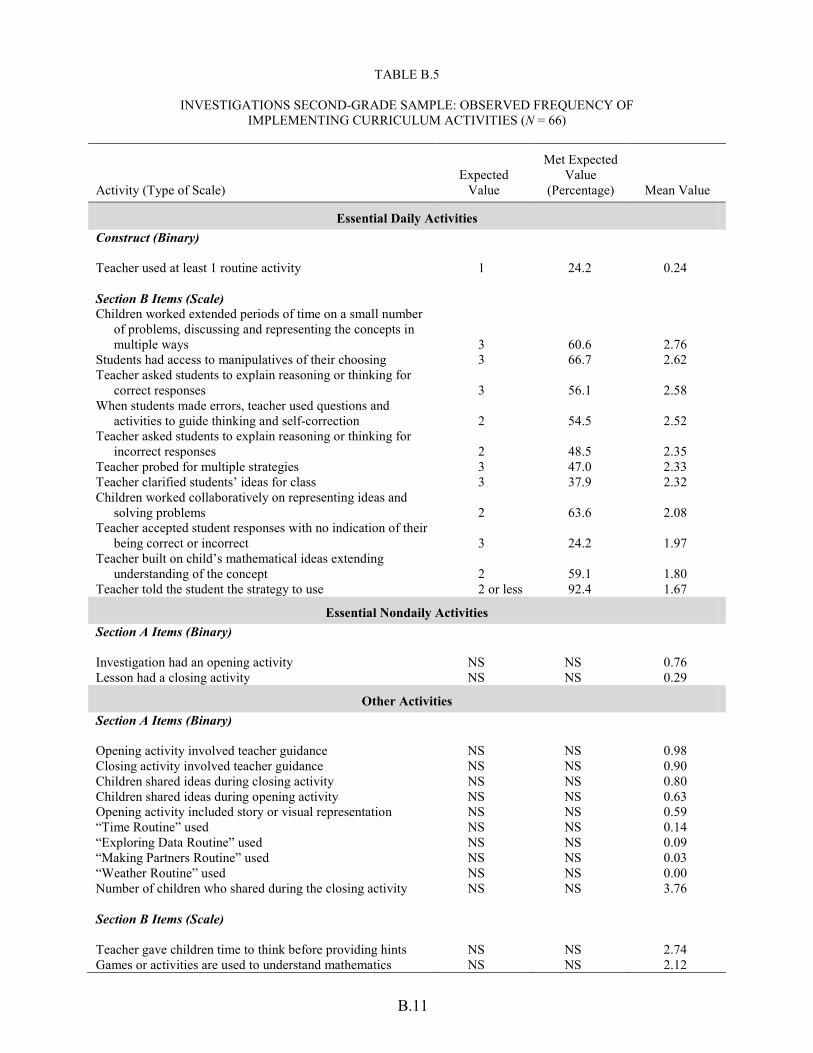
B.11
TABLE B.5
INVESTIGATIONS SECOND-GRADE SAMPLE: OBSERVED FREQUENCY OF IMPLEMENTING CURRICULUM ACTIVITIES (N = 66)
Activity (Type of Scale) Expected
Value
Met Expected Value
(Percentage) Mean Value
Essential Daily Activities Construct (Binary) Teacher used at least 1 routine activity 1 24.2 0.24 Section B Items (Scale) Children worked extended periods of time on a small number
of problems, discussing and representing the concepts in multiple ways 3 60.6 2.76
Students had access to manipulatives of their choosing 3 66.7 2.62 Teacher asked students to explain reasoning or thinking for
correct responses 3 56.1 2.58 When students made errors, teacher used questions and
activities to guide thinking and self-correction 2 54.5 2.52 Teacher asked students to explain reasoning or thinking for
incorrect responses 2 48.5 2.35 Teacher probed for multiple strategies 3 47.0 2.33 Teacher clarified students’ ideas for class 3 37.9 2.32 Children worked collaboratively on representing ideas and
solving problems 2 63.6 2.08 Teacher accepted student responses with no indication of their
being correct or incorrect 3 24.2 1.97 Teacher built on child’s mathematical ideas extending
understanding of the concept 2 59.1 1.80 Teacher told the student the strategy to use 2 or less 92.4 1.67
Essential Nondaily Activities Section A Items (Binary) Investigation had an opening activity NS NS 0.76 Lesson had a closing activity NS NS 0.29
Other Activities Section A Items (Binary) Opening activity involved teacher guidance NS NS 0.98 Closing activity involved teacher guidance NS NS 0.90 Children shared ideas during closing activity NS NS 0.80 Children shared ideas during opening activity NS NS 0.63 Opening activity included story or visual representation NS NS 0.59 “Time Routine” used NS NS 0.14 “Exploring Data Routine” used NS NS 0.09 “Making Partners Routine” used NS NS 0.03 “Weather Routine” used NS NS 0.00 Number of children who shared during the closing activity NS NS 3.76 Section B Items (Scale) Teacher gave children time to think before providing hints NS NS 2.74 Games or activities are used to understand mathematics NS NS 2.12

B.12
Table B.5 (continued)
Activity (Type of Scale) Expected
Value
Met Expected Value
(Percentage) Mean Value Practice of number facts occurred through worksheets and
flashcards NS NS 1.58 When a solution was incorrect, the teacher immediately told
the student the correct solution NS NS 1.58 Source: Author tabulations using classroom observation data. Note: For all Section A items but one, observers indicated whether or not an activity occurred. For that item
(Number of children who shared during the closing activity), observers used a four-point ordinal scale that included 1 (no students), 2 (1–2 students), 3 (3–4 students), and 4 (5 or more students). For Section B items, observers considered the extent to which various features of the curricula were used during math instruction and rated each feature using a four-point ordinal scale that included 1 (not at all characteristic), 2 (minimally characteristic), 3 (strongly characteristic), and 4 (extremely characteristic). Some features could be rated as not applicable (NA) when the lesson did not require a particular instructional activity. Some activities were not expected to occur daily. For these items, the expected frequency is not specified because the activity may not have been expected on the day of the single classroom observation.
NS indicates the expected frequency was not specified.

B.13
TABLE B.6
MATH EXPRESSIONS FIRST-GRADE SAMPLE: TEACHER-REPORTED FREQUENCY OF IMPLEMENTING CURRICULUM ACTIVITIES (N = 106)
Activity (Scale) Expected
Frequency
Met Expected Frequency
(Percentage) Mean Response
Essential Teacher Activities Assign homework 5 57.5 4.32 Use “Quick Practice” activity 5 53.8 4.29 Ask students to demonstrate a procedure or concept to other
students 5 33.0 4.09 Complete the “Daily Routines” for the unit 5 47.6 4.03 Use proof drawings 4 69.8 3.90 Use student leaders during the “Daily Routines” 4-5 63.2 3.76 Use “Solve and Discuss” at the board 3-4 88.6 3.89 Use “Step-by-Step” at the board 3-4 89.6 3.88 Use student leaders during “Quick Practice” 4-5 61.3 3.78 Use “Scenarios” 3-4 85.8 3.65 Administer “Quick Quizzes” 3 51.9 2.55
Essential Student Activities Use manipulatives, pictures, or diagrams to solve problems 5 55.7 4.35 Explain a math concept or procedure to other students 5 39.6 4.02 Ask mathematical questions of other students 5 31.4 3.52 Write about how to solve a problem NS NS 2.95
Other Activities Use “Teaching the Lesson” activities 5 65.4 4.51 Assign the “Remembering” worksheet 5 53.8 4.18 Use differentiated instruction activities NS NS 3.53 Group students for each activity as recommended in the
teachers’ guide 5 29.5 3.48 Conduct ongoing assessment activities 4-5 41.5 3.32 Use math writing prompts 3-4 50.5 2.59 Administer unit tests 2 85.8 2.09 Source: Author tabulations using cohort-one and cohort-two teacher survey data.
Note: Teachers indicated how frequently they implemented the activities on the following scale: 0 (never), 1 (less than once a month), 2 (once or twice a month), 3 (one to two times a week), 4 (three to four times a week), and 5 (daily). A mean of 4 indicates that teachers implemented an activity an average of three to four times a week.
NS indicates the expected frequency was not specified.
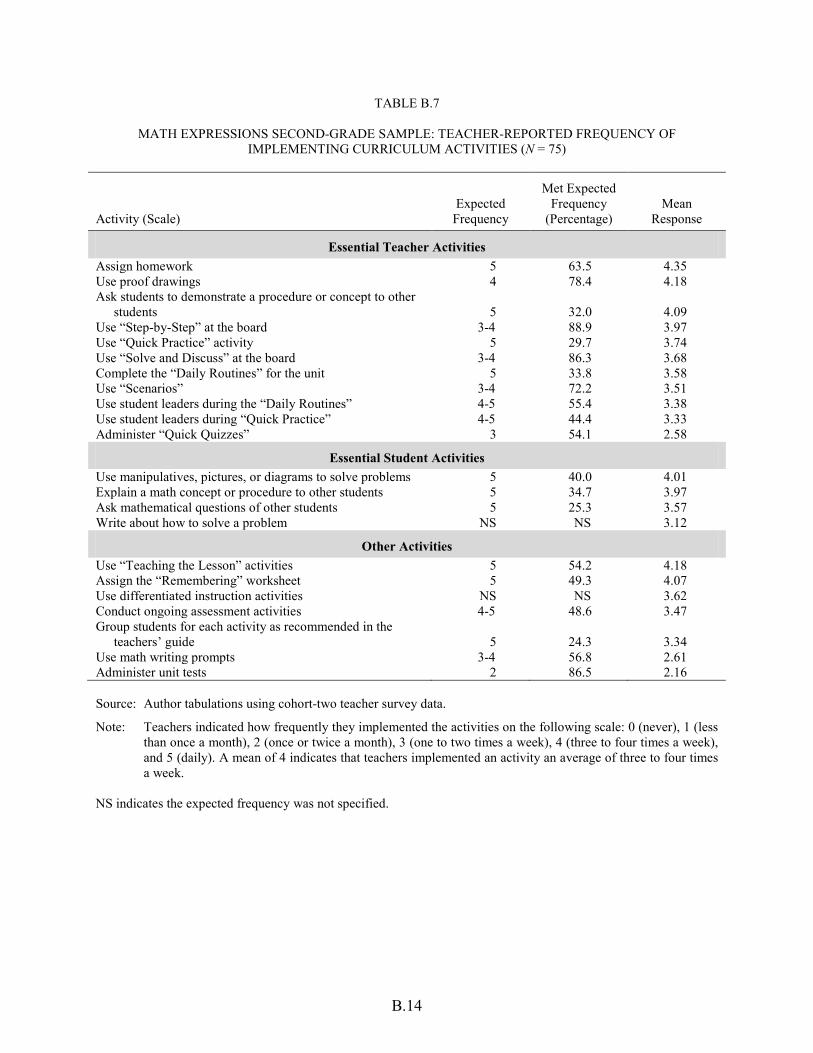
B.14
TABLE B.7
MATH EXPRESSIONS SECOND-GRADE SAMPLE: TEACHER-REPORTED FREQUENCY OF IMPLEMENTING CURRICULUM ACTIVITIES (N = 75)
Activity (Scale) Expected
Frequency
Met Expected Frequency
(Percentage) Mean
Response
Essential Teacher Activities Assign homework 5 63.5 4.35 Use proof drawings 4 78.4 4.18 Ask students to demonstrate a procedure or concept to other
students 5 32.0 4.09 Use “Step-by-Step” at the board 3-4 88.9 3.97 Use “Quick Practice” activity 5 29.7 3.74 Use “Solve and Discuss” at the board 3-4 86.3 3.68 Complete the “Daily Routines” for the unit 5 33.8 3.58 Use “Scenarios” 3-4 72.2 3.51 Use student leaders during the “Daily Routines” 4-5 55.4 3.38 Use student leaders during “Quick Practice” 4-5 44.4 3.33 Administer “Quick Quizzes” 3 54.1 2.58
Essential Student Activities Use manipulatives, pictures, or diagrams to solve problems 5 40.0 4.01 Explain a math concept or procedure to other students 5 34.7 3.97 Ask mathematical questions of other students 5 25.3 3.57 Write about how to solve a problem NS NS 3.12
Other Activities Use “Teaching the Lesson” activities 5 54.2 4.18 Assign the “Remembering” worksheet 5 49.3 4.07 Use differentiated instruction activities NS NS 3.62 Conduct ongoing assessment activities 4-5 48.6 3.47 Group students for each activity as recommended in the
teachers’ guide 5 24.3 3.34 Use math writing prompts 3-4 56.8 2.61 Administer unit tests 2 86.5 2.16 Source: Author tabulations using cohort-two teacher survey data.
Note: Teachers indicated how frequently they implemented the activities on the following scale: 0 (never), 1 (less than once a month), 2 (once or twice a month), 3 (one to two times a week), 4 (three to four times a week), and 5 (daily). A mean of 4 indicates that teachers implemented an activity an average of three to four times a week.
NS indicates the expected frequency was not specified.

B.15
TABLE B.8
MATH EXPRESSIONS: TEACHER-REPORTED SUCCESS AT FACILITATING DISCUSSIONS FOCUSED ON PROCESS
Mean Response
Type of Discussion First-Grade Sample Second-Grade Sample
Discussions that allow students to explain their answers 3.41 3.36
Discussions that enable students to offer or share multiple approaches to solving a problem 3.31 3.32
Discussions that enable students to raise mathematical questions or discuss mathematical concepts or both 3.01 3.11
Discussions that encourage students to reference other students’ ideas 2.85 2.97
Sample Size 106 74 Source: Author tabulations using cohort-one and cohort-two teacher survey data.
Note: Teachers rated their success at facilitating discussions on the following scale: 1 (not at all successful), 2 (somewhat successful), 3 (moderately successful), and 4 (very successful).
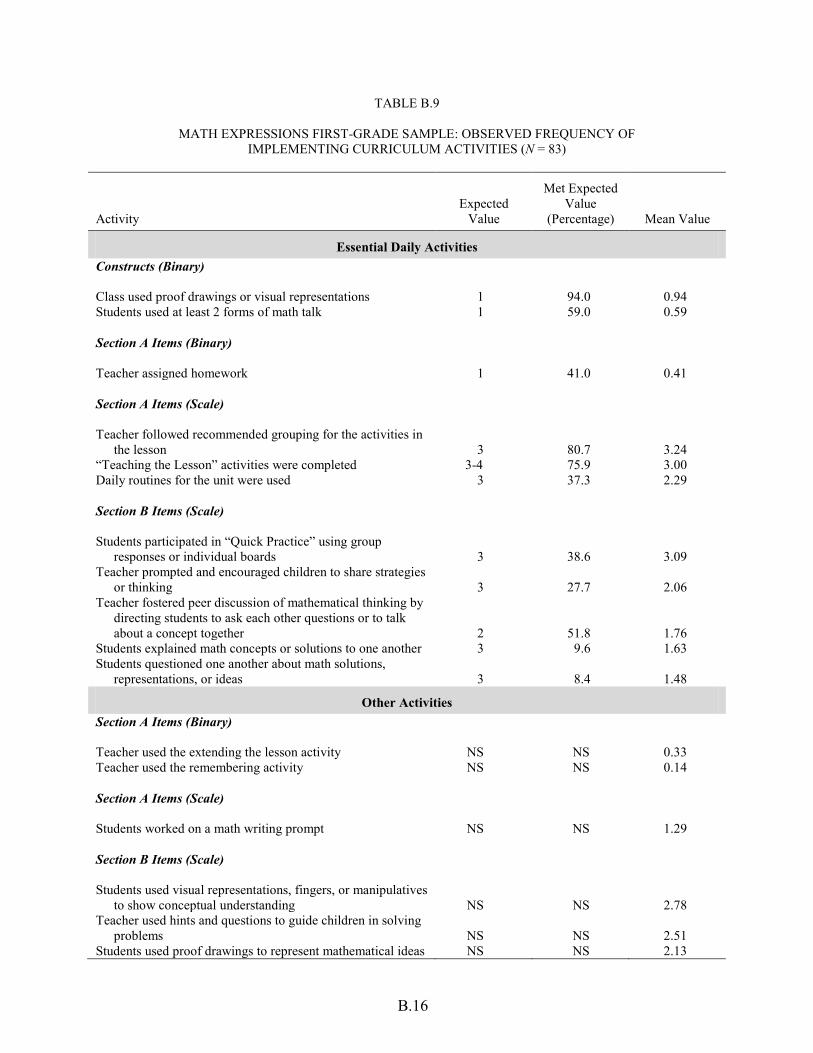
B.16
TABLE B.9
MATH EXPRESSIONS FIRST-GRADE SAMPLE: OBSERVED FREQUENCY OF IMPLEMENTING CURRICULUM ACTIVITIES (N = 83)
Activity Expected
Value
Met Expected Value
(Percentage) Mean Value
Essential Daily Activities Constructs (Binary) Class used proof drawings or visual representations 1 94.0 0.94 Students used at least 2 forms of math talk 1 59.0 0.59 Section A Items (Binary) Teacher assigned homework 1 41.0 0.41 Section A Items (Scale) Teacher followed recommended grouping for the activities in
the lesson 3 80.7 3.24 “Teaching the Lesson” activities were completed 3-4 75.9 3.00 Daily routines for the unit were used 3 37.3 2.29 Section B Items (Scale) Students participated in “Quick Practice” using group
responses or individual boards 3 38.6 3.09 Teacher prompted and encouraged children to share strategies
or thinking 3 27.7 2.06 Teacher fostered peer discussion of mathematical thinking by
directing students to ask each other questions or to talk about a concept together 2 51.8 1.76
Students explained math concepts or solutions to one another 3 9.6 1.63 Students questioned one another about math solutions,
representations, or ideas 3 8.4 1.48
Other Activities Section A Items (Binary) Teacher used the extending the lesson activity NS NS 0.33 Teacher used the remembering activity NS NS 0.14 Section A Items (Scale) Students worked on a math writing prompt NS NS 1.29 Section B Items (Scale) Students used visual representations, fingers, or manipulatives
to show conceptual understanding NS NS 2.78 Teacher used hints and questions to guide children in solving
problems NS NS 2.51 Students used proof drawings to represent mathematical ideas NS NS 2.13

B.17
Table B.9 (continued)
Activity Expected
Value
Met Expected Value
(Percentage) Mean Value Teacher clarified or extended student thinking by rephrasing
what the student said or labeling a strategy or pointing out part of the solution or asking a question NS NS 2.12
Teacher used errors as opportunities for learning NS NS 2.09 Students wrote equations to represent mathematical ideas NS NS 2.05 Students lead the designated daily routines for the day
independently NS NS 1.80 Teacher used whole-class practice with student leaders NS NS 1.64 Students worked together in small groups NS NS 1.63 Teacher used student ideas as the basis of mini-lessons NS NS 1.61 Teacher used real-world situations to illustrate ideas NS NS 1.59 Teacher used the solve, explain, ask questions, justify model
of instruction NS NS 1.54 Teacher used student pairs NS NS 1.47 Students built on one another’s ideas trying out what another
student did NS NS 1.46 Students wrote about math concepts NS NS 1.42 Teacher used scenarios to demonstrate mathematical
relationships NS NS 1.27 Teacher used step-by-step at the board NS NS 1.25 Source: Author tabulations using classroom observation data. Note: There were two types of items in Section A. For one type, observers indicated whether or not an activity
occurred. For the other type, observers indicated the extent to which sections of the curriculum were implemented using a four-point ordinal scale that included 1 (none), 2 (some), 3 (most), and 4 (all). For Section B items, observers considered the extent to which various features of the curricula were used during math instruction and rated each feature using a four-point ordinal scale that included 1 (not at all characteristic), 2 (minimally characteristic), 3 (strongly characteristic), and 4 (extremely characteristic). Some features could be rated as not applicable (NA) when the lesson did not require a particular instructional activity. Some activities were not expected to occur daily. For these items, the expected frequency is not specified because the activity may not have been expected on the day of the single classroom observation.
NS indicates the expected frequency was not specified.

B.18
TABLE B.10
MATH EXPRESSIONS SECOND-GRADE SAMPLE: OBSERVED FREQUENCY OF IMPLEMENTING CURRICULUM ACTIVITIES (N = 62)
Activity (Scale) Expected
Value
Met Expected Value
(Percentage) Mean Value
Essential Daily Activities Constructs (Binary) Students used at least 2 forms of math talk 1 50.0 0.50 Class used proof drawings or visual representations 1 93.5 0.95 Section A Items (Binary) Teacher assigned homework 1 48.4 0.48 Section A Items (Scale) Teacher followed recommended grouping for the activities in
the lesson 3 75.8 3.15 “Teaching the Lesson” activities were completed 3-4 66.1 2.82 Daily routines for the unit were used 3 29.0 1.92 Section B Items (Scale) Students participated in “Quick Practice” using group
responses or individual boards 3 50.0 2.80 Teacher prompted and encouraged children to share strategies
or thinking 3 30.6 2.07 Students explained math concepts or solutions to one another 3 21.0 1.75 Teacher fostered peer discussion of mathematical thinking by
directing students to ask each other questions or to talk about a concept together 2 40.3 1.59
Students questioned one another about math solutions, representations, or ideas 3 9.7 1.41
Other Activities Section A Items (Binary) Teacher used the extending the lesson activity NS NS 0.16 Teacher used the remembering activity NS NS 0.08 Section A Items (Scale) Students worked on a math writing prompt NS NS 1.11 Section B Items (Scale) Students used visual representations, fingers, or manipulatives
to show conceptual understanding NS NS 2.77 Teacher used hints and questions to guide children in solving
problems NS NS 2.41 Students wrote equations to represent mathematical ideas NS NS 2.41

B.19
Table B.10 (continued)
Activity (Scale) Expected
Value
Met Expected Value
(Percentage) Mean Value Teacher used errors as opportunities for learning NS NS 2.32 Students used proof drawings to represent mathematical ideas NS NS 2.02 Teacher clarified or extended student thinking by rephrasing
what the student said or labeling a strategy or pointing out part of the solution or asking a question NS NS 1.95
Teacher used real-world situations to illustrate ideas NS NS 1.80 Students led the designated daily routines for the day
independently NS NS 1.63 Teacher used student ideas as the basis of mini-lessons NS NS 1.62 Teacher used the solve, explain, ask questions, justify model
of instruction NS NS 1.56 Teacher used whole-class practice with student leaders NS NS 1.56 Teacher used student pairs NS NS 1.49 Students built on one another’s ideas trying out what another
student did NS NS 1.36 Students worked together in small groups NS NS 1.33 Teacher used scenarios to demonstrate mathematical
relationships NS NS 1.33 Students wrote about math concepts NS NS 1.30 Teacher differentiated instruction for different kinds of
students NS NS 1.28 Teacher used step-by-step at the board NS NS 1.23 Source: Author tabulations using classroom observation data. Note: There were two types of items in Section A. For one type, observers indicated whether or not an activity
occurred. For the other type, observers indicated the extent to which sections of the curriculum were implemented using a four-point ordinal scale that included 1 (none), 2 (some), 3 (most), and 4 (all). For Section B items, observers considered the extent to which various features of the curricula were used during math instruction and rated each feature using a four-point ordinal scale that included 1 (not at all characteristic), 2 (minimally characteristic), 3 (strongly characteristic), and 4 (extremely characteristic). Some features could be rated as not applicable (NA) when the lesson did not require a particular instructional activity. Some activities were not expected to occur daily. For these items, the expected frequency is not specified because the activity may not have been expected on the day of the single classroom observation.
NS indicates the expected frequency was not specified.

B.20
TABLE B.11
SAXON FIRST-GRADE SAMPLE: TEACHER-REPORTED FREQUENCY OF IMPLEMENTING CURRICULUM ACTIVITIES (N = 106)
Activity (Scale) Expected
Frequency
Met Expected Frequency
(Percentage) Mean
Response
Essential Activities Ask students to complete the “Guided Class
Practice” worksheet 5 93.4 4.89 Model completion of the “Guided Class Practice”
chart 5 87.7 4.84 State the lesson’s objective from the script 5 74.3 4.53 Complete “Fact Practice” specified in the lesson 4–5 87.6 4.52 Ask students to respond to your questions as a
whole group 4–5 90.6 4.51 Use the manipulatives and visual representations
specified in the lesson 5 58.5 4.50 Complete all parts of the “Meeting” specified in the
lesson 5 50.5 4.28 Adhere to the lesson script 4–5 84.9 4.27 Complete all activities specified in the lesson 5 45.3 4.22 Ask students at the end of the lesson to summarize
what they learned 5 44.2 4.03 Complete “Fact Assessment” if specified in the
lesson 3 92.5 3.82 Administer written assessments 3 91.4 3.46
Other Activities Prepare all required materials in advance of the
lesson 5 60.4 4.49 Preview the homework for students 5 63.2 4.17 Group students for each activity as specified in the
lessons 5 35.6 3.75 Administer oral assessments and record student
responses 2 67.3 1.98 Source: Author tabulations using cohort-one and cohort-two teacher survey data.
Note: Teachers indicated how frequently they implemented the activities on the following scale: 0 (never), 1 (less than once a month), 2 (once or twice a month), 3 (one to two times a week), 4 (three to four times a week), and 5 (daily). A mean of 4 indicates that teachers implemented an activity an average of three to four times a week.
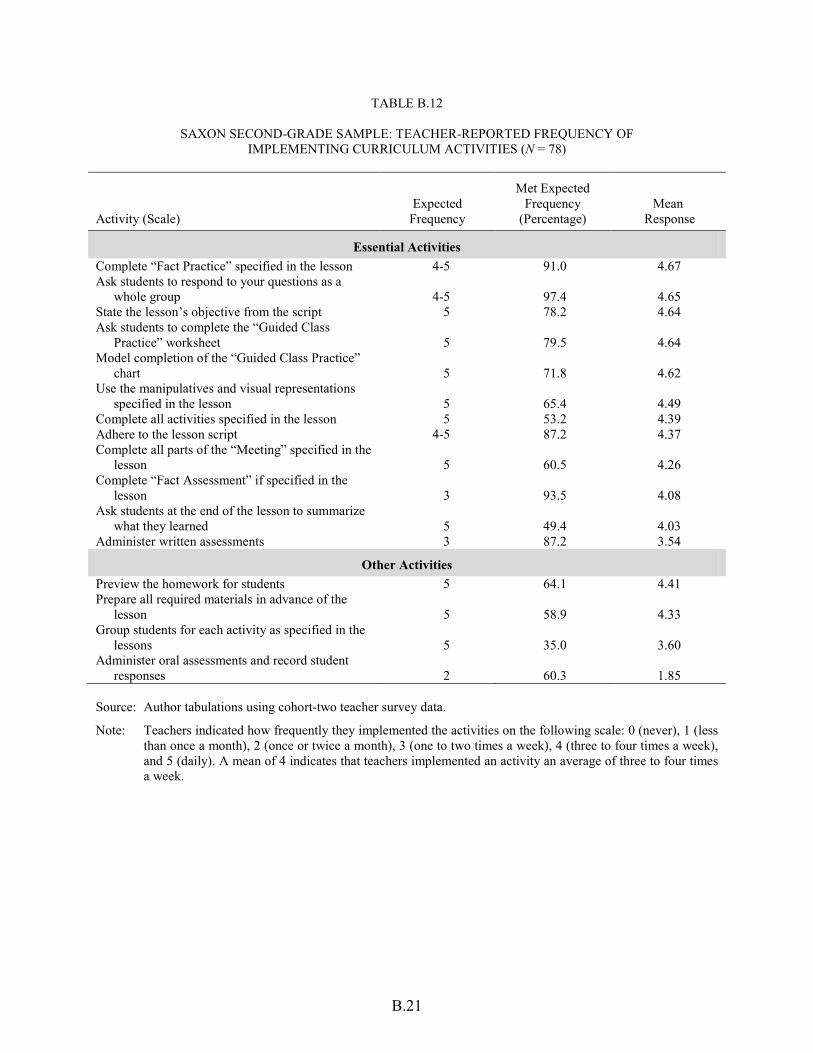
B.21
TABLE B.12
SAXON SECOND-GRADE SAMPLE: TEACHER-REPORTED FREQUENCY OF IMPLEMENTING CURRICULUM ACTIVITIES (N = 78)
Activity (Scale) Expected
Frequency
Met Expected Frequency
(Percentage) Mean
Response
Essential Activities Complete “Fact Practice” specified in the lesson 4-5 91.0 4.67 Ask students to respond to your questions as a
whole group 4-5 97.4 4.65 State the lesson’s objective from the script 5 78.2 4.64 Ask students to complete the “Guided Class
Practice” worksheet 5 79.5 4.64 Model completion of the “Guided Class Practice”
chart 5 71.8 4.62 Use the manipulatives and visual representations
specified in the lesson 5 65.4 4.49 Complete all activities specified in the lesson 5 53.2 4.39 Adhere to the lesson script 4-5 87.2 4.37 Complete all parts of the “Meeting” specified in the
lesson 5 60.5 4.26 Complete “Fact Assessment” if specified in the
lesson 3 93.5 4.08 Ask students at the end of the lesson to summarize
what they learned 5 49.4 4.03 Administer written assessments 3 87.2 3.54
Other Activities Preview the homework for students 5 64.1 4.41 Prepare all required materials in advance of the
lesson 5 58.9 4.33 Group students for each activity as specified in the
lessons 5 35.0 3.60 Administer oral assessments and record student
responses 2 60.3 1.85 Source: Author tabulations using cohort-two teacher survey data.
Note: Teachers indicated how frequently they implemented the activities on the following scale: 0 (never), 1 (less than once a month), 2 (once or twice a month), 3 (one to two times a week), 4 (three to four times a week), and 5 (daily). A mean of 4 indicates that teachers implemented an activity an average of three to four times a week.

B.22
TABLE B.13
SAXON FIRST-GRADE SAMPLE: OBSERVED FREQUENCY OF IMPLEMENTING CURRICULUM ACTIVITIES (N = 91)
Activity (Scale) Expected
Value
Met Expected Value
(Percentage) Mean Value
Essential Daily Activities Constructs (Binary) Did at least 1 morning meeting activity 1 97.8 0.98 “Fact Practice” or “Assessment” was conducted 1 80.2 0.80 Section A Items (Binary) Teacher stated objective for lesson 1 87.9 0.88 Section A Items (Scale) Children summarized at the end of the lesson 2 51.6 1.81 Section B Items (Scale) Teacher used the materials as directed in the lesson 3 89.0 3.31 Teacher guided practice in the day’s objective 4 46.2 3.27 Lesson was sequenced according to the manual
(demonstration, guided practice, distributed practice) 4 42.9 3.22 Teacher correctly modeled the concept or procedure
according to the directions in the manual 3 86.8 3.22 Teacher was faithful to the script during routines 4 20.9 2.96 Teacher was faithful to the script during the lesson 4 27.5 2.96 Choral or nonverbal group responses were used 3 68.1 2.89 Teacher monitored student completion of “Guided Class
Practice” page 4 24.2 2.82
Essential Nondaily Activities Section B Items (Scale) Teacher demonstrated recommended strategy or procedure for
the lesson NS NS 3.13 Teacher used the directed correction procedure (when
children made errors, teacher immediately corrected the mistake) NS NS 2.98
Teacher pointed out errors NS NS 2.77 Teacher corrected errors during student written practice or
independent work NS NS 2.52
Other Activities Section A Items (Binary) “Calendar Routine” used NS NS 0.95 “Counting Routine” used NS NS 0.95 “Number Pattern Routine” used NS NS 0.92 “Coin Cup Routine” used NS NS 0.90 “Weather Graph Routine” used NS NS 0.86
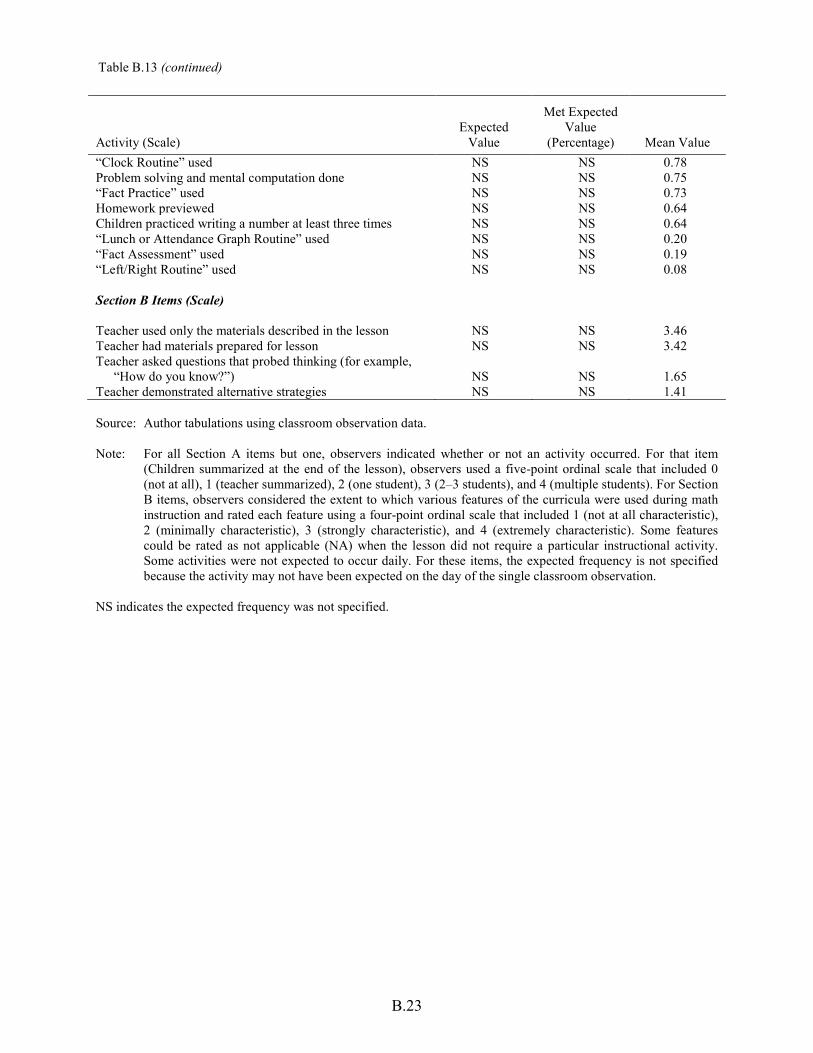
B.23
Table B.13 (continued)
Activity (Scale) Expected
Value
Met Expected Value
(Percentage) Mean Value “Clock Routine” used NS NS 0.78 Problem solving and mental computation done NS NS 0.75 “Fact Practice” used NS NS 0.73 Homework previewed NS NS 0.64 Children practiced writing a number at least three times NS NS 0.64 “Lunch or Attendance Graph Routine” used NS NS 0.20 “Fact Assessment” used NS NS 0.19 “Left/Right Routine” used NS NS 0.08 Section B Items (Scale) Teacher used only the materials described in the lesson NS NS 3.46 Teacher had materials prepared for lesson NS NS 3.42 Teacher asked questions that probed thinking (for example,
“How do you know?”) NS NS 1.65 Teacher demonstrated alternative strategies NS NS 1.41 Source: Author tabulations using classroom observation data. Note: For all Section A items but one, observers indicated whether or not an activity occurred. For that item
(Children summarized at the end of the lesson), observers used a five-point ordinal scale that included 0 (not at all), 1 (teacher summarized), 2 (one student), 3 (2–3 students), and 4 (multiple students). For Section B items, observers considered the extent to which various features of the curricula were used during math instruction and rated each feature using a four-point ordinal scale that included 1 (not at all characteristic), 2 (minimally characteristic), 3 (strongly characteristic), and 4 (extremely characteristic). Some features could be rated as not applicable (NA) when the lesson did not require a particular instructional activity. Some activities were not expected to occur daily. For these items, the expected frequency is not specified because the activity may not have been expected on the day of the single classroom observation.
NS indicates the expected frequency was not specified.

B.24
TABLE B.14
SAXON SECOND-GRADE SAMPLE: OBSERVED FREQUENCY OF IMPLEMENTING CURRICULUM ACTIVITIES (N = 74)
Activity (Scale) Expected
Value
Met Expected Value
(Percentage) Mean Value
Essential Daily Activities Constructs (Binary) Did at least 1 morning meeting activity 1 95.9 0.96 “Fact Practice” or “Assessment” was conducted 1 89.2 0.89 Section A Items (Binary) Teacher stated objective for lesson 1 94.6 0.95 Section A Items (Scale) Children summarized at end of lesson 2 62.2 2.32 Section B Items (Scale) Lesson was sequenced according to the manual
(demonstration, guided practice, distributed practice) 4 39.2 3.24 Teacher correctly modeled the concept or procedure
according to the directions in the manual 3 87.8 3.23 Teacher guided practice in the day’s objective 4 39.2 3.20 Teacher use the materials as directed in the lesson 3 91.9 3.16 Teacher was faithful to the script during the lesson 4 33.8 3.12 Teacher was faithful to the script during routines 4 27.0 3.08 Choral or nonverbal group responses were used 3 71.6 2.82 Teacher monitored student completion of “Guided Class
Practice” page 4 16.2 2.61
Essential Nondaily Activities Section B Items (Scale) Teacher demonstrated recommended strategy or procedure for
the lesson NS NS 3.05 Teacher used the directed correction procedure (when
children made errors, teacher immediately corrected the mistake) NS NS 2.84
Teacher pointed out errors NS NS 2.76 Teacher corrected errors during student written practice or
independent work NS NS 2.49
Other Activities Section A Items (Binary) “Clock Routine” used NS NS 0.93 “Counting Routine” used NS NS 0.92 “Calendar Routine ” used NS NS 0.91 “Number Pattern Routine” used NS NS 0.81 “Fact Practice” used NS NS 0.80

B.25
Table B.14 (continued)
Activity (Scale) Expected
Value
Met Expected Value
(Percentage) Mean Value “Weather Graph Routine” used NS NS 0.78 “Coin Cup Routine” used NS NS 0.76 “Lunch/Attendance Graph Routine” used NS NS 0.66 Homework previewed NS NS 0.62 “Fact Assessment” used NS NS 0.24 Section B Items (Scale) Teacher had materials prepared for lesson NS NS 3.32 Teacher used only the materials described in the lesson NS NS 3.28 Teacher asked questions that probed thinking (for example,
“How do you know?”) NS NS 1.84 Teacher demonstrated alternative strategies NS NS 1.58 Source: Author tabulations using classroom observation data. Note: For all Section A items but one, observers indicated whether or not an activity occurred. For that item
(Children summarized at the end of the lesson), observers used a five-point ordinal scale that included 0 (not at all), 1 (teacher summarized), 2 (one student), 3 (2–3 students), and 4 (multiple students). For Section B items, observers considered the extent to which various features of the curricula were used during math instruction and rated each feature using a four-point ordinal scale that included 1 (not at all characteristic), 2 (minimally characteristic), 3 (strongly characteristic), and 4 (extremely characteristic). Some features could be rated as not applicable (NA) when the lesson did not require a particular instructional activity. Some activities were not expected to occur daily. For these items, the expected frequency is not specified because the activity may not have been expected on the day of the single classroom observation.
NS indicates the expected frequency was not specified.

B.26
TABLE B.15
SFAW FIRST-GRADE SAMPLE: TEACHER-REPORTED FREQUENCY OF IMPLEMENTING CURRICULUM ACTIVITIES (N = 106)
Activity (Scale) Expected
Frequency
Met Expected Frequency
(Percentage) Mean
Response
Essential Activities Do the “Investigating the Concept” activity 5 62.9 4.33 Use manipulatives during the lesson 4-5 89.5 4.40 Use the “Think About It” questions 4 70.5 4.02 Differentiate math instruction for students at different
ability levels NS NS 4.01 Do the “Warm Up” activity 5 48.1 3.98 Ask students to complete the “Learn!” section of the
student worksheets 4-5 71.8 3.95 Do the “Spiral Review” 5 54.8 3.86 Use the “Talk About It” questions 4-5 67.3 3.81 Ask students to complete the “Test-Taking Practice” NS NS 2.88 Ask students to complete the “Journal Activity” NS NS 2.56 Provide the recommended “Error Intervention” for
struggling students NS NS 2.52 Administer SFAW assessments 2 89.5 2.50
Other Activities State the objective of the lesson 5 89.5 4.85 Provide step-by-step guidance on how to complete
the practice page NS NS 4.63 Provide reading assistance to students as they
complete the practice page NS NS 4.47 Introduce the vocabulary specified in the lesson 3-4 96.2 4.32 Provide additional activities for early finishers NS NS 3.93 Group students into small groups for collaborative
activities NS NS 3.58 Use the “Leveled Practice” provided for students at
varying levels (below, on level, above) NS NS 3.02 Use “Instant Check Mat” NS NS 2.05 Provide opportunities for students to use online
materials or other SFAW supplemental materials NS NS 0.99 Source: Author tabulations using cohort-one and cohort-two teacher survey data.
Note: Teachers indicated how frequently they implemented the activities on the following scale: 0 (never), 1 (less than once a month), 2 (once or twice a month), 3 (one to two times a week), 4 (three to four times a week), and 5 (daily). A mean of 4 indicates that teachers implemented an activity an average of three to four times a week.
NS indicates the expected frequency was not specified.

B.27
TABLE B.16
SFAW SECOND-GRADE SAMPLE: TEACHER-REPORTED FREQUENCY OF IMPLEMENTING CURRICULUM ACTIVITIES (N = 62)
Activity (Scale) Expected
Frequency
Met Expected Frequency
(Percentage) Mean
Response
Essential Activities Do the “Warm Up” activity 5 62.9 4.39 Use the “Think About It” questions 4 82.3 4.31 Ask students to complete the “Learn!” section of the
student worksheets 4-5 79.0 4.24 Use manipulatives during the lesson 4-5 75.8 4.05 Use the “Talk About It” questions 4-5 66.1 3.98 Differentiate math instruction for students at different
ability levels NS NS 3.94 Do the “Investigating the Concept” activity 5 45.0 3.92 Do the “Spiral Review” 5 41.9 3.68 Ask students to complete the “Test-Taking Practice” NS NS 3.00 Ask students to complete the “Journal Activity” NS NS 2.92 Administer SFAW assessments 2 91.8 2.64 Provide the recommended “Error Intervention” for
struggling students NS NS 2.54
Other Activities State the objective of the lesson 5 90.0 4.77 Provide step-by-step guidance on how to complete the
practice page NS NS 4.74 Introduce the vocabulary specified in the lesson 3-4 95.0 4.47 Provide reading assistance to students as they
complete the practice page NS NS 4.31 Provide additional activities for early finishers NS NS 3.85 Group students into small groups for collaborative
activities NS NS 3.60 Use the “Leveled Practice” provided for students at
varying levels (below, on level, above) NS NS 3.11 Use “Instant Check Mat” NS NS 1.78 Provide opportunities for students to use online
materials or other SFAW supplemental materials NS NS 1.55 Source: Author tabulations using cohort-two teacher survey data.
Note: Teachers indicated how frequently they implemented the activities on the following scale: 0 (never), 1 (less than once a month), 2 (once or twice a month), 3 (one to two times a week), 4 (three to four times a week), and 5 (daily). A mean of 4 indicates that teachers implemented an activity an average of three to four times a week.
NS indicates the expected frequency was not specified.

B.28
TABLE B.17
SFAW FIRST-GRADE SAMPLE: OBSERVED FREQUENCY OF IMPLEMENTING CURRICULUM ACTIVITIES (N = 101)
Activity (Scale) Expected
Value
Met Expected Value
(Percentage) Mean Value
Essential Daily Activities Section A Items (Binary) The teacher identified the important math concept or key idea
before the lesson began 1 91.1 0.91 Teacher conducted a closure activity 1 39.6 0.40 Section B Items (Scale) Students used recommended manipulatives or visual
representations 3 78.2 3.40 Children were engaged in “Investigating the Concept” activity
before the workbook page was discussed 3 81.2 3.16 Children were engaged in completing the “Spiral Review” of
previous relevant knowledge and skills 3 70.3 3.01 The structure of the lesson was warm up, teach, practice, and
assess 4 28.7 2.98 There was evidence of ongoing assessment and test-taking
practice 3 52.5 2.49 Teacher asked the “Think About It” questions 3 or NA 31.7 2.48 Teacher asked the “Talk About It” questions 3 or NA 30.7 2.32 Teacher provided error intervention with additional guided
practice on the area of difficulty 3 38.6 2.07
Other Activities Section A Items (Binary) If teacher used multisensory activities, was the connection to
math concepts clear and explicit? NS NS 0.70 Math vocabulary was evident on the wall board NS NS 0.64 Students who finished early were assigned other tasks NS NS 0.34 Teacher provided the “Reading Assist” for the practice page NS NS 0.20 Teacher provided opportunities for students to use online
materials NS NS 0.02 Section B Items (Scale) Teacher indicated incorrect answers NS NS 3.15 Teacher identified math vocabulary and explained meaning NS NS 2.94 Children were grouped for activities according to the
recommendation in the lesson NS NS 2.86 Time devoted to different parts of the lesson followed the
recommendation in the lesson NS NS 2.81 Teacher indicated part of the answer that was incorrect and
asked the student to check again NS NS 2.77 Teacher had students write in a math journal NS NS 1.36

Table B.17 (continued)
B.29
Source: Author tabulations using classroom observation data. Note: For Section A items, observers indicated whether or not an activity occurred. For Section B items,
observers considered the extent to which various features of the curricula were used during math instruction and rated each feature using a four-point ordinal scale that included 1 (not at all characteristic), 2 (minimally characteristic), 3 (strongly characteristic), and 4 (extremely characteristic). Some features could be rated as not applicable (NA) when the lesson did not require a particular instructional activity. Some activities were not expected to occur daily. For these items, the expected frequency is not specified because the activity may not have been expected on the day of the single classroom observation.
NS indicates the expected frequency was not specified.

B.30
TABLE B.18
SFAW SECOND-GRADE SAMPLE: OBSERVED FREQUENCY OF IMPLEMENTING CURRICULUM ACTIVITIES (N = 67)
Activity (Scale) Expected
Value
Met Expected Value
(Percentage) Mean Value
Essential Daily Activities Section A Items (Binary) The teacher identified the important math concept or key idea
before the lesson began 1 88.1 0.88 Teacher conducted a closure activity 1 44.8 0.45 Section B Items (Scale) Students used recommended manipulatives or visual
representations 3 71.6 3.29 Children were engaged in “Investigating the Concept” activity
before the workbook page was discussed 3 82.1 3.27 The structure of the lesson was warm up, teach, practice, and
assess 4 19.4 3.05 Children were engaged in completing the “Spiral Review” of
previous relevant knowledge and skills 3 67.2 3.04 Teacher asked the “Talk About It” questions 3 or NA 28.4 2.70 There was evidence of ongoing assessment and test-taking
practice 3 58.2 2.64 Teacher asked the “Think About It” questions 3 or NA 22.4 2.61 Teacher provided error intervention with additional guided
practice on the area of difficulty 3 47.8 2.28
Other Activities Section A Items (Binary) If teacher used multisensory activities, was the connection to
math concepts clear and explicit? NS NS 0.76 Math vocabulary is evident on the wall board NS NS 0.55 Students who finished early were assigned other tasks NS NS 0.33 Teacher provided the “Reading Assist” for the practice page NS NS 0.19 Teacher provided opportunities for students to use online
materials NS NS 0.01 Section B Items (Scale) Teacher indicated incorrect answers NS NS 3.37 Children were grouped for activities according to the
recommendation in the lesson NS NS 3.31 Time devoted to different parts of the lesson followed the
recommendation in the lesson NS NS 3.15 Teacher identified math vocabulary and explained meaning NS NS 3.08 Teacher indicated part of the answer that was incorrect and
asked the student to check again NS NS 2.80 Teacher had students write in a math journal NS NS 1.45
B.31
Table B.18 (continued)
Source: Author tabulations using classroom observation data. Note: For Section A items, observers were asked to indicate whether or not an activity occurred. For Section B
items, observers considered the extent to which various features of the curricula were used during math instruction and rated each feature using a four-point ordinal scale that included 1 (not at all characteristic), 2 (minimally characteristic), 3 (strongly characteristic), and 4 (extremely characteristic). Some features could be rated as not applicable (NA) when the lesson did not require a particular instructional activity. Some activities were not expected to occur daily. For these items, the expected frequency is not specified because the activity may not have been expected on the day of the single classroom observation.
NS indicates the expected frequency was not specified.

B.32
TABLE B.19
INTER-RATER RELIABILITY BY ITEM – ADHERENCE DATA
Observation Item Item Description
Inter-Rater Reliability
(Percentage)
INVESTIGATIONS (N = 13) a01 Counting (Routine) 69.2 a02 Time (Routine) 100.0 a03 Weather (Routine) 100.0 a04 Exploring Data (Routine) 100.0 a05 Making Pairs (Routine) 100.0 a07 Math lesson had an opening introductory activity 92.3 a08 Math lesson had a closing activity 84.6 b01 Children worked extended periods of time on a small number of problems 92.3 b02 Children work collaboratively on representing ideas and solving problems 100.0 b03 Games/activities are used to understand mathematics 84.6 b04 Practice of number facts occurred through worksheets and flashcards 84.6 b05 Students had access to manipulatives of their choosing 100.0 b06 Teacher immediately provided the correct solution 100.0 b07 Teacher accepted student responses with no indication of correct/incorrect 84.6 b08 Teacher clarified students' ideas for class 92.3 b09 Teacher built on child's mathematical ideas by extending understanding 84.6 b10 Teacher used questions and activities to guide thinking and self-correction 92.3 b11 Teacher asked students to explain reasoning for "correct" responses 92.3 b12 Teacher asked students to explain reasoning for "incorrect" responses 100.0 b13 Teacher probed for multiple strategies 92.3 b14 Teacher told the student the strategy to use 92.3 b15 Teacher gave children time to think before providing hints 100.0 b16 Children appeared familiar with the type of interaction that occurred today 100.0
MATH EXPRESSIONS (N = 17)
a01 Daily routine for the unit are used 100.0 a02 Teaching the lesson activities completed 100.0 a03 Teacher follows recommended grouping for the activities in the lesson 100.0 a04 Students worked on a math writing prompt 100.0 a05 Teacher assigned homework 94.1 a06 Teacher used the "extending the lesson activity" 100.0 a07 Teacher used the "remembering activities" 100.0 b01 Teacher fosters peer discussion of mathematical thinking 94.1 b02 Teacher used hints and questions to guide children in solving problems 94.1 b03 Teacher used the solve, explain, ask questions, justify model of instruction 94.1 b04 Teacher used student pairs 100.0 b05 Teacher used scenarios to demonstrate mathematical relationships 94.1 b06 Teacher used "step-by-step" at the board 94.1 b07 Teacher used whole class practice with student leaders 100.0 b08 Students worked together in small groups 100.0 b09 Teacher clarified and/or extended student thinking by rephrasing 100.0 b10 Teacher prompted and encouraged children to share strategies/thinking 94.1 b11 Teacher used errors as opportunities for learning 81.3 b12 Students lead the designated daily routines for the day independently 94.1 b13 Students questioned one another about math 100.0 b14 Students built on one another's ideas trying out what another student did 100.0 b15 Students used proof drawings to represent mathematical ideas 100.0

B.33
Table B.19 (continued)
Observation Item Item Description
Inter-Rater Reliability
(Percentage) b16 Students used visual representations to show conceptual understanding 94.1 b17 Students wrote equations to represent mathematical ideas 94.1 b18 Students explained math concepts or solutions to one another 100.0 b19 Students participated in Quick Practice 81.8 b20 Students wrote about math concepts 100.0 b21 Teacher used student ideas as the basis of mini-lessons 88.2 b22 Teacher uses real world situations to illustrate math ideas 100.0 b23 Teacher differentiates instruction for different kinds of students 100.0
SAXON (N = 11)
a01 Calendar (Routine) 100.0 a02 Counting (Routine) 100.0 a03 Number pattern/pattern (Routine) 100.0 a04 Weather graph/temperature (Routine) 100.0 a05 Lunch/attendance graph (Routine) 81.8 a06 Clock (Routine) 100.0 a07 Coin cup/money (Routine) 100.0 a08 Problem solving and mental computation (Routine) 100.0 a09 Right/left (Routine) 100.0 a10 Fact practice 81.8 a11 Fact assessment 90.9 a12 Teacher stated objective for lesson 100.0 a13 Homework preview 100.0 a14 Children practiced writing a number at least three times 100.0 a15 Children summarized at the end of lesson 90.9 b01 Teacher was faithful to the script during routines 100.0 b02 Teacher was faithful to the script during the lesson 100.0 b03 Teacher used only the materials as described in the lesson 90.9 b04 Teacher had materials prepared for lesson 90.9 b05 Teacher correctly modeled the concept or procedure according to script 100.0 b06 Teacher used the directed correction procedure 90.0 b07 Choral or non-verbal group responses were used 100.0 b08 Teacher used the materials as directed in the lesson 100.0 b09 Teacher demonstrated recommended strategy or procedure for lesson 100.0 b10 Teacher demonstrated alternative strategies 100.0 b11 Teacher guided practice in the day's objective 88.9 b12 Teacher monitored student completion of "Guided Class Practice" page 100.0 b13 Teacher pointed out errors 100.0 b14 Teacher corrected errors during student written practice/independent work 100.0 b15 Teacher asked questions that probed thinking 100.0 b16 Lesson was sequenced according to the manual 90.9
SFAW (N = 18)
a01 The teacher identified the key idea before the lesson began 83.3 a02 Math vocabulary is evident on wall board 94.4 a03 Teacher provided opportunities for students to use online materials 100.0 a04 Teacher conducted a closure activity 100.0 a05 Students who finished early were assigned other tasks 85.7 a06 If teacher used multisensory activities, the connection to math was clear 100.0 a07 Teacher provided the Reading Assist for the practice page 100.0 b01 Children were engaged in completing the Spiral Review 94.4 b02 Children were engaged in Investigating the Concept activity before workbook 94.1 b03 Teacher asked the "talk about it" questions 94.1

B.34
Table B.19 (continued)
Observation Item Item Description
Inter-Rater Reliability
(Percentage) b04 Teacher asked the "think about it" questions 81.3 b05 Teacher had students write in a math journal 100.0 b06 Teacher identified math vocabulary and explained meaning 90.9 b07 There was evidence of ongoing assessment and test-taking practice 94.1 b08 Teacher indicated incorrect answers 94.1 b09 Teacher indicated part of the answer that is incorrect 81.3 b10 Students used recommended manipulatives or visual representations 100.0 b11 Teacher provided error intervention with additional guided practice 88.2 b12 The structure of the lesson was warm up, teach, practice, and assess 100.0 b13 Children were grouped for activities according to the recommendation 88.2 b14 Time devoted to different parts of the lesson followed the recommendation 100.0
Source: Author calculations using 59 paired observations in first- and second-grade classrooms. Observation data were
collected by the study team. Note: About 10 percent of the classroom observations were coded by two observers to assess item reliability. Percentage
agreement was calculated within 1 for all categorical items. Exact agreement was required for dichotomous items. Items with inter-rater reliability below 75 percent were considered unreliable.

APPENDIX C
PROCESS USED TO CREATE MEASURES OF TEACHING APPROACHES AND PRACTICES
This page intentionally left blank for double-sided copying.

C.3
In this appendix we provide additional information about the development of the classroom observation protocol and procedures used for converting raw observational data into quantitative indices of teaching approaches and practices.
A. PROTOCOL DEVELOPMENT
The framework we used to develop the study’s observation protocol is based on the structure developed by Dane and Schneider (1998) and later updated by Dusenbury et al. (2003) and Lynch and O’Donnell (2005). The framework is comprised of five domains:
1. Exposure. Sometimes referred to as “dosage,” exposure is described in the 2004
National Research Council (NRC) report as the extent of curricular implementation.
2. Quality of Delivery. Areas of teacher quality that previous research has identified include student behavior management, use and organization of instructional time, extent to which the environment is emotionally supportive, and quality of feedback (Baker 1999; Pianta et al. 2006).
3. Participant Responsiveness. As noted in the NRC (2004) report, studies of mathematics curricula by Baxter and colleagues (Woodward and Baxter 1997; Baxter et al. 2001) illustrated the importance of examining student engagement or participant responsiveness; other studies had similar findings (Padron and Waxman 1999).
4. Program Differentiation. This domain examines features that distinguish one curriculum from another. Some practices required in one curriculum (for example, telling a student when an answer is incorrect) are discouraged in another (Huntley 2005).
5. Adherence. This area considers whether the teacher adhered to the strategies and activities described in the developer’s materials. The adherence section of the protocol is discussed in Chapter II and was not used in the development of cross-curriculum scales.
These five domains were combined into a protocol designed to capture information on two perspectives: (1) one that examines instructional quality and student engagement across the curricula and (2) another that includes curriculum-specific items to examine adherence to each curriculum. The cross-curriculum portion of the protocol was used to measure teacher activities and practices.
To establish the face validity of the items developed for each domain before using them in
the field, the protocols were piloted by using them with videotapes of classrooms and in live classrooms. In addition, the protocol was reviewed by members of the study’s advisory panel and by the Institute of Education Sciences (IES). Revisions were made based on feedback received from each pilot session and review.
C.4
The protocol includes interactive coding (coding clearly defined behaviors as they occur) and ratings that provide information in several categories, including teacher-initiated instruction; type of feedback provided to students; use of representations for mathematical ideas; student engagement; classroom management; teacher use of time; materials available; and the setting (such as independent work, small group, or large group) in which students work.
Because of the different instructional approaches used by the study’s curricula, the protocol
was designed to code for instructional behaviors related to a content-focus (which typically concentrates on obtaining correct answers) and a process-focus (which typically is more metacognitive). For many behaviors, the expected differentiation among the curricula is how often the behavior is used. Thus, while some items require a yes or no response, most require observers to tally the frequency of a behavior. Such items are those that may occur with different frequency across the curricula and therefore may be most important for differentiating the curricula.
Frequency alone would not capture whether the behaviors occur throughout the class and at
the appropriate times, however. For example, a teacher might ask several open-ended questions at the beginning of class and then not do so again for the rest of the class period. In another classroom, the use of open-ended questions may occur with the same frequency but distributed throughout the lesson. Therefore, ratings were completed at the end of the day to allow observers to characterize the prevalence of such behaviors over the lesson as a whole. The behaviors rated by observers include behavior management, student responsiveness or engagement, use of instructional time, emotional supportiveness of the classroom, peer collaboration, and differentiation of instruction. Observers rated these characteristics of the classroom environment on a four-point scale: 1 (not at all characteristic), 2 (minimally characteristic), 3 (strongly characteristic), and 4 (extremely characteristic).
B. DETAILED DESCRIPTION OF THE EXPLORATORY FACTOR ANALYSIS
Social scientists have evolved several scaling methods for converting raw observational data into quantitative measures. These methods vary in the number and kinds of underlying assumptions they rest upon, as well as in their analytical sophistication. In this section, we discuss several prevalent scaling methods and our rationale for selecting a particular method.
All these scaling methods employ a form of data reduction, combining information from
dozens of observation items into a much smaller set of meaningful numbers. Analytically, we are often more interested in a small handful of key underlying constructs than we are in the idiosyncratic ways in which these constructs can manifest themselves in behavior. For example, we may be interested in the extent to which teachers assigned to a particular curriculum use teacher-directed instructional approaches. This may be indicated by several different behaviors, such as the number of close-ended questions asked by the teacher, the frequency with which the teacher tells information to students, or the percentage of time spent in whole group instruction. Any one of these direct observations is in part driven by the underlying characteristic of teacher-directed instruction. While any single observational element gives us some information about a teacher’s propensity to use teacher-directed instruction, combining the information gathered

C.5
from several such elements delivers a more precise and accurate estimate of that teacher’s propensity in this regard.
The question of how to combine this information across observational elements and
mathematically translate the result into measures of a construct is the subject of scaling methods. As with any research activity, the best method depends largely on the nature of the question being asked.
In this study, we proposed a set of construct definitions when the observation instruments
were developed (Agodini et al. 2008). However, our lack of prior experience with the protocol led us to remain open to the possibility that we might need to modify these definitions once we examined the observational data.
As a result, our approach was to: (1) recode the observational data, if necessary, in
preparation for a classical exploratory factor analysis (EFA); (2) fit a series of exploratory factor models while systematically varying technical model parameters; and (3) examine the results of each variation, noting where the outcomes (the loading of particular items on specific factors) were sensitive to variations in method. After examining the factor models and interpreting the collections of items that emerged, we defined, labeled, and scaled a new set of constructs.
We note that there is no judgment-free, objective method for converting observational data
into measurement scales. The selection of a method is itself a human judgment, and once a selection is made subsequent decisions are required to determine the best criteria for judging model fit.
1. Data Preparation for the EFA
The items in the observation protocol can be divided into three types: dichotomous (a box is checked or not checked), ordinal (a selection is made from a scale), and count (a specific behavior is tallied and the count recorded). Conducting an exploratory factor analysis with a mixture of ordinal and count items presents a challenge to most commercial software.89
In order to conduct a classical EFA, we recoded the count data into an ordinal representation based on quintiles. This enabled us to construct a consistent polychoric correlation matrix of all observation items simultaneously, a necessary precursor to conducting the exploratory factor analysis.
We created two constructs that combined dichotomous items from Sections G and H of the observation protocol.90
These items were dichotomous check-boxes indicating whether particular mathematical materials and representations were used in the classroom. We created a measure that indicates the number of G items used, and another that indicates the number of H items used.
89 The analysis was conducted using STATA. Mplus provides another analysis option, but is unlikely to produce different results.
90 The protocol contains 10 sections (Sections A through J) that are described in Chapter IV.
C.6
Another construct was created by totaling the number of types of rote counting (by ones, by twos, by fives, and so on) used in the classroom. All three of these constructs (which were continuous variables) were converted to quintiles.
Items on the observation protocol were used in the EFA if they met an acceptable threshold
for inter-rater reliability. To assess the reliability of observers in the field, each observer was paired with a master coder for at least one observation, resulting in about 10 percent of observations coded by two individuals. Master coders were study team members with direct experience in developing and piloting the observation form and significant experience coding the protocols. One item on the observation protocol (students participated in curricula specific activities) failed to meet the inter-rater reliability threshold (see Table C.1); it was the only item excluded from the EFA.
2. Model Fitting
We used Stata software (version 11) to fit a series of exploratory factor models based on the observation items. Several technical parameters were varied, among them:
• The use of orthogonal or oblique factor rotations • The number of factors extracted • The threshold value used to qualify item loadings • The selection criteria for assigning items to constructs We describe each parameter variation below. Use of Orthogonal and Oblique Factor Rotations. Two types of rotation could be used in
the EFA—orthogonal and oblique. We conducted the EFA and all parameter variations using both rotations to assess the sensitivity of the results to this parameter.
In the orthogonal approach, after the first factor has been extracted, each subsequent factor
is defined to maximize the variability that is not captured by preceding factors and each extracted factor is assumed to have removed all variability related to that factor so that consecutive factors are independent of each other. In other words, consecutive factors are uncorrelated, or orthogonal to each other.
In the oblique approach, factors are assumed to be correlated with one another. Factors are
intended to represent the best clusters of variables, without the constraint of their orthogonality. The oblique and orthogonal solutions were similar to one another, but the solutions based on
the oblique rotations were slightly more desirable for their reliability and meaningfulness. In addition, conceptually, there was no reason to expect that factors should be orthogonal; therefore, we chose to use solutions based on oblique rotation.
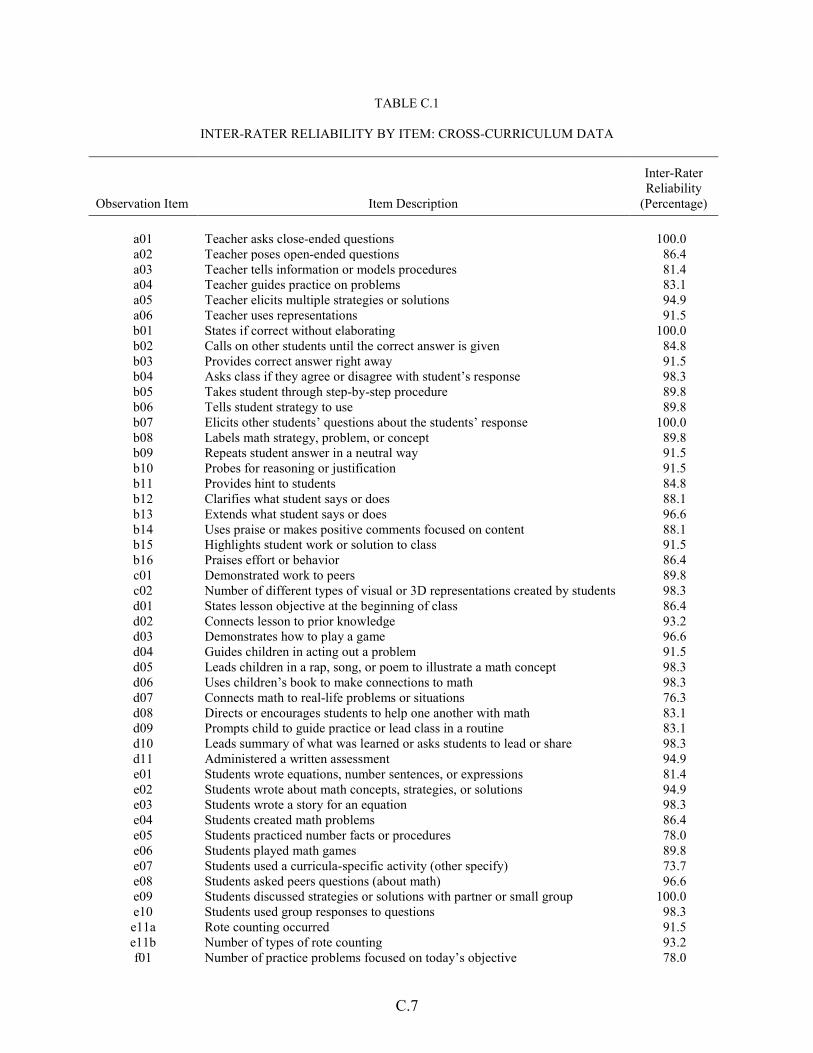
C.7
TABLE C.1
INTER-RATER RELIABILITY BY ITEM: CROSS-CURRICULUM DATA
Observation Item Item Description
Inter-Rater Reliability
(Percentage)
a01 Teacher asks close-ended questions 100.0 a02 Teacher poses open-ended questions 86.4 a03 Teacher tells information or models procedures 81.4 a04 Teacher guides practice on problems 83.1 a05 Teacher elicits multiple strategies or solutions 94.9 a06 Teacher uses representations 91.5 b01 States if correct without elaborating 100.0 b02 Calls on other students until the correct answer is given 84.8 b03 Provides correct answer right away 91.5 b04 Asks class if they agree or disagree with student’s response 98.3 b05 Takes student through step-by-step procedure 89.8 b06 Tells student strategy to use 89.8 b07 Elicits other students’ questions about the students’ response 100.0 b08 Labels math strategy, problem, or concept 89.8 b09 Repeats student answer in a neutral way 91.5 b10 Probes for reasoning or justification 91.5 b11 Provides hint to students 84.8 b12 Clarifies what student says or does 88.1 b13 Extends what student says or does 96.6 b14 Uses praise or makes positive comments focused on content 88.1 b15 Highlights student work or solution to class 91.5 b16 Praises effort or behavior 86.4 c01 Demonstrated work to peers 89.8 c02 Number of different types of visual or 3D representations created by students 98.3 d01 States lesson objective at the beginning of class 86.4 d02 Connects lesson to prior knowledge 93.2 d03 Demonstrates how to play a game 96.6 d04 Guides children in acting out a problem 91.5 d05 Leads children in a rap, song, or poem to illustrate a math concept 98.3 d06 Uses children’s book to make connections to math 98.3 d07 Connects math to real-life problems or situations 76.3 d08 Directs or encourages students to help one another with math 83.1 d09 Prompts child to guide practice or lead class in a routine 83.1 d10 Leads summary of what was learned or asks students to lead or share 98.3 d11 Administered a written assessment 94.9 e01 Students wrote equations, number sentences, or expressions 81.4 e02 Students wrote about math concepts, strategies, or solutions 94.9 e03 Students wrote a story for an equation 98.3 e04 Students created math problems 86.4 e05 Students practiced number facts or procedures 78.0 e06 Students played math games 89.8 e07 Students used a curricula-specific activity (other specify) 73.7 e08 Students asked peers questions (about math) 96.6 e09 Students discussed strategies or solutions with partner or small group 100.0 e10 Students used group responses to questions 98.3 e11a Rote counting occurred 91.5 e11b Number of types of rote counting 93.2 f01 Number of practice problems focused on today’s objective 78.0

C.8
Table C.1 (continued)
Observation Item Item Description
Inter-Rater Reliability
(Percentage) f02 Number of problems focused on review of previously learned material 76.3 f03 Review of homework 93.2 G Materials used by children (number used) 91.5 H Types of representations (number used) 81.4
i01 Percent of time in large group 96.6 i02 Percent of time in small group 100.0 i03 Percent of time in pairs 100.0 i04 Percent of time individual 96.6 j01 Students are cooperative and attentive to the lesson 100.0 j02 Teacher spends a lot of time managing behavior (reverse coded) 100.0 j03 Student behavior disrupts the classroom (reverse coded) 96.6 j04 Students are perfectly behaved 100.0 j05 Teacher uses praise or rewards to maintain positive behavior 96.6 j06 Teacher uses nonverbal methods to manage misbehaviors 98.3 j07 Class runs without disruption from student behavior 98.3 j08 Students appear excited by the lesson 96.6 j09 Students are actively engaged 98.3 j10 Students attended to the lesson in a passive way (reverse coded) 94.9 j11 Students are off-task (reverse coded) 98.3 j12 Teacher and students have a warm, positive relationship 96.6 j13 Teacher encourages students to help one another understand the math 93.2 j14 Students help one another understand math concepts or procedures 94.9 j15 Peer-to-peer interaction about math occurs 98.3 j16 Teacher has techniques for gaining class attention in less than 10 seconds 96.6 j17 Students spend little time waiting or transitioning 98.3 j18 Transitions are smooth, and students get to work quickly 94.9 j19 Students do not need to wait for the teacher to begin 94.9 j20 Teacher spends a lot of time giving directions. (reverse coded) 100.0 j21 Teacher has materials prepared and ready for students 98.3 j22 Class time is spent on understanding or practicing math 98.3 j23 Students had easy access to and permission to use manipulatives 94.9 j24 Teacher is fluid in presentation 96.6 j25 Students appear familiar with the materials and procedures used 96.6 j26 Students are given the opportunity to think and respond 93.1 j27 During independent work time, teacher monitored student work 96.3 j28 In monitoring student work, teacher followed through to ensure understanding 98.3 j29 Teacher differentiated curriculum for children who were above level 96.6 j30 Teacher differentiated curriculum for children who were below level 100.0 j31 Teacher differentiated curriculum for English language learners 94.7
Source: Author calculations using 59 paired observations in first- and second-grade classrooms. Observation data were
collected by the study team. Note: About 10 percent of the classroom observations were coded by two observers to assess item reliability. When
assessing inter-rater reliability, some items were measured using the raw data and other items were measured using constructs derived from the raw data. Specifically, tallied items in Sections A, B, C, and F were converted to the following seven categories 0 (0 tallies), 1 (1–2 tallies), 2 (3-5 tallies), 3 (6–10 tallies), 4 (11–15 tallies), 5 (16–20 tallies), and 6 (21 or more tallies). Items in Sections G and H, and item e11b (which was a series of check boxes) were converted into a single continuous variable for each section that summed the items in each section. These constructs were consistent with the methods used to certify observers for the observation effort during training. Percentage agreement was calculated within 1 for all (raw and constructed) categorical and continuous items. Exact agreement was required for dichotomous items. Items with inter-rater reliability below 75 percent were considered unreliable.

C.9
Number of Factors Extracted. The number of factors extracted ranged from one to five.91
The number of factors were varied to help identify the most reliable and meaningful solutions. Generally speaking, we could quickly discount the one-factor solutions, and then closely evaluated solutions based on two to five factors for potential use in the mediation analysis.
Threshold Value Used to Qualify Item Loadings. Factor loadings of 0.30 and 0.35 were tested as the minimum threshold required to keep an item on a factor solution. Values between 0.30 and 0.40 are commonly used in EFAs; however, the data used in this analysis include many binary and ordinal variables, which have less variation than count data and could be less likely to meet the 0.40 threshold. Values of 0.30 and 0.35 were considered to evaluate how many items might be gained or lost from each solution, depending on the threshold used. A threshold of 0.35 was selected as the criterion for keeping items because very few items were gained by lowering the threshold to 0.30 (see factor loadings in Table C.2).
Selection Criteria for Assigning Items to Constructs. As we conducted the EFA some
items loaded on multiple factors. When this occurred, we examined whether the items should be kept on all factors to which they loaded. We considered three selection criteria for assigning items to constructs:
1. Unique Criterion. An item would be assigned to a single construct if and only if its
loading exceeded the threshold value on one and only one construct.
2. Maximum Criterion. An item would be assigned to a single construct if and only if its loading exceeded the threshold value and this construct was the maximally loading factor.
3. Multiple Match Criterion. An item would be assigned to multiple constructs as long as its loading exceeded the threshold value for each construct. 92
91 Early in the analysis, the number of factors extracted ranged from one to ten. The results showed a rapid deterioration in the interpretability and reliability of solutions with more than five factors. Therefore, all subsequent variations in the analysis were conducted using one to five factors.
92 A fourth method would have been to construct a pure measurement model in which a weighted sum of every item is used to construct each factor score (the weights varying by factor). We discussed and discarded this possibility because, since all factor loadings are statistics derived from this specific sample, they would necessarily vary if these instruments were used on a different sample. This means that the actual operational definitions of the measures would vary across applications. It also means that the results from two different samples could not be meaningfully compared. We chose to use the factor-based scale method (Kim and Mueller 1978) to preserve replicability across future applications:
“Consequently a scale is built by summing all the variables with substantial loadings and ignoring the remaining variables with minor loadings. The scale created in this way is no longer a factor scale but merely factor-based. The specific reasons behind such a scale construction are that (1) even if factor loadings are zero for some variables in the population they will not be zero in a specific sample solution; (2) even if the factor loadings are uniform in the population, they will not be so in a sample. The rule of
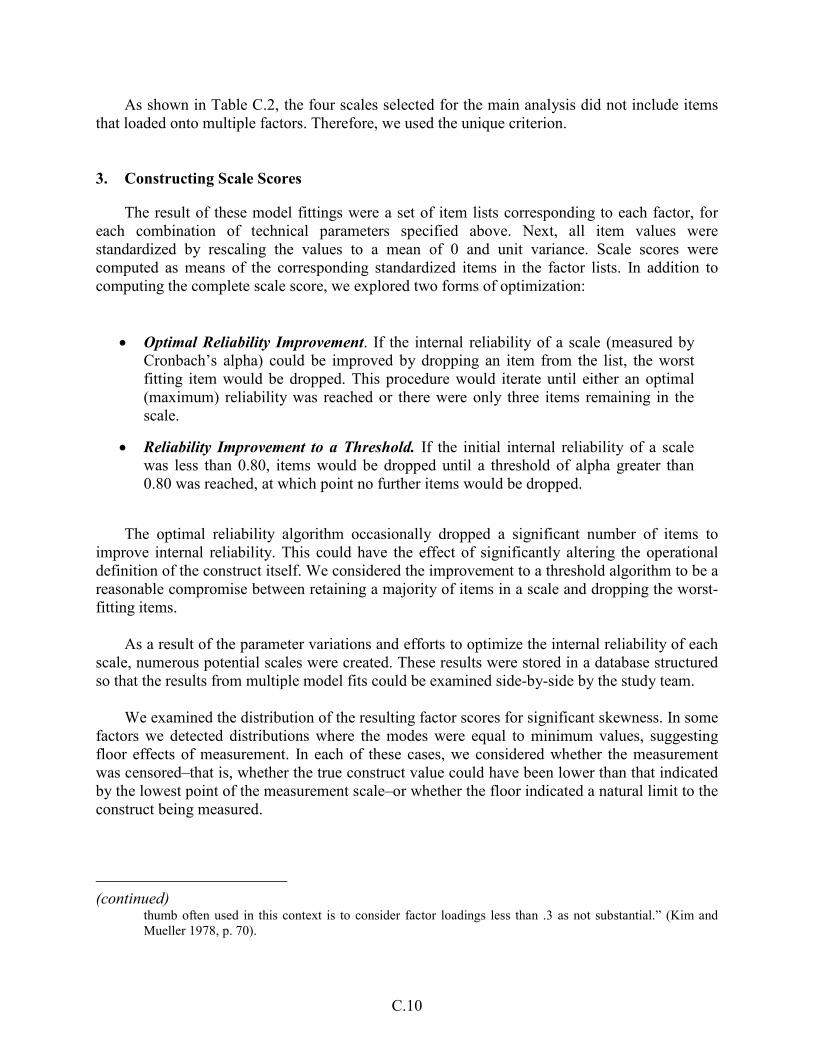
C.10
As shown in Table C.2, the four scales selected for the main analysis did not include items that loaded onto multiple factors. Therefore, we used the unique criterion.
3. Constructing Scale Scores
The result of these model fittings were a set of item lists corresponding to each factor, for each combination of technical parameters specified above. Next, all item values were standardized by rescaling the values to a mean of 0 and unit variance. Scale scores were computed as means of the corresponding standardized items in the factor lists. In addition to computing the complete scale score, we explored two forms of optimization:
• Optimal Reliability Improvement. If the internal reliability of a scale (measured by
Cronbach’s alpha) could be improved by dropping an item from the list, the worst fitting item would be dropped. This procedure would iterate until either an optimal (maximum) reliability was reached or there were only three items remaining in the scale.
• Reliability Improvement to a Threshold. If the initial internal reliability of a scale was less than 0.80, items would be dropped until a threshold of alpha greater than 0.80 was reached, at which point no further items would be dropped.
The optimal reliability algorithm occasionally dropped a significant number of items to improve internal reliability. This could have the effect of significantly altering the operational definition of the construct itself. We considered the improvement to a threshold algorithm to be a reasonable compromise between retaining a majority of items in a scale and dropping the worst-fitting items.
As a result of the parameter variations and efforts to optimize the internal reliability of each
scale, numerous potential scales were created. These results were stored in a database structured so that the results from multiple model fits could be examined side-by-side by the study team.
We examined the distribution of the resulting factor scores for significant skewness. In some
factors we detected distributions where the modes were equal to minimum values, suggesting floor effects of measurement. In each of these cases, we considered whether the measurement was censored–that is, whether the true construct value could have been lower than that indicated by the lowest point of the measurement scale–or whether the floor indicated a natural limit to the construct being measured.
(continued)
thumb often used in this context is to consider factor loadings less than .3 as not substantial.” (Kim and Mueller 1978, p. 70).

C.11
For example, a scale comprised of indicators of student peer group discussion may result in many classrooms exhibiting a perfect zero for a score–these would be classrooms in which the lesson allows no time for students to talk among themselves. In this case, no censoring would have occurred–the construct being measured (classroom peer discussion) had a natural limit, reflected in the zeros on the factor score. If, on the other hand, these items were intended to reflect the degree of openness in the classroom climate, a wide range of classrooms on the more closed end of the spectrum could exhibit zeros on the factor score. In this case, we would need to flag this factor as possibly being censored and adjust for this in subsequent analytical models.
4. Final Scale Selection
Given the numerous solutions and the overarching goal of creating meaningful and reliable scales, we identified the four factor solution as the best choice (Table IV.2). This solution maximized our scale development goal to balance meaningfulness with reliability. The solution produced four reliable scales: measures of student-centered and teacher-directed instruction, which were likely to differentiate the curricula; a measure of peer collaboration, which may be important for distinguishing the curricula; and a highly reliable measure of the classroom environment.
In the solution we selected, approximately 20 of the Section J items loaded onto one highly
reliable scale that measures classroom quality and environment, including behavior management, use of instructional time, and the presence of warm or positive interactions between teachers and students (Table IV.2). Regardless of the number of factors extracted, this set of items consistently loaded onto a single scale. Based on the framework used in the protocol development (in which these aspects of the classroom environment were considered separately), additional exploratory work was conducted to determine if this classroom environment construct was comprised of additional underlying factors. Therefore, two additional models examined Section J separately from Sections A through I.93
The results showed that five scales could be extracted from Section J when it was treated separately. Three of the five scales (labeled behavior management, use of instructional time, and interactions with students) were derived from the one broad measure of the classroom environment we identified when analyzing all sections together. However, those three scales are correlated with each other in the range of 0.57 to 0.72. Since we are using the scales in a mediation analysis of curriculum effects on student achievement, it is important to avoid collinearity problems in the models.
93 For the factors that emerged from these models, each of five items loaded onto two constructs in meaningful
ways. Further, these cross-loading items added to the internal reliability of both factors to which they loaded. Therefore, for this analysis, we used the multiple match criterion described above for assigning items to constructs.
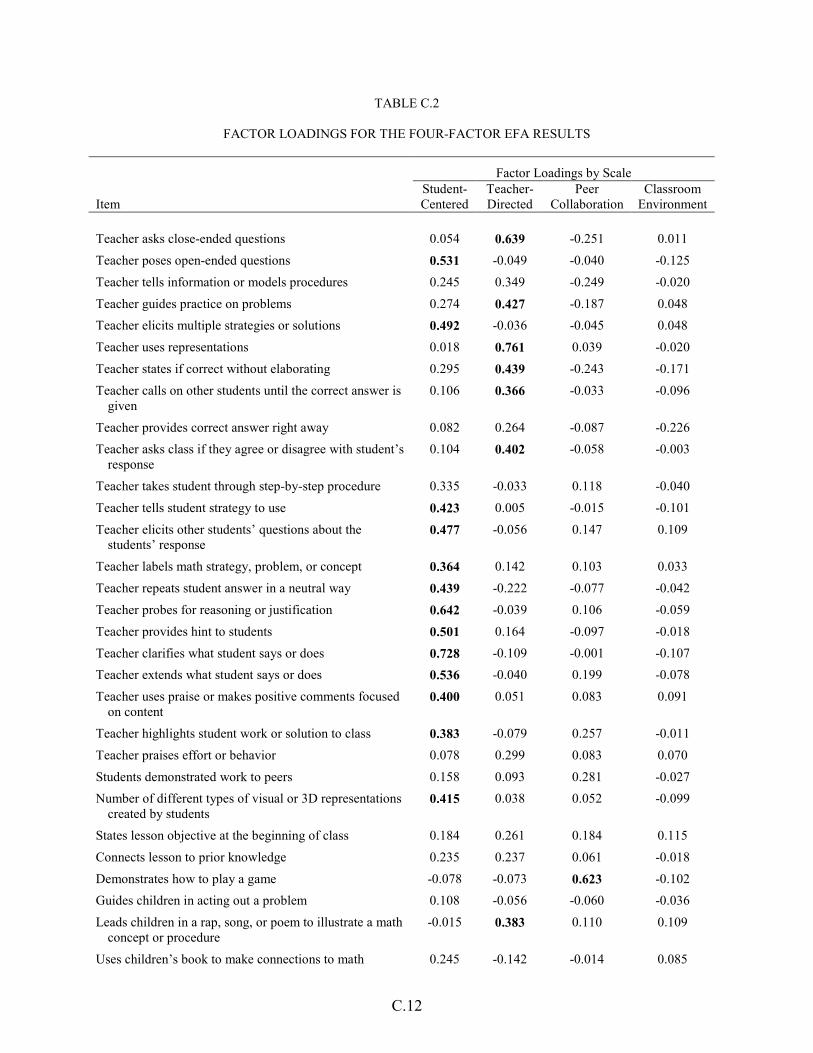
C.12
TABLE C.2
FACTOR LOADINGS FOR THE FOUR-FACTOR EFA RESULTS
Factor Loadings by Scale
Item Student- Centered
Teacher-Directed
Peer Collaboration
Classroom Environment
Teacher asks close-ended questions 0.054 0.639 -0.251 0.011 Teacher poses open-ended questions 0.531 -0.049 -0.040 -0.125 Teacher tells information or models procedures 0.245 0.349 -0.249 -0.020 Teacher guides practice on problems 0.274 0.427 -0.187 0.048 Teacher elicits multiple strategies or solutions 0.492 -0.036 -0.045 0.048 Teacher uses representations 0.018 0.761 0.039 -0.020 Teacher states if correct without elaborating 0.295 0.439 -0.243 -0.171 Teacher calls on other students until the correct answer is
given 0.106 0.366 -0.033 -0.096
Teacher provides correct answer right away 0.082 0.264 -0.087 -0.226 Teacher asks class if they agree or disagree with student’s
response 0.104 0.402 -0.058 -0.003
Teacher takes student through step-by-step procedure 0.335 -0.033 0.118 -0.040 Teacher tells student strategy to use 0.423 0.005 -0.015 -0.101 Teacher elicits other students’ questions about the
students’ response 0.477 -0.056 0.147 0.109
Teacher labels math strategy, problem, or concept 0.364 0.142 0.103 0.033 Teacher repeats student answer in a neutral way 0.439 -0.222 -0.077 -0.042 Teacher probes for reasoning or justification 0.642 -0.039 0.106 -0.059 Teacher provides hint to students 0.501 0.164 -0.097 -0.018 Teacher clarifies what student says or does 0.728 -0.109 -0.001 -0.107 Teacher extends what student says or does 0.536 -0.040 0.199 -0.078 Teacher uses praise or makes positive comments focused
on content 0.400 0.051 0.083 0.091
Teacher highlights student work or solution to class 0.383 -0.079 0.257 -0.011 Teacher praises effort or behavior 0.078 0.299 0.083 0.070 Students demonstrated work to peers 0.158 0.093 0.281 -0.027 Number of different types of visual or 3D representations
created by students 0.415 0.038 0.052 -0.099
States lesson objective at the beginning of class 0.184 0.261 0.184 0.115 Connects lesson to prior knowledge 0.235 0.237 0.061 -0.018 Demonstrates how to play a game -0.078 -0.073 0.623 -0.102 Guides children in acting out a problem 0.108 -0.056 -0.060 -0.036 Leads children in a rap, song, or poem to illustrate a math
concept or procedure -0.015 0.383 0.110 0.109
Uses children’s book to make connections to math 0.245 -0.142 -0.014 0.085

C.13
Table C.2 (continued)
Factor Loadings by Scale
Item Student- Centered
Teacher-Directed
Peer Collaboration
Classroom Environment
Connects math to real-life problems or situations 0.124 0.087 0.039 0.011 Directs or encourages students to help one another with
math 0.017 0.145 0.785 -0.078
Prompts child to guide practice or lead class in a routine -0.016 0.594 0.220 -0.027 Leads summary of what was learned or asks students to
lead/share summary 0.064 0.290 0.033 0.081
Administered a written assessment 0.245 0.029 -0.155 0.081 Students wrote equations, number sentences, or
expressions -0.002 0.339 0.000 0.107
Students wrote about math concepts, strategies, or solutions
0.395 -0.310 -0.286 0.228
Students wrote a story for an equation 0.172 0.122 -0.006 0.028 Students created math problems 0.127 0.033 0.269 0.086 Students practiced number facts or procedures -0.259 0.553 0.073 -0.027 Students played math games -0.146 -0.150 0.596 -0.031 Students asked peers questions (about math) 0.206 0.011 0.696 -0.015 Students discussed strategies or solutions with partner or
small group 0.214 -0.164 0.730 -0.059
Choral (group) responses to questions -0.056 0.351 -0.085 0.076 Rote counting occurred -0.205 0.741 0.116 -0.008 Number of types of rote counting -0.211 0.761 0.057 0.001 Number of practice problems focused on today’s
objective 0.051 0.301 -0.013 0.043
Number of problems focused on review of previously learned material
-0.005 0.559 -0.178 0.029
Review of homework (together in class or marked answers correct or incorrect)
-0.045 0.114 -0.182 0.296
Materials used by children (number used) 0.006 0.433 0.219 0.059 Types of representations (number used) 0.195 0.390 -0.031 0.029 Percent of time in large group -0.056 0.528 -0.229 -0.021 Percent of time in small group 0.049 -0.030 0.456 -0.094 Percent of time in pairs 0.006 -0.206 0.601 -0.035 Percent of time individual 0.161 -0.280 -0.504 0.075 Students are cooperative and attentive to the lesson 0.011 -0.024 -0.107 0.883 Teacher spends a lot of time managing behavior (reverse
coded) -0.077 0.029 -0.068 0.829
Student behavior disrupts the classroom (reverse coded) -0.072 -0.051 -0.086 0.848 Students are perfectly behaved -0.091 -0.022 -0.145 0.847 Teacher uses praise or rewards to maintain positive
behavior -0.011 0.106 0.073 0.315

C.14
Table C.2 (continued)
Factor Loadings by Scale
Item Student- Centered
Teacher-Directed
Peer Collaboration
Classroom Environment
Teacher uses nonverbal methods (that do not disrupt class) to manage misbehaviors (or no misbehavior was evident)
0.044 0.148 0.038 0.517
Class runs without disruption from student behavior -0.009 -0.055 -0.097 0.815 Students appear excited by the lesson (smiling, leaning
forward, waving hands, starting easily and quickly on activity)
-0.019 0.158 0.202 0.580
Students are actively engaged (asking questions, responding, working with materials, writing)
0.014 0.057 0.106 0.661
Students attended to the lesson in a passive way (reverse coded)
0.014 -0.060 0.206 0.362
Students are off-task (reverse coded) -0.156 0.113 -0.051 0.805 Teacher and students have a warm, positive relationship -0.064 0.063 0.102 0.650 Teacher encourages students to help one another
understand the math -0.016 0.072 0.845 -0.033
Students help one another understand math concepts or procedures
0.048 0.022 0.848 -0.064
Peer-to-peer interaction about math occurs -0.043 -0.014 0.881 -0.006 Teacher has techniques for gaining class attention in less
than 10 seconds 0.024 -0.067 -0.101 0.796
Students spend little time waiting or transitioning -0.027 0.001 0.083 0.707 Transitions are smooth, and students get to work quickly 0.006 -0.042 -0.016 0.692 Students do not need to wait for the teacher to begin -0.235 -0.033 0.074 0.257 Teacher spends a lot of time giving directions (reverse
coded) -0.028 -0.043 -0.089 0.616
Teacher has materials prepared and ready for students -0.037 0.080 0.154 0.418 Class time is spent on understanding or practicing math -0.064 0.037 0.097 0.761 Students had easy access to and permission to use
manipulatives 0.038 -0.088 0.264 0.253
Teacher is fluid in presentation 0.122 -0.070 -0.020 0.682 Students appear familiar with the materials and
procedures used 0.061 -0.073 -0.059 0.522
Students are given the opportunity to think and respond 0.197 -0.007 0.064 0.388 During independent work time, teacher monitored student
work 0.339 -0.226 0.021 0.310
In monitoring student work, teacher followed through to ensure understanding
0.230 -0.194 0.101 0.423
Teacher differentiated curriculum for children who were above level
0.373 -0.062 0.292 -0.032
Teacher differentiated curriculum for children who were below level
0.321 -0.035 0.205 0.026
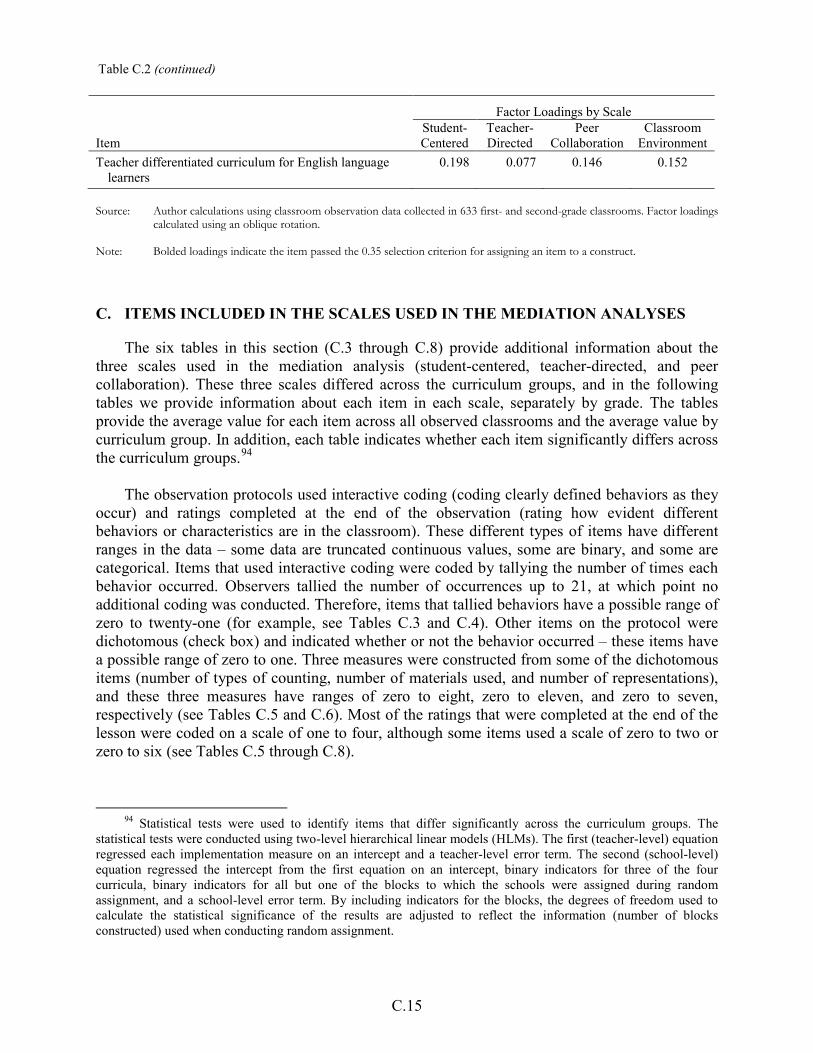
C.15
Table C.2 (continued)
Factor Loadings by Scale
Item Student- Centered
Teacher-Directed
Peer Collaboration
Classroom Environment
Teacher differentiated curriculum for English language learners
0.198 0.077 0.146 0.152
Source: Author calculations using classroom observation data collected in 633 first- and second-grade classrooms. Factor loadings
calculated using an oblique rotation. Note: Bolded loadings indicate the item passed the 0.35 selection criterion for assigning an item to a construct. C. ITEMS INCLUDED IN THE SCALES USED IN THE MEDIATION ANALYSES
The six tables in this section (C.3 through C.8) provide additional information about the three scales used in the mediation analysis (student-centered, teacher-directed, and peer collaboration). These three scales differed across the curriculum groups, and in the following tables we provide information about each item in each scale, separately by grade. The tables provide the average value for each item across all observed classrooms and the average value by curriculum group. In addition, each table indicates whether each item significantly differs across the curriculum groups.94
The observation protocols used interactive coding (coding clearly defined behaviors as they occur) and ratings completed at the end of the observation (rating how evident different behaviors or characteristics are in the classroom). These different types of items have different ranges in the data – some data are truncated continuous values, some are binary, and some are categorical. Items that used interactive coding were coded by tallying the number of times each behavior occurred. Observers tallied the number of occurrences up to 21, at which point no additional coding was conducted. Therefore, items that tallied behaviors have a possible range of zero to twenty-one (for example, see Tables C.3 and C.4). Other items on the protocol were dichotomous (check box) and indicated whether or not the behavior occurred – these items have a possible range of zero to one. Three measures were constructed from some of the dichotomous items (number of types of counting, number of materials used, and number of representations), and these three measures have ranges of zero to eight, zero to eleven, and zero to seven, respectively (see Tables C.5 and C.6). Most of the ratings that were completed at the end of the lesson were coded on a scale of one to four, although some items used a scale of zero to two or zero to six (see Tables C.5 through C.8).
94 Statistical tests were used to identify items that differ significantly across the curriculum groups. The
statistical tests were conducted using two-level hierarchical linear models (HLMs). The first (teacher-level) equation regressed each implementation measure on an intercept and a teacher-level error term. The second (school-level) equation regressed the intercept from the first equation on an intercept, binary indicators for three of the four curricula, binary indicators for all but one of the blocks to which the schools were assigned during random assignment, and a school-level error term. By including indicators for the blocks, the degrees of freedom used to calculate the statistical significance of the results are adjusted to reflect the information (number of blocks constructed) used when conducting random assignment.
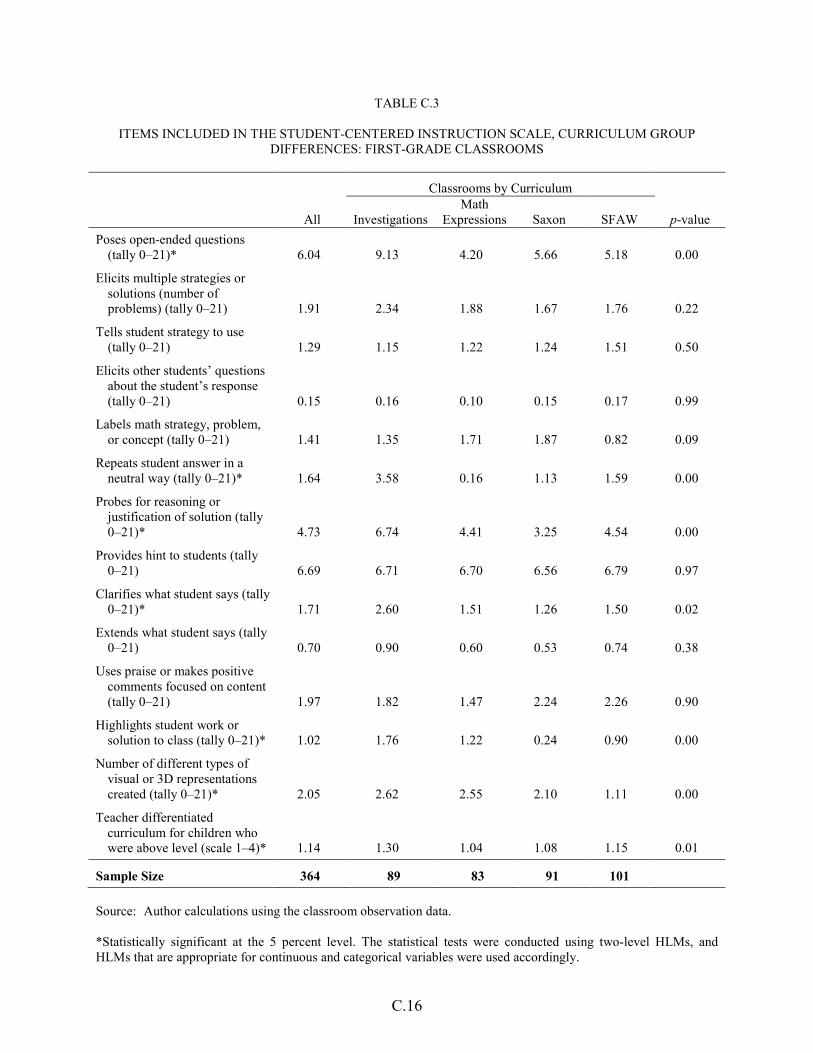
C.16
TABLE C.3
ITEMS INCLUDED IN THE STUDENT-CENTERED INSTRUCTION SCALE, CURRICULUM GROUP DIFFERENCES: FIRST-GRADE CLASSROOMS
Classrooms by Curriculum
All Investigations Math
Expressions Saxon SFAW p-value Poses open-ended questions
(tally 0–21)* 6.04 9.13 4.20 5.66 5.18 0.00
Elicits multiple strategies or solutions (number of problems) (tally 0–21) 1.91 2.34 1.88 1.67 1.76 0.22
Tells student strategy to use (tally 0–21) 1.29 1.15 1.22 1.24 1.51 0.50
Elicits other students’ questions about the student’s response (tally 0–21) 0.15 0.16 0.10 0.15 0.17 0.99
Labels math strategy, problem, or concept (tally 0–21) 1.41 1.35 1.71 1.87 0.82 0.09
Repeats student answer in a neutral way (tally 0–21)* 1.64 3.58 0.16 1.13 1.59 0.00
Probes for reasoning or justification of solution (tally 0–21)* 4.73 6.74 4.41 3.25 4.54 0.00
Provides hint to students (tally 0–21) 6.69 6.71 6.70 6.56 6.79 0.97
Clarifies what student says (tally 0–21)* 1.71 2.60 1.51 1.26 1.50 0.02
Extends what student says (tally 0–21) 0.70 0.90 0.60 0.53 0.74 0.38
Uses praise or makes positive comments focused on content (tally 0–21) 1.97 1.82 1.47 2.24 2.26 0.90
Highlights student work or solution to class (tally 0–21)* 1.02 1.76 1.22 0.24 0.90 0.00
Number of different types of visual or 3D representations created (tally 0–21)* 2.05 2.62 2.55 2.10 1.11 0.00
Teacher differentiated curriculum for children who were above level (scale 1–4)* 1.14 1.30 1.04 1.08 1.15 0.01
Sample Size 364 89 83 91 101 Source: Author calculations using the classroom observation data.
*Statistically significant at the 5 percent level. The statistical tests were conducted using two-level HLMs, and HLMs that are appropriate for continuous and categorical variables were used accordingly.
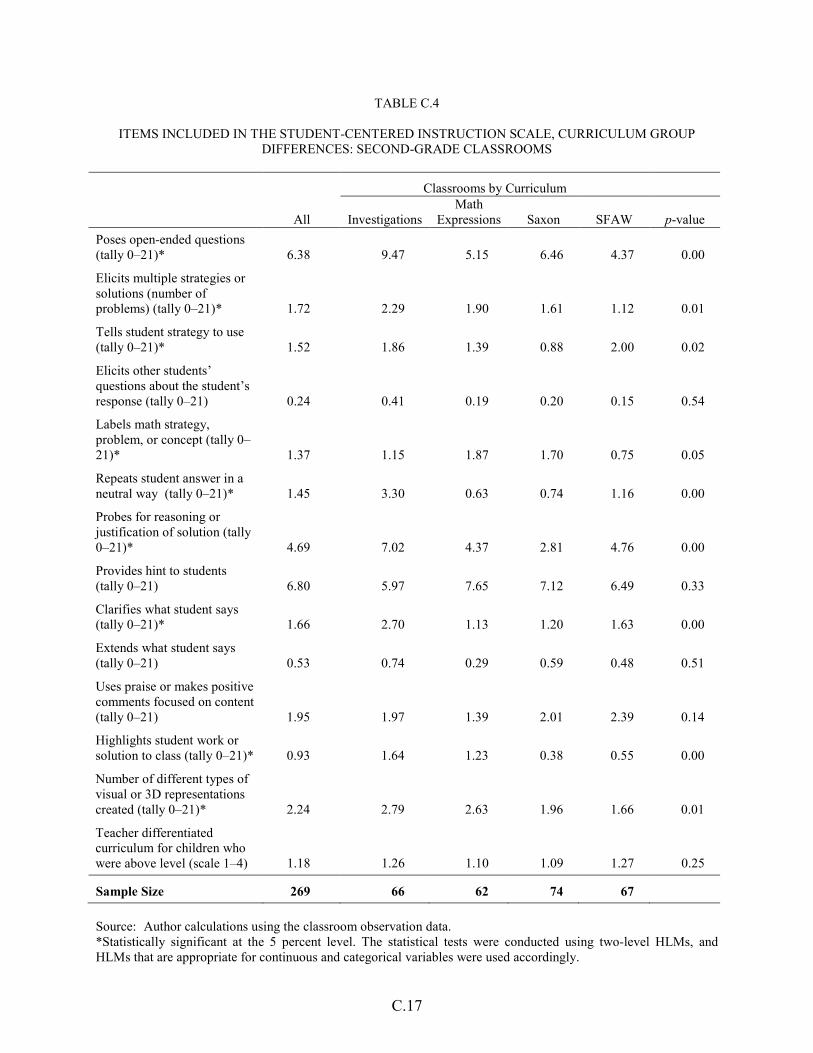
C.17
TABLE C.4
ITEMS INCLUDED IN THE STUDENT-CENTERED INSTRUCTION SCALE, CURRICULUM GROUP DIFFERENCES: SECOND-GRADE CLASSROOMS
Classrooms by Curriculum
All Investigations Math
Expressions Saxon SFAW p-value Poses open-ended questions (tally 0–21)* 6.38 9.47 5.15 6.46 4.37 0.00
Elicits multiple strategies or solutions (number of problems) (tally 0–21)* 1.72 2.29 1.90 1.61 1.12 0.01
Tells student strategy to use (tally 0–21)* 1.52 1.86 1.39 0.88 2.00 0.02
Elicits other students’ questions about the student’s response (tally 0–21) 0.24 0.41 0.19 0.20 0.15 0.54
Labels math strategy, problem, or concept (tally 0–21)* 1.37 1.15 1.87 1.70 0.75 0.05
Repeats student answer in a neutral way (tally 0–21)* 1.45 3.30 0.63 0.74 1.16 0.00
Probes for reasoning or justification of solution (tally 0–21)* 4.69 7.02 4.37 2.81 4.76 0.00
Provides hint to students (tally 0–21) 6.80 5.97 7.65 7.12 6.49 0.33
Clarifies what student says (tally 0–21)* 1.66 2.70 1.13 1.20 1.63 0.00
Extends what student says (tally 0–21) 0.53 0.74 0.29 0.59 0.48 0.51
Uses praise or makes positive comments focused on content (tally 0–21) 1.95 1.97 1.39 2.01 2.39 0.14
Highlights student work or solution to class (tally 0–21)* 0.93 1.64 1.23 0.38 0.55 0.00
Number of different types of visual or 3D representations created (tally 0–21)* 2.24 2.79 2.63 1.96 1.66 0.01
Teacher differentiated curriculum for children who were above level (scale 1–4) 1.18 1.26 1.10 1.09 1.27 0.25
Sample Size 269 66 62 74 67 Source: Author calculations using the classroom observation data. *Statistically significant at the 5 percent level. The statistical tests were conducted using two-level HLMs, and HLMs that are appropriate for continuous and categorical variables were used accordingly.

C.18
TABLE C.5
ITEMS INCLUDED IN THE TEACHER-DIRECTED INSTRUCTION SCALE, CURRICULUM GROUP DIFFERENCES: FIRST-GRADE CLASSROOMS
Classrooms by Curriculum
All Investigations Math
Expressions Saxon SFAW p-value Asks close-ended questions (tally 0–21)* 20.37 19.19 20.39 21.00 20.81 0.00
Guides practice on problems (number of problems) (tally 0–21)* 9.37 5.63 7.29 12.21 11.83 0.00
Uses representations (number of types) (tally 0–21)* 7.28 5.07 6.71 11.78 5.65 0.00
States if correct or not without elaborating (tally 0–21)* 19.21 17.79 20.07 20.08 18.99 0.01
Calls on other students until the correct answer is given (tally 0–21)* 2.66 1.57 2.59 3.34 3.05 0.01
Asks class if they agree or disagree with student’s response (tally 0–21)* 1.98 1.54 1.20 3.46 1.65 0.00
Prompts child to guide practice or lead class in a routine (check)* 0.34 0.27 0.52 0.43 0.19 0.00
Practiced number facts or procedures (scale 0–6)* 3.40 1.97 3.77 4.66 3.21 0.00
Group response to questions (scale 0–2)* 1.23 1.04 1.10 1.38 1.36 0.01
Counting (check)* 0.70 0.52 0.72 0.97 0.58 0.00
Counting (total of 8 items)* 2.04 1.18 1.52 3.90 1.53 0.00
Number of problems focused on review of previously learned material (tally 0–21)* 6.88 2.80 6.59 13.51 4.76 0.00
Materials (total of 11 items)* 1.83 2.03 1.34 2.38 1.54 0.00
Representations (total of 7 items)* 2.24 2.37 2.01 2.82 1.79 0.00
Large group (scale 0–4)* 3.09 2.56 3.20 3.30 3.26 0.00
Sample Size 364 89 83 91 101 Source: Author calculations using the classroom observation data.
*Statistically significant at the 5 percent level. The statistical tests were conducted using two-level HLMs, and HLMs that are appropriate for continuous, binary, and categorical variables were used accordingly.

C.19
TABLE C.6
ITEMS INCLUDED IN THE TEACHER-DIRECTED INSTRUCTION SCALE, CURRICULUM GROUP DIFFERENCES: SECOND-GRADE CLASSROOMS
Classrooms by Curriculum
All Investigations Math
Expressions Saxon SFAW p-value Asks close-ended questions (tally 0–21)* 19.84 17.44 20.52 21.00 20.30 0.00
Guides practice on problems (number of problems) (tally 0–21)* 8.95 6.12 8.52 10.30 10.64 0.00
Uses representations (number of types) (tally 0–21)* 7.51 4.36 7.48 13.18 4.36 0.00
States if correct or not without elaborating (tally 0–21)* 18.55 16.41 19.76 19.53 18.45 0.01
Calls on other students until the correct answer is given (tally 0–21)* 2.68 1.71 2.55 3.97 2.33 0.00
Asks class if they agree or disagree with student’s response (tally 0–21)* 2.47 1.64 1.82 4.89 1.22 0.00
Prompts child to guide practice or lead class in a routine (check)* 0.32 0.11 0.45 0.62 0.07 0.00
Practiced number facts or procedures (scale 0–6)* 3.35 2.17 2.15 5.51 3.22 0.00
Group response to questions (scale 0–2)* 1.34 1.05 1.18 1.61 1.48 0.00
Counting (check)* 0.55 0.30 0.58 0.96 0.30 0.00
Counting (total of 8 items)* 1.43 0.48 1.08 3.35 0.55 0.00
Number of problems focused on review of previously learned material (tally 0–21)* 7.17 2.92 6.35 14.92 3.57 0.00
Materials (total of 11 items)* 1.45 1.47 1.34 1.82 1.12 0.01
Representations (total of 7 items)* 2.29 2.18 1.82 3.01 2.04 0.00
Large group (scale 0–4)* 3.15 2.30 3.45 3.68 3.13 0.00
Sample Size 269 66 62 74 67 Source: Author calculations using the classroom observation data.
*Statistically significant at the 5 percent level. The statistical tests were conducted using two-level HLMs, and HLMs that are appropriate for continuous, binary, and categorical variables were used accordingly.
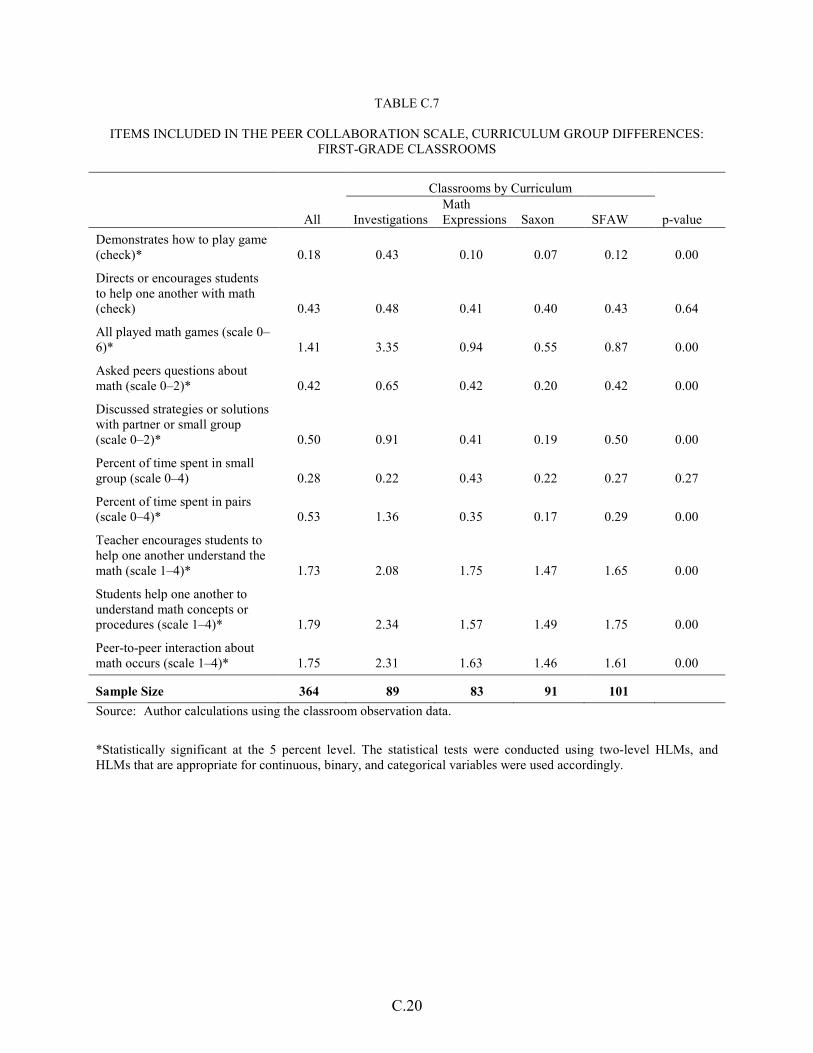
C.20
TABLE C.7
ITEMS INCLUDED IN THE PEER COLLABORATION SCALE, CURRICULUM GROUP DIFFERENCES: FIRST-GRADE CLASSROOMS
Classrooms by Curriculum
All Investigations Math Expressions Saxon SFAW p-value
Demonstrates how to play game (check)* 0.18 0.43 0.10 0.07 0.12 0.00
Directs or encourages students to help one another with math (check) 0.43 0.48 0.41 0.40 0.43 0.64
All played math games (scale 0–6)* 1.41 3.35 0.94 0.55 0.87 0.00
Asked peers questions about math (scale 0–2)* 0.42 0.65 0.42 0.20 0.42 0.00
Discussed strategies or solutions with partner or small group (scale 0–2)* 0.50 0.91 0.41 0.19 0.50 0.00
Percent of time spent in small group (scale 0–4) 0.28 0.22 0.43 0.22 0.27 0.27
Percent of time spent in pairs (scale 0–4)* 0.53 1.36 0.35 0.17 0.29 0.00
Teacher encourages students to help one another understand the math (scale 1–4)* 1.73 2.08 1.75 1.47 1.65 0.00
Students help one another to understand math concepts or procedures (scale 1–4)* 1.79 2.34 1.57 1.49 1.75 0.00
Peer-to-peer interaction about math occurs (scale 1–4)* 1.75 2.31 1.63 1.46 1.61 0.00
Sample Size 364 89 83 91 101 Source: Author calculations using the classroom observation data.
*Statistically significant at the 5 percent level. The statistical tests were conducted using two-level HLMs, and HLMs that are appropriate for continuous, binary, and categorical variables were used accordingly.

C.21
TABLE C.8
ITEMS INCLUDED IN THE PEER COLLABORATION SCALE, CURRICULUM GROUP DIFFERENCES: SECOND-GRADE CLASSROOMS
Classrooms by Curriculum
All Investigations
Math Expressions Saxon SFAW p-value
Demonstrates how to play game (check)* 0.11 0.30 0.06 0.04 0.04
0.00
Directs or encourages students to help one another with math (check) 0.38 0.42 0.50 0.34 0.28 0.08
All played math games (scale 0–6) * 0.86 2.35 0.21 0.35 0.55 0.00
Asked peers questions about math (scale 0–2)* 0.34 0.45 0.42 0.22 0.30 0.03
Discussed strategies or solutions with partner or small group (scale 0–2)* 0.46 0.79 0.52 0.18 0.39 0.00
Percent of time spent in small group (scale 0–4)* 0.21 0.41 0.15 0.05 0.24 0.02
Percent of time spent in pairs (scale 0–4)* 0.47 1.08 0.31 0.19 0.31 0.00
Teacher encourages students to help one another understand the math (scale 1–4) 1.70 1.88 1.81 1.64 1.48 0.07
Students help one another to understand math concepts or procedures (scale 1–4)* 1.78 2.00 1.82 1.64 1.67 0.03
Peer to peer interaction about math occurs (scale 1–4)* 1.67 2.14 1.55 1.51 1.48 0.00
Sample Size 269 66 62 74 67 Source: Author calculations using the classroom observation data.
*Statistically significant at the 5 percent level. The statistical tests were conducted using two-level HLMs, and HLMs that are appropriate for continuous, binary, and categorical variables were used accordingly.

This page intentionally left blank for double-sided copying.
APPENDIX D
CONSTRUCTING THE ANALYSIS SAMPLES AND ESTIMATING CURRICULUM EFFECTS

This page intentionally left blank for double-sided copying.
D.3
This appendix describes how the analysis samples were constructed and provides more details about the approach for estimating curriculum effects. The first section describes the students who were included in the analysis samples and the student-, teacher-, and school-level measures for each student. It also describes the techniques used to impute missing data and the weights developed for the analysis samples. The second section describes the statistical models used to estimate relative effects and presents the results for the models. It also describes the models used to estimate curriculum effects for the subgroups examined.
A. CONSTRUCTING THE ANALYSIS SAMPLES
Separate analysis samples were constructed for first- and second-grade students using the curricula for the first time. Within each grade level, two analysis samples were constructed to estimate the effects of the curricula on student achievement. The primary sample for both grades was a longitudinal sample consisting of students tested in both the fall and the spring.95
For these longitudinal samples, students were linked to their teachers and schools during the fall assessment; the characteristics of these teachers and schools were measured as of the start of the school year. The secondary sample for both grades was a cross-sectional sample consisting of all students tested in the spring. The cross-sectional samples included students who were tested both in the fall and the spring (that is, the longitudinal samples), those who had not been tested in the fall despite being eligible for fall testing but were tested in the spring, and those who arrived in a study school after the fall assessments were administered and were tested in the spring. For the cross-sectional samples, students were linked to their teachers and schools as of the spring assessment; the characteristics of these teachers and schools were measured as of the start of the school year.
The first-grade longitudinal sample consisted of 4,716 students. Among them, 1,309 students were from the four districts that participated in the study during the 2006–2007 school year and 3,407 students were from the eight districts that participated during the 2007–2008 school year. The cross-sectional sample consisted of 5,413 students. The sample included 1,466 students from the four districts that had participated during the 2006–2007 school year and 3,947 students from the eight districts that had participated during the 2007–2008 school year.
The second-grade longitudinal sample consisted of 3,344 students, and the cross-sectional
sample consisted of 3,869 students. Both second-grade samples included only students from the eight districts that had participated in the study during the 2007–2008 school year, where curriculum implementation occurred in the second grade.
95 Among the 17 to 18 percent of first- and second-grade records that were subject to listwise deletion (see
Appendix A, Table A.6), about 7 percentage points are missing both the fall and spring test; the rest are missing either the fall or spring test.
D.4
Measures Included in the Analysis Files
The analysis files constructed for the longitudinal and the cross-sectional samples contain student-, teacher-, and school-level measures. Student-level math test scores were obtained from a file provided by Educational Testing Service that included scores based on the fall and spring ECLS–K math assessments conducted by the study team. Every student began the assessments with the same first-stage form and, depending on the score on the first stage, was assigned an easy, middle-difficulty, or hard second-stage form. Item response theory (IRT) techniques, which analyze patterns of correct and incorrect answers, were used to put scores from the different forms on the same scale to allow comparisons. The overall scale score that estimates the student’s performance on the whole set of assessment questions was used in our analysis.
School records were used to construct other student-level measures included in the analysis
files. These measures include student demographics (age, gender, and race/ethnicity), whether the student is limited English proficiency (LEP) or an English language learner (ELL), and whether that student had an individualized education plan (IEP) or special service. In addition, the analysis file includes the number of days between the beginning of school and the fall assessment and the number of days between the fall and spring assessments. As described in Appendix A, free/reduced-price meals eligibility also was included on school records. However, we did not use this student-level measure because, as shown in Appendix A, it had a high nonresponse rate (24 percent for first graders and 27 percent for second graders). Instead, as described below, we used a school-level measure of free/reduced-price meals eligibility in our analysis.
Teacher-level measures were obtained from the assessment of math content and pedagogical
knowledge and the fall teacher survey. Teachers were administered an assessment of their content knowledge and pedagogical knowledge before they received initial training on their school’s assigned curriculum. An overall scale score and separate measures of content knowledge and pedagogical knowledge were included in the analysis files. Teacher experience, education, race/ethnicity, and prior use of the assigned curriculum at the K–3 level were obtained from the fall teacher survey. Teachers who did not complete the fall survey were asked to provide this information during the spring survey, with experience, education, and prior use of the assigned curriculum being reported as of the start of the school year. Classroom size was obtained from class rosters. To measure the heterogeneity of the students in the classroom, the classroom variance and skewness of the fall student math score were computed.
School-level measures were obtained from the Common Core of Data (CCD) and study
records. Two school-level measures were extracted from the CCD: the percentage of students eligible for free or reduced-price meals and whether the school was Title I. In addition, the analysis files included the block into which the school was placed during the random assignment process, the curriculum assigned to the school, and the school district.

D.5
Imputing Missing Data
Complete data were available for the school-level measures. Complete data also were available for the fall and spring student math test scores of the longitudinal file, and spring student scores of the cross-sectional file.
However, a small fraction of data was missing for some of the other student-level measures
and for each of the teacher-level measures. For example, fall math scores were not available for students in the cross-sectional samples who arrived at a study school after the study team completed fall testing. Specifically, these data were missing for 13 percent of the first-grade cross-sectional sample and 14 percent of the second-grade cross-sectional sample.
Tables D.1 and D.2 list the student- and teacher-level measures included in the longitudinal
samples for first and second graders. Tables D.3 and D.4 list the same information for the cross-sectional samples. Measures that have a nonzero value in the “Number Missing” column are those student- and teacher-level measures with the small fraction of missing data.
Model-based imputations were used to replace missing data. With this technique, missing
values on each measure are replaced with the predicted value of the measure from a regression model. Imputations were done separately for student- and teacher-level measures, separately for the longitudinal and cross-sectional samples, and separately for first- and second-grade students.
For the student-level measures of the longitudinal samples, only some demographic data
were missing. The missing data were imputed using the fall math test score, the available demographic data, the school-level percentage of students eligible for free or reduced-price meals, whether the school was Title I, and the school district.
Imputing missing student-level measures for the cross-sectional samples was more complex
because fall test scores were systematically missing for students who enrolled in a study school after fall testing was complete. These scores were also missing for the small fraction of students who were eligible for testing in the fall but could not be tested.
Students who arrived in a study school after the fall assessments were found to be more
similar to students who were tested in the fall but left the study school before the spring assessment, than they were to students in the longitudinal sample (that is, those who were in a study school in both the fall and spring). To use this information, students who were tested in the fall but left the study school before the spring assessment were included in the imputation processes and an indicator of whether the student was in a study school for only the fall or the spring was included in the regression models. The imputation models also included the other variables used for the longitudinal sample.
The number of days between the beginning of school and the fall assessment and the number
of days between the fall and spring assessments were systematically missing for students who did not complete an assessment in the fall. Since these measures are determined by the study’s testing schedule and not by other student-level measures, the model-based imputation was not

D.6
TABLE D.1
MODEL-BASED IMPUTATION OF MISSING DATA, FIRST-GRADE LONGITUDINAL SAMPLE
Variable Name N Number Missing Mean
(Pre-imputation) Mean
(Post-imputation)
Student–Level Data
Fall math scale score 4,716 0 31.14 31.14
Age at fall test 4,336 380 6.57 6.57
Female 4,687 29 0.49 0.49
Race/ethnicity Hispanic 4,323 393 0.28 0.29 Non-Hispanic black 4,323 393 0.27 0.26
LEP/ELL 4,109 607 0.14 0.14
IEP/special services 4,094 622 0.09 0.08 Days between start of school and fall assessment 4,716 0 20.54 20.54
Days between assessments 4,716 0 237.35 237.35
Teacher-Level Data
Master’s degree 427 27 0.48 0.48
Experience 438 16 12.20 12.17
Prior use of the assigned curriculum 426 28 0.11 0.11
Race/ethnicity Non-Hispanic black 419 35 0.10 0.09 Hispanic 419 35 0.19 0.19
Assessment Overall IRT score 435 19 -0.54 -0.54 Content knowledge IRT score 435 19 -0.79 -0.79 Pedagogical knowledge IRT score 435 19 -0.33 -0.33
Note: The sample excludes 1 cohort-one school with 3 classrooms and 32 students that participated
during part of the school year and then stopped using its assigned curriculum (Math Expressions) and did not allow the study to collect follow-up data.

D.7
TABLE D.2
MODEL-BASED IMPUTATION OF MISSING DATA, SECOND-GRADE LONGITUDINAL SAMPLE
Variable Name N Number Missing Mean
(Pre-imputation) Mean
(Post-imputation)
Student Level Data
Fall math scale score 3,344 0 56.00 56.00
Age at fall test 2,983 361 7.64 7.64
Female 3,320 24 0.48 0.48
Race/ethnicity Hispanic 3,104 240 0.30 0.31 Non-Hispanic black 3,104 240 0.29 0.28
LEP/ELL 2,771 573 0.10 0.10
IEP/special services 2,780 564 0.09 0.09 Days between start of school and fall Assessment 3,344 0 21.99 21.99
Days between assessments 3,344 0 236.44 236.44
Teacher-Level Data
Master’s degree 289 29 0.40 0.39
Experience 293 25 12.41 12.46
Prior use of the assigned curriculum 285 33 0.10 0.09
Race/ethnicity Non-Hispanic black 288 30 0.13 0.13 Hispanic 288 30 0.28 0.28
Assessment Overall IRT score 298 20 -0.59 -0.58 Content knowledge IRT score 298 20 -0.86 -0.85 Pedagogical knowledge IRT score 298 20 -0.33 -0.32
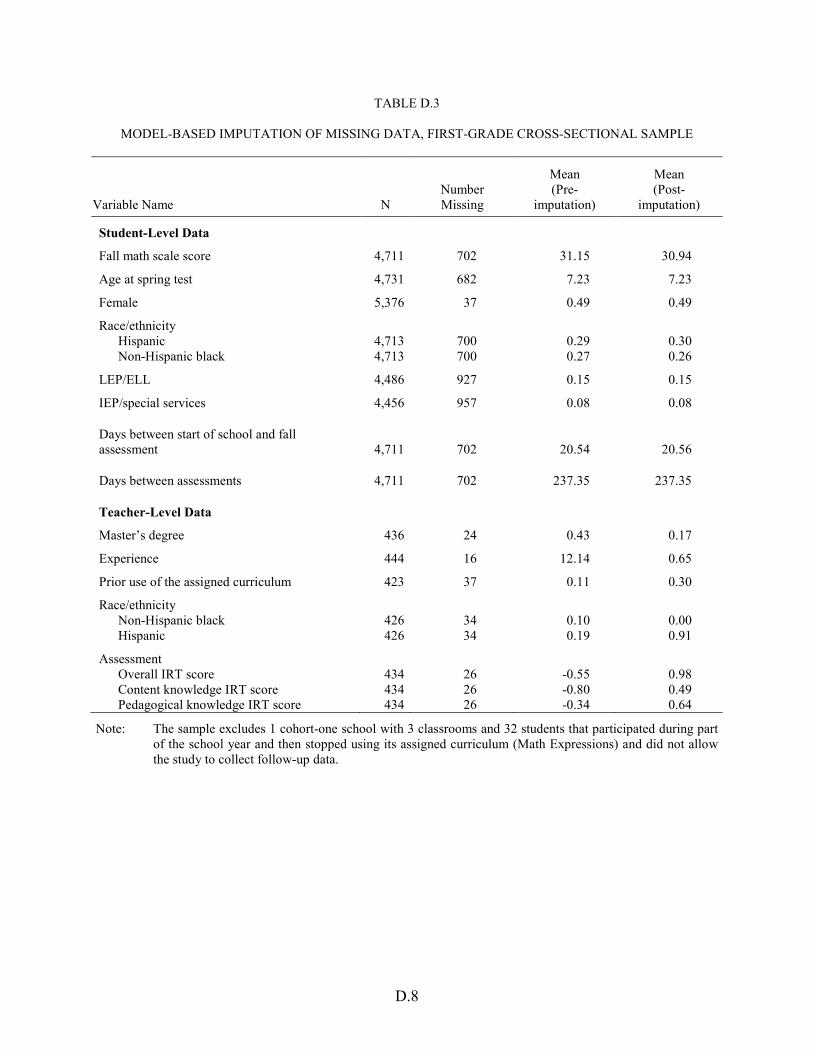
D.8
TABLE D.3
MODEL-BASED IMPUTATION OF MISSING DATA, FIRST-GRADE CROSS-SECTIONAL SAMPLE
Variable Name N Number Missing
Mean (Pre-
imputation)
Mean (Post-
imputation)
Student-Level Data
Fall math scale score 4,711 702 31.15 30.94
Age at spring test 4,731 682 7.23 7.23
Female 5,376 37 0.49 0.49
Race/ethnicity Hispanic 4,713 700 0.29 0.30 Non-Hispanic black 4,713 700 0.27 0.26
LEP/ELL 4,486 927 0.15 0.15
IEP/special services 4,456 957 0.08 0.08
Days between start of school and fall assessment 4,711 702 20.54 20.56
Days between assessments 4,711 702 237.35 237.35
Teacher-Level Data
Master’s degree 436 24 0.43 0.17
Experience 444 16 12.14 0.65
Prior use of the assigned curriculum 423 37 0.11 0.30
Race/ethnicity Non-Hispanic black 426 34 0.10 0.00 Hispanic 426 34 0.19 0.91
Assessment Overall IRT score 434 26 -0.55 0.98 Content knowledge IRT score 434 26 -0.80 0.49 Pedagogical knowledge IRT score 434 26 -0.34 0.64
Note: The sample excludes 1 cohort-one school with 3 classrooms and 32 students that participated during part of the school year and then stopped using its assigned curriculum (Math Expressions) and did not allow the study to collect follow-up data.

D.9
TABLE D.4
MODEL-BASED IMPUTATION OF MISSING DATA, SECOND-GRADE CROSS-SECTIONAL SAMPLE
Variable Name N Number Missing
Mean (Pre-
imputation)
Mean (Post-
imputation)
Student-Level Data
Fall math scale score 3,346 523 55.97 55.54
Age at spring test 3,217 652 8.29 8.29
Female 3,843 26 0.48 0.48
Race/ethnicity Hispanic 3,356 513 0.30 0.33 Non-Hispanic black 3,356 513 0.29 0.27
LEP/ELL 2,994 875 0.10 0.10
IEP/special services 2,992 877 0.09 0.09
Days between start of school and fall assessment 3,346 523 21.98 21.97
Days between assessments 3,346 523 236.45 236.50
Teacher-Level Data
Master’s degree 298 24 0.33 0.33
Experience 299 23 12.24 12.49
Prior use of the assigned curriculum 281 41 0.10 0.10
Race/ethnicity Non-Hispanic black 293 29 0.14 0.14 Hispanic 293 29 0.27 0.28
Assessment Overall IRT score 296 26 -0.59 -0.60 Content knowledge IRT score 296 26 -0.87 -0.87 Pedagogical knowledge IRT score 296 26 -0.34 -0.34

D.10
used to replace these missing data. Instead, students were assigned the average values for these measures based on the students with the same math teacher who had data.96
Although imputations were conducted separately for the teacher-level measures of the first- and second-grade longitudinal and cross-sectional samples, the same regression model was used for each of the four analysis samples. Missing teacher assessment measures and missing teacher survey measures were imputed using the available teacher assessment measures, the available teacher survey measures, the school percentage of students eligible for free or reduced-price meals, whether the school was Title I, and the school district. Indicators of random assignment block were not included because the imputation model would not converge.
In addition to reporting the number of missing observations for each measure included in the
analysis, Tables D.1, D.2, D.3, and D.4 list the pre- and post-imputation means for the measures.
Weights
A sampling weight was developed for each student in each of the four samples. For the first- and second-grade longitudinal samples, students who were tested in the fall and spring were weighted up to the number of students who were eligible to be tested in the fall, separately for each classroom. For example, if 20 students in a classroom were eligible to be tested in the fall but only 12 were tested in the fall and spring, each student who was tested in the fall and spring was assigned a weight of 1.67 (20/12). Similarly, for the first- and second-grade cross-sectional samples, the number of students in each classroom who were tested in the spring was weighted up to the number of students in the classroom who were eligible to be tested in the spring.
A nonresponse adjustment for students who were sampled for testing but did not complete
the assessments also was developed, using a three-step process. First, a stepwise logistic regression predicting the probability of response at the student level was run by curriculum. The model included the student demographics, the school-level measures from the CCD, and school and district dummy variables. Second, the stepwise procedure identified measures that were statistically significant, and a model with these significant measures was used to generate a predicted probability of response for each student. In cases where a district dummy variable was significant, dummy variables for all schools in the district were included in the new model. Third, the student-level nonresponse adjustment was created as the inverse of the predicted probability.
A combined weight was then developed using the sampling weight and the nonresponse
adjustment. In particular, the sampling weights and the nonresponse adjustments were multiplied, and the product was normalized so that the sum of the combined weights equals the number of observations in the specific sample.
96 In one district, no fall assessments were completed in three classrooms of first-grade students and in one
classroom of second-grade students. The students in these classrooms were assigned the average number of days between the beginning of school and the fall assessment and the average number of days between the fall and spring assessments among students in the other classrooms of the same schools who had data.
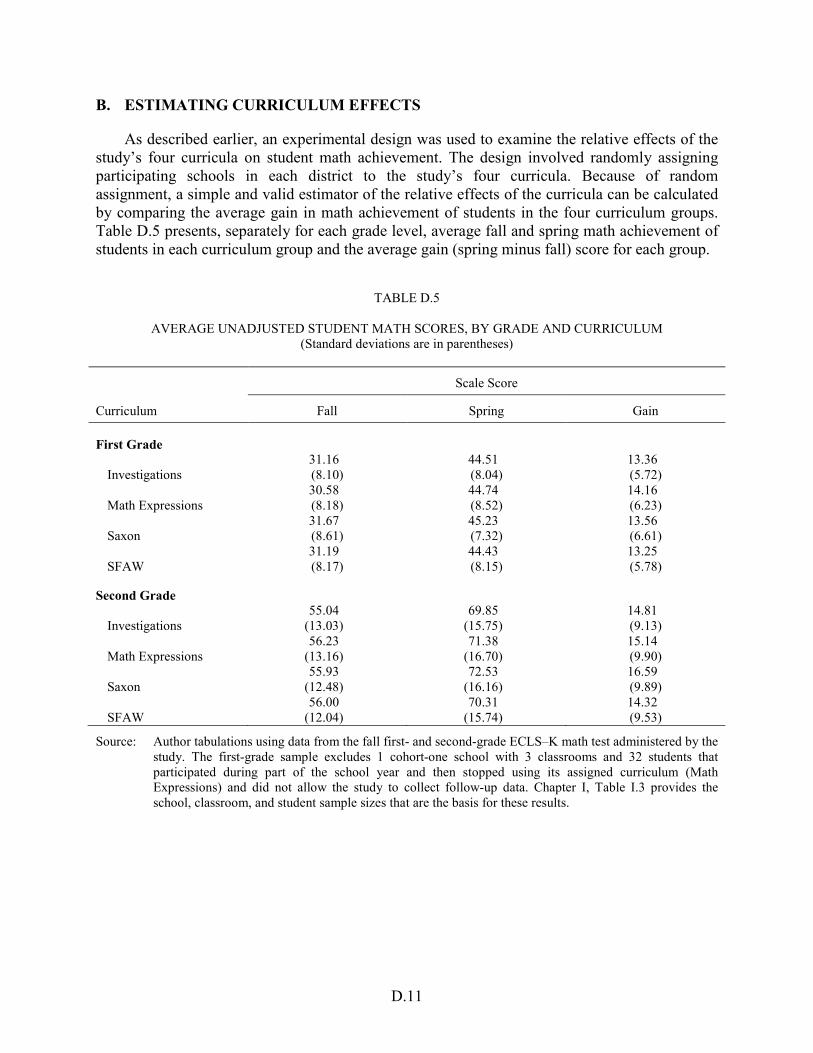
D.11
B. ESTIMATING CURRICULUM EFFECTS
As described earlier, an experimental design was used to examine the relative effects of the study’s four curricula on student math achievement. The design involved randomly assigning participating schools in each district to the study’s four curricula. Because of random assignment, a simple and valid estimator of the relative effects of the curricula can be calculated by comparing the average gain in math achievement of students in the four curriculum groups. Table D.5 presents, separately for each grade level, average fall and spring math achievement of students in each curriculum group and the average gain (spring minus fall) score for each group.
TABLE D.5
AVERAGE UNADJUSTED STUDENT MATH SCORES, BY GRADE AND CURRICULUM (Standard deviations are in parentheses)
Scale Score
Curriculum Fall Spring Gain
First Grade
Investigations 31.16 (8.10)
44.51 (8.04)
13.36 (5.72)
Math Expressions 30.58 (8.18)
44.74 (8.52)
14.16 (6.23)
Saxon 31.67 (8.61)
45.23 (7.32)
13.56 (6.61)
SFAW 31.19 (8.17)
44.43 (8.15)
13.25 (5.78)
Second Grade
Investigations 55.04
(13.03) 69.85
(15.75) 14.81 (9.13)
Math Expressions 56.23
(13.16) 71.38
(16.70) 15.14 (9.90)
Saxon 55.93
(12.48) 72.53
(16.16) 16.59 (9.89)
SFAW 56.00
(12.04) 70.31
(15.74) 14.32 (9.53)
Source: Author tabulations using data from the fall first- and second-grade ECLS–K math test administered by the study. The first-grade sample excludes 1 cohort-one school with 3 classrooms and 32 students that participated during part of the school year and then stopped using its assigned curriculum (Math Expressions) and did not allow the study to collect follow-up data. Chapter I, Table I.3 provides the school, classroom, and student sample sizes that are the basis for these results.

D.12
Model for Estimating Curriculum Effects and Statistical Significance
To assess whether the differences in achievement between the curriculum groups are statistically significant, we used a statistical model that accounts for the nested structure of the data (students clustered in classrooms and classrooms clustered in schools). To help increase the precision of the estimates, we also included baseline values of measures that explain variation in spring achievement.
In particular, a three-level hierarchical linear model (HLM) was used to estimate the relative effects of the study’s curricula; separate models were developed for the first- and second-grade longitudinal samples. The first (student) level of each HLM regressed the spring student scale score on the following student characteristics:
• Fall score—student scale score on the fall assessment
• Age—student age at the time of the fall assessment
• Gender—indicator of whether the student is female
• Race/ethnicity—indicators of whether the student is (1) Hispanic or (2) non-Hispanic black. Non-Hispanic white students and non-Hispanic students of other races serve as the reference category.
• LEP/ELL—student is limited English proficient or an English language learner
• IEP—student has an individualized education plan or receives special services
• Days before fall assessment—the number of days between the beginning of school and the student’s fall assessment
• Days between assessments—the number of days between the student’s fall and spring assessments
The second (classroom) level of the HLMs regressed the intercept from the first-level equation on the following teacher characteristics:
• Education—teacher has a master’s degree. Teachers who do not have a master’s degree, all of whom have a bachelor’s degree, serve as the reference category.
• Experience—years of teaching experience prior to the start of the school year
• Prior use of the assigned curriculum—teacher used the assigned curriculum at the K–3 level before joining the study
• Race—indicators of whether the teacher is (1) Hispanic or (2) non-Hispanic black. Non-Hispanic white teachers and non-Hispanic teachers of other races serve as the reference category
D.13
• Class size—number of students in the classroom in the fall
• Variance of the fall scale score for the classroom—calculated variance of the student scale score on the fall assessment for the classroom
• Skewness of the fall scale score for the classroom—calculated skewness of the student scale score on the fall assessment for the classroom
• Teacher assessment—teacher’s overall scale score on the assessment of math content and pedagogical knowledge
The third (school) level of the HLMs regressed the intercept from the second-level equation on the following school characteristics:
• Curricula—indicators of whether the school was assigned to Investigations, Math Expressions, or Saxon. Schools assigned to Scott Foresman-Addison Wesley Math (SFAW) serve as the reference category.
• Random assignment block—indicators for all but one of the blocks constructed for random assignment. Schools in the block without an indicator serve as the reference category.
• Free or reduced-price meals eligibility—the percentage of students eligible for free or reduced-price meals
• Title I—an indicator of whether the school was Title I97
The same general model was estimated for the first- and second-grade cross-sectional samples, but two measures—student age and class size—were constructed slightly differently. Student age and class size was defined at the time of the spring assessment instead of at the time of the fall assessment, as was the case with the longitudinal samples.
Making Pair-Wise Comparisons
With the four curricula included in the study, six unique pair-wise comparisons of effects can be made: (1) Investigations relative to Math Expressions, (2) Investigations relative to Saxon, (3) Investigations relative to SFAW, (4) Math Expressions relative to Saxon, (5) Math Expressions relative to SFAW, and (6) Saxon relative to SFAW. Because an SFAW indicator is not included in the model and thereby serves as the reference category, the coefficients on the Investigations, Math Expressions, and Saxon indicators indicate the effects of these curricula
97 We also estimated another specification of the HLM where the independent variables were grand-mean
centered. Grand mean centering had no effect on the relative curriculum effects (as expected) and did not affect the statistical significance of those results.

D.14
relative to SFAW. To make the pair-wise comparisons among Investigations, Math Expressions, and Saxon, the coefficients on the curriculum indicators are subtracted from one another. For example, to determine the effect of Investigations relative to Math Expressions, the coefficient on the Math Expressions indicator is subtracted from the coefficient on the Investigations indictor. Chapter III presents the results from the multiple curriculum comparisons, along with the statistical significance of each comparison.
The statistical significance of the curriculum differentials was calculated with and without
adjusting for these six pair-wise curriculum comparisons. For the multiple comparison adjustments, the Tukey-Kramer method was used to adjust the estimated p-values. When performing several statistical tests, the chance of finding a significant effect that is actually due to chance increases. For example, with the four curriculum groups in this study, there are six unique pair-wise comparisons that can be made. If each comparison is made using a t-test with a 5 percent confidence level, then the probability that one of those 6 tests will be statistically significant, even when there are no real differences between groups, could be as high as [1 – (1-0.05)^6] = 26 percent. Put differently, the probability of mistakenly concluding that one curriculum is better than another is 26 percent, not the usual 5 percent. Tukey (1952) developed a method that specifically adjusts for pair-wise comparisons. This approach takes into account the dependencies between comparisons, while still maintaining a low probability of finding false effects. Tukey (1953) and Kramer (1956) independently developed a modification that is appropriate for unequal sample sizes.
Model Estimates Based on the Main (Longitudinal) Sample
Table D.6 presents results based on the first-grade longitudinal sample for three specifications of the HLM: (1) a model that includes only the curriculum indicators and the block indicators used when conducting random assignment, (2) a model that adds the student’s fall score to the first model, and (3) a model that adds all the other student-, teacher-, and school-level controls to the second model. The results presented in the report are based on the third model. The pattern of results for the curriculum indicators is similar across the three models. For each model, the table also presents the residual variances at the three levels in the last three rows of each table. Table D.7 presents comparable results based on the second-grade longitudinal sample. Again, the pattern of results for the curriculum indicators is similar across the models.
The models were estimated with the SAS 9.1 software package, using the maximum
likelihood estimation method of Proc Mixed. As a check, the models also were estimated with the HLM 6.06 software package. The results in both cases were consistent.
As mentioned earlier, model-based imputations were used to replace the small fraction of
missing data with the predicted values of the measures from regression models based on the available data. Another approach could have been to use multiple imputation techniques, which use a model-based approach as we did, but calculate a set of plausible values (as opposed to one value, as we did) that represent the uncertainty about which value to impute. Model-based multiple imputations were not used because it is extremely costly to implement the Tukey-Kramer method that adjusts for multiple comparisons when using multiple imputations. However, parameter estimates and standard errors of the HLMs were calculated using model-

D.15
TABLE D.6
HIERARCHICAL LINEAR MODEL ESTIMATES FOR THE FIRST-GRADE LONGITUDINAL SAMPLE: OUTCOME IS SPRING MATH SCALE SCORE
Model Using Only Block Dummies
Model Using Only Fall Scale Score
Full Model
Variable Name Estimate Standard
Error
Estimate Standard
Error
Estimate Standard
Error
Student-Level Data Intercept 44.49 0.91 21.97 0.73 29.21 5.19 Fall math scale score . . 0.69 0.01 0.69 0.01 Age at fall test . . . . -0.99 0.19 Female . . . . -0.14 0.15 Race/ethnicity
Hispanic . . . . -0.55 0.31 Non-Hispanic black . . . . -1.55 0.26
LEP/ELL . . . . -0.01 0.27 IEP/special services . . . . -1.68 0.29 Days between start of school and fall assessment . .
. .
-0.04 0.02
Days between assessments . . . . 0.00 0.02 Teacher-Level Data
Master’s degree . . . . 0.17 0.25 Experience . . . . 0.02 0.01 Prior use of the assigned curriculum . .
. .
-0.03 0.36
Race/ethnicity Hispanic . . . . -0.03 0.41 Non-Hispanic black . . . . -0.35 0.42
Class size . . . . 0.11 0.04 Variance of the fall scale score . . . . -0.01 0.00 Skewness of the fall scale score . . . . -0.05 0.16 Teacher assessment overall score . .
. .
-0.19 0.22
School-Level Data
Curricula
Investigations 0.21 0.53 0.03 0.39 -0.03 0.36 Math Expressions 0.44 0.53 0.87 0.39 0.89 0.36 Saxon 0.81 0.53 0.65 0.39 0.51 0.36
Random assignment block Block 201 -2.17 1.56 1.46 1.14 0.68 1.21 Block 202 3.68 1.37 3.44 1.00 2.31 1.22 Block 211 2.33 1.00 2.30 0.73 -0.16 1.03
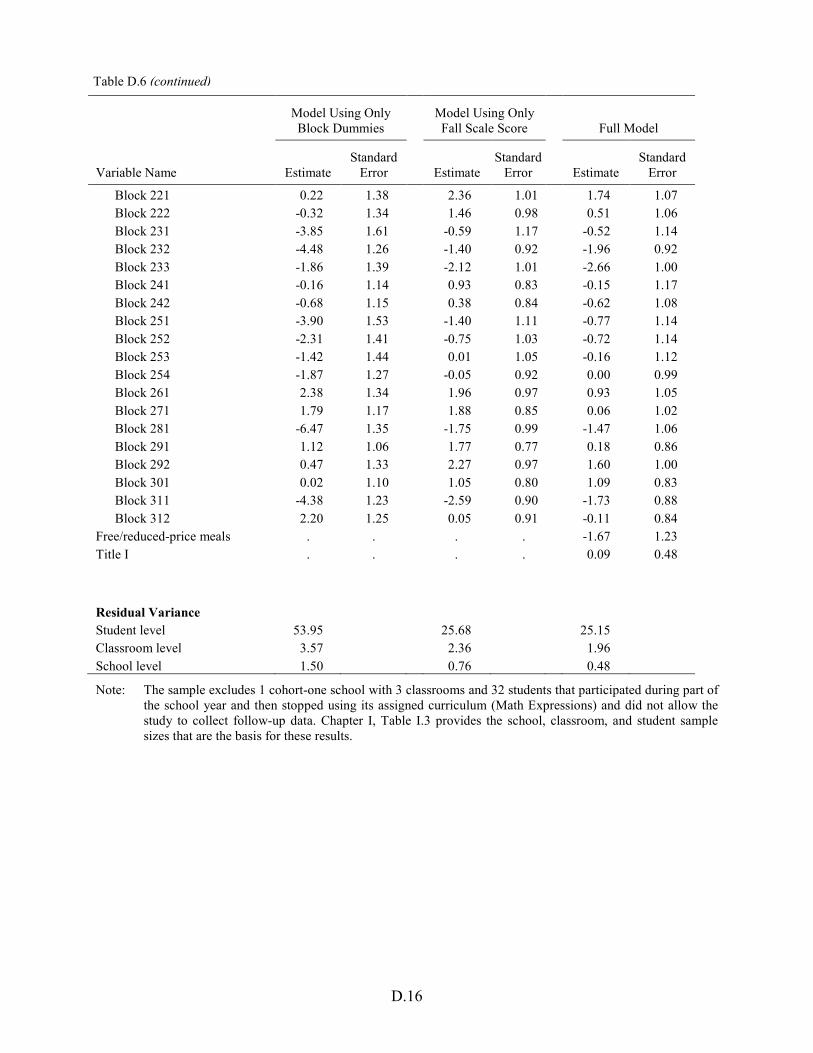
D.16
Table D.6 (continued)
Model Using Only Block Dummies
Model Using Only Fall Scale Score
Full Model
Variable Name Estimate Standard
Error
Estimate Standard
Error
Estimate Standard
Error
Block 221 0.22 1.38 2.36 1.01 1.74 1.07 Block 222 -0.32 1.34 1.46 0.98 0.51 1.06 Block 231 -3.85 1.61 -0.59 1.17 -0.52 1.14 Block 232 -4.48 1.26 -1.40 0.92 -1.96 0.92 Block 233 -1.86 1.39 -2.12 1.01 -2.66 1.00 Block 241 -0.16 1.14 0.93 0.83 -0.15 1.17 Block 242 -0.68 1.15 0.38 0.84 -0.62 1.08 Block 251 -3.90 1.53 -1.40 1.11 -0.77 1.14 Block 252 -2.31 1.41 -0.75 1.03 -0.72 1.14 Block 253 -1.42 1.44 0.01 1.05 -0.16 1.12 Block 254 -1.87 1.27 -0.05 0.92 0.00 0.99 Block 261 2.38 1.34 1.96 0.97 0.93 1.05 Block 271 1.79 1.17 1.88 0.85 0.06 1.02 Block 281 -6.47 1.35 -1.75 0.99 -1.47 1.06 Block 291 1.12 1.06 1.77 0.77 0.18 0.86 Block 292 0.47 1.33 2.27 0.97 1.60 1.00 Block 301 0.02 1.10 1.05 0.80 1.09 0.83 Block 311 -4.38 1.23 -2.59 0.90 -1.73 0.88 Block 312 2.20 1.25 0.05 0.91 -0.11 0.84
Free/reduced-price meals . . . . -1.67 1.23 Title I . . . . 0.09 0.48 Residual Variance
Student level 53.95 25.68 25.15 Classroom level 3.57 2.36 1.96 School level 1.50 0.76 0.48
Note: The sample excludes 1 cohort-one school with 3 classrooms and 32 students that participated during part of the school year and then stopped using its assigned curriculum (Math Expressions) and did not allow the study to collect follow-up data. Chapter I, Table I.3 provides the school, classroom, and student sample sizes that are the basis for these results.

D.17
TABLE D.7
HIERARCHICAL LINEAR MODEL ESTIMATES FOR THE SECOND-GRADE LONGITUDINAL SAMPLE OUTCOME IS SPRING MATH SCALE SCORE
Model Using Only Block Dummies
Model Using Only Fall Scale Score
Full Model
Variable Name Estimate Standard
Error
Estimate Standard
Error
Estimate Standard
Error
Student-Level Data Intercept 70.04 1.90 15.06 1.42 44.43 9.71 Fall math scale score . . 0.98 0.01 0.94 0.01 Age at fall test . . . . -1.38 0.35 Female . . . . -1.56 0.31 Race/ethnicity
Hispanic . . . . -1.54 0.67 Non-Hispanic black . . . . -4.44 0.51
LEP/ELL . . . . -0.49 0.57 IEP/special services . . . . -3.17 0.61 Days between start of school and fall assessment . .
. .
-0.11 0.04
Days between assessments . . . . -0.03 0.03 Teacher-Level Data
Master’s degree . . . . -0.62 0.52 Experience . . . . 0.03 0.03 Prior use of the assigned curriculum . .
. .
1.58 0.80
Race/ethnicity Hispanic . . . . -0.45 0.82 Non-Hispanic black . . . . -0.03 0.80
Class size . . . . -0.10 0.09 Variance of the fall scale score . . . . -0.00 0.00 Skewness of the fall scale score . . . . 0.19 0.27 Teacher assessment overall score . .
. .
0.89 0.44
School-Level Data
Curricula
Investigations 0.17 1.30 0.64 0.83 1.35 0.79 Math Expressions 0.69 1.33 0.96 0.84 1.89 0.81 Saxon 2.73 1.30 2.67 0.83 2.75 0.82
Random assignment block Block 241 -1.89 2.33 -0.95 1.49 -3.22 2.72 Block 242 -0.78 2.34 -0.12 1.50 -2.24 2.52 Block 251 -6.49 3.08 -2.37 1.93 0.25 2.13

D.18
Table D.7 (continued)
Model Using Only Block Dummies
Model Using Only Fall Scale Score
Full Model
Variable Name Estimate Standard
Error
Estimate Standard
Error
Estimate Standard
Error
Block 252 -4.61 2.86 -0.86 1.80 -0.61 2.30 Block 253 -1.64 2.95 0.12 1.85 -1.19 2.30 Block 254 -6.96 2.59 -1.49 1.64 -0.17 2.00 Block 261 7.03 2.61 3.61 1.66 2.16 2.13 Block 271 7.33 2.34 4.19 1.50 0.44 2.17 Block 281 -12.29 2.71 -4.33 1.72 -2.06 1.95 Block 291 2.66 2.12 1.35 1.37 -1.59 1.65 Block 292 -1.41 2.65 2.03 1.69 1.53 2.02 Block 301 1.03 2.15 1.46 1.38 1.63 1.65 Block 311 -7.19 2.48 -4.48 1.60 -1.78 1.66 Block 312 8.37 2.49 2.26 1.60 2.81 1.48
Free/reduced-price meals . . . . -5.11 2.83 Title I . . . . 0.04 1.40 Residual Variance
Student level 211.02 79.44 75.69 Classroom level 16.24 4.97 4.78 School level 5.71 2.78 1.87
Note: Chapter I, Table I.3 provides the school, classroom, and student sample sizes that are the basis for these results.

D.19
based multiple imputations, and conclusions based on these results are the same as those using the single imputation approach actually employed.
Sensitivity Analyses
We explored whether the results are sensitive to (1) the specification of the HLMs used to estimate effects, (2) the one school that stopped using its assigned curriculum (Math Expressions) and did not allow spring testing of students and, therefore, had to be excluded from the analysis, and (3) the students who moved between study schools that used a different study curriculum.
HLM Specification. The teacher assessment of math content and pedagogical knowledge
can be scored using IRT techniques to create a single scale score based on all the items on the test, or to create two scale scores for each domain—content knowledge and pedagogical knowledge. For the first- and second-grade longitudinal samples, two separate HLMs were estimated with these scores, where one specification included the total scale score and the other included the two domain scale scores. Furthermore, both models were estimated with and without the student-level weight to assess the sensitivity of using the weight to calculate effects. Specifically, the following four models were estimated for the first- and second-grade longitudinal samples:
1. Weighted with the overall scale score on the teacher assessment
2. Unweighted with the overall scale score on the teacher assessment
3. Weighted with the content knowledge scale score and pedagogical knowledge scale score on the teacher assessment
4. Unweighted with the content knowledge scale score and pedagogical knowledge scale score on the teacher assessment
Results for all four models were very similar, showing nearly identical relative effects of the curricula.
No Outcome Data for One School. We also explored whether the results are affected by the
one (Math Expressions) school that stopped using the curriculum and did not allow spring testing of students and, therefore, had to be excluded from the analysis. This sensitivity analysis exploits a property of random assignment. Because of random assignment, we can assume that the schools assigned to each of the curriculum groups are identical, within a known degree of statistical precision. Since one of the schools assigned to Math Expressions stopped using the curriculum and did not allow the study team to test students in the spring, it implies that one school in each of the other groups would have done the same had they been assigned to Math Expressions. If we could identify those schools, we could exclude them from the analysis and recalculate the results. Since we cannot identify those schools, an alternative approach is to recalculate the results with two samples, one that excludes the lowest gaining Investigations, Saxon, and SFAW schools and another that excludes the highest gaining school in each of those
D.20
curriculum groups. These two sets of results represent the upper and lower bound on the single set of results that we would calculate if we could identify the correct Investigations, Saxon, and SFAW schools to exclude from the analysis. The pattern of results presented in Chapter III, Table III.2 is robust to this sensitivity analysis.
The Small Number of Students That Crossed Over to Another Study Curriculum. Last, the
results are not affected by crossovers. In a study of this kind, in which study schools are using four curricula, it is possible that students move between schools with different curricula during the school year. In the first-grade longitudinal sample, 30 of the 4,716 students were in different study schools with different curricula between fall and spring testing; in the second-grade longitudinal sample, 26 of the 3,344 students moved to a school with a different curriculum. Analytic techniques can be used to correct results for crossovers, but those techniques cannot be used in this setting because the number of crossovers is too low to support the analysis. To explore whether the results are affected by the crossovers, we deleted them from the sample and reestimated the model. The results are nearly identical to those reported in Table III.3.
Model Estimates Based on the Cross-Sectional Sample
The results for the three-level HLM based on the first- and second-grade cross-sectional samples are shown in Table D.8. The magnitude of the results for each unique pair-wise curriculum comparison that can be made are shown in Table D.9. The main conclusion based on these results is similar to the conclusion based on the longitudinal sample—that is, in both the first and second grades, the math curriculum used by the study schools mattered. At the first-grade level, three curriculum differentials are statistically significant—average math achievement of Math Expressions students was 0.11 and 0.13 standard deviations higher than achievement of Investigations and SFAW students, respectively, and average math achievement of Saxon students was 0.09 standard deviations higher than achievement of SFAW students. At the second-grade level, one curriculum differential is statistically significant—average math achievement of Saxon students was 0.13 standard deviations higher than achievement SFAW students. None of the other curriculum differentials at either grade level is statistically significant.
Subgroup Analyses
As described earlier, subgroup analyses were conducted to examine whether curriculum effects differ along seven characteristics: (1) participating districts, (2) school fall achievement, (3) school-level information about student eligibility for free or reduced-price meals, (4) teacher education, (5) teacher experience, (6) teacher math content and pedagogical knowledge, and (7) teacher prior use of the assigned curriculum at the K–3 level. These results were based on the longitudinal sample.

D.21
TABLE D.8
HIERARCHICAL LINEAR MODEL ESTIMATES FOR THE FIRST- AND SECOND-GRADE CROSS-SECTIONAL SAMPLES: OUTCOME IS SPRING MATH SCALE SCORE
Full Model
First Grade Second Grade
Variable Name Estimate Standard Error
Estimate Standard
Error
Student-Level Data
Intercept 30.41 5.41 51.60 9.66
Fall math scale score 0.62 0.01 0.84 0.01
Age at spring test -0.81 0.19 -0.95 0.37
Female -0.17 0.16 -1.71 0.33
Race/ethnicity Hispanic -0.78 0.31 -1.70 0.71 Non-Hispanic black -1.92 0.27 -4.40 0.54
LEP/ELL 0.03 0.27 -2.07 0.61
IEP/special services -2.18 0.30 -3.06 0.62
Days between start of school and fall assessment -0.03 0.02 -0.12 0.04
Days between assessments 0.01 0.02 -0.03 0.03 Teacher-Level Data
Master’s degree 0.25 0.26 -0.30 0.51
Experience 0.02 0.01 0.01 0.02
Prior use of the assigned curriculum -0.19 0.38 0.94 0.77
Race Hispanic -0.56 0.43 -1.40 0.82 Non-Hispanic black -0.30 0.43 -0.58 0.82
Class size 0.08 0.04 -0.13 0.08
Variance of the fall scale score -0.01 0.00 -0.00 0.00
Skewness of the fall scale score -0.19 0.17 0.05 0.31
Teacher assessment overall score 0.01 0.24 0.91 0.47

D.22
Table D.8 (continued)
Full Model
First Grade Second Grade
Variable Name Estimate Standard Error
Estimate Standard
Error
School-Level Data
Curricula Investigations 0.23 0.36 1.57 0.74 Math Expressions 1.05 0.37 1.50 0.76 Saxon 0.76 0.36 2.48 0.77
Random assignment block Block 201 -0.02 1.25 . . Block 202 2.18 1.24 . . Block 211 0.03 1.05 . . Block 221 1.05 1.09 . . Block 222 0.51 1.07 . . Block 231 -0.98 1.17 . . Block 232 -1.38 0.94 . . Block 233 -1.92 1.03 . . Block 241 0.50 1.20 -3.88 2.52 Block 242 0.34 1.10 -2.71 2.32 Block 251 -0.55 1.15 -0.41 2.04 Block 252 -0.74 1.17 -2.09 2.20 Block 253 -0.24 1.14 -3.10 2.19 Block 254 0.04 1.01 -1.10 1.93 Block 261 0.91 1.06 0.88 2.01 Block 271 0.08 1.03 -1.41 2.01 Block 281 -1.39 1.08 -3.09 1.85 Block 291 0.23 0.87 -2.94 1.56 Block 292 1.53 1.02 0.54 1.90 Block 301 1.20 0.84 0.64 1.52 Block 311 -1.85 0.88 -1.51 1.48 Block 312 0.44 0.82 3.32 1.33
Free/reduced-price meals -1.04 1.26 -6.48 2.68
Title I -0.36 0.48 0.00 1.29 Residual Variance
Student level 30.54 . 101.27 .
Classroom level 2.35 . 5.23 .
School level 0.41 . 0.86 .
Note: The first-grade sample excludes 1 cohort-one school with 3 classrooms and 32 students that participated during part of the school year and then stopped using its assigned curriculum (Math Expressions) and did not allow the study to collect follow-up data. The first-grade sample includes 109 schools, 467 teachers, and 5,413 students; the second-grade sample includes 71 schools, 335 teachers, and 3,869 students.
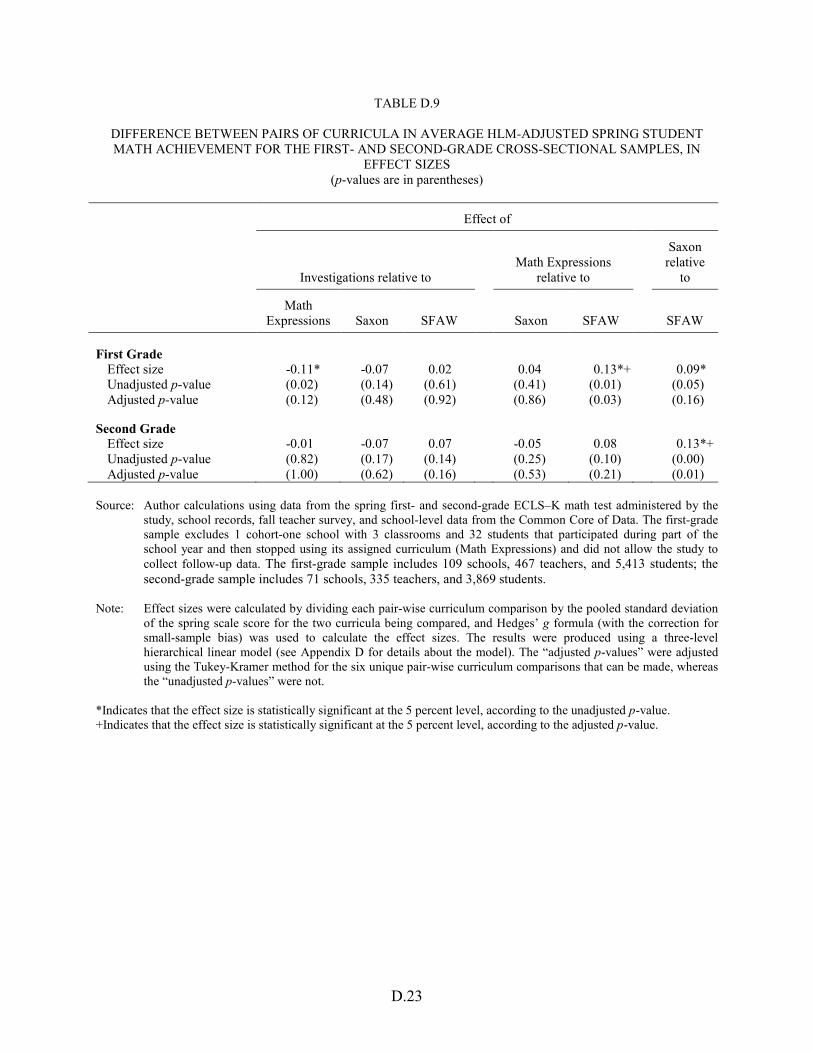
D.23
TABLE D.9
DIFFERENCE BETWEEN PAIRS OF CURRICULA IN AVERAGE HLM-ADJUSTED SPRING STUDENT MATH ACHIEVEMENT FOR THE FIRST- AND SECOND-GRADE CROSS-SECTIONAL SAMPLES, IN
EFFECT SIZES (p-values are in parentheses)
Effect of
Investigations relative to Math Expressions
relative to
Saxon relative
to
Math Expressions Saxon SFAW Saxon SFAW SFAW
First Grade Effect size -0.11* -0.07 0.02 0.04 0.13*+ 0.09* Unadjusted p-value (0.02) (0.14) (0.61) (0.41) (0.01) (0.05) Adjusted p-value (0.12) (0.48) (0.92) (0.86) (0.03) (0.16)
Second Grade Effect size -0.01 -0.07 0.07 -0.05 0.08 0.13*+ Unadjusted p-value (0.82) (0.17) (0.14) (0.25) (0.10) (0.00) Adjusted p-value (1.00) (0.62) (0.16) (0.53) (0.21) (0.01)
Source: Author calculations using data from the spring first- and second-grade ECLS–K math test administered by the
study, school records, fall teacher survey, and school-level data from the Common Core of Data. The first-grade sample excludes 1 cohort-one school with 3 classrooms and 32 students that participated during part of the school year and then stopped using its assigned curriculum (Math Expressions) and did not allow the study to collect follow-up data. The first-grade sample includes 109 schools, 467 teachers, and 5,413 students; the second-grade sample includes 71 schools, 335 teachers, and 3,869 students.
Note: Effect sizes were calculated by dividing each pair-wise curriculum comparison by the pooled standard deviation
of the spring scale score for the two curricula being compared, and Hedges’ g formula (with the correction for small-sample bias) was used to calculate the effect sizes. The results were produced using a three-level hierarchical linear model (see Appendix D for details about the model). The “adjusted p-values” were adjusted using the Tukey-Kramer method for the six unique pair-wise curriculum comparisons that can be made, whereas the “unadjusted p-values” were not.
*Indicates that the effect size is statistically significant at the 5 percent level, according to the unadjusted p-value. +Indicates that the effect size is statistically significant at the 5 percent level, according to the adjusted p-value.

D.24
Tables D.10 and D.11 present school, teacher, and student sample sizes for each subgroup, along with the average value of the characteristic used to define each subgroup for the first- and second-grade longitudinal samples. For example, the cell for the “lowest third school fall achievement” subgroup indicates the average value of school fall achievement for the schools included in that subgroup. The table also presents the minimum detectable effect size for each subgroup. The effect sizes were calculated as described in Chapter I using the sample sizes reported in Tables D.10 and D.11 and assuming that the sample is distributed evenly across the curricula.
Separate HLMs were estimated for each characteristic by expanding on the HLM described
in Chapter III—that is, interactions between the curriculum indicators and the subgroups defined by the characteristic were added to the model. For example, to examine whether curriculum effects differ along teacher education, the model was expanded to include eight third-level interactions:
1. Investigations interacted with teachers who had a master’s degree
2. Investigations interacted with teachers who did not have a master’s degree
3. Math Expressions interacted with teachers who had a master’s degree
4. Math Expressions interacted with teachers who did not have a master’s degree
5. Saxon interacted with teachers who had a master’s degree
6. Saxon interacted with teachers who did not have a master’s degree
7. SFAW interacted with teachers who had a master’s degree
8. SFAW interacted with teachers who did not have a master’s degree (serves as the reference category)
Similar models were used for the other characteristics.

D.25
TABLE D.10
SAMPLE SIZES USED IN FIRST-GRADE SUBGROUP ANALYSES
Sample
Size
Subgroup
Average Value of Subgroup
Characteristic Schools Teachers Students
Minimum Detectable Effect Size Between
Any Pair of Curricula
Participating Districts
District #1 -- 11 59 519 0.26 District #2 -- 7 22 232 0.43 District #3 -- 17 43 483 0.21 District #4 -- 4 14 204 --b District #5 -- 5 26 339 -- b District #6 -- 12 62 666 0.22 District #7 -- 8 23 212 0.43 District #8 -- 12 34 348 0.27 District #9 -- 4 14 208 -- b District #10 -- 11 67 655 0.23 District #11 -- 12 52 517 0.26 District #12 -- 6 38 333 0.44
School Fall Achievementa Lowest third 27.26 36 123 1,258 0.20 Middle third 30.68 36 169 1,643 0.19 Highest third 34.29 37 162 1,815 0.17
School Free/Reduced-Price Meals Participation
Up to 40% eligibility 16.00% 37 192 1,889 0.18 Greater than 40% eligibility 67.15% 72 262 2,827 0.14
Teacher Education
Bachelor’s degree -- 85 234 2,299 0.14 Master’s degree -- 96 220 2,417 0.13
Teacher Experience
Up to 5 years 2.46 71 126 1,308 0.15 Greater than 5 years 15.90 108 328 3,408 0.11
Teacher Math Content/Pedagogical Knowledgea
1st (lowest) quintile -1.23 58 87 873 0.19 2nd through 5th quintiles -0.38 108 367 3,843 0.10
Teacher Previously Used Curriculum
No prior use -- 105 402 4,155 0.10 Prior Use -- 33 52 561 0.28
a School Fall Achievement and Teacher Math Content/Pedagogical Knowledge are expressed in scale score units.
b Not presented because none of the curriculum differentials were examined for the subgroup, since each curriculum had only one school.
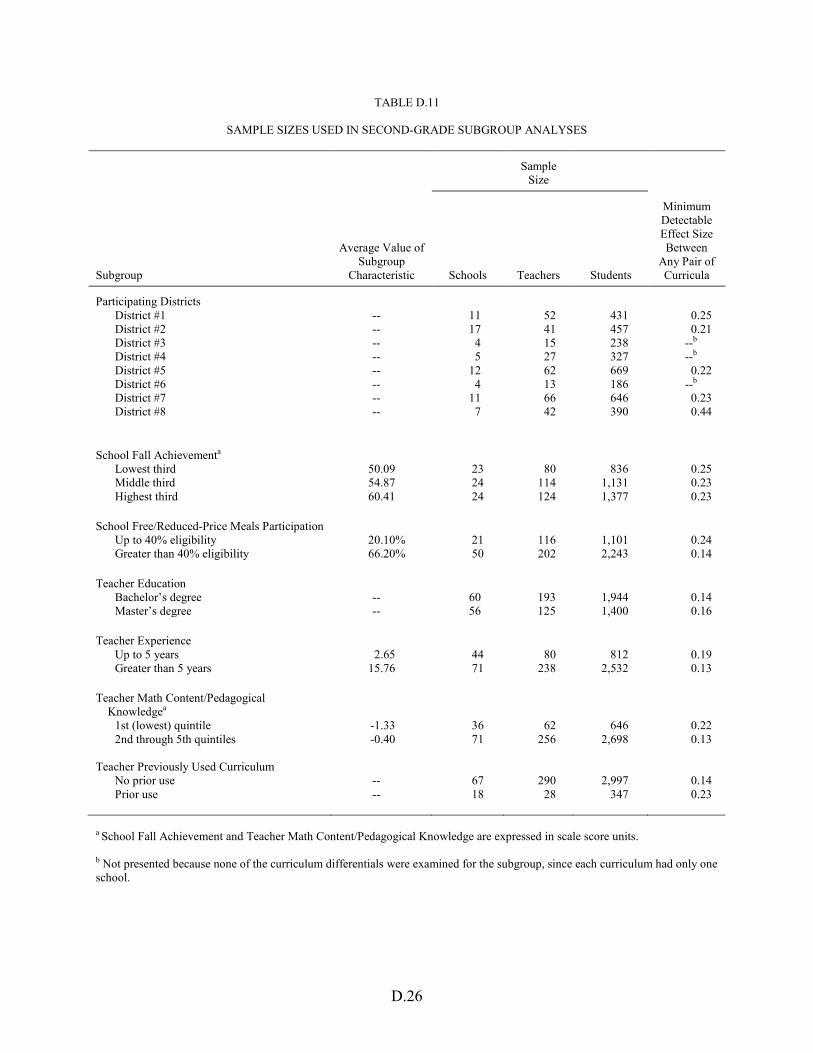
D.26
TABLE D.11
SAMPLE SIZES USED IN SECOND-GRADE SUBGROUP ANALYSES
Sample
Size
Subgroup
Average Value of Subgroup
Characteristic Schools Teachers Students
Minimum Detectable Effect Size Between
Any Pair of Curricula
Participating Districts
District #1 -- 11 52 431 0.25 District #2 -- 17 41 457 0.21 District #3 -- 4 15 238 --b District #4 -- 5 27 327 --b District #5 -- 12 62 669 0.22 District #6 -- 4 13 186 --b District #7 -- 11 66 646 0.23 District #8 -- 7 42 390 0.44
School Fall Achievementa
Lowest third 50.09 23 80 836 0.25 Middle third 54.87 24 114 1,131 0.23 Highest third 60.41 24 124 1,377 0.23
School Free/Reduced-Price Meals Participation Up to 40% eligibility 20.10% 21 116 1,101 0.24 Greater than 40% eligibility 66.20% 50 202 2,243 0.14
Teacher Education Bachelor’s degree -- 60 193 1,944 0.14 Master’s degree -- 56 125 1,400 0.16
Teacher Experience Up to 5 years 2.65 44 80 812 0.19 Greater than 5 years 15.76 71 238 2,532 0.13
Teacher Math Content/Pedagogical Knowledgea
1st (lowest) quintile -1.33 36 62 646 0.22 2nd through 5th quintiles -0.40 71 256 2,698 0.13
Teacher Previously Used Curriculum
No prior use -- 67 290 2,997 0.14 Prior use -- 18 28 347 0.23
a School Fall Achievement and Teacher Math Content/Pedagogical Knowledge are expressed in scale score units.
b Not presented because none of the curriculum differentials were examined for the subgroup, since each curriculum had only one school.

D.27
Pair-wise comparisons to determine the relative curriculum effects for each subgroup were made using the process described earlier. If a subgroup had two levels, twelve pair-wise comparisons were made. For example, to examine if curriculum effects differ along teacher experience, the following pair-wise comparisons were made:
• Investigations among teachers with five or fewer years of experience relative to Math Expressions among teachers with five or fewer years of experience
• Investigations among teachers with five or fewer years of experience relative to Saxon among teachers with five or fewer years of experience
• Investigations among teachers with five or fewer years of experience relative to SFAW among teachers with five or fewer years of experience
• Math Expressions among teachers with five or fewer years of experience relative to Saxon among teachers with five or fewer years of experience
• Math Expressions among teachers with five or fewer years of experience relative to SFAW among teachers with five or fewer years of experience
• Saxon among teachers with five or fewer years of experience relative to SFAW among teachers with five or fewer years of experience
• Investigations among teachers with more than five years of experience relative to Math Expressions among teachers with more than five years of experience
• Investigations among teachers with more than five years of experience relative to Saxon among teachers with more than five years of experience
• Investigations among teachers with more than five years of experience relative to SFAW among teachers with more than five years of experience
• Math Expressions among teachers with more than five years of experience relative to Saxon among teachers with more than five years of experience
• Math Expressions among teachers with more than five years of experience relative to SFAW among teachers with more than five years of experience
• Saxon among teachers with more than five years of experience relative to SFAW among teachers with more than five years of experience
The statistical significance of the curriculum differentials for each subgroup was calculated with and without adjusting for the six pair-wise curriculum comparisons that can be made. As described earlier, the Tukey-Kramer method was used to adjust the estimated p-values for the multiple comparisons being made. Tables D.12 and D.13 report the unadjusted and adjusted p-values for the relative curriculum effects for the first- and second-grade subgroups, respectively. The relative effects for the first- and second-grade subgroups are reported in Chapter III.

D.28
TABLE D.12
P-VALUES FOR EFFECT SIZES REPORTED IN TABLE III.3
Effect of
Investigations Relative to Math Expressions
Relative to
Saxon Relative
to
Math Expressions Saxon SFAW Saxon SFAW SFAW
School Fall Achievement Lowest third
Unadjusted p-value (0.17) (0.00) (0.24) (0.08) (0.02) (0.00) Adjusted p-value (0.88) (0.05) (0.95) (0.66) (0.19) (0.00)
Middle third Unadjusted p-value (0.75) (0.48) (0.77) (0.33) (0.98) (0.35) Adjusted p-value (1.00) (1.00) (1.00) (0.98) (1.00) (0.99)
Highest third Unadjusted p-value (0.04) (0.58) (0.79) (0.07) (0.05) (0.77) Adjusted p-value (0.39) (1.00) (1.00) (0.61) (0.49) (1.00)
School Free/Reduced-Price Meals Eligibility Up to 40% eligibility
Unadjusted p-value (0.06) (0.27) (0.67) (0.40) (0.12) (0.48) Adjusted p-value (0.43) (0.90) (1.00) (0.97) (0.65) (0.99)
Greater than 40% eligibility Unadjusted p-value (0.24) (0.29) (0.76) (0.94) (0.15) (0.18) Adjusted p-value (0.86) (0.91) (1.00) (1.00) (0.72) (0.78)
Teacher Education Less than master’s degree
Unadjusted p-value (0.78) (0.85) (0.61) (0.65) (0.43) (0.75) Adjusted p-value (1.00) (1.00) (1.00) (1.00) (0.98) (1.00)
Master’s degree or more Unadjusted p-value (0.00) (0.03) (0.80) (0.46) (0.01) (0.07) Adjusted p-value (0.05) (0.27) (1.00) (0.98) (0.10) (0.43)
Teacher Experience Up to 5 years
Unadjusted p-value (0.11) (0.76) (0.97) (0.18) (0.08) (0.72) Adjusted p-value (0.61) (1.00) (1.00) (0.77) (0.50) (1.00)
More than 5 years Unadjusted p-value (0.06) (0.15) (0.87) (0.71) (0.05) (0.11) Adjusted p-value (0.41) (0.71) (1.00) (1.00) (0.33) (0.60)
Teacher Math Content/Pedagogical Knowledge First (lowest) quintile
Unadjusted p-value (0.56) (0.87) (0.54) (0.68) (0.23) (0.45) Adjusted p-value (1.00) (1.00) (0.99) (1.00) (0.85) (0.98)
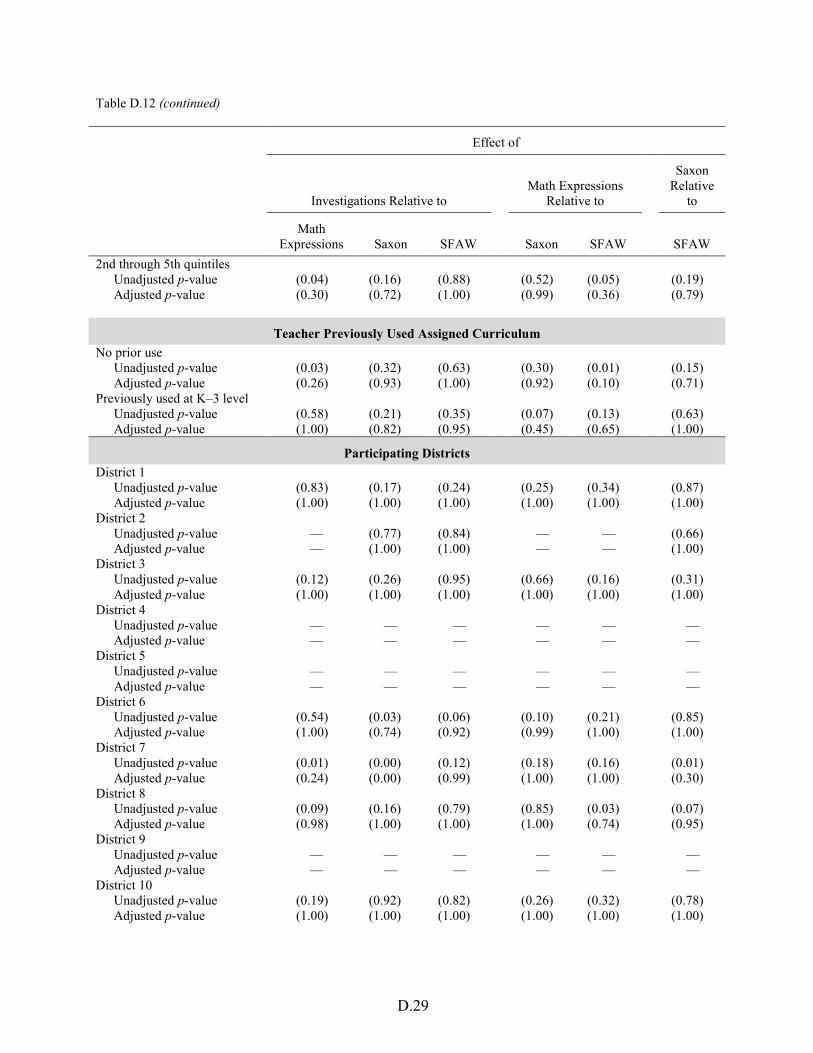
Table D.12 (continued)
D.29
Effect of
Investigations Relative to Math Expressions
Relative to
Saxon Relative
to
Math Expressions Saxon SFAW Saxon SFAW SFAW
2nd through 5th quintiles Unadjusted p-value (0.04) (0.16) (0.88) (0.52) (0.05) (0.19) Adjusted p-value
(0.30) (0.72) (1.00) (0.99) (0.36) (0.79)
Teacher Previously Used Assigned Curriculum No prior use
Unadjusted p-value (0.03) (0.32) (0.63) (0.30) (0.01) (0.15) Adjusted p-value (0.26) (0.93) (1.00) (0.92) (0.10) (0.71)
Previously used at K–3 level Unadjusted p-value (0.58) (0.21) (0.35) (0.07) (0.13) (0.63) Adjusted p-value (1.00) (0.82) (0.95) (0.45) (0.65) (1.00)
Participating Districts District 1
Unadjusted p-value (0.83) (0.17) (0.24) (0.25) (0.34) (0.87) Adjusted p-value (1.00) (1.00) (1.00) (1.00) (1.00) (1.00)
District 2 Unadjusted p-value — (0.77) (0.84) — — (0.66) Adjusted p-value — (1.00) (1.00) — — (1.00)
District 3 Unadjusted p-value (0.12) (0.26) (0.95) (0.66) (0.16) (0.31) Adjusted p-value (1.00) (1.00) (1.00) (1.00) (1.00) (1.00)
District 4 Unadjusted p-value — — — — — — Adjusted p-value — — — — — —
District 5 Unadjusted p-value — — — — — — Adjusted p-value — — — — — —
District 6 Unadjusted p-value (0.54) (0.03) (0.06) (0.10) (0.21) (0.85) Adjusted p-value (1.00) (0.74) (0.92) (0.99) (1.00) (1.00)
District 7 Unadjusted p-value (0.01) (0.00) (0.12) (0.18) (0.16) (0.01) Adjusted p-value (0.24) (0.00) (0.99) (1.00) (1.00) (0.30)
District 8 Unadjusted p-value (0.09) (0.16) (0.79) (0.85) (0.03) (0.07) Adjusted p-value (0.98) (1.00) (1.00) (1.00) (0.74) (0.95)
District 9 Unadjusted p-value — — — — — — Adjusted p-value — — — — — —
District 10 Unadjusted p-value (0.19) (0.92) (0.82) (0.26) (0.32) (0.78) Adjusted p-value (1.00) (1.00) (1.00) (1.00) (1.00) (1.00)
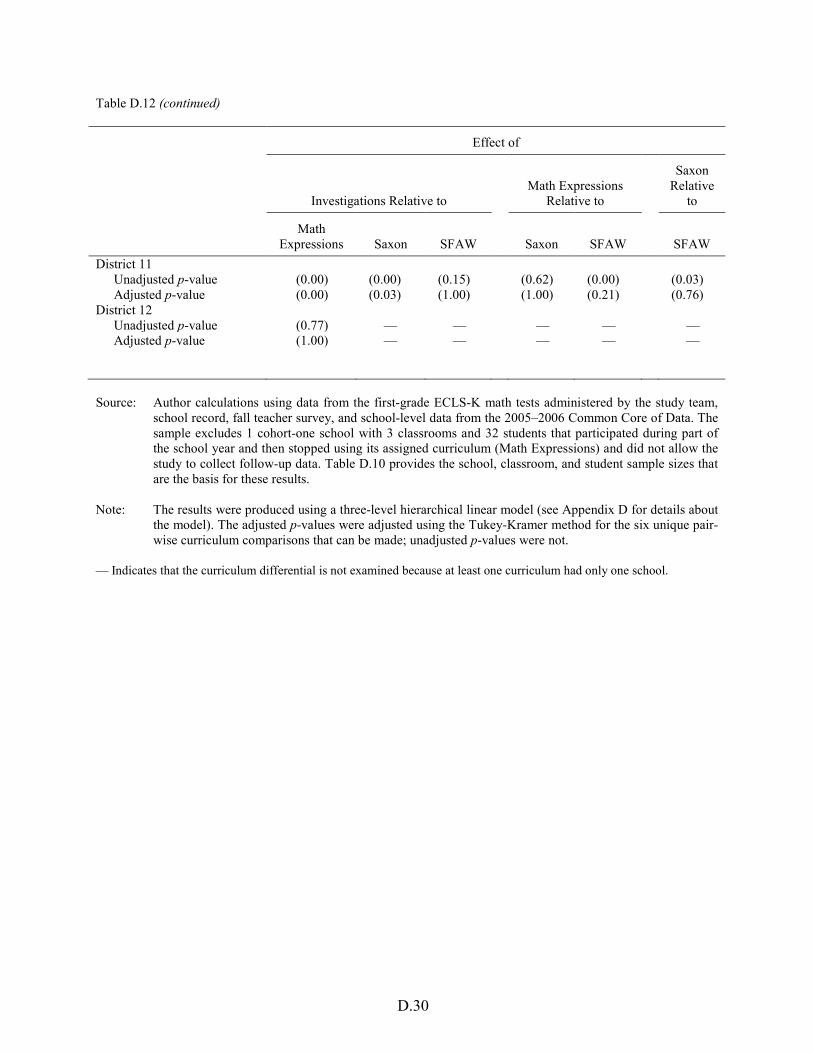
Table D.12 (continued)
D.30
Effect of
Investigations Relative to Math Expressions
Relative to
Saxon Relative
to
Math Expressions Saxon SFAW Saxon SFAW SFAW
District 11 Unadjusted p-value (0.00) (0.00) (0.15) (0.62) (0.00) (0.03) Adjusted p-value (0.00) (0.03) (1.00) (1.00) (0.21) (0.76)
District 12 Unadjusted p-value (0.77) — — — — — Adjusted p-value
(1.00) — — — — —
Source: Author calculations using data from the first-grade ECLS-K math tests administered by the study team,
school record, fall teacher survey, and school-level data from the 2005–2006 Common Core of Data. The sample excludes 1 cohort-one school with 3 classrooms and 32 students that participated during part of the school year and then stopped using its assigned curriculum (Math Expressions) and did not allow the study to collect follow-up data. Table D.10 provides the school, classroom, and student sample sizes that are the basis for these results.
Note: The results were produced using a three-level hierarchical linear model (see Appendix D for details about
the model). The adjusted p-values were adjusted using the Tukey-Kramer method for the six unique pair-wise curriculum comparisons that can be made; unadjusted p-values were not.
— Indicates that the curriculum differential is not examined because at least one curriculum had only one school.
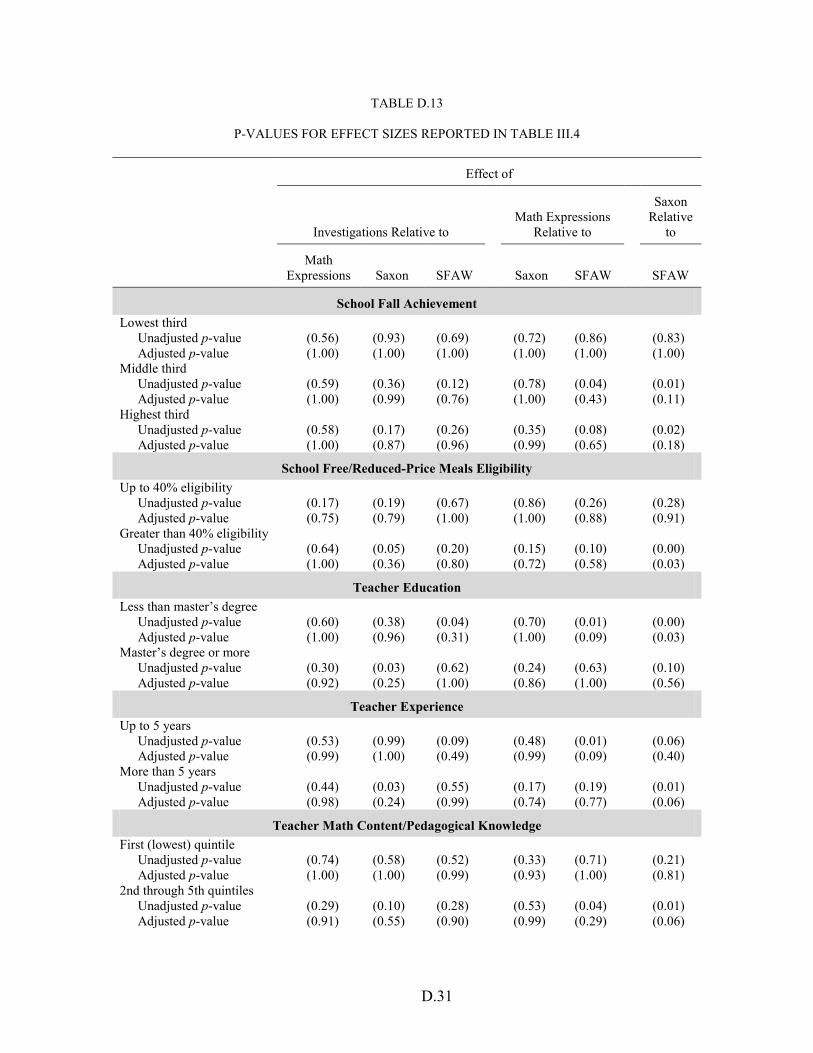
D.31
TABLE D.13
P-VALUES FOR EFFECT SIZES REPORTED IN TABLE III.4
Effect of
Investigations Relative to Math Expressions
Relative to
Saxon Relative
to
Math Expressions Saxon SFAW Saxon SFAW SFAW
School Fall Achievement Lowest third
Unadjusted p-value (0.56) (0.93) (0.69) (0.72) (0.86) (0.83) Adjusted p-value (1.00) (1.00) (1.00) (1.00) (1.00) (1.00)
Middle third Unadjusted p-value (0.59) (0.36) (0.12) (0.78) (0.04) (0.01) Adjusted p-value (1.00) (0.99) (0.76) (1.00) (0.43) (0.11)
Highest third Unadjusted p-value (0.58) (0.17) (0.26) (0.35) (0.08) (0.02) Adjusted p-value (1.00) (0.87) (0.96) (0.99) (0.65) (0.18)
School Free/Reduced-Price Meals Eligibility Up to 40% eligibility
Unadjusted p-value (0.17) (0.19) (0.67) (0.86) (0.26) (0.28) Adjusted p-value (0.75) (0.79) (1.00) (1.00) (0.88) (0.91)
Greater than 40% eligibility Unadjusted p-value (0.64) (0.05) (0.20) (0.15) (0.10) (0.00) Adjusted p-value (1.00) (0.36) (0.80) (0.72) (0.58) (0.03)
Teacher Education Less than master’s degree
Unadjusted p-value (0.60) (0.38) (0.04) (0.70) (0.01) (0.00) Adjusted p-value (1.00) (0.96) (0.31) (1.00) (0.09) (0.03)
Master’s degree or more Unadjusted p-value (0.30) (0.03) (0.62) (0.24) (0.63) (0.10) Adjusted p-value (0.92) (0.25) (1.00) (0.86) (1.00) (0.56)
Teacher Experience Up to 5 years
Unadjusted p-value (0.53) (0.99) (0.09) (0.48) (0.01) (0.06) Adjusted p-value (0.99) (1.00) (0.49) (0.99) (0.09) (0.40)
More than 5 years Unadjusted p-value (0.44) (0.03) (0.55) (0.17) (0.19) (0.01) Adjusted p-value (0.98) (0.24) (0.99) (0.74) (0.77) (0.06)
Teacher Math Content/Pedagogical Knowledge First (lowest) quintile
Unadjusted p-value (0.74) (0.58) (0.52) (0.33) (0.71) (0.21) Adjusted p-value (1.00) (1.00) (0.99) (0.93) (1.00) (0.81)
2nd through 5th quintiles Unadjusted p-value (0.29) (0.10) (0.28) (0.53) (0.04) (0.01) Adjusted p-value (0.91) (0.55) (0.90) (0.99) (0.29) (0.06)

Table D.13 (continued)
D.32
Effect of
Investigations Relative to Math Expressions
Relative to
Saxon Relative
to
Math Expressions Saxon SFAW Saxon SFAW SFAW
Teacher Previously Used Assigned Curriculum No prior use
Unadjusted p-value (0.41) (0.11) (0.31) (0.40) (0.08) (0.01) Adjusted p-value (0.97) (0.58) (0.92) (0.97) (0.46) (0.09)
Previously used at K–3 level
Unadjusted p-value (0.11) (0.18) (0.95) (0.44) (0.06) (0.05) Adjusted p-value (0.59) (0.76) (1.00) (0.98) (0.39) (0.31)
Participating Districts District 1
Unadjusted p-value (0.47) (0.69) (0.06) (0.20) (0.01) (0.06) Adjusted p-value (1.00) (1.00) (0.85) (1.00) (0.23) (0.82)
District 3 Unadjusted p-value (0.66) (0.00) (0.72) (0.00) (0.94) (0.00) Adjusted p-value (1.00) (0.01) (1.00) (0.06) (1.00) (0.06)
District 4 Unadjusted p-value — — — — — — Adjusted p-value — — — — — —
District 5 Unadjusted p-value — — — — — — Adjusted p-value — — — — — —
District 6 Unadjusted p-value (0.23) (0.61) (0.00) (0.08) (0.00) (0.00) Adjusted p-value (1.00) (1.00) (0.00) (0.90) (0.00) (0.02)
District 9 Unadjusted p-value — — — — — — Adjusted p-value — — — — — —
District 10 Unadjusted p-value (0.66) (0.65) (0.39) (0.44) (0.63) (0.27) Adjusted p-value (1.00) (1.00) (1.00) (1.00) (1.00) (1.00)
District 12 Unadjusted p-value (0.31) (0.93) — (0.27) — — Adjusted p-value (1.00) (1.00) — (1.00) — —
Source: Author tabulations using data from the second-grade ECLS-K math tests administered by the
study team, school record, fall 2006 teacher survey, and school-level data from the 2005–2006 Common Core of Data. Table D.11 provides the school, classroom, and student sample sizes that are the basis for these results.
Note: The results were produced using a three-level hierarchical linear model (see Appendix D for
details about the model). The adjusted p-values were adjusted using the Tukey-Kramer method for the six unique pair-wise curriculum comparisons that can be made; unadjusted p-values were not.
— Indicates that the curriculum differential is not examined because at least one curriculum had only one school.

This page intentionally left blank for double-sided copying.

Table D.13 (continued)
D.34