Embed Size (px)
Citation preview

© 2017 THE EDUCATION TRUST
Copyright 2017 The Education Trust
Achievement and
Opportunity in America:Critical Next Steps for School
Boards
NSBA Equity Symposium
Washington, DC
January, 2017

© 2017 THE EDUCATION TRUST
America: Two Powerful Stories

© 2017 THE EDUCATION TRUST
1. Land of Opportunity:
Work hard, and you can become
anything you want to be.

© 2017 THE EDUCATION TRUST
2. Generational Advancement:
Through hard work, each generation of
parents can assure a better life — and
better education — for their children.

© 2017 THE EDUCATION TRUST
These stories animated hopes and dreams of
people here at home
And drew countless immigrants to our shores

© 2017 THE EDUCATION TRUST
Yes, America was often intolerant…
And they knew the “Dream” was a work in progress.
© 2017 THE EDUCATION TRUST
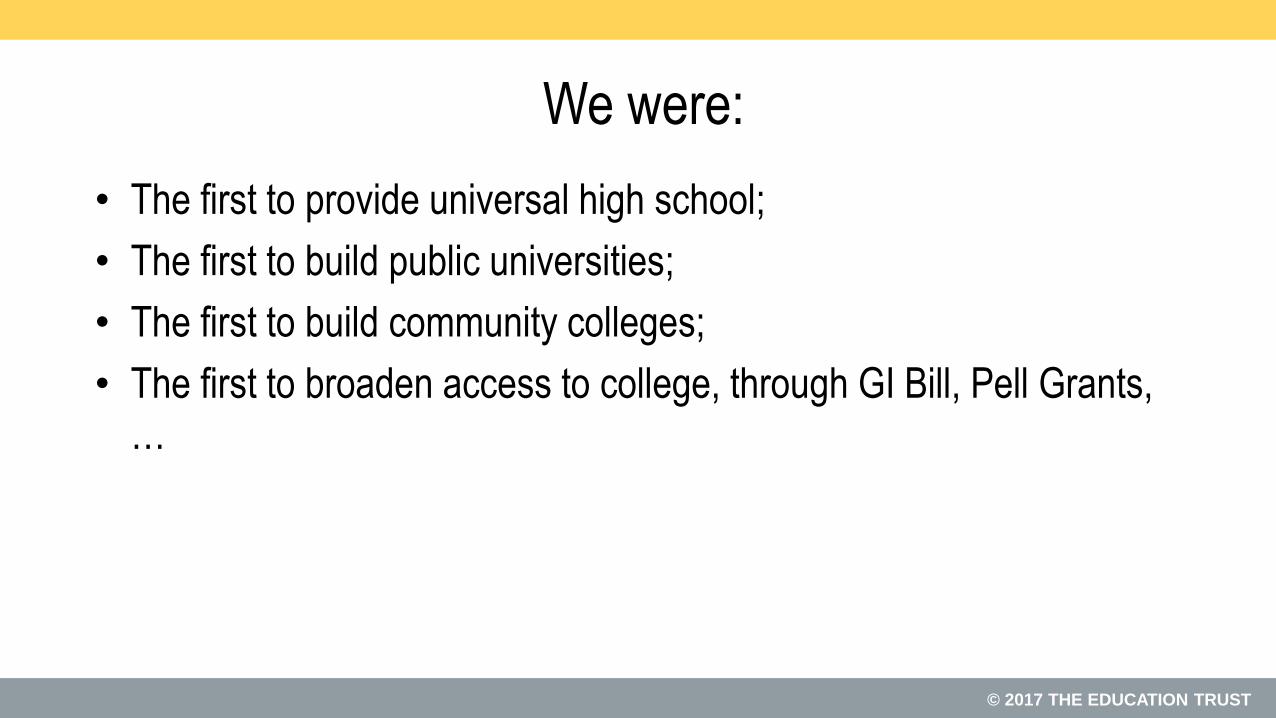
We were:
• The first to provide universal high school;
• The first to build public universities;
• The first to build community colleges;
• The first to broaden access to college, through GI Bill, Pell Grants,
…

© 2017 THE EDUCATION TRUST
1920 1940 1960
1980 2000 2012
Percent of U.S. adults with a high school diploma

© 2017 THE EDUCATION TRUST
Percent of U.S. adults with a B.A. or more
192019401960198020002012

© 2017 THE EDUCATION TRUST
Progress was painfully slow, especially for people
of color. But year by year, decade by decade…
© 2017 THE EDUCATION TRUST
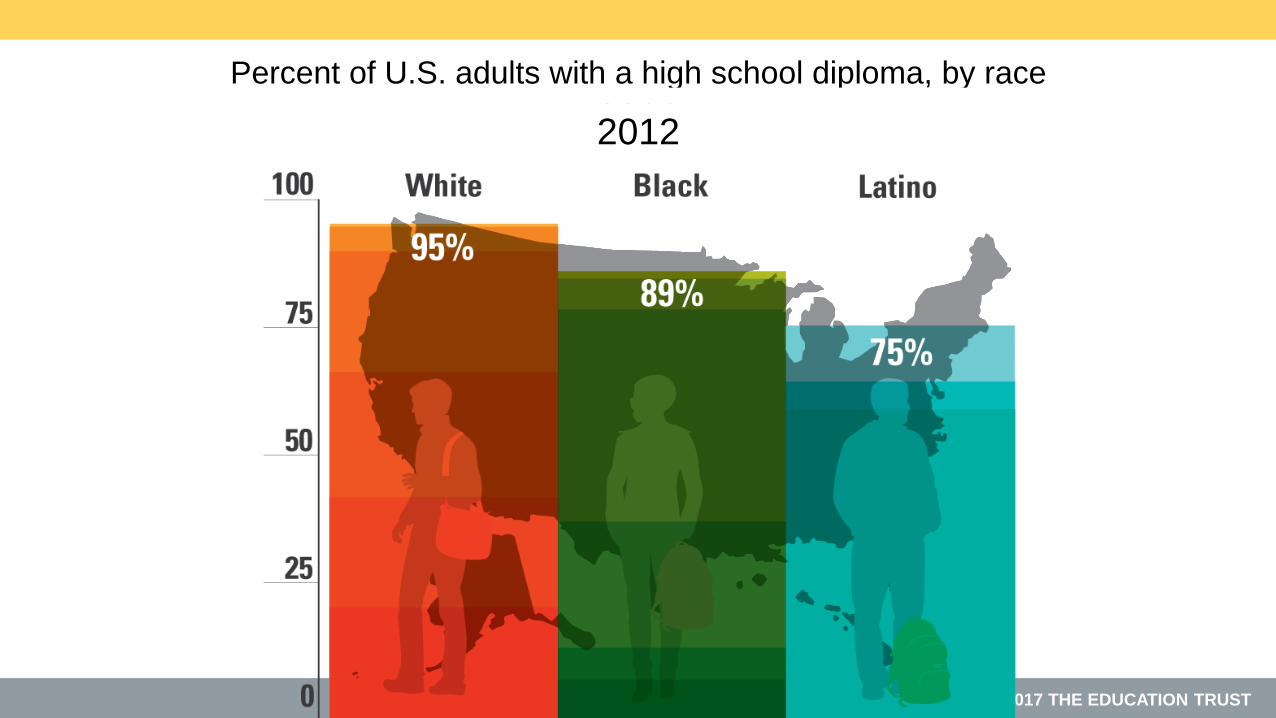
Percent of U.S. adults with a high school diploma, by race
192019401960198020002012

© 2017 THE EDUCATION TRUST
Percent of U.S. adults with a B.A. or more, by race
192019401960198020002012

© 2017 THE EDUCATION TRUST© 2017 THE EDUCATION TRUST
Then, beginning in the eighties,
growing economic inequality
started eating away at our
progress.

© 2017 THE EDUCATION TRUST© 2017 THE EDUCATION TRUST
In recent years, most income gains have
gone to those at the top of the ladder, while
those at the bottom have fallen backwards.
Source: Stiglitz, “Inequality is a Choice,” New York Times, October 13, 2013.

© 2017 THE EDUCATION TRUST© 2017 THE EDUCATION TRUST
0.00
0.10
0.20
0.30
0.40
0.50
0.60
0.70
0.80
0.90
1.00
Gin
iCo
effi
cien
t
Note: Gini coefficient ranges from 0 to 1, where 0 indicates total income equality and 1 indicates total income inequality.
Instead of being the most equal, the U.S. has the third
highest income inequality among OECD nations.
United States
Source: United Nations, U.N. data, http://data.un.org/DocumentData.aspx?q=gini&id=271: 2011

© 2017 THE EDUCATION TRUST© 2017 THE EDUCATION TRUST
Not just wages and wealth, but social
mobility as well.
© 2017 THE EDUCATION TRUST© 2017 THE EDUCATION TRUST
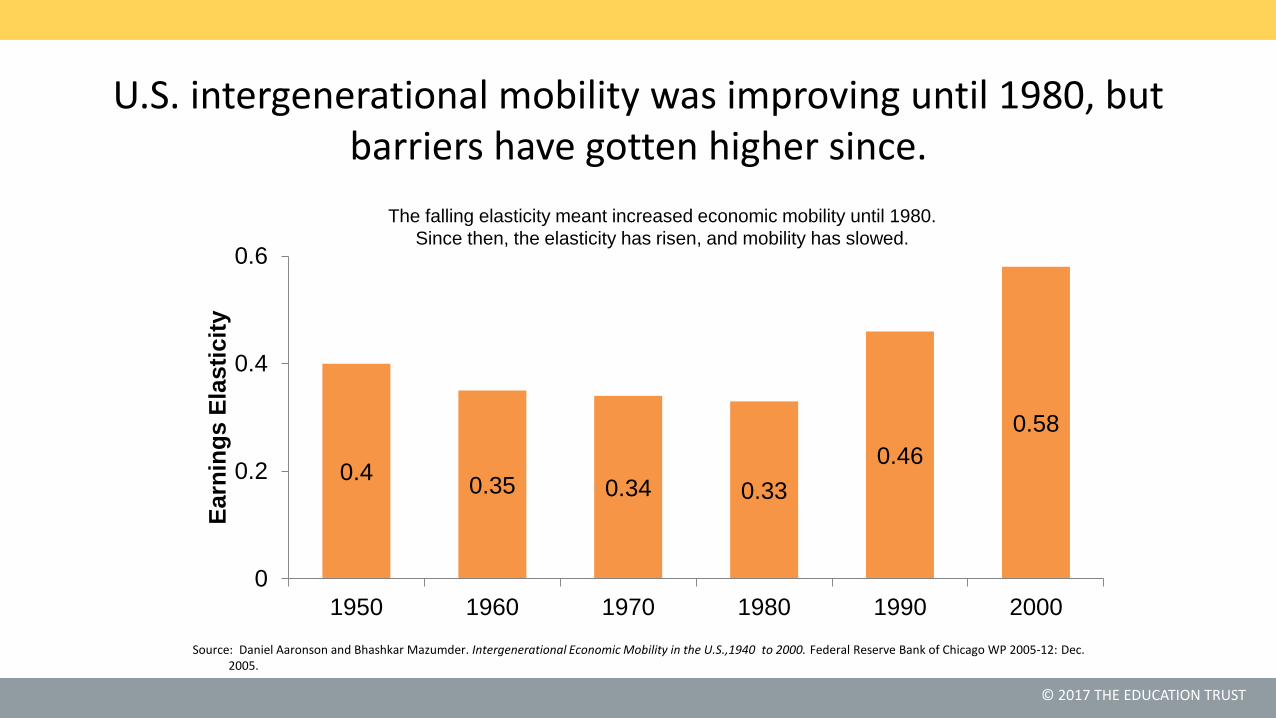
U.S. intergenerational mobility was improving until 1980, but barriers have gotten higher since.
Source: Daniel Aaronson and Bhashkar Mazumder. Intergenerational Economic Mobility in the U.S.,1940 to 2000. Federal Reserve Bank of Chicago WP 2005-12: Dec. 2005.
0.40.35 0.34 0.33
0.46
0.58
0
0.2
0.4
0.6
1950 1960 1970 1980 1990 2000
Earn
ing
s E
lasti
cit
yThe falling elasticity meant increased economic mobility until 1980.
Since then, the elasticity has risen, and mobility has slowed.

© 2017 THE EDUCATION TRUST
Source:
The US now has one of lowest rates of
intergenerational mobility
0.5 0.48 0.470.41 0.4
0.320.27 0.26
0.19 0.18 0.17 0.15
0
0.2
0.4
0.6
UnitedKingdom
Italy UnitedStates
France Spain Germany Sweden Australia Canada Finland Norway Denmark
Earn
ings
Ela
stic
ity
Cross-country examples of the link between father and son wages
Source: Corak, Miles. Chasing the Same Dream, Climbing Different Ladders. Economic Mobility Project;
Pew Charitable Trusts, 2010.

© 2017 THE EDUCATION TRUST
At macro level, better and more equal education is not
the only answer.
But at the individual level, it really is.

© 2017 THE EDUCATION TRUST© 2017 THE EDUCATION TRUST
There is one road up, and that road runs
through us.
© 2017 THE EDUCATION TRUST© 2017 THE EDUCATION TRUST
So, how are we doing?

© 2017 THE EDUCATION TRUST
First, some good news.
After more than a decade of fairly flat achievement and stagnant or growing gaps in K-12, we appear to be turning
the corner with our elementary students.

© 2017 THE EDUCATION TRUST
Source:
Since 1999, large gains for all groups of
students, especially students of color
150
160
170
180
190
200
210
220
230
240
250
1971* 1975* 1980* 1984* 1988* 1990* 1992* 1994* 1996* 1999* 2004 2008 2012
Ave
rage
Sca
le S
core
9 Year Olds – NAEP Reading
African American Latino White
*Denotes previous assessment formatNational Center for Education Statistics, “The Nation's Report Card: Trends in Academic Progress 2012”

© 2017 THE EDUCATION TRUST
Source:
Since 1999, performance rising for
all groups of students
160
170
180
190
200
210
220
230
240
250
260
1973* 1978* 1982* 1986* 1990* 1992* 1994* 1996* 1999* 2004 2008 2012
Ave
rage
Sca
le S
core
9 Year Olds – NAEP Math
African American Latino White
*Denotes previous assessment formatNational Center for Education Statistics, “The Nation's Report Card: Trends in Academic Progress 2012”

© 2017 THE EDUCATION TRUST
Looked at differently, and on the other NAEP
exam…

© 2017 THE EDUCATION TRUST
Source:
1996 NAEP Grade 4 Math
73%61%
26%
24%
32%
49%
3% 7%
26%
0%
10%
20%
30%
40%
50%
60%
70%
80%
90%
100%
AfricanAmerican
Latino White
Per
cen
tage
of
Stu
den
ts
By Race/Ethnicity – National Public
Proficient/Advanced
Basic
Below Basic
National Center for Education Statistics, NAEP Data Explorer, http://nces.ed.gov/nationsreportcard/nde/

© 2017 THE EDUCATION TRUST
Source:
© 2015 THE EDUCATION TRUST
34%27%
9%
48%
47%
37%
18%26%
54%
0%
10%
20%
30%
40%
50%
60%
70%
80%
90%
100%
African American Latino White
Perc
enta
ge o
f St
ud
ents
By Race/Ethnicity – National Public
Proficient/Advanced
Basic
Below Basic
National Center for Education Statistics, NAEP Data Explorer, http://nces.ed.gov/nationsreportcard/nde/
2013 NAEP Grade 4 Math
© 2017 THE EDUCATION TRUST
Middle grades are up, too.

© 2017 THE EDUCATION TRUST© 2017 THE EDUCATION TRUST
Record performance for students of
color
200
210
220
230
240
250
260
270
280
290
300
1971* 1975* 1980* 1984* 1988* 1990* 1992* 1994* 1996* 1999* 2004 2008 2012
Ave
rage
Sca
le S
core
13 Year Olds – NAEP Reading
African American Latino White
*Denotes previous assessment format• National Center for Education Statistics, “The Nation's Report Card: Trends in Academic Progress 2012”
© 2017 THE EDUCATION TRUST
Source:
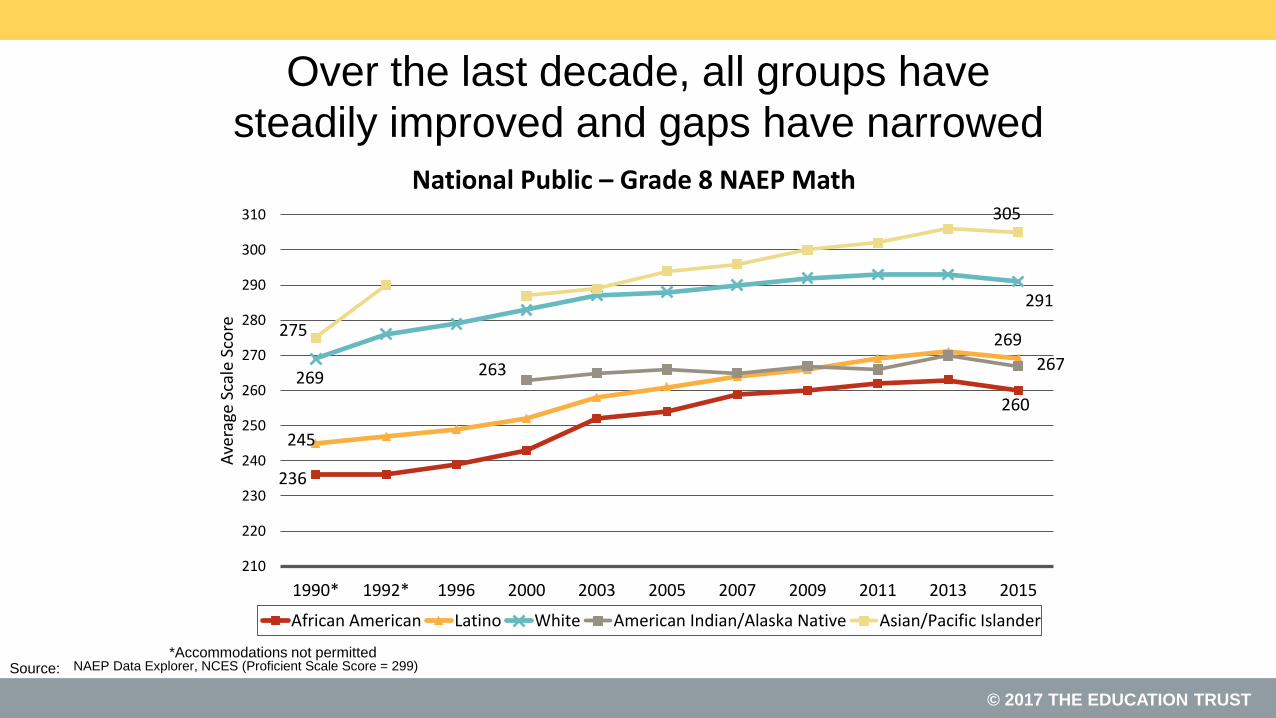
Over the last decade, all groups have
steadily improved and gaps have narrowed
236
260
245
269
269
291
263 267
275
305
210
220
230
240
250
260
270
280
290
300
310
1990* 1992* 1996 2000 2003 2005 2007 2009 2011 2013 2015
Ave
rage
Sca
le S
core
National Public – Grade 8 NAEP Math
African American Latino White American Indian/Alaska Native Asian/Pacific Islander
NAEP Data Explorer, NCES (Proficient Scale Score = 299)*Accommodations not permitted

© 2017 THE EDUCATION TRUST
Bottom Line:
When we really focus on something, we
make progress!

© 2017 THE EDUCATION TRUST
Clearly, much more remains to be done in elementary
and middle school
Too many youngsters still enter high school way behind.
© 2017 THE EDUCATION TRUST
But at least we have some traction on elementary and middle
school problems.
The same is NOT true
of our high schools.

© 2017 THE EDUCATION TRUST
Source:
Achievement is flat in reading for students overall.
240
250
260
270
280
290
300
310
320
330
340
1984 1988 1990 1992 1994 1996 1999 2004 2008 2012
Ave
rage
Sca
le S
core
17-Year-Olds Overall - NAEP
NAEP Long-Term Trends, NCES (2004)

© 2017 THE EDUCATION TRUST
Source:
Math achievement for students overall is flat over time.
250
260
270
280
290
300
310
320
330
340
350
1973* 1978* 1982* 1986* 1990* 1992* 1994* 1996* 1999* 2004 2008 2012
Ave
rage
Sca
le S
core
17-Year-Olds Overall - NAEP
National Center for Education Statistics, NAEP 2008 Trends in Academic Progress
* Denotes previous assessment format

© 2017 THE EDUCATION TRUST© 2017 THE EDUCATION TRUST
And despite earlier improvements, gaps
between groups haven’t narrowed much
since the late 80s and early 90s.
© 2017 THE EDUCATION TRUST
Source:
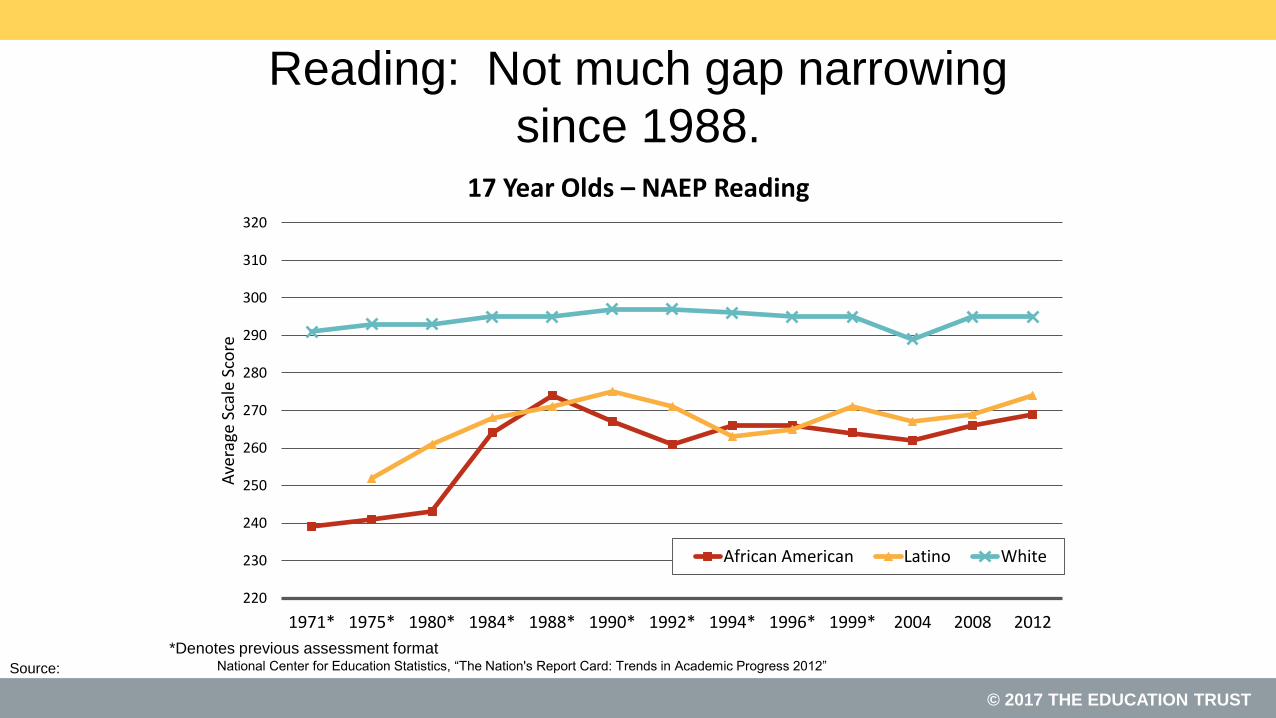
Reading: Not much gap narrowing
since 1988.
220
230
240
250
260
270
280
290
300
310
320
1971* 1975* 1980* 1984* 1988* 1990* 1992* 1994* 1996* 1999* 2004 2008 2012
Ave
rage
Sca
le S
core
17 Year Olds – NAEP Reading
African American Latino White
*Denotes previous assessment formatNational Center for Education Statistics, “The Nation's Report Card: Trends in Academic Progress 2012”
© 2017 THE EDUCATION TRUST
Source:
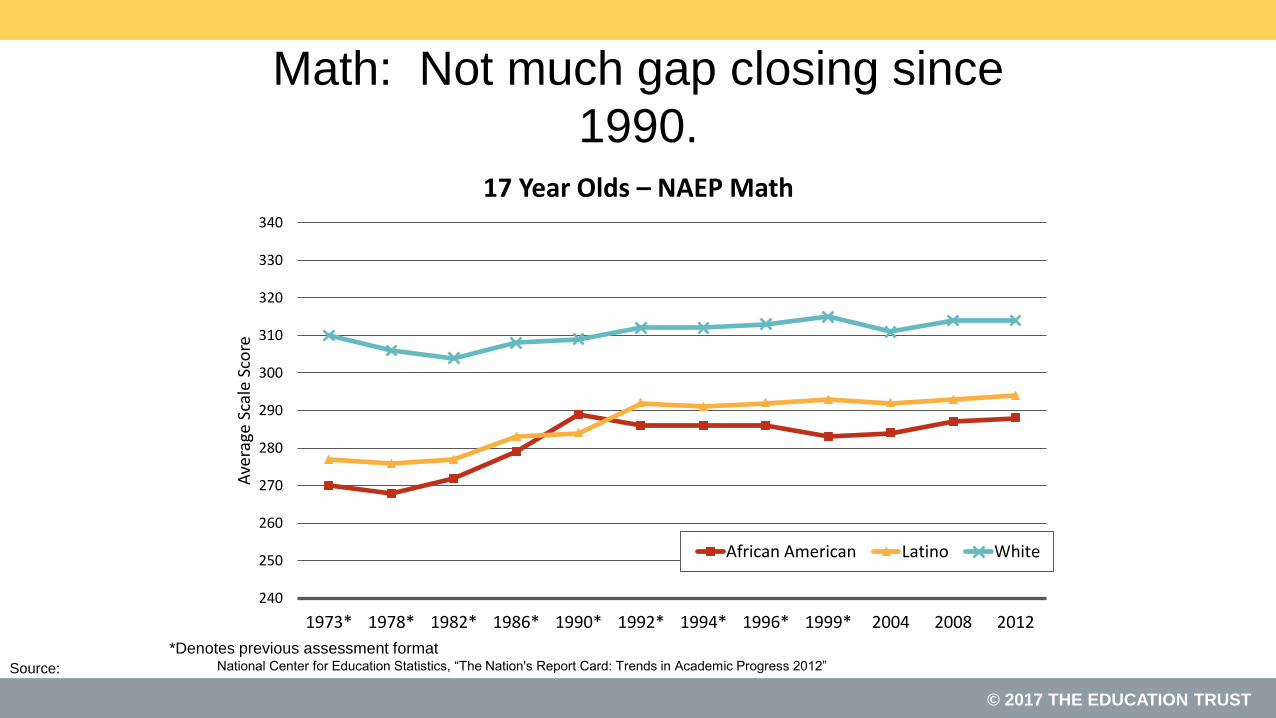
Math: Not much gap closing since
1990.
240
250
260
270
280
290
300
310
320
330
340
1973* 1978* 1982* 1986* 1990* 1992* 1994* 1996* 1999* 2004 2008 2012
Ave
rage
Sca
le S
core
17 Year Olds – NAEP Math
African American Latino White
*Denotes previous assessment formatNational Center for Education Statistics, “The Nation's Report Card: Trends in Academic Progress 2012”

© 2017 THE EDUCATION TRUST© 2017 THE EDUCATION TRUST
Moreover, no matter how you cut
the data, our students aren’t doing
well compared with their peers in
other countries.

© 2017 THE EDUCATION TRUST
Source:
Of 35 OECD Countries, U.S.A. Ranks 19th in Science
Literacy
300
350
400
450
500
550
Ave
rage
Sca
le S
core
PISA Science, 2015 – All Students
U.S.A. OECD
Higher than U.S. average Not measurably different from U.S. average Lower than U.S. average
National Center for Education Statistics, 2016 https://nces.ed.gov/surveys/pisa/pisa2015/pisa2015highlights_3.asp

© 2017 THE EDUCATION TRUST
Source:
0
100
200
300
400
500
600
Reading, 2015 - All Students
Of 35 OECD Countries, U.S.A. Ranks 20thth in
Reading Literacy
U.S.A. OECD
Higher than U.S. average Not measurably different from U.S. average Lower than U.S. average
National Center for Education Statistics, 2016 https://nces.ed.gov/surveys/pisa/pisa2015/pisa2015highlights_4.asp
Ave
rag
e s
ca
le s
co
re

© 2017 THE EDUCATION TRUST
Source:
Of 35 OECD Countries, U.S.A. Ranks 31st in Math
Literacy
U.S.A.OECD
Higher than U.S. average Not measurably different from U.S. average Lower than U.S. average
National Center for Education Statistics, 2016 https://nces.ed.gov/surveys/pisa/pisa2015/pisa2015highlights_5.asp
300
350
400
450
500
550
Ja
pa
n
Ko
rea
, R
epu
blic
of
Sw
itze
rlan
d
Esto
nia
Ca
na
da
Ne
the
rla
nd
s
De
nm
ark
Fin
land
Slo
ve
nia
Ge
rma
ny
Po
land
Ire
land
No
rway
Au
str
ia
Ne
w Z
ea
land
Sw
ede
n
Au
str
alia
Fra
nce
Un
ite
d K
ingd
om
Cze
ch R
epu
blic
Po
rtu
ga
l
OE
CD
avera
ge
Ita
ly
Ice
land
Sp
ain
Luxe
mb
ou
rg
Latv
ia
Hu
ng
ary
Slo
va
k R
ep
ub
lic
Isra
el
Un
ite
d S
tate
s
Gre
ece
Ch
ile
Turk
ey
Me
xic
o
Ave
rag
e s
ca
le s
co
re
Math, 2015 – All Students

© 2017 THE EDUCATION TRUST
Up until the latest results, the only place we ranked
high was someplace we didn’t want to rank high:
Inequality!
But we made a little progress there.

© 2017 THE EDUCATION TRUST
Source:
The gap between high and low-SES students in the United States is
slightly smaller than the OECD average.
National Center for Education Statistics, 2016 https://nces.ed.gov/surveys/pisa/pisa2015/pisa2015highlights_4.asp
350
400
450
500
550
600
Icela
nd
Tu
rke
y
Norw
ay
Esto
nia
Latv
ia
Me
xic
o
Cana
da
Denm
ark
Fin
land
Kore
a, R
ep
ublic
of
United
Kin
gd
om
Ja
pa
n
Slo
ven
ia
Un
ited
Sta
tes
Ire
land
Spa
in
Italy
Pola
nd
OE
CD
ave
rag
e
Sw
ede
n
Austr
alia
Ch
ile
Neth
erla
nds
Port
ug
al
Germ
any
Isra
el
Gre
ece
New
Ze
ala
nd
Sw
itze
rla
nd
Austr
ia
Belg
ium
Slo
vak R
epu
blic
Cze
ch R
ep
ub
lic
Hung
ary
Fra
nce
Luxe
mb
ou
rg
Reading, 2015 - Gap between high and low SES students
U.S.A. OECDG
ap
in A
ve
rage
Sca
le S
co
re
Note: High SES students are those in the top quartile on the ESCS. Low SES students are those in the bottom quartile. The ESCS (Index
of Economic, Social, and Cultural Status) is comprised of information related to parents’ occupational status, parents’ educational
attainment, family wealth, home educational resources, and possessions related to “classical” culture in the home.

© 2017 THE EDUCATION TRUST
Source:
The U.S. Gap Between High-SES and Low-SES
Students is Equivalent to Over Two Years of
Schooling
National Center for Education Statistics, 2016 https://nces.ed.gov/surveys/pisa/pisa2015/pisa2015highlights_5.asp
U.S.A.OECD
350
400
450
500
550
600
Gap in A
vera
ge S
cale
Score
Math, 2015 – Gaps in low- and high- SES performance
Note: High SES students are those in the top quartile on the ESCS. Low SES students are those in the bottom quartile. The ESCS (Index of Economic, Social, and
Cultural Status) is comprised of information related to parents’ occupational status, parents’ educational attainment, family wealth, home educational resources, and
possessions related to “classical” culture in the home.

© 2017 THE EDUCATION TRUST© 2017 THE EDUCATION TRUST
The U.S. Gap Between High-SES and Low-SES
Students is Equivalent to Over Two Years of
Schooling
350
400
450
500
550
600
Gap
in A
vera
ge S
cale
Sco
re
Science, 2015 – Gaps between low- and high- SES performance
• National Center for Education Statistics, 2016 https://nces.ed.gov/surveys/pisa/pisa2015/pisa2015highlights_3.asp
U.S.A.OECD
Note: High SES students are those in the top quartile on the ESCS. Low SES students are those in the bottom quartile. The ESCS (Index of
Economic, Social, and Cultural Status) is comprised of information related to parents’ occupational status, parents’ educational attainment,
family wealth, home educational resources, and possessions related to “classical” culture in the home.

© 2017 THE EDUCATION TRUST
Source:
PISA results indicate that U.S. schools are equipping white
and Asian students with higher levels of preparation in
reading.
National Center for Education Statistics, 2016 https://nces.ed.gov/surveys/pisa/pisa2015/pisa2015highlights_4.asp
526
443
478
527
493
350
400
450
500
550
600
White Black Hispanic Asian OECD average
Reading, 2015 – Performance by race/ ethnic group
Ave
rag
e s
ca
le s
co
re

© 2017 THE EDUCATION TRUST
Source:
PISA results indicate that U.S. schools are
equipping white and Asian students with higher
levels of preparation in Math.
499
419
446
498490
350
400
450
500
550
600
White African American Latino Asian OECD Average
Ave
rage
sca
le s
core
Math, 2015 – U.S. results by race/ ethnicity
National Center for Education Statistics, 2016 https://nces.ed.gov/surveys/pisa/pisa2015/pisa2015highlights_5.asp

© 2017 THE EDUCATION TRUST© 2017 THE EDUCATION TRUST
PISA results indicate that U.S. schools are
equipping white and Asian students with higher
levels of preparation in science.
531
433
470
525
493
350
400
450
500
550
600
White African American Latino Asian OECD Average
Ave
rage
sca
le s
core
Science, 2015 – Performance by race/ ethnic group
• National Center for Education Statistics, 2016 https://nces.ed.gov/surveys/pisa/pisa2015/pisa2015highlights_3.asp
© 2017 THE EDUCATION TRUST
So let’s talk about those gaps.

© 2017 THE EDUCATION TRUST
Gaps in achievement begin before children arrive
at the schoolhouse door.
But, rather than organizing our educational system to ameliorate this problem, we organize
it to exacerbate the problem.

© 2017 THE EDUCATION TRUST
How?
By giving students who arrive with less, less in school,
too.
© 2017 THE EDUCATION TRUST© 2017 THE EDUCATION TRUST
Some of these “lesses” are a result of
choices that policymakers make.

© 2017 THE EDUCATION TRUST
Source:
National Inequities in State and Local Revenue Per Student
Gap
High Poverty vs. Low Poverty Districts
–$1200
per student
High Minority vs. Low Minority Districts
–$2,000
per student
Education Trust analyses based on U.S. Dept of Education and U.S. Census Bureau data for 2010-12
© 2017 THE EDUCATION TRUST© 2017 THE EDUCATION TRUST
In truth, though, some of the most
devastating “lesses” are a function of choices
that we educators (and school board
members) make.

© 2017 THE EDUCATION TRUST© 2017 THE EDUCATION TRUST
Choices we make about what to expect of
whom.....

© 2017 THE EDUCATION TRUST
Source: Prospects (ABT Associates, 1993), in “Prospects: Final Report on Student Outcomes”, PES, DOE, 1997.
Students in poor schools receive As for work that would earn
Cs in affluent schools.
87
35
56
3441
22 21
11
0
100
Perc
entile
- C
TB
S4
A B C DGrades
Seventh-Grade Math
Low-poverty schools High-poverty schools

© 2017 THE EDUCATION TRUST© 2017 THE EDUCATION TRUST
Choices we make about what to teach
whom…

© 2017 THE EDUCATION TRUST© 2017 THE EDUCATION TRUST
35%
68%63%
94%
0%
20%
40%
60%
80%
100%
African American Latino White Asian
Perc
enta
ge o
f st
ud
ents
wh
o w
ere
in t
he
top
tw
o
qu
inti
les
of
mat
h p
erfo
rman
ce in
fif
th g
rad
e an
d in
al
geb
ra in
eig
hth
gra
de
Source: NCES, “Eighth-Grade Algebra: Findings from the Eighth-Grade Round of the Early Childhood Longitudinal Study, Kindergarten
Class of 1998-99 (ECLS-K)” (2010).
Even African-American students with high math
performance in fifth grade are unlikely to be placed in
algebra in eighth grade

© 2017 THE EDUCATION TRUST© 2017 THE EDUCATION TRUST
And choices we make about
who teaches whom…
© 2017 THE EDUCATION TRUST
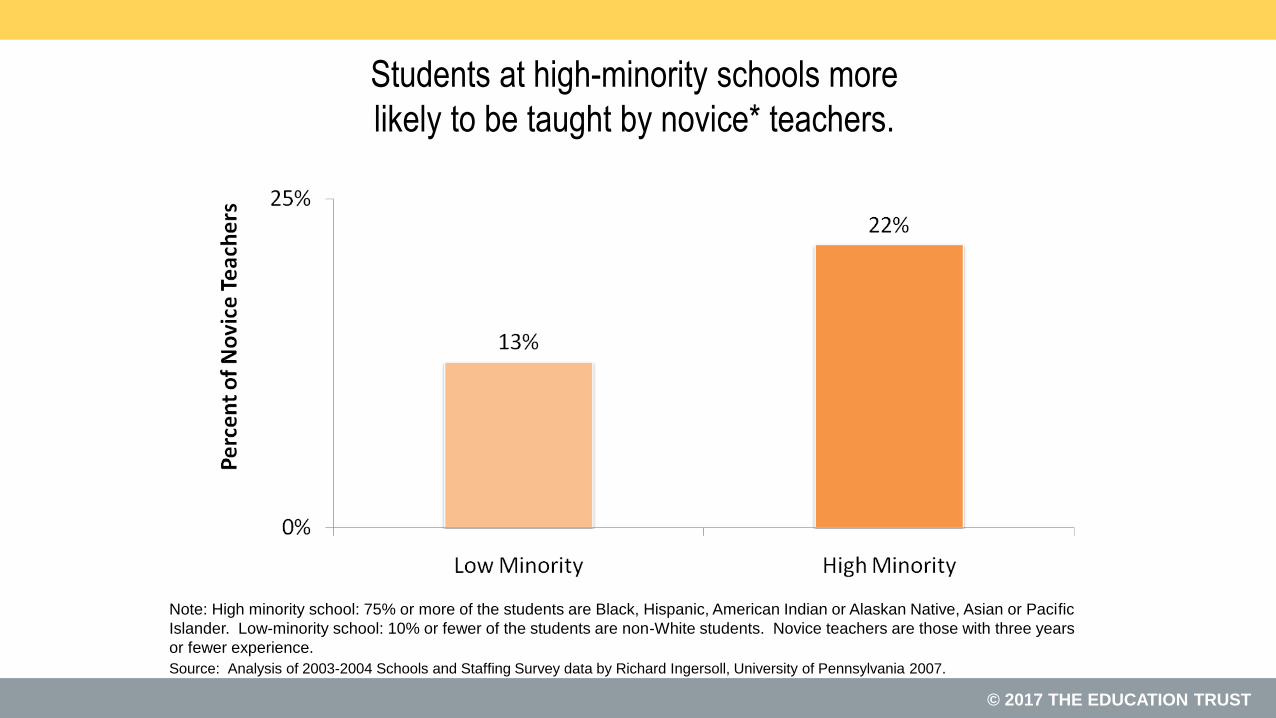
Students at high-minority schools more
likely to be taught by novice* teachers.
Source: Analysis of 2003-2004 Schools and Staffing Survey data by Richard Ingersoll, University of Pennsylvania 2007.
Note: High minority school: 75% or more of the students are Black, Hispanic, American Indian or Alaskan Native, Asian or Pacific
Islander. Low-minority school: 10% or fewer of the students are non-White students. Novice teachers are those with three years
or fewer experience.

© 2017 THE EDUCATION TRUST
Math classes at high-poverty, high-minority secondary schools are more likely to be
taught by
out-of-field* teachers.
25%
22%
11%13%
0%
30%
Poverty Minority
Pe
rce
nt
of
Cla
ss T
augh
t b
y Te
ach
ers
W
ith
Ne
ith
er
Ce
rtif
icat
ion
no
r M
ajo
rHigh
Low
Note: High-poverty school: 55 percent or more of the students are eligible for free/reduced-price lunch. Low-poverty school :15 percent or
fewer of the students are eligible for free/reduced-price lunch. High-minority school: 78 percent or more of the students are black, Hispanic,
American Indian or Alaskan Native, Asian or Pacific Islander. Low-minority school : 12 percent or fewer of the students are non-white
students. *Teachers with neither certification nor major. Data for secondary-level core academic classes (math, science, social studies, English) across
the U.S.
Source: Education Trust Analysis of 2007-08 Schools and Staffing Survey data.

© 2017 THE EDUCATION TRUST
Los Angeles: Black, Latino students have fewer
highly effective teachers, more weak ones.
Latino and
black
students
are:
3X as
likely to get
low-
effectiveness
teachers
½ as
likely to get
highly
effective
teachers
READING/LANGUAGE ARTS
Source: Education Trust—West, Learning Denied, 2012.

© 2017 THE EDUCATION TRUST
The results are devastating.
Kids who come in a little behind, leave a lot behind.

© 2017 THE EDUCATION TRUST© 2017 THE EDUCATION TRUST
And these are the students who remain in
school through 12th grade.

© 2017 THE EDUCATION TRUST© 2017 THE EDUCATION TRUST
71%75%
87% 89%
70%
0%
20%
40%
60%
80%
100%
African American Latino White Asian Native American
Ave
rage
d F
resh
man
Gra
du
atio
n R
ate
Class of 2013
Source: National Center for Education Statistics, “Public School Graduates and Dropouts from the Common Core of Data: School Year 2008-
09” (2011).
Students of color are less likely to graduate from
high school on time.

© 2017 THE EDUCATION TRUST© 2017 THE EDUCATION TRUST
Add those numbers up and throw in college
entry and graduation, and different groups of
young Americans obtain degrees and very
different rates…

© 2017 THE EDUCATION TRUST
Whites attain bachelor’s degrees at nearly twice the rate of blacks and
almost three times the rate of Hispanics
Source: U.S. Census Bureau, Educational Attainment in the United States: 2014
41%
22%
15%
White African American Latino
Bachelor’s Degree Attainment of Young Adults (25-29-year-olds), 2014

© 2017 THE EDUCATION TRUST
Young adults from high-income families are more
than three times as likely as those from low-
income families to earn bachelor’s degrees by age
24
54%
17%
0%
20%
40%
60%
80%
100%
Highest income quartile Lowest income quartile
Pe
rce
nt
wit
h B
ach
elo
r’s
De
gre
e b
y A
ge 2
4
3x
http://www.brookings.edu/research/papers/2015/03/12-chalkboard-income-education-attainment-
chingos

© 2017 THE EDUCATION TRUST
These numbers are not good news for our country—or
for the lives of the young people in question.

© 2017 THE EDUCATION TRUST
What Can We Do?
An awful lot of Americans have decided that we can’t do
much.
© 2017 THE EDUCATION TRUST
Source:
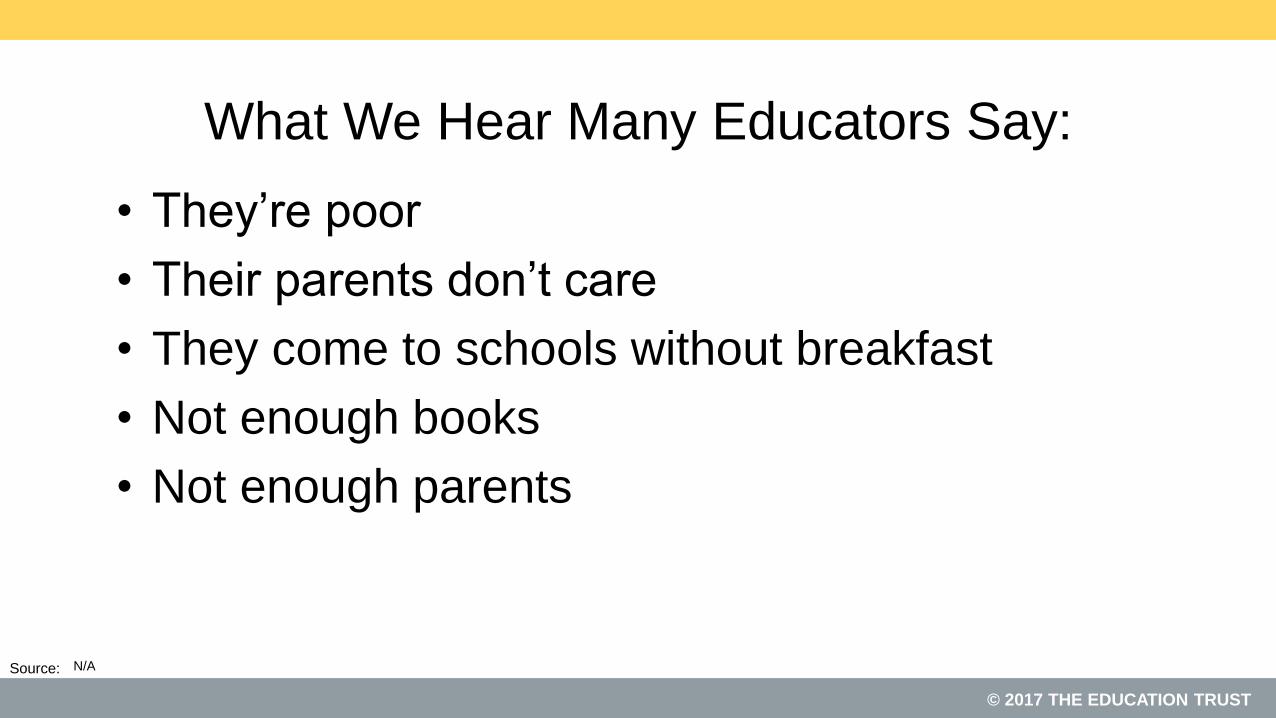
What We Hear Many Educators Say:
• They’re poor
• Their parents don’t care
• They come to schools without breakfast
• Not enough books
• Not enough parents
N/A

© 2017 THE EDUCATION TRUST© 2017 THE EDUCATION TRUST
Let’s be clear, these things do matter.

© 2017 THE EDUCATION TRUST© 2017 THE EDUCATION TRUST
Child Poverty in the US, 2013
White 13.4%
Black 36.9%
Hispanic 30.4%
Asian 9.6%
ALL 19.9%
Source: US Census Bureau
© 2017 THE EDUCATION TRUST© 2017 THE EDUCATION TRUST
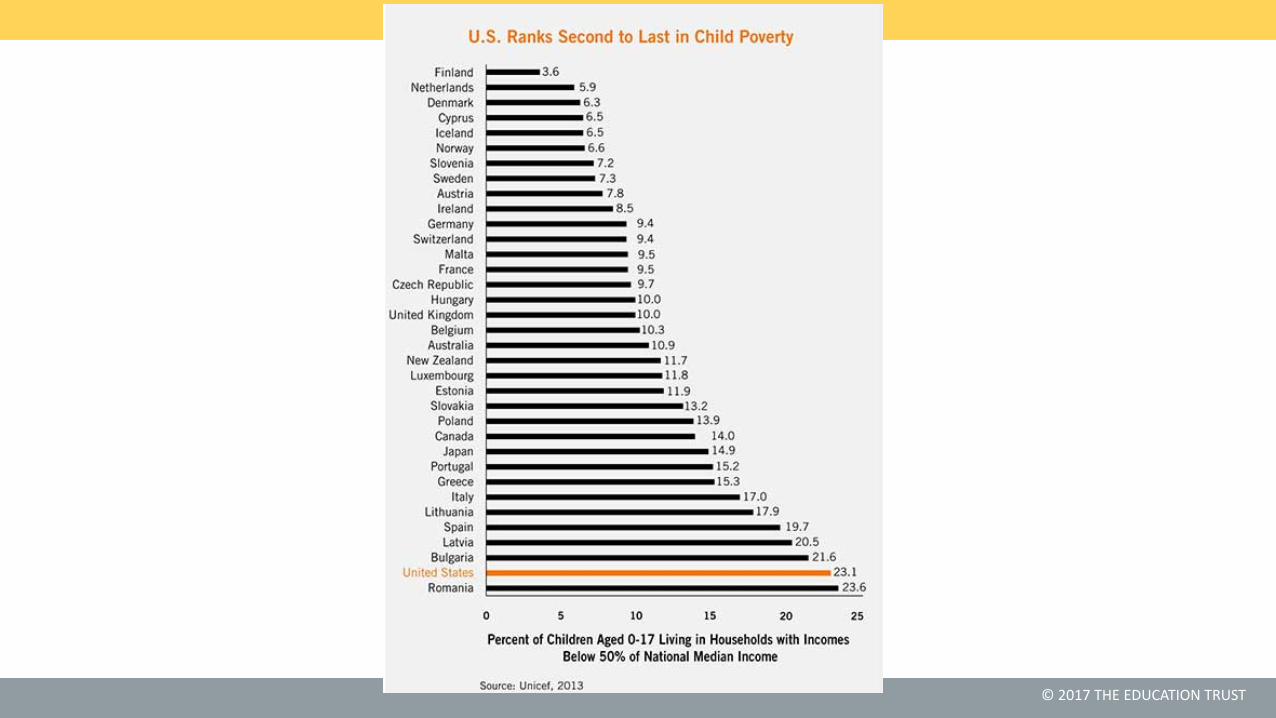
And let’s also be clear: tolerating high child
poverty rates is a policy choice. Though we
remain the richest nation on earth…
© 2017 THE EDUCATION TRUST© 2017 THE EDUCATION TRUST

© 2017 THE EDUCATION TRUST© 2017 THE EDUCATION TRUST
Yet, how we respond to the effects of that
choice is a choice, too.

© 2017 THE EDUCATION TRUST© 2017 THE EDUCATION TRUST
We can choose to go along with what has
become conventional wisdom in our
profession—that, until we fix poverty, there’s
not much we educators can do…

© 2017 THE EDUCATION TRUST
Or we can choose differently.
…joining colleagues in schools all over this country that
serve very poor kids but get very good results.

© 2017 THE EDUCATION TRUST
Mary McLeod Bethune Elementary SchoolNew Orleans, Louisiana
• 505 students in grades PK
– 6
• 99% African American
• 90% Low-Income
Source: Louisiana Department of Education, 2016
.

© 2017 THE EDUCATION TRUST
Bethune Elementary Outperforming the State
073
1928
36
53
35
17
3
0%
Grade 6 ELA Bethune Grade 6 ELA Louisiana
PARCC, 2016
Unsatisfactory Approaching Basic Basic Mastery Advanced
Source: Louisiana Department of Education

© 2017 THE EDUCATION TRUST
Bethune Elementary Outperforming the State
211
16
22
41
30
3331
8 6
0%
Grade 3 Math Bethune Grade 3 Math Louisiana
PARCC, 2016
Unsatisfactory Approaching Basic Basic Mastery Advanced
Source: Louisiana Department of Education

© 2017 THE EDUCATION TRUST
Dr. Carlos J. Finlay Elementary SchoolMiami-Dade, Florida
• 511 students in grades PK – 5
• 98% Latino
• 86% Low Income
• 57% English Language
Learners
Source: Florida Department of Education
Note: Data are for 2012-2013 school year.

© 2017 THE EDUCATION TRUST
Finlay Elementary Outperforming the State
0
20
40
60
80
100
English Math
2016
Finlay Florida Florida, Hispanic studentsSource: Florida Department of Education

© 2017 THE EDUCATION TRUST
Source:
Elmont Memorial High SchoolElmont, New York
1,739 students in grades 7-12
76% African American14% Latino9% Asian1% White
New York State Department of Education,2016

© 2017 THE EDUCATION TRUST
Source:
High Performance by ALL Students at Elmont
Memorial High School
New York Department of Education https://reportcards.nysed.gov/schools.php?district=800000049235&year=2012
94% 94% 97% 96%
82%
71% 72% 76%
0%
20%
40%
60%
80%
100%
Overall AfricanAmerican
Hispanic Low Income
Pe
rce
nta
ge P
rofi
cie
nt
and
Ab
ove
Secondary Level Math (2012)
EMHS
New York

© 2017 THE EDUCATION TRUST
Source:
High Performance by ALL Students at Elmont
Memorial High School
New York Department of Education https://reportcards.nysed.gov/schools.php?district=800000049235&year=2012
96% 96%93%
98%
82%72% 71% 75%
0%
20%
40%
60%
80%
100%
Overall AfricanAmerican
Hispanic Low Income
Pe
rce
nta
ge P
rofi
cie
nt
and
Ab
ove
Secondary Level English (2012)
EMHS
New York
© 2017 THE EDUCATION TRUST
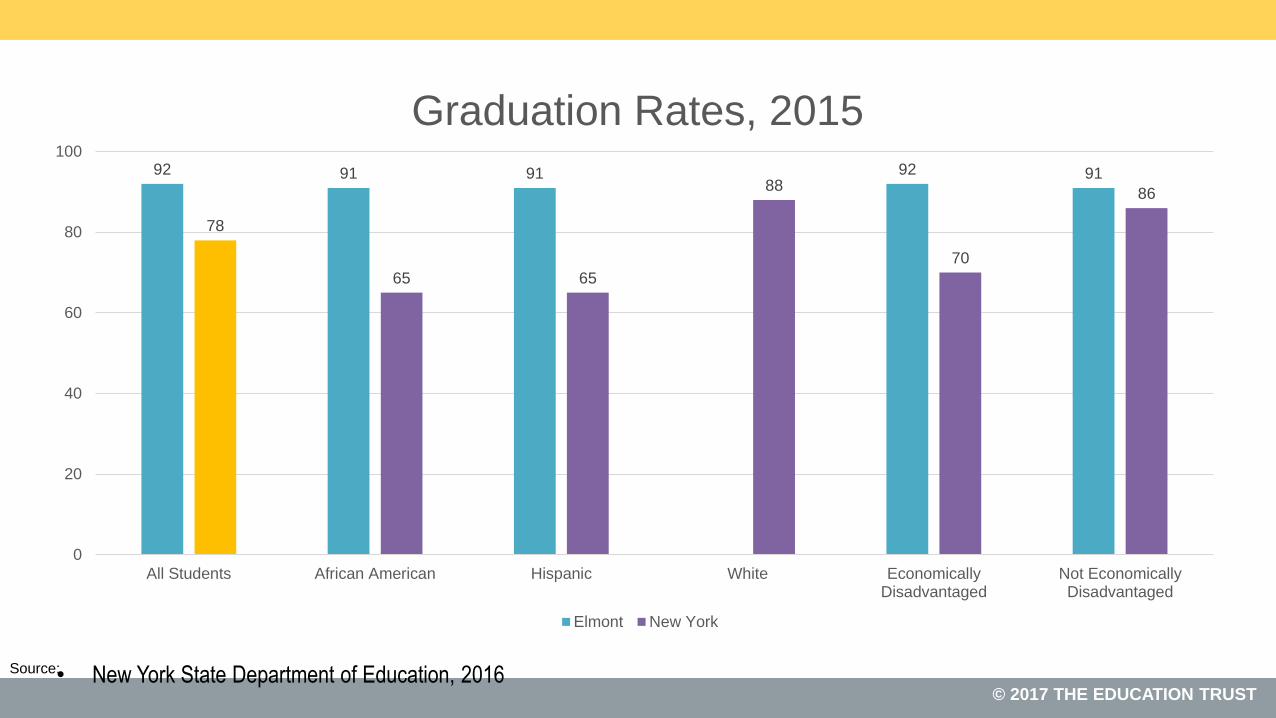
Source:
© 2017 THE EDUCATION TRUST• New York State Department of Education, 2016
92 91 91 92 91
78
65 65
88
70
86
0
20
40
60
80
100
All Students African American Hispanic White EconomicallyDisadvantaged
Not EconomicallyDisadvantaged
Graduation Rates, 2015
Elmont New York

© 2017 THE EDUCATION TRUST
Source:
© 2017 THE EDUCATION TRUST• New York State Department of Education, 2016
43
46
39
46
32
10
44
17
44
0
5
10
15
20
25
30
35
40
45
50
All Students African American White Economically Disadvantaged Not EconomicallyDisadvantaged
Graduating with an Advanced Designation, 2015
Elmont New York

© 2017 THE EDUCATION TRUST
Source:
High Graduation Rates at Elmont Memorial High School
94% 95%89%
97%93%
74%
58% 58%
64%
81%
0%
10%
20%
30%
40%
50%
60%
70%
80%
90%
100%
Overall AfricanAmerican
Latino EconomicallyDisadvantaged
NotEconomically
Disadvantaged
Perc
enta
ge o
f 2
00
7 F
resh
men
Gra
du
atin
g in
Fo
ur
Yea
rs
Class of 2011
Elmont
New York
New York State Department of EducationNote: Includes students graduating by June 2011.

© 2017 THE EDUCATION TRUST© 2017 THE EDUCATION TRUST
This is what happens when teams of
educators choose differently.

© 2017 THE EDUCATION TRUST
Available from
Harvard Education
Press and amazon.com

© 2017 THE EDUCATION TRUST
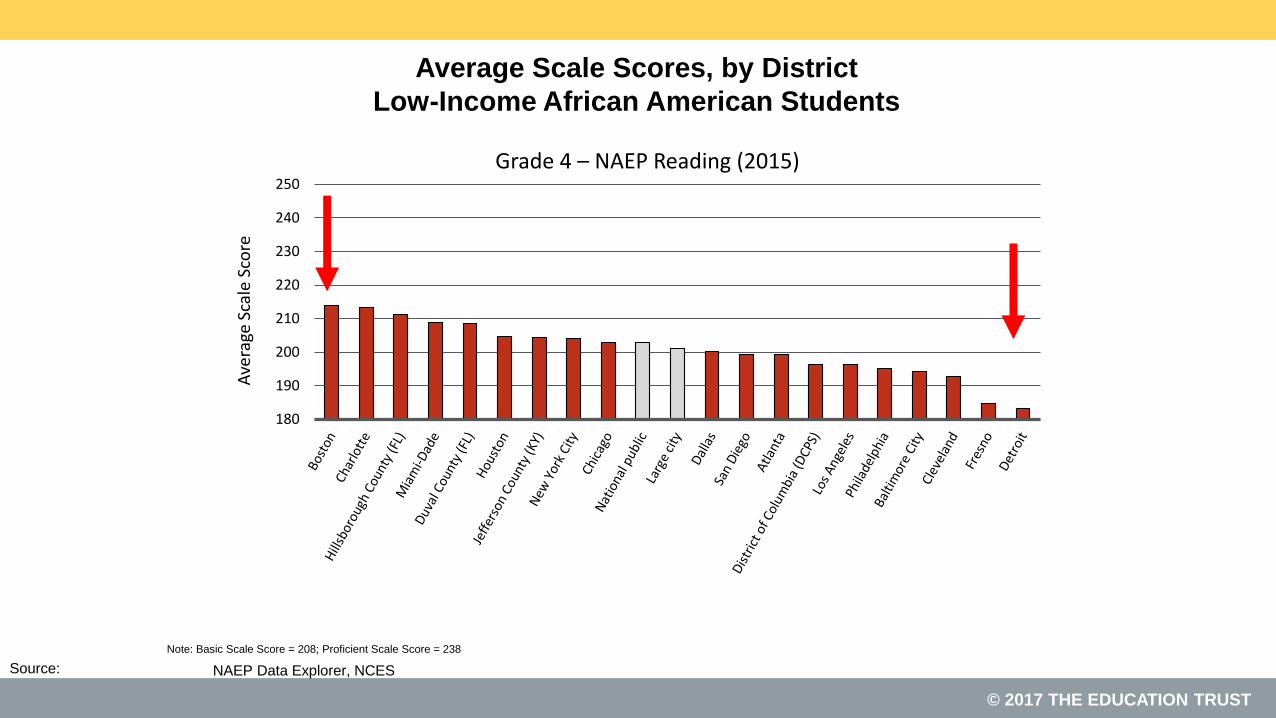
Just flukes, outliers?
No. Very big differences at district level, too—even in
the progress and performance of the “same” group of
students.
© 2017 THE EDUCATION TRUST
Source:
Average Scale Scores, by District
Low-Income African American Students
180
190
200
210
220
230
240
250
Ave
rage
Sca
le S
core
Grade 4 – NAEP Reading (2015)
NAEP Data Explorer, NCES
Note: Basic Scale Score = 208; Proficient Scale Score = 238

© 2017 THE EDUCATION TRUST
Source:
Average Scale Scores, by District
Low-Income Latino Students
180
190
200
210
220
230
240
250
260
270
280
Ave
rage
Sca
le S
core
Grade 4 – NAEP Math (2015)
NAEP Data Explorer, NCES
Note: Basic Scale Score = 214; Proficient Scale Score = 249

© 2017 THE EDUCATION TRUST© 2017 THE EDUCATION TRUST
1
4
6
6
10
10
11
12
13
14
15
15
0 5 10 15 20
Cleveland
New York City
San Diego
Houston
National public
Atlanta
Large city
Chicago
Boston
Los Angeles
District of Columbia (DCPS)
Charlotte
Change in Mean Scale Score, 2003-2015
Grade 4 – NAEP Reading (2003-2015)
Source: NCES, NAEP Data Explorer
Note: Chart includes only districts that participated, and had members of this specific subgroup, in both the 2003 and 2015 NAEP TUDA
administrations .
Change in Average Scale Scores, by District
Low-Income African American Students

© 2017 THE EDUCATION TRUST© 2017 THE EDUCATION TRUST
Source: NCES, NAEP Data Explorer
Note: Chart includes only districts that participated, and had members of this specific subgroup, in both the 2003 and 2015 NAEP TUDA
administrations .
Change in Average Scale Scores, by District
Low-Income Latino Students
-1
-1
1
7
7
8
8
8
11
13
14
-5 0 5 10 15
Cleveland
New York City
Houston
Large city
Los Angeles
National public
Chicago
San Diego
Charlotte
District of Columbia (DCPS)
Boston
Change in Mean Scale Score, 2003-2015
Grade 4 – NAEP Reading (2003-2015)

© 2017 THE EDUCATION TRUST© 2017 THE EDUCATION TRUST
0
6
9
9
11
12
12
17
17
19
22
-1 4 9 14 19 24
Cleveland
Houston
New York City
National public
District of Columbia (DCPS)
Charlotte
Large city
Atlanta
Chicago
Boston
Los Angeles
Change in Mean Scale Score, 2003-2015
Grade 8 – NAEP Math (2003-2015)
Source: NCES, NAEP Data Explorer
Note: Chart includes only districts that participated, and had members of this specific subgroup, in both the 2003 and 2015 NAEP TUDA
administrations .
Change in Average Scale Scores, by District
Low-Income African American Students

© 2017 THE EDUCATION TRUST© 2017 THE EDUCATION TRUST
Source: NCES, NAEP Data Explorer
Note: Chart includes only districts that participated, and had members of this specific subgroup, in both the 2003 and 2015 NAEP TUDA
administrations .
Change in Average Scale Scores, by District
Low-Income Latino Students
8
9
10
12
13
13
14
18
19
19
0 5 10 15 20
Cleveland
New York City
District of Columbia (DCPS)
National public
Houston
Large city
Chicago
Los Angeles
Boston
San Diego
Change in Mean Scale Score, 2003-2015
Grade 8 – NAEP Math (2003-2015)

© 2017 THE EDUCATION TRUST
Bottom Line:
What We Do Matters!

© 2017 THE EDUCATION TRUST
What Can School Board Members Do?

© 2017 THE EDUCATION TRUST
1. Like good teachers, good schools and districts
don’t ignore what is going on beyond their walls.
Instead, they seek and use teachable moments—and
they work hard at creating a real sense of community,
where kids and parents of all sorts feel safe and valued.

© 2017 THE EDUCATION TRUST
Right now might be an important moment for Board
members to ask where your schools stack up on that
measure.
Whether you agree with their reasons or not, kids and
parents are scared and need some reassurance that they
are valued. (And your staff may need some training here.)

© 2017 THE EDUCATION TRUST
Source:
An Example: Superintendent Eric Witherspoon,
Evanston Township, ILGood morning, E-Town –
This is Dr. Witherspoon.
Once in a while it’s important that we pause and reflect on who we are and reaffirm
our appreciation for one another.
This morning I want to remind all of you that ETHS is a safe and welcoming place
for you. You attend a school where we not only respect differences, we embrace
our diversity.
We embrace one another’s race and ethnicity. We embrace one another’s family
background, heritage, language and culture.

© 2017 THE EDUCATION TRUST
We embrace one another’s religion and your right to your own personal customs and beliefs.
We embrace your sexual orientation and your gender identity.
We embrace your special needs.
We embrace you and value you as individual human beings.
Never forget: you belong here at ETHS—each and every one of you.
Today, I urge you to be kind and caring to one another. Redouble your support for one another.
And even though we cannot always control what is going on in the larger world around us, we
can define our own school, our own community.

© 2017 THE EDUCATION TRUST
Let’s make this school year a year of strengthening our sense of community here at ETHS,
and let’s reaffirm a community legacy for all the students today and for those who will follow
you at ETHS.
The sun is shining today. Your school is a nurturing place for you to learn and grow. Your
futures are bright.
Let’s protect and take care of each other. Everything is going to be okay.
I love all of you. Fill your hearts with love for each other. And no matter what, remember,
even today, that it is a great day to be a Wildkit.

© 2017 THE EDUCATION TRUST
#2. Good schools, districts don’t leave anything about
teaching and learning to chance.

© 2017 THE EDUCATION TRUST
An awful lot of our teachers—even brand new ones—are left to figure out on
their own what to teach and what constitutes “good enough” work.
© 2017 THE EDUCATION TRUST
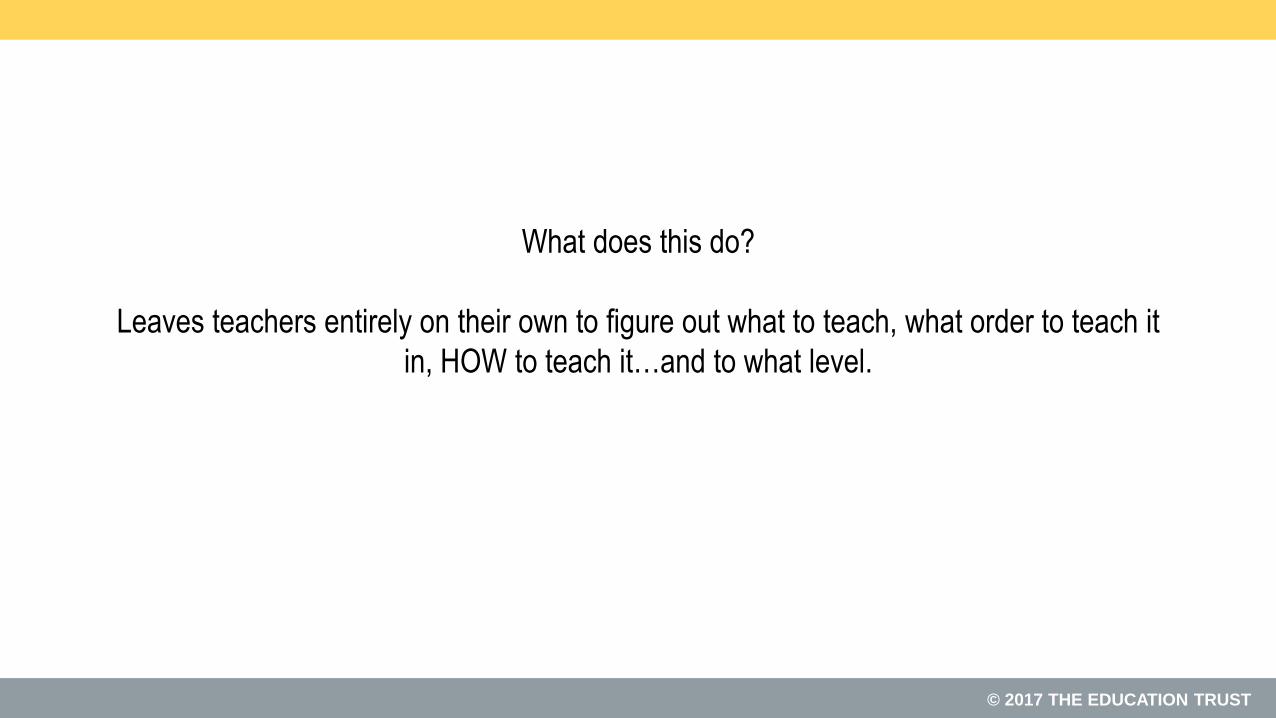
What does this do?
Leaves teachers entirely on their own to figure out what to teach, what order to teach it
in, HOW to teach it…and to what level.
© 2017 THE EDUCATION TRUST
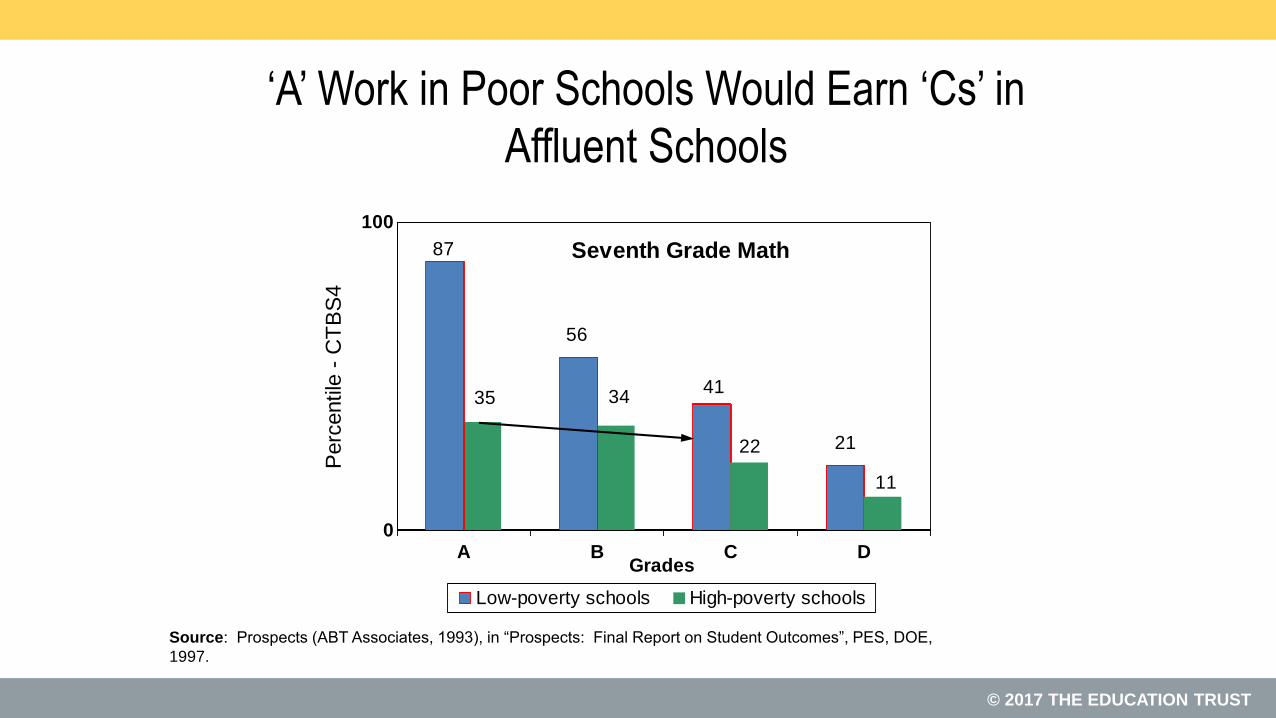
Source: Prospects (ABT Associates, 1993), in “Prospects: Final Report on Student Outcomes”, PES, DOE,
1997.
‘A’ Work in Poor Schools Would Earn ‘Cs’ in
Affluent Schools
87
35
56
3441
22 21
11
0
100
Perc
entile
- C
TB
S4
A B C DGrades
Seventh Grade Math
Low-poverty schools High-poverty schools

© 2017 THE EDUCATION TRUST
Students can do no better than
the assignments they are given...

© 2017 THE EDUCATION TRUST
Grade 10 Writing Assignment
A frequent theme in literature is the conflict between the individual and society. From literature you have read, select a character who struggled with society. In a well-developed essay, identify the character and explain why this character’s conflict with society is important.

© 2017 THE EDUCATION TRUST
Grade 10 Writing Assignment
Write a composition of at least 4 paragraphs on Martin Luther King’s most important contribution to this society. Illustrate your work with a neat
cover page. Neatness counts.
© 2017 THE EDUCATION TRUSTSource: Unnamed school district in California, 2002-03 school
year.
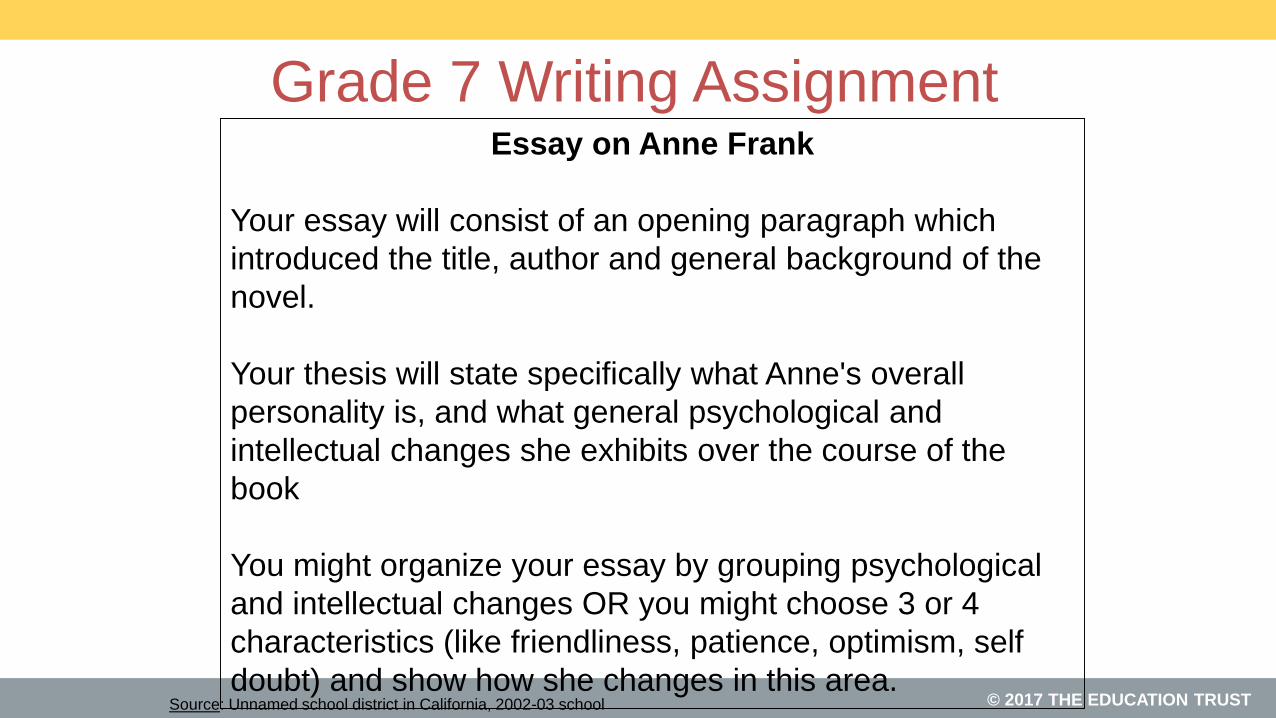
Essay on Anne Frank
Your essay will consist of an opening paragraph which
introduced the title, author and general background of the
novel.
Your thesis will state specifically what Anne's overall
personality is, and what general psychological and
intellectual changes she exhibits over the course of the
book
You might organize your essay by grouping psychological
and intellectual changes OR you might choose 3 or 4
characteristics (like friendliness, patience, optimism, self
doubt) and show how she changes in this area.
Grade 7 Writing Assignment

© 2017 THE EDUCATION TRUST
•My Best Friend:
•A chore I hate:
•A car I want:
•My heartthrob:Source: Unnamed school district in California, 2002-03 school
year.
Grade 7 Writing Assignment

© 2017 THE EDUCATION TRUST
That was pre-Common Core.
Do common standards change that?
A brand new EdTrust study

© 2017 THE EDUCATION TRUST
A Deeper Look at What We Did
Analyzed and scored close to 1,600 assignments
using our Literacy Assignment Analysis Framework.
Alignment With the Common
Core
Centrality of Text
Cognitive Challenge
Motivation and Engagement
Domains of
Rigorous
Student
Assignments
Additional Features Analyzed
• Text Type and Length
• Writing Output
• Length of Assignment
• Student Thinking

© 2017 THE EDUCATION TRUST
GRADE 7– English Language Arts
How can we make out voices heard? After
reading I am Malala, write a literary essay in
which you answer this question. Select and
analyze one of the following:
• Any key person from the text
• The setting
• A theme from the text
Support your argument with evidence from the
text. In your piece, be sure to write at least 5
paragraphs and follow the structure of a
literary analysis.
© 2017 THE EDUCATION TRUST
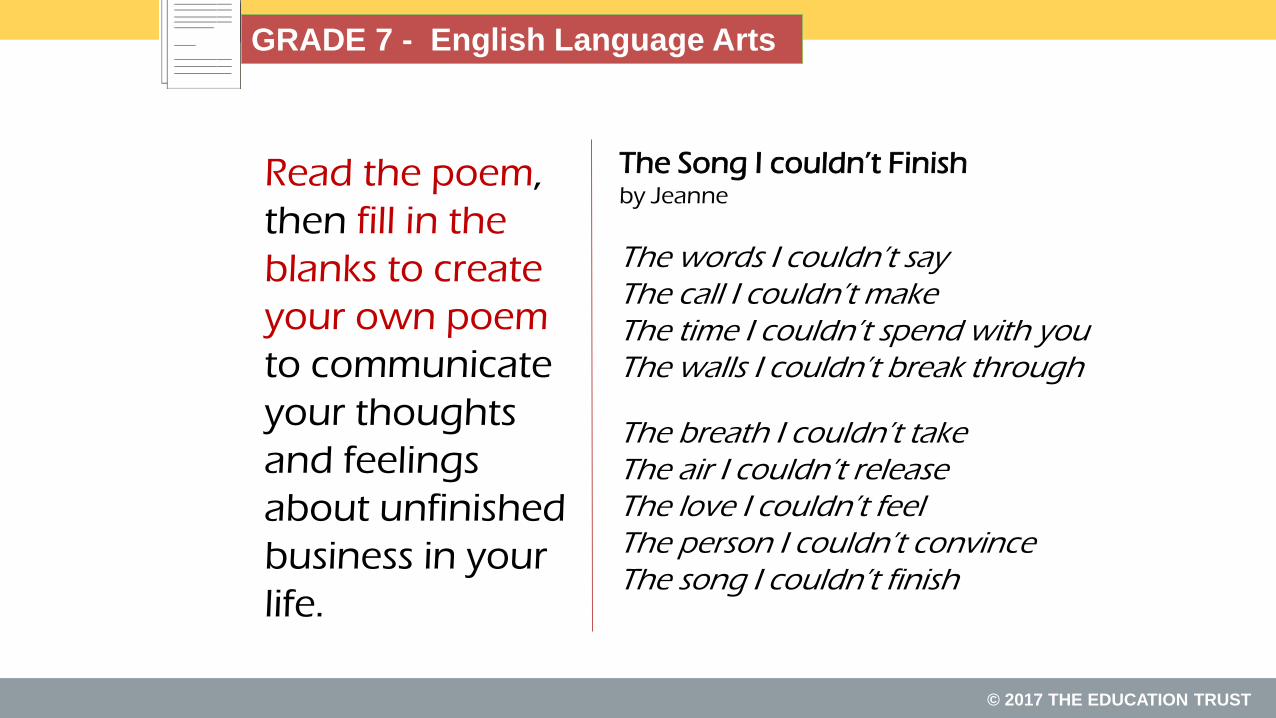
GRADE 7 - English Language Arts
Read the poem,
then fill in the
blanks to create
your own poem
to communicate
your thoughts
and feelings
about unfinished
business in your
life.
The Song I couldn’t Finishby Jeanne
The words I couldn’t sayThe call I couldn’t makeThe time I couldn’t spend with youThe walls I couldn’t break through
The breath I couldn’t takeThe air I couldn’t releaseThe love I couldn’t feelThe person I couldn’t convinceThe song I couldn’t finish
© 2017 THE EDUCATION TRUST
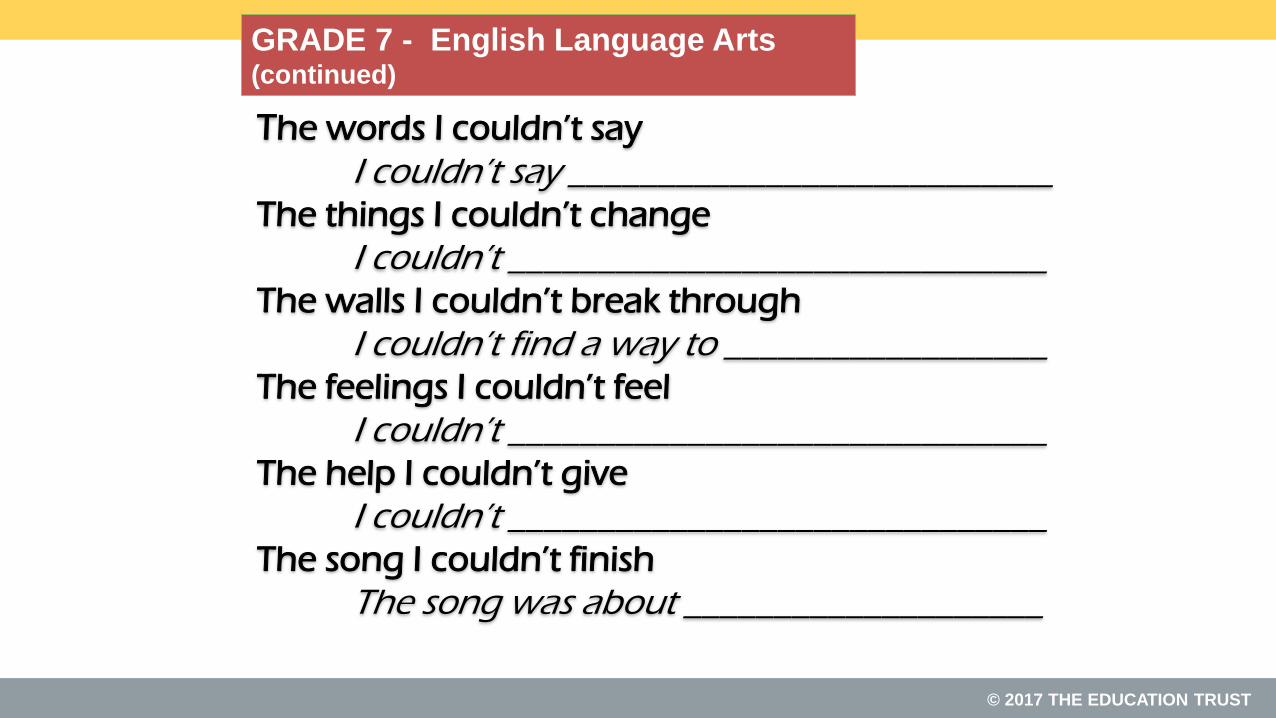
The words I couldn’t say
I couldn’t say ___________________________The things I couldn’t change
I couldn’t ______________________________The walls I couldn’t break through
I couldn’t find a way to __________________The feelings I couldn’t feel
I couldn’t ______________________________The help I couldn’t give
I couldn’t ______________________________The song I couldn’t finish
The song was about ____________________
GRADE 7 - English Language Arts (continued)

© 2017 THE EDUCATION TRUST
In isolation, the low assignments can
reflect targeted skill building and student
practice…not necessarily harmful in
moderation

© 2017 THE EDUCATION TRUST
However when compounded over multiple class
periods, in multiple subjects, over multiple years, the
effect is detrimental.

© 2017 THE EDUCATION TRUST
Ed Trust Assignment Study:
What We Found• Fewer than 4 in 10 middle grades assignments are targeted at a
grade-appropriate standard;
• In high poverty schools the proportion drops to only about one third,
compared to nearly half of assignments in low poverty schools;
• That said, only about 5% of assignments in both kinds of schools
tapped into the higher-level cognitive demands of the CCSS;
• Most efforts at engagement and relevance were superficial, and
often condescending.

© 2017 THE EDUCATION TRUST
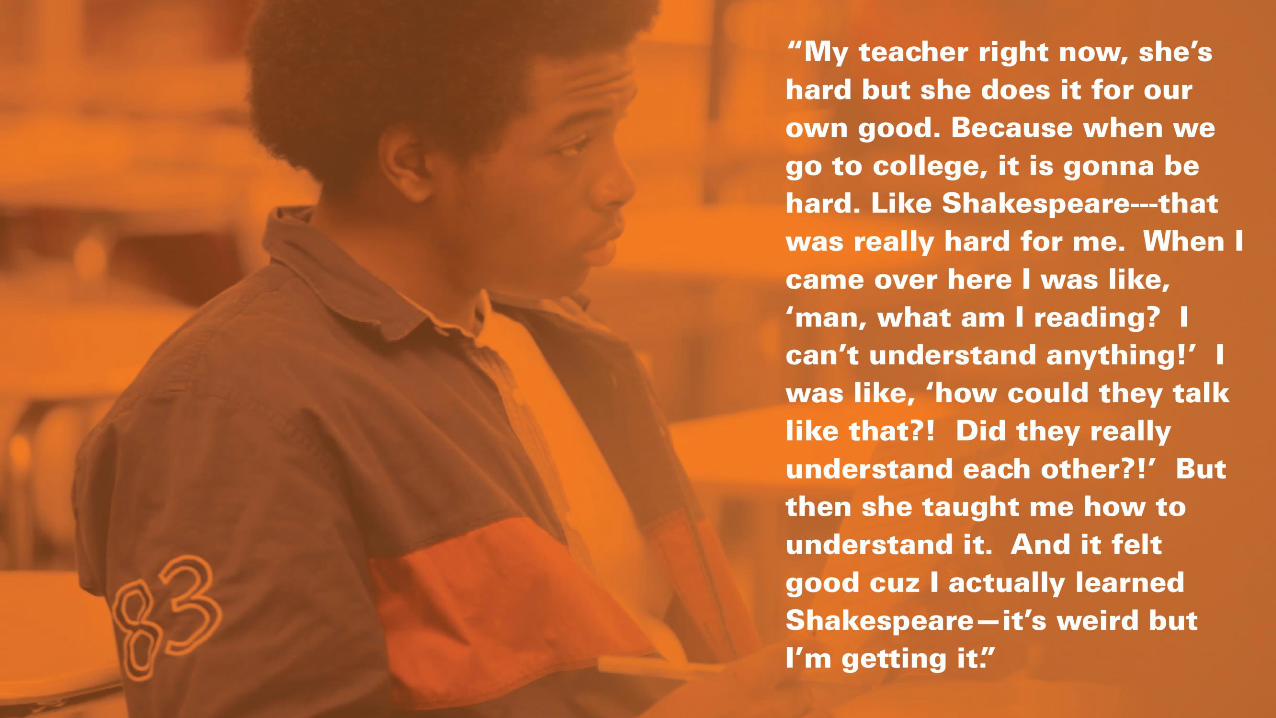
And don’t think that your students don’t know the
difference….

© 2017 THE EDUCATION TRUST
© 2017 THE EDUCATION TRUST

© 2017 THE EDUCATION TRUST© 2017 THE EDUCATION TRUST
Source:
Critical questions for board members:
• Who—district office versus schools—is
responsible for what in the standards
implementation effort? Who, in particular, is
translating standards into curriculum?
• Are we getting regular reports from district
staff on the status of implementation efforts?
• What other kind of evidence—surveys of
teachers or students, or periodic audits of
classroom assignments, for example—should
we be collecting to understand where things
are going well…and where not?

© 2017 THE EDUCATION TRUST
#3. Good schools, districts know how much teachers matter, and they act
on that knowledge.
Not leaving anything to chance means not leaving who
teaches whom to chance, either.

© 2017 THE EDUCATION TRUST
15 years of research makes it very clear: there are big
differences among our teachers in their effectiveness
in growing student learning.

© 2017 THE EDUCATION TRUST
Students in Dallas Gain More in Math with
Effective Teachers: One Year Growth From 3rd-
4th Grade
Source: Heather Jordan, Robert Mendro, and Dash Weerasinghe, The Effects of Teachers on Longitudinal Student
Achievement, 1997.

© 2017 THE EDUCATION TRUST
DIFFERENCES IN TEACHER EFFECTIVENESS
ACCOUNT FOR LARGE DIFFERENCES IN
STUDENT LEARNING
The distribution of value-added
scores for ELA teachers in LAUSD
© 2017 THE EDUCATION TRUST
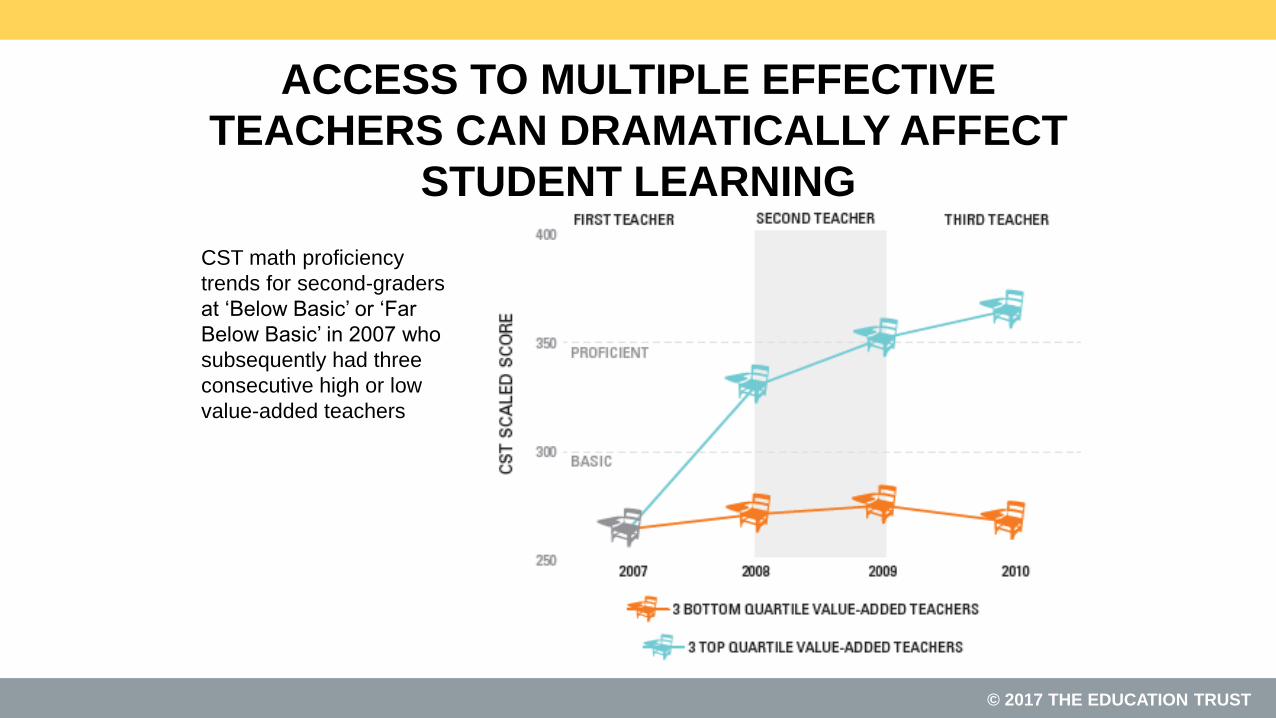
ACCESS TO MULTIPLE EFFECTIVE
TEACHERS CAN DRAMATICALLY AFFECT
STUDENT LEARNING
CST math proficiency
trends for second-graders
at ‘Below Basic’ or ‘Far
Below Basic’ in 2007 who
subsequently had three
consecutive high or low
value-added teachers
© 2017 THE EDUCATION TRUST
And, no matter how you measure, some kids
aren’t getting their fair share.

© 2017 THE EDUCATION TRUST
Students at High-Minority Schools More Likely to Be
Taught By Novice* Teachers
*Novice teachers are those with three years or fewer experience.
Source: Analysis of 2003-2004 Schools and Staffing Survey data by Richard Ingersoll, University of Pennsylvania 2007.
Note: High minority school-75% or more of the students are Black, Hispanic, American Indian or Alaskan Native, Asian or Pacific
Islander. Low-minority school -10% or fewer of the students are non-White students.
© 2017 THE EDUCATION TRUST
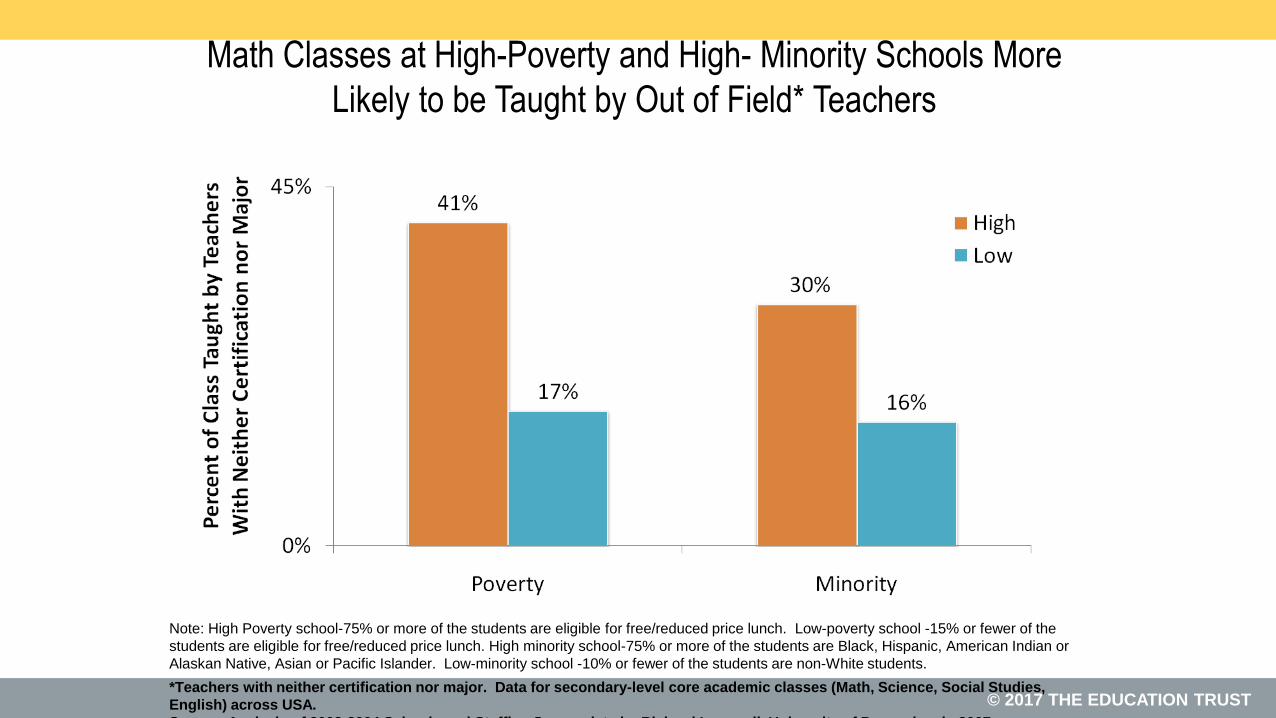
Math Classes at High-Poverty and High- Minority Schools More
Likely to be Taught by Out of Field* Teachers
Note: High Poverty school-75% or more of the students are eligible for free/reduced price lunch. Low-poverty school -15% or fewer of the
students are eligible for free/reduced price lunch. High minority school-75% or more of the students are Black, Hispanic, American Indian or
Alaskan Native, Asian or Pacific Islander. Low-minority school -10% or fewer of the students are non-White students.
*Teachers with neither certification nor major. Data for secondary-level core academic classes (Math, Science, Social Studies,
English) across USA.
Source: Analysis of 2003-2004 Schools and Staffing Survey data by Richard Ingersoll, University of Pennsylvania 2007.

© 2017 THE EDUCATION TRUST
Tennessee: High poverty/high minority schools have fewer of the
“most effective” teachers and more “least effective” teachers
Source: Tennessee Department of Education 2007. “Tennessee’s Most Effective Teachers: Are they assigned to the schools that
need them most?” http://tennessee.gov/education/nclb/doc/TeacherEffectiveness2007_03.pdf
Note: High Poverty/High minority means at least 75% qualify for FRPL and at least 75% are minority.
© 2017 THE EDUCATION TRUST
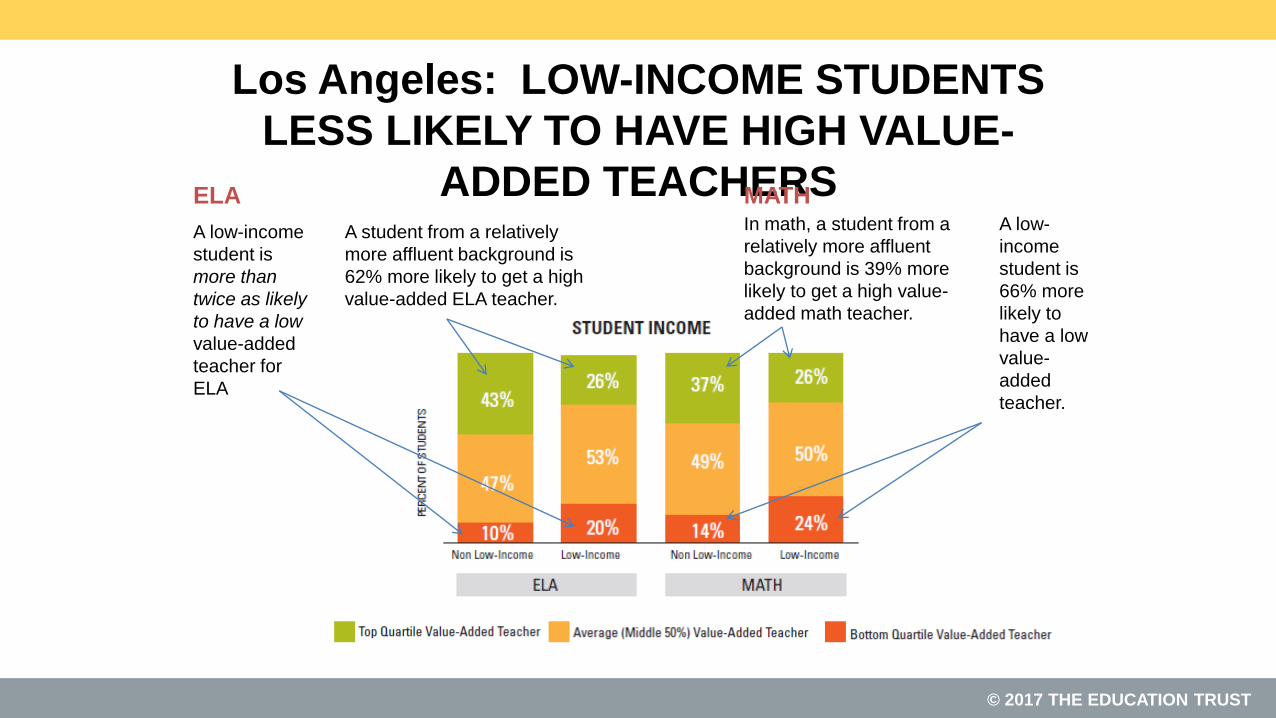
A low-
income
student is
66% more
likely to
have a low
value-
added
teacher.
Los Angeles: LOW-INCOME STUDENTS
LESS LIKELY TO HAVE HIGH VALUE-
ADDED TEACHERSA low-income
student is
more than
twice as likely
to have a low
value-added
teacher for
ELA
In math, a student from a
relatively more affluent
background is 39% more
likely to get a high value-
added math teacher.
ELA MATH
A student from a relatively
more affluent background is
62% more likely to get a high
value-added ELA teacher.

© 2017 THE EDUCATION TRUST
Low-Achieving Students are More Likely to be Assigned to Ineffective
Teachers than Effective Teachers
Source: Sitha Babu and Robert Mendro, Teacher Accountability: HLM-Based Teacher Effectiveness Indices in the
Investigation of Teacher Effects on Student Achievement in a State Assessment Program, AERA Annual Meeting, 2003.
© 2017 THE EDUCATION TRUST
These patterns not, however, inevitable.
Charlotte’s Strategic Staffing Initiative

© 2017 THE EDUCATION TRUST
Putting it All Together:
Charlotte’s Strategic Staffing Initiative
• Experienced, high performing principal;
• Gets to bring in 6 high performing teachers from
elsewhere in district, and bump out that many low
performers;
• Two years of autonomy to produce turn around
results;
• Near 100% results.

© 2017 THE EDUCATION TRUST
The practice of assigning weaker teachers to the kids
who come in behind is so longstanding, that many
educators don’t even think about it any more.
But school board members can—and should.

© 2017 THE EDUCATION TRUST
When is the last time you asked:
• Are there differences in teacher quality (experience, education,
effectiveness) between our high poverty and low poverty schools?
• Are there differences, even within schools, in who teaches the more
advanced courses and kids…and who teaches the remedial courses
and kids?
• What are we doing about this?
© 2017 THE EDUCATION TRUST
#4. Good schools, districts don’t think about closing the
achievement gap only as “bringing the bottom up.”

© 2017 THE EDUCATION TRUST
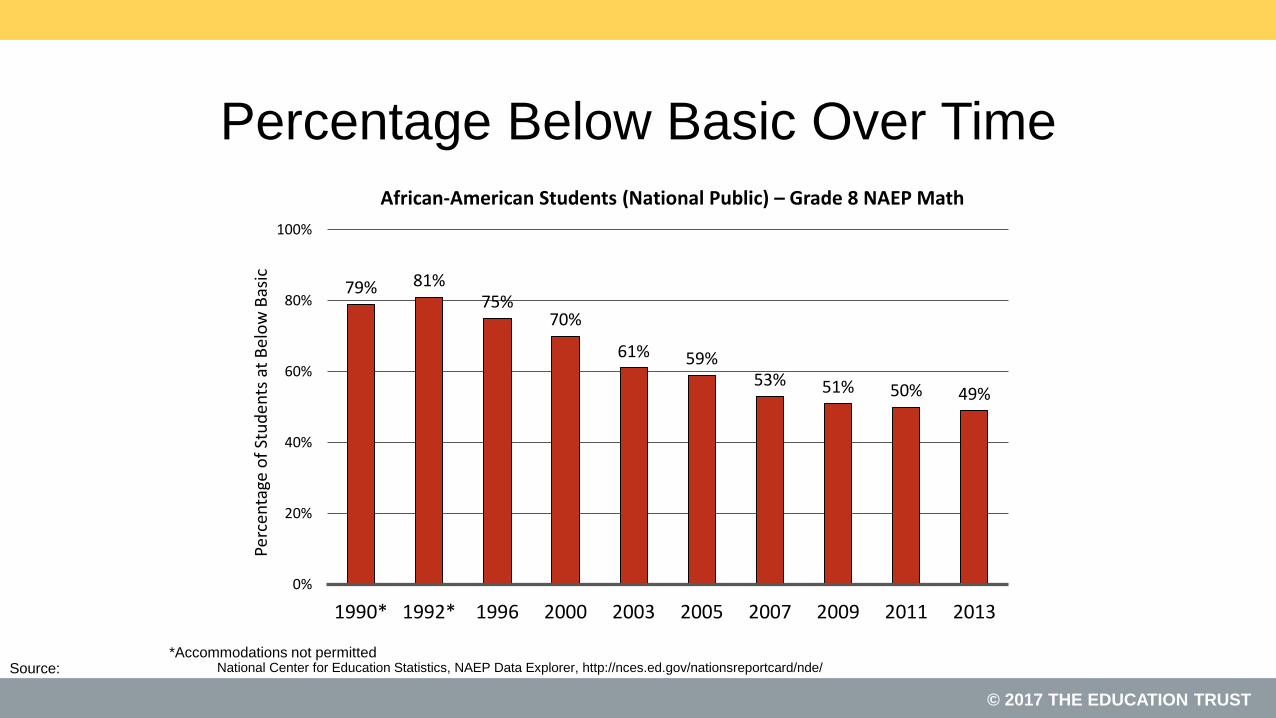
In part because of the push from NCLB, there’s been a
lot of energy directed at bringing bottom achievers up.
© 2017 THE EDUCATION TRUST
Source:
Percentage Below Basic Over Time
79% 81%75%
70%
61% 59%53% 51% 50% 49%
0%
20%
40%
60%
80%
100%
1990* 1992* 1996 2000 2003 2005 2007 2009 2011 2013
Perc
enta
ge o
f St
ud
ents
at
Bel
ow
Bas
ic
African-American Students (National Public) – Grade 8 NAEP Math
*Accommodations not permittedNational Center for Education Statistics, NAEP Data Explorer, http://nces.ed.gov/nationsreportcard/nde/
© 2017 THE EDUCATION TRUST
Source:
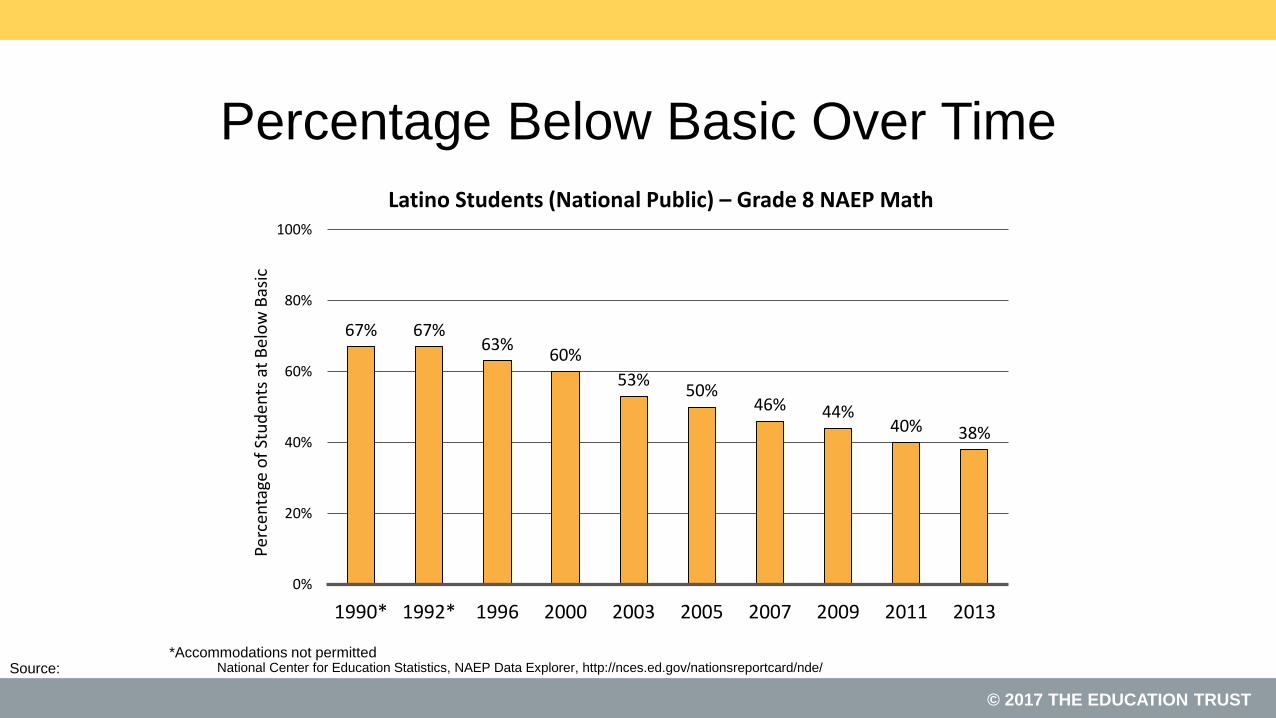
Percentage Below Basic Over Time
67% 67%63%
60%
53%50%
46% 44%40% 38%
0%
20%
40%
60%
80%
100%
1990* 1992* 1996 2000 2003 2005 2007 2009 2011 2013
Perc
enta
ge o
f St
ud
ents
at
Bel
ow
Bas
ic
Latino Students (National Public) – Grade 8 NAEP Math
*Accommodations not permittedNational Center for Education Statistics, NAEP Data Explorer, http://nces.ed.gov/nationsreportcard/nde/

© 2017 THE EDUCATION TRUST
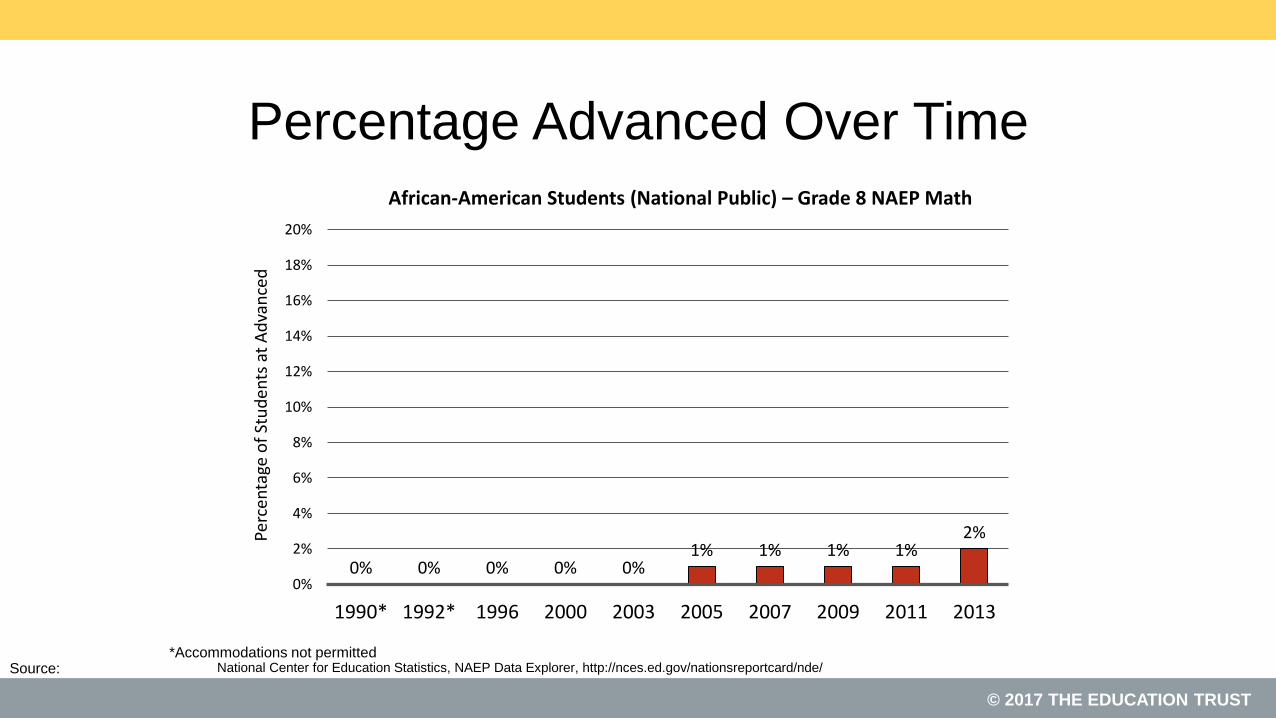
At the same time, though…

© 2017 THE EDUCATION TRUST
Source:
Percentage Advanced Over Time
3% 3%
5%6%
7% 7%
9%10% 10%
11%
0%
2%
4%
6%
8%
10%
12%
14%
16%
18%
20%
1990* 1992* 1996 2000 2003 2005 2007 2009 2011 2013
Perc
enta
ge o
f St
ud
ents
at
Ad
van
ced
White Students (National Public) – Grade 8 NAEP Math
*Accommodations not permittedNational Center for Education Statistics, NAEP Data Explorer, http://nces.ed.gov/nationsreportcard/nde/
© 2017 THE EDUCATION TRUST
Source:
Percentage Advanced Over Time
0% 0% 0% 0% 0%1% 1% 1% 1%
2%
0%
2%
4%
6%
8%
10%
12%
14%
16%
18%
20%
1990* 1992* 1996 2000 2003 2005 2007 2009 2011 2013
Perc
enta
ge o
f St
ud
ents
at
Ad
van
ced
African-American Students (National Public) – Grade 8 NAEP Math
*Accommodations not permittedNational Center for Education Statistics, NAEP Data Explorer, http://nces.ed.gov/nationsreportcard/nde/

© 2017 THE EDUCATION TRUST
Source:
Percentage Advanced Over Time
1%0%
1%0%
1% 1%2% 2%
3% 3%
0%
2%
4%
6%
8%
10%
12%
14%
16%
18%
20%
1990* 1992* 1996 2000 2003 2005 2007 2009 2011 2013
Perc
enta
ge o
f St
ud
ents
at
Ad
van
ced
Latino Students (National Public) – Grade 8 NAEP Math
*Accommodations not permittedNational Center for Education Statistics, NAEP Data Explorer, http://nces.ed.gov/nationsreportcard/nde/

© 2017 THE EDUCATION TRUST
We need to focus on growing students at all ends
of the spectrum.
© 2017 THE EDUCATION TRUST
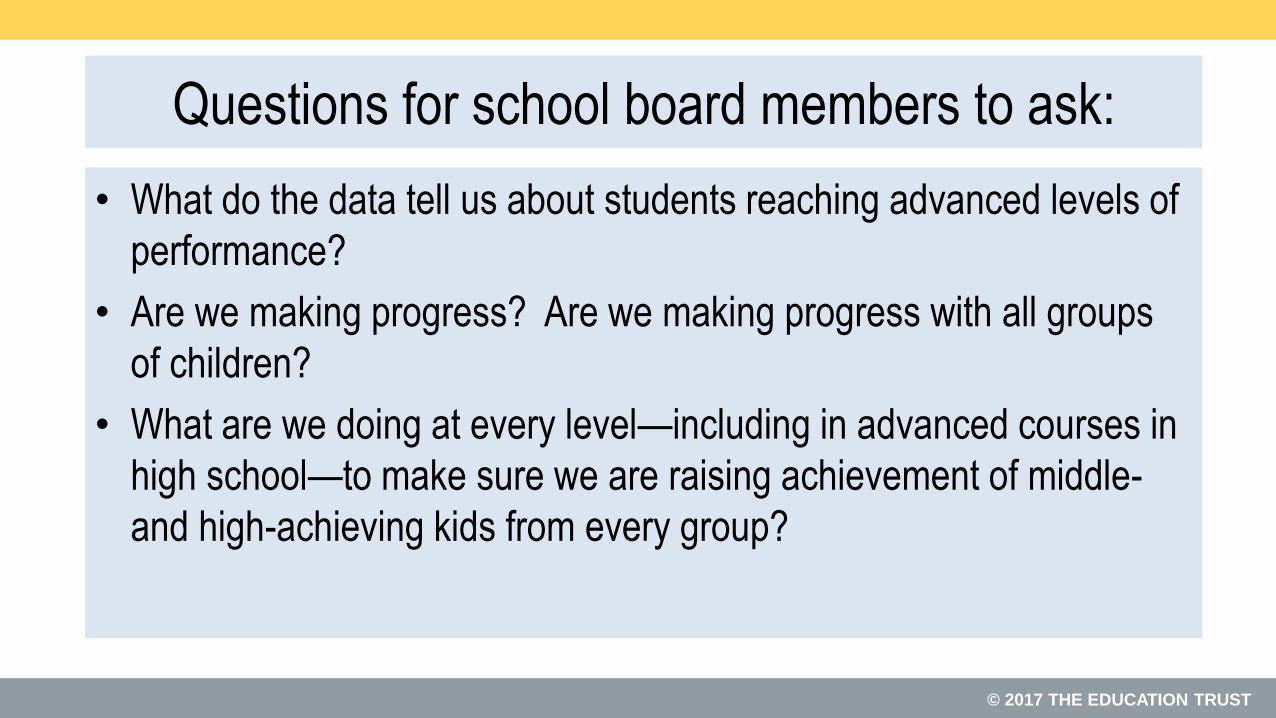
Questions for school board members to ask:
• What do the data tell us about students reaching advanced levels of
performance?
• Are we making progress? Are we making progress with all groups
of children?
• What are we doing at every level—including in advanced courses in
high school—to make sure we are raising achievement of middle-
and high-achieving kids from every group?

© 2017 THE EDUCATION TRUST
#5. In good schools, educators know that they
have enormous power to shape children’s lives.

© 2017 THE EDUCATION TRUST
They know that it’s not about heroic individuals.
That path, as we all know, is unsustainable.
© 2017 THE EDUCATION TRUST
But they have seen the awesome power of the
collective—some describe it as the “huddle”—to lift
children up.
As well as the destructive power of individual adults to
tear children down.

© 2017 THE EDUCATION TRUST
So they organize and celebrate the lifting, and
they do not tolerate those who tear down.

© 2017 THE EDUCATION TRUST
No, things aren’t fair out there.
And we should fight hard to make sure families get what
they need.

© 2017 THE EDUCATION TRUST
But in the meantime, we have enormous power to
pave the path upward for far more children…
© 2017 THE EDUCATION TRUST
And they need us to exercise that power.

© 2017 THE EDUCATION TRUST
For board members, that means:
• Holding up and celebrating schools and classrooms that are
producing real gains for vulnerable students;
• Not accepting excuses from those who are not.

© 2017 THE EDUCATION TRUST
Washington, D.C. Metro Detroit, MI
202/293-1217 734/619-8009
Download this presentation on our website
www.edtrust.org
Oakland, CA
510/465-6444