Embed Size (px)
Citation preview
1
Achievement and equity:Achievement and equity:Where is Australia at?Where is Australia at?
Brisbane, AustraliaBrisbane, Australia22--3 June 20053 June 2005
Barry McGawBarry McGawDirector for EducationDirector for Education
Organisation for Economic CoOrganisation for Economic Co--operation and Developmentoperation and Development
2005 Curriculum Corporation Conference2005 Curriculum Corporation Conference
Curriculum and assessment:Curriculum and assessment:Closing the gapClosing the gap
2
OECD’s Programme for International Student Assessment (PISA)
3
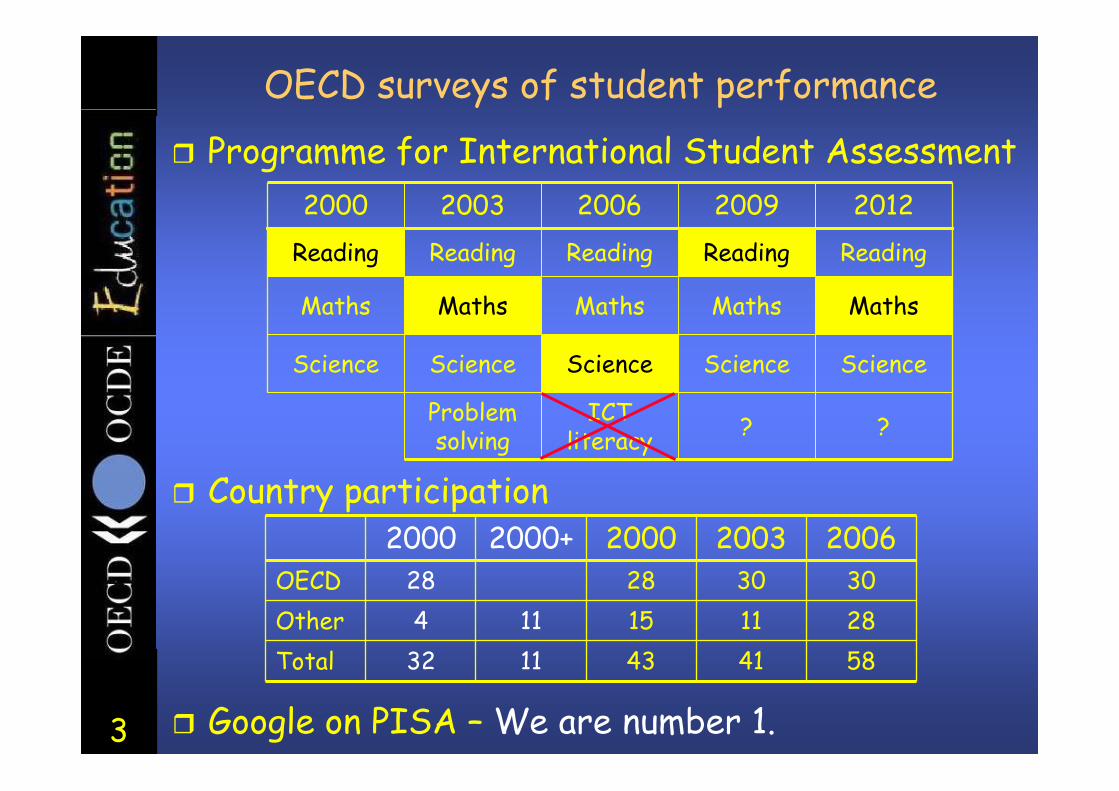
OECD surveys of student performanceProgramme for International Student Assessment
?
Science
Maths
Reading
2012
?ICTliteracy
Problem solving
ScienceScienceScienceScience
MathsMathsMathsMaths
ReadingReadingReadingReading
2009200620032000
Country participation
Google on PISA – We are number 1.
431528
2000
1111
2000+
584132Total28114Other303028OECD
200620032000
4
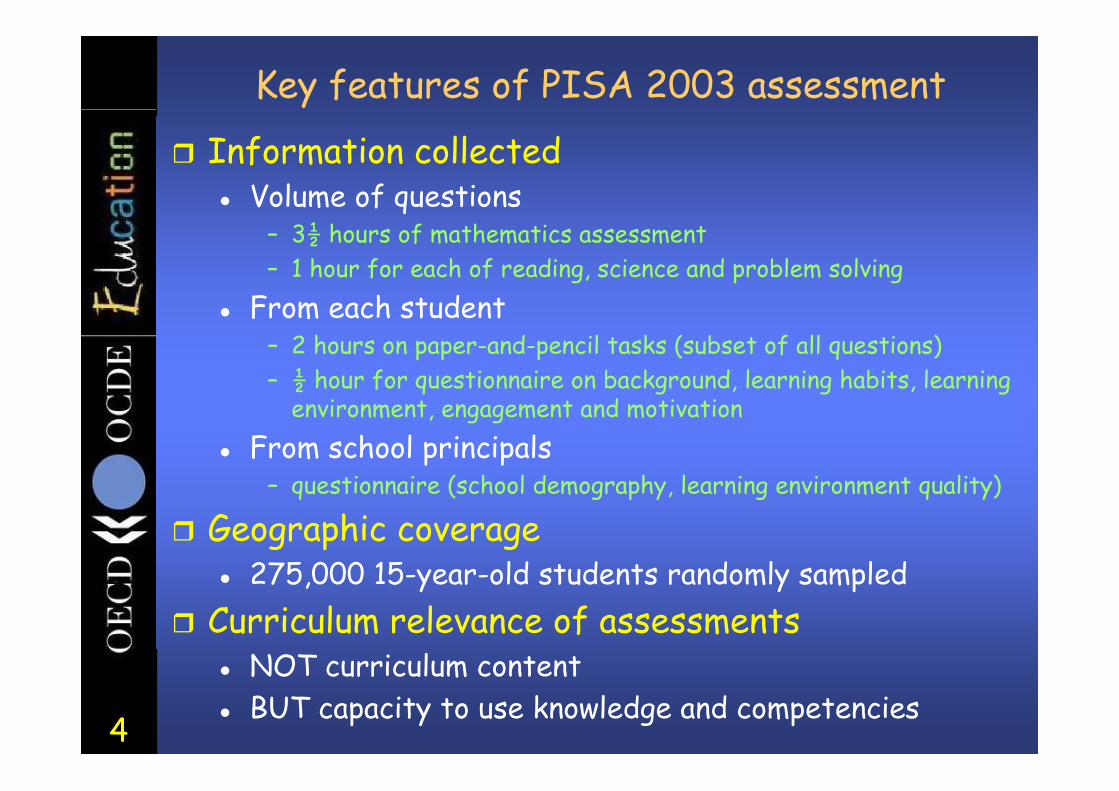
Key features of PISA 2003 assessmentInformation collected
Volume of questions– 3½ hours of mathematics assessment– 1 hour for each of reading, science and problem solving
From each student– 2 hours on paper-and-pencil tasks (subset of all questions)– ½ hour for questionnaire on background, learning habits, learning
environment, engagement and motivationFrom school principals
– questionnaire (school demography, learning environment quality)
Geographic coverage275,000 15-year-old students randomly sampled
Curriculum relevance of assessmentsNOT curriculum contentBUT capacity to use knowledge and competencies
5
PISA’s messages about quality.
6
Mathematical literacy
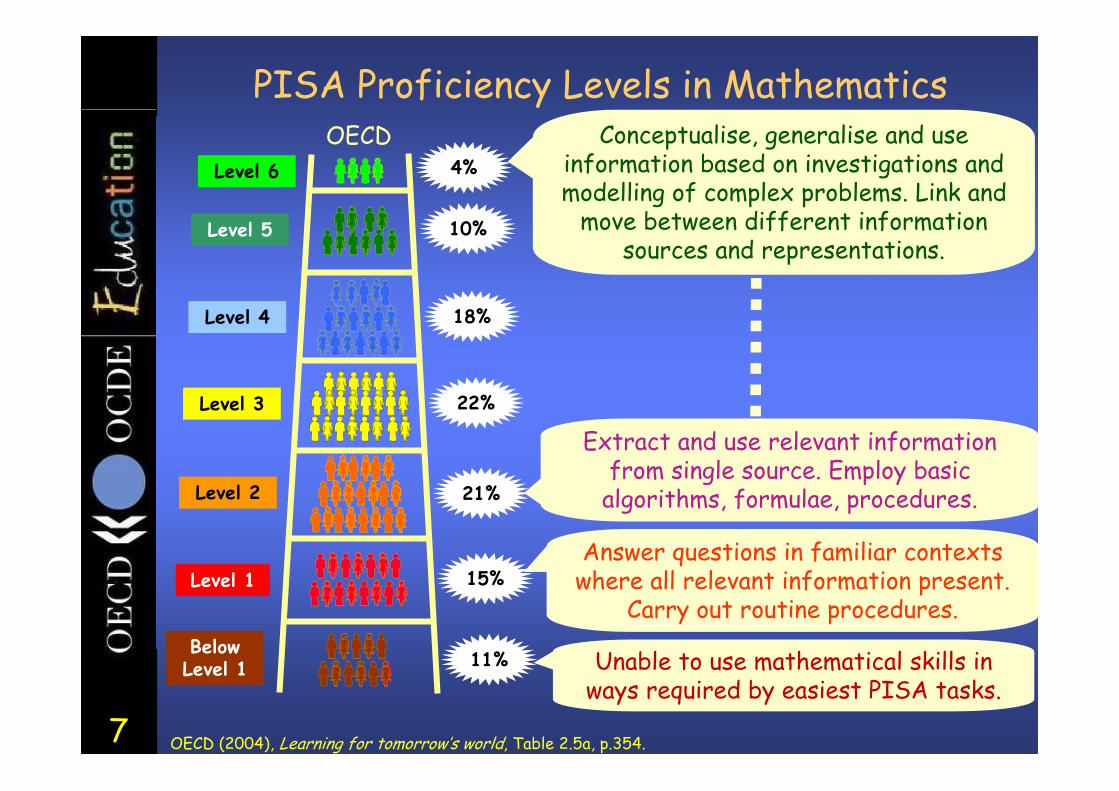
7
Unable to use mathematical skills in ways required by easiest PISA tasks.
Answer questions in familiar contexts where all relevant information present.
Carry out routine procedures.
OECD Conceptualise, generalise and use information based on investigations and modelling of complex problems. Link and
move between different information sources and representations.
Level 6
Level 5
Level 4
Level 3
Level 2
Level 1
BelowLevel 1
OECD (2004), Learning for tomorrow’s world, Table 2.5a, p.354.
PISA Proficiency Levels in Mathematics
15%
21%
22%
18%
10%
4%
11%
Extract and use relevant information from single source. Employ basic
algorithms, formulae, procedures.
8
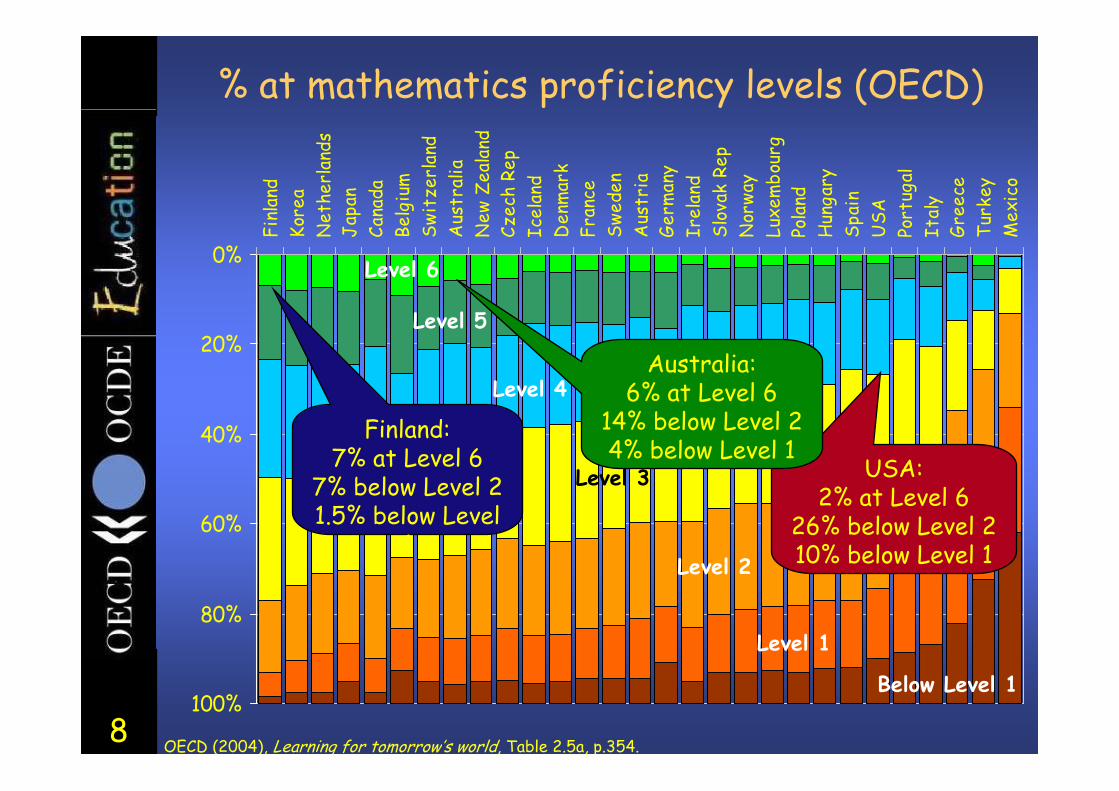
% at mathematics proficiency levels (OECD)
0%
20%
40%
60%
80%
100%
Finl
and
Kore
aN
ethe
rlan
dsJa
pan
Cana
daBe
lgiu
mSw
itze
rlan
dA
ustr
alia
New
Zea
land
Czec
h Re
pIc
elan
dD
enm
ark
Fran
ceSw
eden
Aus
tria
Germ
any
Irel
and
Slov
ak R
epN
orwa
yLu
xem
bour
gPo
land
Hun
gary
Spai
nU
SAPo
rtug
alIt
aly
Gree
ceTu
rkey
Mex
ico
Level 3
Level 1
Below Level 1
Level 6
Level 5
Level 4
Level 2
OECD (2004), Learning for tomorrow’s world, Table 2.5a, p.354.
USA:2% at Level 6
26% below Level 210% below Level 1
Finland:7% at Level 6
7% below Level 21.5% below Level
1
Australia:6% at Level 6
14% below Level 24% below Level 1
9
0%
20%
40%
60%
80%
100%
Hon
g Ko
ng-C
hina
Finl
and
Kore
aN
ethe
rlan
dsLi
echt
enst
ein
Japa
nCa
nada
Belg
ium
Mac
ao-C
hina
Swit
zerl
and
Aus
tral
iaN
ew Z
eala
ndCz
ech
Repu
blic
Icel
and
Denm
ark
Fran
ceSw
eden
Aus
tria
Germ
any
Irel
and
Slov
ak R
epub
licN
orwa
yLu
xem
bour
gPo
land
Hun
gary
Spai
nLa
tvia
Uni
ted
Stat
esRu
ssia
n Fe
dera
tion
Port
ugal
Ital
yGr
eece
Serb
iaTu
rkey
Uru
guay
Thai
land
Mex
ico
Indo
nesi
aTu
nisi
aBr
azil
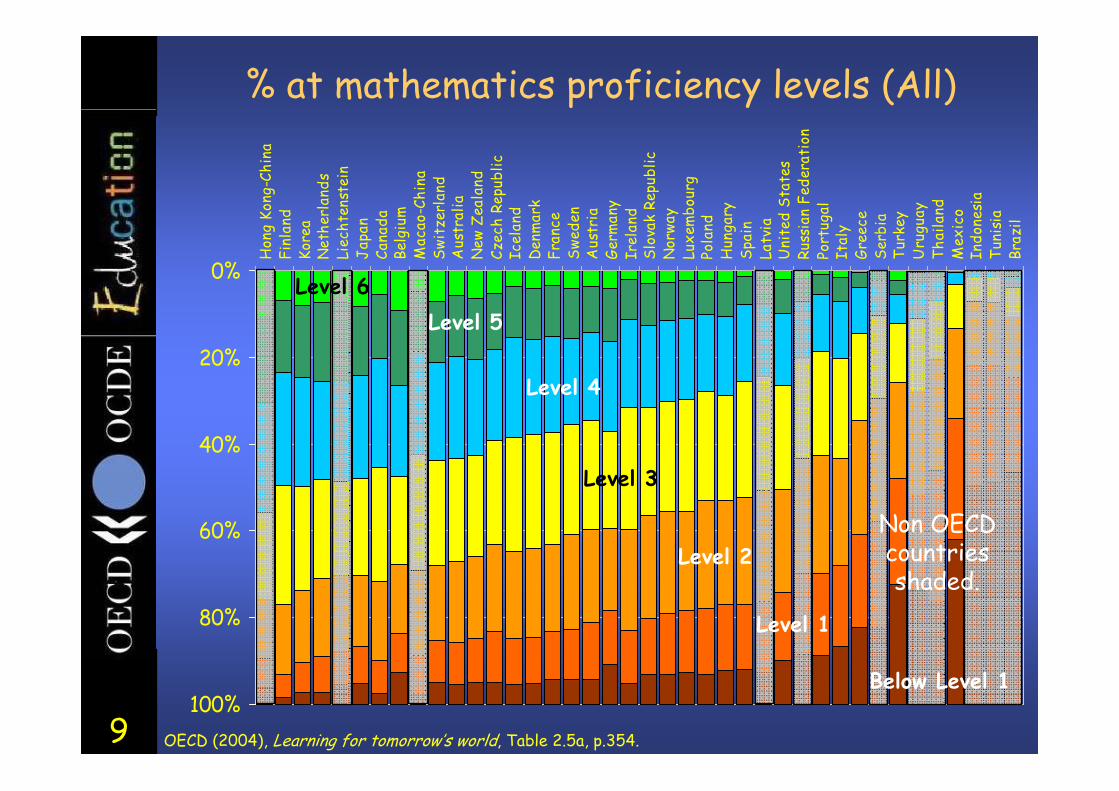
OECD (2004), Learning for tomorrow’s world, Table 2.5a, p.354.
% at mathematics proficiency levels (All)
Level 4
Level 3
Level 2
Level 5
Non OECD countries shaded.
Below Level 1
Level 1
Level 6
10
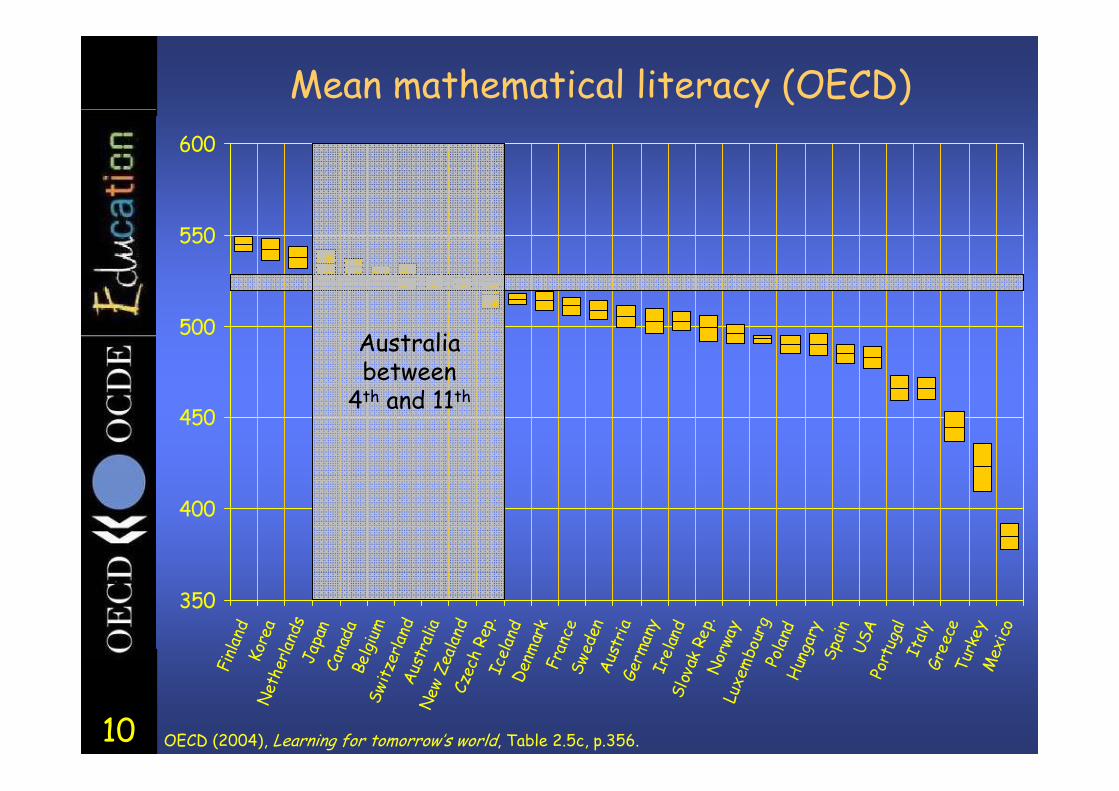
Mean mathematical literacy (OECD)
350
400
450
500
550
600
Finl
and
Kore
aN
ethe
rland
sJa
pan
Cana
daBe
lgiu
mSw
itzer
land
Aust
ralia
New
Zea
land
Czec
h Re
p.Ic
elan
dDe
nmar
kFr
ance
Swed
enAu
stri
aGe
rman
yIr
elan
dSl
ovak
Rep
.N
orwa
yLu
xem
bour
gPo
land
Hun
gary
Spai
nUS
APo
rtug
alIt
aly
Gree
ceTu
rkey
Mex
ico
Australia between
4th and 11th
OECD (2004), Learning for tomorrow’s world, Table 2.5c, p.356.
11
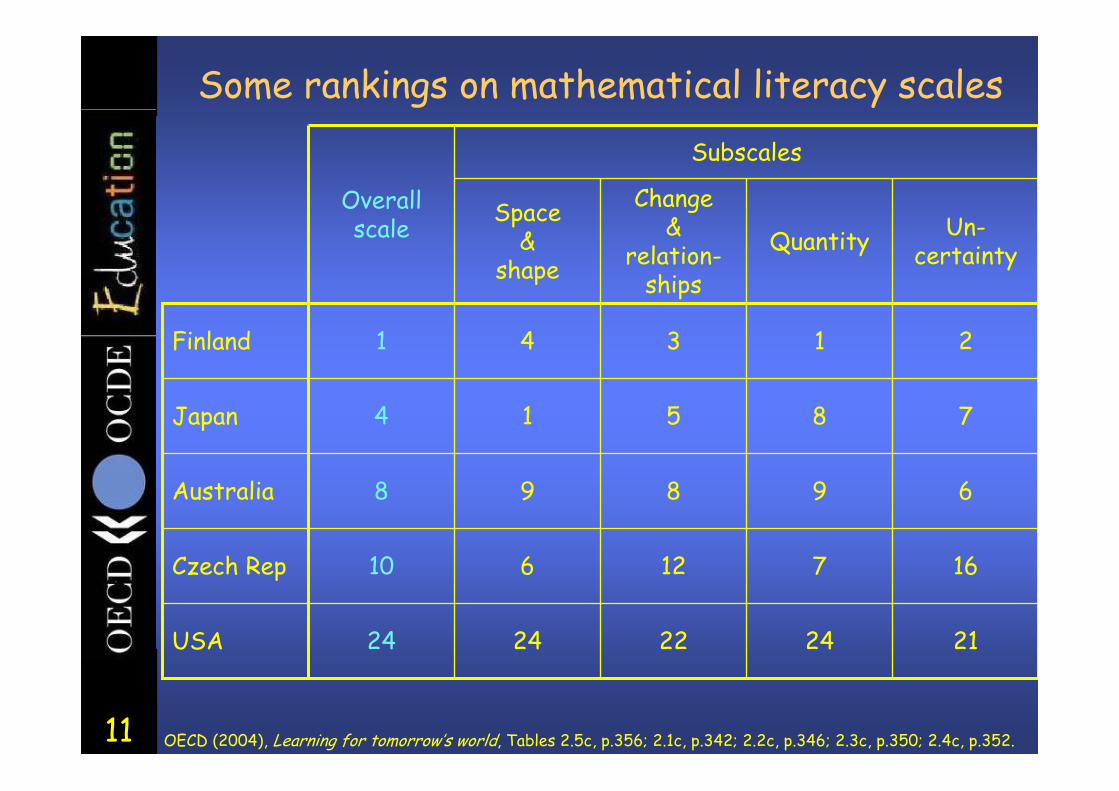
Some rankings on mathematical literacy scalesSubscales
2124222424USA
16712610Czech Rep
69898Australia
78514Japan
21341Finland
Un-certaintyQuantity
Change&
relation-ships
Space&
shape
Overallscale
OECD (2004), Learning for tomorrow’s world, Tables 2.5c, p.356; 2.1c, p.342; 2.2c, p.346; 2.3c, p.350; 2.4c, p.352.
12
Problem solving
13
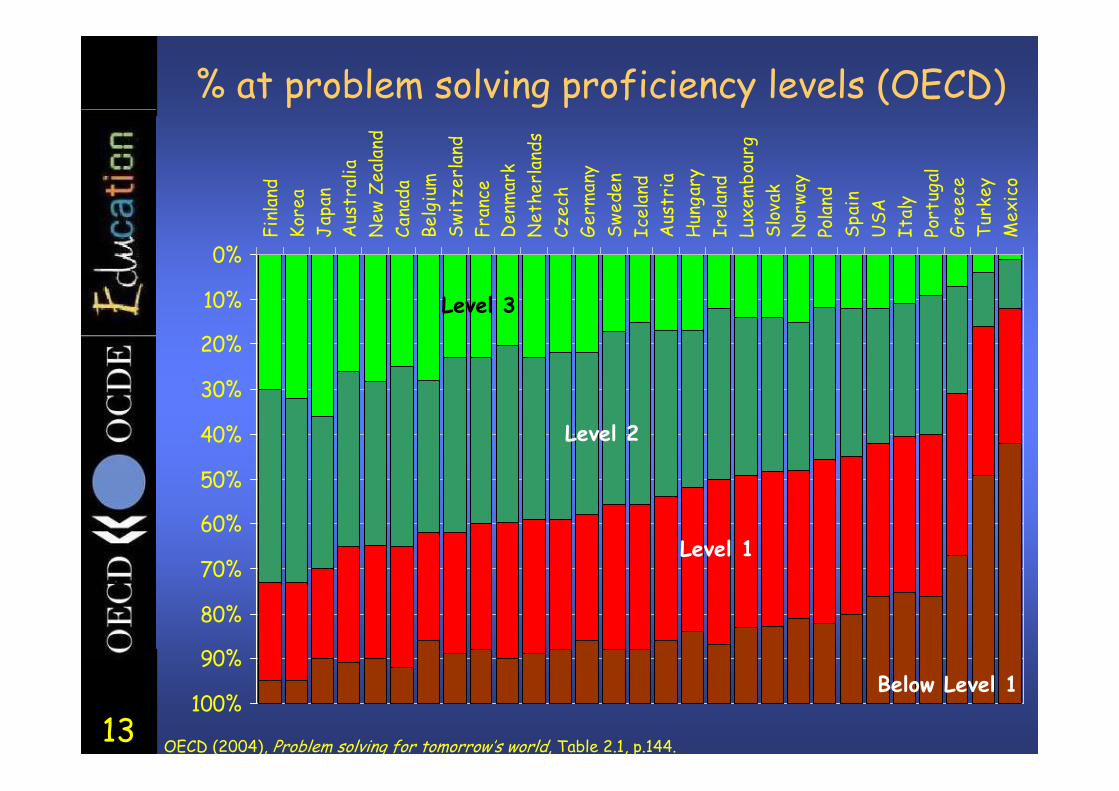
% at problem solving proficiency levels (OECD)
0%
10%
20%
30%
40%
50%
60%
70%
80%
90%
100%
Finl
and
Kore
aJa
pan
Aus
tral
iaN
ew Z
eala
ndCa
nada
Belg
ium
Swit
zerl
and
Fran
ceD
enm
ark
Net
herl
ands
Czec
hGe
rman
ySw
eden
Icel
and
Aus
tria
Hun
gary
Irel
and
Luxe
mbo
urg
Slov
akN
orwa
yPo
land
Spai
nU
SAIt
aly
Port
ugal
Gree
ceTu
rkey
Mex
ico
Level 1
Level 3
Level 2
OECD (2004), Problem solving for tomorrow’s world, Table 2.1, p.144.
Below Level 1
14
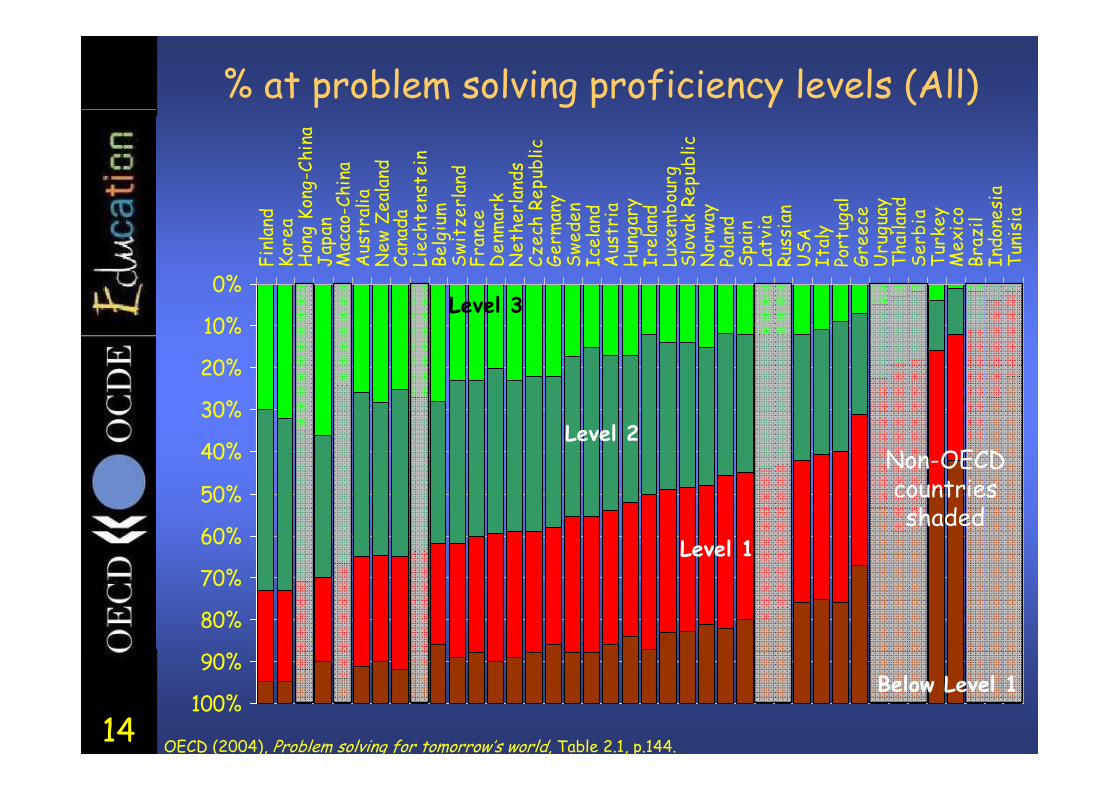
% at problem solving proficiency levels (All)
0%
10%
20%
30%
40%
50%
60%
70%
80%
90%
100%
Finl
and
Kore
aH
ong
Kong
-Chi
naJa
pan
Mac
ao-C
hina
Aus
tral
iaN
ew Z
eala
ndCa
nada
Liec
hten
stei
nBe
lgiu
mSw
itze
rlan
dFr
ance
Den
mar
kN
ethe
rlan
dsCz
ech
Repu
blic
Germ
any
Swed
enIc
elan
dA
ustr
iaH
unga
ryIr
elan
dLu
xem
bour
gSl
ovak
Rep
ublic
Nor
way
Pola
ndSp
ain
Latv
iaRu
ssia
nU
SAIt
aly
Port
ugal
Gree
ceU
rugu
ayTh
aila
ndSe
rbia
Turk
eyM
exic
oBr
azil
Indo
nesi
aTu
nisi
a
Level 1
Level 3
Level 2Non-OECD countries shaded
Below Level 1
OECD (2004), Problem solving for tomorrow’s world, Table 2.1, p.144.
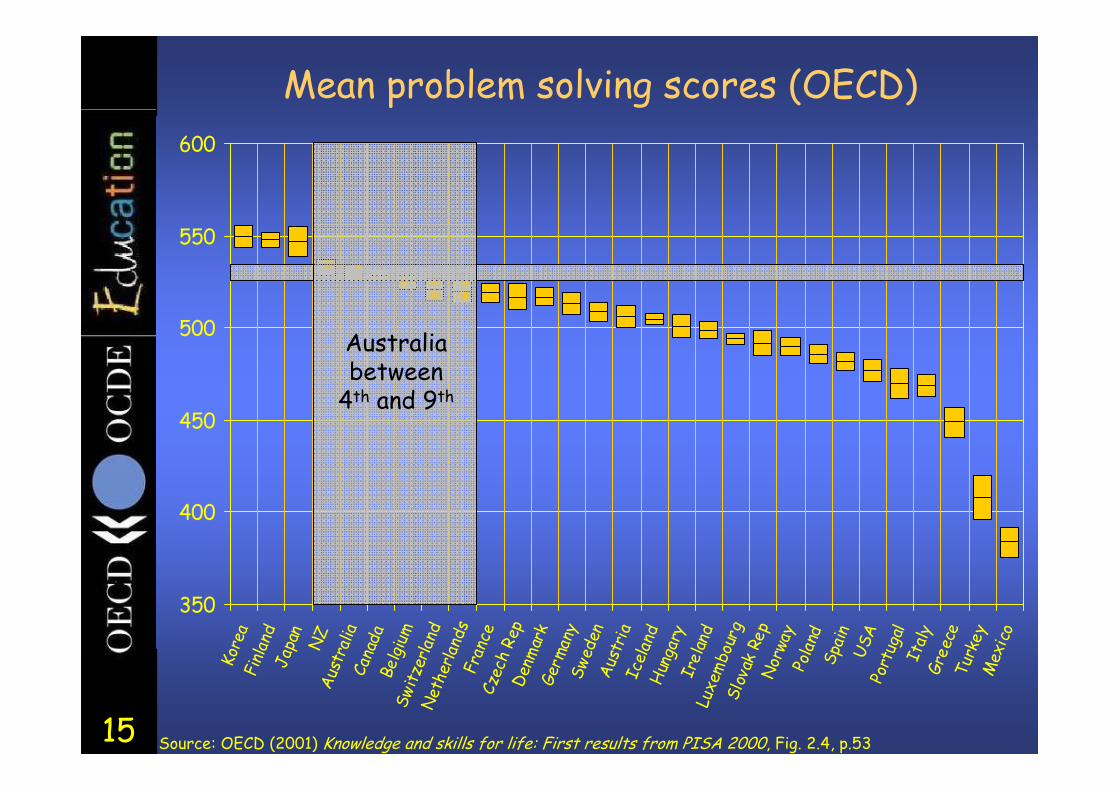
15 Source: OECD (2001) Knowledge and skills for life: First results from PISA 2000, Fig. 2.4, p.53
Mean problem solving scores (OECD)
350
400
450
500
550
600
Kore
aFi
nlan
dJa
pan
NZ
Aust
ralia
Cana
daBe
lgiu
mSw
itzer
land
Net
herla
nds
Fran
ceCz
ech
Rep
Denm
ark
Germ
any
Swed
enAu
stri
aIc
elan
dH
unga
ryIr
elan
dLu
xem
bour
gSl
ovak
Rep
Nor
way
Pola
ndSp
ain
USA
Port
ugal
Ital
yGr
eece
Turk
eyM
exic
o
Australia between
4th and 9th
16
PISA’s messages about qualityfor Australia.
Australian education, at least to age 15, is of high quality by international standards, in
• mathematics• problem solving
AND• reading• science
17
PISA’s messages about equity.
18
Link between social background & achievement:Reading literacy – PISA 2000
19
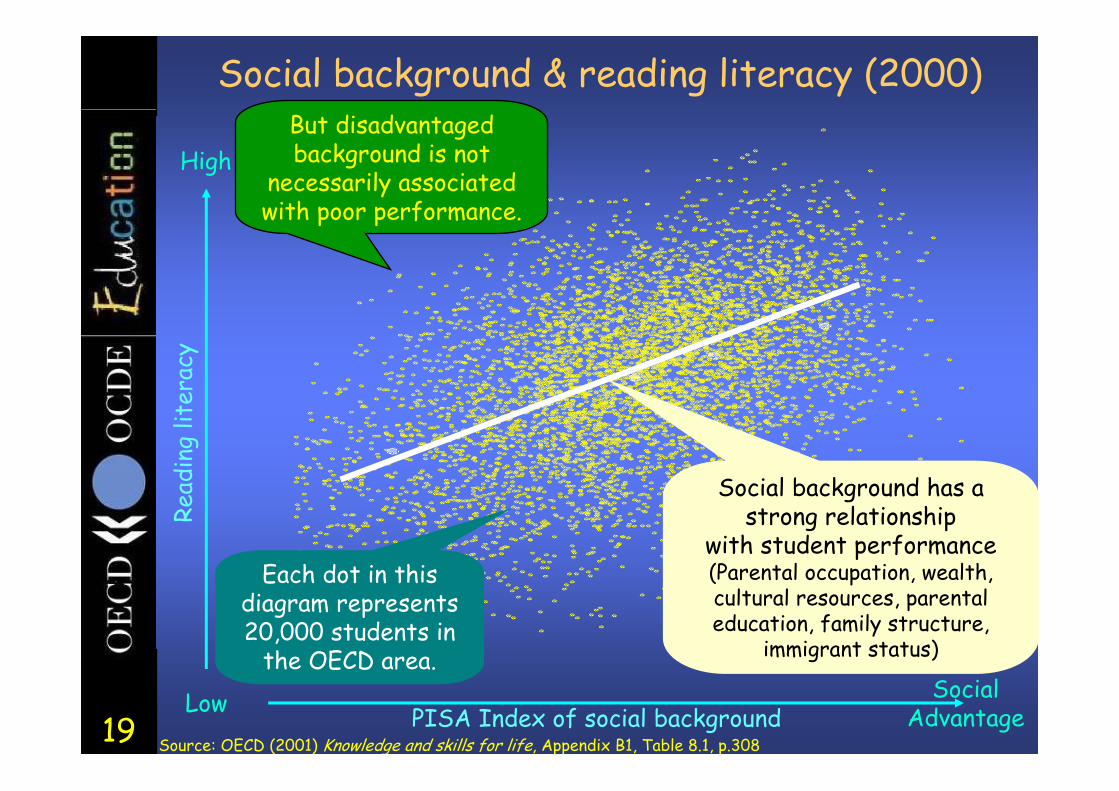
Social background & reading literacy (2000)
SocialAdvantagePISA Index of social background
Each dot in this diagram represents 20,000 students in
the OECD area.
HighRe
adin
g lit
erac
y
LowSource: OECD (2001) Knowledge and skills for life, Appendix B1, Table 8.1, p.308
Social background has a strong relationship
with student performance(Parental occupation, wealth, cultural resources, parental education, family structure,
immigrant status)
But disadvantaged background is not
necessarily associated with poor performance.
20
300
350
400
450
500
550
600
-2 -1.5 -1 -0.5 0 0.5 1 1.5 2
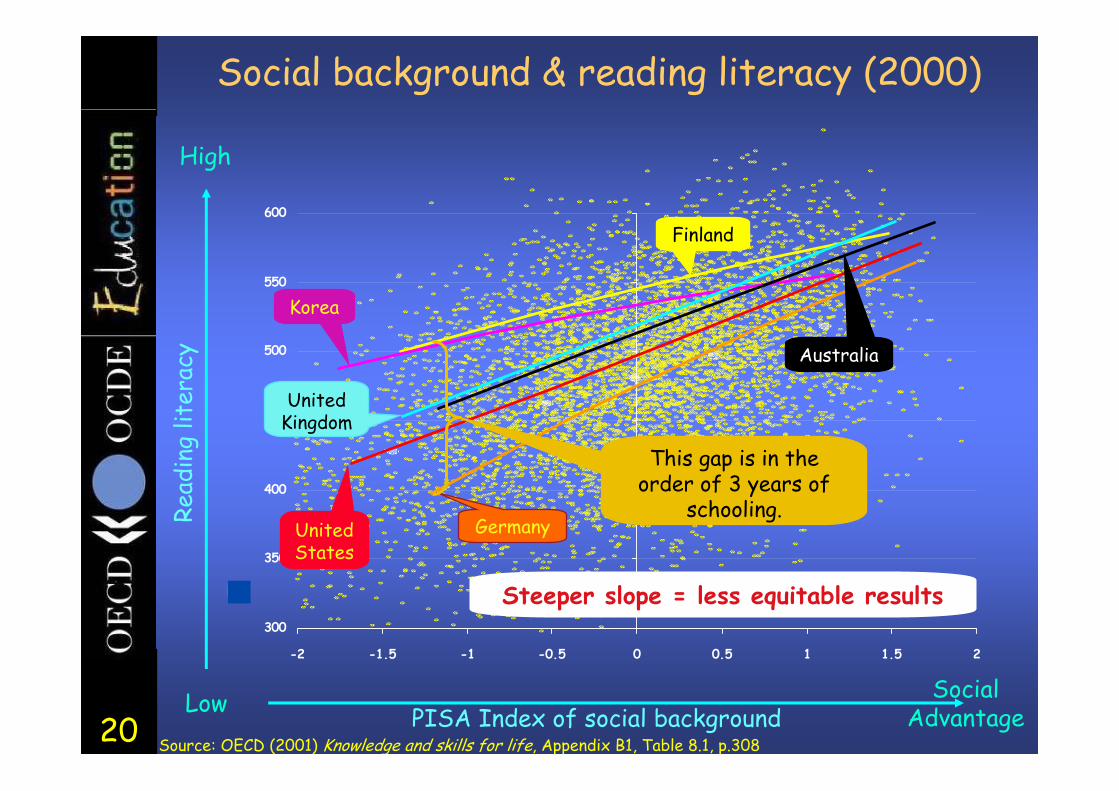
Social background & reading literacy (2000)
Source: OECD (2001) Knowledge and skills for life, Appendix B1, Table 8.1, p.308
SocialAdvantagePISA Index of social backgroundLow
Read
ing
liter
acy
High
Finland
GermanyUnitedStates
UnitedKingdom
Korea
This gap is in the order of 3 years of
schooling.
Australia
Steeper slope = less equitable results
21
Germany HungaryCzech RepublicSwitzerland
Luxembourg
Denmark
PortugalGreecePoland
Mexico
Italy
United Kingdom
BelgiumUnited StatesFrance
AustraliaNew Zealand
AustriaNorway
IrelandCanada
Sweden
Finland
Iceland
KoreaJapan
Spain
420
440
460
480
500
520
540
560
-20 -15 -10 -5 0 5 10 15 20 25
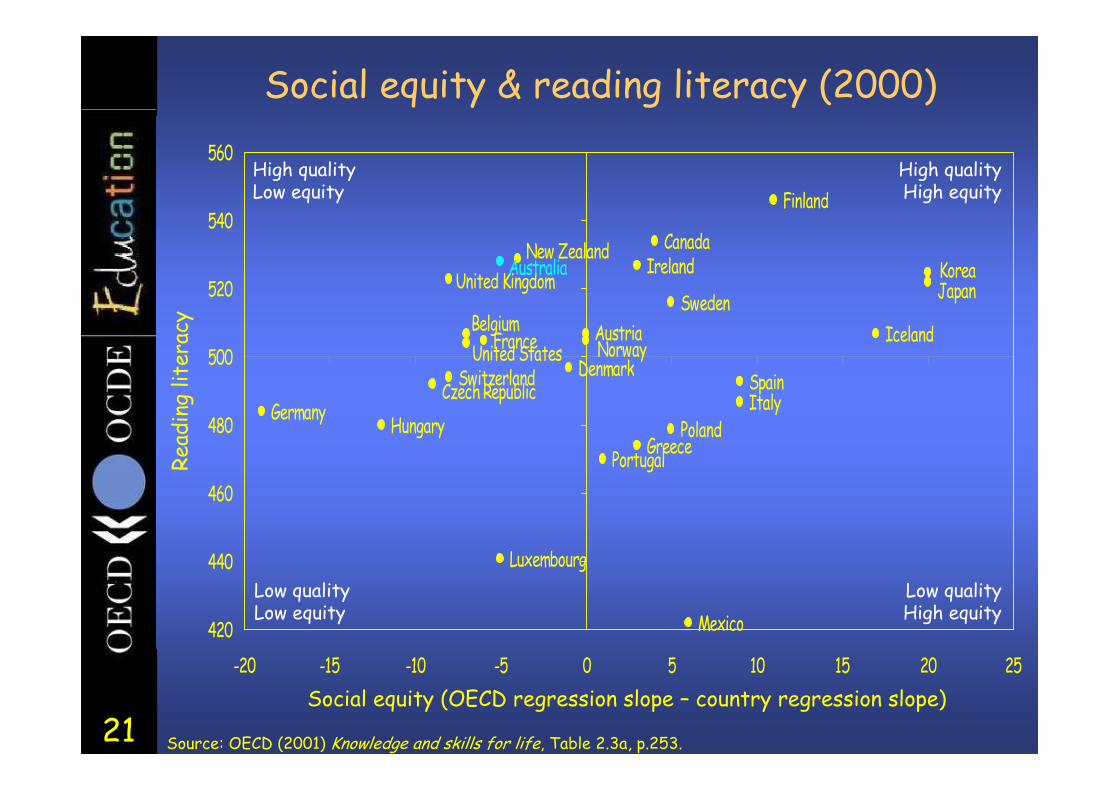
Social equity & reading literacy (2000)
Social equity (OECD regression slope – country regression slope)
Read
ing
liter
acy
Source: OECD (2001) Knowledge and skills for life, Table 2.3a, p.253.
High qualityLow equity
High qualityHigh equity
Low qualityLow equity
Low qualityHigh equity
22
PISA’s messages about equityfor Australia: reading literacy 2000
Australian education is relatively low equity, including in comparison with some other high quality countries like Canada, Ireland, Sweden, Finland, Japan, Korea.

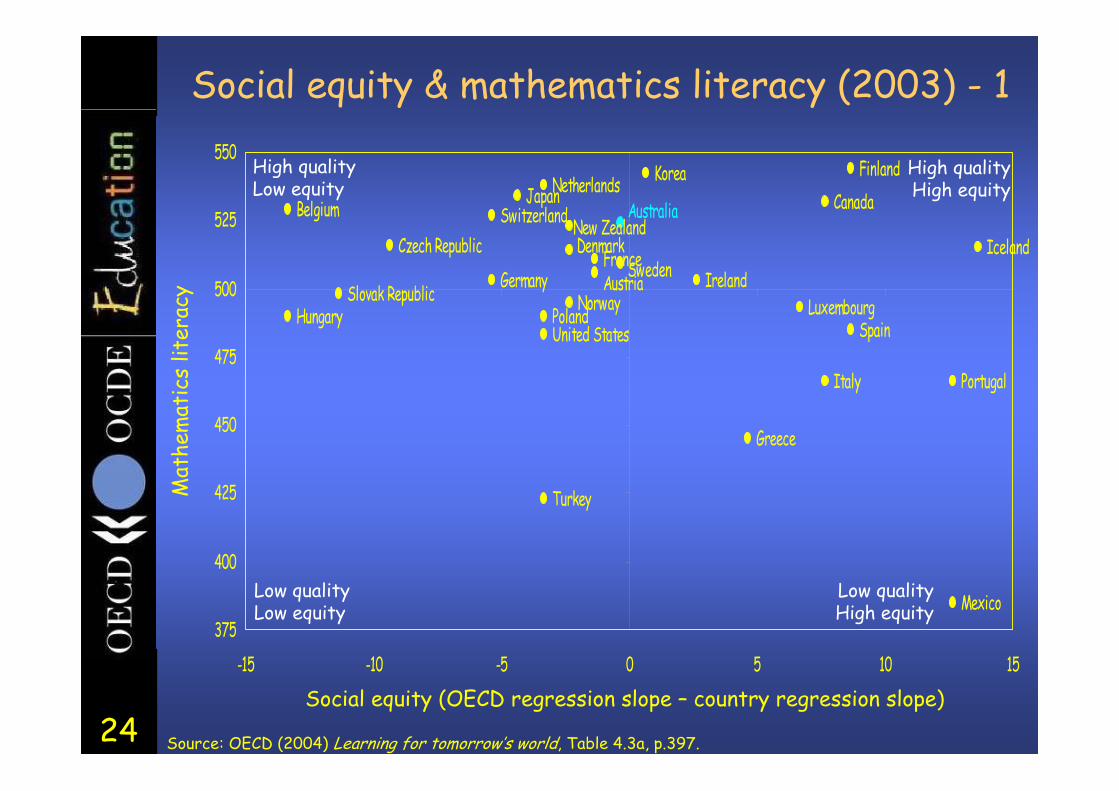
23
Link between social background & achievement:Mathematics literacy – PISA 2003
24
United States
Turkey
Switzerland
Sweden
Spain
Slovak Republic
Portugal
PolandNorway
New Zealand
Netherlands
Mexico
Luxembourg
KoreaJapan
Italy
IrelandIceland
Hungary
Greece
GermanyFrance
Finland
DenmarkCzech Republic
CanadaBelgium
Austria
Australia
375
400
425
450
475
500
525
550
-15 -10 -5 0 5 10 15
Social equity & mathematics literacy (2003) - 1
Source: OECD (2004) Learning for tomorrow’s world, Table 4.3a, p.397.
Social equity (OECD regression slope – country regression slope)
Mat
hem
atic
s lit
erac
yHigh qualityLow equity
High qualityHigh equity
Low qualityLow equity
Low qualityHigh equity
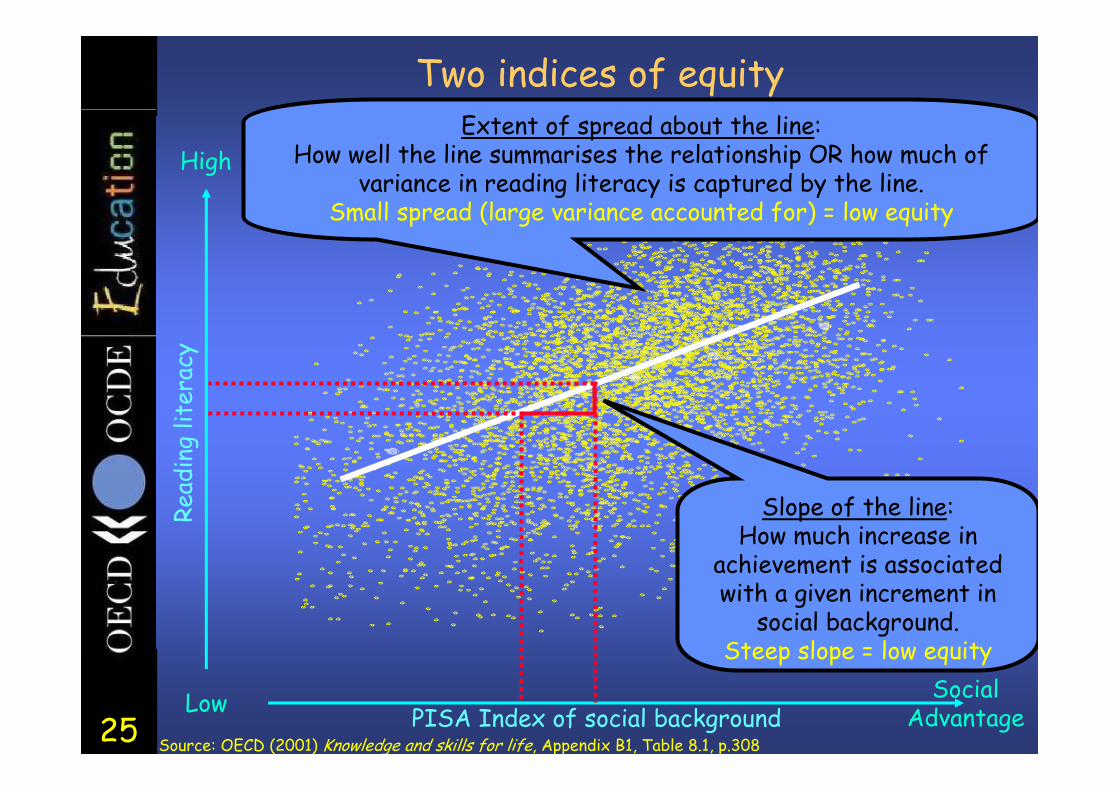
25
Two indices of equity
SocialAdvantagePISA Index of social background
HighRe
adin
g lit
erac
y
LowSource: OECD (2001) Knowledge and skills for life, Appendix B1, Table 8.1, p.308
Slope of the line:How much increase in
achievement is associated with a given increment in
social background.Steep slope = low equity
Extent of spread about the line:How well the line summarises the relationship OR how much of
variance in reading literacy is captured by the line.Small spread (large variance accounted for) = low equity
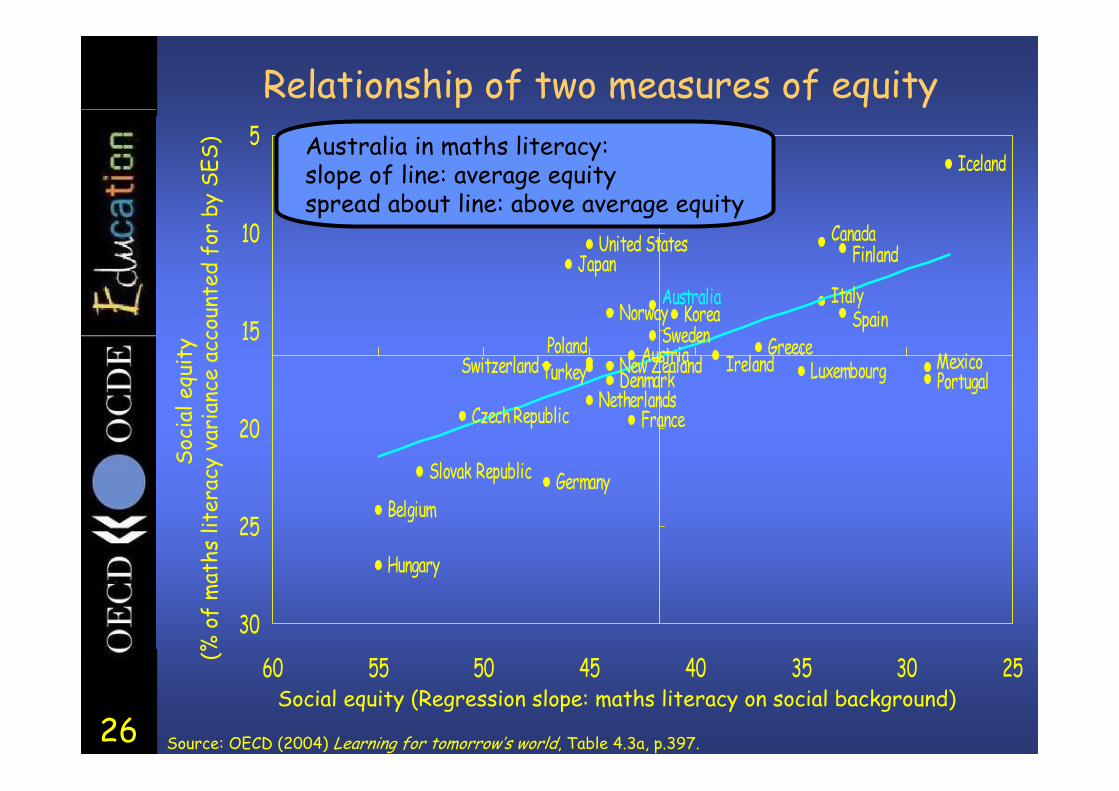
26
Relationship of two measures of equity
United States
TurkeySwitzerlandSweden
Spain
Slovak Republic
PortugalPoland
Norway
New ZealandNetherlands
MexicoLuxembourg
Korea
JapanItaly
Ireland
Iceland
Hungary
Greece
Germany
France
Finland
DenmarkCzech Republic
Canada
Belgium
Austria
Australia
5
10
15
20
25
302530354045505560
Social equity (Regression slope: maths literacy on social background)
Source: OECD (2004) Learning for tomorrow’s world, Table 4.3a, p.397.
Soci
al e
quit
y(%
of
mat
hs li
tera
cy v
aria
nce
acco
unte
d fo
r by
SES
) Australia in maths literacy:slope of line: average equityspread about line: above average equity
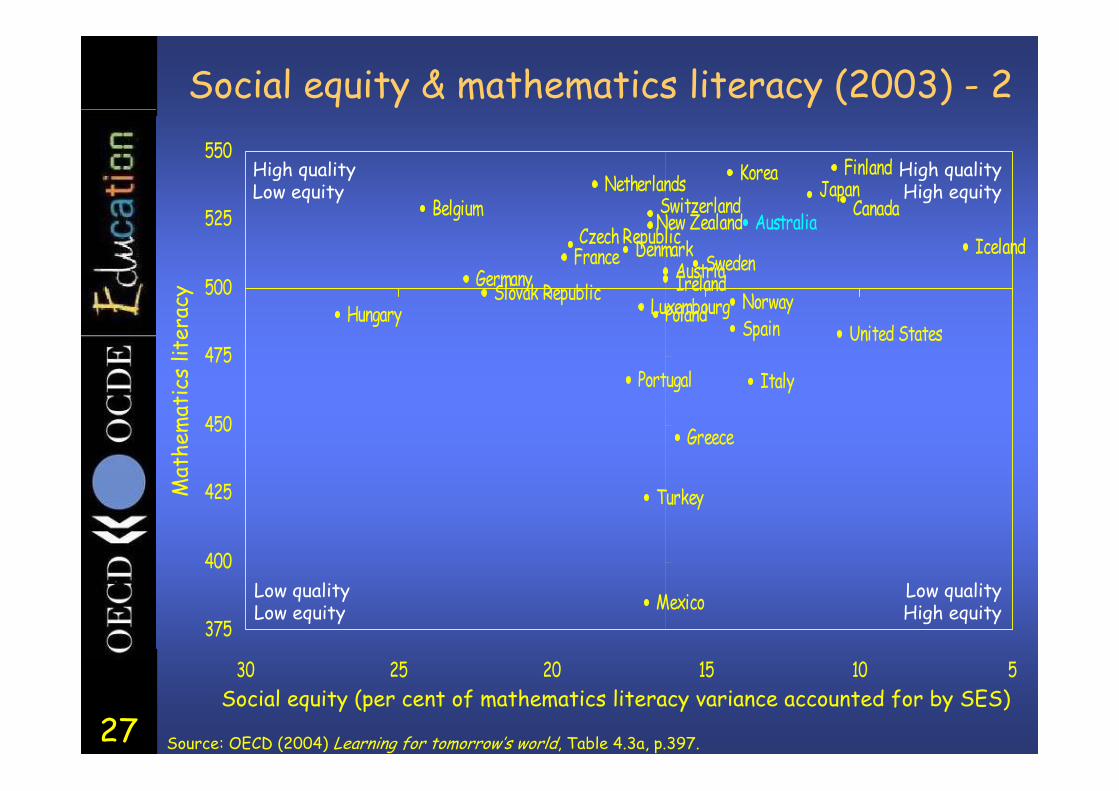
27
Social equity & mathematics literacy (2003) - 2
Australia
Austria
Belgium CanadaCzech RepublicDenmark
Finland
FranceGermany
Greece
Hungary
Iceland
Ireland
Italy
JapanKorea
Luxembourg
Mexico
Netherlands
New Zealand
NorwayPoland
Portugal
Slovak RepublicSpain
Sweden
Switzerland
Turkey
United States
375
400
425
450
475
500
525
550
51015202530
Mat
hem
atic
s lit
erac
y
Social equity (per cent of mathematics literacy variance accounted for by SES)
Source: OECD (2004) Learning for tomorrow’s world, Table 4.3a, p.397.
High qualityLow equity
High qualityHigh equity
Low qualityLow equity
Low qualityHigh equity
28
PISA’s messages about equityfor Australia: mathematics literacy 2003
Average increases in mathematics literacy associated with increases in advantage of social background.Relatively low proportion of variation in mathematics literacy explained by differences in social background.
Australian education is of moderate equity in having, compared with other OECD countries:
29
Link between social background & achievement and school organisation:
Mathematical literacy – PISA 2003
30
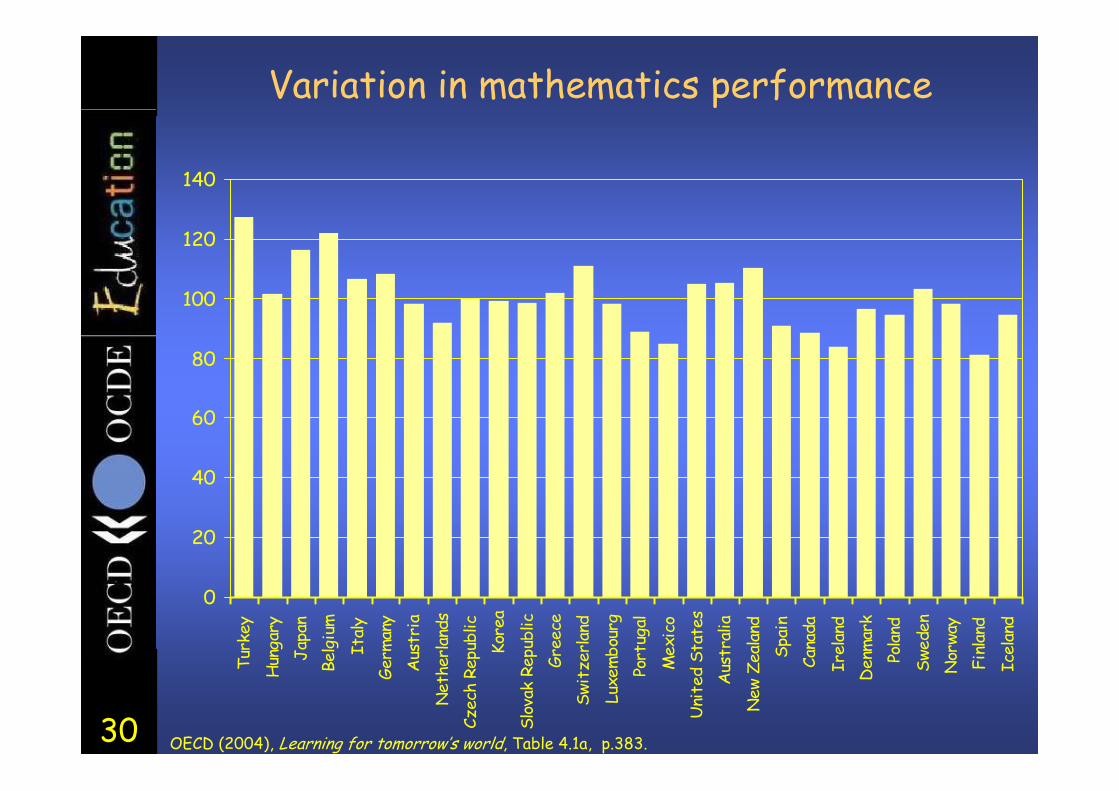
Variation in mathematics performance
0
20
40
60
80
100
120
140
Turk
ey
Hun
gary
Ja
pan
Belg
ium
Ital
y Ge
rman
y A
ustr
ia
Net
herl
ands
Cz
ech
Repu
blic
Ko
rea
Slov
ak R
epub
licGr
eece
Sw
itze
rlan
d
Luxe
mbo
urg
Port
ugal
Mex
ico
Uni
ted
Stat
es
Aus
tral
ia
New
Zea
land
Sp
ain
Cana
da
Irel
and
Den
mar
k Po
land
Swed
en
Nor
way
Finl
and
Icel
and
OECD (2004), Learning for tomorrow’s world, Table 4.1a, p.383.
31
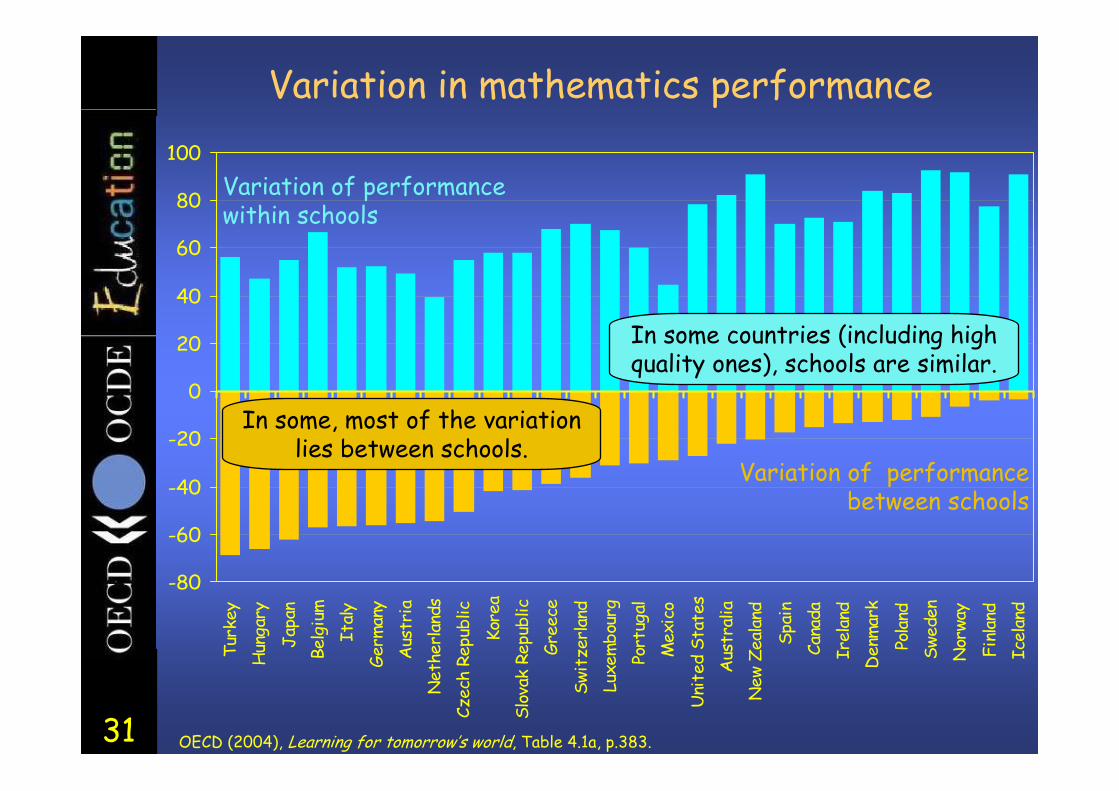
Variation in mathematics performance
-80
-60
-40
-20
0
20
40
60
80
100
Turk
ey
Hun
gary
Japa
n Be
lgiu
m
Ital
y
Germ
any
Aus
tria
N
ethe
rlan
ds
Czec
h Re
publ
ic
Kore
aSl
ovak
Rep
ublic
Gree
ce
Swit
zerl
and
Luxe
mbo
urg
Port
ugal
M
exic
o
Uni
ted
Stat
es
Aus
tral
ia
New
Zea
land
Spai
n Ca
nada
Ir
elan
d D
enm
ark
Pola
nd
Swed
en
Nor
way
Finl
and
Icel
and
Variation of performance between schools
Variation of performance within schools
OECD (2004), Learning for tomorrow’s world, Table 4.1a, p.383.
In some countries (including high quality ones), schools are similar.
In some, most of the variation lies between schools.
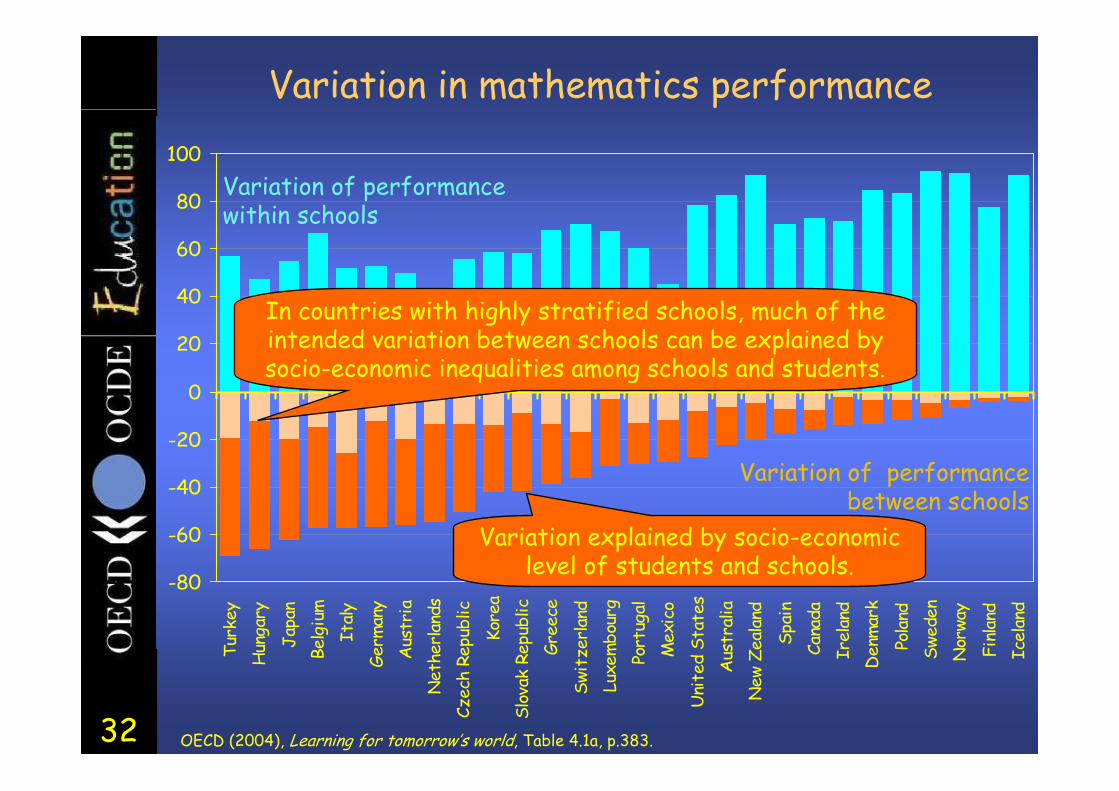
32
Variation in mathematics performance
-80
-60
-40
-20
0
20
40
60
80
100
Turk
ey
Hun
gary
Japa
n Be
lgiu
m
Ital
y
Germ
any
Aus
tria
N
ethe
rlan
ds
Czec
h Re
publ
ic
Kore
aSl
ovak
Rep
ublic
Gree
ce
Swit
zerl
and
Luxe
mbo
urg
Port
ugal
M
exic
o
Uni
ted
Stat
es
Aus
tral
ia
New
Zea
land
Spai
n Ca
nada
Ir
elan
d D
enm
ark
Pola
nd
Swed
en
Nor
way
Finl
and
Icel
and
OECD (2004), Learning for tomorrow’s world, Table 4.1a, p.383.
Variation explained by socio-economic level of students and schools.
Variation of performance within schools
Variation of performance between schools
In countries with highly stratified schools, much of the intended variation between schools can be explained by socio-economic inequalities among schools and students.
33
Apparent consequences ofgrouping students in schools:
Mathematical literacy – PISA 2003
34
250
375
500
625
750
-2.0 -1.5 -1.0 -0.5 0.0 0.5 1.0 1.5 2.0
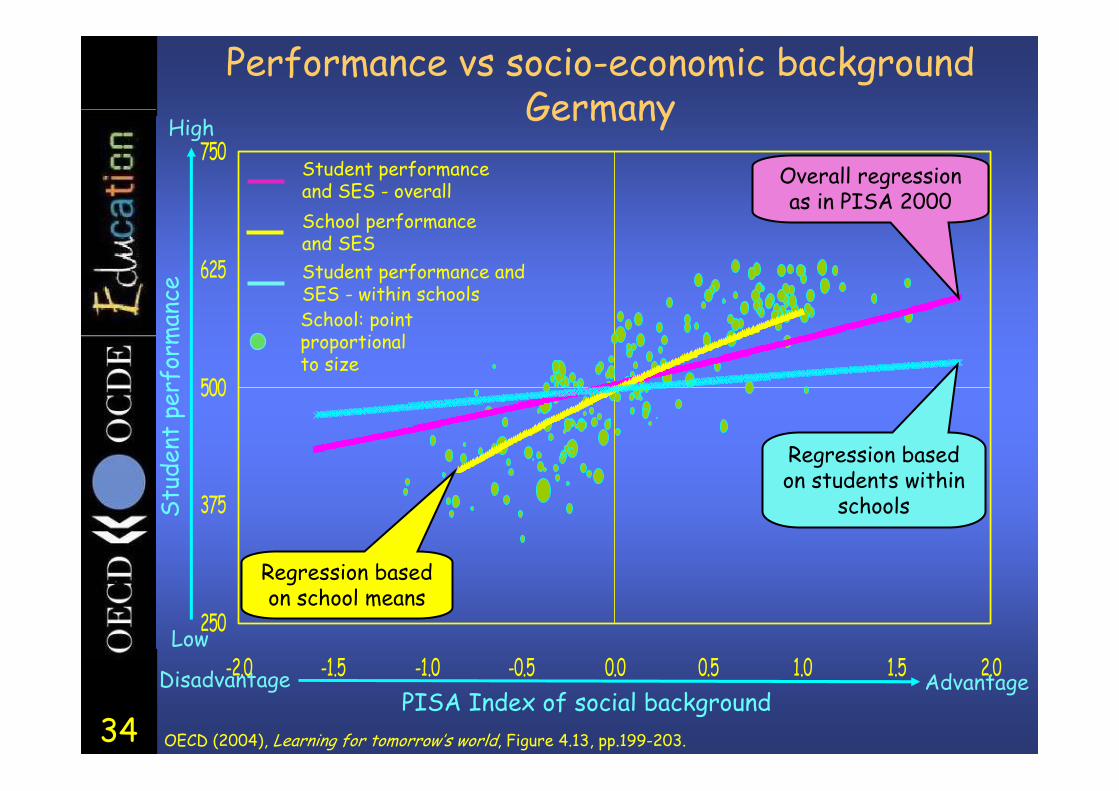
School: point proportional to size
Stud
ent
perf
orm
ance
AdvantagePISA Index of social background
Disadvantage
High
Low
OECD (2004), Learning for tomorrow’s world, Figure 4.13, pp.199-203.
Performance vs socio-economic backgroundGermany
Student performance and SES - overall
Student performance and SES - within schools
School performance and SES
Overall regression as in PISA 2000
Regression based on school means
Regression based on students within
schools
35
250
375
500
625
750
-2.0 -1.5 -1.0 -0.5 0.0 0.5 1.0 1.5 2.0
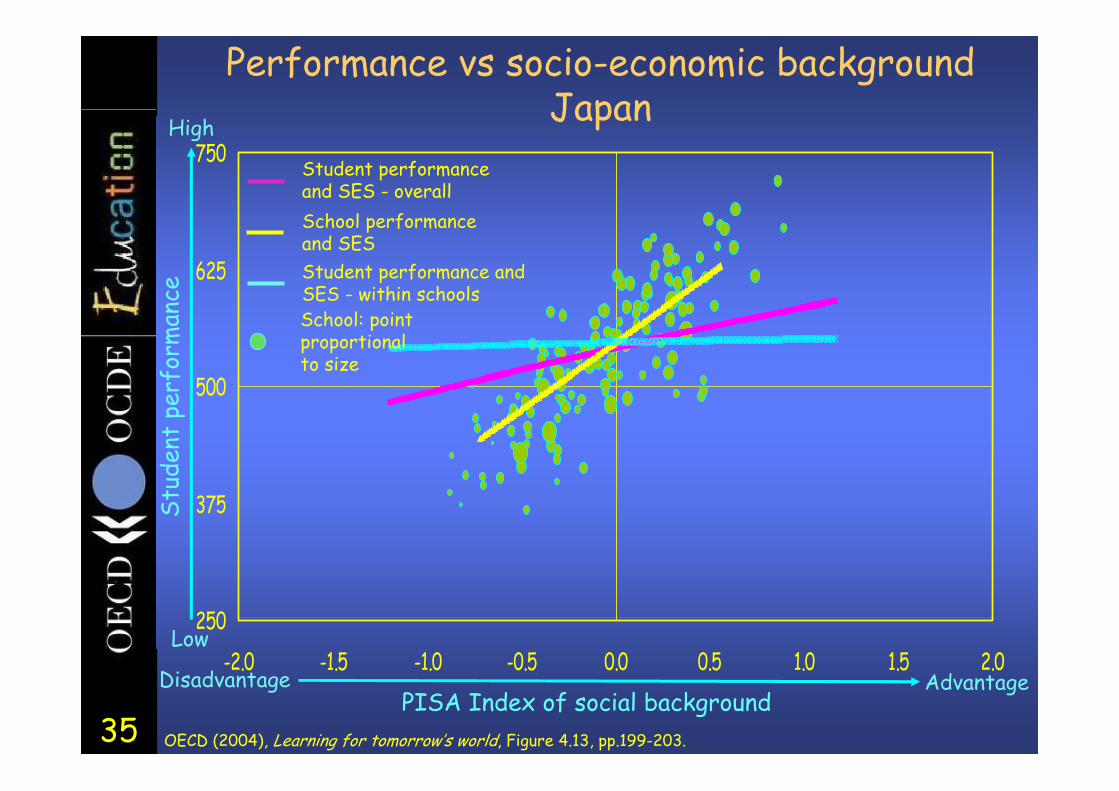
Performance vs socio-economic backgroundJapan
Stud
ent
perf
orm
ance
AdvantagePISA Index of social background
Disadvantage
High
Low
OECD (2004), Learning for tomorrow’s world, Figure 4.13, pp.199-203.
Student performance and SES - overall
Student performance and SES - within schools
School performance and SES
School: point proportional to size
36
250
375
500
625
750
-2.0 -1.5 -1.0 -0.5 0.0 0.5 1.0 1.5 2.0
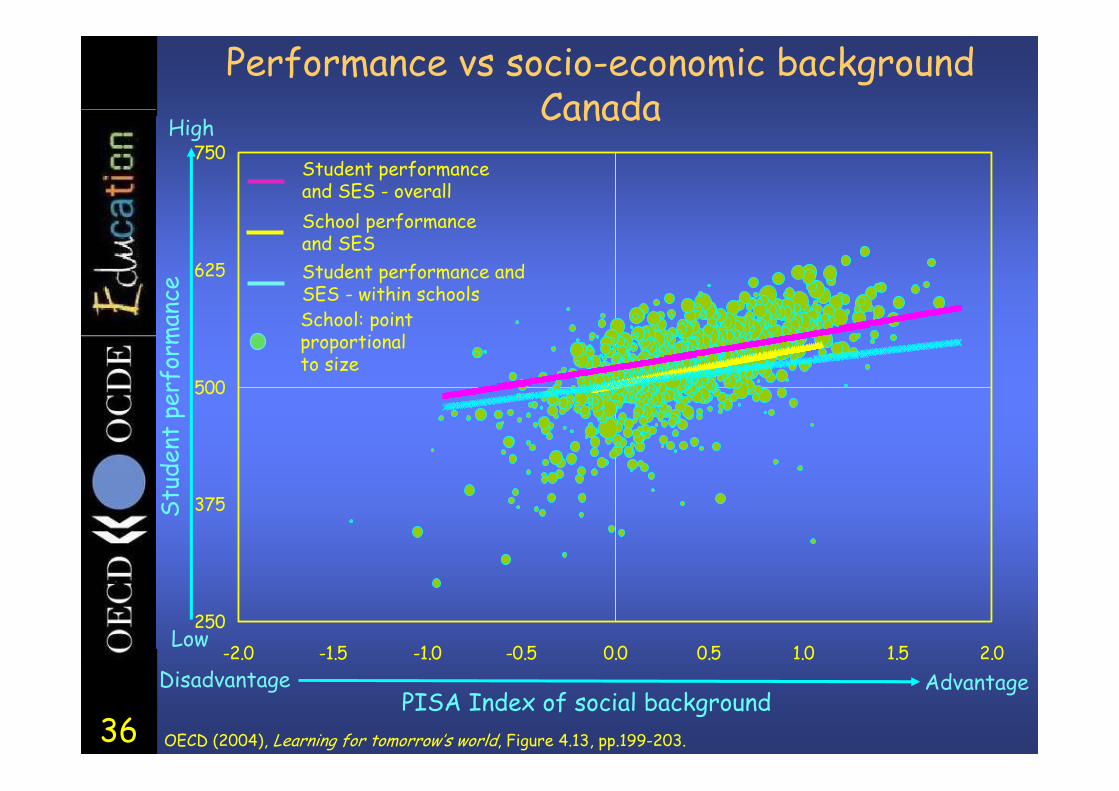
Performance vs socio-economic backgroundCanada
Stud
ent
perf
orm
ance
AdvantagePISA Index of social background
Disadvantage
High
Low
OECD (2004), Learning for tomorrow’s world, Figure 4.13, pp.199-203.
Student performance and SES - overall
Student performance and SES - within schools
School performance and SES
School: point proportional to size
37
250
375
500
625
750
-2.0 -1.5 -1.0 -0.5 0.0 0.5 1.0 1.5 2.0
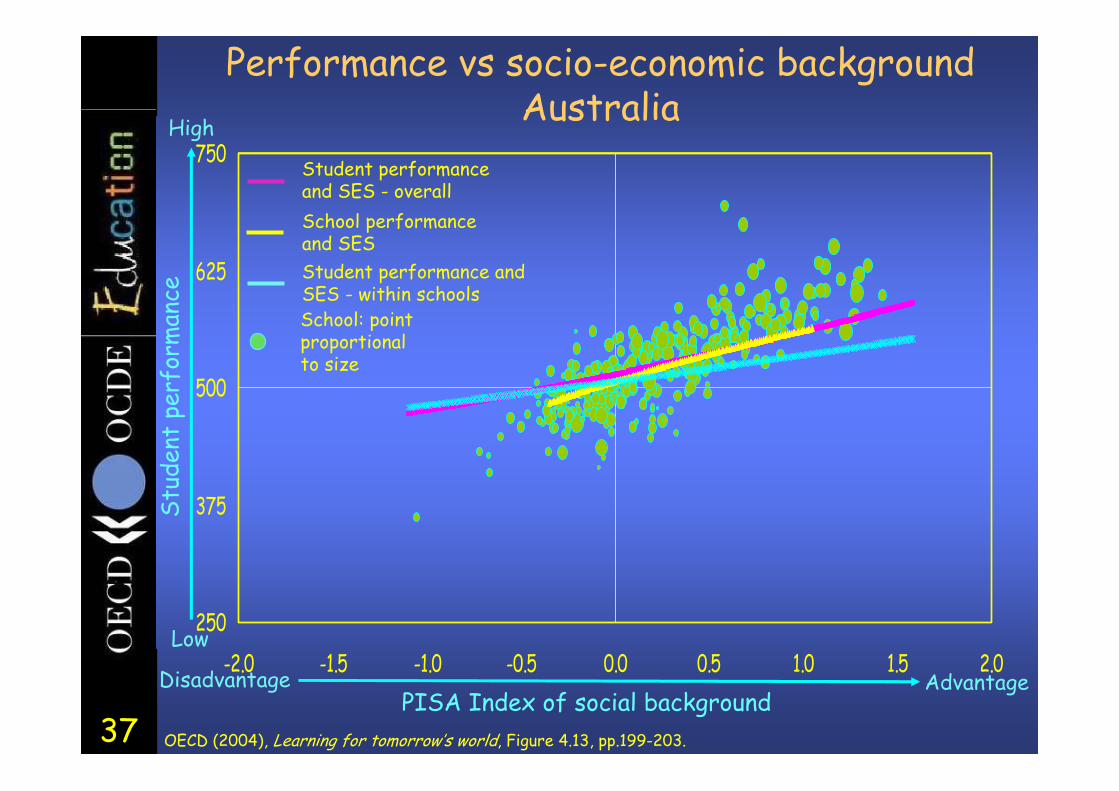
Performance vs socio-economic backgroundAustralia
Stud
ent
perf
orm
ance
AdvantagePISA Index of social background
Disadvantage
High
Low
OECD (2004), Learning for tomorrow’s world, Figure 4.13, pp.199-203.
Student performance and SES - overall
Student performance and SES - within schools
School performance and SES
School: point proportional to size
38
Less related to social background than in Japan or Germany.More related to social background than in Canada.Moderately equitable.
Grouping of Australian students into schools is:
PISA’s messages about equity and school organisation for Australia:mathematics literacy 2003.
39
Do the differences betweengovernment and non-government schools
create inequities?
40
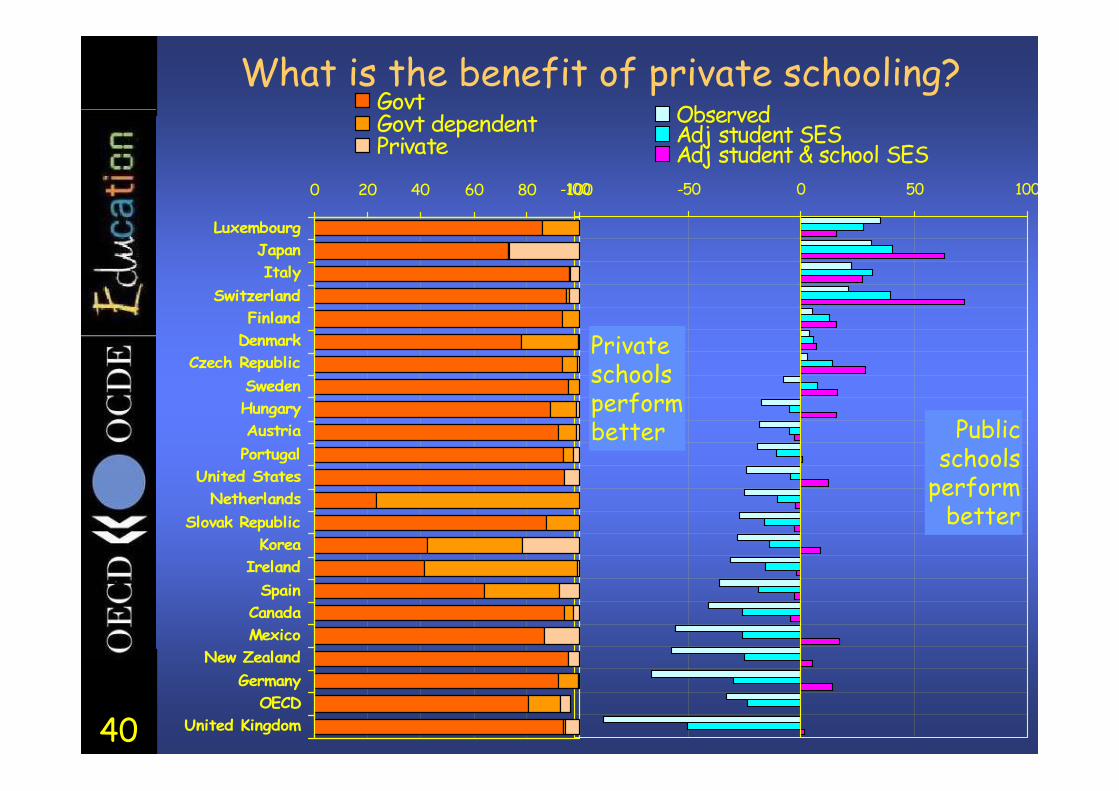
-100 -50 0 50 100
ObservedAdj student SESAdj student & school SES
0 20 40 60 80 100
LuxembourgJapanItaly
SwitzerlandFinland
DenmarkCzech Republic
SwedenHungaryAustriaPortugal
United StatesNetherlands
Slovak RepublicKorea
IrelandSpain
CanadaMexico
New ZealandGermany
OECDUnited Kingdom
GovtGovt dependentPrivate
Private schools perform better Public
schools perform
better
What is the benefit of private schooling?
41
None, because the identifiers of school type are suppressed in the PISA data by Australia.
PISA’s messages about government and non-government schooling for Australia.
42
Further informationWebsites
OECD work on education: www.oecd.org/eduOECD/PISA: www.pisa.oecd.org
– All national and international publications– Complete micro-level database
Staff contacts at [email protected]@[email protected]