Embed Size (px)
Citation preview

The Journal of Neuroscience, January 1991, 7 f(1): 11 l-l 22
Acetylcholine Release from the Rabbit Retina Mediated by Kainate Receptors
David M. Linn,’ Christine Blazynski,* Dianna A. Redburn, and Stephen C. Massey’
Sensory Sciences Center, Graduate School of Biomedical Sciences, University of Texas Health Science Center, Houston, Texas 77030, 2Department of Biochemistry and Molecular Biophysics, Washington University School of Medicine, St. Louis, Missouri 63110, and 3Deoartment of Neurobiology and Anatomy, University of Texas Medical School, Houston,.Texas 77225
The cholinergic amacrine cells of the rabbit retina may be labeled with 3H-choline (3H-Ch), and the activity of the cho- linergic population may be monitored by following the re- lease of H-ACh. Glutamate analogs caused massive ACh release, up to 50 times the basal efflux, with the following rank order of potency: a-amino-3-hydroxy-5-methyl-4-isox- azolepropionic acid (AMPA) > quisqualate (QQ) = kainate (KA) z+ NMDA (in magnesium-free medium) B glutamate > aspartate. In contrast, the release of 3H-Ch was unchanged. Submaximal doses of each agonist were used to establish the specifity of glutamate antagonists. Kynurenic acid was selective for KA B QQ, and 6,7-dinitroquinoxaline-2,3-dione (DNQX) was selective for KA > QQ B NMDA. At low doses, which selectively blocked the response to KA, both antag- onists blocked the light-evoked release of ACh. These re- sults suggest that ACh release may be produced via several glutamate receptors, but the physiological input to the cho- linergic amacrine cells is mediated by KA receptors. Be- cause these cells receive direct input from cone bipolar cells, this work supports previous evidence that the bipolar cell transmitter is glutamate.
Glutamate is widely regarded as the major excitatory neuro- transmitter in the CNS, including the retina. Much like other neurotransmitters, glutamate activates a variety of postsynaptic receptors (Mayer and Westbrook, 1987; Monaghan et al., 1989), which have all been found in the retina (Miller and Slaughter, 1986; Massey, 1990). Four of these receptors, apparently as- sociated with different postsynaptic ion channels, have been classified according to their affinities for the glutamate agonists kainate (KA), quisqualate (QQ), NMDA, and 2-amino-4-phos- phonobutyrate (APB; Foster and Fagg, 1984). Very specific NMDA antagonists and relatively selective KA antagonists are available, and by using these experimental tools, we have tried to identify the excitatory input to a well-described population of cholinergic amacrine cells in the retina.
The vertebrate retina is a layered structure, and in the outer retina, photoreceptors release glutamate and make sign-con- serving synapses with horizontal cells and OFF bipolar cells via
Received Mar. 29, 1990; revised Aug. 30, 1990; accepted Sept. 5, 1990. This work was supported by National Eye Institute Grant EY-065 15 and Texas
Higher Education Coordinating Board Grant 1953. We wish to thank Dr. Robert Marc for discussion.
Correspondence should be addressed to Stephen C. Massey, Sensory Sciences Center, UTHSC, 6420 Lamar Fleming Avenue, Houston, TX 77030. Copyright 0 199 1 Society for Neuroscience 0270-647419 l/O 10 I 1 I- 12$03.00/O
KA or QQ receptors (Slaughter and Miller, 1983a,b; Copen- hagen and Jahr, 1989). In contrast, the sign-inverting input to ON bipolar cells is mediated by APB receptors (Shiells et al., 198 1; Slaughter and Miller, 198 1, 1985). In fact, APB is a spe- cific agonist at this site, which underlies the separation of ON and OFF responses throughout the visual system. Although KA, QQ, and APB receptors have been found in the outer retina, NMDA receptors appear to be rare or absent. NMDA and NMDA antagonists have little or no effect on second-order neu- rons of most species, including the rabbit (Shiells et al., 198 1; Lasater and Dowling, 1982; Slaughter and Miller, 1983b; Las- ater et al., 1984; Massey and Miller, 1987; O’Dell and Chris- tensen, 1989).
Visual information is transmitted from photoreceptors to the inner retina via ON and OFF bipolar cells, excitatory neurons that are strongly immunoreactive for glutamate (Ehinger et al., 1988; Marc et al., 1989). In the inner retina, bipolar cells synapse with amacrine and ganglion cells, and at these synapses, glu- tamate receptors are abundant. However, in contrast to the outer retina, APB receptors are absent, and most third-order neurons are excited by NMDA as well as KA and QQ (Slaughter and Miller, 1983b; Bloomfield and Dowling, 1985b; Lukasiewicz and McReynolds, 1985; Coleman et al., 1986; Aizenman et al., 1988; Massey and Miller, 1988, 1990; Coleman and Miller, 1989). Consistent with the role of glutamate as the bipolar cell transmitter, the physiological responses of amacrine and gan- glion cells are blocked by glutamate antagonists (Slaughter and Miller, 1983~; Coleman et al., 1986; Massey and Miller, 1988).
The choline@ neurons of the rabbit retina have been iden- tified as amacrine cells and displaced amacrine cells located on either side of the inner plexiform layer in almost equal numbers (Masland and Mills, 1979; Tauchi and Masland, 1984; Vaney, 1984). Also know as starburst amacrine cells on account of their unique morphology (Famiglietti, 1983a), they are narrowly uni- stratified with a large overlap, so the dendrites of each group form a dense meshwork in the inner plexiform layer (Tauchi and Masland, 1985). Both groups receive direct input from cone bipolar cells (Famiglietti, 1983b; Brandon, 1987). Although oth- er cells with high membrane turnover, such as photoreceptors, also take up choline, the cholinergic amacrine cells are the only ones to synthesize the neurotransmitter ACh (Masland and Mills, 1979).
In response to a flashing stimulus, the cholinergic amacrine cells release ACh (Masland and Livingstone, 1976; Massey and Neal, 1979; Massey and Redburn, 1982; Masland et al., 1984; O’Malley and Masland, 1989). This provides a method to look
112 Linn et al. l ACh Release Mediated by KA Receptors
at the inputs to this system based on the premise that physio- logically evoked transmitter release reflects the summed activity of the cholinergic population. Previous work has shown that glutamate analogs stimulate ACh release from the rabbit retina (Cunningham and Neal, 1985) and this is consistent with the release of an excitatory amino acid from bipolar cells. However, Cunningham and Neal (1985) also found that the pharmacology of glutamate receptors associated with ACh release was sub- stantially different from other systems. They concluded that glutamate and aspartate act at QQ receptors, but that the en- dogenous transmitter may be an unknown glutamate analog acting at a KA receptor. Most recently, L-homocysteic acid (L-
HCA) has been proposed as a bipolar cell transmitter in the rabbit retina (Neal and Cunningham, 1989).
In the present study, we determined the effective dose for glutamate analogs on ACh release and then tested equivalent doses of agonist against known glutamate antagonists. Once the pharmacological profile was established, each antagonist was tested against the light-evoked release of ACh. Fortunately, in the last few years, several new glutamate antagonists have been developed with greater potency and specificity. Kynurenic acid (Kyn) and cis-2,3-piperidine dicarboxylic acid (PDA) are gen- eral glutamate antagonists that have previously been used in the rabbit and mudpuppy retina (Slaughter and Miller, 1983a,c; Coleman et al., 1986; Massey and Miller, 1987, 1988). Kyn blocks the action of NMDA at the allosteric glycine site (Birch et al., 1988) but also has some selectivity for KA over QQ (Coleman et al., 1986; Perouansky and Grantyn, 1989). The quinoxalinediones 6-cyano-7-nitroquinoxaline-2,3-dione (CNQX) and 6-7-dinitroquinoxaline-2,3-dione (DNQX) are more potent and show selectivity for KA and QQ receptors over NMDA receptors (Honor6 et al., 1988; Yamada et al., 1989). Using these pharmacological tools, our results suggest that the physiological input to cholinergic amacrine cells is mediated by KA receptors. This is consistent with previous evidence that suggests that the bipolar cell neurotransmitter is glutamate.
Materials and Methods Preparation. The continuous perfusion system for the rabbit eyecup used in these experiments has previously been described in detail (Mas- sey and Redbum, 1982). Briefly, New Zealand white rabbits of either sex (1.5-2.5 kg) were deeply anesthetized with urethane (loading dose, 1.5 gm/kg, i.p.), and the orbit was infused with Xylocaine (2%). A tracheal cannula was inserted to ensure a clear airway, and body tem- perature was maintained at 37°C by a thermostatically controlled heated water blanket. A support ring was attached to the eye, and the cornea, lens, and vitreous were removed, leaving an eyecup lined by the retina. The remainder of each experiment was conducted under dim red light.
Cholinereic neurons were labeled for 30 min with 20 &i of ‘H-choline OH-Ch; SO-&/mmol; New England Nuclear) that was evaporated to dryness and redissolved in a small volume of choline-free Krebs’ so- lution (Ames and Nesbett, 1981). During the incubation period, the retina was stimulated with ~-HZ flashing light to maximize choline uptake (Masland and Livingstone, 1976). The preparation was then flushed with Krebs’ solution before superfusion cannulae, and a tem- perature probe were lowered into the eyecup. Perfusion solution was pumped (Sage Instruments, 375A) at 1.5 ml/min through an in-line heater and maintained at 37°C. Background radioactivity was reduced by washing via the perfusion system for 60-90 min, during which time, the retina was allowed to dark adapt. Subsequently, I-min fractions were collected directly into vials and prepared for liquid scintillation countine (Packard CAl900) bv the addition of 2 ml Pica-Fluor- (Packard).. Light stimulation was produced by a LED placed close to the eye, which provided a bright photopic flash of 100 msec duration at 3 Hz. Test solutions were applied to the retina in I-min pulses by switching from control Krebs’ to the test solution by means of a 6-way valve. Platinum electrodes were used to record the electroretinogram
(ERG) throughout each experiment; a b-wave amplitude of 100 PV was taken to indicate a healthy, functional retina.
Solutions. The composition of the Krebs’ bicarbonate medium used throughout these experiments was modified from Ames and Nesbett (1981). It consisted of NaCl (118 mM), NaHCO, (25 mM), KC1 (4.7 mM), CaCl, (2.5 mM), MgSO, (1.2 mM), KH,PO, (1.2 mM), glucose (11.1 mM), and an aliquot of previously prepared choline-free amino acid vitamin concentrate. The Krebs’ solution was freshly prepared and ox- ygenated with 95% 0, and 5% CO, to pH 7.4. An anticholinesterase, k~erine sulfate (Sigma; 30 ELM), was present at all times except for the labeline ueriod of 30 min. CNOX and DNOX were obtained from CambGdge Research Biochemicais, Tocris Neuramin, or as a gift from Dr. T. Honor&, whom we thank for collaboration. All other drugs and reagents were obtained from commercial sources.
ACh analysis. To examine the composition of released radioactivity, ‘H-ACh was separated from ‘H-choline by a modified enzymatic meth- od (Shea and Aprison, 1973; Johnson and Pilar, 1980). Each sample was acidified with HCI in the collection vial to stabilize ACh, and then choline was phosphorylated with a choline kinase solution. ACh was complexed by the addition of tetraphenylboron, and a toluene-based fluor was added to the vial, forming a 2-phase system. Most of the ACh (90%) was extracted into the organic phase and counted, but the choline phosphate remained in the aqueous phase and was not counted. A correction was applied for ACh not extracted, and the crossover of choline from the aqueous stage to the organic phase (l-2%) was esti- mated by adding a known amount of 14C-choline.
Data analysis. Data from the counter in the form of DPMs were plotted as release curves versus the fraction number. There are 2 effects that distort the results when handled this way: (1) The release curve is exponential, so, even aher a prolonged wash, the baseline declines steadily throughout the experiment. Therefore, responses were quantified rela- tive to the background by dividing the peak-evoked release by the basal efflux, taken as the average baseline 5 min before drug application. For a repeated drug dose, this ratio remained relatively constant throughout an experiment. (2) The depletion of a finite pool of labeled transmitter leads to smaller responses later in the experiment. This is especially true with glutamate agonists that cause massive ACh release. Therefore, a minimum number of agonist controls were performed, usually at the end of an experiment, and test doses were always compared with a nearby control.
Semilog dose-response curves were constructed by combining data from different experiments. Peak : base ratios for each experiment were normalized to the maximum response for a saturating dose, taken as 1. Agonist dose-response curves were derived from the equation V/V,,, = [agonist]n/(ED,,n + [agonistIn), and antagonist-blockade curves were fitted to the equation V/V,,,,, = [antagonist]‘Y(IC,,” + [antagonist]‘), where V is the response, V,,, is the maximum response normalized to 1, ED,, is the dose of agonist producing half of the maximal response, IC,, isthe dose of antagonist reducing the response by half, and n is the Hill coefficient. No sienificance is attached to the Hill coefficients, which ranged from 2 to 3:as might be expected for a nonlinear system such as transmitter release. We used ASYSTANT+ (Macmillan Software Co., 1986) for least-squares nonlinear curve fitting and the ED,, and IC,, calculations.
Results Glutamate agonists After 60-90 min of perfusion, to reduce the background radio- activity to a steady level, the retina was stimulated with light to ensure that physiological ACh release could be obtained. The preparation was taken as functional if 2 comparable peaks of at least twice the basal efflux were obtained in response to 4-min periods of flashing light at 3 Hz.
The first goal of these experiments was to establish the effec- tive range for each glutamate analog. To minimize the well- known excitotoxic effects of these compounds, increasing doses were applied briefly for periods of 1 min until saturation was obtained at approximately 25-30 times the basal efflux. cu-Ami- no-3-hydroxy-S-methyl-4-isoxazolepropionicacid (AMPA), QQ, and KA (Fig. 1) were the most potent ACh-releasing compounds with threshold doses of 1, 2, and 5 I.LM and ED,,s of 6.2, 10.3,

FRACT I ON NUMBER Figure 1. Release of ACh from rabbit retina in response to increasing series of KA (top) or QQ (bottom) concentrations. In this and all other figures, release data in DPMs were plotted against the fraction number. One-minute fractions were collected, and glutamate analogs were ap- plied for 1 min. The numbers indicate the concentration ofagonist (PM),
and asterisks indicate light stimulation at 3 Hz for 4 min.
The Journal of Neuroscience, January 1991, 7 f(1) 113
and 12.4 PM, respectively (Fig. 2). In normal magnesium (1.2 mM), the release of ACh in response to perfusion with NMDA was completely blocked (see also Linn and Massey, 199 1). How- ever, in magnesium-free medium, NMDA was a moderately potent agonist, with a threshold of 50 /.bM and an ED,, of 112 KM.
The endogenous amino acids glutamate and aspartate were much less potent, with threshold doses of 2 mM and ED,,s of 5.0 mM and 5.8 mM, respectively. In addition, glutamate and aspartate consistently released less ACh at saturation (maxi- mum, 12-l 5 times the basal efflux) than the glutamate analogs described above. Two other putative transmitters were tested for their effects on ACh release: N-acetylaspartylglutamate (NAAG) had no effect up to a concentration of 20 mM with or without magnesium. L-HCA was a weak NMDA agonist (ED,,, approximately 300 PM) because it was most effective in mag- nesium-free medium. In normal medium, L-HCA produced a smaller response, which suggests a non-NMDA component.
ACh analysis
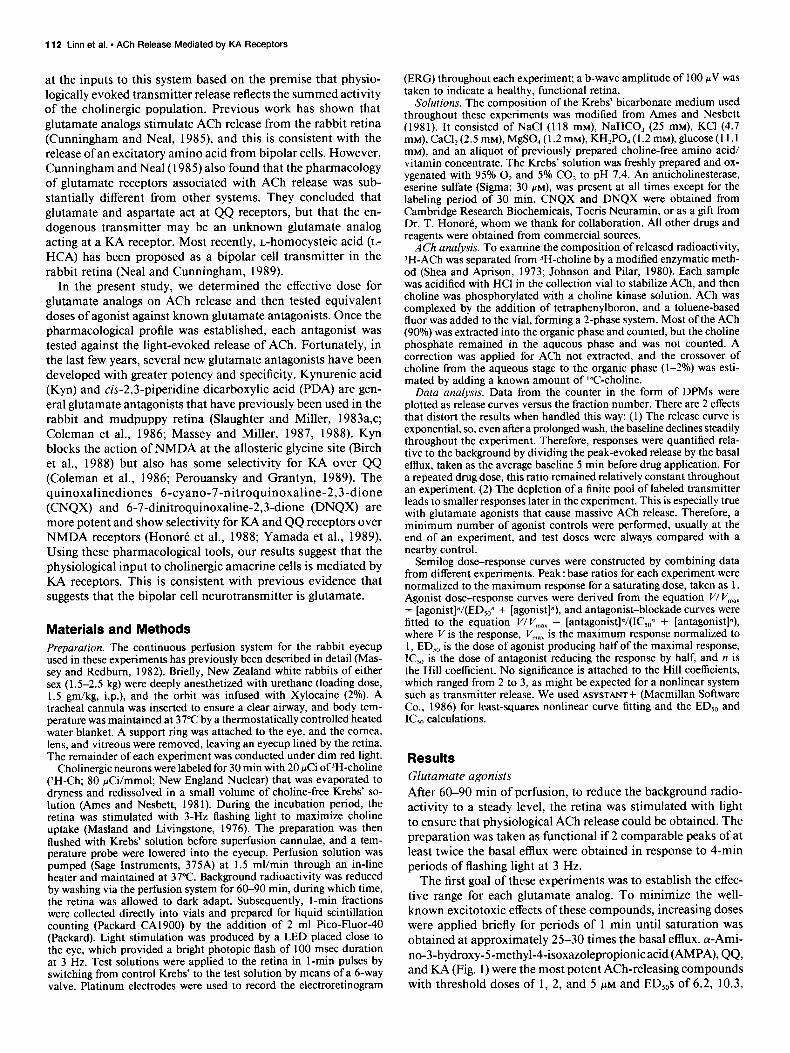
Previous work has shown that ACh accounts for essentially all the radioactivity released from the retina in response to light (Masland and Livingstone, 1976; Massey and Neal, 1979; Mas- sey and Redbum, 1982). Because the release of radioactivity by glutamate analogs was so large, we wondered if choline or other labeled metabolites were released, perhaps by cell lysis. How- ever, the analysis shown in Figure 3 shows that more than 90% of the radioactivity released by KA, QQ, and NMDA could be identified as 3H-ACh. The release of 3H-Ch was essentially un- changed by light or perfusion with glutamate analogs. Therefore, in the following experiments, we have taken increments in the release of total radioactivity to indicate the release of ACh from cholinergic amacrine cells. Approximately half the basal efflux is accounted for by 3H-Ch, so the real peak: base ratio for )H- ACh release should be doubled. For example, in Figure 3, 15 WM KA caused a 17-fold increase in the release of total radio-
l-
x ‘8-
F .6- Figure 2. Semilog dose-response curves for glutamate agonists on release
< .4- of ACh from rabbit retina. V,,, for AMPA, QQ, KA, and NMDA was a peak : base ratio of 25-30, and for glu- tamate and aspartate, 12-15. Vertical
> .2- bars indicate SEM; where not shown, they are smaller than the symbol. The NMDA curve was derived in magnesi- urn-free medium. ED,,+: AMPA, 6.2
O- PM; QQ, 10.3 /AM; KA, 12.4 PM; NMDA, 112 FM; glutamate, 5.0 mM; aspartate,
I ’ I I I I 1 I I I I I 1 I I 1 I I 1 5.8 mM. KA was just significantly dif-
- 1 0 1 2 3 4 5 ferentthanQQ(x2=4.11,df= l,p< 0.05). KA and QQ were both signifi- cantly different than AMPA (x2 = 11.43, df = 1, p < 0.01; x2 = 8.53, df = I, p < 0.0 1). Glutamate and aspartate were LOG CONC ENTRAT I ON ( UM ) notsignificantlydifferent.
114 Linn et al. * ACh Release Mediated by KA Receptors
A TOTAL B 75
KA
3H-CH C 3 H-ACH 75
50
25
1 KA
FRACTION NUMBER Figure 3. ACh accounts for all radioactivity released from rabbit retina in response to glutamate agonists. Half of each sample was counted normally, and ACh was extracted from the remainder and counted as described in Materials and Methods. This experiment was conducted in magnesium-free medium to promote a response to NMDA. A, Total radioactivity released in response to light stimulation (asterisks; 4 min, 3 Hz) and KA (15 PM), QQ (15 PM), and NMDA (300 PM). all applied for 1 min. Although the doses of glutamate agonists are roughly equivalent, it is quite normal for the peak size to decrease through the experiment. This probably reflects the depletion of a finite transmitter pool. B, Choline released in response to the same stimuli as in A. This curve was obtained by subtracting ACh from the total counts (i.e., A - C). C, The release of ACh in response to light stimulation and glutamate agonists. By measuring the area under each peak, we showed that ACh accounts for more than 90% of the stimulus-evoked release, but the release of choline was almost unchanged. This indicates that the source of the release is from choline@ amacrine cells.
30
20
IO
FRACTION 25 5o 75 IO0 125
NUMBER Co” 2nM
activity. Perfusate analysis shows this actually represents a 39- fold increase in the release of 3H-ACh.
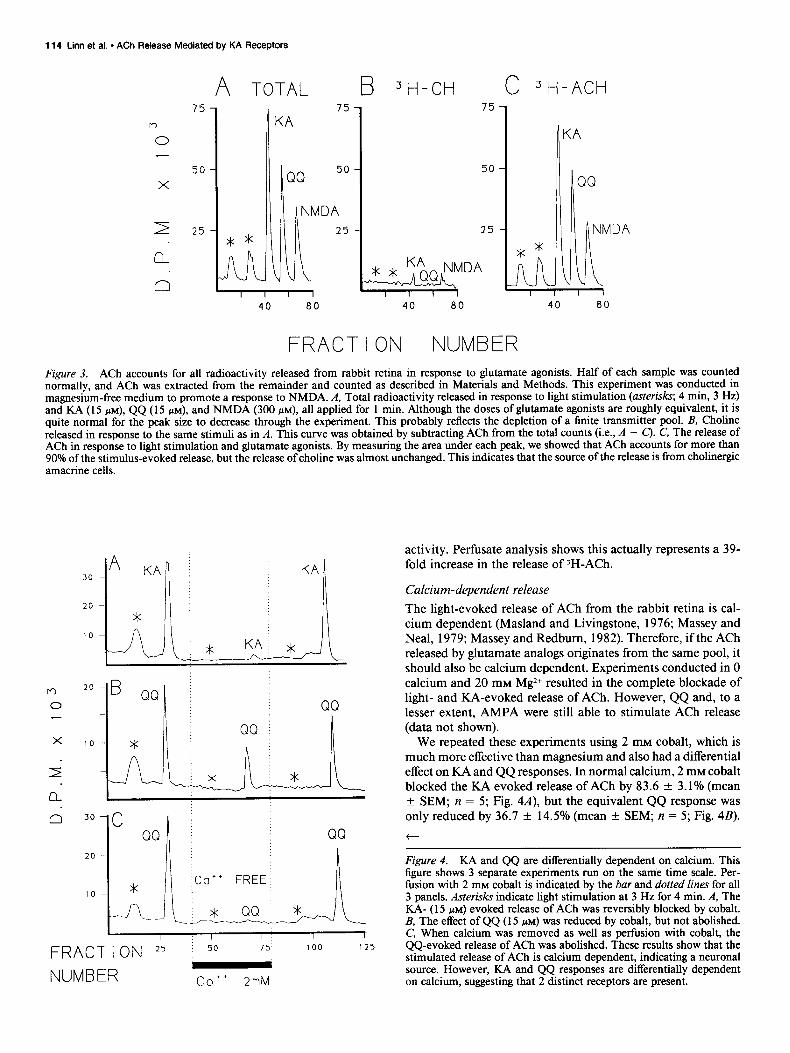
Calcium-dependent release The light-evoked release of ACh from the rabbit retina is cal- cium dependent (Masland and Livingstone, 1976; Massey and Neal, 1979; Massey and Redbum, 1982). Therefore, if the ACh released by glutamate analogs originates from the same pool, it should also be calcium dependent. Experiments conducted in 0 calcium and 20 mM Mg2+ resulted in the complete blockade of light- and KA-evoked release of ACh. However, QQ and, to a lesser extent, AMPA were still able to stimulate ACh release (data not shown).
We repeated these experiments using 2 mM cobalt, which is much more effective than magnesium and also had a differential effect on KA and QQ responses. In normal calcium, 2 mM cobalt blocked the KA evoked release of ACh by 83.6 + 3.1% (mean f SEM; n = 5; Fig. 4A), but the equivalent QQ response was only reduced by 36.7 f 14.5% (mean f SEM; n = 5; Fig. 4B).
t
Figure 4. KA and QQ are differentially dependent on calcium. This figure shows 3 separate experiments run on the same time scale. Per- fusion with 2 mM cobalt is indicated by the bar and dotted lines for all 3 panels. Asterisks indicate light stimulation at 3 Hz for 4 min. A, The KA- (15 PM) evoked release of ACh was reversibly blocked by cobalt. B, The effect of QQ (15 PM) was reduced by cobalt, but not abolished. C, When calcium was removed as well as perfusion with cobalt, the QQ-evoked release of ACh was abolished. These results show that the stimulated release of ACh is calcium dependent, indicating a neuronal source. However, KA and QQ responses are differentially dependent on calcium, suggesting that 2 distinct receptors are present.

The Journal of Neuroscience, January 1991, 77(l) 115
KA 15uM
QQ 15uM
FRACTION 50 ; 250
NUMBER CONCENTRATION
The QQ-evoked release of ACh was blocked by cobalt when calcium was omitted (72.2 & 8.5%, mean f SEM; n = 6; Fig. 4C). Thus, the release of ACh by glutamate analogs appears to be calcium dependent, consistent with release from a neuronal source. However, these results demonstrate that KA and QQ responses can be separated in this preparation, suggesting the possibility of 2 distinct receptors. The profile of the light-evoked release of ACh most closely resembles that of KA.
Antagonists PDA was the first general glutamate antagonist available. As previously reported (Cunningham and Neal, 1985), PDA (5 mM) reversibly blocked the light-evoked and KA-evoked release of ACh from the rabbit retina. Because more potent and specific antagonists are now available, we did not test PDA against other glutamate analogs.
Kynurenic acid Kyn is another general glutamate antagonist that is more potent than PDA and has previously been used in the retina (Coleman et al., 1986; Massey and Miller, 1987, 1988). To obtain maxi- mum specificity from the available glutamate antagonists, we tried to identify the optimal concentration for each one. There- fore, we tested equivalent submaximal doses of glutamate ag- onists against an increasing staircase of antagonist concentra- tions. Figure 5 shows a typical experiment testing Kyn against KA- and QQ-evoked release of ACh. The first 2 peaks were produced by light stimulation to show that the preparation was functional, and then control peaks were obtained in response to perfusion for 1 min with equivalent doses of KA (15 KM) and QQ (15 MM). Increasing steps of Kyn decreased the IL&evoked release of ACh relative to the QQ response until, at 1 mM Kyn, the KA response was abolished but the QQ response was only reduced by half. After washout, full recovery was obtained, and the final KA and QQ peaks were almost identical. This exper- iment shows that Kyn is a reversible KA antagonist and suggests that Kyn may be used to separate KA and QQ responses.
Figure 5. Dose and specificity of Kyn versus KA- and QQ-evoked release of ACh. Equivalent submaximal doses of KA and QQ were applied for 1 min in paired stimuli against an increasing staircase of Kyn, shown by the bars and dotted lines. The first KA control peak was unusually large, followed by a sharp drop in the baseline, often seen with the first major peak, but the peak : base ra- tios for the KA and QQ controls were almost the same (15.2 and 14.6, re- spectively). By 500 ELM Kyn, only a trace of the KA peak remained, and by 1 mM Kyn, the KA response was abolished, but the peak : base ratio for QQ was 7, approximately half the control re- sponse. To compensate for the normal rundown in this long experiment, it is important to compare the last peaks in Kyn to the final controls. After washing out the Kyn, KA and QQ elicited sim- ilar control responses (peak: base ra- tios, 14.0 and 13.8, respectively). This experiment shows that Kyn can be used to separate KA and QQ responses in the rabbit retina.
From experiments such as this, data were gathered to produce the antagonist curves for Kyn shown in Figure 6. Kyn was tested against equipotent and submaximal doses of each glutamate analog, KA (15 FM), QQ (15 PM), and AMPA (8 PM). The QQ and AMPA curves were similar, but KA was much more sen- sitive to Kyn. The following IC,, values for Kyn were derived: versus KA, 142 PM; versus AMPA, 76 1 FM; versus QQ, 1.4 mM. Thus, the KA and QQ curves were separated by 1 log unit, and 1 mM Kyn may be used to differentiate between them.
Kyn blocked the light-evoked release of ACh and the KA response over the same range, from threshold at 100 I.LM to a complete block at 1 mM. A self-contained experiment is shown in Figure 7. In the first half of this experiment, Kyn (1 mM) reversibly abolished the light-evoked release of ACh and caused a 50% drop in the basal efflux attributable to the block of spon- taneous ACh release. This implies that both the light-evoked release and the spontaneous release are synaptically driven. In the second half, the pharmacological specificity of Kyn was tested against equivalent, submaximal doses of glutamate ag- onists. Kyn (1 mM) abolished the KA (15 PM) response, but the responses to QQ (15 MM) and AMPA (8 FM) were only reduced by 30% and 70%, respectively. After washout, similar peaks were obtained for KA, QQ, and AMPA. This experiment shows that Kyn reversibly blocks the light-evoked release of ACh, at a dose that selectively blocks the KA-evoked release of ACh.
Quinoxalinediones The quinoxalinediones DNQX and CNQX have been reported as “non-NMDA” antagonists in several systems. Our goal was to characterize the pharmacological profile of these compounds in the rabbit retina so they could be used to distinguish between different glutamate receptors. We obtained similar results with either compound, but DNQX was used in most experiments because the IO-rn~ stock solution appeared to be more stable.
Figure 8 shows an experiment designed to test equivalent doses of NMDA and KA against an increasing staircase of DNQX concentrations. After the initial light-evoked peaks to confirm

116 Linn et al. l ACh Release Mediated by KA Receptors
Figure 6. Semilog dose-response curves for KA, QQ, and AMPA versus Kyn. The data were derived from ex- periments such as that shown in Figure 5, where increasing doses of antagonist were tested against fixed submaximal doses of KA ( 15 PM), QQ ( 15 PM), and AMPA (8 PM). Vertical bars indicate SEM; where not shown, they are small- er than the symbol. The KA and QQ curves are separated by 1 log unit, in- dicating that Kyn is a relatively selec-
0 1 I I / I I 1 I I 1
1 2 3 4
tive KA antagonist. From these curves, we chose a concentration of 1 mM as a working dose for Kyn. At this concen- KYNURENATE CONCENTRATION tration, KA responses were eliminated, but QQ and AMPA responses were only reduced by half. (LOG uM)
retinal viability, control peaks of ACh release were obtained with submaximal doses of NMDA (300 PM) and KA (15 PM).
As the concentration of DNQX was increased, the KA-evoked release of ACh was selectively reduced until, at 5 PM DNQX, it was completely abolished, though NMDA still evoked a 15- fold increase over the base release. After washout, the final control responses to KA and NMDA were almost the same size. This experiment indicates that low concentrations of DNQX
Figure 7. Kyn: effect on light-evoked release of ACh and pharmacological specificity. In the first half of this ex- periment, Kyn (1 mM indicated by the solid bar and dotted lines) was tested against the light-evoked release of ACh (asterisks). The mean peak: base ratio for the first pair of light peaks was 3.4, and 3.6 for the second control pair. In between, Kyn caused a 50% drop in the basal efflux, which probably represents the blockade of spontaneous ACh re- lease superimposed on the release of Ch. The light-evoked release of ACh was completely abolished by 1 mM Kyn. In the second half of this experiment, Kyn blocked the KA (15 PM) response, but QQ (15 PM) and AMPA (8 PM) caused an 8.3- and 3.7-fold increase, respec- tively. After washout, KA, QQ, and AMPA elicited similar control re- sponses and peak: base ratios of 9.6, 11.8, and 12.2, respectively. Compar- ing the peaks in Kyn to the controls indicates that KA, QQ, and AMPA were inhibited by 10096, 3096, and 70%, re- spectively. These results show that Kyn reversibly blocked the light-evoked re- lease of ACh, and in the same experi- ment, Kyn was shown to be a relatively selective KA antagonist.
30
n 0 20
X
r
a
n IO
selectively blocked the KA- but not the NMDA-evoked release of ACh.
From a series of experiments like this, DNQX was tested against submaximal doses of KA (15 PM), QQ (15 PM), AMPA (8 KM), and NMDA (300 PM). Then, the data were normalized, and the antagonist curves in Figure 9 were derived, yielding the following IC,, values for DNQX: versus LA, 1.2 PM; versus QQ, 2.3 PM; versus AMPA, 4.0 PM; versus NMDA, 30.6 I.LM.
KA 15uM
* *
AMPA
G/
QQ 5uM
AMPA 8uM
i
FRACT I ON NUMBER
100
i
200
KYNURENATE 1nM

NMDA
The Journal of Neuroscience, January 1991, 7 7(l) 117
NMDA
30
M 0
20
X
r
a IO
d ** !211
NMDA
NMDA NMDA
These results indicate that DNQX is over 100 x more potent than Kyn as a KA antagonist. The NMDA curve was separated from the KA curve by more than 1 log unit. Therefore, at doses less than ~OPM, DNQX can easily be used to differentiate be- tween KA and NMDA, but at concentrations greater than 100 PM, NMDA responses were also blocked. The differential be- tween KA and QQ (or AMPA) was less, but DNQX preferen- tially blocked KA responses; at 3 I.IM DNQX, the KA-evoked release of ACh was blocked by 95%, but the QQ and AMPA responses were only reduced by 60% and 40%, respectively. We also tested DNQX against the glutamate-evoked release of ACh. However, in 7 experiments, DNQX (5-20 PM) consistently failed to block the response to 5 mM glutamate.
To determine the type of antagonism, we tested a fixed dose of DNQX (10 PM) against increasing concentrations of KA. DNQX (10 PM) caused a parallel shift of almost 1 log unit in the KA dose-response curve (Fig. 10). Importantly, raising the dose of KA overcame the DNQX blockade, and the same max- imum response was obtained with 400 PM KA. Although the data in this figure were normalized to 1, the maximum peak: base ratios underlying these numbers were also the same (50 PM KA, 23.2, n = 9; 400 PM IL4 in DNQX, 23.0, n = 2). A parallel shift of the dose-response curve reaching the same I’,,,,, is the classic result if both compounds are competing for the same site. Therefore, we concluded that DNQX was a potent and competitive KA antagonist.
Once we had established the correct dose, we tested DNQX against the light-evoked release of ACh. The threshold dose for DNQX versus light was 1 KM, and a complete block was ob- tained at 3-5 PM. This coincides with the effective range for DNQX versus KA. Figure 11 illustrates a self-contained ex- periment that may be functionally divided into 2 parts. The
X
F >
2
Figure 8. Dose and specificity of DNQX versus KA and NMDA. Sub- maximal doses of NMDA (300 PM) and KA (15 PM) were applied for 1 min in paired stimuli against an increasing staircase of DNQX shown by the solid bars and dotted lines. This experiment was conducted in magnesium-free me- dium to promote NMDA responses. The peak : base ratio for the first NMDA response was 11.4, and for the first KA response, 12.2. Starting at 1 PM DNQX, the KA-evoked release of ACh was se- lectively reduced until, at 5 PM DNQX, the KA response was abolished, but NMDA still produced a response with a peak: base ratio of 12.4. It is impor- tant to compare the last 2 responses in DNQX with the final controls, which gave similar responses for NMDA and KA (peak: base ratios, 10.0 and 12.1, respectively). This experiment shows that 5 PM DNQX is a selective KA an- tagonist in the rabbit retina.
- 1 0 1 2 3
DNQX CONCENTRATION ( LOG uh’)
Figure 9. Semilog dose-response curves for KA, QQ, AMPA, and NMDA versus DNQX. The data were derived from experiments such as that shown in Figure 8, where increasing doses of antagonist were tested against fixed submaximal doses of IL4 (15 PM), QQ (15 PM), AMPA (8 W(M), and NMDA (300 PM). The KA and NMDA curves were separated by more than 1 log unit, indicating that DNQX may be used to separate these 2 receptor types. The separation of KA from AMPA and QQ was much less. From these curves, we chose a concentration of 5 PM as a working dose for DNQX. At this concentration, KA re- sponses were eliminated, NMDA responses were unaffected, QQ re- sponses were reduced by 70%, and AMPA responses were reduced by 60%. The vertical bars represent SEM.

118 Linn et al. * ACh Release Mediated by KA Receptors
1 .
1
i I DNQX
KA CONCENTRATION (LOG uM)
Figure 10. Semilog dose+response curves for KA against fixed dose of DNQX ( 10 PM). DNQX caused a parallel shift in the KA dose-response curve, and V,,, was the same in both conditions, approximately 23 x the basal efflux. These results indicate that DNQX is a competitive antagonist at KA receptors in the rabbit retina. The vertical bars rep- resent SEM.
first half shows that 5 PM DNQX reversibly abolished the light- evoked release of ACh from the rabbit retina. During perfusion with 5 PM DNQX, the response to light was not discernible from the background noise.
The second part of Figure 11 shows the pharmacological spec-
Figure 11. The effect of DNQX on light-evoked release of ACh. Asterisks indicate light stimulation for 4 min at 3 Hz. In the first half of this experiment, 5 PM DNQX (shown by solid bars and dotted lines) reversibly abolished the light-evoked release of ACh. The mean peak: base ratio was 3.1 before and 3.3 after DNQX, but during perfusion with DNQX, the same light stimulation caused no change in release. In the sec- ond half of this experiment, we tested the pharmacological specificity of DNQX. Perfusion with DNQX revers- ibly blocked the KA-evoked release of ACh, but the NMDA response was 40 x and the QQ response was 2 1 x the basal efflux. Co-perfusion with DL-AP-I blocked the NMDA response, confirrn- ing a specific action at NMDA receptors that was unaffected by DNQX alone. On return to control medium, similar responses were obtained for NMDA, QQ, and KA (peak: base ratios: 20,28, and 28, respectively). Comparing the responses in DNQX to the final con- trols shows that KA was completely blocked, the QQ response was partially reduced, and the NMDA response was unaffected. This indicates that 5 PM DNQX, which reversibly abolished the light-evoked release of ACh, is a rela- tively specific KA antagonist.
160
M
0
I20
X
r 80
a
d
ificity of DNQX. During perfusion with 5 PM DNQX, NMDA (300 MM) caused a 4 1 -fold increase in the release of ACh, a large response often seen with the first application of a glutamate agonist. QQ (15 PM) elicited a 2 1 -fold increase in ACh release, but the effect of KA (15 MM) was abolished by 5 PM DNQX. Because the NMDA response was so large, we took the extra precaution of testing it against a well-described NMDA antag- onist. Co-perfusion with m-2-amino-7-phosphonoheptanoate (DL-AP-7) completely blocked the effect of NMDA, indicating a specific interaction with NMDA receptors. Comparison with the final control peaks shows that, in 5 PM DNQX, the NMDA response was not reduced, the QQ response was partially re- duced, but the KA response was reversibly abolished. Thus, 5 I.LM DNQX, which completely blocked the light-evoked release of ACh, was shown to be a relatively specific KA antagonist in the same experiment. This strongly implies that KA receptors mediate the excitatory input to choline& amacrine cells.
Discussion By following the release of ACh, we have analyzed the effect of various glutamate analogs and antagonists on the cholinergic amacrine cells of the rabbit retina. Our results lead to 3 major conclusions: (1) The release of ACh from cholinergic amactine cells may be stimulated via multiple glutamate receptors, in- cluding KA, QQ, and NMDA receptors. (2) Kyn is selective for KA B QQ, while DNQX is selective for IL4 > QQ >> NMDA. This pharmacological profile is similar to many other systems using glutamate. (3) The light-evoked release of ACh is blocked by Kyn and DNQX, suggesting that the physiological input to the cholinergic amacrine cells is mediated via KA receptors. This is consistent with previous work suggesting that bipolar cells release glutamate.
VMDA
NMDA
300uM
‘5uM KA
NUMBER - 150 ; ; 200
v DNQX 5uM
: AP-7 200uM

The Journal of Neuroscience, January 1991, If (1) 119
Agonists All the glutamate analogs we tested, except NAAG, caused mas- sive ACh release from the rabbit retina. In fact, these responses were so large, up to 50x the basal efflux, that cell lysis due to the neural toxicity of these compounds seemed like a possible mechanism for release. However, we used brief applications of submaximal doses and obtained reversible and repeatable re- sponses. Perfusate analysis revealed that only labeled ACh was released in response to stimulation with KA, QQ, or NMDA (Fig. 3), and previous work has shown that the cholinergic ama- crine cells are the only cells in the retina that synthesize ACh (Masland and Mills, 1979). Furthermore, ACh release in re- sponse to these glutamate analogs was calcium dependent, the hallmark of neuronal release (Fig. 4). These observations in- dicate that the ACh release measured in our experiments rep- resents neurotransmitter release from cholinergic neurons and may be taken as a measure of their response.
To demonstrate a direct effect, it is conventional to block synaptic transmission with cobalt and apply the agent in ques- tion. In this way, KA, QQ, and NMDA were shown to excite ganglion cells directly in the rabbit retina (Massey and Miller, 1988, 1990). In this study, we could not use this approach be- cause the dependent measure, ACh release, is calcium dependent and therefore blocked by cobalt. However, the glutamate ana- logs may have a direct effect because of the following: (1) Other amacrine cells in the rabbit retina were directly excited by glu- tamate analogs (Massey and Miller, 1988). (2) The threshold dose for ACh release was lower than the threshold dose for horizontal cells in the outer retina (Massey and Miller, 1987). (3) The effect of glutamate analogs on the ON bipolar cell is sign inverting, so an action at this site would reduce ACh release, at least in the ON pathway (Shiells et al., 1981; Slaughter and Miller, 198 1, 1985). (4) The cholinergic amacrine cells receive direct input from bipolar cells, which are thought to release glutamate (Famiglietti, 1983b; Brandon, 1987; Ehinger et al., 1988; Marc et al., 1989). (5) NMDA, which caused massive ACh release in magnesium-free medium, had almost no effect in the outer retina of the rabbit (Massey and Miller, 1987). Therefore, though we cannot rule out polysynaptic pathways, it is possible that the effect of glutamate agonists on ACh release is due to a direct effect on cholinergic amacrine cells.
The release of ACh by glutamate analogs was much greater than the light-evoked release of ACh. At the most, light caused a lo-fold increase in ACh release at a stimulation rate of 3 Hz (Massey and Redbum, 1982). The depolarizing transients at light ON or OFF are probably responsible for most of the release of ACh, but they are brief, having a duration of less than 50 msec (Bloomfield and Miller, 1986). There is no such limitation for the exogenous application of glutamate analogs, which are continuously effective while present. Thus, it follows that the response to glutamate analogs should be greater than the light- evoked response. Cunningham and Neal (1985) reported peak : base ratios of 4-5, but only tested concentrations of KA and QQ in the l-~-PM range. Our results in the IOW-KM range are comparable, and our larger responses reflect the higher concen- trations tested and possibly the continuous perfusion method.
All the effective glutamate analogs, except NMDA, caused ACh release from the retina in normal physiological medium containing magnesium. NMDA was effective only in magne- sium-free medium, as previously reported by Cunningham and Neal (1985). This immediately suggests that NMDA receptors
do not carry the physiological input to cholinergic amacrine cells. Furthermore, NMDA antagonists did not block the light- evoked release of ACh (Linn and Massey, 1991). This is quite different from striatal slices, where, in magnesium-free medium, ACh release was mediated by NMDA receptors, and the effect of other glutamate analogs, including KA and QQ, was negligible (Lehmann and Scatton, 1982; Scatton and Lehmann, 1982). The pharmacology of NMDA-mediated ACh release from the rabbit retina is presented in the following paper (Linn and Massey, 1991).
From the dose-response curves in Figure 2, KA, QQ, and AMPA were almost 3 log units (1000 x) more potent than glu- tamate or aspartate. A similar difference has been reported in electrophysiological studies. For example, horizontal cells were depolarized by lo-20 mM glutamate, but the same response could be obtained with 20-50 PM KA (Bloomfield and Dowling, 1985a; Massey and Miller, 1987). This difference is probably due to glutamate uptake by glial cells, which effectively prevents the access of exogenous glutamate (Marc and Lam, 198 1; Brew and Attwell, 1987; Rosenberg and Aizenman, 1989). Hence, in isolated cells, glutamate and KA are almost equipotent (Lasater and Dowling, 1982; Ariel et al., 1984; Aizenman et al., 1988). In addition, the maximum response with glutamate or aspartate (20-50 mM) was only half that obtained with other glutamate analogs, and the peaks were broader, with slower recovery. These last effects may reflect saturation of the uptake system, but the pharmacological specificity of such high doses is not clear.
AMPA has been proposed as a more selective ligand for the QQ receptor site because QQ also activates the metabotropic receptor associated with a second-messenger system (Monaghan et al., 1989). In this study, AMPA was the most potent analog tested, in agreement with previous electrophysiological results in the rabbit retina (Massey and Miller, 1988). Antagonism with Kyn or DNQX produced curves for QQ and AMPA that were close and separated from KA (Figs. 6,9). This suggests that QQ and AMPA may interact with the same receptor, which is dif- ferent from the KA receptor. KA and QQ responses were also differentially dependent on calcium. The KA-evoked release of ACh was abolished by low calcium/high magnesium or by co- balt, but the QQ response was only blocked by cobalt in calcium- free medium. These observations suggest that QQ may cause the release of calcium from an internal store or that it may open a calcium channel (Benavides et al., 1988; Murphy and Miller, 1988).
Antagonists It was the goal of this study to use glutamate antagonists to identify the excitatory input to the cholinergic amacrine cells. The dose-response curves in Figure 6 show that Kyn is more potent against KA than AMPA and QQ. This is consistent with previous work in the retina and other systems (Coleman et al., 1986; Massey and Miller, 1988; Perouansky and Grantyn, 1989). From the dose-response curves, we chose to use 1 mM Kyn, a dose that eliminated KA responses but only reduced QQ and AMPA responses by 50%. At this concentration, Kyn reversibly abolished the light-evoked release of ACh from the retina. Kyn also blocks NMDA responses, but specific NMDA antagonists did not reduce the light-evoked release of ACh (Linn and Mas- sey, 199 1). These results imply that the physiological input to cholinergic amacrine cells is mediated by KA receptors. Because ACh release was completely eliminated, indicating that both ON and OFF cholinergic amacrine cells were blocked, it may
120 Linn et al. l ACh Release Mediated by KA Receptors
be that both types have the same input, but this idea will require confirmation. In addition, because ON bipolar cells are not affected by general glutamate antagonists, because they receive input via APB receptors, Kyn must have a post-bipolar-cell effect, at least in the ON pathway (Slaughter and Miller, 198 1, 1983~). This suggests that the KA receptors mediating the light- evoked release of ACh are located in the inner retina.
We also used DNQX, which, in our hands, was a competitive KA antagonist, 100 x more potent than Kyn. We chose 5 wrn DNQX as a working dose, and at this concentration, there was no effect on the NMDA-evoked release of ACh (Fig. 8). DNQX has also been reported to interact with the allosteric glycine site of the NMDA receptor complex (Birch et al., 1988), but in the retina, the extracellular concentration of glycine is sufficient to saturate this site (Linn and Massey, 1991). Competition with endogenous glycine may reduce the potency of DNQX at the glycine site, and this may contribute to the selectivity for KA over NMDA receptors.
DNQX (5 PM) reversibly abolished the light-evoked release of ACh from the rabbit retina (Fig. 11). In the same experiment, we showed that the KA-evoked release of ACh was eliminated by the same concentration of DNQX that blocked the light- evoked response, but the QQ response was only partially re- duced, and the NMDA evoked release of ACh was unchanged. Thus, in agreement with the Kyn results, our observations with DNQX suggest that the physiological input to the choline& amacrine cells is mediated by KA receptors.
Both Kyn and DNQX block the light-evoked release of ACh, and both these antagonists had a preferential effect against KA over QQ. Therefore, it appears that the light-activated receptor fits the profile of the KA receptor. However, the specificity of competitive antagonists such as Kyn and DNQX depends partly on the concentration of agonist, which, for light activation, is unknown. In other words, if the light-evoked release of ACh were mediated by a low dose of glutamate acting at a QQ re- ceptor, it could be blocked by Kyn and DNQX, leading us to think that a KA receptor was involved. From the data in this study, we can place certain limits on this scenario: Kyn (1 mM) abolished the light-evoked release of ACh but only reduced the response to 15 PM QQ by 40%. Therefore, the light-evoked input must be equivalent to less than 15 FM QQ. For the light-evoked response to be completely blocked by Kyn, we estimate that it would have to be equivalent to less than 5 I.LM QQ. From Figures 1B and 2, the release of ACh in response to light is almost as large as the response to 5 PM QQ and larger than the response to 5 PM KA. However, this is the average response to a ~-HZ transient. On a finer time scale, the release of ACh in response to light must be much greater than 5 I.LM KA or QQ. Therefore, because responses of this size are blocked by Kyn, we deduce that the light-evoked release of ACh is predominantly mediated by KA receptors. This is consistent with the similar calcium dependence of the KA and light responses. Finally, the GABA antagonist picrotoxin more than doubles the light-evoked re- lease of ACh (Massey and Redbum, 1982), but it is still blocked by DNQX (not shown), suggesting that QQ receptors only make a minor contribution, at most.
Identity of the bipolar cell transmitter Because cholinergic amacrine cells receive direct input from bipolar cells (Famiglietti, 1983b Brandon, 1987), the release of ACh by glutamate agonists and the blockade of the light-evoked release by glutamate antagonists are consistent with previous
work suggesting that the bipolar cell transmitter is a glutamate- like substance. However, a number of candidates have been proposed. NAAG (acetate salt), which at best is a weak NMDA agonist (Westbrook et al., 1986), may be ruled out because it had no effect on ACh release up to a concentration of 20 mM in the presence or absence of magnesium. Most recently, some effects of NAAG were shown to be caused by the presence of potassium (Whittemore and Koemer, 1989).
L-Homocysteate has also been proposed as a bipolar cell trans- mitter (Neal and Cunningham, 1989), but in our hands, L-HCA was mostly an NMDA agonist of moderate potency (ED,, > 300 PM) whose effects were reduced by magnesium and DL-AP- 7. This is consistent with previous work indicating that L-HCA is an NMDA agonist in the retina and other systems (Olney et al., 1987; Lehmann et al., 1988). Because the input to cholinergic amacrine cells is not mediated by NMDA receptors, it is unlikely that L-HCA is the endogenous transmitter. Furthermore, it is only present in the retina in trace concentrations, less than 111000 of the endogenous glutamate concentration (Neal and Cun- ningham, 1989). The combination of low potency and low con- centration make it unlikely that L-HCA could be the transmitter for a population of neurons as numerous as bipolar cells, even the subset that provides input to the cholinergic amacrine cells.
Aspartate is unlikely to be the bipolar cell transmitter because its effects are mediated by NMDA receptors, though even at this site, glutamate is more potent (Olverman et al., 1984). In addition, aspartate is not concentrated in bipolar cells (Marc et al., 1989). Glutamate is the outstanding candidate because bi- polar cells are highly immunoreactive for glutamate (Ehinger et al., 1988; Marc et al., 1989), and because it is the only substance known to activate all the different glutamate receptors at high potency. However, in this study, we were consistently unable to block the glutamate-evoked release of ACh with DNQX. One obvious explanation is that glutamate is a mixed agonist, but the glutamate response was not blocked by combinations of DNQX and the NMDA antagonist DL-AP-7. Another more likely possibility is that, at the high concentrations (5-20 mM) required to overcome the glial uptake system, glutamate effects are nonspecific or toxic, leading to secondary effects on retinal neurons. For example, glial uptake of glutamate is electrogenic and associated with potassium release, which may, in turn, stim- ulate transmitter release in a manner not affected by glutamate antagonists (Barbour et al., 1988). These problems present a strong argument for the use of glutamate analogs, whose potency is not reduced by uptake, to investigate the function of glutamate receptors.
References Aizenman E, Frosch MP, Lipton SA (1988) Responses mediated by
excitatory amino acid receptors in solitary retinal ganglion cells from rat. J Physiol (Lond) 396:75-9 1.
Ames A, Nesbett FB (198 1) In vitro retina as an experimental model of the central nervous system. J Neurochem 37:867-877.
Ariel M, Lasater EM, Mange1 SC, Dowling JE (1984) On the sensitivity of H 1 horizontal cells of the carp retina to glutamate, aspartate and their agonists. Brain Res 295: 179-l 83.
Barbour B, Brew H, Attwell D (1988) Electrogenic glutamate uptake in glial cells is activated by intracellular potassium. Nature 335:433- 435.
Benavides J, Claustre Y, Scatton B (1988) L-Glutamate increases in- ternal free calcium levels in synaptoneurosomes from immature rat brain via quisqualate receptors. J-Neurosci 8:3607-36 15.
Birch PJ, Grossman CJ, Hayes AG (1988) 6,7-Dinitro-quinoxaline- 2,3-dion and 6-nitro,7-cyano-quinoxaline-2,3-dion antagonise re-

The Journal of Neuroscience, January 1991, 71(l) 121
sponses to NMDA in the rat spinal cord via an action at the strychnine insensitive glycine receptor. Em J Pharmacol 156: 177-l 80.
Bloomfield S, Dowling JE (1985a) Roles of aspartate and glutamate in synaptic transmission in rabbit retina. I. Outer plexiform layer. J Neurosphysiol 53:699-7 13.
Bloomfield S, Dowlina JE (1985b) Roles of aspartate and glutamate
amacrine cells: identification and selective staining by using radiog- raphy and fluorescent markers. J Neurosci 2: 1633-1643.
Massey SC (1990) Cell types using glutamate as a neurotransmitter in the vertebrate retina. Prog Retinal Res 9:399-425.
Massey SC, Miller RF (1987) Excitatory amino acid receptors of rod- and cone-driven horizontal cells in the rabbit retina. J Neurophysiol
in synaptic’ transmi&on in rabbit retina. II. Inner plexiform layer. J Neurophysiol 53:7 14-725.
Bloomfield S, Miller RF (1986) A functional organization of ON and OFF pathways in the rabbit retina. J Neurosci 6: 1-13.
Brandon C (1987) Cholinergic neurons in the rabbit retina: immu- nocytochemical localization, and relationship to GABAergic and cho- linesterase-containing neurons. Brain Res 40 1:385-39 1.
Brew H, Attwell D (1987) Electrogenic glutamate uptake is a major current carrier in the membrane of axolotl retinal glial cells. Nature 3271707-709.
Coleman PA, Miller RF (1989) Kainate receptor-mediated synaptic currents in mudpuppy inner retinal neurons reduced by D-O-phos- phoserine. J Neurophysiol 62:495-500.
Coleman PA, Massey SC, Miller RF (1986) Kynurenic acid distin- guishes kainate and quisqualate receptors in the vertebrate retina. Brain Res 381:172-175.
Copenhagen DR, Jahr CE (1989) Release of endogenous excitatory amino acids from turtle photoreceptors. Nature 341:536-539.
Cunningham JR, Neal MJ (1985) Effect of excitatory amino acids and analogues on ‘H-acetylcholine release from amacrine cells of the rab- bit retina. J Physiol (Lond) 366:47-62.
Ehinger B, Ottersen OP, Storm-Mathisen J, Dowling JE (1988) Bipolar cells in the turtle retina are strongly immunoreactive for glutamate. Proc Nat1 Acad Sci USA 85:8321-8325.
Famiglietti EV (1983a) On and off pathways through amacrine cells in mammalian retina: the synaptic connections of ‘starburst’ amacrine cells. Vision Res 23:1265-1279.
Famiglietti EV (1983b) ‘Starburst’ amacrine cells and cholinergic neu- rons: mirror-symmetric ON and OFF amacrine cells of rabbit retina. Brain Res 261: 138-144.
Foster AC, Fagg GE (1984) Acidic amino acid binding sites in mam-
Honork T, Davies SN, Drejer J, Fletcher EJ, Jacobsen P, Lodge D,
malian neuronal membranes: their characteristics and relationship to
Nielsen FE (1988) Quinoxalinediones: potent competitive non-
synaptic receptors. Brain Res Rev 7: 103-l 64.
NMDA glutamate receptor antagonists. Science 241:701-703.
Massey SC, Miller RF (1988) Glutamate receptors of ganglion cells in the rabbit retina: evidence for glutamate as a bipolar cell trans- mitter. J Physiol (Lond) 405:635-655.
Massey SC, Miller RF (1990) N-methyl-D-aspartate receptors of gan- glion cells in rabbit retina. J Neurophysiol 63: 16-30.
Massey SC, Neal MJ (1979) The light-evoked release of acetylcholine from the rabbit retina in vivo and its inhibition by GABA. J Neu- rochem 32: 1327-1329.
Massey SC, Redburn DA (1982) A tonic gamma-aminobutyric acid- mediated inhibition of cholinergic amacrine cells in rabbit retina. J Neurosci 2: 1633-1643.
Mayer ML, Westbrook GL (1987) The physiology of excitatory amino acids in the vertebrate central nervous system. Prog Neurobiol 28: 197-276.
Miller RF, Slaughter MM (1986) Excitatory amino acid receptors in the vertebrate retina: diversity of subtypes and conductance mecha- nisms. Trends Neurosci 9:2 1 l-2 13.
Monaghan DT, Bridges RJ, Cotman CW (1989) The excitatory amino acid receptors: their classes, pharmacology, and distinct properties in the function of the central nervous system. Annu Rev Pharmacol Toxic01 29:365402.
Murphy SN, Miller RJ (1988) A glutamate receptor regulates Ca2+ mobilization in hippocampal neurons. Proc Nat1 Acad Sci USA 85: 8737-8741.
Neal MJ, Cunningham JR (1989) L-Homocysteic acid-a possible bipolar cell transmitter in rabbit retina. Neurosci Lett 102: 114-l 19.
O’Dell TJ, Christensen BN (1989) A voltage-clamp study of isolated stinarav horizontal cell non-NMDA excitatory amino acid receptors. J N&rophysiol 61: 162-172.
602.
Olney JW, Price MT, Salles KS, Labruyere J, Ryerson R, Mahan K,
Olverman HJ, Jones AW, Watkins JC (1984) L-Glutamate has higher affinity than other amino acids for [)H]-D-APS binding sites in rat
Frierdich Cl, Samson L ( 1987) L-Homocysteic acid: an endogenous
brain membranes. Nature 307:460-4621 O’Mallev DM. Masland RH (1989) Co-release of acetylcholine and
excitotoxic ligand of the NMDA receptor. Brain Res Bull 19:597-
Johnson DA, Pilar G (1980) The release of acetylcholine from post- ganglion cell bodies in response to depolarization. J Physiol (Lond) 299:605-6 19.
Lasater EM, Dowling JE (1982) Carp horizontal cells in culture re- spond selectively to L-glutamate and its agonists. Proc Nat1 Acad Sci USA 79~936-940.
Lasater EM, Dowling JE, Ripps H (1984) Pharmacological properties of isolated horizontal and bipolar cells from the skate retina. J Neu- rosci 4:1966-1975.
Lehmann J, Scatton B (1982) Characterization of the excitatory amino acid receptor-mediated release of [‘HI-acetylcholine from rat striatal slices. Brain Res 252177-89.
Lehmann J, Tsai C, Wood PL (1988) Homocyteic acid as a putative excitatory amino acid neurotransmitter: postsynaptic characteristics at N-methyl-D-aspartate-type receptors on striatal cholinergic inter- neurons. J Neurochem 5 1: 1765-l 770.
Linn DM, Massey SC (1991) Acetylcholine release from the rabbit retina mediated by NMDA receptors. J Neurosci 11: 123-l 33.
Lukasiewicz PD, McReynolds JS (1985) Synaptic transmission at the N-methyl-D-aspartate receptors in the proximal retina of the mud- puppy. J Physiol (Lond) 367:99-l 15.
Marc RE, Lam DMK (198 1) Uptake of aspartic and glutamic acid by goldfish photoreceptors. Proc Nat1 Acad Sci USA 78:7 185-7 189.
Marc RE, Massey SC, Kalloniatis M, Basinger SF (1989) Immuno- chemical evidence that the fast neurotransmitter of rods, cones, bi- oolar and aanalion cells is ahttamic acid. Invest Opthalmol Vis Sci iSuppl] 30326 -
Masland RH, Livingstone CJ (1976) Effect of stimulation with light on synthesis and release of acetylcholine by an isolated mammalian retina. J Neurophysiol 39: 1210-1219.
Masland RH, Mills JW (1979) Autoradiographic identification of ace- tylcholine in the rabbit retina. J Cell Biol 83: 159-l 78.
Masland RH, Mills JW, Hayden SA (1984) Acetylcholine-synthesizing
gamma-aminobutyric acid by a retinal neuron. Proc Nat1 Acad Sci USA 85:8737-8741.
Perouansky M, Grantyn R (1989) Separation of quisqualate- and kai- nate-selective glutamate receptors in cultured neurons from the rat superior colliculus. J Neurosci 9:70-80.
Rosenberg PA, Aizenman E (1989) Hundred-fold increase in neuronal vulnerability to glutamate toxicity in astrocyte-poor cultures of rat cerebral cortex. Neurosci Lett 103: 162-168.
Scatton B, Lehmann J (1982) N-methyl-D-aspartate-type receptors mediate striatal 3H-acetvlcholine release evoked bv excitatory amino acids. 2971422-424. -
Shea PA, Aprison MH (1973) An enzymatic method for measuring oicomole auantities of acetvlcholine and choline in CNS tissue. Anal Biochem 56~165-177. -
Shiells RA, Falk G, Nagshingeh S (1981) Action of glutamate and aspartate analogues on rod horizontal and bipolar cells. Nature 294: 592-594.
Slaughter MM, Miller RF (198 1) 2-Amino-4-phosphonobutyric acid: a new pharmacological tool for retina research. Science 2 11: 182-l 85.
Slaughter MM, Miller RF (1983a) An excitatory amino acid antagonist blocks cone input to sign-conserving second-order retinal neurons. Science 219:1230-1232.
Slaughter MM, Miller RF (1983b) The role of excitatory amino acid transmitters in the mudpuppy retina: an analysis with kainic acid and N-methyl aspartate. J Neurosci 3: 1701-l 7 11.
Slaughter MM, Miller RF (1983~) Bipolar cells in the mudpuppy retina use an excitatory amino acid neurotransmitter. Nature 303:537-538.
Slaughter MM, Miller RF (1985) Characterization of an extended glutamate receptor of the ON bipolar neuron in the vertebrate retina. J Neurosci 5:224-233.
Tauchi M, Masland RH (1984) The shape and arrangement of the

122 Linn et al. l ACh Release Mediated by KA Receptors
cholinergic neurons in the rabbit retina. Proc R Sot Land [Biol] 223: 101-l 19.
Tauchi M, Masland RH (1985) Local order among the dendrities of an amacrine cell population. J Neurosci 5:2494-250 1.
Vaney DI (1984) ‘Coronate’ amacrine cells in the rabbit retina have the ‘starburst’ dendritic morphology. Proc R Sot Lond [Biol] 220: 501-508.
Westbrook GL, Mayer ML, Namboordiri MAA, Neale JH (1986) High concentrations of N-acetylaspartylglutamate (NAAG) selectively ac-
tivate NMDA receptors on mouse spinal cord neurons in cell culture. J Neurosci 6:3385-3392.
Whittemore ER, Koemer JF (1989) An explanation for the purported excitation of piriform cortical neurons by N-acetyl-L-aspartyl-L-glu- tamic acid (NAAG). Proc Nat1 Acad Sci USA 86:9602-9605.
Yamada KA, Dubinsky JM, Rothman SM (1989) Quantitative phys- iological characterization of a quinoxalinedione non-NMDA receptor antagonist. J Neurosci 9:3230-3236.