Embed Size (px)
Citation preview

1
ACEA Benchmarking Survey 1993-2003
n Dual Objective– For firms as a benchmarking tool (annual comparisons) against peers– For ACEA industry information (industry trends)
n Operation– Collected annually– ten+ years continuity of collection to date
The Model

2
ACEA Benchmarking Survey 1993-2003
n Benchmarking Parameters– Financial Performance (fees, margins, assets/liabilities, salaries, generated
income, costs, debtors, work in progress).
– Sources of Work (government, private sector, overseas)
– Services Provided (Engineering (civil, struct, mech, envir, geotech etc), Related Services (survey, IT, fin’l, mgmt, legal etc))
– Fees Earned by Marketing Category (building, plant, infrastructure, mining, energy etc)
– Work Done by Fee Structure (percent cost of works, time)
– Consultant Selection Method (QBS, tender, D&C)
The Model (cont)

3
ACEA Benchmarking Survey 1993-2003
n Rates of responses irregular from year to year (range 60% - 30%)
n Large variations in response rates between large/small firms• time resources
• expertise resources
n Variable interpretations of definitions
n Different approach to operations and processes across firms
n Problems with time of year questionnaire issued
n Competition from other benchmarking surveys.
Despite limitations, some good data emerged.
Limitations

4
ACEA Benchmarking Survey 1993-2003
Benchmarking PerformanceA Decade of ACEA Business Performance Surveys
n Major Benefits for Firms - Highlights– Performance against industry norms, competitors.
– Business strengths/weaknesses, areas for improvement.
– Significant trends/changes in the market.
– Impacts of employment costs, staff performance.
n Major Benefits for ACEA and the Industry - Highlights– Issues for lobbying/information, industry promotion.
– Areas best/least emerging profitability, diversification, (multidisciplinary/specialist).
– Market impacts/trends (economic, major events).
– Differences between small (1-19)/medium(20-299)/large firms (300Plus).

5
ACEA Benchmarking Survey 1993-2003
Average Fees Earned: All Firms
500
1,000
1,500
2,000
2,500
3,000
1993/94 1994/95 1995/96 1996/97 1997/98 1998/99 1999/00 2000/01 2001/02 2002/03
Current prices Constant 2003/04 prices
$000
trend
trend
Part 1: Financial Performance
1.1: Average Fees Earned for All Firms
n Median firm is now 12, compared with 8 in 93/94,
n Earns fees of $1.5 m a year - 50% increase on 93/94.

6
ACEA Benchmarking Survey 1993-2003
Average Fees Earned: Small Firms
300
400
500
600
700
800
900
1,000
1993/94 1994/95 1995/96 1996/97 1997/98 1998/99 1999/00 2000/01 2001/02 2002/03
Current prices Constant 2003/04 prices
$m
trend
trend
Average Fees Earned: Medium-sized Firms
3
4
5
6
7
1993/94 1994/95 1995/96 1996/97 1997/98 1998/99 1999/00 2000/01 2001/02 2002/03
Current prices Constant 2003/04 prices
$m
trend
trend
Average Fees Earned: Large Firms
70
80
90
100
110
120
130
140
150
1993/94 1994/95 1995/96 1996/97 1997/98 1998/99 1999/00 2000/01 2001/02 2002/03
Current prices Constant 2003/04 prices
$m
trend
trend
(Different ‘X’ axis values, magnitudes not comparable)
n Small firms marginally increased average fees
n Medium/large firms decreased fees due to competition. (Sizes of medium firms have increased).
Part 1: Financial Performance
1.2: Average Fees Earned by Size of Firm

7
ACEA Benchmarking Survey 1993-2003
Pre-tax Profit Margins, By Size of Firm
-5
0
5
10
15
20
1993/94 1994/95 1995/96 1996/97 1997/98 1998/99 1999/00 2000/01 2001/02 2002/03
Small Medium Large
% Pre-tax profit % fees earned
Average Pre-tax Profit Margin: All Firms
7
8
9
10
11
12
13
1993/94 1994/95 1995/96 1996/97 1997/98 1998/99 1999/00 2000/01 2001/02 2002/03
% Pre-tax profit % fees earned
trend
Part 1: Financial Performance
1.3: Pre-Tax Profit Margins(Different ‘X’ axis values, magnitudes not comparable)
n Pre-tax profits varied between size of firm.
n Depressed economy in 93/94. n Profits increased to 12% in 99/00.n Margins fell in recession of 2000/01.n Margins recovered in 2002/03.n Small, medium firms earned higher
margins than large firms.n Increasing pre-tax profit for all firms.

8
ACEA Benchmarking Survey 1993-2003
$0
$20,000
$40,000
$60,000
$80,000
$100,000
$120,000
$140,000
$160,000
1993/94 1994/95 1995/96 1996/97 1997/98 1998/99 1999/00 2000/01 2001/02 2002/03
Year
All FirmsStaff 1 - 19Staff 20 - 299Staff 300+
Part 1: Financial Performance
1.4: Income Per Staff Member(Total income divided by the number of staff including principals)
n Trend shows modest increase for all firms over the decade. (may be less when CPI is taken into account).

9
ACEA Benchmarking Survey 1993-2003
0
10
20
30
40
50
60
70
80
90
1993/94 1994/95 1995/96 1996/97 1997/98 1998/99 1999/00 2000/01 2001/02 2002/03
Year
Day
s
All Firms
Staff 1 - 19
Staff 20 - 299
Staff 300+
Part 1: Financial Performance
1.5: Days of Debtors Outstanding(The data in this graph compares the value of debtors as at June 30 each year with total income, multiplied by 365 to determine the number of debtor days outstanding)
n Increasing days of debtors for all firms. n Potential for improvements in invoicing, contract payments, debt
recovery.

10
ACEA Benchmarking Survey 1993-2003
0.00
2.00
4.00
6.00
8.00
10.00
12.00
1993/94 1994/95 1995/96 1996/97 1997/98 1998/99 1999/00 2000/01 2001/02 2002/03
Year
Rat
io
All Firms
Staff 1 - 19
Staff 20 - 299
Staff 300+
Part 1: Financial Performance
1.6: Current Ratio of Assets to Liabilities(The data in this graph compares firms’ business assets with outstanding liabilities.)
n Modest improvement for large firms.n Significant falls for small and medium firms.

11
ACEA Benchmarking Survey 1993-2003
0%
2%
4%
6%
8%
10%
12%
14%
1993/94 1994/95 1995/96 1996/97 1997/98 1998/99 1999/00 2000/01 2001/02 2002/03
Year
Per
cent
age
All Firms
Staff 1 - 19
Staff 20 - 299
Staff 300+
Part 1: Financial Performance
1.7: Marketing Costs (1995/96 - 2002/03)(The costs of marketing hours as a percentage of total generated income)
n Apart from rises in 2000/01, costs between 2% and 6% of total income.
12
ACEA Benchmarking Survey 1993-2003
0%
1%
2%
3%
4%
5%
6%
7%
8%
9%
1993/94 1994/95 1995/96 1996/97 1997/98 1998/99 1999/00 2000/01 2001/02 2002/03
Year
Per
cent
age
All Firms
Staff 1 - 19
Staff 20 - 299
Staff 300+
Part 1: Financial Performance
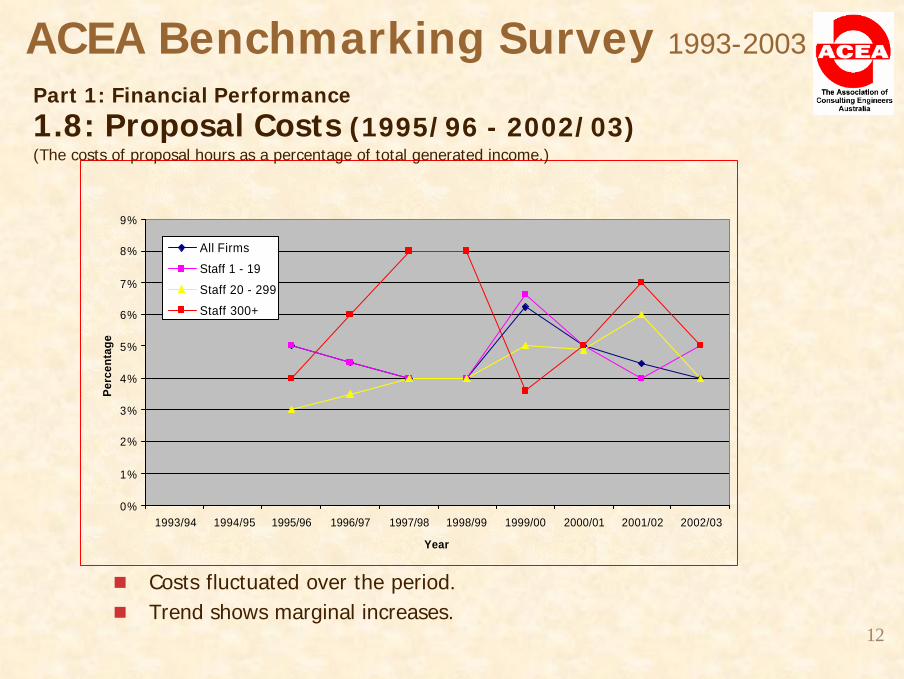
1.8: Proposal Costs (1995/96 - 2002/03)(The costs of proposal hours as a percentage of total generated income.)
n Costs fluctuated over the period.n Trend shows marginal increases.

13
ACEA Benchmarking Survey 1993-2003
0%
5%
10%
15%
20%
25%
30%
35%
40%
1993/94 1994/95 1995/96 1996/97 1997/98 1998/99 1999/00 2000/01 2001/02 2002/03
Year
Per
cent
age
All Firms
Staff 1 - 19
Staff 20 - 299
Staff 300+
Part 1: Financial Performance
1.9: Administration Costs (1995/96 - 2002/03)(The costs of administration/overheads as a percentage of total generated income)
n Costs fluctuated over the period.n Trend shows marginal decreases.

14
ACEA Benchmarking Survey 1993-2003
Fees from Federal Government, by Size of Firm
0
2
4
6
8
10
12
14
93/94 94/95 95/96 96/97 97/98 98/99 99/00 00/01 01/02 02/03
Small Medium Large
% % total fees earned
Fees from State Governments, by Size of Firm
5
10
15
20
25
93/94 94/95 95/96 96/97 97/98 98/99 99/00 00/01 01/02 02/03
Small Medium Large
% % total fees earned
Fees from Local Governments, by Size of Firm
0
5
10
15
20
93/94 94/95 95/96 96/97 97/98 98/99 99/00 00/01 01/02 02/03
Small Medium Large
%% total fees earned
Fees from Australian Private Sector, by Size of Firm
30
40
50
60
70
80
90
93/94 94/95 95/96 96/97 97/98 98/99 99/00 00/01 01/02 02/03
Small Medium Large
% % total fees earned
Part 2: Sources of Income
2.0: Sources of Work: Australian Domestic Clients

15
ACEA Benchmarking Survey 1993-2003
Part 2: Sources of Income
2.1: Sources of Work: Australian Domestic Clients
n Over decade:– Federal/Local Government work for small/ medium firms declined.
– State Government work increased for small/ medium firms.
– Australian private sector major source of income for all firms.

16
ACEA Benchmarking Survey 1993-2003
Fees from Work Overseas, by Size of Firm
0
10
20
30
40
93/94 94/95 95/96 96/97 97/98 98/99 99/00 00/01 01/02 02/03
Small Medium Large
% % total fees earned
Part 2: Sources of Income
2.2: Sources of Work: Overseas Clients
n Overseas work increased for all firms. n Some large firms established subsidiary companies offshore. n Some firms now part of global offshore parent company.

17
ACEA Benchmarking Survey 1993-2003
Fees from Civil Engineering, by Size of Firm
10
20
30
40
50
93/94 94/95 95/96 96/97 97/98 98/99 99/00 00/01 01/02 02/03
Small Medium Large
% % total fees earned
Fees from Structural Engineering, by Size of Firm
5
15
25
35
45
93/94 94/95 95/96 96/97 97/98 98/99 99/00 00/01 01/02 02/03
Small Medium Large
% % total fees earned
Fees from Mechanical & Electrical Engineering, by Size of Firm
0
10
20
30
40
93/94 94/95 95/96 96/97 97/98 98/99 99/00 00/01 01/02 02/03
Small Medium Large
% % total fees earned
(Different ‘X’ axis values, magnitudes not comparable)
n Civil/struct engineering major fee earners for all firms.
n Declining work for small/medium firms, increasing for large firms.
n Mech/elec next highest. Decline for large/small firms.
Part 2: Sources of Income (to be read in conjunction with following slide)
2.3: Percentage of Fees Earned by Discipline (1)

18
ACEA Benchmarking Survey 1993-2003
Fees from Environmental Engineering, by Size of Firm (1999/00 to 2002/03)
0
2
4
6
8
10
12
99/00 00/01 01/02 02/03
Small Medium Large
% % total fees earned
Fees from Project Management Services, by Size of Firm (1993/94 to 1998/99)
0
10
20
30
40
50
93/94 94/95 95/96 96/97 97/98 98/99
Small Medium Large
%% total fees earned
Fees from Geotechnical Services, by Size of Firm (1993/94 to 2002/03)
0
5
10
15
20
25
93/94 94/95 95/96 96/97 97/98 98/99 99/00 00/01 01/02 02/03
Small Medium Large
% % total fees earned
(Different ‘X’ axis values, magnitudes not comparable)
n Project management next ranked source of fees.
n Geotech/envir show increases for all
firms.
Part 2: Sources of Income (to be read in conjunction with previous slide)
2.3: Percentage of Fees Earned by Discipline (2)

19
ACEA Benchmarking Survey 1993-2003
Fees Charged by Percent of Cost, by Size of Firm
0
5
10
15
20
93/94 94/95 95/96 96/97 97/98 98/99 99/00 00/01 01/02 02/03
Small Medium Large
% % total fees earned
Fees Charged by Time, by Size of Firm
20
25
30
35
40
45
50
93/94 94/95 95/96 96/97 97/98 98/99 99/00 00/01 01/02 02/03
Small Medium Large
% % total fees earned Fees Charged as Lump Sum, by Size of Firm
30
40
50
60
70
93/94 94/95 95/96 96/97 97/98 98/99 99/00 00/01 01/02 02/03
Small Medium Large
% % total fees earned
(Different ‘X’ axis values, magnitudes not comparable)
n Lump sum most common method of fee charging, increasing trend.
n Time basis next most common fee charging method, declining for medium/ large firms, increasing for small firms.
n Percentage of the cost of the works least used fee structure, declined for
medium/ small firms.
Part 2: Sources of Income
2.4: Estimate of Work Done by Fee Structure

20
ACEA Benchmarking Survey 1993-2003
Qualification Based Selection, by Size of Firm
0
5
10
15
20
25
95/96 96/97 97/98 98/99 99/00 00/01 01/02 02/03
Small Medium Large
% % total fees earned Selection by Tender, by Size of Firm
30
40
50
60
70
80
95/96 96/97 97/98 98/99 99/00 00/01 01/02 02/03
Small Medium Large
% % total fees earned
Selection to Design & Construct, by Size of Firm
0
5
10
15
20
25
95/96 96/97 97/98 98/99 99/00 00/01 01/02 02/03
Small Medium Large
%% total fees earned
(Different ‘X’ axis values, magnitudes not comparable)
n Selection by tender predominant method, shows decline in post-Olympics period.
n Qualification based selection (QBS) increasing for all firms.
n Design and Construct (D&C) increasing in post-Olympics period.
Part 2: Sources of Income (1995/96 -2002/03)
2.5: Estimate of Work Done by Consultant Selection Method

21
ACEA Benchmarking Survey 1993-2003
n Additional data shows:
– Fees earned diverging from building/construction, to new areas (industrial development, IT, business improvement).
– Increase in large firm sizes, their diversity into areas outside traditional engineering.
– Increasing number of medium firms as small firms merged.
– Changes in contracting regimes, emerging growth of Public Private Partnerships (PPPs) and Alliance Contracting.
Overall Trends from Data

22
ACEA Benchmarking Survey 1993-2003
n KISS:– One page maximum if possible
– Small number of key indicators
• Tested with firms for value
• Questions easily answered (Clear definitions, no ratios/complex calculations, estimates)
– Different Surveys for Large and Small firms.
– Circulate at start of financial year (for previous year’s figures).
– Promote value, usefulness of survey information to firms.
– Apply consistent, significant resources to task.
– Spot check usefulness, adapt process according to feedback.
Recommendations