Embed Size (px)
Citation preview

ACE Limited Global Loss Triangles Supplement 2011

Investor Contact
Helen M. WilsonPhone: (441) 299-9283Fax: (441) 292-8675email: [email protected]
This report is for informational purposes only. It should be read in conjunctionwith documents filed by ACE Limited with the Securities and ExchangeCommission, including the most recent Annual Report on Form 10-K and Quar-terly Reports on Form 10-Q.
Cautionary Statement Regarding Forward-Looking Statements:Any forward-looking statements made in this document reflect the Company’scurrent views with respect to future events and financial performance and aremade pursuant to the safe harbor provisions of the Private Securities LitigationReform Act of 1995. Such statements involve risks and uncertainties, which maycause actual results to differ materially from those set forth in these statements.
For example, the Company’s forward-looking statements related to potentialchanges in actuarial methods and reserves could be affected by the frequency ofunpredictable catastrophic events, actual loss experience which differs from theCompany’s assumptions, uncertainties in the reserving or settlement process, newtheories of liability, coverage issues, judicial, legislative, regulatory and other gov-ernmental developments, litigation tactics and developments, the amount andtiming of reinsurance recoverable, credit developments among reinsurers, pricingand policy term trends and actual market conditions and developments, as well asmanagement’s response to these factors, and other factors identified in theCompany’s filings with the Securities and Exchange Commission, including theCompany’s Annual Report on Form 10-K for the year ended December 31, 2011,the Company’s quarterly reports on Form 10-Q, and in the Company’s earningspress releases, which are available on the Company’s website.
Readers are cautioned not to place undue reliance on these forward-looking state-ments, which speak only as of the dates on which they are made. The Companyundertakes no obligation to publicly update or revise any forward-looking state-ments, whether as a result of new information, future events or otherwise.
ACE Limited 2011 Global Loss Triangles Global Loss Triangles Supplement
Table of Contents
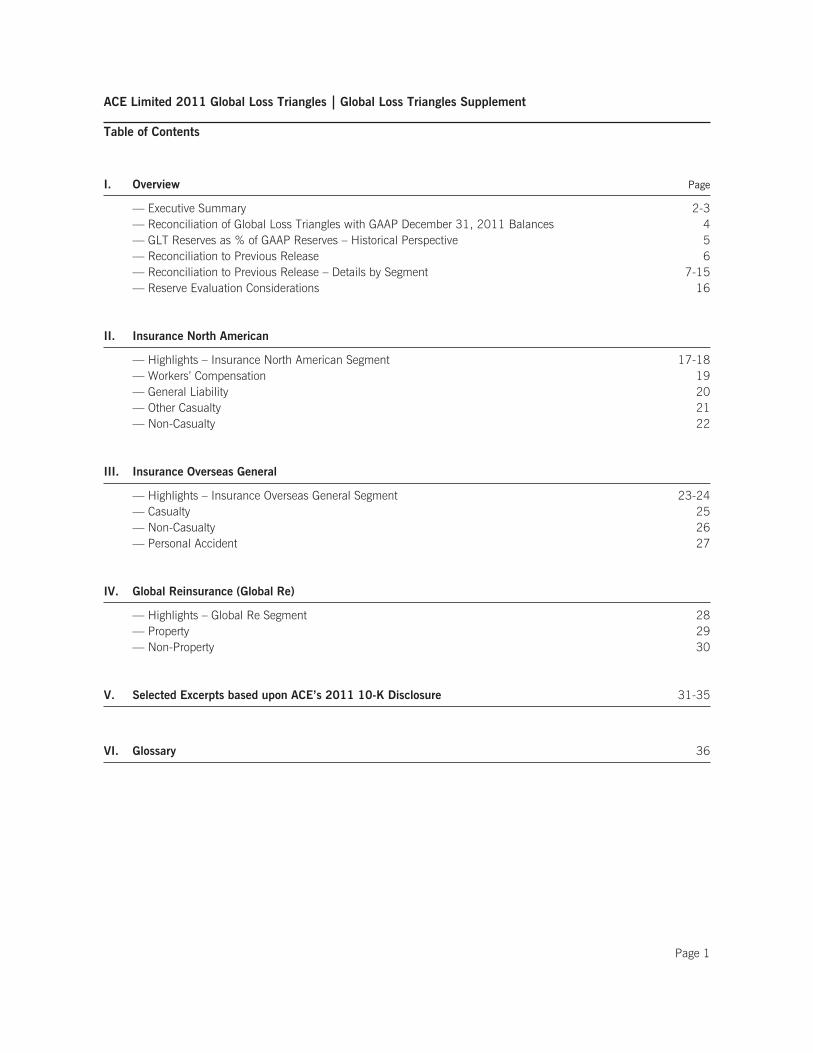
I. Overview Page
— Executive Summary 2-3— Reconciliation of Global Loss Triangles with GAAP December 31, 2011 Balances 4— GLT Reserves as % of GAAP Reserves – Historical Perspective 5— Reconciliation to Previous Release 6— Reconciliation to Previous Release – Details by Segment 7-15— Reserve Evaluation Considerations 16
II. Insurance North American
— Highlights – Insurance North American Segment 17-18— Workers’ Compensation 19— General Liability 20— Other Casualty 21— Non-Casualty 22
III. Insurance Overseas General
— Highlights – Insurance Overseas General Segment 23-24— Casualty 25— Non-Casualty 26— Personal Accident 27
IV. Global Reinsurance (Global Re)
— Highlights – Global Re Segment 28— Property 29— Non-Property 30
V. Selected Excerpts based upon ACE’s 2011 10-K Disclosure 31-35
VI. Glossary 36
Page 1

ACE Limited 2011 Global Loss Triangles Overview
Executive Summary
This document forms the supplement to ACE’s release of its Global Loss Triangles (GLT) as of December 31,2011. This year is our ninth GLT release with the purpose of providing the reader with the opportunity to use theirown judgment with respect to the adequacy of certain areas of our Property & Casualty (P&C) reserves and alsoproviding greater insight into ACE’s overall reserve balance and business in general. As discussed later in thisdocument, our reserving approach is a detailed ground-up process using data at a detailed level that reflects thespecific type and coverage of the diverse products written by our various operations. The aggregated data pre-sented in this release is therefore a consolidation of the numerous individual loss reserve triangles that areanalyzed by our actuarial staff. In addition, the market continues to see changes in both rates and terms and con-ditions. It is therefore difficult to prepare an aggregate disclosure that captures all of these aspects.
We advise that the inappropriate use of the aggregated data presented in this release may produce misleadingresults. However, we believe that with the requisite care and attention to analysis, the disclosure can be used bythe reader to provide insight about ACE’s loss reserves.
To assist the reader with their analysis, we have provided guidance where possible in the document on key assump-tions that should be considered when performing an analysis. Please see Pages 16, 17-18, 23-24, and 28.
In compiling this year’s release we have followed essentially the same format as released last year but we havealso made some modest changes to the data. These changes reflect actions from foreign exchange adjustmentsand continued enhancements to the compilation process.
The GLT supplement is comprised of the following information:• For direct business — accident year (AY) triangles of a) net paid loss plus paid allocated loss adjustment
expenses (ALAE) and b) net reported loss plus paid ALAE (i.e., excluding Incurred But Not Reported reserves(IBNR)) for the ten calendar years ending December 31, 2011.
• For reinsurance business — treaty year (TY) triangles of a) net paid loss plus paid ALAE and b) net reported lossplus paid ALAE (i.e., excluding IBNR) for the ten calendar years ending December 31, 2011.
• Net earned premium for each of the ten accident/treaty years ending December 31, 2011.
The triangle data are provided in line groupings under three of ACE’s four SEC reporting segments. The remainingsegment is Life business. Life business reserves are not typically subject to analysis using triangular actuarialmethodologies. The data associated with Life business is therefore not considered within the scope of the GLTrelease. The SEC reporting segments included are as follows:• Insurance North American Segment (excluding Financial Solutions business)
• Workers’ Compensation (WC)• General Liability (GL)• Other Casualty• Non-Casualty
• Insurance Overseas General Segment• Casualty• Non-Casualty• Personal Accident
• Global Reinsurance Segment• Property• Non-Property
Page 2

ACE Limited 2011 Global Loss Triangles Overview
Executive Summary (cont.)
Furthermore, the GLT supplement also contains the following:• A reconciliation of the GLT reserve balances with ACE’s published GAAP reserve balance ending December 31,
2011.• A reconciliation of the current data to that contained in the previous release.• A discussion of some factors to consider when analyzing loss reserve triangles.• Commentary highlighting aspects of the GLT triangles and their interpretations.• Relevant discussion from our 2011 10-K addressing ACE’s reserving process.
Page 3
ACE Limited 2011 Global Loss Triangles Overview
Reconciliation of GLT with GAAP December 31, 2011 Reserve Balances*
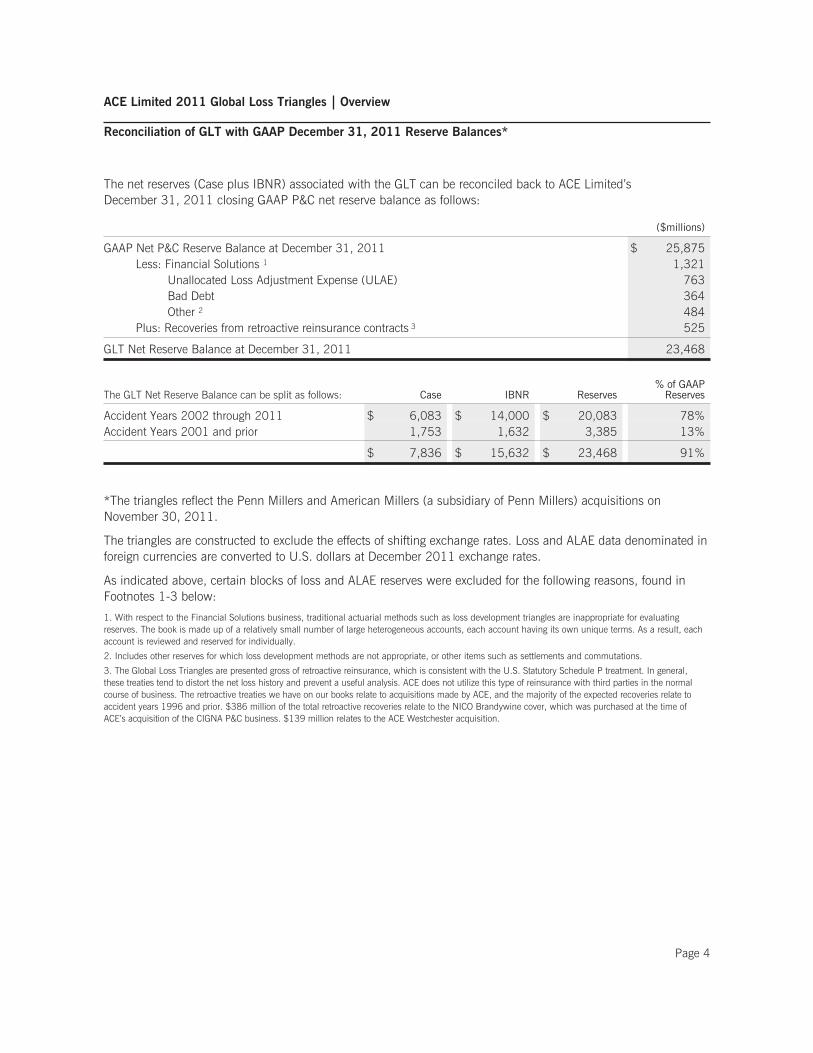
The net reserves (Case plus IBNR) associated with the GLT can be reconciled back to ACE Limited’sDecember 31, 2011 closing GAAP P&C net reserve balance as follows:
($millions)
GAAP Net P&C Reserve Balance at December 31, 2011 $ 25,875Less: Financial Solutions 1 1,321
Unallocated Loss Adjustment Expense (ULAE) 763Bad Debt 364Other 2 484
Plus: Recoveries from retroactive reinsurance contracts 3 525
GLT Net Reserve Balance at December 31, 2011 23,468
The GLT Net Reserve Balance can be split as follows: Case IBNR Reserves% of GAAP
Reserves
Accident Years 2002 through 2011 $ 6,083 $ 14,000 $ 20,083 78%Accident Years 2001 and prior 1,753 1,632 3,385 13%
$ 7,836 $ 15,632 $ 23,468 91%
*The triangles reflect the Penn Millers and American Millers (a subsidiary of Penn Millers) acquisitions onNovember 30, 2011.
The triangles are constructed to exclude the effects of shifting exchange rates. Loss and ALAE data denominated inforeign currencies are converted to U.S. dollars at December 2011 exchange rates.
As indicated above, certain blocks of loss and ALAE reserves were excluded for the following reasons, found inFootnotes 1-3 below:
1. With respect to the Financial Solutions business, traditional actuarial methods such as loss development triangles are inappropriate for evaluatingreserves. The book is made up of a relatively small number of large heterogeneous accounts, each account having its own unique terms. As a result, eachaccount is reviewed and reserved for individually.
2. Includes other reserves for which loss development methods are not appropriate, or other items such as settlements and commutations.
3. The Global Loss Triangles are presented gross of retroactive reinsurance, which is consistent with the U.S. Statutory Schedule P treatment. In general,these treaties tend to distort the net loss history and prevent a useful analysis. ACE does not utilize this type of reinsurance with third parties in the normalcourse of business. The retroactive treaties we have on our books relate to acquisitions made by ACE, and the majority of the expected recoveries relate toaccident years 1996 and prior. $386 million of the total retroactive recoveries relate to the NICO Brandywine cover, which was purchased at the time ofACE’s acquisition of the CIGNA P&C business. $139 million relates to the ACE Westchester acquisition.
Page 4
ACE Limited 2011 Global Loss Triangles Overview
GLT Reserves as % of GAAP Reserves – Historical Perspective
In $US millions
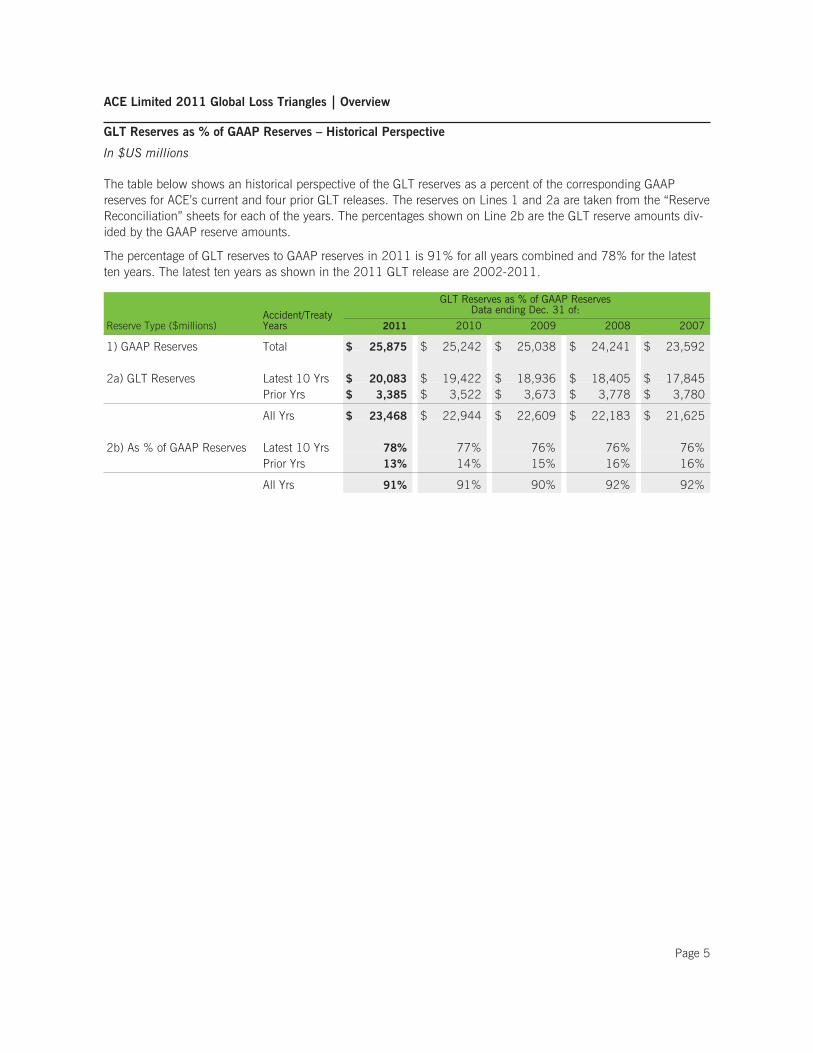
The table below shows an historical perspective of the GLT reserves as a percent of the corresponding GAAPreserves for ACE’s current and four prior GLT releases. The reserves on Lines 1 and 2a are taken from the “ReserveReconciliation” sheets for each of the years. The percentages shown on Line 2b are the GLT reserve amounts div-ided by the GAAP reserve amounts.
The percentage of GLT reserves to GAAP reserves in 2011 is 91% for all years combined and 78% for the latestten years. The latest ten years as shown in the 2011 GLT release are 2002-2011.
Reserve Type ($millions)Accident/TreatyYears
GLT Reserves as % of GAAP ReservesData ending Dec. 31 of:
2011 2010 2009 2008 2007
1) GAAP Reserves Total $ 25,875 $ 25,242 $ 25,038 $ 24,241 $ 23,592
2a) GLT Reserves Latest 10 Yrs $ 20,083 $ 19,422 $ 18,936 $ 18,405 $ 17,845Prior Yrs $ 3,385 $ 3,522 $ 3,673 $ 3,778 $ 3,780
All Yrs $ 23,468 $ 22,944 $ 22,609 $ 22,183 $ 21,625
2b) As % of GAAP Reserves Latest 10 Yrs 78% 77% 76% 76% 76%Prior Yrs 13% 14% 15% 16% 16%
All Yrs 91% 91% 90% 92% 92%
Page 5

ACE Limited 2011 Global Loss Triangles Overview
Reconciliation to Previous Release
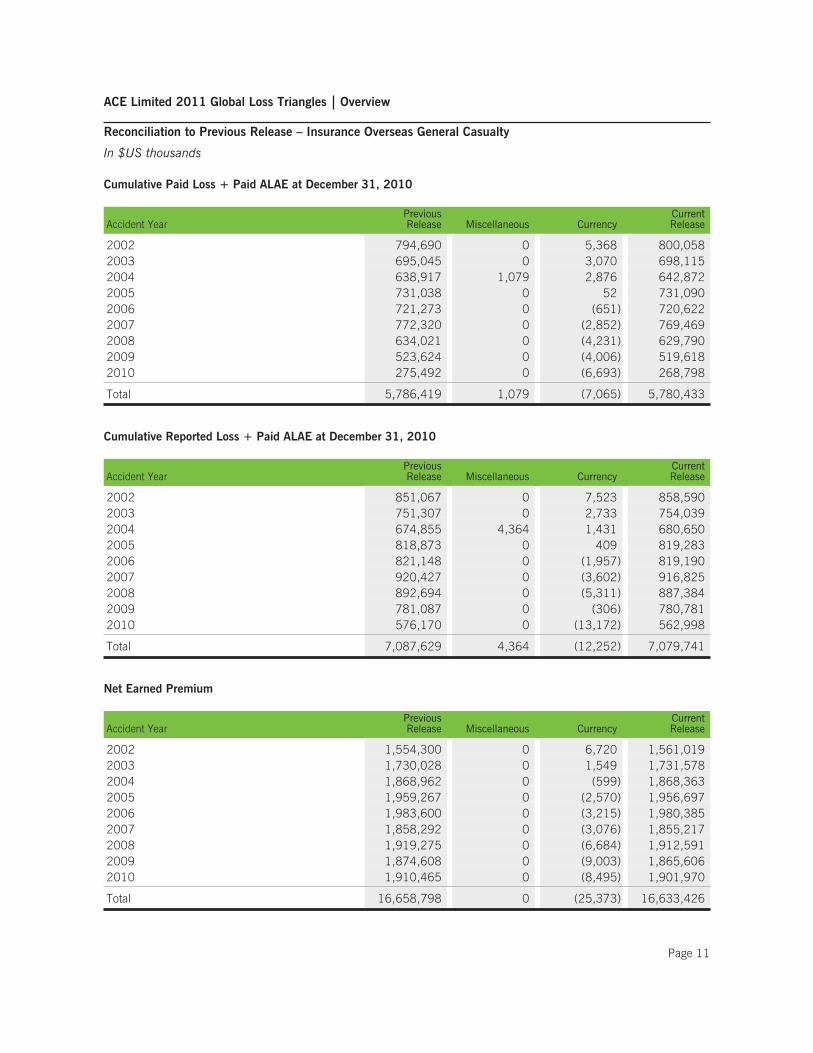
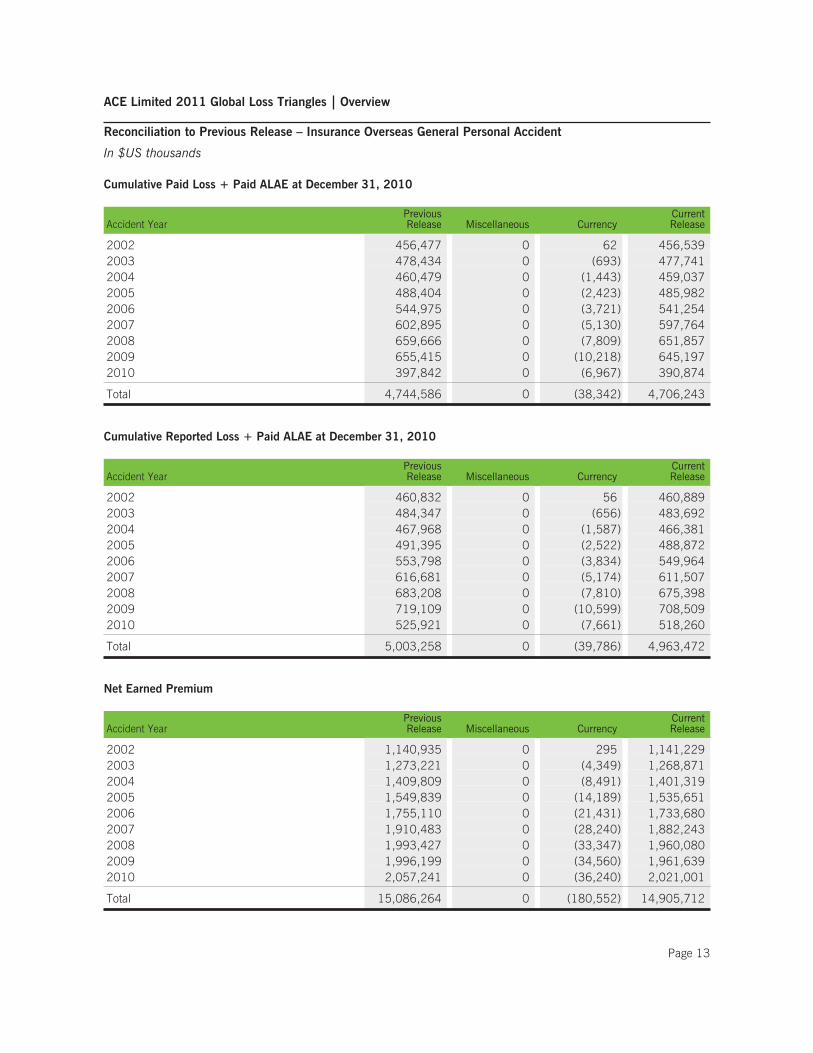
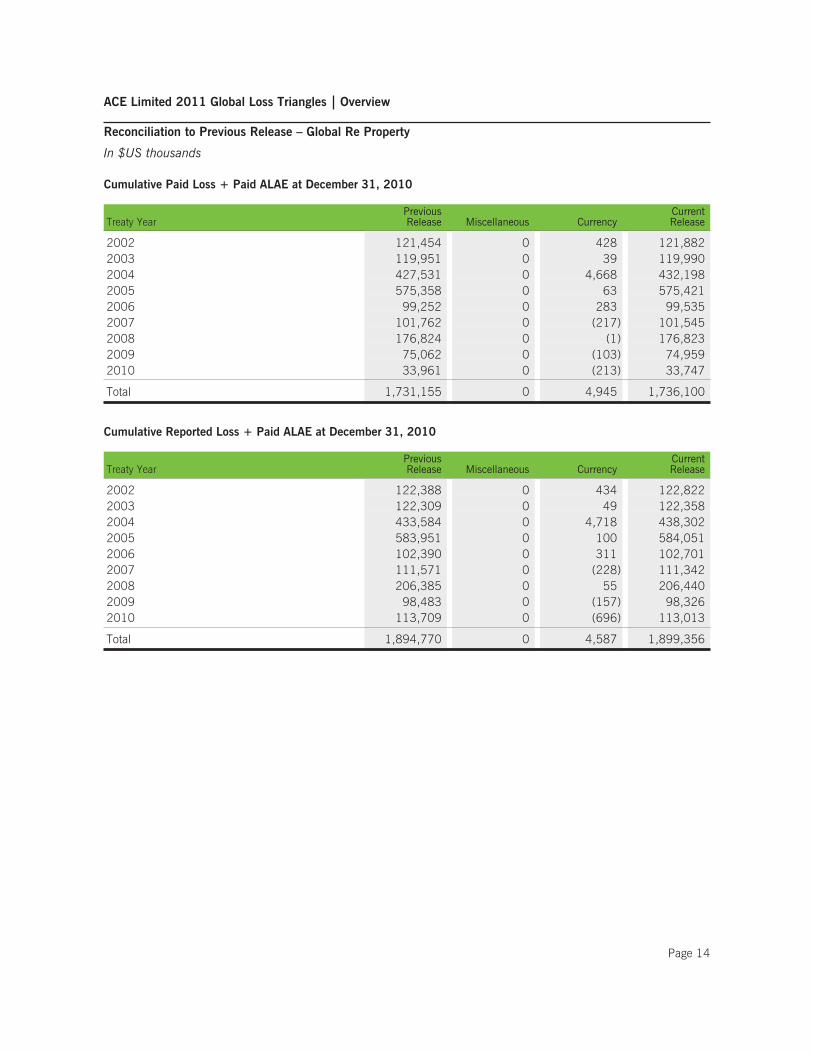
On the following pages we summarize the historical data changes by segment and accident/treaty year (2002-2010) at December 31, 2010 for paid loss, reported loss, and earned premium. The changes in paid losses andreported losses are the differences between the next to the last diagonal in the triangles from this release and thelast diagonal in the corresponding triangles from last year’s release. The impact associated with currency fluctua-tion is separated from other “miscellaneous” enhancements. Please see discussion below for more details.
As with prior releases of the GLTs, we reviewed the compilation process in detail, and have continued to identifyopportunities to improve the quality and scope of the GLT.
The most significant changes in the GLT data arise from Insurance North American and are noted below.
A number of other enhancements are also reflected in the 2011 GLTs. Although these enhancements are relativelyminor in the context of the overall reserves, we believe their inclusion provides an improved data set for the reader.
A discussion of the changes by reporting segment is included below.
Insurance North American
A comparison of this year’s GLT with the previous release shows paid losses increased by 1%, reported losses increasedby 1%, and premiums increased by 1% across accident years 2002-2010 combined.• Miscellaneous
Inclusion of the historical data for both Penn Millers and American Millers as a result of their November 30,2011 acquisition. Increased earned premiums by $595 million, paid losses by $290 million, and reportedlosses by $340 million. Impact was across all four Insurance North American line groupings.Correction of net earned premium for calendar year 2010 in one Insurance North American unit. Increasedearned premium in Insurance North American Other Casualty by $48 million and decreased earned premiumfor Insurance North American Non-Casualty by $14 million.Correction of paid losses and reported losses for accident year 2010 in another Insurance North American unit.Decreased paid losses and reported losses for Insurance North American Workers’ Compensation by $15 million;and increased paid losses for Insurance North American General Liability by $8 million and decreased reportedlosses for Insurance North American General Liability by $16 million.
• Currency
Effect of restating historical values at December 2011 exchange rates
Insurance Overseas General
A comparison of this year’s GLT with the previous release shows paid losses decreased by less than 1%, reported lossesdecreased by less than 1%, and premiums decreased by less than 1% across accident years 2002-2010 combined.• Miscellaneous
None• Currency
Effect of restating historical values at December 2011 exchange rates
Global Re
A comparison of this year’s GLT with the previous release shows paid losses increased by less than 1% and reportedlosses decreased by less than 1% over treaty years 2002-2010 combined. A comparison of the earned premium figureswould show large increases as treaty years naturally advance towards being fully earned. Therefore we have not shownthis comparison within the reconciliation schedules.• Miscellaneous
None• Currency
Effect of restating historical values at December 2011 exchange rates
For future releases, we will continue to review the content and segmentation of the triangles to ensure that theyprovide a useful representation of our evolving business profile.
Page 6

ACE Limited 2011 Global Loss Triangles Overview
Reconciliation to Previous Release – Insurance North American Workers’ Compensation
In $US thousands
Cumulative Paid Loss + Paid ALAE at December 31, 2010
Accident YearPreviousRelease Miscellaneous Currency
CurrentRelease
2002 116,885 3,796 (13) 120,6672003 147,748 3,955 (18) 151,6862004 200,539 5,206 (10) 205,7352005 306,617 5,063 (6) 311,6742006 323,789 6,497 (5) 330,2812007 245,355 7,145 (4) 252,4952008 182,702 7,528 (5) 190,2252009 117,706 4,172 (2) 121,8762010 76,902 (13,600) 0 63,303
Total 1,718,244 29,762 (64) 1,747,943
Cumulative Reported Loss + Paid ALAE at December 31, 2010
Accident YearPreviousRelease Miscellaneous Currency
CurrentRelease
2002 146,128 3,976 (14) 150,0912003 198,795 4,974 (22) 203,7472004 270,262 5,773 (10) 276,0252005 402,263 5,684 (7) 407,9402006 432,442 7,911 (10) 440,3432007 355,776 8,546 (10) 364,3122008 305,193 9,852 (11) 315,0352009 222,102 6,345 (10) 228,4362010 164,688 (9,913) (4) 154,771
Total 2,497,648 43,148 (98) 2,540,699
Net Earned Premium
Accident YearPreviousRelease Miscellaneous Currency
CurrentRelease
2002 375,304 5,950 (1,857) 379,3972003 615,016 7,773 (2,328) 620,4612004 907,979 9,587 (3,230) 914,3362005 1,263,078 10,885 (4,558) 1,269,4052006 1,319,839 11,579 8,738 1,340,1562007 1,249,688 13,890 3,539 1,267,1172008 1,049,522 16,023 7,476 1,073,0212009 962,527 14,206 (8,832) 967,9022010 998,607 12,141 (1,945) 1,008,803
Total 8,741,561 102,034 (2,997) 8,840,599
Page 7
ACE Limited 2011 Global Loss Triangles Overview
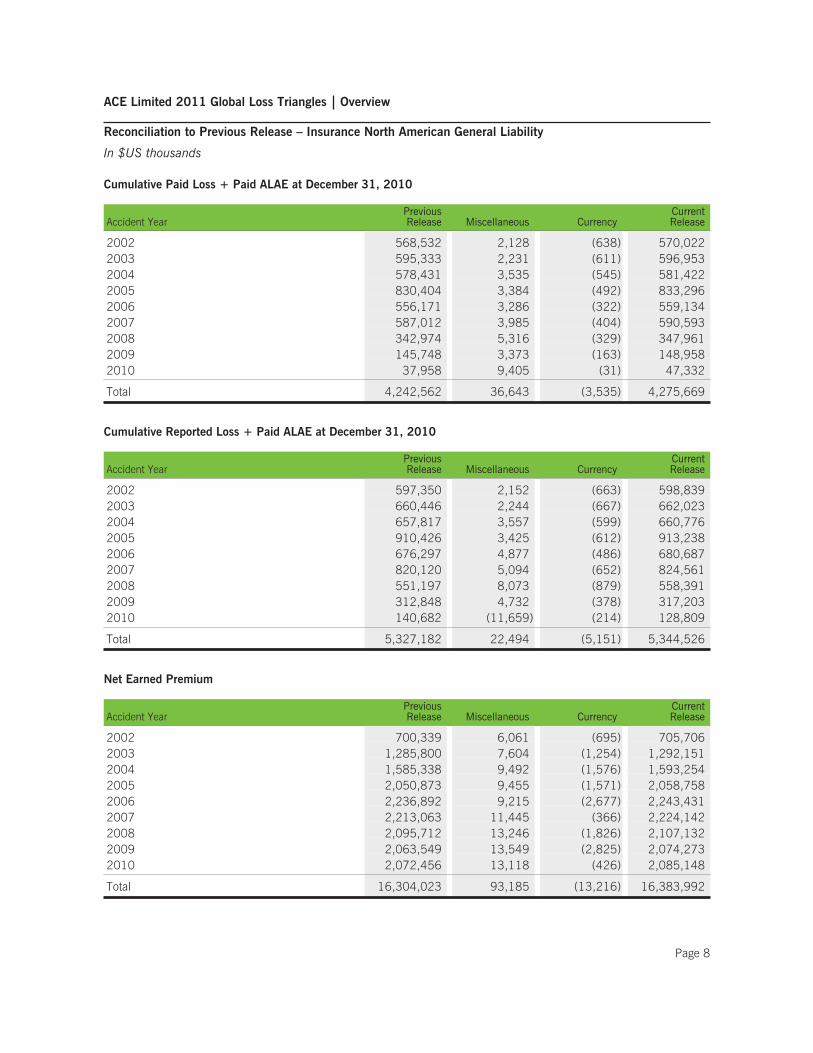
Reconciliation to Previous Release – Insurance North American General Liability
In $US thousands
Cumulative Paid Loss + Paid ALAE at December 31, 2010
Accident YearPreviousRelease Miscellaneous Currency
CurrentRelease
2002 568,532 2,128 (638) 570,0222003 595,333 2,231 (611) 596,9532004 578,431 3,535 (545) 581,4222005 830,404 3,384 (492) 833,2962006 556,171 3,286 (322) 559,1342007 587,012 3,985 (404) 590,5932008 342,974 5,316 (329) 347,9612009 145,748 3,373 (163) 148,9582010 37,958 9,405 (31) 47,332
Total 4,242,562 36,643 (3,535) 4,275,669
Cumulative Reported Loss + Paid ALAE at December 31, 2010
Accident YearPreviousRelease Miscellaneous Currency
CurrentRelease
2002 597,350 2,152 (663) 598,8392003 660,446 2,244 (667) 662,0232004 657,817 3,557 (599) 660,7762005 910,426 3,425 (612) 913,2382006 676,297 4,877 (486) 680,6872007 820,120 5,094 (652) 824,5612008 551,197 8,073 (879) 558,3912009 312,848 4,732 (378) 317,2032010 140,682 (11,659) (214) 128,809
Total 5,327,182 22,494 (5,151) 5,344,526
Net Earned Premium
Accident YearPreviousRelease Miscellaneous Currency
CurrentRelease
2002 700,339 6,061 (695) 705,7062003 1,285,800 7,604 (1,254) 1,292,1512004 1,585,338 9,492 (1,576) 1,593,2542005 2,050,873 9,455 (1,571) 2,058,7582006 2,236,892 9,215 (2,677) 2,243,4312007 2,213,063 11,445 (366) 2,224,1422008 2,095,712 13,246 (1,826) 2,107,1322009 2,063,549 13,549 (2,825) 2,074,2732010 2,072,456 13,118 (426) 2,085,148
Total 16,304,023 93,185 (13,216) 16,383,992
Page 8

ACE Limited 2011 Global Loss Triangles Overview
Reconciliation to Previous Release – Insurance North American Other Casualty
In $US thousands
Cumulative Paid Loss + Paid ALAE at December 31, 2010
Accident YearPreviousRelease Miscellaneous Currency
CurrentRelease
2002 277,700 17,275 (354) 294,6222003 347,554 13,790 (468) 360,8772004 352,689 13,812 (494) 366,0072005 426,586 14,206 (357) 440,4362006 377,313 10,159 (348) 387,1242007 362,083 11,688 (427) 373,3432008 561,556 9,405 (574) 570,3872009 275,160 6,043 (315) 280,8882010 217,192 4,908 (111) 221,989
Total 3,197,834 101,286 (3,447) 3,295,674
Cumulative Reported Loss + Paid ALAE at December 31, 2010
Accident YearPreviousRelease Miscellaneous Currency
CurrentRelease
2002 293,763 17,301 (355) 310,7102003 348,549 13,792 (490) 361,8512004 368,587 14,351 (577) 382,3612005 428,169 15,017 (396) 442,7902006 396,964 11,539 (404) 408,0992007 413,431 13,000 (629) 425,8022008 635,397 17,239 (644) 651,9922009 359,493 9,740 (512) 368,7212010 363,953 9,320 (234) 373,039
Total 3,608,308 121,299 (4,242) 3,725,365
Net Earned Premium
Accident YearPreviousRelease Miscellaneous Currency
CurrentRelease
2002 556,979 24,008 (524) 580,4642003 676,264 21,755 (829) 697,1892004 590,821 22,318 (1,101) 612,0382005 752,832 22,692 (1,063) 774,4612006 820,328 22,815 (886) 842,2572007 911,126 23,605 (1,015) 933,7162008 969,348 24,045 (982) 992,4112009 838,095 22,322 (1,062) 859,3552010 790,127 66,761 (564) 856,324
Total 6,905,920 250,321 (8,026) 7,148,215
Page 9
ACE Limited 2011 Global Loss Triangles Overview
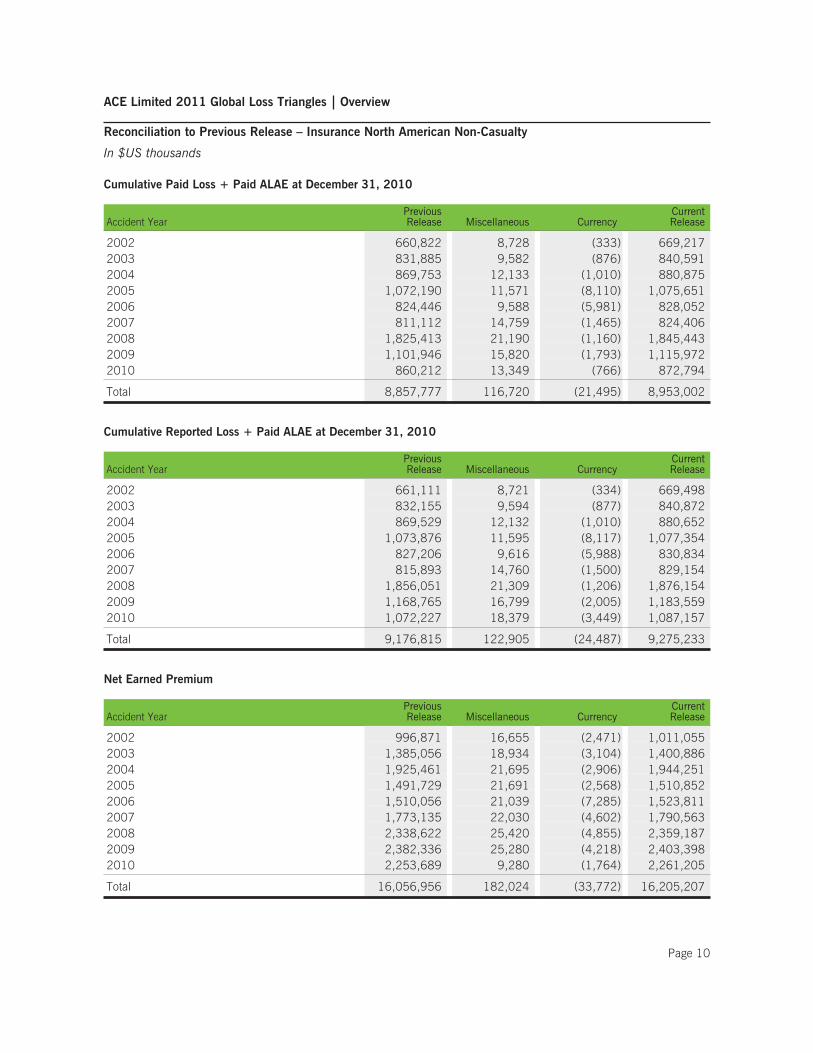
Reconciliation to Previous Release – Insurance North American Non-Casualty
In $US thousands
Cumulative Paid Loss + Paid ALAE at December 31, 2010
Accident YearPreviousRelease Miscellaneous Currency
CurrentRelease
2002 660,822 8,728 (333) 669,2172003 831,885 9,582 (876) 840,5912004 869,753 12,133 (1,010) 880,8752005 1,072,190 11,571 (8,110) 1,075,6512006 824,446 9,588 (5,981) 828,0522007 811,112 14,759 (1,465) 824,4062008 1,825,413 21,190 (1,160) 1,845,4432009 1,101,946 15,820 (1,793) 1,115,9722010 860,212 13,349 (766) 872,794
Total 8,857,777 116,720 (21,495) 8,953,002
Cumulative Reported Loss + Paid ALAE at December 31, 2010
Accident YearPreviousRelease Miscellaneous Currency
CurrentRelease
2002 661,111 8,721 (334) 669,4982003 832,155 9,594 (877) 840,8722004 869,529 12,132 (1,010) 880,6522005 1,073,876 11,595 (8,117) 1,077,3542006 827,206 9,616 (5,988) 830,8342007 815,893 14,760 (1,500) 829,1542008 1,856,051 21,309 (1,206) 1,876,1542009 1,168,765 16,799 (2,005) 1,183,5592010 1,072,227 18,379 (3,449) 1,087,157
Total 9,176,815 122,905 (24,487) 9,275,233
Net Earned Premium
Accident YearPreviousRelease Miscellaneous Currency
CurrentRelease
2002 996,871 16,655 (2,471) 1,011,0552003 1,385,056 18,934 (3,104) 1,400,8862004 1,925,461 21,695 (2,906) 1,944,2512005 1,491,729 21,691 (2,568) 1,510,8522006 1,510,056 21,039 (7,285) 1,523,8112007 1,773,135 22,030 (4,602) 1,790,5632008 2,338,622 25,420 (4,855) 2,359,1872009 2,382,336 25,280 (4,218) 2,403,3982010 2,253,689 9,280 (1,764) 2,261,205
Total 16,056,956 182,024 (33,772) 16,205,207
Page 10
ACE Limited 2011 Global Loss Triangles Overview
Reconciliation to Previous Release – Insurance Overseas General Casualty
In $US thousands
Cumulative Paid Loss + Paid ALAE at December 31, 2010
Accident YearPreviousRelease Miscellaneous Currency
CurrentRelease
2002 794,690 0 5,368 800,0582003 695,045 0 3,070 698,1152004 638,917 1,079 2,876 642,8722005 731,038 0 52 731,0902006 721,273 0 (651) 720,6222007 772,320 0 (2,852) 769,4692008 634,021 0 (4,231) 629,7902009 523,624 0 (4,006) 519,6182010 275,492 0 (6,693) 268,798
Total 5,786,419 1,079 (7,065) 5,780,433
Cumulative Reported Loss + Paid ALAE at December 31, 2010
Accident YearPreviousRelease Miscellaneous Currency
CurrentRelease
2002 851,067 0 7,523 858,5902003 751,307 0 2,733 754,0392004 674,855 4,364 1,431 680,6502005 818,873 0 409 819,2832006 821,148 0 (1,957) 819,1902007 920,427 0 (3,602) 916,8252008 892,694 0 (5,311) 887,3842009 781,087 0 (306) 780,7812010 576,170 0 (13,172) 562,998
Total 7,087,629 4,364 (12,252) 7,079,741
Net Earned Premium
Accident YearPreviousRelease Miscellaneous Currency
CurrentRelease
2002 1,554,300 0 6,720 1,561,0192003 1,730,028 0 1,549 1,731,5782004 1,868,962 0 (599) 1,868,3632005 1,959,267 0 (2,570) 1,956,6972006 1,983,600 0 (3,215) 1,980,3852007 1,858,292 0 (3,076) 1,855,2172008 1,919,275 0 (6,684) 1,912,5912009 1,874,608 0 (9,003) 1,865,6062010 1,910,465 0 (8,495) 1,901,970
Total 16,658,798 0 (25,373) 16,633,426
Page 11

ACE Limited 2011 Global Loss Triangles Overview
Reconciliation to Previous Release – Insurance Overseas General Non-Casualty
In $US thousands
Cumulative Paid Loss + Paid ALAE at December 31, 2010
Accident YearPreviousRelease Miscellaneous Currency
CurrentRelease
2002 473,697 0 (2,286) 471,4102003 522,431 0 (2,924) 519,5072004 599,220 0 (3,058) 596,1622005 721,361 0 (5,200) 716,1612006 477,927 0 (3,432) 474,4962007 563,247 0 (5,706) 557,5412008 568,033 0 (3,922) 564,1102009 425,464 0 (5,109) 420,3552010 257,103 0 (2,933) 254,169
Total 4,608,482 0 (34,570) 4,573,912
Cumulative Reported Loss + Paid ALAE at December 31, 2010
Accident YearPreviousRelease Miscellaneous Currency
CurrentRelease
2002 476,184 0 (4,473) 471,7102003 526,648 0 (2,979) 523,6692004 607,174 0 (1,796) 605,3782005 740,954 0 (4,696) 736,2582006 501,824 0 (3,844) 497,9802007 606,140 0 (5,853) 600,2882008 675,214 0 (5,250) 669,9642009 590,355 0 (6,342) 584,0132010 577,175 0 (15,697) 561,477
Total 5,301,669 0 (50,930) 5,250,738
Net Earned Premium
Accident YearPreviousRelease Miscellaneous Currency
CurrentRelease
2002 870,016 0 (824) 869,1922003 1,245,235 0 (3,488) 1,241,7462004 1,345,421 0 (5,323) 1,340,0982005 1,268,038 0 (5,897) 1,262,1412006 1,216,999 0 (7,292) 1,209,7082007 1,209,883 0 (9,372) 1,200,5122008 1,225,760 0 (13,530) 1,212,2302009 1,216,608 0 (14,084) 1,202,5242010 1,297,551 0 (8,460) 1,289,091
Total 10,895,510 0 (68,270) 10,827,240
Page 12
ACE Limited 2011 Global Loss Triangles Overview
Reconciliation to Previous Release – Insurance Overseas General Personal Accident
In $US thousands
Cumulative Paid Loss + Paid ALAE at December 31, 2010
Accident YearPreviousRelease Miscellaneous Currency
CurrentRelease
2002 456,477 0 62 456,5392003 478,434 0 (693) 477,7412004 460,479 0 (1,443) 459,0372005 488,404 0 (2,423) 485,9822006 544,975 0 (3,721) 541,2542007 602,895 0 (5,130) 597,7642008 659,666 0 (7,809) 651,8572009 655,415 0 (10,218) 645,1972010 397,842 0 (6,967) 390,874
Total 4,744,586 0 (38,342) 4,706,243
Cumulative Reported Loss + Paid ALAE at December 31, 2010
Accident YearPreviousRelease Miscellaneous Currency
CurrentRelease
2002 460,832 0 56 460,8892003 484,347 0 (656) 483,6922004 467,968 0 (1,587) 466,3812005 491,395 0 (2,522) 488,8722006 553,798 0 (3,834) 549,9642007 616,681 0 (5,174) 611,5072008 683,208 0 (7,810) 675,3982009 719,109 0 (10,599) 708,5092010 525,921 0 (7,661) 518,260
Total 5,003,258 0 (39,786) 4,963,472
Net Earned Premium
Accident YearPreviousRelease Miscellaneous Currency
CurrentRelease
2002 1,140,935 0 295 1,141,2292003 1,273,221 0 (4,349) 1,268,8712004 1,409,809 0 (8,491) 1,401,3192005 1,549,839 0 (14,189) 1,535,6512006 1,755,110 0 (21,431) 1,733,6802007 1,910,483 0 (28,240) 1,882,2432008 1,993,427 0 (33,347) 1,960,0802009 1,996,199 0 (34,560) 1,961,6392010 2,057,241 0 (36,240) 2,021,001
Total 15,086,264 0 (180,552) 14,905,712
Page 13
ACE Limited 2011 Global Loss Triangles Overview
Reconciliation to Previous Release – Global Re Property
In $US thousands
Cumulative Paid Loss + Paid ALAE at December 31, 2010
Treaty YearPreviousRelease Miscellaneous Currency
CurrentRelease
2002 121,454 0 428 121,8822003 119,951 0 39 119,9902004 427,531 0 4,668 432,1982005 575,358 0 63 575,4212006 99,252 0 283 99,5352007 101,762 0 (217) 101,5452008 176,824 0 (1) 176,8232009 75,062 0 (103) 74,9592010 33,961 0 (213) 33,747
Total 1,731,155 0 4,945 1,736,100
Cumulative Reported Loss + Paid ALAE at December 31, 2010
Treaty YearPreviousRelease Miscellaneous Currency
CurrentRelease
2002 122,388 0 434 122,8222003 122,309 0 49 122,3582004 433,584 0 4,718 438,3022005 583,951 0 100 584,0512006 102,390 0 311 102,7012007 111,571 0 (228) 111,3422008 206,385 0 55 206,4402009 98,483 0 (157) 98,3262010 113,709 0 (696) 113,013
Total 1,894,770 0 4,587 1,899,356
Page 14

ACE Limited 2011 Global Loss Triangles Overview
Reconciliation to Previous Release – Global Re Non-Property
In $US thousands
Cumulative Paid Loss + Paid ALAE at December 31, 2010
Treaty YearPreviousRelease Miscellaneous Currency
CurrentRelease
2002 196,921 0 (23) 196,8982003 294,480 0 (1,449) 293,0322004 328,596 0 356 328,9522005 348,187 0 211 348,3982006 264,265 0 (2,606) 261,6592007 166,209 0 (1,538) 164,6712008 121,197 0 43 121,2402009 61,997 0 82 62,0792010 14,632 0 (1) 14,631
Total 1,796,485 0 (4,926) 1,791,559
Cumulative Reported Loss + Paid ALAE at December 31, 2010
Treaty YearPreviousRelease Miscellaneous Currency
CurrentRelease
2002 228,599 0 (153) 228,4462003 353,190 0 (1,482) 351,7082004 402,382 0 299 402,6812005 432,930 0 168 433,0982006 372,655 0 (2,706) 369,9502007 264,779 0 (1,635) 263,1442008 221,875 0 (88) 221,7882009 117,440 0 (1) 117,4392010 49,745 0 (31) 49,713
Total 2,443,594 0 (5,628) 2,437,966
Page 15

ACE Limited 2011 Global Loss Triangles Overview
Reserve Evaluation Considerations
We have actuarial staff in each of our operating segments who track insurance reserves and regularly evaluate thelevels of loss reserves, taking into consideration factors that may impact the ultimate loss reserves. This is accom-plished not only by employing a variety of actuarial methods, but also by applying judgment to help quantify theimpact of these variables.
Considerable caution should be used when attempting to analyze reserve adequacy based on aggregated triangles.It is rare that the data is so consistent, homogeneous, and static that a valid analysis is possible without exercisingsubstantial judgment. Results can be distorted by both industry-wide and company-specific factors. Below is anon-exhaustive list of possible pitfalls:• Paid and reported chain ladder loss development methods can be particularly volatile at early evaluation points
for more recent accident years, especially for longer-tailed lines. In those situations, the expected percentage ofpaid (reported) claims is low, and so small differences between actual and expected claims can produce largedifferences in projected ultimate losses. In such cases, we would recommend relying on an expected loss tech-nique. One expected loss technique not addressed in Sholom Feldblum’s paper (see below) is the Bornhuetter-Ferguson method (1), which can be modified to incorporate information on changing premium rates in ananalysis of reserve adequacy.
• Certain methods for judging reserve adequacy assume that expected loss ratios (ELRs) do not change over time.In fact, ELRs can change substantially from year to year due to many reasons (e.g., change in rates, change inmix of business, etc.). In recent years, a soft market has produced lower rates and some loosening of terms andconditions for some lines, which should result in higher ELRs. If these rate changes are not taken into consid-eration, indicated reserves will most likely be understated, or explained another way, any resulting indicatedreserve redundancies/deficiencies may be misleading. While we consider ACE’s actual rate change informationto be proprietary, there are a number of public sources that can be used as a proxy to adjust loss ratios to amore appropriate level. These sources include, but are not limited to, the Council of Insurance Agents & Brokers(CIAB) Commercial P&C Market Survey, Lloyd’s of London Premium Rating Index, and Towers Watson Direc-tors & Officers Liability Survey.
• Changes in inflation rates distort any reserve analysis based on loss triangles. If expected future inflation islower (higher) than historical inflation rates, needed reserves may be overstated (understated) as a result, andappropriate adjustments should be made. If inflation rates are stable over time, no adjustment may be required.
• Many other changes and distortions (e.g., change in reinsurance structure, large losses, change in settlementrates, change in mix of business (e.g., primary vs excess; or by state/country), change in volume, etc.) can skewthe results of a reserve analysis based on aggregated triangles. These distortions are not always easily correctedfor and the reasonableness of the final projection should consider the possible influence of these factors.
• Contained in the triangles there may be instances of modest negative case reserves (calculated by taking thedifference between the reported and paid at a given development age for a particular accident year). This istypically due to timing differences associated primarily with ceded reinsurance. In our view, these negative casereserves will not significantly distort an analysis nor detract from the usefulness of the information provided.
There are a number of valid prospective tests of reserve adequacy that can be performed based on consolidatedtriangles. One excellent source of information on the various methods is Completing and Using Schedule P bySholom Feldblum (2). It is strongly recommended that anyone attempting to analyze reserves presented in losstriangles be familiar with the methods detailed in the section entitled “Loss Reserve Adequacy Testing – Pro-spective Valuation.”(1) Publicly available on the Casualty Actuarial Society’s web site at the following address
http://www.casact.org/pubs/proceed/proceed72/72181.pdf(2) Publicly available on the Casualty Actuarial Society’s web site at the following address
http://www.casact.org/pubs/forum/02fforum/02ff353.pdf
Page 16
ACE Limited 2011 Global Loss Triangles Insurance North American Segment
Highlights
Insurance North American SegmentThe Insurance North American segment is comprised of business written by ACE USA, ACE Westchester, ACEBermuda, ACE Commercial Risk Services, ACE Agriculture and ACE Private Risk Services. ACE USA is our U.S.based retail operation writing primarily specialty commercial lines through national and regional brokers. Includedin this unit are ACE Canada – a writer of commercial lines and accident & health (A&H) business throughoutCanada, and ACE Financial Solutions (AFS) – a writer of large risk management transactions including loss portfo-lio transfers (LPTs). ACE Westchester is our U.S. based wholesale operation writing specialty commercial linesproduced by wholesale and excess & surplus (E&S) distribution channels. ACE Bermuda writes high excess prop-erty and liability coverage including products liability and directors and officers (D&O), principally with Side A/CODA coverage for U.S. exposures, and political risk. Included in this unit is ACE Financial Solutions International(FSI) – now in runoff, which was a writer of large structured transactions including LPTs.
ACE Commercial Risk Services is our U.S. based operation targeting primarily small to middle market commerciallines risks through a variety of distribution channels including programs. ACE Agriculture is our U.S. based farm,crop and commercial agriculture insurance operation which includes the Rain and Hail business and two compa-nies acquired on November 30, 2011, Penn Millers Insurance Company and American Millers InsuranceCompany. The historical data for both of these newly acquired companies has been included in the 2011 GLTs forall accident years. ACE Private Risk Services is a writer of personal lines coverages with a target market of affluentand high net worth insureds. All of the Insurance North American operations have been included in the loss tri-angles with the exception of AFS and FSI, where we have excluded these businesses since the accountingtreatment of LPTs would distort the paid and incurred loss development patterns.
There are three important points with regards to the “Prior” line. First, the “Prior” line shown here is gross of retroactivereinsurance (NICO treaties). Second, it would be incorrect to apply a single loss development factor to the “Prior” line,as it does not represent a single accident year but the total activity in accident years 2001 and prior. Third, all of ACE’sAsbestos and Environmental exposure is contained in the “Prior” line of the General Liability and Other Casualty tri-angles. Development factors derived from loss triangles are inappropriate for analysis of this exposure.
Insurance North American – Workers’ CompensationThe U.S. Statutory Schedule P filings for workers’ compensation are net of two separate internal reinsurance trans-actions between the ACE American Pool and other ACE entities which distort the loss development shown inSchedule P. These transactions have been unwound in the loss triangles included in this supplement in order toprovide a more complete representation of the U.S.-based WC business.
The WC line has experienced shifts in mix by business type during the ten year experience period included in theloss triangles. In the earliest year, 2002, the market was hardening and our national account business’s premiumvolume was growing significantly. Approximately 78% of total net earned premium (NEP) was from high deduc-tible business. In 2004, we launched a small workers’ compensation initiative, offering only first dollar costcoverage in select states including California. As a result, the percentage of first dollar exposure business grewrapidly from 2004 to 2006, but then decreased in volume from 2007 onwards. The mix of premium with firstdollar exposure, guaranteed cost and loss sensitive, is about 30% of the NEP in 2011.
Throughout the experience period shown in the loss triangles, our WC exposure has been heavily concentrated inrisk management business which includes high deductible policies, loss sensitive business (i.e. retro policies) andbusiness fronted for captives. NEP for these risk management accounts have significant administrative expensesand unallocated loss expenses components. As a result, the loss and ALAE component of the NEP is much lower
Page 17
ACE Limited 2011 Global Loss Triangles Insurance North American Segment
Highlights (cont.)
than primary or guaranteed cost policies making loss projection methods that rely on expected loss ratios based onindustry experience (or prior year loss ratios) inappropriate.
Insurance North American – General LiabilityThe triangles consist of primary general liability, excess liability, D&O, and professional liability exposures. Theprimary general liability and excess liability exposures represent the largest part of the exposures and are typicallywritten in the U.S. on an occurrence form, while the D&O and professional liability exposures are written on aclaims made form. ACE Bermuda writes excess liability on a “claims first reported” form, which means that cover-age is triggered when news of a potential claim is received, potentially well in advance of a claim being filed.Bermuda typically writes at high attachment points, particularly on its excess liability book. The nature of ACEBermuda excess liability claims, low frequency due to high attachments with large policy limits, creates a volatilereporting pattern. When claim activity does occur, it produces abnormal volatility in the loss triangles at later ageswithin an accident year due to the complex nature of the underlying claim. (An example of such activity occurredduring the 2010 calendar year where development on the Bermuda portfolio contributed to the high case incurredactivity in the 2005 and 2007 accident years).
The U.S. exposure during 2002 was mostly primary standard lines coverage. Premium volume in specialty linesincluding D&O, professional liability (including hospital professional) and excess casualty started to become morematerial from 2003 as the volume of these products grew during a period of strong rate levels in the hard market.As rate adequacy began to decline in 2006 and 2007, the rate of growth had slowed and then declined. Claimsmade business in total has averaged a little more than 40% of our total General Liability NEP over the last tenyears.
Finally, in ACE’s U.S. Statutory Schedule P, warranty business appears in Other Liability – Occurrence. The charac-teristics of warranty contracts are different from standard general liability exposures (i.e. claims are settled quickly,case reserves are generally not established, and premium earnings are deferred over the life of the contract ratherthan earning premium and recording IBNR reserves for future claims, which is consistent with industry practices).Therefore, we have removed data associated with warranty business from the triangles.
Insurance North American – Other CasualtyThe triangles consist of the non-WC and non-GL casualty lines of business such as automobile liability, commer-cial multi-peril (CMP; includes both property and liability), homeowners, political risk, marine and aviation. Thepaid and reported data are impacted by some catastrophe loss activity primarily on CMP exposures, homeownersexposures and to a lesser extent, marine exposures. The ultimate loss ratio for the 2005 year will be impacted bylosses associated with the 2005 hurricanes, including Hurricanes Katrina, Rita, and Wilma. The same is true forthe 2008 year where losses will be impacted by catastrophes, primarily Hurricane Ike. Beginning with the 2008accident year, this product line includes the majority of the business written by our Private Risk Services operation.
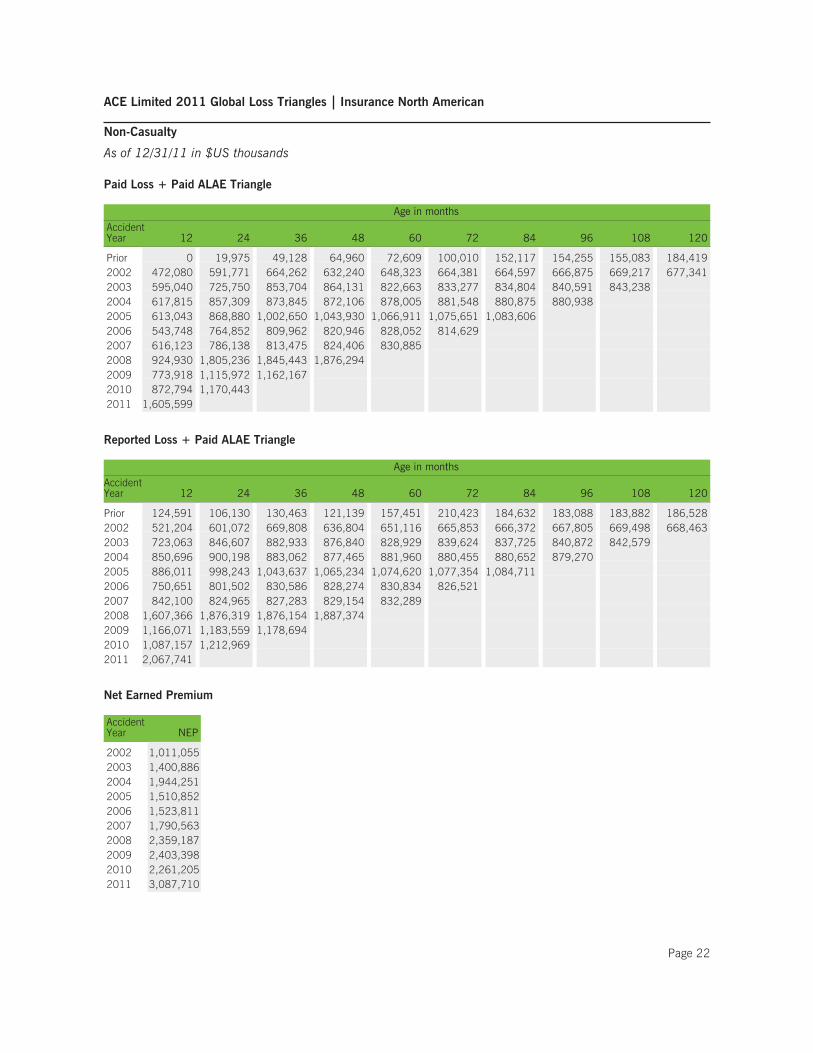
Insurance North American – Non-CasualtyThis business represents first party product lines which are short-tailed in nature. The early years are predom-inantly lines such as property, inland marine, fidelity and surety. During this ten year period, our accident & healthbusiness grew substantially. In addition with the acquisition of the Rain & Hail business, the historical loss devel-opment experience of this business has been added to our triangles. This has dramatically increased the mixture ofcrop hail business within this triangle. By 2011, our crop hail business and our accident and health businessmade up 69% of NEP, up from 45% in 2002. The increase in net earned premium from accident year 2010 toaccident year 2011 is mainly due to crop hail business.
Page 18
ACE Limited 2011 Global Loss Triangles Insurance North American
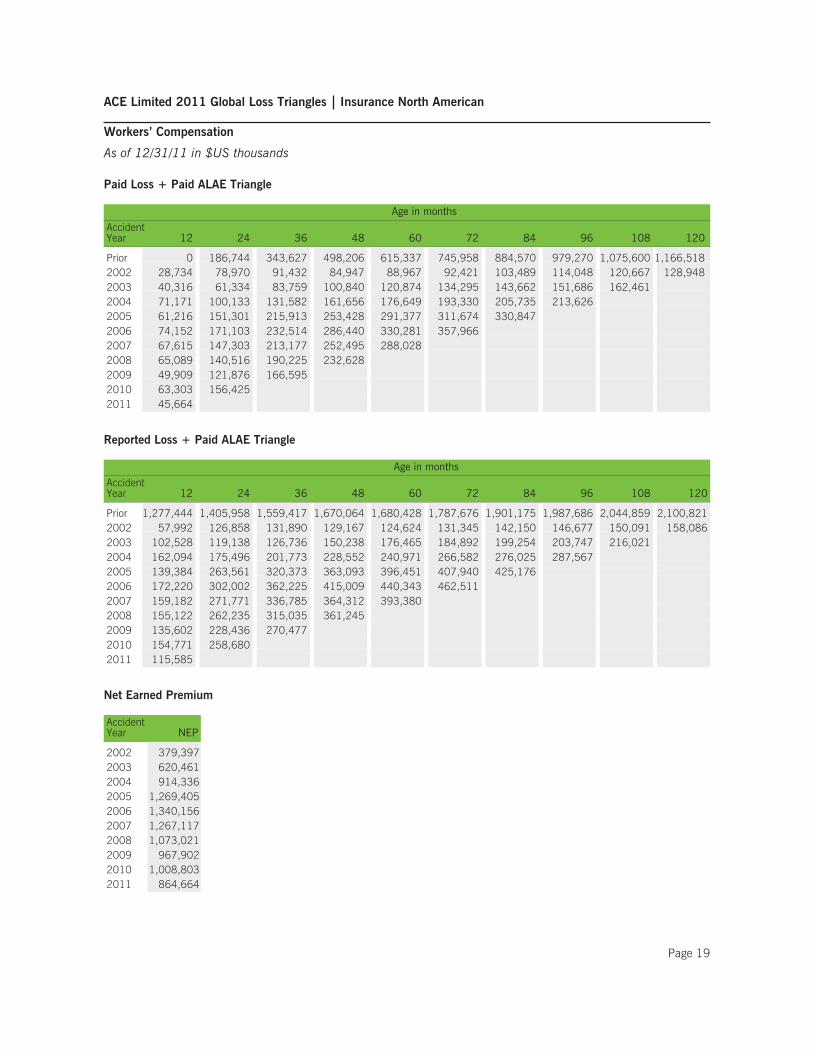
Workers’ Compensation
As of 12/31/11 in $US thousands
Paid Loss + Paid ALAE Triangle
Age in months
AccidentYear 12 24 36 48 60 72 84 96 108 120
Prior 0 186,744 343,627 498,206 615,337 745,958 884,570 979,270 1,075,600 1,166,5182002 28,734 78,970 91,432 84,947 88,967 92,421 103,489 114,048 120,667 128,9482003 40,316 61,334 83,759 100,840 120,874 134,295 143,662 151,686 162,4612004 71,171 100,133 131,582 161,656 176,649 193,330 205,735 213,6262005 61,216 151,301 215,913 253,428 291,377 311,674 330,8472006 74,152 171,103 232,514 286,440 330,281 357,9662007 67,615 147,303 213,177 252,495 288,0282008 65,089 140,516 190,225 232,6282009 49,909 121,876 166,5952010 63,303 156,4252011 45,664
Reported Loss + Paid ALAE Triangle
Age in months
AccidentYear 12 24 36 48 60 72 84 96 108 120
Prior 1,277,444 1,405,958 1,559,417 1,670,064 1,680,428 1,787,676 1,901,175 1,987,686 2,044,859 2,100,8212002 57,992 126,858 131,890 129,167 124,624 131,345 142,150 146,677 150,091 158,0862003 102,528 119,138 126,736 150,238 176,465 184,892 199,254 203,747 216,0212004 162,094 175,496 201,773 228,552 240,971 266,582 276,025 287,5672005 139,384 263,561 320,373 363,093 396,451 407,940 425,1762006 172,220 302,002 362,225 415,009 440,343 462,5112007 159,182 271,771 336,785 364,312 393,3802008 155,122 262,235 315,035 361,2452009 135,602 228,436 270,4772010 154,771 258,6802011 115,585
Net Earned Premium
AccidentYear NEP
2002 379,3972003 620,4612004 914,3362005 1,269,4052006 1,340,1562007 1,267,1172008 1,073,0212009 967,9022010 1,008,8032011 864,664
Page 19

ACE Limited 2011 Global Loss Triangles Insurance North American
General Liability
As of 12/31/11 in $US thousands
Paid Loss + Paid ALAE Triangle
Age in months
AccidentYear 12 24 36 48 60 72 84 96 108 120
Prior 0 561,770 909,747 1,534,671 1,805,010 2,039,557 2,211,025 2,575,219 2,756,479 3,017,2202002 32,249 112,545 152,347 284,387 375,564 463,278 510,556 521,792 570,022 578,8582003 42,353 206,420 295,624 326,661 372,980 475,463 511,005 596,953 612,4412004 67,529 175,998 274,187 370,420 439,374 516,869 581,422 625,2942005 62,416 201,088 329,838 491,442 595,507 833,296 888,4702006 45,896 151,302 291,648 429,494 559,134 668,4542007 46,496 164,926 321,579 590,593 849,2102008 42,214 160,231 347,961 533,4752009 32,903 148,958 292,3032010 47,332 185,7672011 59,756
Reported Loss + Paid ALAE Triangle
Age in months
AccidentYear 12 24 36 48 60 72 84 96 108 120
Prior 855,820 1,277,097 1,692,318 2,203,706 2,373,359 2,490,400 2,543,395 2,903,403 3,075,069 3,320,9402002 87,133 146,413 330,129 417,377 456,124 556,588 563,699 570,371 598,839 607,6652003 78,132 296,891 470,464 485,708 510,283 568,528 591,838 662,023 644,0212004 175,592 233,149 325,726 449,556 532,233 617,848 660,776 678,1422005 143,874 342,952 448,157 599,545 786,951 913,238 971,3292006 140,233 284,151 424,930 599,393 680,687 770,3482007 137,492 323,953 535,326 824,561 1,056,0662008 143,536 350,646 558,391 708,9472009 142,149 317,203 451,8102010 128,809 298,3742011 136,082
Net Earned Premium
AccidentYear NEP
2002 705,7062003 1,292,1512004 1,593,2542005 2,058,7582006 2,243,4312007 2,224,1422008 2,107,1322009 2,074,2732010 2,085,1482011 1,924,660
Page 20

ACE Limited 2011 Global Loss Triangles Insurance North American
Other Casualty
As of 12/31/11 in $US thousands
Paid Loss + Paid ALAE Triangle
Age in months
AccidentYear 12 24 36 48 60 72 84 96 108 120
Prior 0 224,304 336,310 477,047 724,590 840,769 939,903 1,020,074 1,127,072 1,239,6052002 116,125 191,572 236,515 281,680 276,045 287,577 289,461 294,905 294,622 293,8742003 128,466 192,827 232,846 275,044 340,771 351,049 357,534 360,877 362,1932004 142,613 236,207 281,288 318,933 344,711 358,591 366,007 373,7742005 141,997 249,266 314,772 370,605 411,758 440,436 444,0002006 118,021 238,948 304,939 355,782 387,124 400,8182007 114,479 244,199 324,534 373,343 398,1562008 225,527 471,146 570,387 639,2302009 122,209 280,888 343,7852010 221,989 409,6882011 286,197
Reported Loss + Paid ALAE Triangle
Age in months
AccidentYear 12 24 36 48 60 72 84 96 108 120
Prior 508,859 636,790 539,628 625,804 974,691 1,053,441 1,140,927 1,224,584 1,408,651 1,520,9922002 201,702 262,233 279,314 313,632 296,073 312,315 308,072 309,532 310,710 297,9292003 202,361 240,051 265,869 302,303 347,636 364,091 358,962 361,851 355,3732004 243,469 289,974 343,664 360,833 372,574 373,362 382,361 380,2582005 338,857 359,745 391,942 411,723 430,550 442,790 437,4082006 253,271 336,945 372,591 393,272 408,099 415,1022007 247,272 347,841 392,010 425,802 430,8432008 411,645 612,109 651,992 688,3532009 254,447 368,721 405,8692010 373,039 494,3062011 453,496
Net Earned Premium
AccidentYear NEP
2002 580,4642003 697,1892004 612,0382005 774,4612006 842,2572007 933,7162008 992,4112009 859,3552010 856,3242011 910,356
Page 21
ACE Limited 2011 Global Loss Triangles Insurance North American
Non-Casualty
As of 12/31/11 in $US thousands
Paid Loss + Paid ALAE Triangle
Age in months
AccidentYear 12 24 36 48 60 72 84 96 108 120
Prior 0 19,975 49,128 64,960 72,609 100,010 152,117 154,255 155,083 184,4192002 472,080 591,771 664,262 632,240 648,323 664,381 664,597 666,875 669,217 677,3412003 595,040 725,750 853,704 864,131 822,663 833,277 834,804 840,591 843,2382004 617,815 857,309 873,845 872,106 878,005 881,548 880,875 880,9382005 613,043 868,880 1,002,650 1,043,930 1,066,911 1,075,651 1,083,6062006 543,748 764,852 809,962 820,946 828,052 814,6292007 616,123 786,138 813,475 824,406 830,8852008 924,930 1,805,236 1,845,443 1,876,2942009 773,918 1,115,972 1,162,1672010 872,794 1,170,4432011 1,605,599
Reported Loss + Paid ALAE Triangle
Age in months
AccidentYear 12 24 36 48 60 72 84 96 108 120
Prior 124,591 106,130 130,463 121,139 157,451 210,423 184,632 183,088 183,882 186,5282002 521,204 601,072 669,808 636,804 651,116 665,853 666,372 667,805 669,498 668,4632003 723,063 846,607 882,933 876,840 828,929 839,624 837,725 840,872 842,5792004 850,696 900,198 883,062 877,465 881,960 880,455 880,652 879,2702005 886,011 998,243 1,043,637 1,065,234 1,074,620 1,077,354 1,084,7112006 750,651 801,502 830,586 828,274 830,834 826,5212007 842,100 824,965 827,283 829,154 832,2892008 1,607,366 1,876,319 1,876,154 1,887,3742009 1,166,071 1,183,559 1,178,6942010 1,087,157 1,212,9692011 2,067,741
Net Earned Premium
AccidentYear NEP
2002 1,011,0552003 1,400,8862004 1,944,2512005 1,510,8522006 1,523,8112007 1,790,5632008 2,359,1872009 2,403,3982010 2,261,2052011 3,087,710
Page 22
ACE Limited 2011 Global Loss Triangles Insurance Overseas General Segment
Highlights
Insurance Overseas General SegmentThe Insurance Overseas General segment is comprised of business written by ACE International, ACE GlobalMarkets (AGM), and Combined Insurance. The historical data for Overseas General includes the internationalPersonal Accident business of Combined Insurance, which was acquired on April 1, 2008. Combined Insurancedata is included for all accident years.
ACE International operates in over 40 countries across Europe, Asia, Latin America, Africa, and the Middle East.Roughly 40% of ACE International’s net earned premium (excluding Combined Insurance) is generated by Euro-pean accounts. Almost 65% of Combined Insurance’s net earned premium was generated by European accountsin calendar year 2011. AGM operates within the London market and writes both U.S. and internationally exposedbusiness, predominately short-tailed. In accordance with standard Lloyd’s market practice, ACE analyzes its AGMbusiness on a year-of-account basis rather than on an accident year basis. In order to provide data on an accidentyear basis, it was necessary to make a number of assumptions.
Overseas General premiums are split approximately 65% non-casualty/personal accident and 35% casualty.
We have compiled the triangles in original currency and then converted to US$ at December 2011 exchange ratesfor all historical data. This approach removes the impact of currency fluctuations from historical development trends.
Insurance Overseas General – CasualtyThe Casualty Class is comprised of non-U.S. general liability, employers liability, and professional liabilityexposures as well as shorter-tailed casualty exposures such as automobile liability, marine, aviation, and politicalrisk. Exposures are located around the world, including Europe, Latin America, and Asia. There is some U.S.exposure in the Casualty Class from multinational accounts. Approximately 75% of the casualty premiums aregeneral and professional liability exposures (split 53% general/47% professional) that are predominately primaryand tend to be quicker developing than comparable exposures in the U.S. Excess casualty exposures representapproximately 25% of total general liability. D&O represents approximately 35% of the total professional liabilityexposures.
Rates for general liability and professional liability were particularly strong between 2002 and 2004 followed by agradual weakening between 2005 and 2007 and leveling off toward the end of 2008. Overall, casualty ratesremained largely flat from 2009 to 2011.
Approximately 40% of the casualty premium is shorter-tailed automobile, marine, aviation, and political riskexposures. Marine is mostly short-tailed cargo (both inland and ocean) and hull risks with some exposure tomarine liability business. The aviation line includes a broad range of aviation risks from longer-tailed aviationproducts and airline/airport liability to shorter-tailed airline hull. Automobile liability included in this category issubstantially personal lines business, with a large concentration in Japan as well as smaller portions in LatinAmerica and Southeast Asia. With the exception of aviation, these lines tend to have had less volatile rate changesand are shorter-tailed than general and professional liability lines.
Insurance Overseas General – Non-CasualtyThe Non-Casualty Class is comprised of fire, construction, and energy exposures, as well as a growing personal linesbook, which includes specialty exposures such as cell phones, laptops, and Japanese renter’s insurance. Generally,rates for these classes have declined from 2003 through 2008 with the exception of North American exposures with theAGM book which experienced significant rate increases following the 2005 hurricanes. Rates on these lines haveremained largely flat from 2009 to 2011, again with the exception of some lines within AGM where rates increased in2009, leveled off in 2010, and increased again in 2011. Approximately 45% of the ACE International non-casualty
Page 23
ACE Limited 2011 Global Loss Triangles Insurance Overseas General Segment
Highlights (cont.)
book originates from Europe. In general, the property lines have relatively stable paid and reporting patterns althoughlosses from Hurricanes Katrina, Rita, and Wilma in 2005 on the AGM portfolio of U.S. exposures will have some impacton the ultimate loss ratio. The same is true for the 2008 year where losses will be impacted by catastrophes, primarilyHurricane Ike, and the 2010 and 2011 years where losses will be impacted by major worldwide catastrophes, such asthe Chilean earthquake, floods in Australia, earthquakes in New Zealand, and the Japanese earthquake.
Insurance Overseas General – Personal AccidentThe Personal Accident Class is comprised of low limit travel, credit, disability and accident accounts sold throughvarious marketing channels. The Class has experienced significant growth since 2002 through increased solic-itation and additional marketing efforts. As noted above, the Overseas General Personal Accident line includes theCombined Insurance Personal Accident data. Average rate levels for this business have been relatively stable since2004 and should have little impact on expected loss ratios.
Page 24

ACE Limited 2011 Global Loss Triangles Insurance Overseas General
Casualty
As of 12/31/11 in $US thousands
Paid Loss + Paid ALAE Triangle
Age in months
AccidentYear 12 24 36 48 60 72 84 96 108 120
Prior 0 310,210 565,401 747,519 918,600 1,103,316 1,176,092 1,247,518 1,312,433 1,373,0882002 205,951 413,614 517,229 606,060 671,299 733,328 763,941 781,777 800,058 817,2212003 194,566 350,520 431,239 502,395 574,214 625,580 662,921 698,115 705,5962004 179,671 377,548 468,095 536,285 580,867 621,018 642,872 661,0662005 200,338 378,981 496,719 590,267 652,262 731,090 767,7402006 232,971 435,655 570,182 649,970 720,622 748,5782007 243,092 490,063 645,125 769,469 854,5892008 253,998 507,765 629,790 764,9392009 264,629 519,618 654,5542010 268,798 487,0722011 197,952
Reported Loss + Paid ALAE Triangle
Age in months
AccidentYear 12 24 36 48 60 72 84 96 108 120
Prior 846,300 1,092,237 1,284,216 1,346,571 1,421,070 1,456,301 1,503,031 1,495,912 1,516,308 1,529,3952002 399,751 634,093 776,574 860,457 868,431 862,227 863,798 861,871 858,590 867,4952003 378,334 526,212 607,623 660,637 720,164 733,108 750,249 754,039 752,1432004 374,029 584,374 639,506 660,539 678,469 681,666 680,650 682,3342005 411,440 597,103 714,499 762,769 790,253 819,283 827,8132006 454,886 644,292 757,418 804,268 819,190 830,8102007 519,585 773,784 874,178 916,825 997,1452008 532,315 770,727 887,384 979,8872009 524,217 780,781 862,7892010 562,998 713,1172011 451,941
Net Earned Premium
AccidentYear NEP
2002 1,561,0192003 1,731,5782004 1,868,3632005 1,956,6972006 1,980,3852007 1,855,2172008 1,912,5912009 1,865,6062010 1,901,9702011 1,829,485
Page 25

ACE Limited 2011 Global Loss Triangles Insurance Overseas General
Non-Casualty
As of 12/31/11 in $US thousands
Paid Loss + Paid ALAE Triangle
Age in months
AccidentYear 12 24 36 48 60 72 84 96 108 120
Prior 0 115,322 156,992 176,835 236,194 253,499 271,164 277,765 278,378 284,8402002 178,402 365,409 442,257 461,101 465,754 468,951 470,727 468,555 471,410 467,7972003 151,243 375,604 460,223 490,829 507,889 510,178 518,104 519,507 520,2082004 202,262 457,413 536,440 565,771 582,149 589,531 596,162 602,5212005 201,833 492,460 625,185 687,381 711,398 716,161 717,0802006 163,297 363,290 438,940 463,185 474,496 483,0832007 193,875 429,257 526,305 557,541 569,5912008 218,317 482,663 564,110 615,7502009 190,728 420,355 495,1022010 254,169 545,3122011 397,238
Reported Loss + Paid ALAE Triangle
Age in months
AccidentYear 12 24 36 48 60 72 84 96 108 120
Prior 327,037 308,908 307,918 293,249 318,553 317,654 325,078 324,189 319,428 323,1972002 399,737 495,034 497,340 494,265 485,082 475,061 473,646 469,992 471,710 469,4022003 409,315 506,356 527,876 530,246 525,118 523,213 524,432 523,669 522,4082004 497,361 595,678 606,162 603,523 607,820 607,500 605,378 607,7682005 572,196 723,745 730,255 736,378 739,065 736,258 731,1992006 389,532 492,161 506,085 502,310 497,980 497,5182007 481,382 605,955 603,140 600,288 596,2282008 565,390 669,126 669,964 670,6942009 477,486 584,013 568,1382010 561,477 754,2392011 790,658
Net Earned Premium
AccidentYear NEP
2002 869,1922003 1,241,7462004 1,340,0982005 1,262,1412006 1,209,7082007 1,200,5122008 1,212,2302009 1,202,5242010 1,289,0912011 1,386,028
Page 26

ACE Limited 2011 Global Loss Triangles Insurance Overseas General
Personal Accident
As of 12/31/11 in $US thousands
Paid Loss + Paid ALAE Triangle
Age in months
AccidentYear 12 24 36 48 60 72 84 96 108 120
Prior 0 84,335 131,865 179,703 209,583 228,714 252,182 261,152 268,247 274,6742002 196,406 352,731 407,236 427,715 438,749 447,609 451,736 453,863 456,539 458,0042003 211,329 383,069 432,664 452,640 465,507 471,188 475,452 477,741 479,7512004 220,783 386,457 421,682 442,154 451,320 455,527 459,037 460,7152005 238,951 417,811 460,055 474,529 481,229 485,982 488,8492006 282,747 473,155 517,834 536,167 541,254 544,9242007 312,448 533,625 578,840 597,764 604,3072008 347,749 594,984 651,857 665,1472009 380,850 645,197 702,1332010 390,874 665,3872011 392,234
Reported Loss + Paid ALAE Triangle
Age in months
AccidentYear 12 24 36 48 60 72 84 96 108 120
Prior 131,951 193,064 225,062 258,180 276,729 286,112 288,423 291,812 294,585 296,6482002 271,044 426,744 451,005 455,983 460,126 460,372 461,647 461,110 460,889 461,8582003 303,390 445,615 473,277 479,491 483,901 483,460 484,787 483,692 483,2092004 298,749 436,277 449,786 459,039 462,642 465,550 466,381 466,9632005 321,540 466,458 483,681 485,124 488,000 488,872 490,4322006 368,170 526,657 540,188 546,741 549,964 550,5112007 406,208 593,369 605,399 611,507 612,6792008 456,236 654,820 675,398 678,4402009 502,153 708,509 727,9892010 518,260 732,6612011 535,510
Net Earned Premium
AccidentYear NEP
2002 1,141,2292003 1,268,8712004 1,401,3192005 1,535,6512006 1,733,6802007 1,882,2432008 1,960,0802009 1,961,6392010 2,021,0012011 2,140,289
Page 27

ACE Limited 2011 Global Loss Triangles Global Re Segment
Highlights
Global Re SegmentThe Global Re segment contains the business written by Tempest USA, Tempest Bermuda, Tempest International,and Tempest Canada, all of which is sourced through reinsurance brokers. Tempest USA writes a US treatyreinsurance book covering nearly all lines. Tempest Bermuda was founded in 1993 and writes catastrophereinsurance, primarily property coverages. Tempest International writes a worldwide portfolio of marine, aviation,international property and casualty business. Tempest Canada was formed in 2007 and writes predominatelyCanadian property and casualty business.
Unlike the rest of the triangles, the data for Global Re is presented on a treaty year basis, rather than on an acci-dent year basis like the rest of the ACE Group. A feature of treaty year data is that individual treaties can incept atany time during a given treaty year. Therefore a full treaty year can typically take up to 36 months to fully earn,and possibly longer if the year contains multi-year contracts. Since reserves should only be established for theearned portion of each treaty year, care should be taken not to fully develop the more recent treaty years withoutexcluding the unearned portion of that treaty year.
For the Global Re Property segment, we generally expect the earned premium at the end of the first developmentyear to represent approximately 70-75% of the ultimate premium for the treaty year, and anticipate minimaldevelopment in earned premium after the second development year. For the Global Re Non-Property segment, wegenerally expect the earned premium at the end of the first and second development years to respectively repre-sent 40-50% and 85-95% of ultimate premium. By the end of the third development year, ultimate premiumsshould be fully earned although the actual premium figures may move slightly after this point due to updatedreporting from the cedants.
Global Re PropertyPrior to treaty year 2000, all of the loss experience relates to Tempest Bermuda and is therefore all property catas-trophe related. In the treaty years subsequent to 2000, the property proportional and property per risk books havegrown substantially. Although the mixture of business varies by year, Tempest Bermuda property catastropherepresents approximately 70% of earned premium in the more recent years. U.S. exposure risks represent approx-imately 75% of the total Property premium. Of the non-catastrophe premium, approximately 50% of the premiumis on proportional treaties increasing to close to 60% over the last four years.
Global Re Non-PropertyThis portfolio consists of a wide range of business which more recently includes general casualty (20%), automo-bile (30%), professional liability (20%), medical malpractice (10%), workers’ compensation, marine and aviation.The mix of business has changed over time as the rate of growth and reduction varied by market conditions andline of business. For example, from 2002 to 2005, general casualty business comprised approximately 40% ofthe portfolio but in more recent years this line of business has reduced to less than 20% of the portfolio. Approx-imately 75% of the Non-Property business is written on U.S. exposed risks. This ratio has historically variedbetween 60% and 80%. Approximately 60% of the premium volume is on non-proportional business and a smallportion of the premium is coming from Facultative treaties (less than 5%).
Given the long-tail nature of the Global Re Non-Property lines of business, care must be taken when trying toproduce meaningful analysis from limited historical information. Compounding this limitation is the fact that thisportfolio grew rapidly in its first few years and has been shrinking in the more recent years due to the softeningmarket. As a result, loss development experience emerging from earlier treaty years may not be an unbiased pre-dictor of loss development in later years.
Page 28

ACE Limited 2011 Global Loss Triangles Global Re
Property
As of 12/31/11 in $US thousands
Paid Loss + Paid ALAE Triangle
Age in months
TreatyYear 12 24 36 48 60 72 84 96 108 120
Prior 0 18,871 21,385 23,391 24,508 26,772 26,317 32,028 33,821 31,0402002 28,247 72,572 106,697 118,051 121,074 122,326 123,155 121,832 121,882 123,1532003 31,156 68,131 102,882 112,863 116,421 118,689 119,337 119,990 120,4072004 171,420 327,079 388,612 413,166 423,856 429,197 432,198 434,4972005 89,513 405,134 516,406 555,358 568,054 575,421 584,8922006 12,908 57,836 86,770 95,941 99,535 100,1572007 12,982 62,334 92,452 101,545 105,7252008 53,298 139,513 176,823 204,7772009 28,967 74,959 95,0772010 33,747 191,7882011 6,292
Reported Loss + Paid ALAE Triangle
Age in months
TreatyYear 12 24 36 48 60 72 84 96 108 120
Prior 21,014 30,433 28,432 28,503 32,038 32,366 31,948 37,147 38,056 34,6692002 76,831 121,184 128,513 129,339 129,214 127,887 127,911 122,925 122,822 124,0262003 58,177 102,283 123,363 121,866 123,393 123,015 122,997 122,358 121,3302004 253,680 394,330 430,961 435,333 436,767 438,241 438,302 437,4662005 394,422 542,773 569,190 584,105 580,769 584,051 591,8372006 33,593 86,999 101,006 102,815 102,701 102,3482007 36,111 98,431 112,940 111,342 112,1142008 155,174 180,171 206,440 215,4362009 57,906 98,326 107,2422010 113,013 259,7212011 62,316
Net Earned Premium
TreatyYear NEP
2002 547,4622003 615,4952004 502,0722005 566,7512006 563,3432007 476,1732008 432,6372009 473,7422010 449,9662011 315,409
Page 29

ACE Limited 2011 Global Loss Triangles Global Re
Non-Property
As of 12/31/11 in $US thousands
Paid Loss + Paid ALAE Triangle
Age in months
TreatyYear 12 24 36 48 60 72 84 96 108 120
Prior 0 17,437 30,499 47,071 65,482 73,298 78,933 82,512 88,082 89,9872002 1,942 23,435 48,906 83,858 115,779 147,479 174,105 187,365 196,898 200,6302003 4,251 38,583 84,964 136,079 198,701 240,482 268,797 293,032 312,3462004 10,226 56,713 104,269 167,513 238,443 291,916 328,952 348,8642005 13,883 93,183 174,739 244,232 305,590 348,398 386,7262006 10,565 66,816 141,090 207,498 261,659 307,4662007 8,486 52,884 113,663 164,671 210,8842008 12,504 57,906 121,240 165,9172009 10,916 62,079 116,5242010 14,631 98,6742011 12,488
Reported Loss + Paid ALAE Triangle
Age in months
TreatyYear 12 24 36 48 60 72 84 96 108 120
Prior 22,057 42,995 64,449 81,737 92,370 92,047 94,645 96,281 98,868 101,0272002 13,485 50,644 112,729 149,312 181,873 202,992 219,512 234,203 228,446 225,8702003 21,136 109,806 195,422 263,689 304,656 321,812 340,463 351,708 355,1702004 35,988 139,515 255,429 316,998 365,697 388,093 402,681 403,8712005 69,021 203,942 306,539 366,922 403,976 433,098 454,8642006 40,459 152,592 260,354 330,005 369,950 396,7052007 29,054 139,743 213,355 263,144 309,0582008 40,726 140,534 221,788 264,8352009 28,456 117,439 203,4762010 49,713 196,2812011 50,203
Net Earned Premium
TreatyYear NEP
2002 430,0902003 758,5182004 910,0572005 887,4602006 817,0452007 635,0812008 508,3342009 608,0652010 549,5412011 224,254
Page 30
ACE Limited 2011 Global Loss Triangles
Selected Excerpts based upon ACE’s 2011 10-K Disclosure
Unpaid losses and loss expensesAs an insurance and reinsurance company, we are required by applicable laws and regulations and GAAP to estab-lish loss and loss expense reserves for the estimated unpaid portion of the ultimate liability for losses and lossexpenses under the terms of our policies and agreements with our insured and reinsured customers. The estimateof the liabilities includes provisions for claims that have been reported but are unpaid at the balance sheet date(case reserves) and for obligations on claims that have been incurred but not reported (IBNR) at the balance sheetdate. IBNR may also include provisions to account for the possibility that reported claims may settle for amountsthat differ from the established case reserves. Loss reserves also include an estimate of expenses associated withprocessing and settling unpaid claims (loss expenses).
At December 31, 2011, our gross unpaid loss and loss expense reserves were $37.5 billion and our net unpaid lossand loss expense reserves were $25.9 billion. With the exception of certain structured settlements, for which the tim-ing and amount of future claim payments are reliably determinable, our loss reserves are not discounted for the timevalue of money. In connection with such structured settlements, we carry net discounted reserves of $59 million.
The process of establishing loss reserves for property and casualty claims can be complex and is subject to consid-erable uncertainty as it requires the use of informed estimates and judgments based on circumstances known atthe date of accrual. The judgments used to estimate unpaid loss and loss expense reserves require differentconsiderations depending upon the individual circumstances underlying the insured loss. For example, thereserves established for high excess casualty claims, A&E claims, claims from major catastrophic events, or theIBNR for our various product lines each require different assumptions and judgments to be made. Necessaryjudgments are based on numerous factors and may be revised as additional experience and other data becomeavailable and are reviewed, as new or improved methods are developed, or as laws change.
Hence, ultimate loss payments may differ from the estimate of the ultimate liabilities made at the balance sheetdate. Changes to our previous estimates of prior period loss reserves impact the reported calendar year under-writing results adversely if our estimates increase and favorably if our estimates decrease.
The potential for variation in loss reserves is impacted by numerous factors, which we discuss below.
We establish loss and loss expense reserves for our claims liabilities for all insurance and reinsurance businessthat we write. For those claims reported by insureds or ceding companies to us prior to the balance sheet date,and where we have sufficient information, our claims personnel establish case reserves as appropriate based onthe circumstances of the claim(s), standard claim handling practices, and professional judgment. In respect ofthose claims that have been incurred but not reported prior to the balance sheet date, there is, by definition, lim-ited actual information to form the case reserve estimate and reliance is placed upon historical loss experience andactuarial methods to project the ultimate loss obligations and the corresponding amount of IBNR. Furthermore, forour assumed reinsurance operation, Global Reinsurance, an additional case reserve may be established above theamount notified by the ceding company if the notified case reserve is judged to be insufficient by GlobalReinsurance’s claims department (refer to “Assumed reinsurance” below) [in Item 7 of the 2011 10-K].
We have actuarial staff within each of our operating segments who analyze loss reserves and regularly projectestimates of ultimate losses and the corresponding indications of the required IBNR reserve. Note that lossesinclude loss expenses for the purposes of this discussion. IBNR reserve estimates are generally calculated by firstprojecting the ultimate amount of losses or a product line and subtracting paid losses and case reserves forreported claims. The judgments involved in projecting the ultimate losses may include the use and interpretation ofvarious standard actuarial reserving methods that place reliance on the extrapolation of actual historical data, lossdevelopment patterns, and industry data as appropriate.
The estimate of the required IBNR reserve also requires judgment by actuaries and management to reflect theimpact of more contemporary and subjective factors, both qualitative and quantitative. Among some of these
Page 31

ACE Limited 2011 Global Loss Triangles
Selected Excerpts based upon ACE’s 2011 10-K Disclosure (cont.)
factors that might be considered are changes in business mix or volume, changes in ceded reinsurance structures,reported and projected loss trends, inflation, the legal environment, and the terms and conditions of the contractssold to our insured parties.
Typically, for each product line, one or more standard actuarial reserving methods may be used to estimate ulti-mate losses and loss expenses, and from these estimates, a single actuarial central estimate is selected.Exceptions to the use of standard actuarial projection methods occur for individual claims of significance thatrequire complex legal, claims, and actuarial analysis and judgment (for example, A&E account projections or highexcess casualty accounts in litigation) or for product lines where the nature of the claims experience and/or avail-ability of the data prevent application of such standard methods. In addition, claims arising from certaincatastrophic events require evaluations that do not utilize standard actuarial loss projection methods but are basedupon our exposure at the time of the event and the circumstances of the catastrophe and its post-event impact.
The standard actuarial reserving methods may include, but are not limited to, expected loss ratio, paid andreported loss development, and Bornhuetter-Ferguson methods. A general description of these methods is providedbelow. In the subsequent discussion on short- and long-tail business, reference is also made, where appropriate,to how consideration in method selection impacted 2011 results. In addition to these standard methods, we mayuse other recognized actuarial methods and approaches depending upon the product line characteristics andavailable data. To ensure that the projections of future loss emergence based on historical loss development pat-terns are representative of the underlying business, the historical loss and premium data is required to be ofsufficient homogeneity and credibility. For example, to improve data homogeneity, we may subdivide product linedata further by similar risk attribute (e.g., geography, coverage such as property versus liability exposure, or originyear), project ultimate losses for these homogenous groups and then combine the results to provide the overallproduct line estimate.
The premium and loss data are aggregated by origin year (e.g., the year in which the losses were incurred –“accident year” or “report year”, for example) and annual or quarterly development periods. Implicit in the standardactuarial methods that we generally utilize is the need for two fundamental assumptions: first, the pattern bywhich losses are expected to emerge over time for each origin year and second, the expected loss ratio for eachorigin year (i.e., accident, report, or underwriting).
The expected loss ratio for any particular origin year is selected after consideration of a number of factors, includ-ing historical loss ratios adjusted for intervening rate changes, premium and loss trends, industry benchmarks, theresults of policy level loss modeling at the time of underwriting, and other more subjective considerations for theproduct line and external environment as noted above. The expected loss ratio for a given origin year is initiallyestablished at the start of the origin year as part of the planning process. This analysis is performed in conjunctionwith underwriters and management. The expected loss ratio method arrives at an ultimate loss estimate by multi-plying the expected ultimate loss ratio by the corresponding premium base.
This method is most commonly used as the basis for the actuarial central estimate for immature origin periods onproduct lines where the actual paid or reported loss experience is not yet deemed sufficiently credible to serve as theprincipal basis for the selection of ultimate losses. The expected loss ratio for a given origin year may be modified overtime if the underlying assumptions such as loss trend or premium rate changes differ from the original assumptions.
Our selected paid and reported development patterns provide a benchmark against which the actual emerging lossexperience can be monitored. Where possible, development patterns are selected based on historical loss emer-gence by origin year with appropriate allowance for changes in business mix, claims handling process, or cededreinsurance that are likely to lead to a discernible difference between the rate of historical and future loss emer-gence. For product lines where the historical data is viewed to have low statistical credibility, the selecteddevelopment patterns also reflect relevant industry benchmarks and/or experience from similar product lines writ-ten elsewhere within ACE.
Page 32
ACE Limited 2011 Global Loss Triangles
Selected Excerpts based upon ACE’s 2011 10-K Disclosure (cont.)
This most commonly occurs for relatively new product lines that have limited historical data or for high severity/lowfrequency portfolios where our historical experience exhibits considerable volatility and/or lacks credibility. Thepaid and reported loss development methods convert the selected loss emergence pattern to a set of multiplicativefactors which are then applied to actual paid or reported losses to arrive at an estimate of ultimate losses for eachperiod. Due to their multiplicative nature, the paid and reported loss development methods will leverage differ-ences between actual and expected loss emergence. These methods tend to be utilized for more mature originperiods and for those portfolios where the loss emergence has been relatively consistent over time.
The Bornhuetter-Ferguson method is essentially a combination of the expected loss ratio method and the lossdevelopment method, where the loss development method is given more weight as the origin year matures. Thisapproach allows a logical transition between the expected loss ratio method which is generally utilized at earliermaturities and the loss development methods which are typically utilized at latter maturities. We usually apply thismethod using reported loss data although paid data may be used.
The applicability of actuarial methods will also be impacted by the attachment point of the policy or contract withthe insured or ceding company. In the case of low attachment points typical of primary insurance or working layerreinsurance, the experience tends to be more frequency driven. For these product types, standard actuarial meth-ods generally work well in determining loss reserve levels, as the loss experience is often credible, given asufficient history and volume of claims experience. In the case of high attachment points typical of excessinsurance or excess of loss reinsurance, the experience tends to be severity driven, as only a loss of significant sizewill enter the layer. For these product lines, it typically takes longer for loss experience to gain credibility, whichadds uncertainty to the estimates derived from standard actuarial methods. For products such as our assumedreinsurance business, we typically supplement the standard actuarial methods with an analysis of each contract’sterms, original pricing information, subsequent internal and external analyses of the ongoing contracts, marketexposures and history, and qualitative input from claims managers. This approach is also used for structured orunique contracts.
Our recorded reserves represent management’s best estimate of the provision for unpaid claims as of the balancesheet date. We perform an actuarial reserve review for each product line at least once a year. At the conclusion ofeach review, we establish an actuarial central estimate. The process to select the actuarial central estimate, whenmore than one estimate is available, may differ across product lines. For example, an actuary may base the centralestimate on loss projections developed using an incurred loss development approach instead of a paid loss devel-opment approach when reported losses are viewed to be a more credible indication of the ultimate loss comparedwith paid losses. The availability of estimates for different projection techniques will depend upon the product line,the underwriting circumstances, and the maturity of the loss emergence.
For a well-established product line with sufficient volume and history, the actuarial central estimate may be drawnfrom a weighting of paid and reported loss development and/or Bornhuetter-Ferguson methods. However, for anew long-tail product line for which we have limited data and experience or a rapidly growing line, the emergingloss experience may not have sufficient credibility to allow selection of loss development or Bornhuetter-Fergusonmethods and reliance may be placed upon the expected loss ratio method until the experience matures andbecomes credible.
Management’s best estimate is developed from the actuarial central estimate after collaboration with actuarial,underwriting, claims, legal, and finance departments and culminates with the input of reserve committees. Eachbusiness unit reserve committee includes the participation of the relevant parties from actuarial, finance, claims,and unit senior management and has the responsibility for finalizing and approving the estimate to be used asmanagement’s best estimate. Reserves are further reviewed by ACE’s Chief Actuary and senior management. Theobjective of such a process is to determine a single estimate that we believe represents a better estimate than anyother. Such an estimate is viewed by management to be the best estimate of ultimate loss settlements and is
Page 33
ACE Limited 2011 Global Loss Triangles
Selected Excerpts based upon ACE’s 2011 10-K Disclosure (cont.)
determined based on consideration of a number of factors in addition to the actuarial central estimate, includingbut not limited to:• segmentation of data to provide sufficient homogeneity and credibility for loss projection methods;• extent of internal historical loss data, and industry information where required;• historical variability of actual loss emergence compared with expected loss emergence;• perceived credibility of emerged loss experience; and• nature and extent of underlying assumptions.
Management does not build in any specific provision for uncertainty.
We do not calculate ranges of loss reserve estimates for our individual loss reserve studies. Such ranges are gen-erally not a true reflection of the potential difference between loss reserves estimated at the balance sheet date andthe ultimate settlement value of losses. This is due to the fact that an actuarial range is developed based on knownevents as of the valuation date whereas actual prior period development reported in subsequent consolidated finan-cial statements relates in part to events and circumstances that were unknown as of the original valuation date.While we believe that our recorded reserves are reasonable and represent management’s best estimate for eachproduct line as of the current valuation date, future changes to our view of the ultimate liabilities are possible.
A five percent change in our net loss reserves equates to $1.3 billion and represents five percent of shareholders’equity at December 31, 2011. Historically, including A&E reserve charges, our reserves, at times, have developedin excess of 10 percent of recorded amounts. Refer to “Analysis of Losses and Loss Expenses Development”, underItem 1 [of the 2011 10-K], for a summary of historical volatility between estimated loss reserves and ultimate losssettlements.
We perform internal loss reserve studies for all product lines at least once a year; the timing of such studies variesthroughout the year. Additionally, each quarter for most product lines, we review the emergence of actual lossesrelative to expectations. If warranted from findings in loss emergence tests, we may alter the timing of our productline reserve studies. Finally, loss reserve studies are performed annually by external third-parties and the findingsare used to test the reasonability of our internal findings.
The time period between the date of loss occurrence and the final payment date of the ensuing claim(s) is referredto as the “claim-tail”. The following is a discussion of specific reserving considerations for both short-tail and long-tail product lines.
Short-tail businessShort-tail business generally describes product lines for which losses are typically known and paid shortly after theloss actually occurs. This would include, for example, most property, personal accident, aviation hull, andautomobile physical damage policies that we write. There are some exceptions on certain product lines or events(e.g., major hurricanes or earthquakes) where the event has occurred, but the final settlement amount is highlyuncertain and not known with certainty for a potentially lengthy period. Due to the short reporting and develop-ment pattern for these product lines, the uncertainty associated with our estimate of ultimate losses for anyparticular accident period diminishes relatively quickly as actual loss experience emerges. We typically assigncredibility to methods that incorporate actual loss emergence, such as the paid and reported loss development andBornhuetter-Ferguson methods, sooner than would be the case for long-tail lines at a similar stage of developmentfor a given origin year.
The reserving process for short-tail losses arising from catastrophic events typically involves an assessment by theclaims department, in conjunction with underwriters and actuaries, of our exposure and estimated losses immedi-ately following an event and then subsequent revisions of the estimated losses as our insureds provide updatedactual loss information.
Page 34

ACE Limited 2011 Global Loss Triangles
Selected Excerpts based upon ACE’s 2011 10-K Disclosure (cont.)
Long-tail businessLong-tail business describes lines of business for which specific losses may not be known/reported for some periodand for which claims can take significant time to settle/close. This includes most casualty lines such as generalliability, D&O, and workers’ compensation. There are many factors contributing to the uncertainty and volatility oflong-tail business. Among these are:• Our historical loss data and experience is sometimes too immature and lacking in credibility to rely upon for reserv-
ing purposes. Where this is the case, in our reserve analysis we rely on industry loss ratios or industry benchmarkdevelopment patterns that we believe reflect the nature and coverage of the underwritten business and its futuredevelopment, where available. For such product lines, actual loss experience may differ from industry loss statisticsas well as loss experience for previous underwriting years;
• The inherent uncertainty around loss trends, claims inflation (e.g., medical and judicial) and underlying economicconditions;
• The inherent uncertainty of the estimated duration of the paid and reporting loss development patterns beyond thehistorical record requires that professional judgment be used in the determination of the length of the patterns basedon the historical data and other information;
• The inherent uncertainty of assuming that historical paid and reported loss development patterns for older originyears will be representative of subsequent loss emergence on recent origin years. For example, changes over time inthe processes and procedures for establishing case reserves can distort reported loss development patterns orchanges in ceded reinsurance structures by origin year can alter the development of paid and reported losses;
• Loss reserve analyses typically require loss or other data be grouped by common characteristics in some manner. Ifdata from two combined lines of business exhibit different characteristics, such as loss payment patterns, the credi-bility of the reserve estimate could be affected. Additionally, since casualty lines of business can have significantintricacies in the terms and conditions afforded to the insured, there is an inherent risk as to the homogeneity of theunderlying data used in performing reserve analyses; and
• The applicability of the price change data used to estimate ultimate loss ratios for most recent origin years.
The interested reader is referred to ACE’s 2011 Form 10-K for additional information on the reserving process.
Page 35

ACE Limited 2011 Global Loss Triangles
Glossary
Accident year (AY): Relates to all losses occurring within a given twelve-month period, regardless of when the losswas reported or booked.
Bornhuetter-Ferguson method: Estimates unpaid (unreported) losses for a given accident/treaty year based on anexpected ultimate and the percentage of losses currently unpaid (unreported).
Chain Ladder method: Estimates unpaid (unreported) losses for a given accident/treaty year by a) estimating ulti-mate losses derived by multiplying the paid (or reported) losses for the given year by the reciprocal of thepercentage of losses currently paid (or reported) for that year and, in the case of treaty year data, also by the per-centage of earned premium to ultimate premium, and then b) subtracting the paid (or reported) losses for thegiven year from the ultimate losses calculated in (a).
Claims made basis: An insurance form where the date the loss is reported to the insurer is deemed to be the dateof the loss event, regardless of when the loss occurred.
Expected Loss Ratio method: Estimates unpaid (unreported) loss for a given accident/treaty year by a) estimatingultimate losses derived by multiplying the earned premiums by a selected loss ratio, and then b) subtracting thepaid (or reported) losses for the given year from the ultimate losses calculated in (a). The selected loss ratio maybe based on the ACE’s own data and/or Industry data or a combination of both.
Occurrence basis: An insurance form where the date the loss occurred is deemed to be the date of the loss event,regardless of when the claim is reported to the insurer.
Retroactive reinsurance: An arrangement whereby a reinsurer assumes liability incurred as a result of past events(i.e., a loss portfolio transfer).
Treaty year (TY): Relates to all losses associated with policies that incepted within a given twelve-month period.
Year-of-Account (YOA) : Terminology specific to Lloyd’s business; the year to which an individual risk is allocatedbased on the calendar year in which it was first signed.
Page 36