Embed Size (px)
Citation preview
1
Angela Carmichael, MBA, RHIA, CDIP, CCS, CCS‐P, CRCDirector, Concepts, Quality & Training
Equian
How Data Analytics Can Drive Success in Risk Adjustment
2
Learning Objectives
• At the completion of this educational activity, the learner will be able to:
– Understand how data analytics contribute to the success of risk adjustment methodologies
– Use analytics to dive deeper into clinical documentation & identify opportunities to improve documentation, coding, and risk score accuracy and compliance
– Demonstrate how data analytics embedded into a CDS workflow improves the efficiency & effectiveness of your CDI program
3
Introduction to Risk Adjustment Data Analytics
2017 Copyright, HCPro, an H3.Group division of Simplify Compliance LLC. All rights reserved. These materials may not be copied without written permission.
1
4
What Is Risk Adjustment?
Definition:
• An actuarial tool used to predict healthcare costs
• Risk adjustment levels the playing field regarding the reporting of patient outcomes by adjusting for the differences in risk among specific patients based on such things as demographics (age, sex, eligibility status) & disease burden (ICD‐10‐CM diagnosis codes reported primarily on claims during the calendar year)
An actuary is a business professional who uses mathematics, statistics, & financial theory to analyze the financial consequences of risk.
5
Why Is Risk Adjustment Important?
• Medicare Advantage plans
• Accountable care organizations (ACOs)
– Medicare (Pioneer, MSSP, NextGen, dual‐eligible, ESRD)
– Commercial
• Value‐based purchasing (VBP)
– Hospital
– Professional fee
• Used across multiple settings
• Improved predictability of costs, quality of care, & readmission risk
6
Zeroing In on the Risk Adjustment Methodology Known as “HCCs” (Hierarchical Condition Categories)
2017 Copyright, HCPro, an H3.Group division of Simplify Compliance LLC. All rights reserved. These materials may not be copied without written permission.
2
7
What Are Hierarchical Condition Categories?
• HCCs are a form of case‐mix index (CMI)
– They mathematically reconcile the observed rate versus the expected rate so the quality of care can be isolated, understood, and compared—an important element of value‐based purchasing
– This form of CMI applies to the patient for the calendar year across inpatient hospital, outpatient, and physician office settings
– HCCs “bucket” patients into different “categories” based on the ICD‐10‐CM diagnosis codes submitted on claims
– The categories group patients that are not only clinically similar, but also follow similar cost patterns
– CMS‐HCCs are more predictive of readmissions and future costs than MS‐DRGs
8
How Are HCCs Used?
• Uses:
– Payment methodology
• For example: CMS‐HCCs set Per Member Per Month (PMPM) capitation payments to Managed Medicare plans
• Used in combination with fee‐for‐service (FFS) to compensate Accountable Care Organizations (ACOs)
– Used to risk‐adjust individual and small group markets on and off the Health Insurance Exchange
– Risk‐adjusts 3 cost & quality measures for value‐based purchasing involving both hospitals and professional providers
9
Risk Adjustment in the Value‐Based Payment Program
Medicare Part A
30‐day All‐Cause Hospital Readmission measure
Medicare Part B
Per Capita Costs for All Attributed Beneficiaries and Per Capita Costs for Beneficiaries with Specific Conditions measures
Medicare Part A & B
Medicare Spending Per Beneficiary (MSPB) measure
2017 Copyright, HCPro, an H3.Group division of Simplify Compliance LLC. All rights reserved. These materials may not be copied without written permission.
3
10
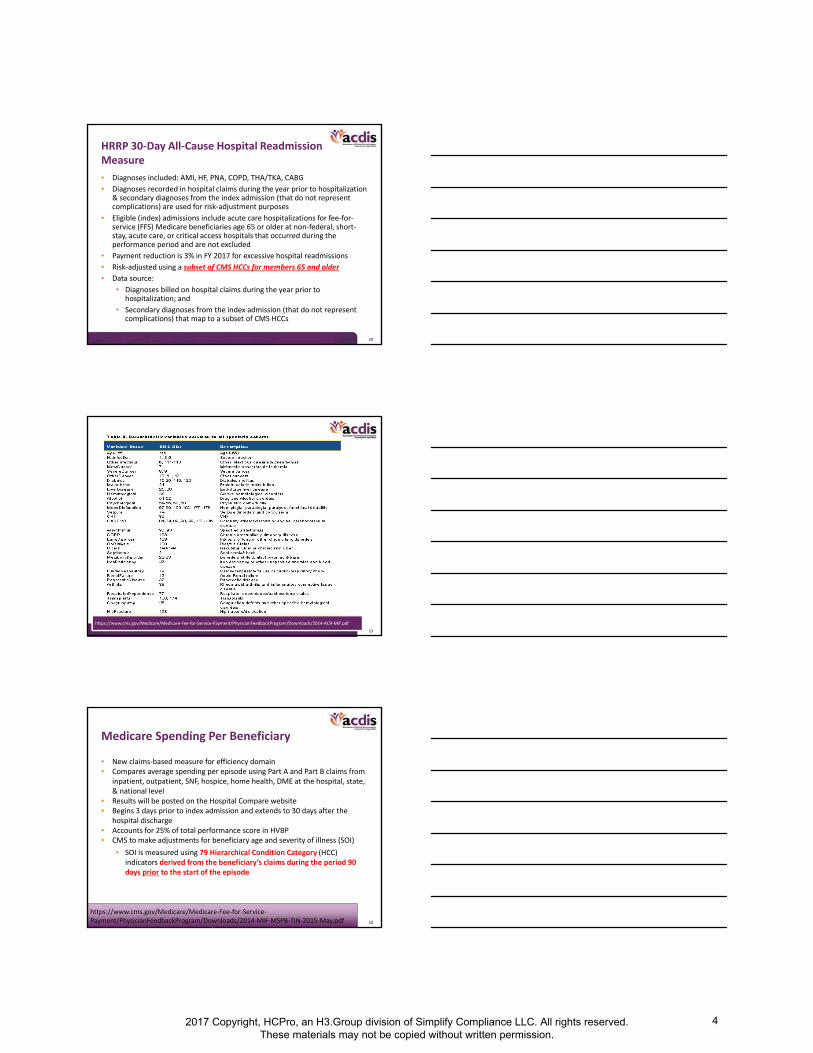
HRRP 30‐Day All‐Cause Hospital Readmission Measure
• Diagnoses included: AMI, HF, PNA, COPD, THA/TKA, CABG
• Diagnoses recorded in hospital claims during the year prior to hospitalization & secondary diagnoses from the index admission (that do not represent complications) are used for risk‐adjustment purposes
• Eligible (index) admissions include acute care hospitalizations for fee‐for‐service (FFS) Medicare beneficiaries age 65 or older at non‐federal, short‐stay, acute care, or critical access hospitals that occurred during the performance period and are not excluded
• Payment reduction is 3% in FY 2017 for excessive hospital readmissions
• Risk‐adjusted using a subset of CMS HCCs for members 65 and older
• Data source:
• Diagnoses billed on hospital claims during the year prior to hospitalization; and
• Secondary diagnoses from the index admission (that do not represent complications) that map to a subset of CMS HCCs
11
https://www.cms.gov/Medicare/Medicare‐Fee‐for‐Service‐Payment/PhysicianFeedbackProgram/Downloads/2014‐ACR‐MIF.pdfhttps://www.cms.gov/Medicare/Medicare‐Fee‐for‐Service‐Payment/PhysicianFeedbackProgram/Downloads/2014‐ACR‐MIF.pdf
12
Medicare Spending Per Beneficiary
• New claims‐based measure for efficiency domain• Compares average spending per episode using Part A and Part B claims from
inpatient, outpatient, SNF, hospice, home health, DME at the hospital, state, & national level
• Results will be posted on the Hospital Compare website• Begins 3 days prior to index admission and extends to 30 days after the
hospital discharge • Accounts for 25% of total performance score in HVBP • CMS to make adjustments for beneficiary age and severity of illness (SOI)
• SOI is measured using 79 Hierarchical Condition Category (HCC) indicators derived from the beneficiary’s claims during the period 90 days prior to the start of the episode
https://www.cms.gov/Medicare/Medicare‐Fee‐for‐Service‐Payment/PhysicianFeedbackProgram/Downloads/2014‐MIF‐MSPB‐TIN‐2015‐May.pdfhttps://www.cms.gov/Medicare/Medicare‐Fee‐for‐Service‐Payment/PhysicianFeedbackProgram/Downloads/2014‐MIF‐MSPB‐TIN‐2015‐May.pdf
2017 Copyright, HCPro, an H3.Group division of Simplify Compliance LLC. All rights reserved. These materials may not be copied without written permission.
4
13
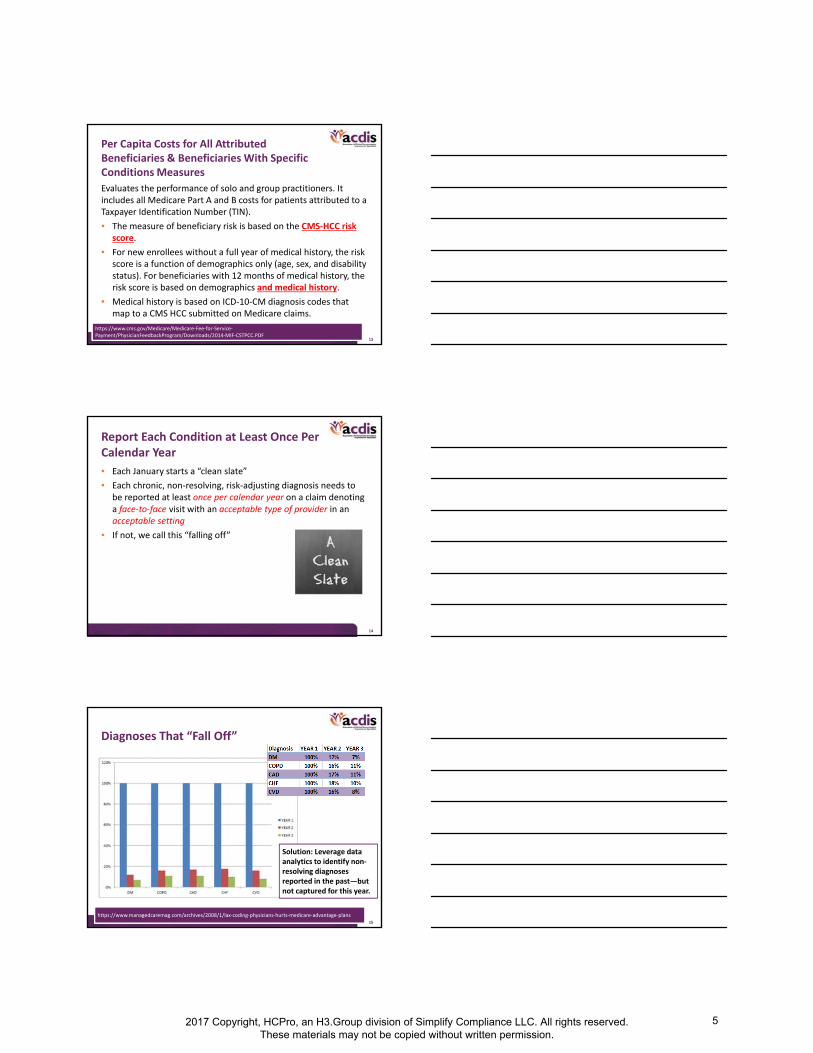
Per Capita Costs for All Attributed Beneficiaries & Beneficiaries With Specific Conditions Measures
Evaluates the performance of solo and group practitioners. It includes all Medicare Part A and B costs for patients attributed to a Taxpayer Identification Number (TIN).
• The measure of beneficiary risk is based on the CMS‐HCC risk score.
• For new enrollees without a full year of medical history, the risk score is a function of demographics only (age, sex, and disability status). For beneficiaries with 12 months of medical history, the risk score is based on demographics and medical history.
• Medical history is based on ICD‐10‐CM diagnosis codes that map to a CMS HCC submitted on Medicare claims.
https://www.cms.gov/Medicare/Medicare‐Fee‐for‐Service‐Payment/PhysicianFeedbackProgram/Downloads/2014‐MIF‐CSTPCC.PDFhttps://www.cms.gov/Medicare/Medicare‐Fee‐for‐Service‐Payment/PhysicianFeedbackProgram/Downloads/2014‐MIF‐CSTPCC.PDF
14
Report Each Condition at Least Once Per Calendar Year
• Each January starts a “clean slate”
• Each chronic, non‐resolving, risk‐adjusting diagnosis needs to be reported at least once per calendar year on a claim denoting a face‐to‐face visit with an acceptable type of provider in an acceptable setting
• If not, we call this “falling off”
15
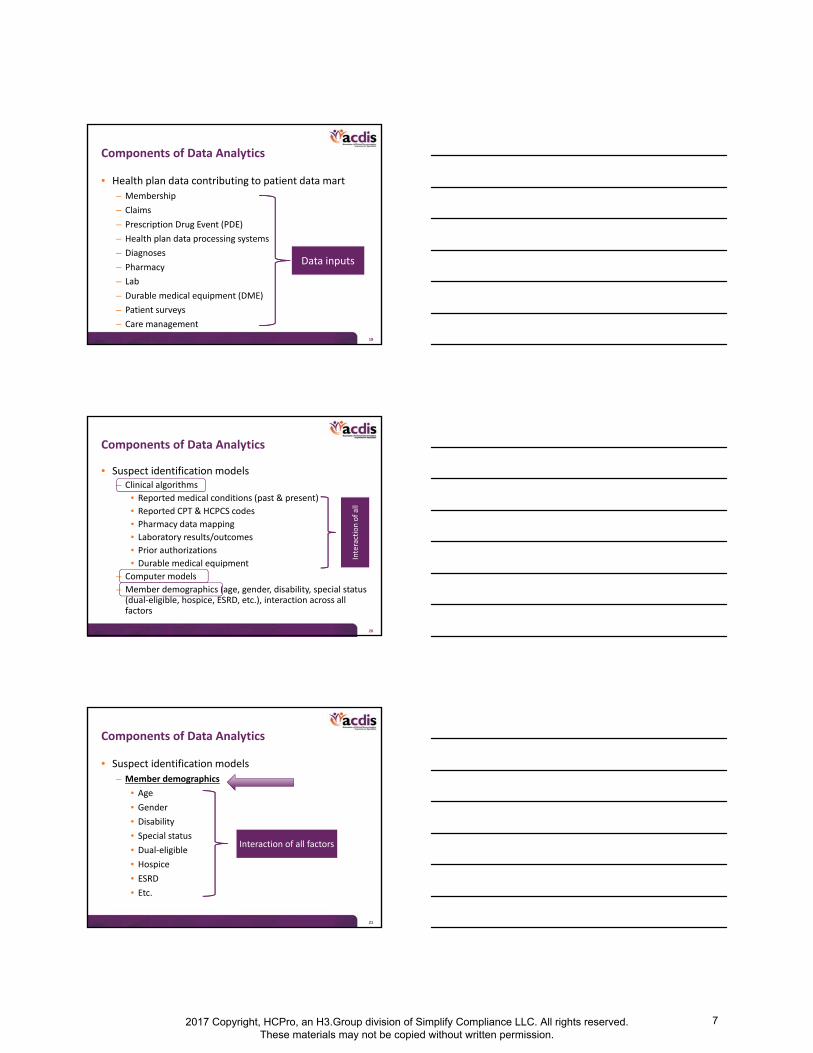
Diagnoses That “Fall Off”
Solution: Leverage data analytics to identify non‐resolving diagnoses reported in the past—but not captured for this year.
https://www.managedcaremag.com/archives/2008/1/lax‐coding‐physicians‐hurts‐medicare‐advantage‐planshttps://www.managedcaremag.com/archives/2008/1/lax‐coding‐physicians‐hurts‐medicare‐advantage‐plans
2017 Copyright, HCPro, an H3.Group division of Simplify Compliance LLC. All rights reserved. These materials may not be copied without written permission.
5
16
Using Data Analytics for Risk Adjustment
17
What Is Data Analytics?
• Healthcare analytics allows for the examination of patterns in various healthcare data in order to determine how clinical care can be improved while limiting excessive spending
18
Goal of Data Analytics in Risk Adjustment
• Optimize reimbursement & decrease financial risk
– Identify unreported & under‐reported risk adjusted conditions
• Capture unstructured data
– Identify billing/data submission errors
• Optimizing care planning & reduce follow‐up visits
– Patient engagement
– Identify patients who would benefit from population health initiatives
2017 Copyright, HCPro, an H3.Group division of Simplify Compliance LLC. All rights reserved. These materials may not be copied without written permission.
6
19
Components of Data Analytics
• Health plan data contributing to patient data mart
– Membership
– Claims
– Prescription Drug Event (PDE)
– Health plan data processing systems
– Diagnoses
– Pharmacy
– Lab
– Durable medical equipment (DME)
– Patient surveys
– Care management
Data inputs Data inputs
20
Components of Data Analytics
• Suspect identification models– Clinical algorithms
• Reported medical conditions (past & present)
• Reported CPT & HCPCS codes
• Pharmacy data mapping
• Laboratory results/outcomes
• Prior authorizations
• Durable medical equipment
– Computer models
– Member demographics (age, gender, disability, special status (dual‐eligible, hospice, ESRD, etc.), interaction across all factors
Interaction of all
Interaction of all
21
Components of Data Analytics
• Suspect identification models
– Member demographics
• Age
• Gender
• Disability
• Special status
• Dual‐eligible
• Hospice
• ESRD
• Etc.
Interaction of all factorsInteraction of all factors
2017 Copyright, HCPro, an H3.Group division of Simplify Compliance LLC. All rights reserved. These materials may not be copied without written permission.
7
22
Clinical Algorithms:Pharmacy Suspecting Examples
• Pharmacy data plays a huge part in predicting HCC capture—“suspecting.”
• Example: Patient has a current prescription for Lyrica. Review of the medical record indicates the patient has “diabetes mellitus.” No mention of neuropathy exists in the current year’s documentation. Past medical history and problem list state “history of peripheral neuropathy.”
23
Components of Data Analytics
• Suspect identification models
– Computer models
• Proprietary algorithms designed to identify suspected conditions
• Statistical modeling that groups suspected conditions into buckets
• Use algorithms to assist in chart selection process for retrospective review
24
Components of Data Analytics
• Suspect identification models
– Member demographics
• Age
• Gender
• Disability
• Special status
• Dual‐eligible
• Hospice
• ESRD
• Etc.
Interaction of all factorsInteraction of all factors
2017 Copyright, HCPro, an H3.Group division of Simplify Compliance LLC. All rights reserved. These materials may not be copied without written permission.
8
25
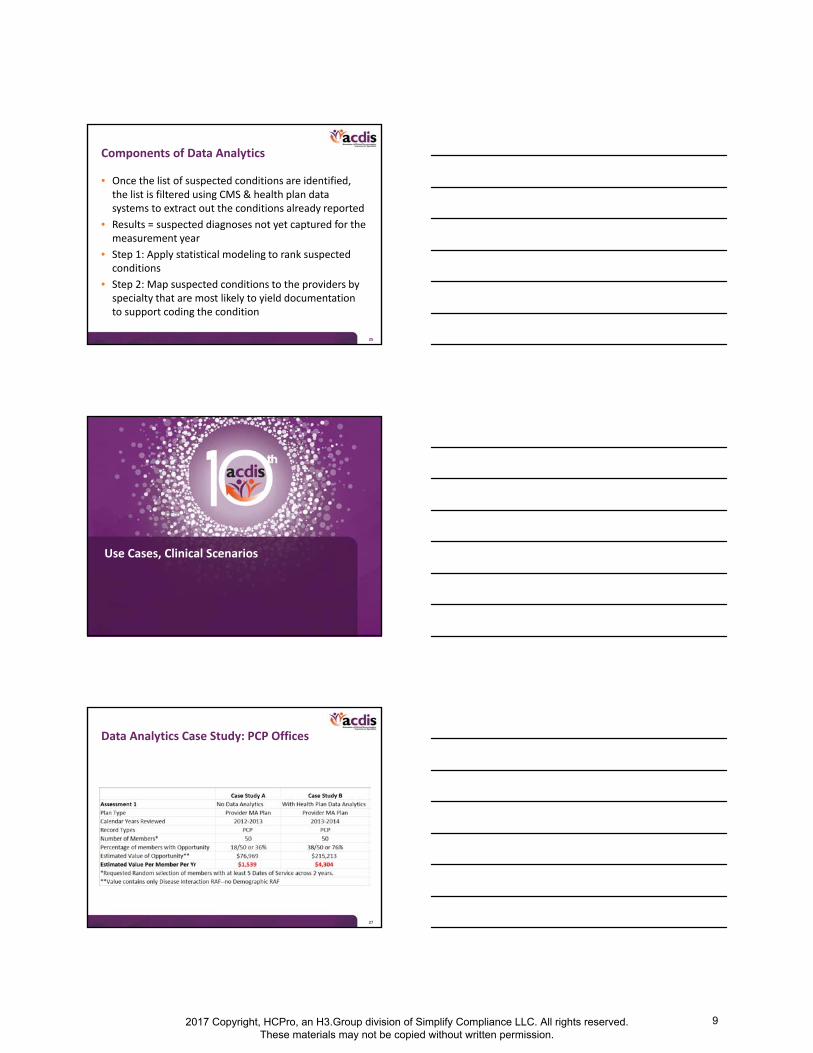
Components of Data Analytics
• Once the list of suspected conditions are identified, the list is filtered using CMS & health plan data systems to extract out the conditions already reported
• Results = suspected diagnoses not yet captured for the measurement year
• Step 1: Apply statistical modeling to rank suspected conditions
• Step 2: Map suspected conditions to the providers by specialty that are most likely to yield documentation to support coding the condition
26
Use Cases, Clinical Scenarios
27
Data Analytics Case Study: PCP Offices
2017 Copyright, HCPro, an H3.Group division of Simplify Compliance LLC. All rights reserved. These materials may not be copied without written permission.
9
28
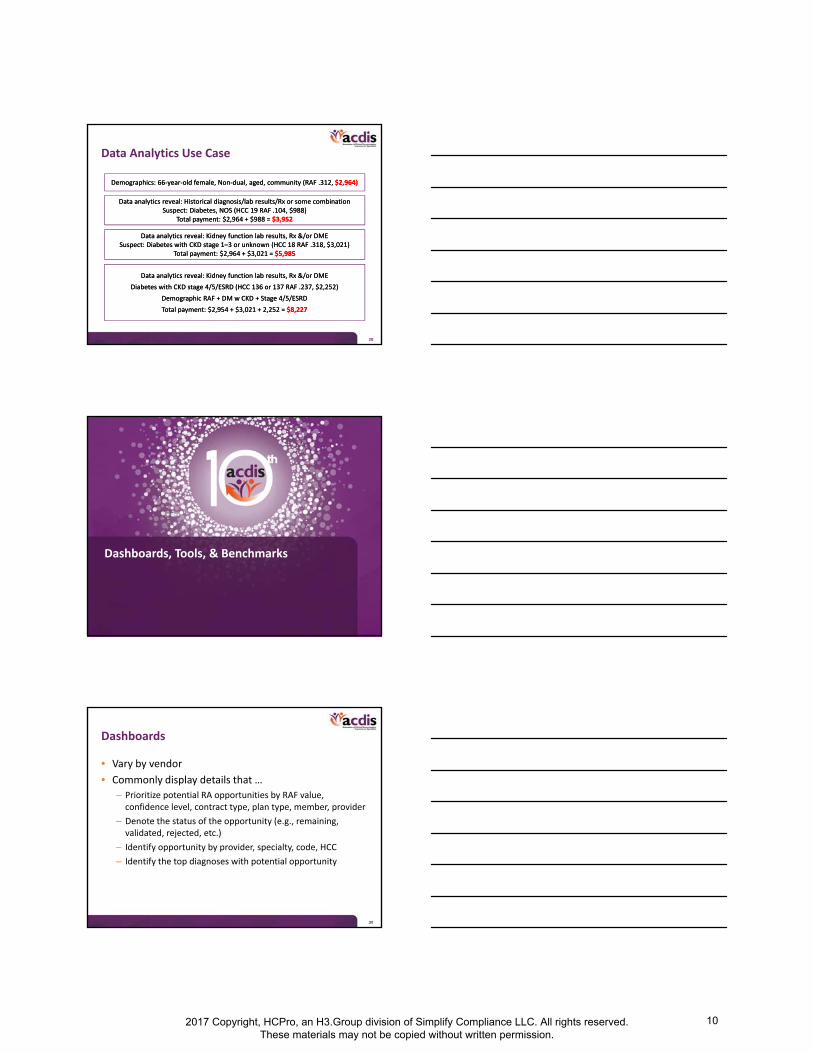
Data Analytics Use Case
Data analytics reveal: Historical diagnosis/lab results/Rx or some combination Suspect: Diabetes, NOS (HCC 19 RAF .104, $988)
Total payment: $2,964 + $988 = $3,952
Data analytics reveal: Historical diagnosis/lab results/Rx or some combination Suspect: Diabetes, NOS (HCC 19 RAF .104, $988)
Total payment: $2,964 + $988 = $3,952
Data analytics reveal: Kidney function lab results, Rx &/or DMESuspect: Diabetes with CKD stage 1–3 or unknown (HCC 18 RAF .318, $3,021)
Total payment: $2,964 + $3,021 = $5,985
Data analytics reveal: Kidney function lab results, Rx &/or DMESuspect: Diabetes with CKD stage 1–3 or unknown (HCC 18 RAF .318, $3,021)
Total payment: $2,964 + $3,021 = $5,985
Demographics: 66‐year‐old female, Non‐dual, aged, community (RAF .312, $2,964)Demographics: 66‐year‐old female, Non‐dual, aged, community (RAF .312, $2,964)
Data analytics reveal: Kidney function lab results, Rx &/or DME
Diabetes with CKD stage 4/5/ESRD (HCC 136 or 137 RAF .237, $2,252)
Demographic RAF + DM w CKD + Stage 4/5/ESRD
Total payment: $2,954 + $3,021 + 2,252 = $8,227
Data analytics reveal: Kidney function lab results, Rx &/or DME
Diabetes with CKD stage 4/5/ESRD (HCC 136 or 137 RAF .237, $2,252)
Demographic RAF + DM w CKD + Stage 4/5/ESRD
Total payment: $2,954 + $3,021 + 2,252 = $8,227
29
Dashboards, Tools, & Benchmarks
30
Dashboards
• Vary by vendor
• Commonly display details that …
– Prioritize potential RA opportunities by RAF value, confidence level, contract type, plan type, member, provider
– Denote the status of the opportunity (e.g., remaining, validated, rejected, etc.)
– Identify opportunity by provider, specialty, code, HCC
– Identify the top diagnoses with potential opportunity
2017 Copyright, HCPro, an H3.Group division of Simplify Compliance LLC. All rights reserved. These materials may not be copied without written permission.
10
31
Tools
• Paper document placed inside a medical record indicating historical yet non‐resolving chronic illness risk‐adjusted diagnoses for recapture (e.g., COPD) when impacting the encounter
• An alert in an EHR of historical risk‐adjusted diagnoses for recapture
• Voice recognition technology at the point of care that alerts providers when they have documented a potential risk‐adjusted diagnosis that might require more specificity to map to an HCC or to a higher‐weighted HCC
32
Benchmarks
• National average risk score for Medicare beneficiaries: 1.013
• Compare the aggregate risk score of members of your provider‐sponsored MA plan or ACO to the national average
• Compare attributed members enrolled in an ACO or Medicare Advantage plan by specialty within a practice and across practices and regions
33
Building Data Analytics Into a Risk Adjustment Program: CDS Key Takeaways
2017 Copyright, HCPro, an H3.Group division of Simplify Compliance LLC. All rights reserved. These materials may not be copied without written permission.
11
34
What Can Data Analytics Do for Your CDI Program?
– Appropriate reimbursement to compensate for financial risk associated with covering a sicker population
– Scale your RA program in each setting & across the care continuum
– Better risk identification & HCC gap closure
– Identify patients for population health initiatives
– Ensuring success with the Triple Aim by improving patient care & experience & lowering costs
35
Inpatient Setting Strategies to Close the HCC Capture Gap
Optimize MS‐DRG assignment
Optimize APR‐DRG SOI/ROM
Ensure you are writing your typical SOI/ROM clarifications
• Approximately 42% of CMS HCC diagnoses are CCs in MS‐DRGs
• Approximately 16% of CMS HCC diagnoses are MCCs in MS‐DRGs
• Approximately 42% of CMS HCCs are not CCs/MCCs
• These same diagnoses are often not documented or not coded/reported in the provider office setting
Use data analytics to identify HCC capture gaps for resolution
Analyze the HCC tables to ensure you are capturing the 42% of conditions that map to an HCC but are not classified as CCs/MCCs
36
Outpatient Setting: Strategies to Close the HCC Capture GapEmergency department, observation, outpatient surgery
Encourage providers to: Think beyond just documenting for medical necessity Document all comorbid conditions
Coders ensure diagnosis coding on the claim is: Accurate, complete, & consistent Supported by the acronym “MEAT” (Monitored, Evaluated,
Assessed, Treated or impacted medical decision‐making) which was created by the risk adjustment industry for use by coders to ensure documented conditions meet reporting criteria as described by CMS
2017 Copyright, HCPro, an H3.Group division of Simplify Compliance LLC. All rights reserved. These materials may not be copied without written permission.
12
37
Provider Office SettingStrategies to Close the HCC Capture Gap
• Greatest volume of HCC gaps is in the physician office– Improving coding alone will only get you so far
• The majority of opportunity requires CDI clarification – Who is performing the coding?
• Ensure coding is accurate, complete, & consistent– Problem‐focused visits should include diagnoses that meet the
MEAT criteria• Think beyond evaluation & management (E/M) & chief complaint (CC)
– Ensure members are seen at least once annually• New patient & annual wellness visits are a great opportunity to capture chronic non‐resolving diagnoses
– Even with great documentation, coding, & billing, you are not protected from compliance reviews
• Eradicate medical record deficiencies
38
Thank you. Questions?
In order to receive your continuing education certificate(s) for this program, you must complete the online evaluation. The link can be found in the continuing education section at the front of the program guide.
2017 Copyright, HCPro, an H3.Group division of Simplify Compliance LLC. All rights reserved. These materials may not be copied without written permission.
13