Embed Size (px)
Citation preview

Accurate Virus Quantitation Using a Scanning Transmission Electron Microscopy (STEM)
Detector in a Scanning Electron Microscope
Candace D Blancett1, David P Fetterer2 , Keith A Koistinen1,6, Elaine M Morazzani3,5, Mitchell
K Monninger1, Ashley E Piper3, Kathleen A Kuehl1, Brian J Kearney4, Sarah L Norris2, Cynthia
A Rossi4 , Pamela J Glass3, Mei G Sun1,*
1 Pathology Division, United States Army Medical Research Institute of Infectious Diseases
(USAMRIID), 1425 Porter Street, Fort Detrick, Maryland, 21702
2Biostatistics Division, United States Army Medical Research Institute of Infectious Diseases
(USAMRIID), 1425 Porter Street, Fort Detrick, Maryland, 21702
3Virology Division, United States Army Medical Research Institute of Infectious Diseases
(USAMRIID), 1425 Porter Street, Fort Detrick, Maryland, 21702
4Diagnostics Systems Division, United States Army Medical Research Institute of Infectious
Diseases (USAMRIID), 1425 Porter Street, Fort Detrick, Maryland, 21702
5Current Address: General Dynamics Information Technology, 321 Ballenger Center Drive,
Frederick, Maryland, 21702
6Current Address: Army Public Health Center, Toxicology Directorate, 5158 Blackhawk Road
Aberdeen Proving Ground, MD 21010-5403
*Corresponding Author
Abstract
TR-17-152 Distribution Statement A: Approved for public release; distribution is unlimited.

A method for accurate quantitation of virus particles has long been sought, but a perfect method
still eludes the scientific community. Electron Microscopy (EM) quantitation is a valuable
technique because it provides direct morphology information and counts of all viral particles,
whether or not they are infectious. In the past, EM negative stain quantitation methods have been
cited as inaccurate, non-reproducible, and with detection limits that were too high to be useful.
To improve accuracy and reproducibility, we have developed a method termed Scanning
Transmission Electron Microscopy – Virus Quantitation (STEM-VQ), which simplifies sample
preparation and uses a high throughput STEM detector in a Scanning Electron Microscope
(SEM) coupled with commercially available software. In this paper, we demonstrate STEM-VQ
with an alphavirus stock preparation to present the method’s accuracy and reproducibility,
including a comparison of STEM-VQ to viral plaque assay and the ViroCyt Virus Counter.
Keywords: Scanning Transmission Electron Microscopy Detector, Virus Quantitation
1. Introduction
Quantitation is an important factor when studying the environmental impact of viruses, or virus
impact on a specific host 1-3. An accurate method for the quantitation of virus particles would be
very useful, but a universally accepted method has not been adopted by the scientific community
1-4. Routinely, multiple different methods of quantitation have been used to substantiate the
validity of the other methods. Commonly used methods for virus quantitation includes negative
staining Transmission Electron Microscopy (TEM) counting, agar overlay plaque assay,
quantitative reverse transcription-polymerase chain reaction (qRT-PCR), immunofluorescence
microscopy, Endpoint dilution assay (TCID50) and analytical flow cytometry 1-3,5,6. Direct EM
quantitation is a valuable technique because it provides enumeration of all virus particles, those
TR-17-152 Distribution Statement A: Approved for public release; distribution is unlimited.

that are infectious, and those that are non-infectious 2,3,7. However, standardized methods for
EM virus quantitation have not been universally implemented, and current techniques can yield
inconsistent results with a low limit of detection 2,3,6. To address the shortcomings of
inconsistency and limit of detection, we developed the STEM-VQ method. This is an efficient,
reproducible SEM quantitation method which combines mPrep/g capsules to improve and
simplify sample preparation with a STEM detector in an SEM for automated image acquisition 8.
TEM particle counting was first documented in the 1940s using a spray or centrifugation
technique to deposit the sample on the supporting media, followed by negative staining with 2%
Uranyl Acetate 2,9-12. Virus particles within representative fields were imaged with a TEM and
manually counted. The final concentration was calculated based on the area imaged and the
volume of sample applied 9,10,12-16. Since that time, scientists have continued to adapt application
techniques to improve sample distribution and different purification steps to decrease
sedimentation that interfered with imaging and counting 14,15. In 1950, scientists began using a
known concentration of latex beads as a reference within their sample. This allowed calculations
based on the bead concentration instead of the area imaged 10-13. Inclusion of these reference
beads led to development of the droplet method for sample application 12. Several variations
have been developed, but the most common method involves placing a drop of sample onto a
horizontally oriented grid 12,16. While other methods of counting have been used, typically, the
two main approaches for counting TEM images involve either counting a set number of grid
squares or a set number of beads. Thresholds for each of these methods have been as few as 3
grid squares, or 200 beads, respectively 2,16. There have been numerous approaches to calculating
the final concentration of virus 2,3,5,6,13-16. With the development of image analysis software and
more automated microscopes in recent years, automated image acquisition, analysis, and
TR-17-152 Distribution Statement A: Approved for public release; distribution is unlimited.
enumeration has emerged 1. SEM has been used for many years in the quantitation of particles
for material sciences samples and STEM imaging has been used for particle counting in cell
monolayers, but STEM imaging has not gained widespread use for particle counting material in
biology or virology fields 1,17-20.
We have developed a consistent, reproducible virus quantitation method called STEM-VQ which
simplifies sample preparation and utilizes large throughput STEM detector in the SEM for
imaging, and commercially available image analysis software. Briefly, our method continues to
use a known concentration of gold beads as a reference, but it involves an different application
method with three major steps (Figure 1A): First, an equal volume of gold beads is mixed with
an unknown concentration of virus particles and the mixture is applied to the EM grid using
mPrep/g capsules8,12,21,22 (Supplementary Figure 1). Use of the mPrep/g capsules reduces direct
handling of grids and allows easy application of samples and buffers. Second, the grids are
imaged with a STEM detector in the SEM using the automated ATLAS software. Compared to
traditional TEM imaging, STEM detector imaging in the SEM eliminates the need for negative
staining and allows easy imaging of a much larger portion of the grid. Third, ImageJ image
analysis software is used to enumerate virus and gold particles. These counts are used to
determine the virus to gold ratio and calculate the original virus concentration (Figure 1C). In
this study, we present a comparison of the STEM-VQ method to agarose-based viral plaque
assay and the ViroCyt Virus Counter 2100 (VC) (ViroCyt, Boulder, CO, USA) 3,23.
2. Material and Methods
2.1.Virus suspension preparation
TR-17-152 Distribution Statement A: Approved for public release; distribution is unlimited.
Venezuelan Equine Encephalitis virus (VEEV), INH-9813 strain and Eastern Equine
Encephalitis virus (EEEV), V105-00210 strain were received from Dr. Robert Tesh at the
University of Texas Medical Branch repository. VEEV INH-9813 was isolated from the serum
of an infected individual who presented with clinical symptoms in Columbia, South America in
199524. The virus was isolated following a single passage in Vero cells. EEEV V105-00210
was isolated from a human case in Massachusetts in 2005, with no passage in animals and a
single passage in cell culture25 . Western Equine Encephalitis virus (WEEV) McMillan strain
was received from the Centers for Disease Control and Prevention, Fort Collins, CO. This virus
was originally isolated from a human case in Ontario, Canada in 194126. This virus had a
passage history in both animals and cell culture. Biosafety Level (BSL-3) laboratory prepared
master virus stocks (MVS), working virus stocks (WVS), and sucrose purified virus stocks
(SpVS) virus stocks were prepared using ATCC Vero 76 cells. For MVS and WVS, Vero cells
were infected at a multiplicity of infection (MOI) of 1 in Eagles Minimal Essential Medium
(EMEM , Cellgro) containing 2% fetal bovine serum (FBS, HyClone), 1% non-essential amino
acids (NEAA, Gibco), 1% Penicillin-Streptomycin (Pen-Strep, 10,000 U/ml and 10 mg/ml stock,
respectively, Sigma-Aldrich), 1% HEPES buffer (1M stock, Sigma-Aldrich), and 1% L-
glutamine (200 mM stock, HyClone). At 24-32 hours post-infection (PI), culture supernatants
were harvested and clarified by centrifugation at 10,000 x g for 30 minutes (Sorvall GSA rotor).
Virus stocks were aliquoted and stored at -70oC for future use. The SpVS, supernatant was
collected from Vero cells that were infected at a MOI=1 in EMEM containing 5% FBS, 0.5%
Pen-Strep (stock solution above), 1% HEPES (stock solution above), 1% L-Glutamine (stock
solution above), and 0.1% Gentamicin (50 mg/ml stock, Sigma-Aldrich) and clarified by
centrifugation. Virus was precipitated with 2.3% NaCl and 7% Polyethylene glycol (MW8000,
TR-17-152 Distribution Statement A: Approved for public release; distribution is unlimited.

Sigma-Aldrich), with stirring, overnight at 4oC. Virus was pelleted by centrifugation at 10,000 x
g for 30 minutes (Sorvall GSA rotor). Virus pellets were resuspended in 1x TNE Buffer (10 mM
Tris, 0.2 M NaCl, 1 mM EDTA, pH 7.4) and layered onto 20-60% continuous sucrose density
gradients. This was spun at 100,000 x g, 4oC, for 4 hours (SW-28Ti rotor, Beckman). The virus
band was collected, aliquoted and stored at -70oC for future use.
For all stocks, deep sequence analysis determined that the sequence of these isolates were
consistent with the reported strain of VEEV, EEEV, and WEEV. Additionally, this sequencing
analysis demonstrated that the virus stocks did not contain contaminating agents.
2.2.STEM-VQ sample preparation with mPrep/g capsules
Viral stocks were serially diluted at 1:10 in phosphate buffered saline (PBS) with dilution
volumes of at least 5 ml to achieve the final dilution for application to EM grids. Two formvar-
carbon coated 200 mesh copper EM grids (SPI, Cat#3420C-MB) were inserted into a capsule
based-microscopy processing system called mPrep/g 8 (Figure 1A left, Microscopy Innovation,
LLC, WI, Cat#G1600 and F1602). Gold beads (40nm, Ted Pella Cat#15707-5, 1.461E10
particles/ml concentration certified by Particle Technology Labs) were sonicated for 10 minutes
and transported into biocontainment with grid-loaded mPrep/g capsules along with filters,
fixatives, and 1% osmium tetroxide. Step 1, in the biocontainment suite, equal volumes of virus
(unknown concentration) and gold beads (known concentration) were well mixed (Figure 1B)
and 40µl of the resulting suspension aspirated into the mPrep/g capsule while attached to a
pipette (Figure 1A left). Step 2, the pipette with mPrep/g attached was laid on its side for 10
minutes with grids oriented horizontally for even sample distribution onto grid formvar. Step 3,
the pipette was picked up and the plunger pressed to dispense the virus bead mixture into a waste
TR-17-152 Distribution Statement A: Approved for public release; distribution is unlimited.
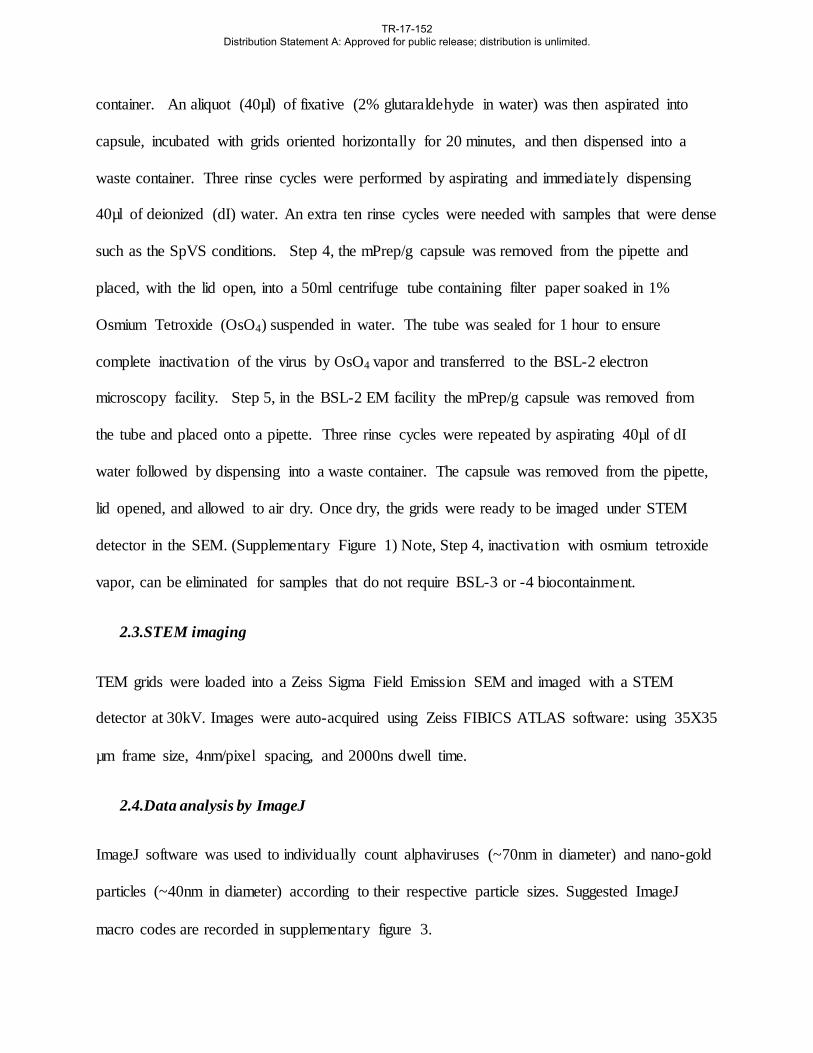
container. An aliquot (40µl) of fixative (2% glutaraldehyde in water) was then aspirated into
capsule, incubated with grids oriented horizontally for 20 minutes, and then dispensed into a
waste container. Three rinse cycles were performed by aspirating and immediately dispensing
40µl of deionized (dI) water. An extra ten rinse cycles were needed with samples that were dense
such as the SpVS conditions. Step 4, the mPrep/g capsule was removed from the pipette and
placed, with the lid open, into a 50ml centrifuge tube containing filter paper soaked in 1%
Osmium Tetroxide (OsO4) suspended in water. The tube was sealed for 1 hour to ensure
complete inactivation of the virus by OsO4 vapor and transferred to the BSL-2 electron
microscopy facility. Step 5, in the BSL-2 EM facility the mPrep/g capsule was removed from
the tube and placed onto a pipette. Three rinse cycles were repeated by aspirating 40µl of dI
water followed by dispensing into a waste container. The capsule was removed from the pipette,
lid opened, and allowed to air dry. Once dry, the grids were ready to be imaged under STEM
detector in the SEM. (Supplementary Figure 1) Note, Step 4, inactivation with osmium tetroxide
vapor, can be eliminated for samples that do not require BSL-3 or -4 biocontainment.
2.3.STEM imaging
TEM grids were loaded into a Zeiss Sigma Field Emission SEM and imaged with a STEM
detector at 30kV. Images were auto-acquired using Zeiss FIBICS ATLAS software: using 35X35
µm frame size, 4nm/pixel spacing, and 2000ns dwell time.
2.4.Data analysis by ImageJ
ImageJ software was used to individually count alphaviruses (~70nm in diameter) and nano-gold
particles (~40nm in diameter) according to their respective particle sizes. Suggested ImageJ
macro codes are recorded in supplementary figure 3.
TR-17-152 Distribution Statement A: Approved for public release; distribution is unlimited.

2.5.STEM-VQ Statistical Analysis
Virus to bead ratio:
For each grid, the virus to bead’ ratio was estimated as the slope of the linear regression of the
virus to bead count per sampled grid area, forced through the origin. The sampling variance of
the estimated virus to bead ratio obtained from a single grid was taken from the large sample
delta-method approximation, as discussed by Kempen and Vilet 27.
𝑣𝑣𝑣𝑣𝑣𝑣(𝑣𝑣1) ≈1𝑛𝑛
(𝑣𝑣𝑣𝑣𝑣𝑣(𝑥𝑥)𝜇𝜇𝑦𝑦4
+𝜇𝜇𝑥𝑥2𝑣𝑣𝑣𝑣𝑣𝑣(𝑦𝑦)
𝜇𝜇𝑦𝑦4−
2𝜇𝜇𝑥𝑥𝑐𝑐𝑐𝑐𝑣𝑣(𝑥𝑥,𝑦𝑦)𝜇𝜇𝑦𝑦3
)
Where x and y are the bead count and the bead weighted virus count and n is the number of
sampled areas. Multiple grids were examined per virus sample, an average of the log virus to
bead ratio is formed by linear mixed model. This procedure reweights the average to adjust for
the correlation observed between certain sets of grids, as well as sampling variances within grid.
Analysis was performed using the PROC MIXED procedure in SAS Version 9.4.
Calculation of the concentration of particles:
The following formula is used to calculate the concentration of particles:
𝑈𝑈𝑛𝑛𝑈𝑈𝑛𝑛𝑐𝑐𝑈𝑈𝑛𝑛 𝑉𝑉𝑉𝑉𝑣𝑣𝑉𝑉𝑉𝑉 𝐶𝐶𝑐𝑐𝑛𝑛𝑐𝑐𝐶𝐶𝑛𝑛𝐶𝐶𝑣𝑣𝑣𝑣𝐶𝐶𝑉𝑉𝑐𝑐𝑛𝑛 = 𝑉𝑉𝑉𝑉𝑣𝑣𝑉𝑉𝑉𝑉 𝐶𝐶𝑐𝑐 𝑏𝑏𝐶𝐶𝑣𝑣𝑏𝑏 𝑣𝑣𝑣𝑣𝐶𝐶𝑉𝑉𝑐𝑐 × 𝐾𝐾𝑛𝑛𝑐𝑐𝑈𝑈𝑛𝑛 𝑏𝑏𝐶𝐶𝑣𝑣𝑏𝑏 𝐶𝐶𝑐𝑐𝑛𝑛𝑐𝑐𝐶𝐶𝑛𝑛𝐶𝐶𝑣𝑣𝑣𝑣𝐶𝐶𝑉𝑉𝑐𝑐𝑛𝑛
2.6.Agarose Overlay Plaque Assay
Each virus stock was quantitated by standard agarose overlay plaque assay23. Virus stocks were
serially diluted in Hank’s Balanced Saline Solution (HBSS). ATCC Vero 76 cells seeded on 6-
well plates were grown to 90-100% confluence. Duplicate wells were infected with 100µL/well
TR-17-152 Distribution Statement A: Approved for public release; distribution is unlimited.

of each serial dilution. Plates were incubated at 37°C for 1 hour, with rocking every 15 minutes
for even distribution and to keep the monolayer from drying. Following the incubation period,
wells were overlaid with 0.5% agarose in 2X Eagle’s Basal Medium with Earle’s Salts (EBME,
USAMRIID, Fort Detrick, MD) containing 1% HEPES and 10% FBS, 1% L-glutamine, 1%
NEAA, 1% Pen-Strep, and 0.1% gentamycin, and plates incubated at 37°C with 5% CO2. After
twenty four hours the cells were stained with the addition of a second agarose overlay prepared
as above with 5% neutral red (Gibco). The plates were incubated at 37oC with 5% CO2 for an
additional 24 hours. Infectivity was quantitated by counting defined plaques (neutral red
exclusion areas). Titer was calculated by factoring in the volume of inoculum used per well and
the dilution(s) with plaque counts between 10 and 150.
2.7. ViroCyt Quantitation
Samples were tested on the VC using the ViroCyt reagent kit and following manufacturer’s
instructions. The strategy was similar to that described for filoviruses in Rossi et al., 2015 3.
Virus preparations were diluted beginning at 1:10 into ViroCyt sample buffer. Serial ¼ log
dilutions were prepared from the 1:10 in order to provide samples with values within the linear
range of the VC. Briefly, 300µl of each dilution was stained using 150µl of Combo Dye
solution, incubated in the dark at room temperature for 30 minutes, and analyzed in the VC.
Each dilution was tested in triplicate with inter-sample washes and a cleanliness control run
between each sample to verify the flow path was clean. Results were automatically analyzed by
the instrument software and reported as virus particles per ml (VP/ml). The sample quantitation
limit (SQL) for unpurified virus stocks were similar to that previously reported for filoviruses
(2.0E+06 VP/ml) while purified virus SQL was lower and equivalent to the lower limit of the
linear range of the instrument (5.5E+05 VP/ml). All VC results greater than this value were
TR-17-152 Distribution Statement A: Approved for public release; distribution is unlimited.

considered statistically distinguishable from background and therefore reportable. Final virus
particle concentrations were established using all samples whose VP/ml counts were above
background and within the linear range of the instrument. Microsoft Excel 2007 (Redmond,
WA, USA) was used for linear-regression analysis and determining coefficient of variation
between replicates. Instrument performance was validated prior to testing samples by running a
manufacturer’s control of known concentration.
3. Results
3.1.Sample preparation quality correlated with accuracy.
Uniform particle distribution and minimal background on EM grids was critical for achieving
accurate results (Figure 2A, 2D) 5,6,16. Proper sample preparation, including bead agitation,
extensive mixing of the gold beads with the virus, and at least 3 washes with reagent grade water
was required. Particles aggregation was always a sample preparation problem (Figure 2B).
Sonication of the bead stock prior to mixing with the virus helped to suspend the bead solution
and eliminate clumping that formed when the solution was stored for a lengthy period between
uses. Thorough mixing of the virus and gold beads by pipetting the mixture up and down several
times evenly distributed sample throughout the solution and helped remove any viral
aggregation. Nutrient rich media was required for virus growth, but this media resulted in
crystallized salt and sugar deposits on the grid which made imaging and counting difficult
(Figure 2C, 2E). Extra rinsing at least 10 times with water helped eliminate these deposits.
Upon data analysis, we found that correlation strength between the gold bead count and virus
count was an indicator of good sample preparation quality; and therefore, result accuracy (Figure
2D, 2E). All of the samples used here were well prepared and the standard macro was used. As
TR-17-152 Distribution Statement A: Approved for public release; distribution is unlimited.

we have developed this method we have observed that while inferior preparations should be
immediately identifiable during imaging, areas within the grid that contain particle clumping or
dirty background may go undetected with our automated imaging process. Samples that
contained particle aggregation or dirty background are usually identified by the technician when
the data set is poorly correlated or contains extreme outliers (Figure 2E). In this event, the image
analysis can be adjusted in a manner appropriate to the severity of the issue. Adjustments to the
analysis macro code (Supplementary Figure 3) such as tailored thresholding or background
extraction often solves the issue. If the particle aggregation or dirty background is severe enough
a new grid preparation for imaging is required.
3.2.Computing bootstrapped standard error to statistically determine the number of
images for an accurate STEM-VQ calculation.
One-hundred areas were imaged from a single grid to determine the number of imaged areas that
would be required for an accurate representation of the entire grid (Figure 3A). Two possible
estimators of the virus to bead ratio were compared: (1) the ratio of mean virus count to mean
bead count (ratio of means) and (2) the slope of the linear regression of virus to bead counts,
forced through the origin (regression through the origin). The 100 areas were resampled 50
times with replacement to form a boot-strap estimate of the standard error (Figure 3B) 28. As
shown in Figure 3B, the standard error decreased with increasing numbers of sampled areas.
Considering a compromise between the costs of increased sampling versus the reduction in error,
we determined that 30 imaged areas per grid were needed for accurate quantitation. Most of the
gains in reliability were realized by n=30, with further increases in the number of sampled areas
yielding only small reductions in variance.
TR-17-152 Distribution Statement A: Approved for public release; distribution is unlimited.

3.3.Individual sample preparations result in variation and limited analytical errors.
We found that a major source of error came from the variability between sample preparations.
We analyzed 4 different preparations of 3 different individual VEEV stock samples. Each
preparation consisted of two duplicate grids (Figure 4A). The results from the simultaneously
prepared duplicate grids in each preparation were very similar to each other, but there were
variations between different preparations. Figure 4B shows the standard error calculated from
the counts in Figure 4A. The range varied between one standard error above and one standard
error below demonstrating that the variability was less than a log, which is commonly considered
acceptable for EM particle counts 2,3,29.
3.4.Detection limit for accurate counting
The detection limit for any EM procedure is typically considered 1E+07 particles/ml (P/ml). 2,6
In order to determine the range for accurate counting for the STEM-VQ method, we examined
serial dilutions using alphavirus samples (Figure 5A). We found that samples containing greater
than 1E+12 P/ml typically had too much viral aggregation for an accurate quantitation (data not
shown). At the lower end, samples below 1E+07 P/ml had too few viral particles in the field of
view for an accurate count (data not shown). Particle counts within the range of 1E+09 to 1E+12
P/ml provided accurate detection in 10-fold dilutions for three different sucrose-purified virus
stocks (EEEV, WEEV and VEEV) (Figure 5B). All data in serial dilutions were linear,
indicating the accuracy of the data set.
3.5.STEM-VQ method results were comparable to agarose-based plaque assay and
ViroCyt Virus Counter results.
TR-17-152 Distribution Statement A: Approved for public release; distribution is unlimited.

There are many ways to quantify virus, all of which use very different methods to identify
particles. Among all methods, plaque assay and the VC are well developed and widely used.
Plaque assay is the most common approach to virus quantitation and is typically considered the
“gold standard” 2,3. It measures infectious virus particles by counting the number of plaques
formed when virus is applied to a monolayer of cells, giving a count expressed as plaque forming
units per ml (PFU/ml) 2-4. The VC is a flow-based counter which quantifies virus particles in
solution 3. It requires the sample to be stained for protein and nucleic acid and counts particles
containing both stains as intact virus particles, resulting in a count expressed as virus particles
per ml VP/ml 3. With STEM-VQ particle images are captured and particles counted
electronically, then visually confirmed. Counts are expressed as particles per ml P/ml 2.
We compared STEM-VQ, plaque assay and VC results for different alphavirus stocks (Figure 6).
The linear range of the VC was verified to be between 5.5E+05 and 1E+09 VP/ml. Testing of
each virus prep resulted in a linear curve with R2 ≥ 0.972, slopes between 0.916 and 1.396 and
coefficient of variation (%CV) ≤ 29% using at least 4 concentrations and n between 11 and 18.
Since the plaque assay measures infectious particles and the VC counts essentially intact virus
particles, we expected VC and plaque assay results to be similar for each virus stocks. Our data
agreed with this theory. We also expected the STEM-VQ results to be higher than both plaque
assay and the VC since STEM-VQ counts the presence of all particles within a size range and
cannot determine if they are infectious. We consistently found STEM-VQ results approximately
1.5 logs higher than the plaque assay and VC results (Figure 6). We do not propose that all types
of viruses or variable conditions would result in a 1.5 log difference in plaque assay and EM
counting, but we would always expect the EM count to be higher than plaque assay.
4. Discussion:
TR-17-152 Distribution Statement A: Approved for public release; distribution is unlimited.

Virus quantitation using negative stain TEM imaging has been criticized as difficult and time
consuming; issues we wanted to improve with the development of this method. In supplementary
Figure 2, we compared and summarized the improvements made to the STEM-VQ method
compared to the conventional TEM method. We simplified sample preparation with better
distribution by using mPrep/g capsules in the process. The mPrep/g is a small capsule that
functions as a pipette tip capable of holding two EM grids 30 (Figure 1A left). Once the grids
have been inserted into the capsule, the person preparing the sample simply attaches the mPrep/g
capsule to a pipette and no further grid manipulation is needed. Using mPrep/g resulted in much
less damage to the grid during sample preparation, providing more data available to collect for
more accurate results. It also made sample preparation in biocontainment labs (BSL3 and BSL4)
much safer and easier. Each capsule holds 2 grids; therefore, duplicate grids can be made with no
further effort. The capsules can also easily be loaded onto a multi-channel pipette, or stacked, so
many samples or several replicates of the same sample can easily be prepared 30. Additionally,
uniform particle distribution on the grid is critical for achieving accurate data 5,6,16. We found
samples prepared using the capsule consistently showed more uniform distribution than samples
prepared using the traditional droplet method 8.
Our new automated imaging and analysis procedure saved valuable technician time and allowed
for the collection of larger data set in a shorter period of time. ATLAS automated imaging
software enabled the user to select multiple areas to image, optimize the image acquisition
settings for quality imaging such as focus, brightness, and contrast, and then the software
automatically acquired images from large areas of the sample while unattended. We were able to
acquire images of thirty 35x35µm square areas from a 200 mesh grid in less than 3 hours, and a
technician needed to be present for only 45 minutes of those 3 hours. This was significantly less
TR-17-152 Distribution Statement A: Approved for public release; distribution is unlimited.

time when compared to traditional methods in which a technician must continually sit at the
microscope manipulating the controls and taking individual images. This new method not only
saved time but largely decreased the amount of hands-on time required by a technician.
Similarly, ImageJ analysis decreased the time needed to count the particles. Manually counting a
well populated grid square requires hours of counting, whereas, using ImageJ software the same
images were completed in less than 5 minutes. When counting or imaging is manually
performed, accidental overlap or skipping an area frequently occurs. Utilization of software for
analysis and automated image acquisition eliminated this error.
Virus quantitation is an important step when characterizing challenge material for use in animal
models of infectious disease. There are many methods for virus quantitation including plaque
assay, TCID50, the VC, and EM 1-3,5,6. The desired information and practicality of each method
should be considered when determining which method to use. The plaque assay can be time
consuming, typically requiring many days to complete, and must be performed at the level of
containment appropriate for the virus being handled 2,3. Choosing a cell line, media, and other
variables are essential to a successful plaque assay 3. Plaque assay has the lowest limit of
detection 31. It can only detect infectious particles, which a majority consider more applicable
for dosing quantitation because infectious particles are responsible for disease; however, there is
evidence that noninfectious particles can also effect the host immune response 32. Therefore, it is
important to evaluate noninfectious as well as infectious particles present in virus challenge
stock preparations.
For alphaviruses, the VC results were comparable to plaque assay results, but VC has a higher
limit of detection with an optimal range of 5.5E+5 – 1.0E+9 VP/ml 3. It must also be operated in
the level of containment required for the sample, but it was quick, taking less than an hour to
TR-17-152 Distribution Statement A: Approved for public release; distribution is unlimited.

stain and count a sample. It was also the most affordable option, costing about $5.00 per run.
However, the VC may provide poor results in samples with high levels of protein in the media 3.
A major limitation of EM counting methods despite improvements seen with the STEM-VQ
method is the relatively high detection limit, a concentration of 1E+07 P/ml remains necessary
for accurate results 2,6. Media containing high levels of salt, protein, or sucrose may lead to poor
imaging if not properly rinsed, and poor fixation can lead to loss of sample from the grid or
unidentifiable particles 2,5. After BSL-3/-4 sample application to the grid, which takes about an
hour, exposure to osmium tetroxide vapor quickly deactivates any virus and allows the rest of the
work to be performed outside biocontainment 8.
Despite its challenges, EM quantitation is valuable due to its ability to count total virus particles
and provide gross morphology data. It should be noted that although this method allowed for
gross morphological evaluation; more detailed observations such as protein coat on virus
particles requires additional EM procedures such as negative staining with TEM imaging. These
EM methods can also be applied to other noninfectious nano-particles such as virus-like-particles
(VLPs), whereas plaque assays and VC are unable to quantify VLPs. EM may also be able to
provide insight into VLPs development or changes due to manipulations through morphologic
evaluation 33,34. STEM-VQ and VC particle counts can be used in conjunction with other
quantitation methods, typically plaque assay, to create ratios that provide insight into both
infectivity of a virus stock and the quality of the virus preparation. These ratios (P:PFU and
VP:PFU) are important when examining alterations in the quality of virus stocks which can arise
from mutation, poor handling techniques, or sequential passaging. 18,35,36
TR-17-152 Distribution Statement A: Approved for public release; distribution is unlimited.

The STEM-VQ method simplifies sample preparation, imaging, and data analysis for particle
analysis using electron microscopy. These changes have increased the accuracy and
reproducibility of the assay.
5. Acknowledgement:
We would like to acknowledge Dr. Camenzind Robinson (Janelia Research Campus, Howard
Hughes Medical Research Institute) for his input and initial STEM set up for this project. We
would like to thank SPC Joshua Patterson for helping proof read this manuscript. This work was
funded in part by USAMRIID and the Defense Threat Reduction Agency-Joint Science and
Technology Office (Program CB3691).
Opinions, interpretations, conclusions, and recommendations are those of the authors and are not
necessarily endorsed by the U.S. Army.
Additional Information:
Competing financial interest statement: The authors declare no competing financial interests.
References:
1. Ferris, M.M., Stoffel, C.L., Maurer, T.T. & Rowlen, K.L. Quantitative intercomparison of transmission electron microscopy, flow cytometry, and epifluorescence microscopy for nanometric particle analysis. Anal Biochem 304, 249-56 (2002).
2. Malenovska, H. Virus quantitation by transmission electron microscopy, TCID(5)(0), and the role of timing virus harvesting: a case study of three animal viruses. J Virol Methods 191, 136-40 (2013).
3. Rossi, C.A. et al. Evaluation of ViroCyt(R) Virus Counter for rapid filovirus quantitation. Viruses 7, 857-72 (2015).
4. Bettarel, Y., Sime-Ngando, T., Amblard, C. & Laveran, H. A comparison of methods for counting viruses in aquatic systems. Appl Environ Microbiol 66, 2283-9 (2000).
5. Kwon, Y.J., Hung, G., Anderson, W.F., Peng, C.A. & Yu, H. Determination of Infectious Retrovirus Concentration from Colony-Forming Assay with Quantitative Analysis. J Virol 77, 5712-5720 (2003).
TR-17-152 Distribution Statement A: Approved for public release; distribution is unlimited.

6. Reid, G.G. et al. Comparison of electron microscopic techniques for enumeration of endogenous retrovirus in mouse and Chinese hamster cell lines used for production of biologics. J Virol Methods 108, 91-6 (2003).
7. Borsheim, K.Y., Bratbak, G. & Heldal, M. Enumeration and biomass estimation of planktonic bacteria and viruses by transmission electron microscopy. Appl Environ Microbiol 56, 352-6 (1990).
8. Monninger, M.K. et al. Preparation of viral samples within biocontainment for ultrastructural analysis: Utilization of an innovative processing capsule for negative staining. J Virol Methods 238, 70-76 (2016).
9. Sharp, D.G. Enumeration of virus particles by electron micrography. Proc Soc Exp Biol Med 70, 54-9 (1949).
10. Backus, R.C. & Williams, R.C. The Use of Spraying Methods and of Volatile Suspending Media in the Preparation of Specimens for Electron Microscopy. Journal of Applied Physics 21, 11-15 (1950).
11. Gelderblom, H.R., Renz, H. & Özel, M. Negative staining in diagnostic virology. Micron and Microscopica Acta 22, 435-447 (1991).
12. Miller, M. Virus particle counting by electron microscopy. Electron microscopy in biology 2, 305-339 (1982).
13. Kellenberger, E. & Arber, W. Electron microscopical studies of phage multiplication. I. A method for quantitative analysis of particle suspensions. Virology 3, 245-55 (1957).
14. Mathews, J. & Buthala, D.A. Centrifugal sedimentation of virus particles for electron microscopic counting. J Virol 5, 598-603 (1970).
15. Strohmaier, K. A new procedure for quantitative measurements of virus particles in crude preparations. J Virol 1, 1074-81 (1967).
16. Zheng, Y.Z., Webb, R., Greenfield, P.F. & Reid, S. Improved method for counting virus and virus like particles. J Virol Methods 62, 153-9 (1996).
17. Bogner, A., Jouneau, P.H., Thollet, G., Basset, D. & Gauthier, C. A history of scanning electron microscopy developments: towards "wet-STEM" imaging. Micron 38, 390-401 (2007).
18. Carpenter, J.E., Henderson, E.P. & Grose, C. Enumeration of an extremely high particle-to-PFU ratio for Varicella-zoster virus. J Virol 83, 6917-21 (2009).
19. Peckys, D.B. & de Jonge, N. Visualizing gold nanoparticle uptake in live cells with liquid scanning transmission electron microscopy. Nano Lett 11, 1733-8 (2011).
20. Datye, A.K., Xu, Q., Kharas, K.C. & McCarty, J.M. Particle size distributions in heterogeneous catalysts: What do they tell us about the sintering mechanism? Catalysis Today 111, 59-67 (2006).
21. Goodman, S.L. & Kostrna, M.S. Reducing Reagent Consumption and Improving Efficiency of Specimen Fixation and Embedding, Grid Staining and Archiving using mPrep Capsule Processing. Microscopy and Microanalysis 17, 174-175 (2011).
22. Goodman, S.L., Wendt, K.D., Kostrna, M.S. & Radi, C. Capsule-Based Processing and Handling of Electron Microscopy Specimens and Grids. Microscopy Today 23, 30-37 (2015).
23. Baer, A. & Kehn-Hall, K. Viral concentration determination through plaque assays: using traditional and novel overlay systems. J Vis Exp, e52065 (2014).
24. Weaver, S.C. et al. Re-emergence of epidemic Venezuelan equine encephalomyelitis in South America. VEE Study Group. Lancet 348, 436-40 (1996).
25. Centers for Disease, C. & Prevention. Eastern equine encephalitis--New Hampshire and Massachusetts, August-September 2005. MMWR Morb Mortal Wkly Rep 55, 697-700 (2006).
26. Nagata, L.P. et al. Infectivity variation and genetic diversity among strains of Western equine encephalitis virus. J Gen Virol 87, 2353-61 (2006).
TR-17-152 Distribution Statement A: Approved for public release; distribution is unlimited.

27. van Kempen, G.M. & van Vliet, L.J. Mean and variance of ratio estimators used in fluorescence ratio imaging. Cytometry 39, 300-5 (2000).
28. Wasserman, L. in All of Nonparametric Statistics 27-39 (Springer-Verlag, New York, NY, 2006). 29. Darling, A.J., Boose, J.A. & Spaltro, J. Virus assay methods: accuracy and validation. Biologicals
26, 105-10 (1998). 30. Goodman, S. & Kostrna, M. Reducing Reagent Consumption and Improving Efficiency of
Specimen Fixation and Embedding, Grid Staining and Archiving using mPrep (TM) Capsule Processing. Microscopy and Microanalysis 17, 1174 (2011).
31. Dulbecco, R. Production of Plaques in Monolayer Tissue Cultures by Single Particles of an Animal Virus. Proc Natl Acad Sci U S A 38, 747-52 (1952).
32. Alfson, K.J. et al. Particle-to-PFU ratio of Ebola virus influences disease course and survival in cynomolgus macaques. J Virol 89, 6773-81 (2015).
33. Pease, L.F., 3rd et al. Quantitative characterization of virus-like particles by asymmetrical flow field flow fractionation, electrospray differential mobility analysis, and transmission electron microscopy. Biotechnol Bioeng 102, 845-55 (2009).
34. Roldao, A., Mellado, M.C., Castilho, L.R., Carrondo, M.J. & Alves, P.M. Virus-like particles in vaccine development. Expert Rev Vaccines 9, 1149-76 (2010).
35. Thompson, K.A. & Yin, J. Population dynamics of an RNA virus and its defective interfering particles in passage cultures. Virol J 7, 257 (2010).
36. McCurdy, K. et al. Differential accumulation of genetic and phenotypic changes in Venezuelan equine encephalitis virus and Japanese encephalitis virus following passage in vitro and in vivo. Virology 415, 20-9 (2011).
Figure Captions:
Figure 1: STEM-VQ Method overview. (A) The three major phases that are needed for
determining particle concentration are illustrated: (left) sample preparation using mPrep/g
system, (middle) STEM imaging in the SEM, (right) Particle counting using imageJ. (B) A
mixture of a known concentration of gold beads with an unknown concentration of virus stock,
followed by application of the mixture onto an EM grid for STEM imaging in the SEM is
illustrated. (C) Formula used to calculate the number of unknown viral particles based on the
known concentration of gold beads and the virus-gold ratio.
Figure 2: Good quality sample preparation produces data points that have a strong linear
correlation: (A) An example of evenly distributed virus and beads. (B) This sample is to highly
TR-17-152 Distribution Statement A: Approved for public release; distribution is unlimited.
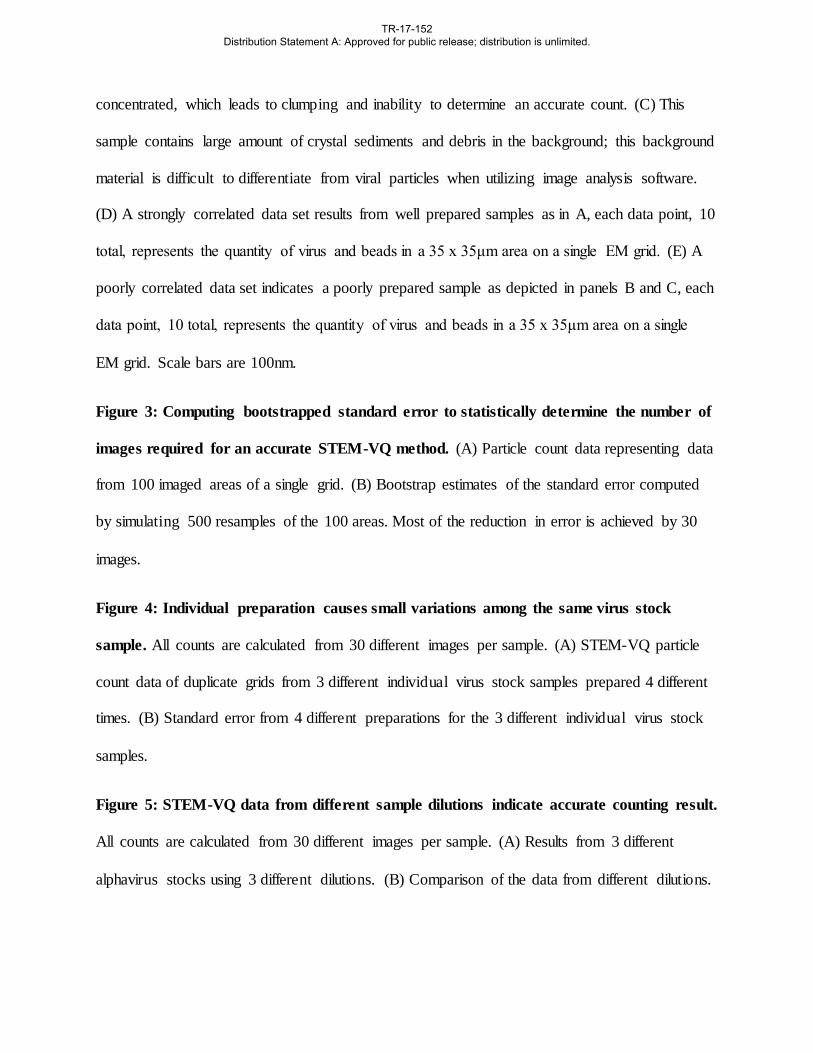
concentrated, which leads to clumping and inability to determine an accurate count. (C) This
sample contains large amount of crystal sediments and debris in the background; this background
material is difficult to differentiate from viral particles when utilizing image analysis software.
(D) A strongly correlated data set results from well prepared samples as in A, each data point, 10
total, represents the quantity of virus and beads in a 35 x 35μm area on a single EM grid. (E) A
poorly correlated data set indicates a poorly prepared sample as depicted in panels B and C, each
data point, 10 total, represents the quantity of virus and beads in a 35 x 35μm area on a single
EM grid. Scale bars are 100nm.
Figure 3: Computing bootstrapped standard error to statistically determine the number of
images required for an accurate STEM-VQ method. (A) Particle count data representing data
from 100 imaged areas of a single grid. (B) Bootstrap estimates of the standard error computed
by simulating 500 resamples of the 100 areas. Most of the reduction in error is achieved by 30
images.
Figure 4: Individual preparation causes small variations among the same virus stock
sample. All counts are calculated from 30 different images per sample. (A) STEM-VQ particle
count data of duplicate grids from 3 different individual virus stock samples prepared 4 different
times. (B) Standard error from 4 different preparations for the 3 different individual virus stock
samples.
Figure 5: STEM-VQ data from different sample dilutions indicate accurate counting result.
All counts are calculated from 30 different images per sample. (A) Results from 3 different
alphavirus stocks using 3 different dilutions. (B) Comparison of the data from different dilutions.
TR-17-152 Distribution Statement A: Approved for public release; distribution is unlimited.

Figure 6: STEM-VQ method results are consistent with plaque assay and ViroCyt counting
results. (A) Quantitation results for 5 different alphavirus stocks using 3 different quantitation
methods. All EM counts are calculated from 30 different images per sample.(B) Comparison of
the results from different methods in graphical format. EM results are higher than ViroCyt and
plaque assay because it counts the presence of all particles, including non-infectious.
TR-17-152 Distribution Statement A: Approved for public release; distribution is unlimited.

Figure 1
TR-17-152 Distribution Statement A: Approved for public release; distribution is unlimited.
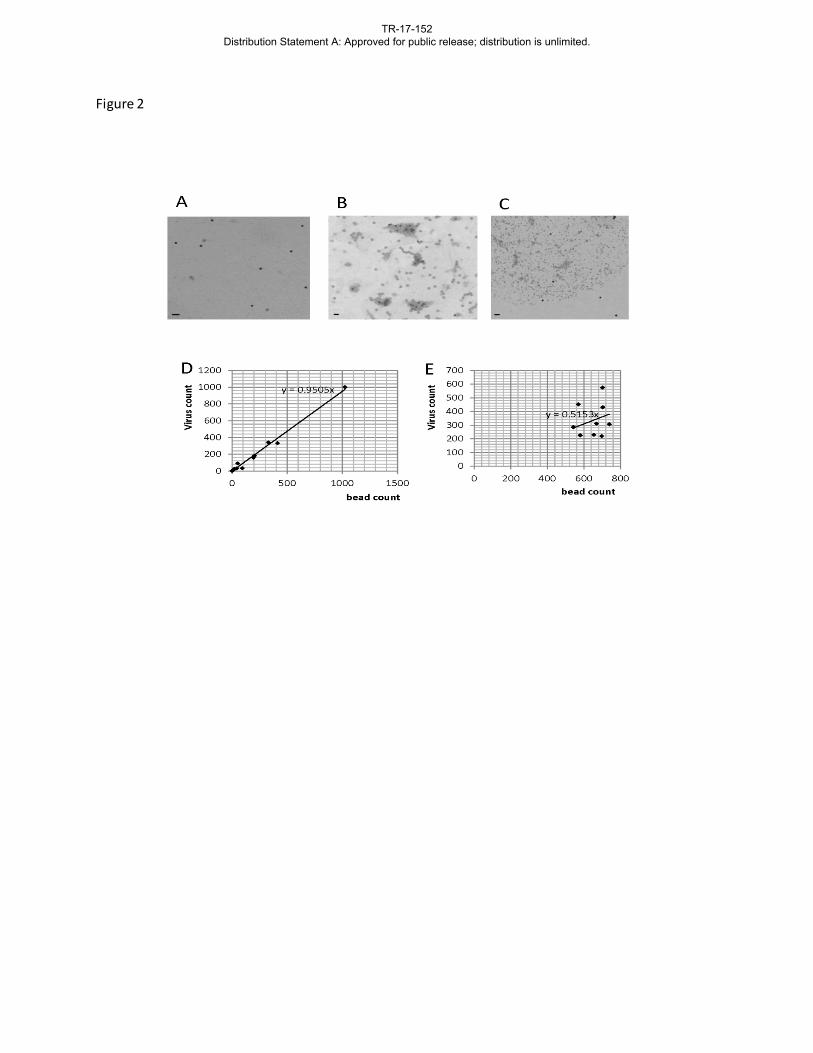
Figure 2
TR-17-152 Distribution Statement A: Approved for public release; distribution is unlimited.

Figure 3
TR-17-152 Distribution Statement A: Approved for public release; distribution is unlimited.

Figure 4
TR-17-152 Distribution Statement A: Approved for public release; distribution is unlimited.

Figure 5
TR-17-152 Distribution Statement A: Approved for public release; distribution is unlimited.

Figure 6
TR-17-152 Distribution Statement A: Approved for public release; distribution is unlimited.

Supplementary Figure 1: mPrep/g capsule procedure overview: Typical procedure using mPrep system in BSL3/4 biocontainment with short inactivation time. Step 4 can be eliminated if using BSL2 samples.
BSL3/4
Pipettor
mPrep/f
mPrep/g
Virus and beads suspension
1
Lay on side for consistent surface
distribution 2
Fix with 2% GLU 20min & 3X wash with water
OsO4 fume 1hr
3 4
BSL2
Wash and dry
5
TR-17-152 Distribution Statement A: Approved for public release; distribution is unlimited.

Conventional TEM method
STEM-VQ method The Benefits
Grid is exposed to the sample and rinsed by manipulating the grid with forceps.
Once the grid is loaded into the mPrep/g no further grid manipulation is needed for sample exposure and rinsing.
Less damage to the grid which leads to: • more even distribution of
the virus and beads. • better accuracy. • more data from each grid.
Imaging with TEM.
Imaging with STEM.
STEM imaging is automated which requires much less time. Negative staining is not needed with STEM, due to greater contrast of imaging method with lower voltage.
Manual bead and virus counts.
Image J software for determination of bead and virus counts.
ImageJ analysis requires much less time with greater accuracy.
Supplementary Figure 2: Comparison of conventional TEM method and STEM-VQ method
TR-17-152 Distribution Statement A: Approved for public release; distribution is unlimited.

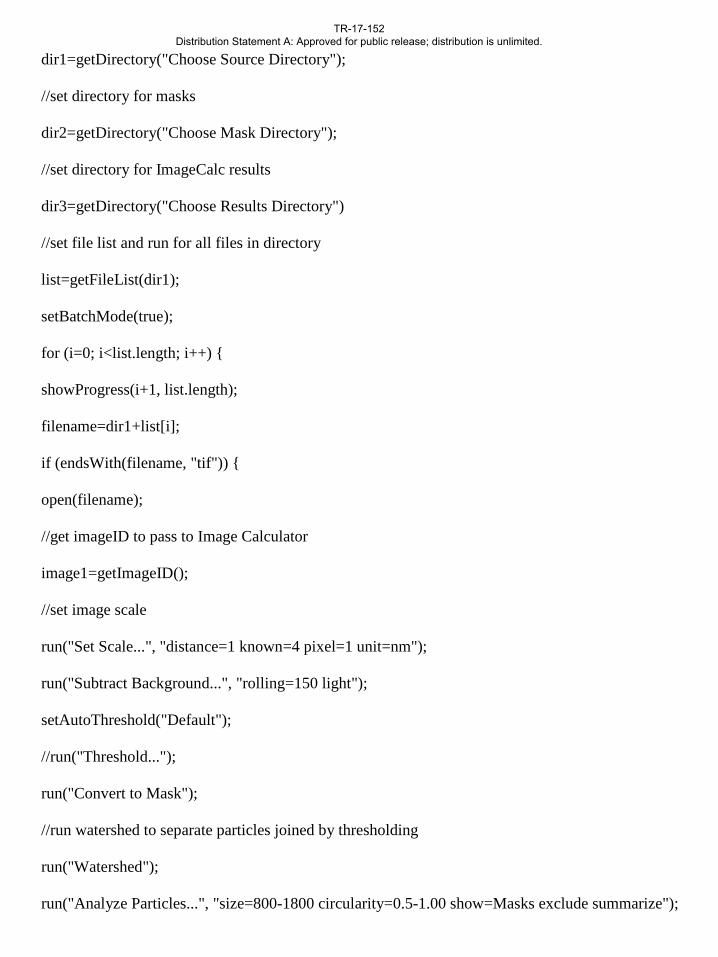
Supplementary Figure 3: Suggested ImageJ macro codes that were utilized for this study.
For counting 70nm alphavirus:
//set source directory
dir1=getDirectory("Choose Source Directory");
//set directory for masks
dir2=getDirectory("Choose Mask Directory");
//set directory for ImageCalc results
dir3=getDirectory("Choose Results Directory")
//set file list and run for all files in directory
list=getFileList(dir1);
setBatchMode(true);
for (i=0; i<list.length; i++) {
showProgress(i+1, list.length);
filename=dir1+list[i];
if (endsWith(filename, "tif")) {
open(filename);
//get imageID to pass to Image Calculator
image1=getImageID();
//set image scale
run("Set Scale...", "distance=1 known=4 pixel=1 unit=nm");
run("Subtract Background...", "rolling=150 light");
setAutoThreshold("Default");
//run("Threshold...");
run("Convert to Mask");
TR-17-152 Distribution Statement A: Approved for public release; distribution is unlimited.

//run watershed to separate particles joined by thresholding
run("Watershed");
run("Analyze Particles...", "size=2000-10000 circularity=0.1-1.00 show=Masks exclude
summarize");
//get imageID of Mask to pass to Image Calculator
image2=getImageID();
saveAs("TIFF", dir2+list[i]);
//need original image prior to running image calculator
open(filename);
image3=getImageID();
//run Image Calculator
imageCalculator("Difference create", image3, image2);
//save Results window
saveAs("TIFF", dir3+list[i]);
close();
run("Close All");
call("java.lang.System.gc");
call("java.lang.System.gc");
call("java.lang.System.gc");
//save summary window to results directory
selectWindow("Summary");
saveAs("Text",dir3+"Summary.txt");
For counting 40nm nano-gold bead particles:
//set source directory
TR-17-152 Distribution Statement A: Approved for public release; distribution is unlimited.
dir1=getDirectory("Choose Source Directory");
//set directory for masks
dir2=getDirectory("Choose Mask Directory");
//set directory for ImageCalc results
dir3=getDirectory("Choose Results Directory")
//set file list and run for all files in directory
list=getFileList(dir1);
setBatchMode(true);
for (i=0; i<list.length; i++) {
showProgress(i+1, list.length);
filename=dir1+list[i];
if (endsWith(filename, "tif")) {
open(filename);
//get imageID to pass to Image Calculator
image1=getImageID();
//set image scale
run("Set Scale...", "distance=1 known=4 pixel=1 unit=nm");
run("Subtract Background...", "rolling=150 light");
setAutoThreshold("Default");
//run("Threshold...");
run("Convert to Mask");
//run watershed to separate particles joined by thresholding
run("Watershed");
run("Analyze Particles...", "size=800-1800 circularity=0.5-1.00 show=Masks exclude summarize");
TR-17-152 Distribution Statement A: Approved for public release; distribution is unlimited.

//get imageID of Mask to pass to Image Calculator
image2=getImageID();
saveAs("TIFF", dir2+list[i]);
//need original image prior to running image calculator
open(filename);
image3=getImageID();
//run Image Calculator
imageCalculator("Difference create", image3, image2);
//save Results window
saveAs("TIFF", dir3+list[i]);
close();
run("Close All");
call("java.lang.System.gc");
call("java.lang.System.gc");
call("java.lang.System.gc");
//save summary window to results directory
selectWindow("Summary");
saveAs("Text",dir3+"Summary.txt");
TR-17-152 Distribution Statement A: Approved for public release; distribution is unlimited.

200nm polymer beads
40nm gold beads
y = 1.9811x
0
10
20
30
40
0 5 10 15 20200
nm p
olym
er c
ount
40 nm gold count (known concentration: 7.3+E9)
y = 0.4702x
0
5
10
15
20
0 20 40
40nm
gol
d co
unt
200 nm polymer count (known concentration: 1+E10)
200nm polymer concentration = polymer to gold count ratio × known gold concentration =1.9811 ×7.3+E9 =1.45+E10
40nm gold concentration = gold to polymer count ratio × known polymer concentration =0.4702 ×1+E10 =4.7+E9
Supplementary Figure 4: Using two sets of known concentration beads together to confirm the method accuracy. (A) 200nm polymer beads (1+E10 particle/ml, arrow) and 40nm gold beads ( 7.3+E9 particle/ml, arrowhead) were mix equally same volume and apply to EM grid for STEM-VQ count. STEM image, scale bar 400nm. (B) Using 40nm gold concentration to calculate 200nm polymer concentration. Calculated result suggested 1.45+E10. Compared to the known polymer concentration (1+E10), this result was within a log in difference and consider acceptable for accuracy of particle counts. (C) Using 200nm polymer concentration to calculate 40nm gold concentration. Calculated result suggest 4.7+E9. Compared to the known gold concentration (7.3+E9), this result was within a log in difference and consider acceptable for accuracy of particle counts.
TR-17-152 Distribution Statement A: Approved for public release; distribution is unlimited.