Embed Size (px)
Citation preview
ACCURATE MEASUREMENT OF THE MAGNETOSTRICTION OF SOFT
MAGNETIC MATERIALS
R.Grössinger1), H.Sassik1), D.Holzer1), N.Pillmayr2) 1) Institut f. Experimentalphysik, Technical Tech.Univ.Vienna,
Wiedner Hauptstr. 8-10, A-1040 Austria 2) KELAG Kärntner Elektrizitäts-AG, Klagenfurt, Arnulfplatz 2, Austria
Abstract
A survey of different measuring methods suited for soft magnetic materials is given. The methods are subdivided into direct and indirect methods. The SAMR method is best suited especially for low magnetostrictive ribbons. Experimental examples will be shown.
1. Introduction
In soft magnetic materials the magnetostriction is an important parameter determining the domain structure, the magnetization process and consequently the coercivity field. For very soft magnetic materials (low coercivity, high permeability) the magnetostriction λS has to be low whereas a high value of λS is interesting for the application of such a material for stress or strain sensors. The magnitude and the sign of the magnetoelastic energy determines the stress dependence of the hysteresis loop, which can be used for the sensor function. The magnetostriction is an intrinsic property of magnetic materials, which is for a crystalline material a direction dependent tensor λhkl which is mainly caused by the orbital coupling of the magnetic moment. From the temperature and concentration dependence of λS
conclusions about the corresponding mechanism are possible. Therefore the accurate determination of the magnetostriction is very important. The magnetostriction can be measured by direct and indirect methods. Direct methods are for example measurements with strain gauges, capacitance transducers or interferometers. For crystalline materials the use of strain gauges is most common. The most sensitive method is the capacitance method. All these methods have the disadvantage that they require a special sample preparation and they do not deliver the “true” saturation magnetostriction. Strain gauges are easy to handle but limited in sensitivity. Additionally the saturation magnetostriction constant has to be determined from measurements parallel and perpendicular to the external field. Indirect methods are the Becker-Kersten method [1] and the SAMR method [2] (Small angle magnetization rotation). For soft magnetic ribbons because of the special geometry beside the stress dependence of the hysteresis the SAMR method delivers very accurate results. This method can also be used from 4.2 K up to high temperatures. With the Becker-Kersten method the magnetostriction is determined from the stress dependence of the hysteresis loop. An overview about these methods can be found in reference [3]. A comparison of some available methods is presented in Table 1.
Table 1 Comparison of some methods to measure magnetostriction
Method Manner Sensitivity Remark
Strain gauges Direct ±1 x 10⁻⁶ Determine λ// and λ⊥ independently,
difficult to perform at high temperature
Capacitance Direct ∼ ±10-10 Most sensitive method but also difficult
to carry out at high temperature
Stress dependence of
hysteresis loop
Indirect ∼ ±10-8 Good for negative and very small value
of λs
SAMR (Small Angle
Magnetisation Rotation)
Indirect ∼ ±10-9 High sensitivity, suitable for ribbons,
usable at all temperature to determine λs
Transverse susceptibility Indirect ∼ ±10-9 Variation of SARM method
2 Experimental methods
There are several ways to determine the magnetostriction using direct as well as indirect methods see e.g. the review of Lachowics in the Proceedings of the SMM Conference in Eger 1984 [4] and e.g. [5]. The actual selection of a certain measuring technique depends on the sensitivity, on the temperature range and also the sample geometry. 2.1 The saturation magnetostriction
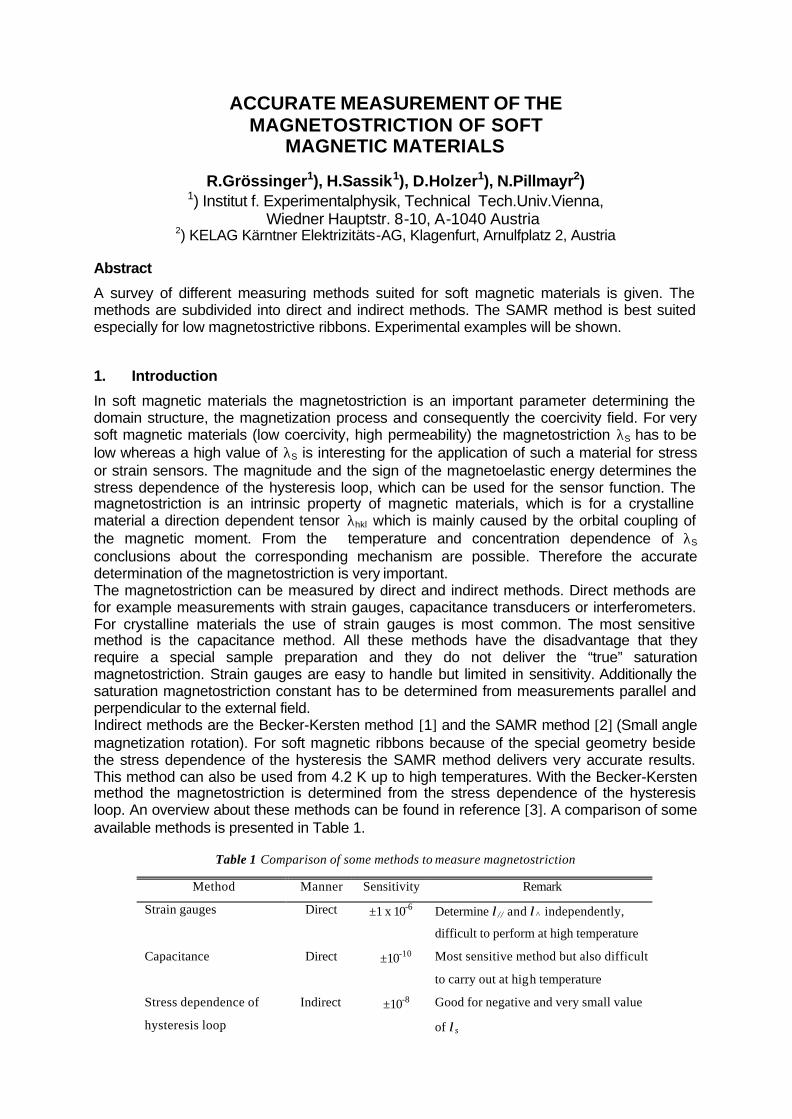
The saturation magnetostriction constant λs characterizes the change in a linear dimension of a magnetic material in an external field and is in general a material tensor. The number of elements depends on the symmetry of the crystal structure. For isotropic materials the relative change in length depends on the angle between the magnetization vector and the strain. Therefore usually one takes an extrapolation from the strain of the high field range to zero and measures the values of elongation or contraction along the z-axis by applying an H-field parallel or perpendicular to z: λ = 3/2 λs (cos2 θ -1/3) , see fig.1.
Fig.1: Definition of the saturation magnetostriction measurement
The free energy of a ferromagnetic sample is not equal in the crystallographic directions. This is called anisotropy. The magnetostrictive distortion is determined by the elongation derivative from the stress dependence of the anisotropy energy. The value of λs
can be obtained by extrapolating the strains from the high field range to zero field: λs = 2/3 (λll - λ⊥). The factor (here 2/3) depends on the symmetry of the lattice. In the case of some texture this can lead to wrong λS values. Generally follows from this expression that (nearly) with all direct methods one has to determine both values: λll - λ⊥.
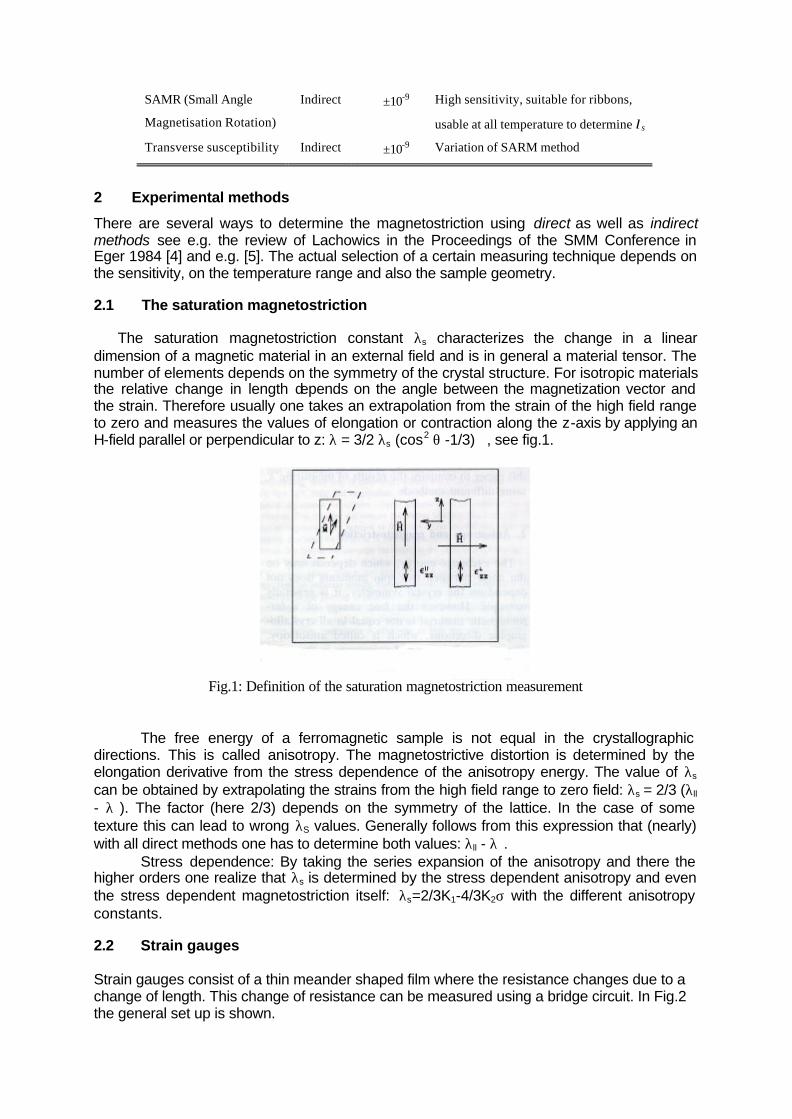
Stress dependence: By taking the series expansion of the anisotropy and there the higher orders one realize that λs is determined by the stress dependent anisotropy and even the stress dependent magnetostriction itself: λs=2/3K1-4/3K2σ with the different anisotropy constants. 2.2 Strain gauges Strain gauges consist of a thin meander shaped film where the resistance changes due to a change of length. This change of resistance can be measured using a bridge circuit. In Fig.2 the general set up is shown.
For crystalline materials the use of strain gauges for measuring the thermal expansion or the magnetostriction is most common since their development in 1947 (but very crucial: the applied strain gauges must be larger than the mean crystalline grains!). Usually full or half bridges are applied to compensate temperature changes during measurement. Application of dummies reduces also the influence of temperature and of magnetic field changes during measurements. If an ac-bridge is used the applied frequency limits dynamic measurements! The sensitivity is in the range of 1x10⁻⁶ running experiments from 4.2 K up to about 2000C depending on the sensor and the glue applied.
Fig.2. Strain gauge 1 substrate, 2 wires, 3 glue, 4 meander, 5 sample.
The strain gauge is glued on the sample , the wires are connected with a resistance bridge. The change of the resistance is proportional to the local elongation ε : ( )∆R R k k E= =ε σ (1) The k-factor gives the sensitivity; it is for metallic strain gauges close to 2. At low temperatures and at high fields deviations due to the magnetoresistance of the material can occur. The field influence can be reduced applying a second strain gauge (on a nonmagnetic sample) in the neighboring part of the bridge. In this case the magnetoresistive but also thermal contributions are cancelled. Using the strain gauge method for measuring the magnetostriction of a polycrystalline sample needs to measure parallel and perpendicular to the field axis. 2.3 Direct displacement method
A direct way is the measurement of a displacement caused by the external magnetic
field performed by mechanical or optical methods as e.g. micrometer screw, dilatometers or reflection of a laserbeam or interferometry reaching a sensitivity of about 10-11 . One sophisticated example is the method of a tunneling tip strain detector by Brizzolara 1990 [6] similar to a scanning tunneling microscope reaching a sensitivity of about 10-9 (see fig.3). In all these cases one can measure of course the magnetostriction itself, but also, very important for actuators, the elongation/ contraction as a function of the magnetic field in absolute values!
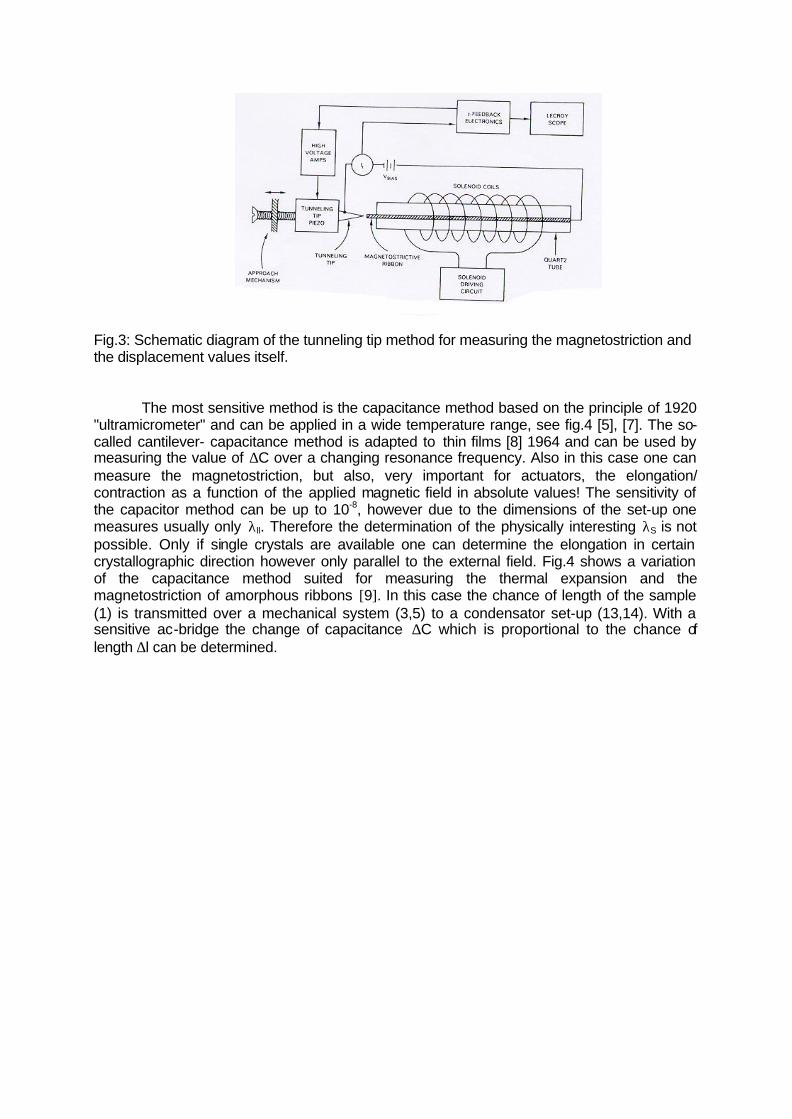
Fig.3: Schematic diagram of the tunneling tip method for measuring the magnetostriction and the displacement values itself.
The most sensitive method is the capacitance method based on the principle of 1920
"ultramicrometer" and can be applied in a wide temperature range, see fig.4 [5], [7]. The so-called cantilever- capacitance method is adapted to thin films [8] 1964 and can be used by measuring the value of ∆C over a changing resonance frequency. Also in this case one can measure the magnetostriction, but also, very important for actuators, the elongation/ contraction as a function of the applied magnetic field in absolute values! The sensitivity of the capacitor method can be up to 10-8, however due to the dimensions of the set-up one measures usually only λll. Therefore the determination of the physically interesting λS is not possible. Only if single crystals are available one can determine the elongation in certain crystallographic direction however only parallel to the external field. Fig.4 shows a variation of the capacitance method suited for measuring the thermal expansion and the magnetostriction of amorphous ribbons [9]. In this case the chance of length of the sample (1) is transmitted over a mechanical system (3,5) to a condensator set-up (13,14). With a sensitive ac-bridge the change of capacitance ∆C which is proportional to the chance of length ∆l can be determined.
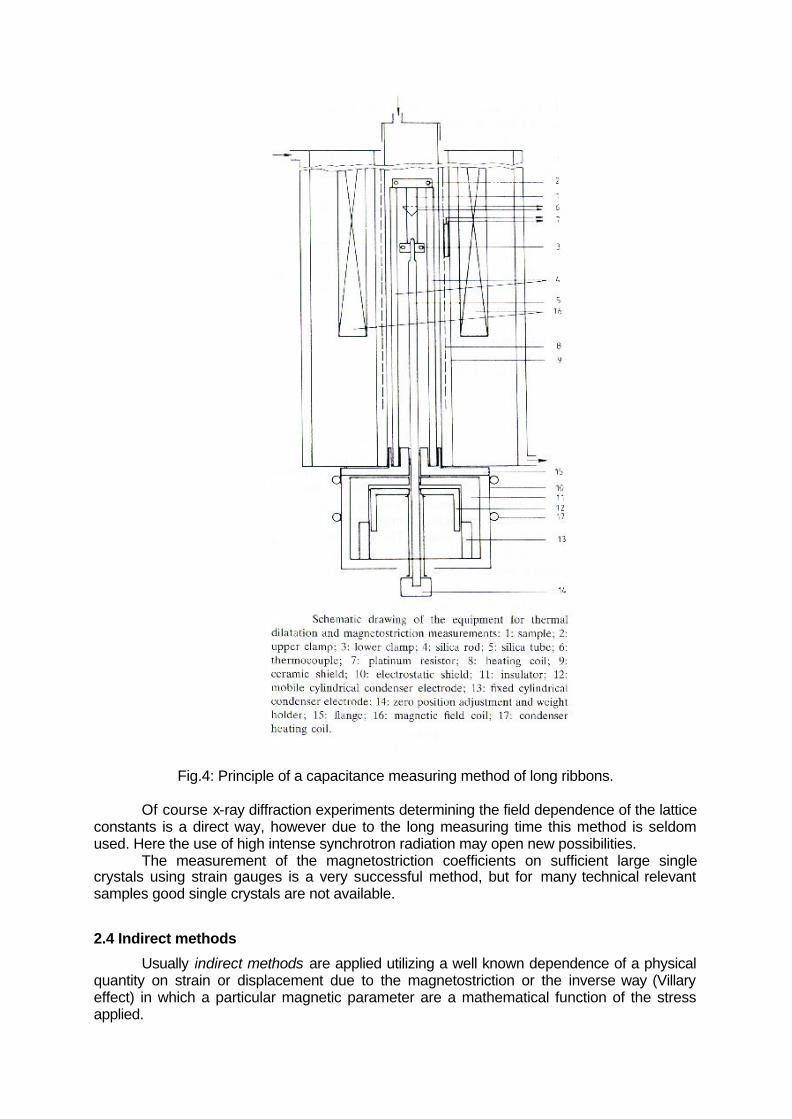
Fig.4: Principle of a capacitance measuring method of long ribbons. Of course x-ray diffraction experiments determining the field dependence of the lattice
constants is a direct way, however due to the long measuring time this method is seldom used. Here the use of high intense synchrotron radiation may open new possibilities.
The measurement of the magnetostriction coefficients on sufficient large single crystals using strain gauges is a very successful method, but for many technical relevant samples good single crystals are not available.
2.4 Indirect methods
Usually indirect methods are applied utilizing a well known dependence of a physical quantity on strain or displacement due to the magnetostriction or the inverse way (Villary effect) in which a particular magnetic parameter are a mathematical function of the stress applied.
The strain modulated ferromagnetic resonance was introduced 1963 [12] and successfully applied to garnets and spinel ferrites. Films and ribbons can be examined and values of λs near 10-9 are detectable, but it is restricted to thin samples because of the high frequency based low skin depth.
For soft magnetic ribbons because of the special geometry the SAMR method delivers very accurate results. This method can also be used from 4.2 K up to high temperatures. It was originally developed 1969 by Konishi and adopted by Narita 1980 [2]. Hernando reached values of λs near 10-9 [10], [11] . Some sophisticated, but related methods are also in use [4], [5] as e.g. the stress dependencies of the transverse susceptibility (by Kraus 1989 [14]): an aligning static field Hdc is applied perpendicular to the ribbon axis and additionally an external stress is applied. The problem with this method is the unfavorable demagnetizing factor. More simple is the stress dependence of the hysteresis loop (Becker Kersten 1930 [1]) which works very well especially for materials with λS < 0. Another possibility is to measure the effect or rotation on the magnetization due to twisting a ribbon or the effect of the field dependence of the sound velocity of a magnetoelastic wave. These methods are mainly restricted to negative values of λs .
2.4.1 Stress dependent hysteresis loop
The very old, but simple and interesting method was first described by Becker,
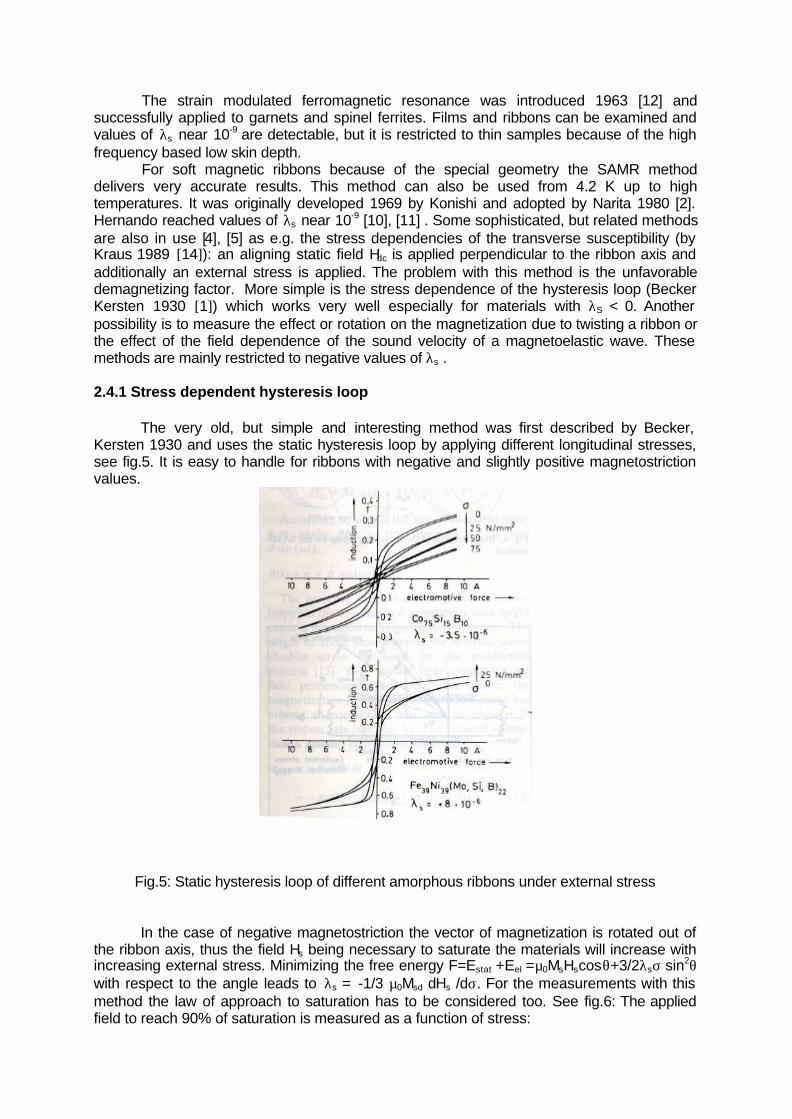
Kersten 1930 and uses the static hysteresis loop by applying different longitudinal stresses, see fig.5. It is easy to handle for ribbons with negative and slightly positive magnetostriction values.
Fig.5: Static hysteresis loop of different amorphous ribbons under external stress
In the case of negative magnetostriction the vector of magnetization is rotated out of the ribbon axis, thus the field Hs being necessary to saturate the materials will increase with increasing external stress. Minimizing the free energy F=Estat +Eel =µ0MsHscosθ+3/2λsσ sin2θ with respect to the angle leads to λs = -1/3 µ0Msd dHs /dσ. For the measurements with this method the law of approach to saturation has to be considered too. See fig.6: The applied field to reach 90% of saturation is measured as a function of stress:
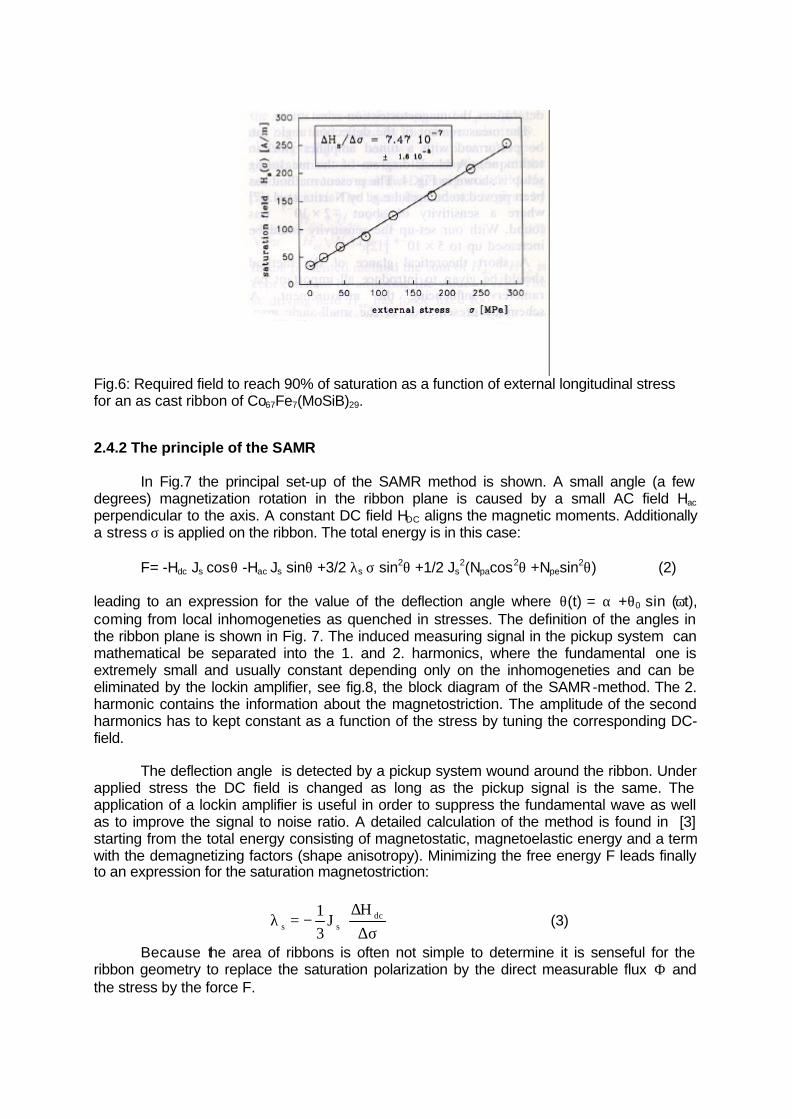
Fig.6: Required field to reach 90% of saturation as a function of external longitudinal stress for an as cast ribbon of Co67Fe7(MoSiB)29. 2.4.2 The principle of the SAMR
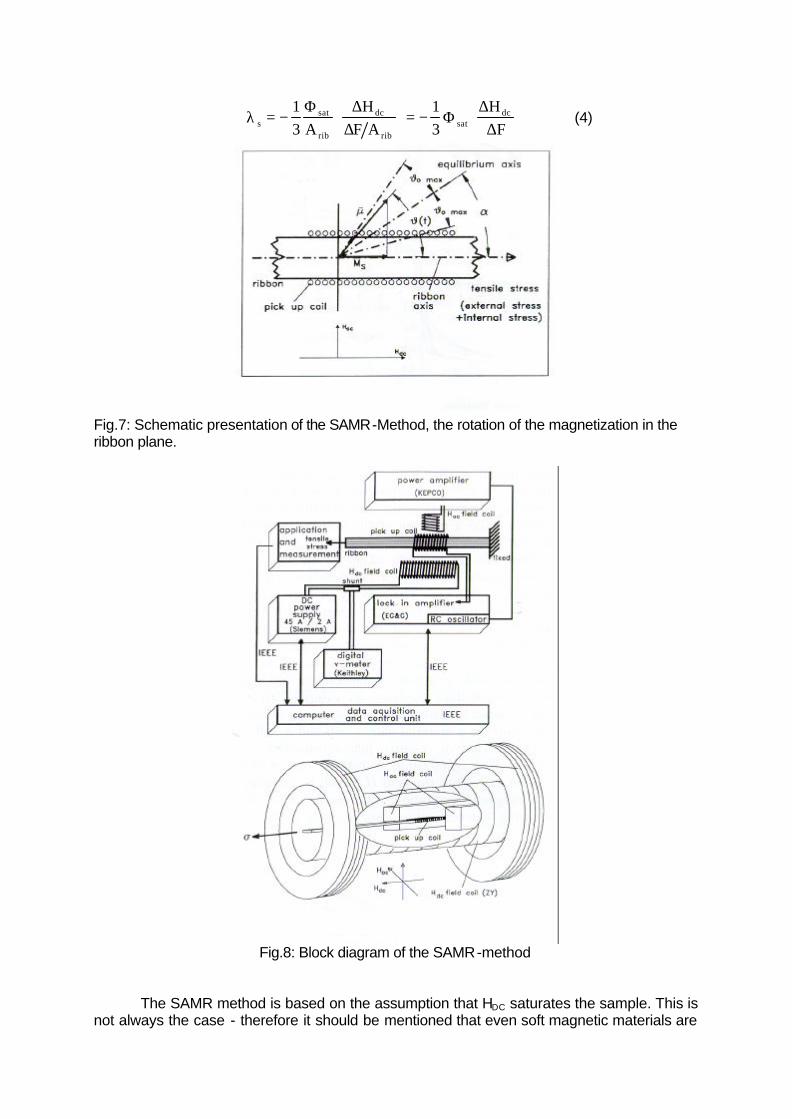
In Fig.7 the principal set-up of the SAMR method is shown. A small angle (a few
degrees) magnetization rotation in the ribbon plane is caused by a small AC field Hac perpendicular to the axis. A constant DC field HDC aligns the magnetic moments. Additionally a stress σ is applied on the ribbon. The total energy is in this case:
F= -Hdc Js cosθ -Hac Js sinθ +3/2 λs σ sin2θ +1/2 Js
2(Npacos2θ +Npesin2θ) (2)
leading to an expression for the value of the deflection angle where θ(t) = α +θ0 sin (ωt), coming from local inhomogeneties as quenched in stresses. The definition of the angles in the ribbon plane is shown in Fig. 7. The induced measuring signal in the pickup system can mathematical be separated into the 1. and 2. harmonics, where the fundamental one is extremely small and usually constant depending only on the inhomogeneties and can be eliminated by the lockin amplifier, see fig.8, the block diagram of the SAMR-method. The 2. harmonic contains the information about the magnetostriction. The amplitude of the second harmonics has to kept constant as a function of the stress by tuning the corresponding DC-field.
The deflection angle is detected by a pickup system wound around the ribbon. Under
applied stress the DC field is changed as long as the pickup signal is the same. The application of a lockin amplifier is useful in order to suppress the fundamental wave as well as to improve the signal to noise ratio. A detailed calculation of the method is found in [3] starting from the total energy consisting of magnetostatic, magnetoelastic energy and a term with the demagnetizing factors (shape anisotropy). Minimizing the free energy F leads finally to an expression for the saturation magnetostriction:
λ s sdcJ
H= −
13
∆∆σ
(3)
Because the area of ribbons is often not simple to determine it is senseful for the ribbon geometry to replace the saturation polarization by the direct measurable flux Φ and the stress by the force F.
λ ssat
rib
dc
ribsat
dc
AH
F AHF
= −
= −
13
13
Φ ∆∆
Φ∆∆
(4)
Fig.7: Schematic presentation of the SAMR-Method, the rotation of the magnetization in the ribbon plane.
Fig.8: Block diagram of the SAMR-method
The SAMR method is based on the assumption that HDC saturates the sample. This is
not always the case - therefore it should be mentioned that even soft magnetic materials are
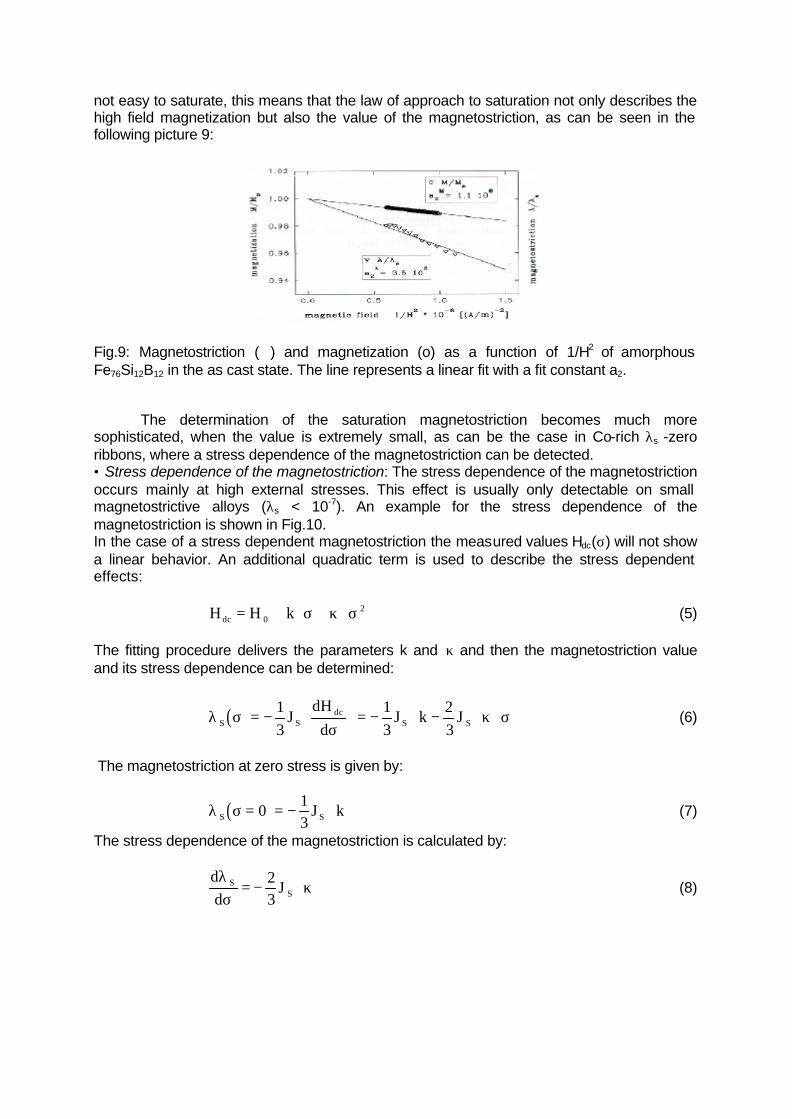
not easy to saturate, this means that the law of approach to saturation not only describes the high field magnetization but also the value of the magnetostriction, as can be seen in the following picture 9:
Fig.9: Magnetostriction (∇) and magnetization (o) as a function of 1/H2 of amorphous Fe76Si12B12 in the as cast state. The line represents a linear fit with a fit constant a2.
The determination of the saturation magnetostriction becomes much more sophisticated, when the value is extremely small, as can be the case in Co-rich λs -zero ribbons, where a stress dependence of the magnetostriction can be detected. • Stress dependence of the magnetostriction: The stress dependence of the magnetostriction occurs mainly at high external stresses. This effect is usually only detectable on small magnetostrictive alloys (λs < 10-7). An example for the stress dependence of the magnetostriction is shown in Fig.10. In the case of a stress dependent magnetostriction the measured values Hdc(σ) will not show a linear behavior. An additional quadratic term is used to describe the stress dependent effects: H H kdc = + ⋅ + ⋅0
2σ κ σ (5) The fitting procedure delivers the parameters k and κ and then the magnetostriction value and its stress dependence can be determined:
( )λ σσ
κ σS Sdc
S SJdH
dJ k J= −
= − ⋅ − ⋅ ⋅13
13
23
(6)
The magnetostriction at zero stress is given by:
( )λ σS SJ k= = − ⋅013
(7)
The stress dependence of the magnetostriction is calculated by:
dd
JSS
λσ
κ= − ⋅23
(8)
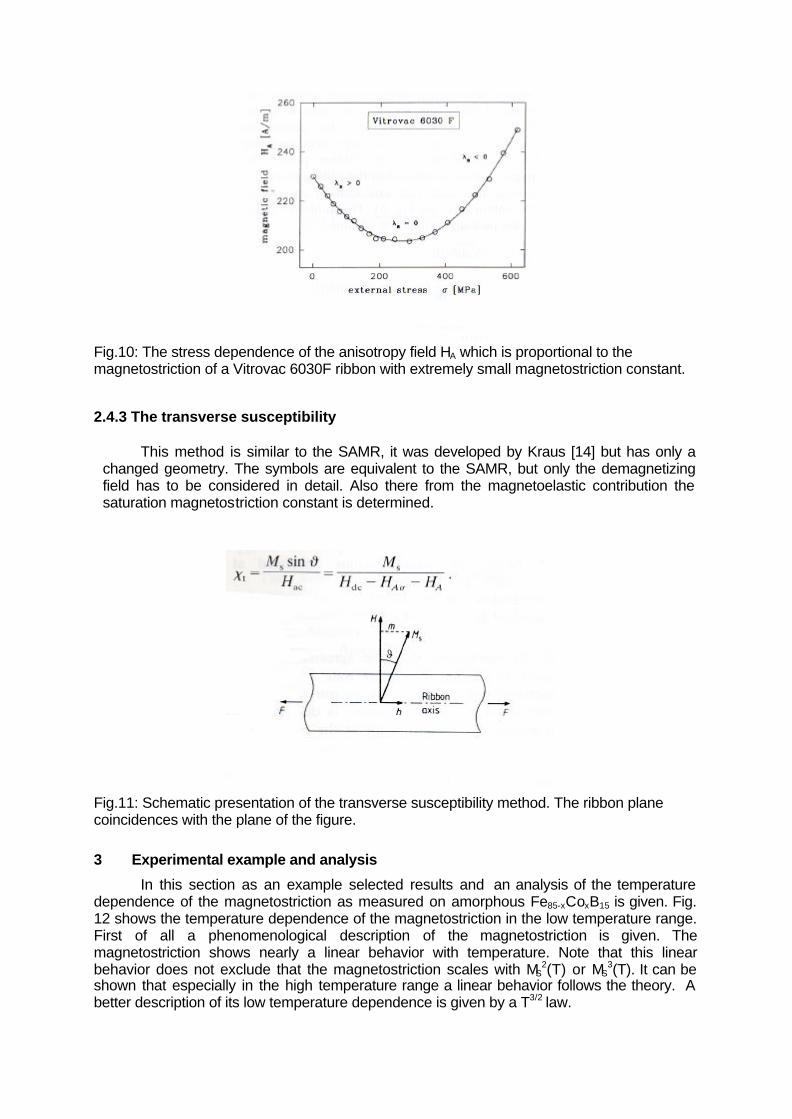
Fig.10: The stress dependence of the anisotropy field HA which is proportional to the magnetostriction of a Vitrovac 6030F ribbon with extremely small magnetostriction constant.
2.4.3 The transverse susceptibility
This method is similar to the SAMR, it was developed by Kraus [14] but has only a
changed geometry. The symbols are equivalent to the SAMR, but only the demagnetizing field has to be considered in detail. Also there from the magnetoelastic contribution the saturation magnetostriction constant is determined.
Fig.11: Schematic presentation of the transverse susceptibility method. The ribbon plane coincidences with the plane of the figure.
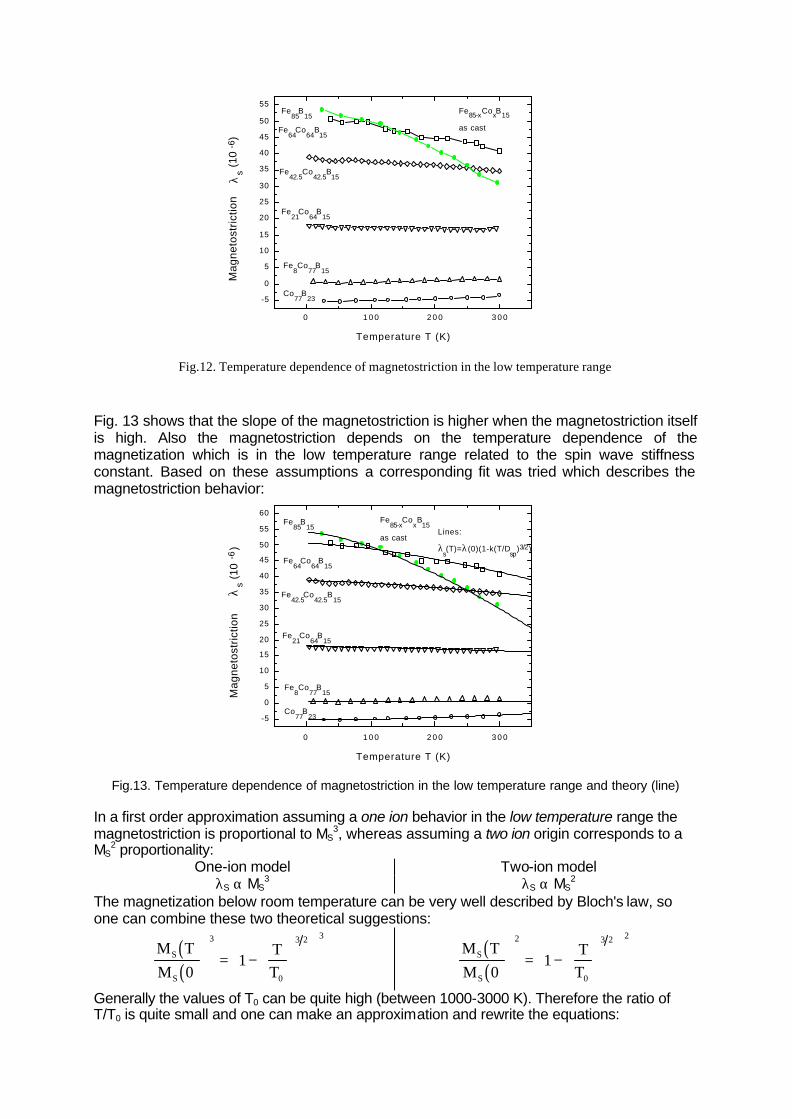
3 Experimental example and analysis
In this section as an example selected results and an analysis of the temperature dependence of the magnetostriction as measured on amorphous Fe85-xCoxB15 is given. Fig. 12 shows the temperature dependence of the magnetostriction in the low temperature range. First of all a phenomenological description of the magnetostriction is given. The magnetostriction shows nearly a linear behavior with temperature. Note that this linear behavior does not exclude that the magnetostriction scales with MS
2(T) or MS3(T). It can be
shown that especially in the high temperature range a linear behavior follows the theory. A better description of its low temperature dependence is given by a T3/2 law.
0 1 0 0 2 0 0 3 0 0
-5
0
5
10
15
20
25
30
35
40
45
50
55
Co77
B23
Fe8Co
77B
15
Fe21
Co64
B15
Fe42.5
Co42.5
B15
Fe64
Co64
B15
Fe85
B15
Fe85-xCoxB15
as cast
Mag
neto
stric
tion
λs (1
0-6
)
Temperature T (K)
Fig.12. Temperature dependence of magnetostriction in the low temperature range
Fig. 13 shows that the slope of the magnetostriction is higher when the magnetostriction itself is high. Also the magnetostriction depends on the temperature dependence of the magnetization which is in the low temperature range related to the spin wave stiffness constant. Based on these assumptions a corresponding fit was tried which describes the magnetostriction behavior:
0 1 0 0 2 0 0 3 0 0
-5
0
5
10
15
20
25
30
35
40
45
50
55
60
Lines:
λs(T)=λ(0)(1-k(T/D
sp)3/2)
Co77
B23
Fe8Co
77B
15
Fe21
Co64
B15
Fe42.5
Co42.5
B15
Fe64
Co64
B15
Fe85
B15
Fe85-x
CoxB
15
as cast
Mag
neto
stric
tion
λs (1
0-6
)
Temperature T (K)
Fig.13. Temperature dependence of magnetostriction in the low temperature range and theory (line) In a first order approximation assuming a one ion behavior in the low temperature range the magnetostriction is proportional to MS
3, whereas assuming a two ion origin corresponds to a MS
2 proportionality: One-ion model Two-ion model
λS α MS3 λS α MS
2 The magnetization below room temperature can be very well described by Bloch's law, so one can combine these two theoretical suggestions:
( )( )
M T
MTT
S
S 01
3
0
3 2 3
= −
≅
( )( )
M T
MTT
S
S 01
2
0
3 2 2
= −
≅
Generally the values of T0 can be quite high (between 1000-3000 K). Therefore the ratio of T/T0 is quite small and one can make an approximation and rewrite the equations:
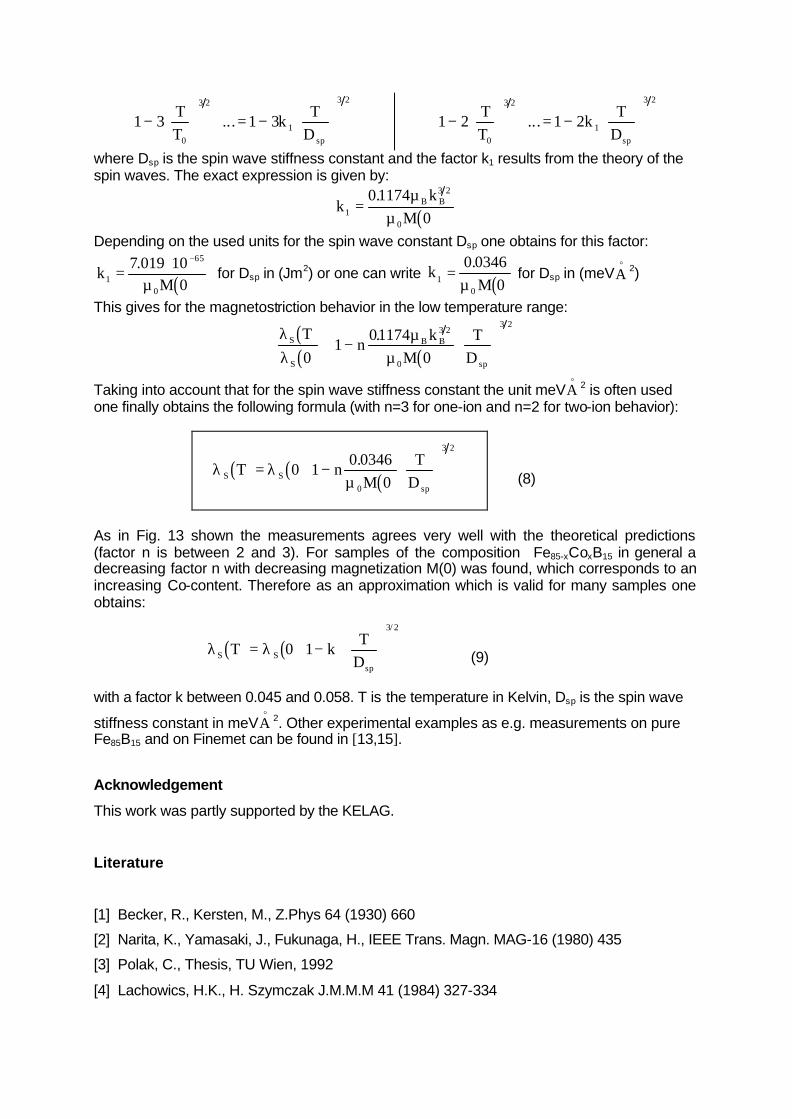
1 3 1 30
3 2
1
3 2
−
+ = −
TT
kT
D sp
... 1 2 1 20
3 2
1
3 2
−
+ = −
TT
kT
Dsp
...
where Dsp is the spin wave stiffness constant and the factor k1 results from the theory of the spin waves. The exact expression is given by:
( )kk
MB B
1
3 2
0
011740
=. µ
µ
Depending on the used units for the spin wave constant Dsp one obtains for this factor:
( )kM1
65
0
7 019 100
= ⋅ −.µ
for Dsp in (Jm2) or one can write ( )k
M10
0 03460
=.
µ for Dsp in (meVA
o2)
This gives for the magnetostriction behavior in the low temperature range:
( )( ) ( )
λλ
µµ
S
S
B B
sp
Tn
kM
TD0
101174
0
3 2
0
3 2
∝ −
.
Taking into account that for the spin wave stiffness constant the unit meVAo
2 is often used one finally obtains the following formula (with n=3 for one-ion and n=2 for two-ion behavior):
( ) ( ) ( )λ λ
µS S
sp
T nM
TD
= −
0 1
0 034600
3 2
. (8)
As in Fig. 13 shown the measurements agrees very well with the theoretical predictions (factor n is between 2 and 3). For samples of the composition Fe85-xCoxB15 in general a decreasing factor n with decreasing magnetization M(0) was found, which corresponds to an increasing Co-content. Therefore as an approximation which is valid for many samples one obtains:
( ) ( )λ λS S
sp
T kT
D= − ⋅
0 1
3 2/
(9)
with a factor k between 0.045 and 0.058. T is the temperature in Kelvin, Dsp is the spin wave
stiffness constant in meVAo
2. Other experimental examples as e.g. measurements on pure Fe85B15 and on Finemet can be found in [13,15].
Acknowledgement
This work was partly supported by the KELAG.
Literature
[1] Becker, R., Kersten, M., Z.Phys 64 (1930) 660
[2] Narita, K., Yamasaki, J., Fukunaga, H., IEEE Trans. Magn. MAG-16 (1980) 435
[3] Polak, C., Thesis, TU Wien, 1992
[4] Lachowics, H.K., H. Szymczak J.M.M.M 41 (1984) 327-334
[5] Polak, Ch., R. Grössinger, G. Vlasak, L. Kraus Int.J.of applied electromagnetics in
Materials 5 (1994) 9-17
[6] Brizzolara R.A., R.J. Colton J.M.M.M. 88 (1990) 343-350
[7] Tsuya N., K.I. Arai, Y. Shiraga, M. Yamada, T. Masumoto Phys.stat. sol. (a) 31
(1975) 557
[8] Klokholm E. IEEE Trans Mag-12 (1976) 819
[9] Vlasak G. Duhai P., Patrasova H.,Svec P., J.Phys. E Sci.Instr. 16 (1983) 1203
[10] Hernando A., V. Madurga, C. Nunez de Villavicencio, M. Vazquez
Appl.Phys.Lett 45 (1984) 802
[11] Mitra A., M. Vazquez J.Appl. Phys. 67 (1990) 4986
[12] Jagielinski T., T. Walecki, K.I. Arai, N. Tsuya J.M.M.M. 15-18 (1980) 1415
[13] Holzer D., R. Grössinger , H. Sassik J.Phys.lV France 8 (1998) Pr2-167-170
[14] Kraus L., J.Phys. E Sci. Instr. 22 (1989) 943
[15] Holzer D., L.Perez de Albinez, R. Grössinger, H. Sassik J.M.M.M. 203 (1999)
82-84


![Blanking induced damage in thin 3.2% silicon steel sheets...stresses on the magnetic properties such as hysteresis loops, permeability curv,and magnetostriction curves [22, 23]. The](https://img.pdfslide.us/doc/110x75/60e0b017ee949e6a5159c711/blanking-induced-damage-in-thin-32-silicon-steel-sheets-stresses-on-the-magnetic.jpg)