Embed Size (px)
Citation preview

Accurate lithography hotspotdetection based on principalcomponent analysis-support vectormachine classifier with hierarchicaldata clustering
Bei YuJhih-Rong GaoDuo DingXuan ZengDavid Z. Pan
Accurate lithography hotspot detection based on principalcomponent analysis-support vector machine classifierwith hierarchical data clustering
Bei Yu,a,* Jhih-Rong Gao,a Duo Ding,b Xuan Zeng,c and David Z. Pana
aUniversity of Texas at Austin, Department of Electrical and Computer Engineering, Austin, Texas 78712, United StatesbOracle Microelectronics, Austin, Texas 78727, United StatescFudan University, State Key Laboratory of ASIC & Systems, Microelectronics Department, Shanghai 200433, China
Abstract. As technology nodes continue to shrink, layout patterns become more sensitive to lithography proc-esses, resulting in lithography hotspots that need to be identified and eliminated during physical verification. Wepropose an accurate hotspot detection approach based on principal component analysis-support vector machineclassifier. Several techniques, including hierarchical data clustering, data balancing, and multilevel training, areprovided to enhance the performance of the proposed approach. Our approach is accurate and more efficientthan conventional time-consuming lithography simulation and provides a high flexibility for adapting to new lithog-raphy processes and rules. © 2015 Society of Photo-Optical Instrumentation Engineers (SPIE) [DOI: 10.1117/1.JMM.14.1.011003]
Keywords: lithography hotspot detection; machine learning; principal component analysis.
Paper 14102SSP received Jun. 28, 2014; revised manuscript received Aug. 29, 2014; accepted for publication Sep. 24, 2014; pub-lished online Nov. 4, 2014.
1 IntroductionWith the continuous shrinking of technology nodes, layoutpatterns become more sensitive to lithography processes anddegrade manufacturing yield. Lithography hotspots are for-bidden topologies that need to be identified and eliminatedduring physical verification. Various designs for manufactur-ing (DFM) techniques have been proposed to avoid thesehotspots.2 In the meantime, there are resolution enhancementtechniques, such as optical proximity correction, phase-shiftmask, and off-axis illumination, to improve the printabilityof problematic topologies.3,4 However, for a deep subwave-length process, preventing lithography hotspots is still chal-lenging and requires accurate physical verification to identifythese hotspots for improving yield.
In physical design and verification stages, the hotspotdetection problem is to locate hotspots on a given layoutwith a fast turn-around time. Conventional lithography sim-ulation5,6 obtains pattern images using complicated lithogra-phy models. Although it is accurate, full-chip lithographysimulation is computationally expensive and cannot providequick feedback to guide the early physical design stages.
To overcome the runtime overhead from conventionallithography simulation recently, two hotspot detection meth-odologies have recently evolved: pattern matching-basedmethods7–10 and machine learning-based methods.1,11–17 Inpattern matching-based approaches, a hotspot pattern isdefined by its geometric characteristics, and the detectionprocess involves matching the hotspot patterns with all lay-out patterns. This method relies on a set of predefined hot-spot patterns, and patterns outside of the scope may all beviewed as nonhotspots. Defining too many hotspot patternswould lead to overestimation and overoptimization, while
defining too few would limit the design space too aggres-sively. Although pattern matching-based methods are accu-rate and fast, how to properly define hotspot patterns is stillthe main issue. In machine learning-based approaches, aregression model is constructed according to a given trainingdata which includes hotspot and nonhotspot patterns. Themodel is then used to identify hotspots on a given testinglayout. Machine learning-based approaches enlarge the pos-sible topologies for hotspots and can improve the detectionrate. However, they also increase the false alarms, whichmean some reported hotspots are not real hotspots.
Effective representation of layout data is essential for thehotspot detection problem and there have been severalencoding methods proposed. Kahng et al. presented anearly hotspot detection7 that builds a graph for the full layoutto reflect the pattern-related critical dimension (CD) varia-tion. This method depends on a limited set of CD variationevaluation methods, and false alarms may be generated. Yuet al. proposed a DRC-based hotspot detection10 byextracting critical topological features and modeling themas design rules. The method used to extract critical designrules is a crucial process for its performance because exces-sive rules would lead to numerous false alarms, while fewrules would lead to missed real hotspots. A range pattern8,9
is proposed to incorporate process-dependent specificationswhich then can be used to identify hotspots by performing astring matching. Recently, support vector nachine (SVM) hasbecome a popular data learning model for hotspot detection.Drmanac et al.11 utilize SVM to train patterns represented bythe histogram extracted from pixel-based layout images. InRef. 13, layout density-based metrics are extracted to trainthe SVM kernel. A hybrid pattern matching and machinelearning-based approaches14 are proposed to take advantageof both techniques.
*Address all correspondence to: Bei Yu, E-mail: [email protected]
The preliminary version of this work appeared in SPIE Intl. Symp. AdvancedLithography 2014.1 0091-3286/2015/$25.00 © 2015 SPIE
J. Micro/Nanolith. MEMS MOEMS 011003-1 Jan–Mar 2015 • Vol. 14(1)
J. Micro/Nanolith. MEMS MOEMS 14(1), 011003 (Jan–Mar 2015)
In this paper, we propose a high performance hotspotdetection approach based on PCA-SVM classifier. Principalcomponent analysis (PCA) is a technique for feature extrac-tion and data reduction. To the best of our knowledge, it isthe first time that a PCA-based method has been applied inhotspot detection or a manufacturing field. We will demon-strate the effectiveness of combining PCA with SVM: thecombination can help to significantly improve detectionaccuracy. Besides, our approach integrates the advantagesof pattern matching and data learning, where pattern match-ing techniques enable high accuracy and data learning algo-rithms provide high flexibility to adapt to new lithographyprocesses and rules. The main contributions include:
• We propose a multilevel PCA-SVM-based data learn-ing flow that can extract critical layout informationthrough mathematical analysis.
• We present a two-stage hierarchical data clusteringapproach to partition the layout data, such that irrel-evant data can be processed by different classifiersfor both efficiency and accuracy improvements.
• We apply several data compression techniques toenhance the performance of PCA-SVM, includingdata sampling for hotspot/nonhotspot imbalances anddimension reduction for encoded layout data.
• The experimental results show that our approach caneffectively optimize accuracy and false alarms, wheremore than 80% of hotspots on all given testing layoutscan be successfully identified.
The rest of the paper is organized as follows. We will firstprovide some preliminaries and the problem formulation inSec. 2. Our proposed approaches, including hotspot modelcalibration and full layout detection, will be explained inSecs. 3 and 4, respectively. Finally, we will show our exper-imental results and performance analysis in Sec. 5, followedby the conclusion in Sec. 6.
2 Preliminaries and Problem Formulation
2.1 Layout Pattern Representation
A layout pattern becomes a hotspot not only because of theshape itself, but also because of the combined impact of itsneighboring patterns. One fundamental step for the hotspot
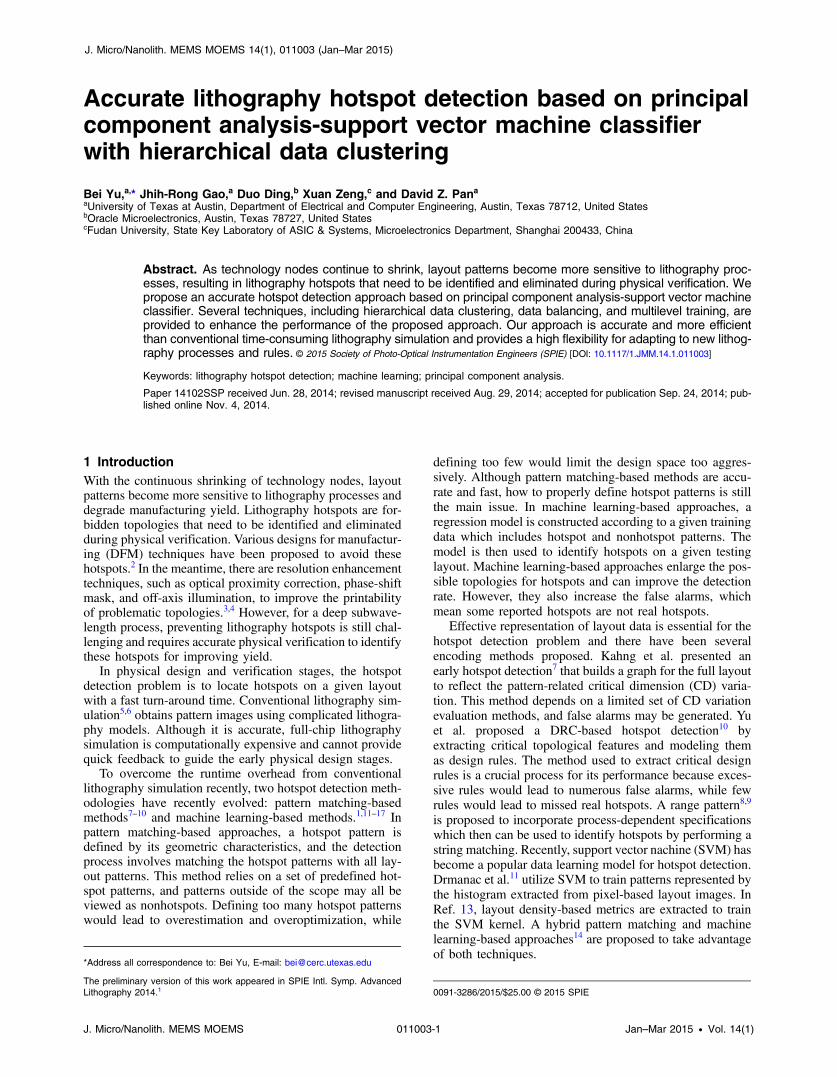
detection problem is to represent layout patterns with a cer-tain format that can well describe the layout environment. Inthis paper, we adopt the concept of the fragmentation-basedcontext characterization18 to encode the layout patterns. Thischaracterization method provides important layout informa-tion that is sufficient to describe a hotspot/nonhotspot,including pattern shapes, the distance between patterns, cor-ner information (convex or concave), and so on.
Figure 1(a) shows the contour of three layout patterns andtheir corresponding Hanan grids. In geometry, the Hanangrid of a finite set of points in the plane is obtained by con-structing vertical and horizontal lines through each point inthis set. It is named after Maurice Hanan, who was the firstperson to introduce this graph.19 Fragments are generatedbased on these grids as shown in (b). For each fragmentf, an effective radius r is defined to cover the neighboringfragments which need to be considered in the context char-acterization of f. The radius r is process-dependent, whichshows how neighboring patterns can affect the fragment ofinterest f. We then extract all fragments fr covered by thecircle with radius r as shown in Fig. 1(b) and their properties.A complete representation of f includes the geometric char-acteristic of each fr, such as the length, corner, space, etc.,which is stored as a vector for each fragment. In the follow-ing paper, we refer to the characterized vector of a fragmentas fragment vectoer (FV).
The fragment generation in Ref. 18 is done by Calibre.20
Since our hotspot detection flow is independent of Calibre,we generate fragments based on the Hanan grids.
2.2 Problem Formulation
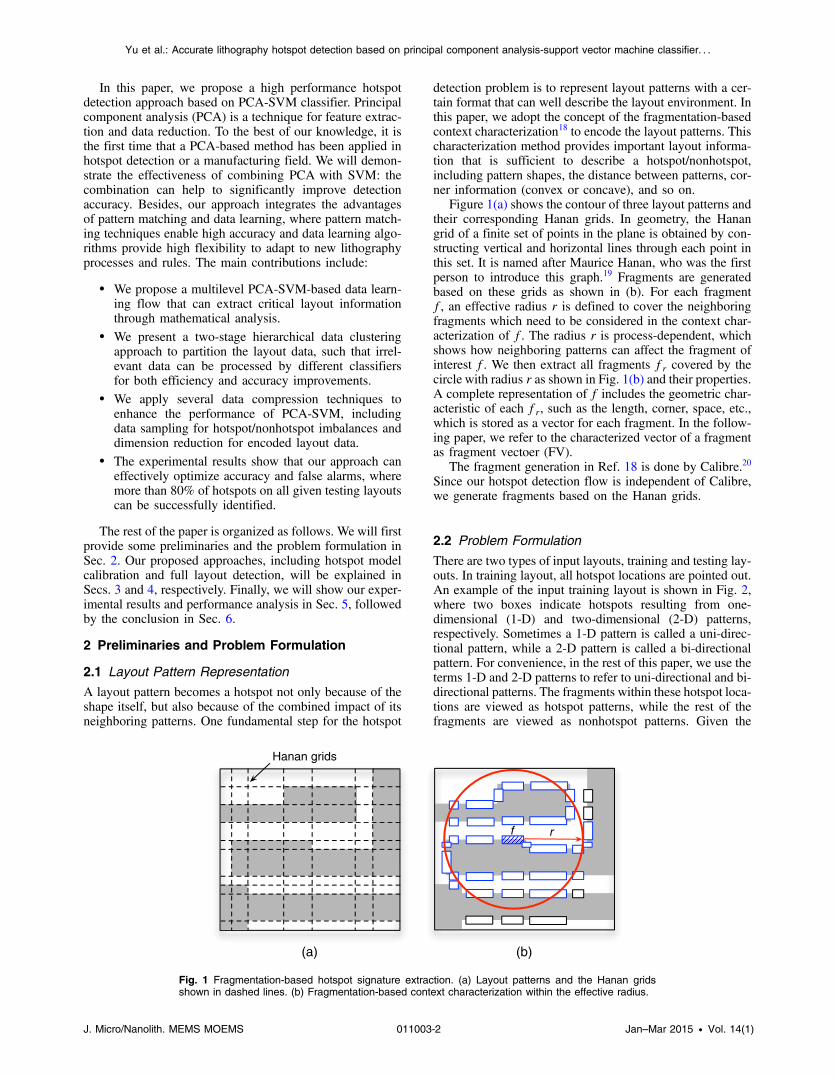
There are two types of input layouts, training and testing lay-outs. In training layout, all hotspot locations are pointed out.An example of the input training layout is shown in Fig. 2,where two boxes indicate hotspots resulting from one-dimensional (1-D) and two-dimensional (2-D) patterns,respectively. Sometimes a 1-D pattern is called a uni-direc-tional pattern, while a 2-D pattern is called a bi-directionalpattern. For convenience, in the rest of this paper, we use theterms 1-D and 2-D patterns to refer to uni-directional and bi-directional patterns. The fragments within these hotspot loca-tions are viewed as hotspot patterns, while the rest of thefragments are viewed as nonhotspot patterns. Given the
Hanan grids
rf
(a) (b)
Fig. 1 Fragmentation-based hotspot signature extraction. (a) Layout patterns and the Hanan gridsshown in dashed lines. (b) Fragmentation-based context characterization within the effective radius.
J. Micro/Nanolith. MEMS MOEMS 011003-2 Jan–Mar 2015 • Vol. 14(1)
Yu et al.: Accurate lithography hotspot detection based on principal component analysis-support vector machine classifier. . .
training and testing layouts, the hotspot detection problemcan be formulated as follows.
Problem 1 (hotspot detection). Given two sets of train-ing layout clips, a set of hotspots and a set of nonhotspots,construct a system/model that can be used to identifyunknown hotspots on a testing layout. The objective is toincrease the number of true hotspots (Hit) and decreasethe number of false hotspots (Extra).
Noted that when given a testing layout with unknown hot-spots, the hotspot detection engine should report all possiblehotspot locations. However, the reporting of excessive falsehotspots would cause an overoptimization for the later hot-spot fixing stage and should be minimized.
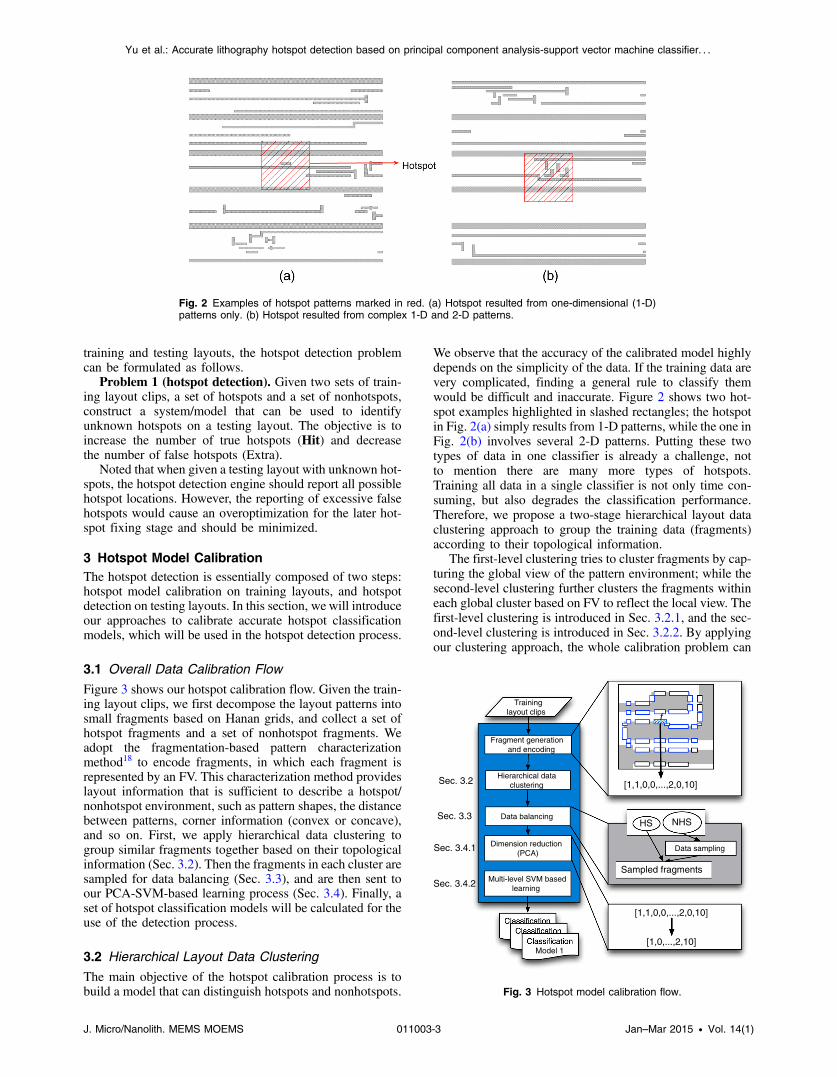
3 Hotspot Model CalibrationThe hotspot detection is essentially composed of two steps:hotspot model calibration on training layouts, and hotspotdetection on testing layouts. In this section, we will introduceour approaches to calibrate accurate hotspot classificationmodels, which will be used in the hotspot detection process.
3.1 Overall Data Calibration Flow
Figure 3 shows our hotspot calibration flow. Given the train-ing layout clips, we first decompose the layout patterns intosmall fragments based on Hanan grids, and collect a set ofhotspot fragments and a set of nonhotspot fragments. Weadopt the fragmentation-based pattern characterizationmethod18 to encode fragments, in which each fragment isrepresented by an FV. This characterization method provideslayout information that is sufficient to describe a hotspot/nonhotspot environment, such as pattern shapes, the distancebetween patterns, corner information (convex or concave),and so on. First, we apply hierarchical data clustering togroup similar fragments together based on their topologicalinformation (Sec. 3.2). Then the fragments in each cluster aresampled for data balancing (Sec. 3.3), and are then sent toour PCA-SVM-based learning process (Sec. 3.4). Finally, aset of hotspot classification models will be calculated for theuse of the detection process.
3.2 Hierarchical Layout Data Clustering
The main objective of the hotspot calibration process is tobuild a model that can distinguish hotspots and nonhotspots.
We observe that the accuracy of the calibrated model highlydepends on the simplicity of the data. If the training data arevery complicated, finding a general rule to classify themwould be difficult and inaccurate. Figure 2 shows two hot-spot examples highlighted in slashed rectangles; the hotspotin Fig. 2(a) simply results from 1-D patterns, while the one inFig. 2(b) involves several 2-D patterns. Putting these twotypes of data in one classifier is already a challenge, notto mention there are many more types of hotspots.Training all data in a single classifier is not only time con-suming, but also degrades the classification performance.Therefore, we propose a two-stage hierarchical layout dataclustering approach to group the training data (fragments)according to their topological information.
The first-level clustering tries to cluster fragments by cap-turing the global view of the pattern environment; while thesecond-level clustering further clusters the fragments withineach global cluster based on FV to reflect the local view. Thefirst-level clustering is introduced in Sec. 3.2.1, and the sec-ond-level clustering is introduced in Sec. 3.2.2. By applyingour clustering approach, the whole calibration problem can
Fig. 2 Examples of hotspot patterns marked in red. (a) Hotspot resulted from one-dimensional (1-D)patterns only. (b) Hotspot resulted from complex 1-D and 2-D patterns.
Hierarchical data clustering
Data balancing
Multi-level SVM based learning
Training layout clips
HS NHS
Data sampling
Sec. 3.2
Sec. 3.3
Sec. 3.4.1
Fragment generation and encoding
Sampled fragments
Dimension reduction(PCA)
f
[1,1,0,0,...,2,0,10]
Sec. 3.4.2
[1,1,0,0,...,2,0,10]
[1,0,...,2,10]Model 1
Fig. 3 Hotspot model calibration flow.
J. Micro/Nanolith. MEMS MOEMS 011003-3 Jan–Mar 2015 • Vol. 14(1)
Yu et al.: Accurate lithography hotspot detection based on principal component analysis-support vector machine classifier. . .
be divided into several independent subproblems. Then allthe calibration results in different clusters can be mergedinto our final calibration result. We will show that this clus-tering approach helps to improve model accuracy and toreduce the overall runtime in our experimental results.
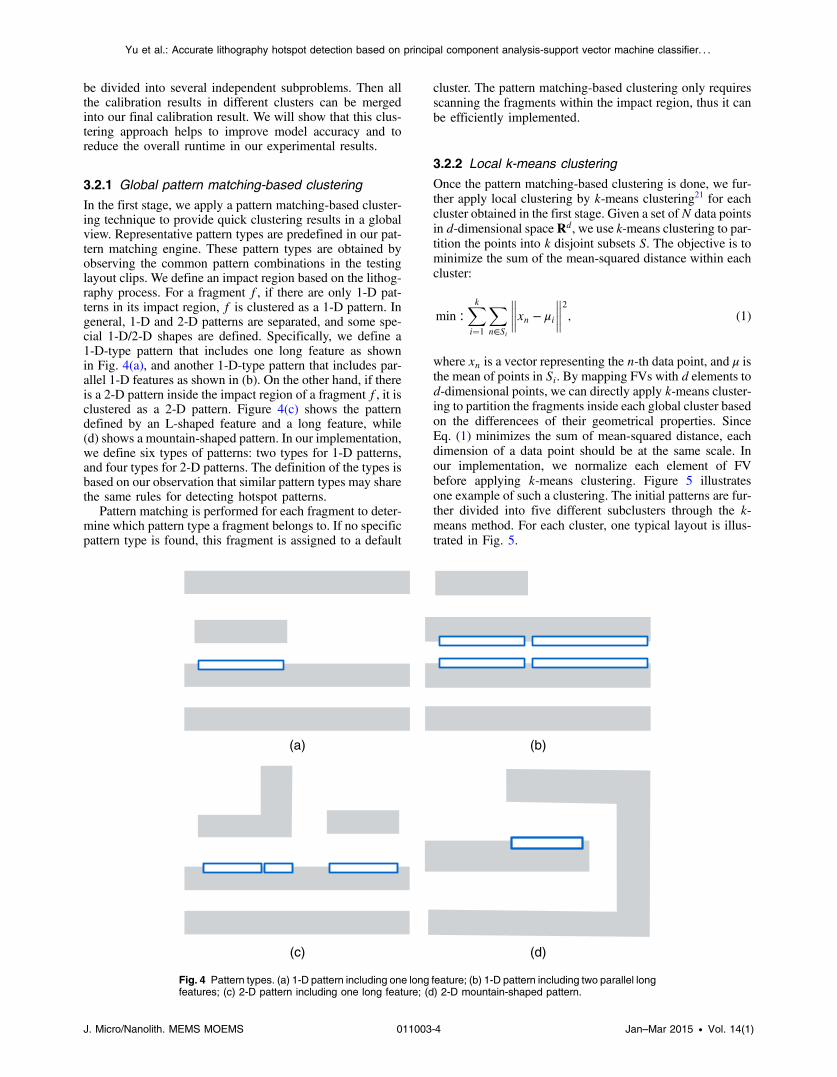
3.2.1 Global pattern matching-based clustering
In the first stage, we apply a pattern matching-based cluster-ing technique to provide quick clustering results in a globalview. Representative pattern types are predefined in our pat-tern matching engine. These pattern types are obtained byobserving the common pattern combinations in the testinglayout clips. We define an impact region based on the lithog-raphy process. For a fragment f, if there are only 1-D pat-terns in its impact region, f is clustered as a 1-D pattern. Ingeneral, 1-D and 2-D patterns are separated, and some spe-cial 1-D/2-D shapes are defined. Specifically, we define a1-D-type pattern that includes one long feature as shownin Fig. 4(a), and another 1-D-type pattern that includes par-allel 1-D features as shown in (b). On the other hand, if thereis a 2-D pattern inside the impact region of a fragment f, it isclustered as a 2-D pattern. Figure 4(c) shows the patterndefined by an L-shaped feature and a long feature, while(d) shows a mountain-shaped pattern. In our implementation,we define six types of patterns: two types for 1-D patterns,and four types for 2-D patterns. The definition of the types isbased on our observation that similar pattern types may sharethe same rules for detecting hotspot patterns.
Pattern matching is performed for each fragment to deter-mine which pattern type a fragment belongs to. If no specificpattern type is found, this fragment is assigned to a default
cluster. The pattern matching-based clustering only requiresscanning the fragments within the impact region, thus it canbe efficiently implemented.
3.2.2 Local k-means clustering
Once the pattern matching-based clustering is done, we fur-ther apply local clustering by k-means clustering21 for eachcluster obtained in the first stage. Given a set ofN data pointsin d-dimensional space Rd, we use k-means clustering to par-tition the points into k disjoint subsets S. The objective is tominimize the sum of the mean-squared distance within eachcluster:
min ∶Xki¼1
Xn∈Si
����xn − μi
����2
; (1)
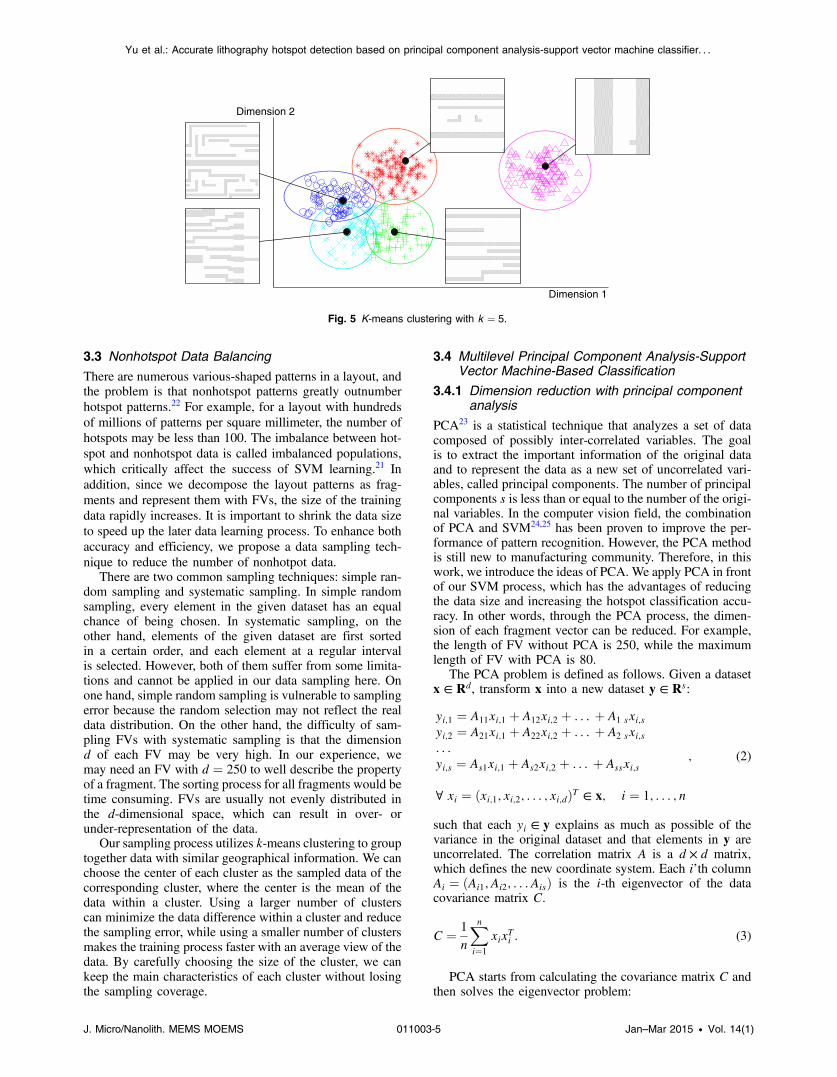
where xn is a vector representing the n-th data point, and μ isthe mean of points in Si. By mapping FVs with d elements tod-dimensional points, we can directly apply k-means cluster-ing to partition the fragments inside each global cluster basedon the differencees of their geometrical properties. SinceEq. (1) minimizes the sum of mean-squared distance, eachdimension of a data point should be at the same scale. Inour implementation, we normalize each element of FVbefore applying k-means clustering. Figure 5 illustratesone example of such a clustering. The initial patterns are fur-ther divided into five different subclusters through the k-means method. For each cluster, one typical layout is illus-trated in Fig. 5.
(a) (b)
(c) (d)
Fig. 4 Pattern types. (a) 1-D pattern including one long feature; (b) 1-D pattern including two parallel longfeatures; (c) 2-D pattern including one long feature; (d) 2-D mountain-shaped pattern.
J. Micro/Nanolith. MEMS MOEMS 011003-4 Jan–Mar 2015 • Vol. 14(1)
Yu et al.: Accurate lithography hotspot detection based on principal component analysis-support vector machine classifier. . .
3.3 Nonhotspot Data Balancing
There are numerous various-shaped patterns in a layout, andthe problem is that nonhotspot patterns greatly outnumberhotspot patterns.22 For example, for a layout with hundredsof millions of patterns per square millimeter, the number ofhotspots may be less than 100. The imbalance between hot-spot and nonhotspot data is called imbalanced populations,which critically affect the success of SVM learning.21 Inaddition, since we decompose the layout patterns as frag-ments and represent them with FVs, the size of the trainingdata rapidly increases. It is important to shrink the data sizeto speed up the later data learning process. To enhance bothaccuracy and efficiency, we propose a data sampling tech-nique to reduce the number of nonhotpot data.
There are two common sampling techniques: simple ran-dom sampling and systematic sampling. In simple randomsampling, every element in the given dataset has an equalchance of being chosen. In systematic sampling, on theother hand, elements of the given dataset are first sortedin a certain order, and each element at a regular intervalis selected. However, both of them suffer from some limita-tions and cannot be applied in our data sampling here. Onone hand, simple random sampling is vulnerable to samplingerror because the random selection may not reflect the realdata distribution. On the other hand, the difficulty of sam-pling FVs with systematic sampling is that the dimensiond of each FV may be very high. In our experience, wemay need an FV with d ¼ 250 to well describe the propertyof a fragment. The sorting process for all fragments would betime consuming. FVs are usually not evenly distributed inthe d-dimensional space, which can result in over- orunder-representation of the data.
Our sampling process utilizes k-means clustering to grouptogether data with similar geographical information. We canchoose the center of each cluster as the sampled data of thecorresponding cluster, where the center is the mean of thedata within a cluster. Using a larger number of clusterscan minimize the data difference within a cluster and reducethe sampling error, while using a smaller number of clustersmakes the training process faster with an average view of thedata. By carefully choosing the size of the cluster, we cankeep the main characteristics of each cluster without losingthe sampling coverage.
3.4 Multilevel Principal Component Analysis-SupportVector Machine-Based Classification
3.4.1 Dimension reduction with principal componentanalysis
PCA23 is a statistical technique that analyzes a set of datacomposed of possibly inter-correlated variables. The goalis to extract the important information of the original dataand to represent the data as a new set of uncorrelated vari-ables, called principal components. The number of principalcomponents s is less than or equal to the number of the origi-nal variables. In the computer vision field, the combinationof PCA and SVM24,25 has been proven to improve the per-formance of pattern recognition. However, the PCA methodis still new to manufacturing community. Therefore, in thiswork, we introduce the ideas of PCA. We apply PCA in frontof our SVM process, which has the advantages of reducingthe data size and increasing the hotspot classification accu-racy. In other words, through the PCA process, the dimen-sion of each fragment vector can be reduced. For example,the length of FV without PCA is 250, while the maximumlength of FV with PCA is 80.
The PCA problem is defined as follows. Given a datasetx ∈ Rd, transform x into a new dataset y ∈ Rs:
yi;1 ¼ A11xi;1 þ A12xi;2 þ : : : þ A1 sxi;syi;2 ¼ A21xi;1 þ A22xi;2 þ : : : þ A2 sxi;s: : :yi;s ¼ As1xi;1 þ As2xi;2 þ : : : þ Assxi;s
∀ xi ¼ ðxi;1; xi;2; : : : ; xi;dÞT ∈ x; i ¼ 1; : : : ; n
; (2)
such that each yi ∈ y explains as much as possible of thevariance in the original dataset and that elements in y areuncorrelated. The correlation matrix A is a d × d matrix,which defines the new coordinate system. Each i’th columnAi ¼ ðAi1; Ai2; : : : AisÞ is the i-th eigenvector of the datacovariance matrix C.
C ¼ 1
n
Xni¼1
xixTi : (3)
PCA starts from calculating the covariance matrix C andthen solves the eigenvector problem:
Dimension 2
Dimension 1
Fig. 5 K-means clustering with k ¼ 5.
J. Micro/Nanolith. MEMS MOEMS 011003-5 Jan–Mar 2015 • Vol. 14(1)
Yu et al.: Accurate lithography hotspot detection based on principal component analysis-support vector machine classifier. . .
CAi ¼ λiAi; i ¼ 1; : : : ; n; (4)
to obtain eigenvalues λ and their corresponding eigenvectors.The eigenvector with the largest eigenvalue captures themost variation among the training vectors x, while the eigen-vector with the smallest eigenvalue has the least variation.
Geometrically, PCA enables us to calculate a projectionof the data to a subspace formed by eigenvectors correspond-ing to the most dominant eigenvalues. By sorting the eigen-values in descending order, we can choose the first sprincipal components to represent the original data. Thisallows us to reduce our high-dimensional FV into a muchshorter and more unique vector.
3.4.2 Support vector machine with polynomial kernel
SVM is a machine learning method for classification andlearning tasks. In SVM, data vectors are mapped into ahigher dimensional space using a kernel function, and anoptimal linear discrimination function in the space or an opti-mal hyperplane that fits the training data is built. The objec-tive is to maximize the margin between the separating hyperplane and the nearest data vectors from both classes. Weadopt a two-class C-type SVM.26,27 Given training vectorsxi ∈ Rd, i ¼ 1; : : : ; n and an indicator vector z ∈ f1;−1g,the classical problem formulation is noted as follows.
min ∶ 12αTQα − eTα
s:t: zTα ¼ 0
Qij ¼ zizjKðxi; xjÞ i; j ¼ 1; : : : ; n0 ≤ αi ≤ C; i ¼ 1; : : : ; n
; (5)
where e is the vector of all ones, Q is an n × n positive semi-definite matrix, and the parameter C controls the trade-offbetween allowing training errors and forcing rigid separatingmargins. For each element Qij ∈ Q, Qij ¼ zizjKðxi; xjÞ.The kernel function K maps the data into a differentspace so a hyperplane can be used to do the separation.We use a polynomial kernel function in our implementation,which achieves the best results in our experiments. Theobjective function is a classical form for a C-type SVM,where α is variable and matrix Q and vector e are constants.
After solving the optimization problem in Eq. (5), all αi ∈α can be calculated. Then, given a new testing vector t, the
decision function is sgnhP
iziαiKðxi; tÞi, where the sgn
function is defined as follows:
sgnðxÞ ¼�−1; if x ≤ 0
1; if x > 0:
In other words, for the testing vector t, if“P
iziαiKðxi; tÞ > 0” it is not a hotspot. Otherwise, the vec-tor t is detected as hotspot.
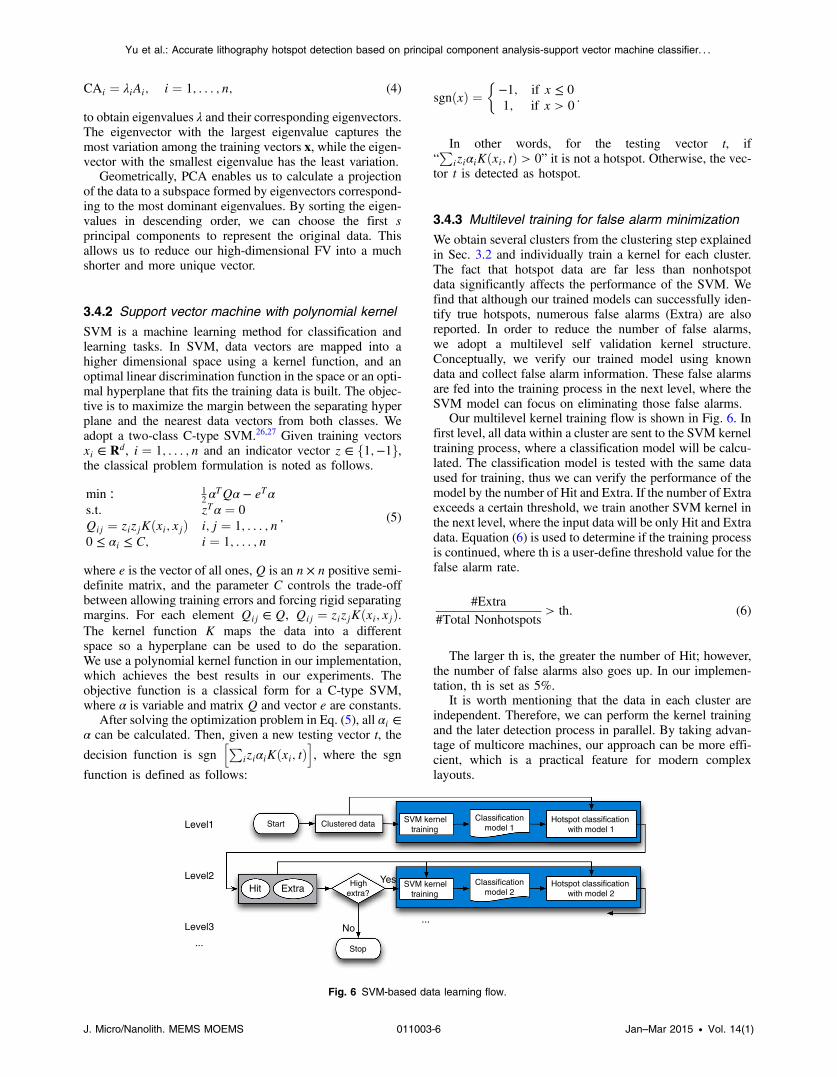
3.4.3 Multilevel training for false alarm minimization
We obtain several clusters from the clustering step explainedin Sec. 3.2 and individually train a kernel for each cluster.The fact that hotspot data are far less than nonhotspotdata significantly affects the performance of the SVM. Wefind that although our trained models can successfully iden-tify true hotspots, numerous false alarms (Extra) are alsoreported. In order to reduce the number of false alarms,we adopt a multilevel self validation kernel structure.Conceptually, we verify our trained model using knowndata and collect false alarm information. These false alarmsare fed into the training process in the next level, where theSVM model can focus on eliminating those false alarms.
Our multilevel kernel training flow is shown in Fig. 6. Infirst level, all data within a cluster are sent to the SVM kerneltraining process, where a classification model will be calcu-lated. The classification model is tested with the same dataused for training, thus we can verify the performance of themodel by the number of Hit and Extra. If the number of Extraexceeds a certain threshold, we train another SVM kernel inthe next level, where the input data will be only Hit and Extradata. Equation (6) is used to determine if the training processis continued, where th is a user-define threshold value for thefalse alarm rate.
#Extra
#Total Nonhotspots> th: (6)
The larger th is, the greater the number of Hit; however,the number of false alarms also goes up. In our implemen-tation, th is set as 5%.
It is worth mentioning that the data in each cluster areindependent. Therefore, we can perform the kernel trainingand the later detection process in parallel. By taking advan-tage of multicore machines, our approach can be more effi-cient, which is a practical feature for modern complexlayouts.
SVM kernel training model 1 with model 1
Clustered data
Hit Extra High extra?
SVM kernel training model 2 with model 2
Start
Stop
...
Level1
Level2
Level3
...
Yes
No
c
c
Fig. 6 SVM-based data learning flow.
J. Micro/Nanolith. MEMS MOEMS 011003-6 Jan–Mar 2015 • Vol. 14(1)
Yu et al.: Accurate lithography hotspot detection based on principal component analysis-support vector machine classifier. . .
4 Full Layout Hotspot DetectionOnce the hotspot classification models are obtained in thetraining process, we can use these models to identifyunknown hotspots on a given testing layout.
4.1 Layout Scanning
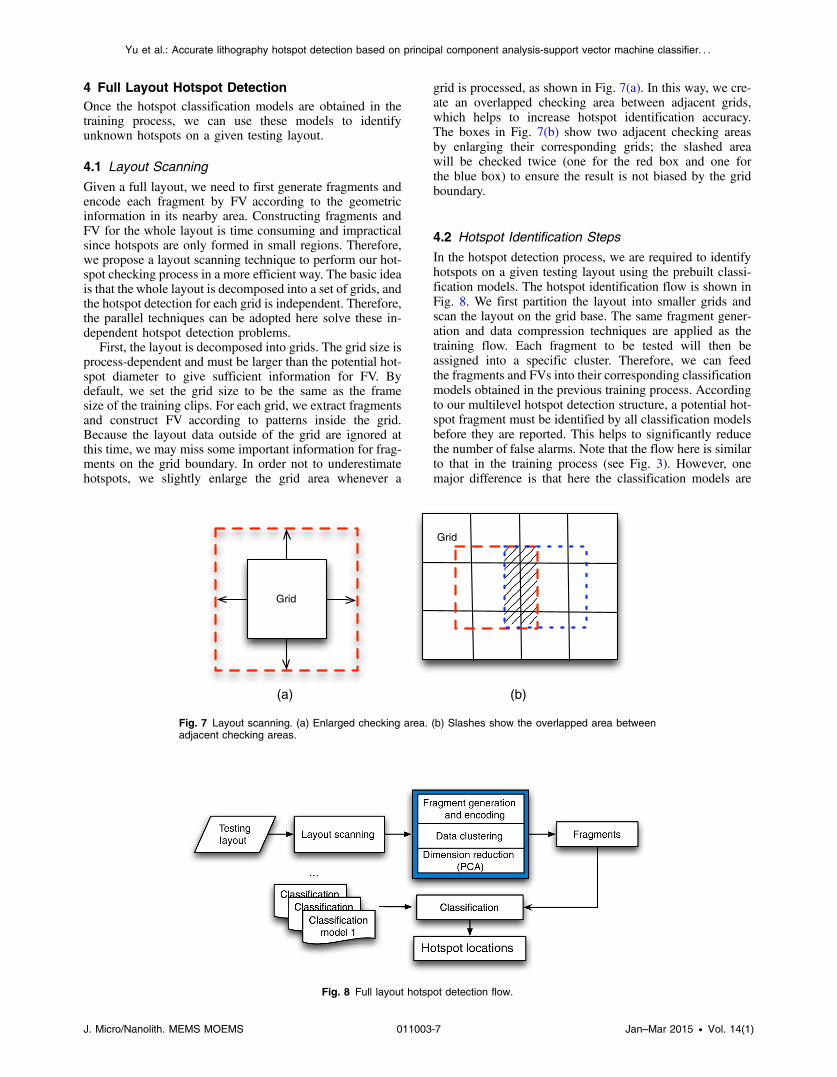
Given a full layout, we need to first generate fragments andencode each fragment by FV according to the geometricinformation in its nearby area. Constructing fragments andFV for the whole layout is time consuming and impracticalsince hotspots are only formed in small regions. Therefore,we propose a layout scanning technique to perform our hot-spot checking process in a more efficient way. The basic ideais that the whole layout is decomposed into a set of grids, andthe hotspot detection for each grid is independent. Therefore,the parallel techniques can be adopted here solve these in-dependent hotspot detection problems.
First, the layout is decomposed into grids. The grid size isprocess-dependent and must be larger than the potential hot-spot diameter to give sufficient information for FV. Bydefault, we set the grid size to be the same as the framesize of the training clips. For each grid, we extract fragmentsand construct FV according to patterns inside the grid.Because the layout data outside of the grid are ignored atthis time, we may miss some important information for frag-ments on the grid boundary. In order not to underestimatehotspots, we slightly enlarge the grid area whenever a
grid is processed, as shown in Fig. 7(a). In this way, we cre-ate an overlapped checking area between adjacent grids,which helps to increase hotspot identification accuracy.The boxes in Fig. 7(b) show two adjacent checking areasby enlarging their corresponding grids; the slashed areawill be checked twice (one for the red box and one forthe blue box) to ensure the result is not biased by the gridboundary.
4.2 Hotspot Identification Steps
In the hotspot detection process, we are required to identifyhotspots on a given testing layout using the prebuilt classi-fication models. The hotspot identification flow is shown inFig. 8. We first partition the layout into smaller grids andscan the layout on the grid base. The same fragment gener-ation and data compression techniques are applied as thetraining flow. Each fragment to be tested will then beassigned into a specific cluster. Therefore, we can feedthe fragments and FVs into their corresponding classificationmodels obtained in the previous training process. Accordingto our multilevel hotspot detection structure, a potential hot-spot fragment must be identified by all classification modelsbefore they are reported. This helps to significantly reducethe number of false alarms. Note that the flow here is similarto that in the training process (see Fig. 3). However, onemajor difference is that here the classification models are
Grid
Grid
(a) (b)
Fig. 7 Layout scanning. (a) Enlarged checking area. (b) Slashes show the overlapped area betweenadjacent checking areas.
Fig. 8 Full layout hotspot detection flow.
J. Micro/Nanolith. MEMS MOEMS 011003-7 Jan–Mar 2015 • Vol. 14(1)
Yu et al.: Accurate lithography hotspot detection based on principal component analysis-support vector machine classifier. . .
input, while in the training process the classification modelsare calculated as output.
5 Experimental ResultsThe proposed algorithms are implemented in C++ and testedon the machine with eight 3.0 GHz CPUs and 32 GBmemory. The OpenMP28 library is used for our parallelimplementation. We apply the same setting of parametersin our approach for all benchmarks. The number of localclusters is set as 10; the maximum number of sampled non-hotspot centers within a cluster is 500; and the number ofprincipal components for FV is 80.
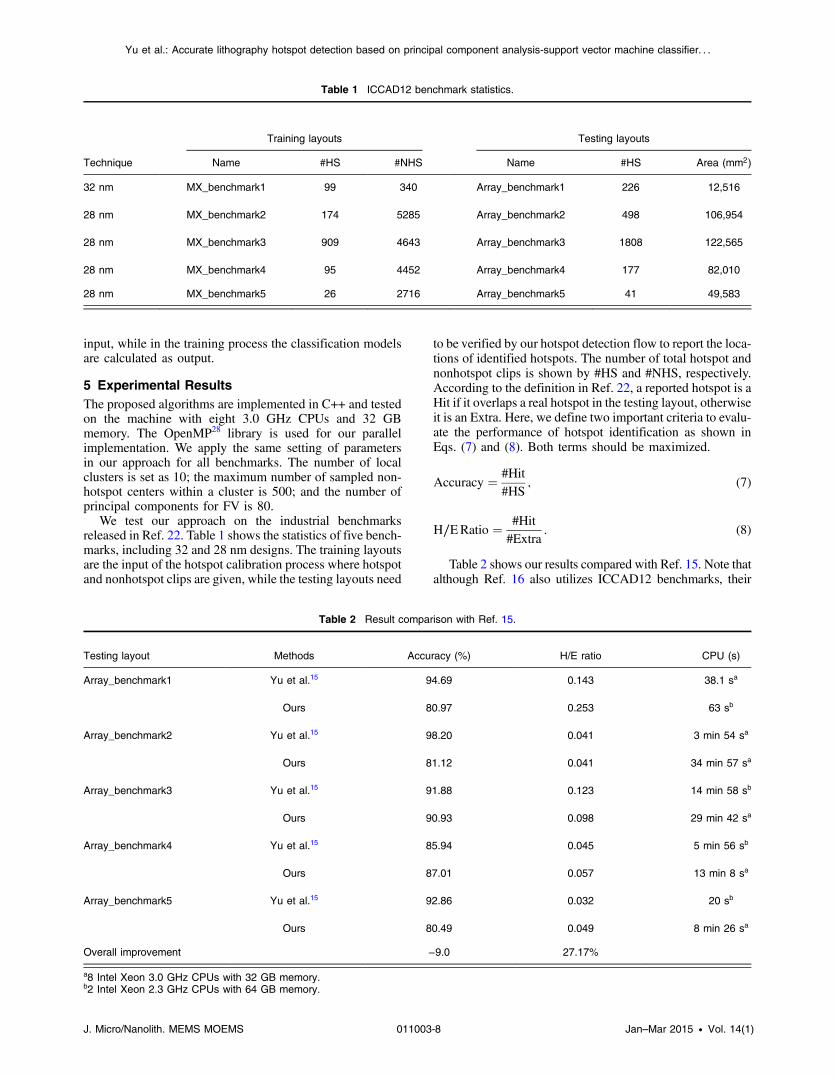
We test our approach on the industrial benchmarksreleased in Ref. 22. Table 1 shows the statistics of five bench-marks, including 32 and 28 nm designs. The training layoutsare the input of the hotspot calibration process where hotspotand nonhotspot clips are given, while the testing layouts need
to be verified by our hotspot detection flow to report the loca-tions of identified hotspots. The number of total hotspot andnonhotspot clips is shown by #HS and #NHS, respectively.According to the definition in Ref. 22, a reported hotspot is aHit if it overlaps a real hotspot in the testing layout, otherwiseit is an Extra. Here, we define two important criteria to evalu-ate the performance of hotspot identification as shown inEqs. (7) and (8). Both terms should be maximized.
Accuracy ¼ #Hit
#HS; (7)
H∕ERatio ¼ #Hit
#Extra: (8)
Table 2 shows our results compared with Ref. 15. Note thatalthough Ref. 16 also utilizes ICCAD12 benchmarks, their
Table 1 ICCAD12 benchmark statistics.
Technique
Training layouts Testing layouts
Name #HS #NHS Name #HS Area (mm2)
32 nm MX_benchmark1 99 340 Array_benchmark1 226 12,516
28 nm MX_benchmark2 174 5285 Array_benchmark2 498 106,954
28 nm MX_benchmark3 909 4643 Array_benchmark3 1808 122,565
28 nm MX_benchmark4 95 4452 Array_benchmark4 177 82,010
28 nm MX_benchmark5 26 2716 Array_benchmark5 41 49,583
Table 2 Result comparison with Ref. 15.
Testing layout Methods Accuracy (%) H/E ratio CPU (s)
Array_benchmark1 Yu et al.15 94.69 0.143 38.1 sa
Ours 80.97 0.253 63 sb
Array_benchmark2 Yu et al.15 98.20 0.041 3 min 54 sa
Ours 81.12 0.041 34 min 57 sa
Array_benchmark3 Yu et al.15 91.88 0.123 14 min 58 sb
Ours 90.93 0.098 29 min 42 sa
Array_benchmark4 Yu et al.15 85.94 0.045 5 min 56 sb
Ours 87.01 0.057 13 min 8 sa
Array_benchmark5 Yu et al.15 92.86 0.032 20 sb
Ours 80.49 0.049 8 min 26 sa
Overall improvement −9.0 27.17%
a8 Intel Xeon 3.0 GHz CPUs with 32 GB memory.b2 Intel Xeon 2.3 GHz CPUs with 64 GB memory.
J. Micro/Nanolith. MEMS MOEMS 011003-8 Jan–Mar 2015 • Vol. 14(1)
Yu et al.: Accurate lithography hotspot detection based on principal component analysis-support vector machine classifier. . .
approach does not process a full layout but only layout clips.Because of this fundamental difference, we cannot provide afair comparison with Ref. 16. H/E ratio includes the informa-tion of both Hit and Extra. Since the hotspot detection problemrequires both Hit maximization and Extra minimization, H/Eratio can more generally represent the overall performance.Hotspot detection should simultaneously optimize both theaccuracy and H/E ratio. H/E ratio is an important metric,because each false alarm may require additional effort to man-ually modify the layout. From Table 2, we can see that ourapproach (Ours) steadily identifies more than 80% of the hot-spots on all benchmarks and maintains a good H/E ratio at thesame time. On average, our approach improves the H/E ratioby 27.17% compared with Ref. 15. The CPU time in Table 2 isthe overall runtime including training and detection processes.We can see that our runtime is longer than Ref. 15. The reasonfor the longer runtime is twofold: (1) our training and detec-tion processes are multilevel approaches. Compared with aconventional single level approach, a longer runtime isexpected. (2) The potential hotspots are encoded into FVs.Therefore, for one region there may be many FVs, whichincreases the complexity of the training process. We believeapplying another encoding method without fragments caneffectively reduce the runtime.
Table 3 shows the training time and detection time of ourapproach. It can be seen that the runtime spent on predictionis relatively low. In a real application, the training processrequires a one-time effort to build the classificationmodel. Then the obtained models can be repeatedly usedfor layouts with the same process parameters. It is worth-while to obtain an accurate model with an affordable runtimeeffort considering that the model determines the detectionperformance and is built only once.
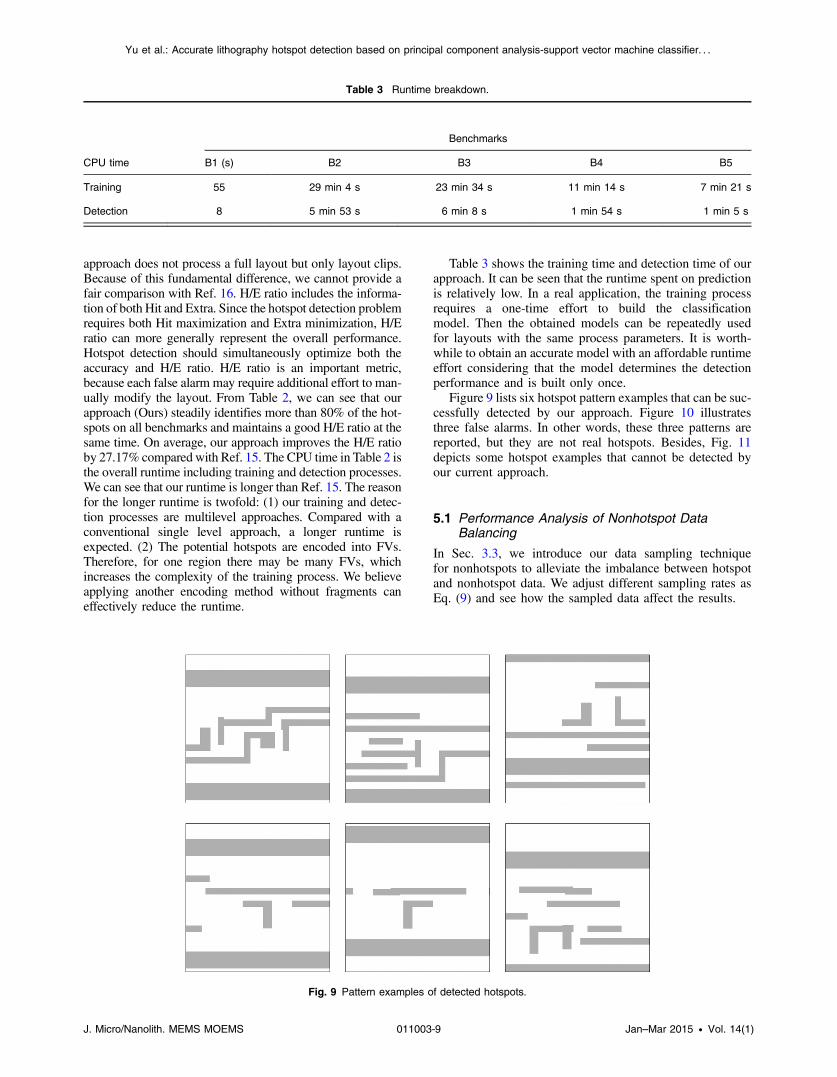
Figure 9 lists six hotspot pattern examples that can be suc-cessfully detected by our approach. Figure 10 illustratesthree false alarms. In other words, these three patterns arereported, but they are not real hotspots. Besides, Fig. 11depicts some hotspot examples that cannot be detected byour current approach.
5.1 Performance Analysis of Nonhotspot DataBalancing
In Sec. 3.3, we introduce our data sampling techniquefor nonhotspots to alleviate the imbalance between hotspotand nonhotspot data. We adjust different sampling rates asEq. (9) and see how the sampled data affect the results.
Table 3 Runtime breakdown.
CPU time
Benchmarks
B1 (s) B2 B3 B4 B5
Training 55 29 min 4 s 23 min 34 s 11 min 14 s 7 min 21 s
Detection 8 5 min 53 s 6 min 8 s 1 min 54 s 1 min 5 s
Fig. 9 Pattern examples of detected hotspots.
J. Micro/Nanolith. MEMS MOEMS 011003-9 Jan–Mar 2015 • Vol. 14(1)
Yu et al.: Accurate lithography hotspot detection based on principal component analysis-support vector machine classifier. . .

Sampling Rate¼ #Sample dfragments for the training process
#Total fragments:
(9)
Figure 12 shows the results of Array_benchmark5 withdifferent sampling rates, where the x-axis is the samplingrate and the y-axis represents the values of the accuracyand the H/E ratio. One can observe that when the samplingrate gets higher, the results have a trend of lower accuracyand higher H/E ratio. The reason for such trend is twofold:(1) the sampling technique is working for nonhotspots, whilehotspot patterns are all kept for the training process. As thesampling rate increases, more nonhotspot patterns areinvolved into our classification models. Therefore, more test-ing patterns tend to be treated as nonhotspots. (2) Our
Fig. 10 Pattern examples of false alarms.
Fig. 11 Pattern examples of nondetected hotspots.
Fig. 12 Results comparison with different sampling rates forArray_benchmark5.
Table 4 Comparison of results with PCA and without PCA applied.
Benchmark
Without PCA With PCA
Accuracy (%) H/E ratio CPU (s) Accuracy (%) H/E ratio CPU (s)
B1 80.09 0.217 69 80.97 0.253 63
B2 81.73 0.041 2005 81.12 0.041 2097
B3 85.90 0.074 1934 85.40 0.092 1782
B4 87.57 0.023 814 87.01 0.057 788
B5 82.93 0.036 496 80.49 0.049 506
Average 1 1 1 0.99 1.45 0.97
J. Micro/Nanolith. MEMS MOEMS 011003-10 Jan–Mar 2015 • Vol. 14(1)
Yu et al.: Accurate lithography hotspot detection based on principal component analysis-support vector machine classifier. . .

training process needs to ensure detection accuracy withmultilevel SVM kernels. When the number of data is large,our training process would generate stricter detection modelsto prevent false alarms. In other words, too high a samplingrate may cause an “overfitting” problem. The trend ofincreasing H/E ratio and decreasing accuracy reflects theeffect of the stricter models. The sampling rate needs tobe properly chosen to maintain a good trade-off betweenthe accuracy and the H/E ratio. In our implementation, weset 80% accuracy as our main optimization objective, thena higher H/E ratio is considered. As a result, the 1.56% sam-pling rate in Fig. 12 is selected as our final parameter.
5.2 Performance Analysis of Principal ComponentAnalysis-Based Support Vector Machine
In order to understand the impact on SVM results by apply-ing PCA, we implement two versions of our approach, oneusing the presented PCA-SVM (with PCA), and the otherusing a typical SVM (without PCA). The length of FV with-out PCA is 250, while the maximum length of FV with PCAis 80.
Table 4 shows the comparison of the five benchmarks interms of accuracy, H/E ratio, and CPU Time. We can see thatthe difference in the accuracy is low, showing that reducingthe vector dimension does not lose critical information. Onthe other hand, the H/E ratio is significantly improved inmost cases, showing that eliminating less-relevant informa-tion using PCA helps to reduce false alarms. The resultsshow the effectiveness of PCA-SVM on reducing the falsealarms and the runtime, while maintaining the accuracy atthe same time.
6 ConclusionsLithography hotspots have a great impact on manufacturingyield. Identifying these forbidden pattern topologies in thephysical verification or early physical design stage hasbecome a critical problem. In this paper, we present a highperformance hotspot detection approach based on PCA-SVM classifier. Several techniques, including hierarchicaldata clustering, data balancing, and multilevel training, areprovided to enhance the performance of the proposedapproach. Pattern matching techniques enable high accuracyand data learning algorithms and provide high flexibility toadapt to new lithography processes and rules. Our data clus-tering and data compression techniques help to improve theaccuracy and to reduce the false alarms. The experimentalresults show that our approach effectively maximizes accu-racy and minimizes false alarms at the same time, wheremore than 80% of the hotspots on all given testing layoutscan be successfully identified.
AcknowledgmentsThe authors would like to thank Dr. Tetsuaki Matsunawa atToshiba (currently a visiting scholar at UTAustin) for helpfuldiscussion. This work is supported in part by NSF, SRC,NSFC, and Toshiba.
References
1. J.-R. Gao, B. Yu, and D. Z. Pan, “Accurate lithography hotspot detectionbased on PCA-SVM classifier with hierarchical data clustering,” Proc.SPIE 9053, 90530E (2014).
2. D. Z. Pan, B. Yu, and J.-R. Gao, “Design for manufacturing with emerg-ing nanolithography,” IEEE Trans. Comput.-Aided Design Integr.Circuits Syst. 32(10), 1453–1472 (2013).
3. P. Yu, S. X. Shi, and D. Z. Pan, “Process variation aware OPC withvariational lithography modeling,” in Proc. IEEE/ACM DesignAutomation Conference, pp. 785–790, ACM, San Francisco, CA(2006).
4. J.-R. Gao et al., “MOSAIC: mask optimizing solution with process win-dow aware inverse correction,” in Proc. IEEE/ACM Design AutomationConference, pp. 1–6, ACM, San Francisco, CA (2014).
5. J. Kim and M. Fan, “Hotspot detection on post-OPC layout using fullchip simulation based verification tool: a case study with aerial imagesimulation,” Proc. SPIE 5256, 919–926 (2003).
6. E. Roseboom et al., “Automated full-chip hotspot detection and removalflow for interconnect layers of cell-based designs,” Proc. SPIE 6521,65210C (2007).
7. A. B. Kahng, C.-H. Park, and X. Xu, “Fast dual graph based hotspotdetection,” Proc. SPIE 6349, 63490H (2006).
8. H. Yao et al., “Efficient process-hotspot detection using range patternmatching,” in Proc. IEEE/ACM Int. Conf. on Computer-Aided Design(ICCAD), pp. 625–632, ACM, San Jose, CA (2006).
9. J. Xu, S. Sinha, and C. C. Chiang, “Accurate detection for process-hot-spots with vias and incomplete specification,” in Proc. IEEE/ACM Int.Conf. on Computer-Aided Design (ICCAD), pp. 839–846, ACM, SanJose, CA (2007).
10. Y.-T. Yu et al., “Accurate process-hotspot detection using critical designrule extraction,” in Proc. IEEE/ACM Design Automation Conference(DAC), pp. 1167–1172, ACM, San Francisco, CA (2012).
11. D. G. Drmanac, F. Liu, and L.-C. Wang, “Predicting variability innanoscale lithography processes,” in Proc. IEEE/ACM DesignAutomation Conference (DAC), pp. 545–550, ACM, San Francisco,CA (2009).
12. D. Ding et al., “Machine learning based lithographic hotspot detectionwith critical-feature extraction and classification,” in Proc. IEEE Int.Conf. on IC Design and Technology (ICICDT), pp. 219–222, IEEE,Austin, TX (2009).
13. J.-Y. Wuu et al., “Rapid layout pattern classification,” in Proc. IEEE/ACM Asia and South Pacific Design Automation Conference(ASPDAC), pp. 781–786, ACM, Yokohama, Japan (2011).
14. D. Ding et al., “EPIC: efficient prediction of IC manufacturing hotspotswith a unified meta-classification formulation,” in Proc. IEEE/ACMAsia and South Pacific Design Automation Conference (ASPDAC),pp. 263–270, IEEE, Sydney, NSW (2012).
15. Y.-T. Yu et al., “Machine-learning-based hotspot detection using topo-logical classification and critical feature extraction,” in Proc. IEEE/ACM Design Automation Conference (DAC), pp. 671–676, ACM,Austin, TX (2013).
16. S.-Y. Lin et al., “A novel fuzzy matching model for lithography hotspotdetection,” in Proc. IEEE/ACM Design Automation Conference (DAC),pp. 681–686, ACM, Austin, TX (2013).
17. H. Nosato et al., “Hotspot prevention and detection method using animage-recognition technique based on higher-order local autocorrela-tion,” J. Micro/Nanolithogr. MEMS MOEMS 13(1), 011007 (2014).
18. D. Ding et al., “High performance lithographic hotspot detection usinghierarchically refined machine learning,” in Proc. IEEE/ACM Asia andSouth Pacific Design Automation Conference (ASPDAC), pp. 775–780,ACM, Yokohama, Japan (2011).
19. M. Hanan, “On steiner’s problem with rectilinear distance,” SIAM J.Appl. Math. 14(2), 255–265 (1966).
20. M. Graphics, “Calibre verification user’s manual,” http://www.mentor.com (2008).
21. T. Kanungo et al., “An efficient k-means clustering algorithm: analysisand implementation,” IEEE Trans. Pattern Anal. Mach. 24(7), 881–892(2002).
22. J. A. Torres, “ICCAD-2012 CAD contest in fuzzy pattern matching forphysical verification and benchmark suite,” in Proc. IEEE/ACM Int.Conf. on Computer-Aided Design (ICCAD) (2012).
23. I. T. Jollife, Principal Component Analysis, Wiley Online Library,Hoboken, New Jersey (2005).
24. O. Dniz, M. Castrilln, and M. Hernndez, “Face recognition using inde-pendent component analysis and support vector machines,” PatternRecognit. Lett. 24(13), 2153–2157 (2003).
25. E. Gumus et al., “Evaluation of face recognition techniques using,PCA, wavelets and SVM,” J. Expert Syst. Appl. 37(9), 6404–6408(2010).
26. B. E. Boser, I. M. Guyon, and V. N. Vapnik, “A training algorithm foroptimal margin classifiers,” in Conf. on Learning Theory, pp. 144–152,ACM (1992).
27. C. Cortes and V. Vapnik, “Support-vector networks,” J. Mach. Learn.20(3), 273–297 (1995).
28. R. Chandra, “Parallel programming in OpenMP,” Morgan Kaufmann,http://www.openmp.org/ (2001).
Bei Yu is a postdoctoral scholar in the Department of Electrical andComputer Engineering, University of Texas at Austin, where he
J. Micro/Nanolith. MEMS MOEMS 011003-11 Jan–Mar 2015 • Vol. 14(1)
Yu et al.: Accurate lithography hotspot detection based on principal component analysis-support vector machine classifier. . .

received his PhD degree in 2014. His research interests includedesign for manufacturability and optimization algorithms with applica-tions in CAD. He received an SPIE education scholarship in 2013,IBM PhD scholarship in 2012, Best Paper Awards at ICCAD’13and ASPDAC’12, and three other Best Paper Award nominations.
Jhih-Rong Gao is on the senior technical staff at Cadence DesignSystems, Inc., Austin. She received her PhD degree from theDepartment of Electrical and Computer Engineering, University ofTexas at Austin in 2014. Her current research interests include physi-cal design and design for manufacturability. She was a research anddevelopment engineer with Synopsys, Inc., Taiwan, from 2007 to2009. She was awarded the BACUS Photomask Scholarship fromSPIE in 2013.
Duo Ding is a senior hardware engineer at Oracle Microelectronics,Austin, Texas. He received PhD degree from the Department ofElectrical and Computer Engineering, University of Texas atAustin, in 2011. He has received the 2013 ACM SIGDA Best PhD
Dissertation Award in Electronic Design Automation, and two BestPaper Awards in ICICDT 2009 and ASPDAC 2012.
Xuan Zeng is a professor in the Microelectronics Department, andserves as the director of State Key Laboratory of ASIC and Systems,Fudan University. She received the First-Class Award of ElectronicInformation Science and Technology from the Chinese Institute ofElectronics in 2005, the Second-Class Award of Science and Tech-nology Advancement and the Cross-Century Outstanding ScholarAward in 2006 and 2002, respectively. She received the award of“IT Top 10” in Shanghai in 2003.
David Z. Pan is a professor in the Department of Electrical and Com-puter Engineering, University of Texas at Austin. His research interestsinclude nanometer IC design for manufacturability/reliability, new fron-tiers of physical design, and CAD for emerging technologies. He haspublished over 200 technical papers, and is the holder of 8 US patents.He has received many awards, including SRC Technical ExcellenceAward, 11 Best Paper Awards, among others. He is an IEEE fellow.
J. Micro/Nanolith. MEMS MOEMS 011003-12 Jan–Mar 2015 • Vol. 14(1)
Yu et al.: Accurate lithography hotspot detection based on principal component analysis-support vector machine classifier. . .


![2 LASER INTERFERENCE LITHOGRAPHY - uni-halle.de · 2 LASER INTERFERENCE LITHOGRAPHY (LIL) 9 2 LASER INTERFERENCE LITHOGRAPHY (LIL) Laser interference lithography [3~22] (LIL) is a](https://img.pdfslide.us/doc/110x75/5eae180eecc7e273a41a4e88/2-laser-interference-lithography-uni-hallede-2-laser-interference-lithography.jpg)