Embed Size (px)
Citation preview
IEEE TRANSACTIONS ON INTELLIGENT TRANSPORTATION SYSTEMS, VOL. 14, NO. 2, JUNE 2013 673
Accurate Ego-Vehicle Global Localization atIntersections Through Alignmentof Visual Data With Digital Map
Sergiu Nedevschi, Member, IEEE, Voichita Popescu, Radu Danescu, Member, IEEE,Tiberiu Marita, and Florin Oniga
Abstract—This paper proposes a method for achieving im-proved ego-vehicle global localization with respect to an ap-proaching intersection, which is based on the alignment of visuallandmarks perceived by the on-board visual system, with the infor-mation from a proposed extended digital map (EDM). The visualsystem relies on a stereovision system that provides a detailed 3-Ddescription of the environment, including road landmark infor-mation (lateral lane delimiters, painted traffic signs, curbs, andstop lines) and dynamic environment information (other vehicles).An EDM is proposed, which enriches the standard map informa-tion with a detailed description of the intersection required forcurrent lane identification, landmark alignment, and ego-vehicleaccurate global localization. A novel approach for lane-delimiterclassification, which is necessary for the lane identification, isalso presented. An original solution for identifying the currentlane, combining visual and map information with the help of aBayesian network (BN), is proposed. Extensive experiments havebeen performed, and the results are evaluated with a GlobalNavigation Satellite System of high accuracy (2 cm). The achievedglobal localization accuracy is of submeter level, depending on theperformance of the stereovision system.
Index Terms—Alignment, Bayesian network (BN), extendeddigital map (EDM), localization, stereovision, visual landmarks.
I. INTRODUCTION
THE INTERSECTION scenario is the most complex de-manding and dangerous part of all driving situations. De-
pending on the region and country, 30%–60% of all accidentsinvolving injuries and up to one-third of the fatalities occurat intersections. For this reason, the INTERSAFE-2 projectaimed to develop and demonstrate new systems, algorithms,and technologies able to significantly reduce injuries and fatalaccidents at intersections. The analysis of the user needs forintersection safety assistance systems identified the followingdriving assistance functions: left-turn assistance, intersectioncrossing assistance, right-turn assistance, right of way, andstop-line assistance. A key requirement of such systems is the
Manuscript received April 12, 2012; revised October 25, 2012; acceptedNovember 1, 2012. Date of publication December 20, 2012; date of cur-rent version May 29, 2013. This work was supported in part by theRomanian National Authority for Scientific Research (CNCS–UEFISCDI) un-der Grant PN-II-ID-PCE-2011-3-1086 and in part by the EXCEL Project underContract POSDRU/89/1.5/S/62557. The Associate Editor for this paper wasR. I. Hammoud.
The authors are with the Department of Computer Science, Techni-cal University of Cluj-Napoca, Cluj-Napoca 400020, Romania (e-mail:[email protected]; [email protected]; [email protected]; [email protected]; [email protected]).
Color versions of one or more of the figures in this paper are available onlineat http://ieeexplore.ieee.org.
Digital Object Identifier 10.1109/TITS.2012.2228191
accurate global localization of the ego-vehicle. Global Navi-gation Satellite Systems (GNSS) equipment has the followingcost–accuracy ratio disadvantage. The standard GNSS receiversthat come at accessible costs provide low accuracy, on the orderof meters, whereas the high-precision GNSS equipment thatprovides centimeter-level accuracy has a high associated cost.Therefore, neither one is a viable solution for any driver assis-tance systems dedicated to intersection safety. As a result, soft-ware solutions for submeter localization are being investigated.
In this paper, we will present an original approach forimproving the ego-vehicle’s global localization given by astandard GPS, by using a visual perception system and amore detailed digital map. The proposed method relies ondiscriminative visual landmarks (lane markings, curbs, paintedtraffic signs, and stop lines) and on their corresponding accuratepositions in an extended digital map (EDM). The visual systemused in this approach uses stereovision [1] to sense the envi-ronment in front of the vehicle and has a large horizontal fieldof view. A priori information about the environment is storedin an EDM that contains detailed information about the road’stopology, geometry, and geography, which are necessary for thecorrespondence with the visual data. The localization processitself is a two-step approach. First, the ego-vehicle drivinglane is identified by matching the visual information with themap information, in a probabilistic framework in the form ofa Bayesian network (BN). Next, the accurate coordinates ofthe ego-vehicle are obtained by aligning the correspondinglandmarks from the visual system and from the EDM.
The rest of this paper is structured as follows. Section IIpresents a literature review regarding localization and theincreased use of digital maps for this task. Section III is anintroduction to BNs. Section IV is an overview of the proposedsolution. Section V introduces the proposed EDM. Section VIpresents a novel lane-delimiter classification method.Section VII shows the proposed accurate global localizationmethod. Section VIII is dedicated to the experimental results,and Section IX concludes this paper.
II. LITERATURE REVIEW
The latest approaches to improved global localization ofthe ego-vehicle use the idea of combining information fromvarious input systems, such as GNSS, vehicle sensors, on-boardperception systems, digital maps, infrastructure monitoring sys-tems, and cooperative systems. The GNSS is still the core
1524-9050/$31.00 © 2012 IEEE
674 IEEE TRANSACTIONS ON INTELLIGENT TRANSPORTATION SYSTEMS, VOL. 14, NO. 2, JUNE 2013
technology for global localization, but additional systems arerequired to combat its shortcomings such as positioning errors,loss of signal, etc. In [2], a Kalman filter is used to integratevehicle-sensor information with differential GPS (DGPS) in-formation for localization. In [3], vehicle sensors are integratedwith low-cost GPS in an interacting multiple mode (IMM) filterfor localization. The success of the method results from theproposed IMM filter that adapts the vehicle model to differentdriving conditions. In [4], Chausse et al. propose combiningdata from GPS, vehicle sensors, vision sensors, and a veryprecise digital map (NavTech) in a particle filter, for estimat-ing the localization parameters. The same input data (visuallydetected landmarks, map data, and vehicle odometry) are usedin [5] for localization. A more complex approach is presentedin [6], where a previously built detailed digital map is used forcorrelation with on-the-spot light detection and ranging mea-surements. The map is built using state-of-the-art equipment(inertial navigation system (INS), SICK laser rangefinders, andGPS). In addition, in [7], the visual information is used togetherwith information from a geographic information system forimproving localization. A comprehensive survey about vehiclepositioning and navigation can be found in [8]. A number of vi-sual localization methods based on the correspondence betweenthe real-world objects and their image projections are availablein the literature. In [9], Haralick et al. propose a method fordetermining the camera orientation by making the correspon-dence between 3-D object world coordinates with 2-D objectimage coordinates. The method considers the simultaneouscorrespondence between multiple geometric features (points,lines, and ellipse–circle); the resulting redundancy improvesthe results. In [10], a method through which the 3-D shapeand orientation of objects are recovered from 2-D images ispresented. In [11], Seetharaman and Le tackled the problem ofvideo-assisted global positioning of an airborne camera usingaerial images of known landmarks (known as the perspective-n-point problem). A minimum of three collinear landmarks isrequired. Having the position of the camera and a minimum ofthree known landmarks in at least two image frames, the posi-tion of a ground object can be computed. Hardware solutionsare proposed for both camera and object localization tasks.
The necessity of a detailed digital map has been widelyrecognized, and research has been initiated by map builders(TeleAtlas and NavTeq) and by other projects (DARPA,SAFESPOT, INTERSAFE2) in the direction of providing ad-vanced digital map solutions for driving assistance systems(DASs). Some of the researched solutions are the Route Net-work Definition File (RNDF) [12], the Road Graph [13], andLocal Dynamic Map (LDM) [14].
The idea of lane-level positioning has gained more attentiondue to the possible DAS that could benefit from it, such aslane keeping [15], lane-level navigation [16], lane maneuverrecommendation [17], hazard warning for a given trajectory,and services such as intelligent speed adaptation and laneallocation [18]. Different approaches have been proposed in thisdirection, many of which use high-detail high-accuracy digitalmaps. In [19], Toledo-Moreo et al. present a level positioningmethod that fuses the information from a GNSS/EuropeanGeostationary Navigation Overlay Service, a gyroscope, an
odometer, and a proposed enhanced digital map (Emap). In[15], Wang et al. used a high-precision GNS/INS togetherwith a vision system and an Emap for lane-level localization;the solution is used for a lane-keeping DAS. In [20], Du andBarth propose a lane-level positioning method that uses an off-the-shelf DGPS system and a self-built high-accuracy digitalmap. The lane-level position is obtained through a proposedBayesian probabilistic map-matching algorithm. In [16], anINS is aided by DGPS and vision measurements for localizationin challenging environments. A priori measured map landmarksare used for improving the localization. In [21], a low-cost lanepositioning solution is proposed, which used only GPS andintervehicle communication.
The main contribution of this paper is a visual-based globallocalization method dedicated to intersection scenarios. Theproposed original approach consists of two steps. First, thelane on which the vehicle is driven is identified based onthe visual and map information. Then, when the stop lineis visually detected, it is aligned with the corresponding ac-curately positioned stop line from the digital map. For laneidentification, an original probabilistic method based on a BNis proposed. This choice is motivated by the fact that BNs rep-resent a framework for modeling human-like reasoning underuncertain measurements while providing a solid mathematicalfoundation at the same time. Compared with our previous work[22], the method proposed in this paper for lane identificationbrings the following significant contributions:
• an original network structure that incorporates informationabout both static and dynamic environments (road land-marks and other vehicles, respectively);
• a parameter learning step, which ensures the generalityand applicability of the method for any road segment,with any given number of lanes, provided that the roadinfrastructure is a priori known from the EDM;
• a temporal filtering mechanism of the frame-by-frameresults provided by the BN, based on a particle filter, whichconsiderably improves the inference over time.
Another contribution of this paper is the original methodfor lane-delimiter classification, with the delimiter types beingrelevant cues for lane identification.
Hence, in this paper, an accurate global localization methodis proposed, which is based on a stereovision system and anEDM. Since both technologies have known exponential devel-opments over the last years, the proposed method is feasibleand implementable, from a technological and economical pointof view, in the near future.
III. BAYESIAN NETWORK OVERVIEW
BNs [23], [24] are part of the family of probabilistic graph-ical models, combining principles from mathematical and en-gineering domains, such as probability theory, statistics, andgraph theory. They have an intuitive graphical representationin the form of a directed acyclic graph. Each random variableof the problem domain is represented by a node of the graph,with each node having a set of probable values called states.The nodes are connected with edges, indicating the direction ofinfluence. The parameters of the network are the probabilities
NEDEVSCHI et al.: ACCURATE EGO-VEHICLE GLOBAL LOCALIZATION AT INTERSECTIONS 675
of the nodes: prior probabilities for nodes with no parents,and conditional probability tables for nodes with parents. Theimportance of the graph is that it encodes the conditionalindependence assumption that each variable is independent ofits nondescendents, given its parents in the graph. The BNitself encodes the joint probability distribution (JPD) over thefinite set of variables represented as nodes in the graph. Due tothe conditional independence property provided by the graph,the JPD can be decomposed into a product of conditionalprobability distributions over each variable given its parents inthe graph, i.e.,
P (x1, x2, . . . , xn) =
n∏
i=1
P (xi | parents(xi)) . (1)
The advantage of having the JPD in a factored form is that itmakes it possible to evaluate all inference queries and that thetime of computation is significantly reduced.
The goal of a BN is to infer the states of the unobservable(immeasurable) variables, given the evidence of the observable(measurable) variables; this is achievable in a BN throughthe inference mechanism that propagates the evidence of theobservable nodes in the entire network and updates the beliefsof the other nodes. There are several inference algorithms thatperform well in complex BNs such as the variable eliminationalgorithm, polytree (Pearl’s algorithm restricted to a graphwith no cycles), variation message passing, relevance tree, andothers.
Due to its flexibility and its intuitive graphical representation,while providing a solid probability theory, the applications ofthe BN have grown from artificial intelligence to computervision and autonomous mobile robots [25]–[28], domains thatare dealing with uncertainty. In [28], Choi et al. propose theuse of a BN model in order to fuse the information from avisual system with the information from a database to locatean approaching intersection. This idea is further developed byChoi et al. in [29], where they propose the use of a similar BNmodel for data fusion but, this time, to detect the driving lane.
IV. SOLUTION OVERVIEW
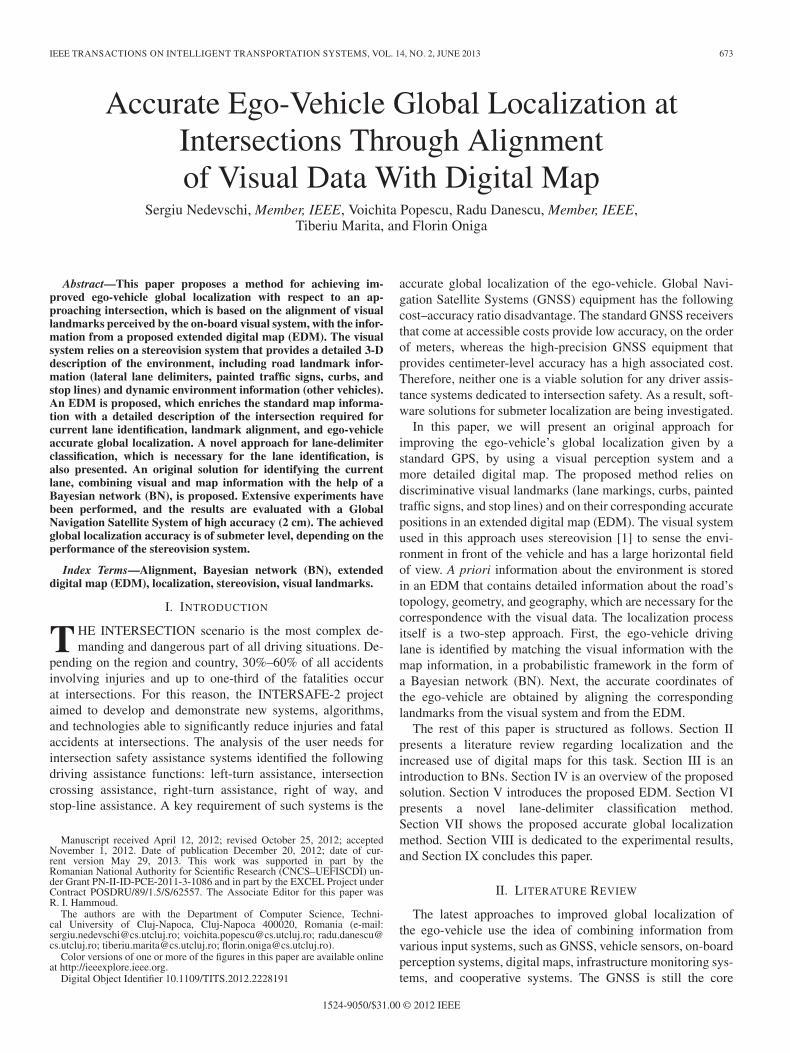
Fig. 1 shows the overview of the proposed approach for anaccurate global localization; the original contributions of thispaper are highlighted with gray hashed boxes. The technologiesemployed in this approach are a stereovision perception system,a standard GPS receiver, and a proposed EDM; they are shownin Fig. 1 with gray rounded boxes. While the stereovisionperception system provides real-time information about thesurrounding environment, the EDM is populated ahead of timeand provides a priori knowledge about the road’s infrastructure.
The stereovision system’s perception functions provide in-formation about static and dynamic environments. The visualinformation used for localization consists of lane information[30], lane-delimiter localization and classification, painted-arrow localization and classification [31], curb localization[32], stop-line localization [33], and information about theother vehicles (relative position and velocity) [34]. Most of thevisual perception functions providing these data are the result of
Fig. 1. Overview of the proposed approach for improved global localization.
previous work of the Image Processing and Pattern RecognitionGroup at the Technical University of Cluj-Napoca. The visualperception function responsible for lane-delimiter classificationrepresents a novelty and a contribution of this paper.
The necessity of high-detail digital maps for accurate lo-calization has been widely recognized and accepted by theintelligent transportation systems community. In this approach,we used our proposed EDM to correlate the visual landmarkswith the landmarks in the map for position estimation. Theproposed EDM was built based on OpenStreetMap, which isaugmented with additional information about the geometry,topology, and geography of the road’s landmarks.
For lane identification and subsequent data alignment, theposition of the ego-vehicle on the map is required. The road seg-ment that the ego-vehicle is located on is determined througha map-matching method, and the intersection toward whichthe ego-vehicle is heading is determined using the vehicle’sorientation. In this way, the a priori information about the roadsegment that the ego-vehicle is currently on is obtained. Sincethese are straightforward approaches, they will not be detailedin this paper.
The goal of this paper is to provide a vision-based lo-calization method for intersection scenarios. The originaltwo-step localization method is also an important contributionof this paper. The steps are as follows.
1) The first step is lane identification, i.e., determiningthe lane on which the ego-vehicle is traveling. This isachieved through a probabilistic approach in the formof a BN, whose frame-by-frame results are time filtered
676 IEEE TRANSACTIONS ON INTELLIGENT TRANSPORTATION SYSTEMS, VOL. 14, NO. 2, JUNE 2013
Fig. 2. Example of study case intersection. Extra features introduced in theproposed digital map are necessary for global localization.
using a particle filter. The structure and the parameters ofthe network are automatically learned based on the mapinformation.
2) The second step is data alignment, i.e., determining theaccurate global position of the ego-vehicle, by aligningthe visual landmarks (stop line bordered by lateral delim-iters) with the corresponding accurately positioned maplandmarks. The detection and 3-D localization of the stopline used for alignment is presented in the earlier work ofthe authors [33].
V. PROPOSED EXTENDED DIGITAL MAP
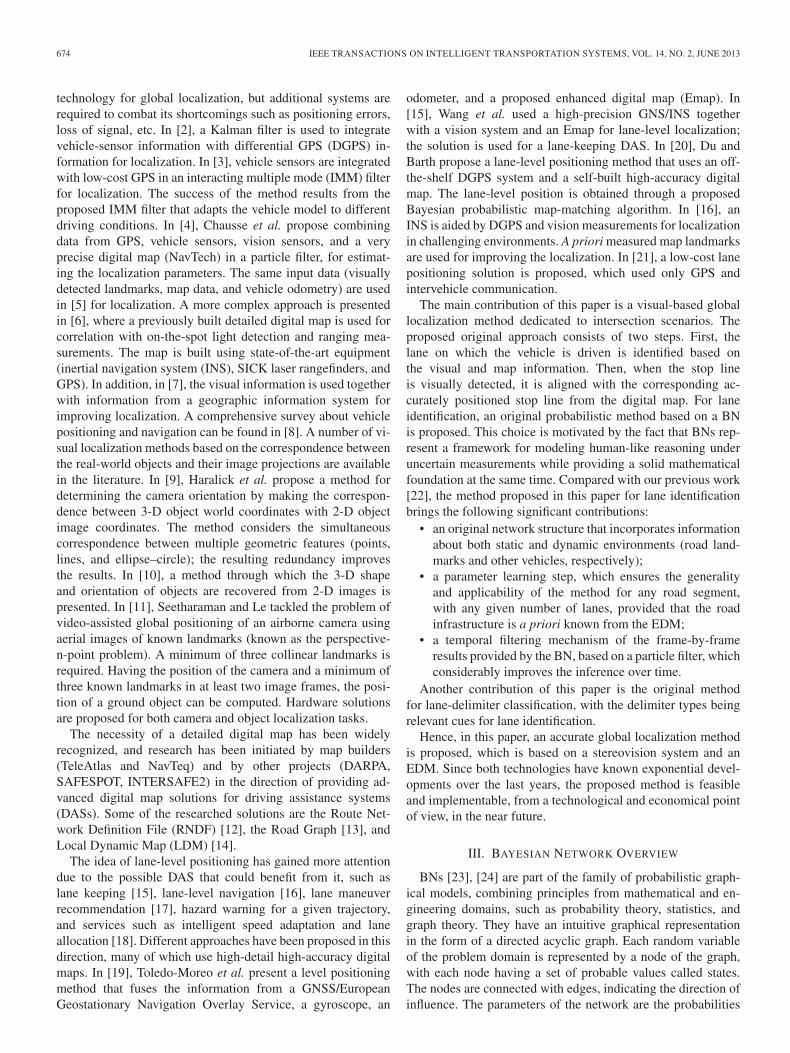
In this approach, we present a viable solution for extendingan existing digital map, with detailed lane-level information,such as the one available in the RDNF format. As a startingpoint, the OpenStreetMap (www.openstreetmap.org) navigationmap is used. This map was chosen because it is a free editablemap of the world that allows viewing, editing, and using thegeographical data. The proposed EDM uses the database struc-ture provided by OpenStreetMap as the basic layer. On top of it,a second layer was constructed that supports all the new extrafeatures that provide lane-level detail information. A utility toolwas built for the management of the EDM data. Hence, we haveextended the road-level detail of the digital map to a lane-leveldetail. Each lane entering the intersection has the followingfeatures: the lane width, the type of lane delimiters, the type ofpainted arrows, and the lane axis (a list of ordered nodes that areplaced at the center of each lane). The lane axis is the centerlineof a lane and has one of the end points on the painted stop lineand the other end point at a distance of 30 m (the green lines inFig. 2); the coordinates of these points are in a world geodeticsystem (latitude longitude height (LLH): WGS84). Fig. 2 showsone of the case study intersections used in this approach, i.e.,a perspective view of the initial map data together with thenew features introduced in the proposed EDM. The EDM isa solution on how to improve a standard digital map used fornavigation with extra features containing information about theroad’s topology, geometry, and geography. The advantage ofthis proposal is that it brings the familiar structure of RNDFto a commercial free digital map application used for vehiclenavigation, i.e., OpenStreetMap.
Fig. 3. Pseudocode for basic feature extraction from the grayscale image.
VI. LANE-DELIMITER CLASSIFICATION
A robust lane boundary classification technique, which relieson the frequency analysis of the intensity profile of the lane lim-its, is presented here. Frequency-based boundary classificationsolutions are presented in [35] and [36]. Our solution is alsorelated to the one presented in [37], with the similarity being theuse of equally spaced scan lines projected in the image space,but the difference is in the processing of the resulted data; thesolution of [37] encodes the presence of markings on neighbor-ing scan lines as codes, i.e., sequence of codes forming regularexpressions that are then analyzed in a parser-like fashion.
A. Feature Extraction
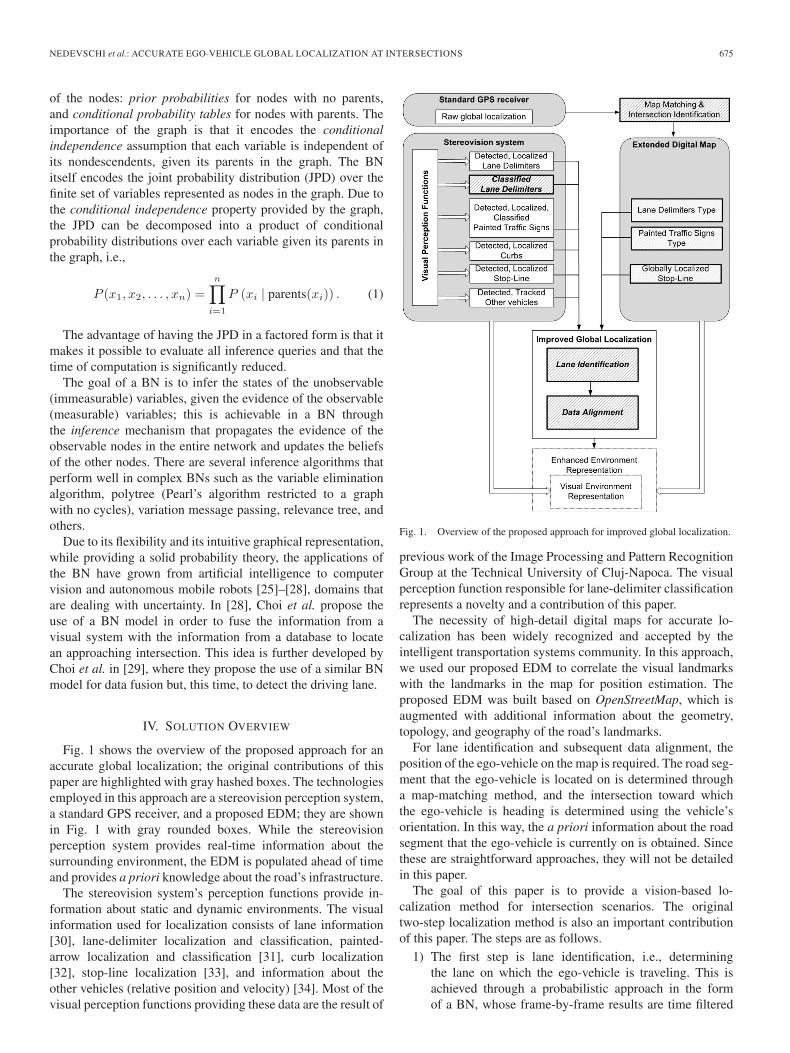
The lane border classification process starts with the extrac-tion of basic features from the gray-level perspective image.The lane geometry is already estimated by a particle-filter-based lane tracker [30].
What we are interested in are the grayscale values along thelane delimiter, and their relationship with the grayscale value ofthe asphalt in the same region. For this reason, we will generate,in the 3D space, a set of equally spaced lines, covering a dis-tance of 20 m (starting from the minimum reliably visible dis-tance). The distance between these lines is 20 cm. Thus, we willcover a length of 20 m of a lane with 100 equally spaced lines.The following pseudocode (see Fig. 3) describes the process.
On each line, we will generate, for each lane boundary (leftand right), two search regions (segments): one that will mostlikely cover the painted markings and the other that will mostlikely cover the asphalt inside the lane. On each segment, wewill select a number of ten equally spaced points, i.e., thepoints for the marking region will be spaced 2 cm apart, andthe points for the asphalt region will be spaced 5 cm apart.These points are then projected in the image space, using theperspective transformations derived from the camera parame-ters. The resulting image space points are shown in Fig. 4, withthe white points for the marking search region, and the blackpoints for the asphalt reference region.
The grayscale values of each point generated in this way areaveraged for each segment of each lane boundary. Thus, for
NEDEVSCHI et al.: ACCURATE EGO-VEHICLE GLOBAL LOCALIZATION AT INTERSECTIONS 677
Fig. 4. (a) Original grayscale image. (b) Search areas for the markings (whitedots) and for the asphalt reference grayscale values (black dots). The positionof the search areas is given by a lane tracking result.
Fig. 5. Processing the search areas. For (a) the left and (b) the right laneboundaries. (Top row) Average intensity on each marking search line. (Middlerow) Average intensity on each asphalt reference search line. (Bottom row)Whether the marking intensity is higher than the reference intensity (plus athreshold) for each line. The arrow shows the driving direction.
each side, we have, for each line (corresponding to a distance),two average values: the average value of the marking area andthe average value of the asphalt reference area. Then, for eachdistance and for each marking, we compare the two averages. Ifthe marking area average is higher than the asphalt area average(by a low fixed threshold), we set a “1” in a binary signal;otherwise, we set a “0.” Fig. 5 describes the process.
The binary signal encoding the relation between the averagegrayscale values of the markings and the asphalt is the primaryfeature of our boundary classification algorithm. This encodingcan be seen as a particular case of local binary pattern, which isa popular encoding used for pattern classification [38].
B. Temporal Integration and Filtering
The binary signal describes the nature of the boundary, as thealternation pattern between the 0’s and the 1’s is characteristicfor the boundary type. However, a signal extracted in a singleframe can be affected by some problems, such as transienterrors (due to small errors in lane model fitting at the distance orcars passing on the lane border) or errors due to a limited field ofview (particularly in the case of interrupted lane markings, the
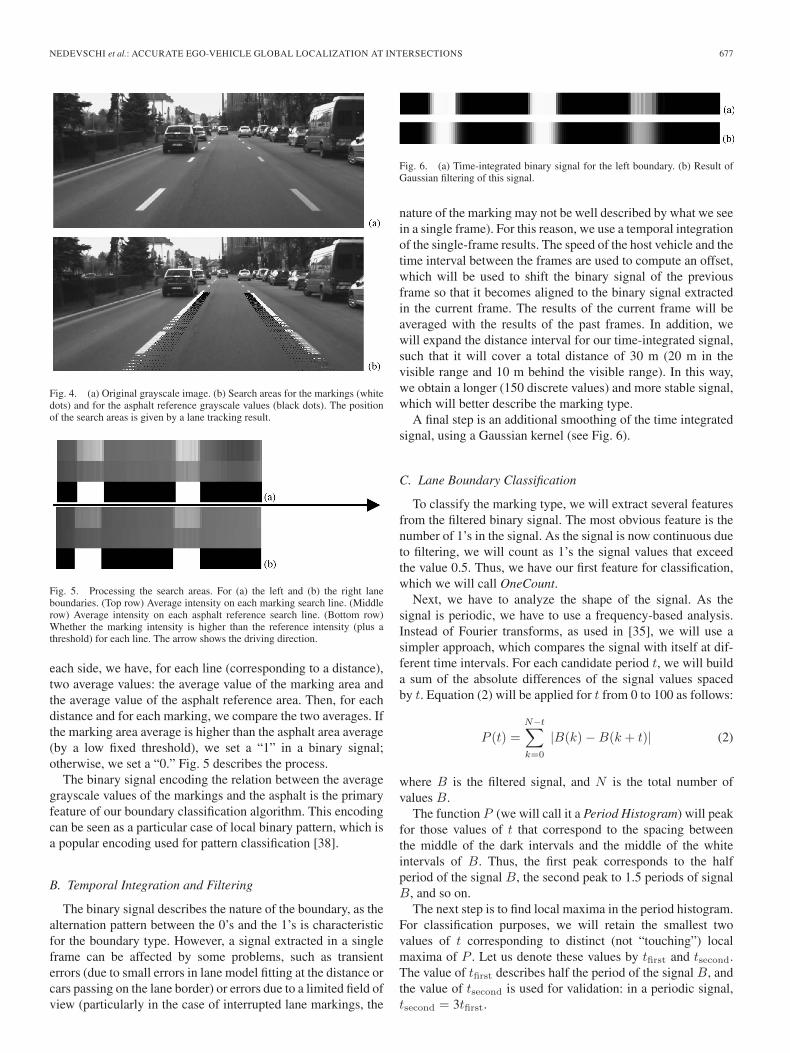
Fig. 6. (a) Time-integrated binary signal for the left boundary. (b) Result ofGaussian filtering of this signal.
nature of the marking may not be well described by what we seein a single frame). For this reason, we use a temporal integrationof the single-frame results. The speed of the host vehicle and thetime interval between the frames are used to compute an offset,which will be used to shift the binary signal of the previousframe so that it becomes aligned to the binary signal extractedin the current frame. The results of the current frame will beaveraged with the results of the past frames. In addition, wewill expand the distance interval for our time-integrated signal,such that it will cover a total distance of 30 m (20 m in thevisible range and 10 m behind the visible range). In this way,we obtain a longer (150 discrete values) and more stable signal,which will better describe the marking type.
A final step is an additional smoothing of the time integratedsignal, using a Gaussian kernel (see Fig. 6).
C. Lane Boundary Classification
To classify the marking type, we will extract several featuresfrom the filtered binary signal. The most obvious feature is thenumber of 1’s in the signal. As the signal is now continuous dueto filtering, we will count as 1’s the signal values that exceedthe value 0.5. Thus, we have our first feature for classification,which we will call OneCount.
Next, we have to analyze the shape of the signal. As thesignal is periodic, we have to use a frequency-based analysis.Instead of Fourier transforms, as used in [35], we will use asimpler approach, which compares the signal with itself at dif-ferent time intervals. For each candidate period t, we will builda sum of the absolute differences of the signal values spacedby t. Equation (2) will be applied for t from 0 to 100 as follows:
P (t) =
N−t∑
k=0
|B(k)−B(k + t)| (2)
where B is the filtered signal, and N is the total number ofvalues B.
The function P (we will call it a Period Histogram) will peakfor those values of t that correspond to the spacing betweenthe middle of the dark intervals and the middle of the whiteintervals of B. Thus, the first peak corresponds to the halfperiod of the signal B, the second peak to 1.5 periods of signalB, and so on.
The next step is to find local maxima in the period histogram.For classification purposes, we will retain the smallest twovalues of t corresponding to distinct (not “touching”) localmaxima of P . Let us denote these values by tfirst and tsecond.The value of tfirst describes half the period of the signal B, andthe value of tsecond is used for validation: in a periodic signal,tsecond = 3tfirst.
678 IEEE TRANSACTIONS ON INTELLIGENT TRANSPORTATION SYSTEMS, VOL. 14, NO. 2, JUNE 2013
Fig. 7. Signal analysis. Left border is interrupted and right border is contin-uous. (a) Original grayscale image. (b) Filtered binary signal B. (c) Periodhistogram P . (d) First and second local maxima of P .
Fig. 8. Signal analysis. Merge boundaries on both sides, inside an intersec-tion. (a) Original grayscale image. (b) Filtered binary signal B. (c) Periodhistogram P . (d) First and second local maxima of P .
Thus, for the classification of the signal B we have threefeatures, which we will summarize here:
• The number of “ones” in the filtered signal, OneCount.• The half-period of the signal, HalfPeriod = tfirst.• The peak position ratio, PeakRatio = tsecond/tfirst.
These simple numerical features are enough to define thenature of the lane boundary: OneCount should be high for acontinuous line boundary, PeakRatio should be 3 for a periodicsignal such as an interrupted line or a merge line (denseinterrupted) line, and the HalfPeriod should have definite valuesfor the interrupted or merge lines. The exact rules for delimiterclassification are extracted using the decision tree learningsystem from Weka [39]. Figs. 7 and 8 show several delimiterexamples and the signal analysis for each of them.
D. Detection of Double Lines
Once the borders are classified based on their longitudinalpattern, we will analyze their lateral shape to detect the doublelines. For this, we will generate search regions again, butthis time, they will be wider so that double markings can becovered by them. We are interested only in the search linesthat correspond to marking lines in the original nonfilteredbinary signal (we expect to have doubles only where markingswere previously located in the narrower search region). Forthese region lines, we classify the pixels as markings versus
Fig. 9. Detection of double lines. (a) Search regions for counting marking/nonmarking transitions. (b) Transitions on a search line.
Fig. 10. Algorithm for accurate ego-vehicle localization.
nonmarkings, based on their intensity. If the intensity of onepixel is closer to that of an already classified marking (seeSection VI-A), it is labeled as marking, and if the intensity iscloser to that of the reference area, it is labeled as nonmarking.The next step is to count the transitions between markingand nonmarking pixel sequences for each line of the searchregions, as shown in Fig. 9. A normal delimiter should havetwo transitions, whereas a double one should have four. Wewill average, for each lane side (left and right), the number oftransitions, and if the transition average is higher than 3, wedeclare the delimiter to be double.
VII. ACCURATE EGO-VEHICLE GLOBAL LOCALIZATION
Fig. 10 shows the basic flow of the proposed method foraccurate global localization. Using the GPS receiver, the globalposition and the heading of the vehicle are obtained. Thisinformation is used to detect on which road segment the ego-vehicle is positioned (map matching) and the intersection thatthe ego-vehicle is approaching.
NEDEVSCHI et al.: ACCURATE EGO-VEHICLE GLOBAL LOCALIZATION AT INTERSECTIONS 679
When the ego-vehicle is considerably close to the intersec-tion (up to 50 m), the necessary information about the roadsegment on which the ego-vehicle is driven on is extracted fromthe EDM. This detailed map information is used together withvisual evidence in the following algorithms: 1) lane identifi-cation, which uses the lateral landmarks; and 2) data align-ment (when the stop line is visually detected), which uses thelongitudinal landmark (stop line) bordered by the lane laterallandmarks. The result is the accurate global localization of theego-vehicle. These two steps are repeated as long as the ego-vehicle is on the same road segment. This condition is evaluatedby map matching either the global position obtained throughdata alignment, if the stop line has been visually detected, or thelatest GPS reading, if otherwise. If the map matching returns thesame road segment, the localization process continues; if not,the GPS reading continues until the ego-vehicle is approachinganother intersection.
A. Lane Identification Through a BN
A key element in the localization process is lane identifica-tion. In this paper, a novel approach is proposed in the form ofa BN for inferring the ego-lane, by combining the informationabout the static environment provided by the visual perceptionsystem with the corresponding information in the proposedEDM. The lateral landmarks are used in identifying the ego-lane. The type of lateral lane delimiters (double, single, inter-rupted, and merge) is determined by the previously presentedvisual perception function. When available, the type of paintedarrows is also used. (The detailed presentation of the visualperception function dedicated to this task can be found in [31]).
A general remark regarding the usefulness of the informationprovided by the other vehicles is the following. In the case inwhich there are more than three lanes per driving direction, thetype of lateral lane delimiters is no longer discriminatory infor-mation, and it becomes difficult to correctly and uniquely iden-tify the lane. In such cases, the relative position and travelingdirection of the detected vehicles can provide useful informa-tion in discriminating between the lanes with equal probability.
Therefore, using each detected vehicle’s relative velocity andrelative lateral position, the following features are extracted:
1) vehicle’s traveling direction, which can be either the sameor the opposite direction with respect to the ego-vehicle(Outgoing or Oncoming, respectively);
2) vehicle’s lateral position, which can be on a left lane ora right lane with respect to the ego-lane (Left or Right,respectively).
Based on these two features, the vehicles detected by thestereovision perception system are classified into the followingthree classes: 1) LeftOutgoing (vehicle that is driving in thesame direction, on a left neighbor lane); 2) RightOutgoing(vehicle that is driving in the same direction, on a right neighborlane); and 3) LeftOncoming (vehicle that is driving in theopposite direction, on a left neighbor lane). Considering theright-side traveling convention, there are no right oncomingvehicles. The vehicles that are driving perpendicular to theego-vehicles’ driving direction are not taken into consideration.These visually detected vehicles provide important information
Fig. 11. BN proposed for the identification.
about the lane on which the vehicle is traveling. For example,a vehicle that is traveling in the same direction as the ego-vehicle, on a left neighboring lane, is an indicator that thevehicle is not on the leftmost lane. Furthermore, dependingon the relative lateral distance between the ego-vehicle andthe detected vehicle, the ego-vehicle must be on one of theremaining lanes. For instance, consider the case in which theego-vehicle is driving on a road segment with four lanes perdriving direction, which are L1, L2, L3, and L4 from left toright. If the stereovision perception system detects a vehicletraveling on a left neighbor lane, in the same direction, at alateral distance that is approximately equal to the lane’s width,then the ego-vehicle cannot be on the leftmost lane L1, and theremaining three lanes (L2, L3, and L4) receive as evidence anequal distributed probability. This is the evidence that the stere-ovision perception system brings to the proposed to the pro-posed network, to the nodes encoding the information relatedto other vehicles.
The BN used for inference is described in the following,which will detail the structure of the network, the parameterlearning process, and the inference mechanism. The disadvan-tage of reasoning using a static BN is that it provides frame-by-frame results, without considering the evolution of the modeledevent in time. To overcome this shortcoming, time filteringof the frame-by-frame results is introduced in the form of aparticle filter, which is also described.
1) BN Structure: The construction is one of the most chal-lenging and time-consuming aspect regarding BNs; it impliesconstructing the directed acyclic graph, i.e., the nodes and theedges (the relationship between the nodes), and estimating theparameters (the a priori probabilities and the conditional proba-bility tables). In this case, the structure of the proposed networkfollows a predefined template, shown in Fig. 11. Depending onthe map information and on the visual information about theother vehicles, some nodes may be or may not be added to thenetwork. For example, if there are no vehicles detected, thenthe nodes encoding this information are not part of the network.The proposed network contains the following nodes.
a) The nodes that encode the information about the staticenvironment (lateral landmarks): LeftDelimiterType (LDT),RightDelimiterType (RDT), and PaintedArrowsType (PAT). Theset of states for these nodes is defined by the type of leftdelimiters, right delimiters, and painted arrows, respectively, ofall the lanes of the road segment on which the vehicle is drivingon. Examples of states for the LDT and RDT are double, single,interrupted, and curb, and the examples of states for PAT, are
680 IEEE TRANSACTIONS ON INTELLIGENT TRANSPORTATION SYSTEMS, VOL. 14, NO. 2, JUNE 2013
forward, left, right, forward-left, and forward-right. This infor-mation is provided by the EDM. These are observable nodes,and the evidence is provided by the stereovision perceptionsystem.
b) The nodes that encode the information about the dy-namic environment (other vehicles): The purpose of such anode is to identify the ego-vehicle driving lane based on theposition and orientation of the corresponding detected vehicles.The set of states for these nodes is L1, L2, . . . , Ln, where n isthe number of lanes per driving direction. The numbering startsfrom the leftmost lane in the driving direction and ends with therightmost one. These are also observable nodes.
c) The final node is the hidden node, i.e., Ego-Lane node:Its states represent the possible lanes L1, L2, . . . , Ln. Thisis an unobservable node, whose belief is computed throughinference. The belief of this node is the answer to the question:“On which lane is the ego-vehicle traveling?”
d) The set of intermediate nodes (Ik, k = 1, . . . , 3): Theyhave the same states as the Ego-Lane node (L1, L2, . . . , Ln)and have been introduced for the following reasons. Theysimplify the process of parameter learning, and they act as“parent divorcing,” reducing the size of the Ego-Lane node’sconditional probability table.
2) BN Parameter Learning: Given the structure of the net-work, its parameters must be learned. The parameters areestimated using the a priori map information about the roadsegment in question as training data. According to BN theory,if the training data set is complete, which is our case, the usualcriterion used for parameter estimation is maximum-likelihoodestimation (MLE). MLE is based on computing the probabil-ities that best match the training data set. Hence, the MLEmethod is based on finding θ∗ that maximizes the likelihood ofP (D|θ), where D is the training data set, and θ is the probabil-ity that the variable in question has a certain value. Accordingto [40], for the case of discrete variables, we have
θ∗=mi∑i mi
=#cases when mi discrete value appears
total # cases. (3)
Translating this to BNs, the prior probability of each state iof leaf node X , i.e., θi = P (X = i), is equal to
θ∗i =mi∑i mi
=#cases when X = i
total # cases. (4)
For child nodes, the conditional probabilities must be esti-mated, i.e., the probability for each state i of the child node, foreach configuration k of its parent’s node states θik = P (X =i|pa(X) = k) must be computed. Using MLE, each parameteris computed using the following:
θ∗ik =mik∑i mik
=#cases (X = i and parent(X) = k)
#cases (parent(X) = k). (5)
Hence, the parameters of the network in Fig. 11 are estimatedusing (4) and (5). For example, for a training data set of the formshown in Table I, the prior probabilities for PAT node will beP (left, forward) = {0.34, 0.66} and the conditional probabilitytable (CPT) of node I2 will be the one shown in Table II.
TABLE IEXAMPLE OF TRAINING
TABLE IICPT FOR I2 NODE
One of the most important advantages of the proposedmethod is the fact that the construction of the network ismade automatically and generically. For each road segment thatthe vehicle is driven on, a corresponding BN is automaticallyconstructed, in accordance with the map information.
3) BN Inference: While the information provided by theEDM is used for parameter estimation, the corresponding visualinformation provides the evidence for the leaf nodes on thisnetwork. In a BN, the reasoning is done through an inferencemechanism, which propagates the evidence of the observablenodes in the entire network and updates the posterior probabil-ities of the other nodes. Thus, the belief of the Ego-Lane nodeis obtained as follows:
P (L1, L2, . . . , Ln) = {w1, w2, . . . , wn}. (6)
There are several inference algorithms that perform well incomplex BNs; the one used in this approach is Pearl’s algorithm[41]. A detailed example of how the BN infers the belief of theEgo-Lane node based on the map a priori data and on the visualevidence is presented in Section VIII.
4) Temporal Filtering of the BN Results: The position of theego-vehicle on the lane is a time-evolving continuous process,and for this reason, tracking can significantly improve the finalresults. Therefore, the Ego-Lane node’s beliefs are tracked overtime using a CONDENSATION type of a particle filter [42].The discrete posterior probability distribution over the lanehypotheses [see (6)] is passed on as measurement to the particlefilter. The varying probability of the vehicle being located oneach of the n lanes is encoded in a population of N = 100particles, with each particle having value li = L1, . . . , Ln (eachparticle is a hypothesis that the vehicle is located on lane li),and weight πi. For each frame, the particle filter executes thefollowing steps.
1) Resampling: From the past population of N weightedparticles, we perform random extraction of a new set ofN particles. The chance of a particle being selected forthe new set is proportional to its weight.
2) Diffusion: The lane value i of each particle is changedrandomly. Most of the values will remain the same, buta small percentage of these values are changed randomlyto neighboring positions so that the tracking system can
NEDEVSCHI et al.: ACCURATE EGO-VEHICLE GLOBAL LOCALIZATION AT INTERSECTIONS 681
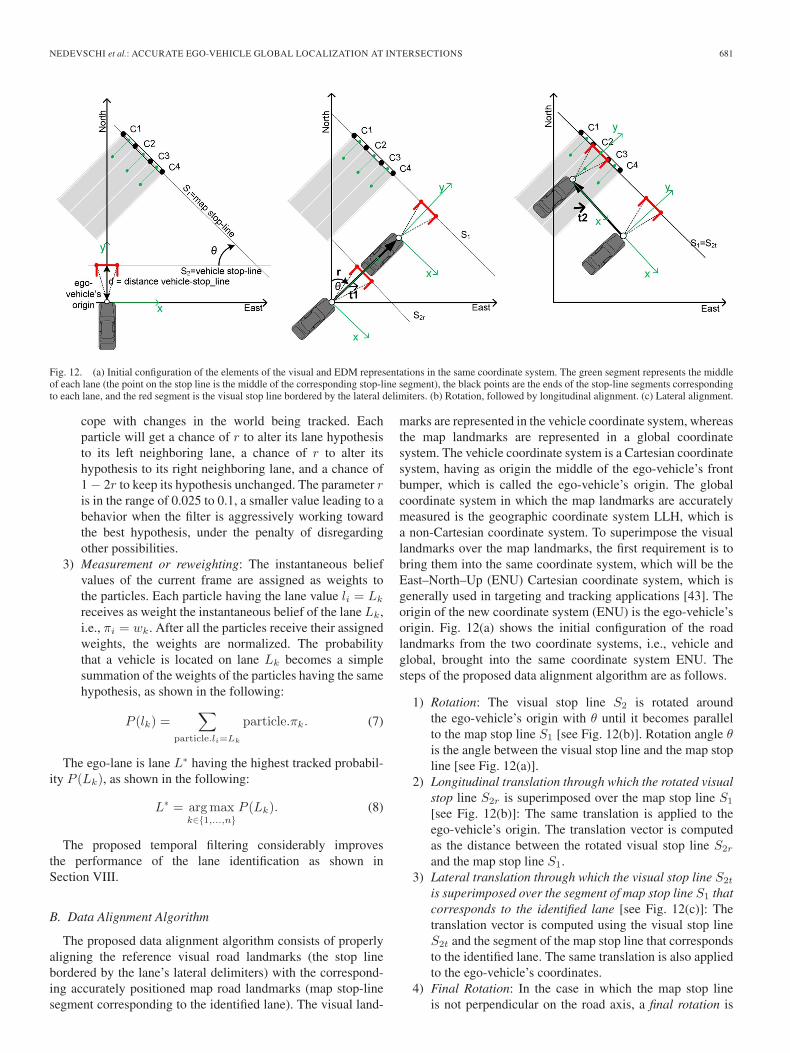
Fig. 12. (a) Initial configuration of the elements of the visual and EDM representations in the same coordinate system. The green segment represents the middleof each lane (the point on the stop line is the middle of the corresponding stop-line segment), the black points are the ends of the stop-line segments correspondingto each lane, and the red segment is the visual stop line bordered by the lateral delimiters. (b) Rotation, followed by longitudinal alignment. (c) Lateral alignment.
cope with changes in the world being tracked. Eachparticle will get a chance of r to alter its lane hypothesisto its left neighboring lane, a chance of r to alter itshypothesis to its right neighboring lane, and a chance of1 − 2r to keep its hypothesis unchanged. The parameter ris in the range of 0.025 to 0.1, a smaller value leading to abehavior when the filter is aggressively working towardthe best hypothesis, under the penalty of disregardingother possibilities.
3) Measurement or reweighting: The instantaneous beliefvalues of the current frame are assigned as weights tothe particles. Each particle having the lane value li = Lk
receives as weight the instantaneous belief of the lane Lk,i.e., πi = wk. After all the particles receive their assignedweights, the weights are normalized. The probabilitythat a vehicle is located on lane Lk becomes a simplesummation of the weights of the particles having the samehypothesis, as shown in the following:
P (lk) =∑
particle.li=Lk
particle.πk. (7)
The ego-lane is lane L∗ having the highest tracked probabil-ity P (Lk), as shown in the following:
L∗ = argmaxk∈{1,...,n}
P (Lk). (8)
The proposed temporal filtering considerably improvesthe performance of the lane identification as shown inSection VIII.
B. Data Alignment Algorithm
The proposed data alignment algorithm consists of properlyaligning the reference visual road landmarks (the stop linebordered by the lane’s lateral delimiters) with the correspond-ing accurately positioned map road landmarks (map stop-linesegment corresponding to the identified lane). The visual land-
marks are represented in the vehicle coordinate system, whereasthe map landmarks are represented in a global coordinatesystem. The vehicle coordinate system is a Cartesian coordinatesystem, having as origin the middle of the ego-vehicle’s frontbumper, which is called the ego-vehicle’s origin. The globalcoordinate system in which the map landmarks are accuratelymeasured is the geographic coordinate system LLH, which isa non-Cartesian coordinate system. To superimpose the visuallandmarks over the map landmarks, the first requirement is tobring them into the same coordinate system, which will be theEast–North–Up (ENU) Cartesian coordinate system, which isgenerally used in targeting and tracking applications [43]. Theorigin of the new coordinate system (ENU) is the ego-vehicle’sorigin. Fig. 12(a) shows the initial configuration of the roadlandmarks from the two coordinate systems, i.e., vehicle andglobal, brought into the same coordinate system ENU. Thesteps of the proposed data alignment algorithm are as follows.
1) Rotation: The visual stop line S2 is rotated aroundthe ego-vehicle’s origin with θ until it becomes parallelto the map stop line S1 [see Fig. 12(b)]. Rotation angle θis the angle between the visual stop line and the map stopline [see Fig. 12(a)].
2) Longitudinal translation through which the rotated visualstop line S2r is superimposed over the map stop line S1
[see Fig. 12(b)]: The same translation is applied to theego-vehicle’s origin. The translation vector is computedas the distance between the rotated visual stop line S2r
and the map stop line S1.3) Lateral translation through which the visual stop line S2t
is superimposed over the segment of map stop line S1 thatcorresponds to the identified lane [see Fig. 12(c)]: Thetranslation vector is computed using the visual stop lineS2t and the segment of the map stop line that correspondsto the identified lane. The same translation is also appliedto the ego-vehicle’s coordinates.
4) Final Rotation: In the case in which the map stop lineis not perpendicular on the road axis, a final rotation is
682 IEEE TRANSACTIONS ON INTELLIGENT TRANSPORTATION SYSTEMS, VOL. 14, NO. 2, JUNE 2013
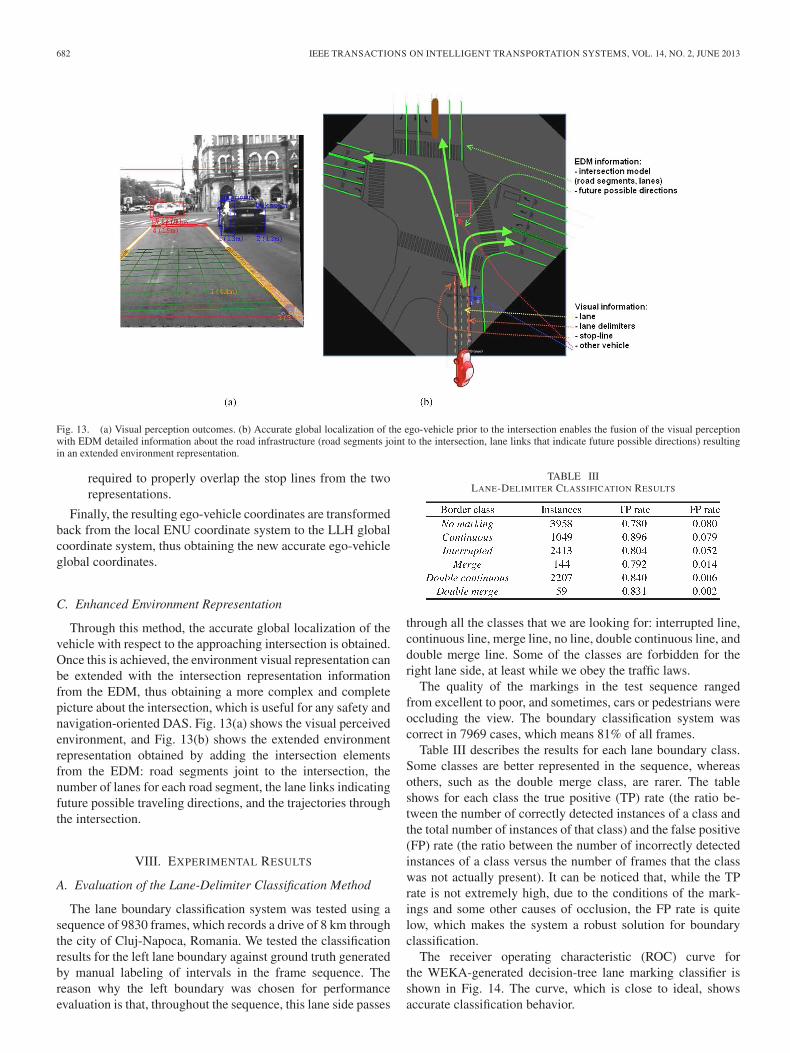
Fig. 13. (a) Visual perception outcomes. (b) Accurate global localization of the ego-vehicle prior to the intersection enables the fusion of the visual perceptionwith EDM detailed information about the road infrastructure (road segments joint to the intersection, lane links that indicate future possible directions) resultingin an extended environment representation.
required to properly overlap the stop lines from the tworepresentations.
Finally, the resulting ego-vehicle coordinates are transformedback from the local ENU coordinate system to the LLH globalcoordinate system, thus obtaining the new accurate ego-vehicleglobal coordinates.
C. Enhanced Environment Representation
Through this method, the accurate global localization of thevehicle with respect to the approaching intersection is obtained.Once this is achieved, the environment visual representation canbe extended with the intersection representation informationfrom the EDM, thus obtaining a more complex and completepicture about the intersection, which is useful for any safety andnavigation-oriented DAS. Fig. 13(a) shows the visual perceivedenvironment, and Fig. 13(b) shows the extended environmentrepresentation obtained by adding the intersection elementsfrom the EDM: road segments joint to the intersection, thenumber of lanes for each road segment, the lane links indicatingfuture possible traveling directions, and the trajectories throughthe intersection.
VIII. EXPERIMENTAL RESULTS
A. Evaluation of the Lane-Delimiter Classification Method
The lane boundary classification system was tested using asequence of 9830 frames, which records a drive of 8 km throughthe city of Cluj-Napoca, Romania. We tested the classificationresults for the left lane boundary against ground truth generatedby manual labeling of intervals in the frame sequence. Thereason why the left boundary was chosen for performanceevaluation is that, throughout the sequence, this lane side passes
TABLE IIILANE-DELIMITER CLASSIFICATION RESULTS
through all the classes that we are looking for: interrupted line,continuous line, merge line, no line, double continuous line, anddouble merge line. Some of the classes are forbidden for theright lane side, at least while we obey the traffic laws.
The quality of the markings in the test sequence rangedfrom excellent to poor, and sometimes, cars or pedestrians wereoccluding the view. The boundary classification system wascorrect in 7969 cases, which means 81% of all frames.
Table III describes the results for each lane boundary class.Some classes are better represented in the sequence, whereasothers, such as the double merge class, are rarer. The tableshows for each class the true positive (TP) rate (the ratio be-tween the number of correctly detected instances of a class andthe total number of instances of that class) and the false positive(FP) rate (the ratio between the number of incorrectly detectedinstances of a class versus the number of frames that the classwas not actually present). It can be noticed that, while the TPrate is not extremely high, due to the conditions of the mark-ings and some other causes of occlusion, the FP rate is quitelow, which makes the system a robust solution for boundaryclassification.
The receiver operating characteristic (ROC) curve forthe WEKA-generated decision-tree lane marking classifier isshown in Fig. 14. The curve, which is close to ideal, showsaccurate classification behavior.
NEDEVSCHI et al.: ACCURATE EGO-VEHICLE GLOBAL LOCALIZATION AT INTERSECTIONS 683
Fig. 14. ROC curve of the decision-tree lane marking classifier. The horizon-tal axis shows the false positive ratio, whereas the vertical axis shows the truepositive ratio.
The data set, containing the images, the 3-D and 2-D coordi-nates of the points in the search regions described in this paper,the manually labeled class of the left delimiter, the timestampsand speed of the vehicle required for temporal filtering of theintensity signal of the markings, and the projection matrixof the camera, is available at http://users.utcluj.ro/~rdanescu/itsdata.rar as a single archive file. In this file, you will find areadme.txt document describing the format of the data and aMatlab script as an example of how these files should be read.
B. Evaluation of the Lane Identification Method
The proposed solution for improving the global localizationwas tested in real urban traffic scenarios under normal trafficconditions in the downtown area of Cluj-Napoca, Romania. Fortesting purposes, more than 30 intersections in Cluj-Napoca,Romania, have been modeled and measured; their detailedinformation have been manually introduced in the proposedEDM. This information is used online as input data by both thelane identification and data alignment modules. The modelingof the intersections was performed using satellite images andhigh-precision measurements using GNSS equipment of highaccuracy (Leica 1200 Series System).
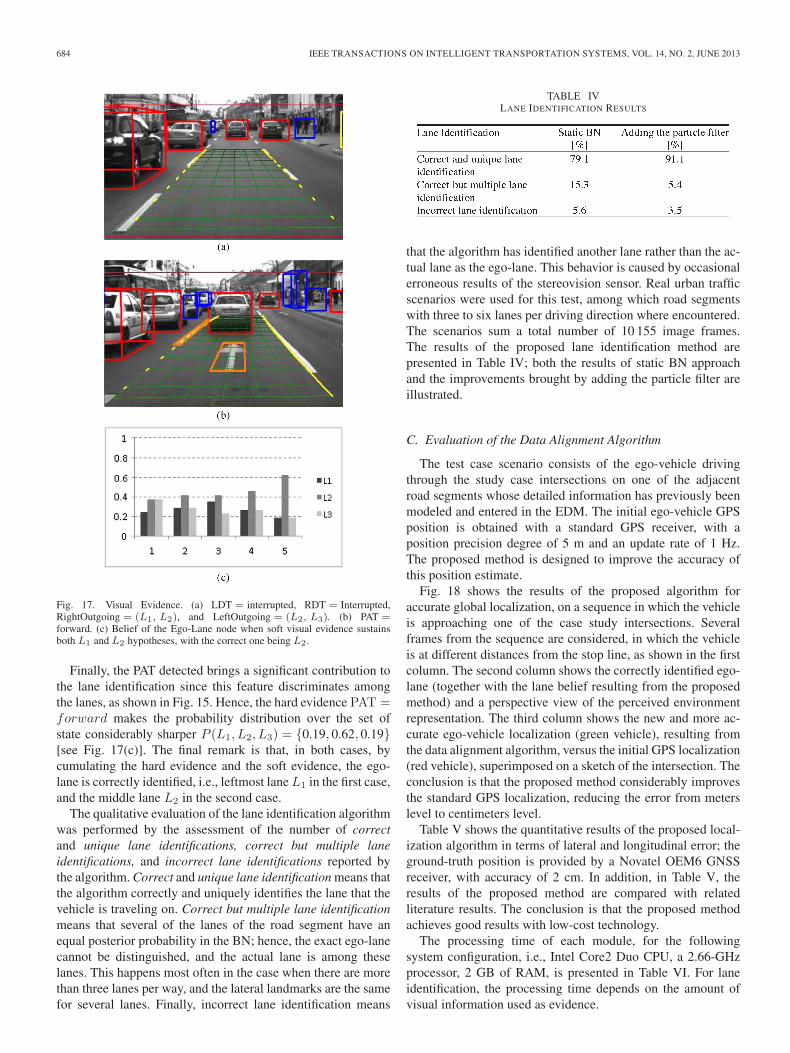
The following example shows how the BN works when dif-ferent pieces of evidence are added to the nodes in the networkthat is presented. Consider the case in which the ego-vehicleis approaching the intersection on a road segment with thelandmarks’ configuration shown in Fig. 15. This represents theconfiguration of one road segment, from one of the consideredcase study intersections. This information about the structure ofthe road is available to the ego-vehicle from the proposed EDMand is used in the automatic BN construction.
The belief of the Ego-Lane node fluctuates according tothe evidence brought by the visual perception system. Twostudy cases are presented in Figs. 16 and 17. We intend tooutline the following two aspects: how the belief of the correctstate increases while the visual evidence is consistent [seeFig. 16(c)], and how the belief is more uniformly distributedamong the states of the Ego-Lane node, when the visual evi-
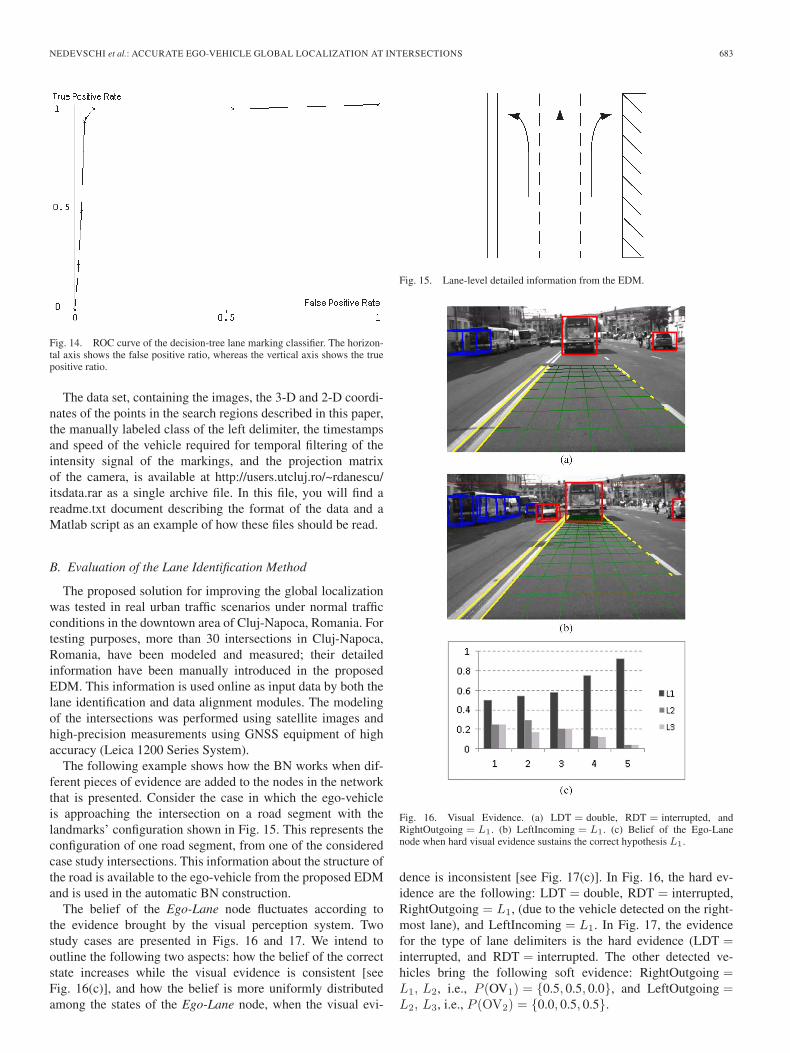
Fig. 15. Lane-level detailed information from the EDM.
Fig. 16. Visual Evidence. (a) LDT = double, RDT = interrupted, andRightOutgoing = L1. (b) LeftIncoming = L1. (c) Belief of the Ego-Lanenode when hard visual evidence sustains the correct hypothesis L1.
dence is inconsistent [see Fig. 17(c)]. In Fig. 16, the hard ev-idence are the following: LDT = double, RDT = interrupted,RightOutgoing = L1, (due to the vehicle detected on the right-most lane), and LeftIncoming = L1. In Fig. 17, the evidencefor the type of lane delimiters is the hard evidence (LDT =interrupted, and RDT = interrupted. The other detected ve-hicles bring the following soft evidence: RightOutgoing =L1, L2, i.e., P (OV1) = {0.5, 0.5, 0.0}, and LeftOutgoing =L2, L3, i.e., P (OV2) = {0.0, 0.5, 0.5}.
684 IEEE TRANSACTIONS ON INTELLIGENT TRANSPORTATION SYSTEMS, VOL. 14, NO. 2, JUNE 2013
Fig. 17. Visual Evidence. (a) LDT = interrupted, RDT = Interrupted,RightOutgoing = (L1, L2), and LeftOutgoing = (L2, L3). (b) PAT =forward. (c) Belief of the Ego-Lane node when soft visual evidence sustainsboth L1 and L2 hypotheses, with the correct one being L2.
Finally, the PAT detected brings a significant contribution tothe lane identification since this feature discriminates amongthe lanes, as shown in Fig. 15. Hence, the hard evidence PAT =forward makes the probability distribution over the set ofstate considerably sharper P (L1, L2, L3) = {0.19, 0.62, 0.19}[see Fig. 17(c)]. The final remark is that, in both cases, bycumulating the hard evidence and the soft evidence, the ego-lane is correctly identified, i.e., leftmost lane L1 in the first case,and the middle lane L2 in the second case.
The qualitative evaluation of the lane identification algorithmwas performed by the assessment of the number of correctand unique lane identifications, correct but multiple laneidentifications, and incorrect lane identifications reported bythe algorithm. Correct and unique lane identification means thatthe algorithm correctly and uniquely identifies the lane that thevehicle is traveling on. Correct but multiple lane identificationmeans that several of the lanes of the road segment have anequal posterior probability in the BN; hence, the exact ego-lanecannot be distinguished, and the actual lane is among theselanes. This happens most often in the case when there are morethan three lanes per way, and the lateral landmarks are the samefor several lanes. Finally, incorrect lane identification means
TABLE IVLANE IDENTIFICATION RESULTS
that the algorithm has identified another lane rather than the ac-tual lane as the ego-lane. This behavior is caused by occasionalerroneous results of the stereovision sensor. Real urban trafficscenarios were used for this test, among which road segmentswith three to six lanes per driving direction where encountered.The scenarios sum a total number of 10 155 image frames.The results of the proposed lane identification method arepresented in Table IV; both the results of static BN approachand the improvements brought by adding the particle filter areillustrated.
C. Evaluation of the Data Alignment Algorithm
The test case scenario consists of the ego-vehicle drivingthrough the study case intersections on one of the adjacentroad segments whose detailed information has previously beenmodeled and entered in the EDM. The initial ego-vehicle GPSposition is obtained with a standard GPS receiver, with aposition precision degree of 5 m and an update rate of 1 Hz.The proposed method is designed to improve the accuracy ofthis position estimate.
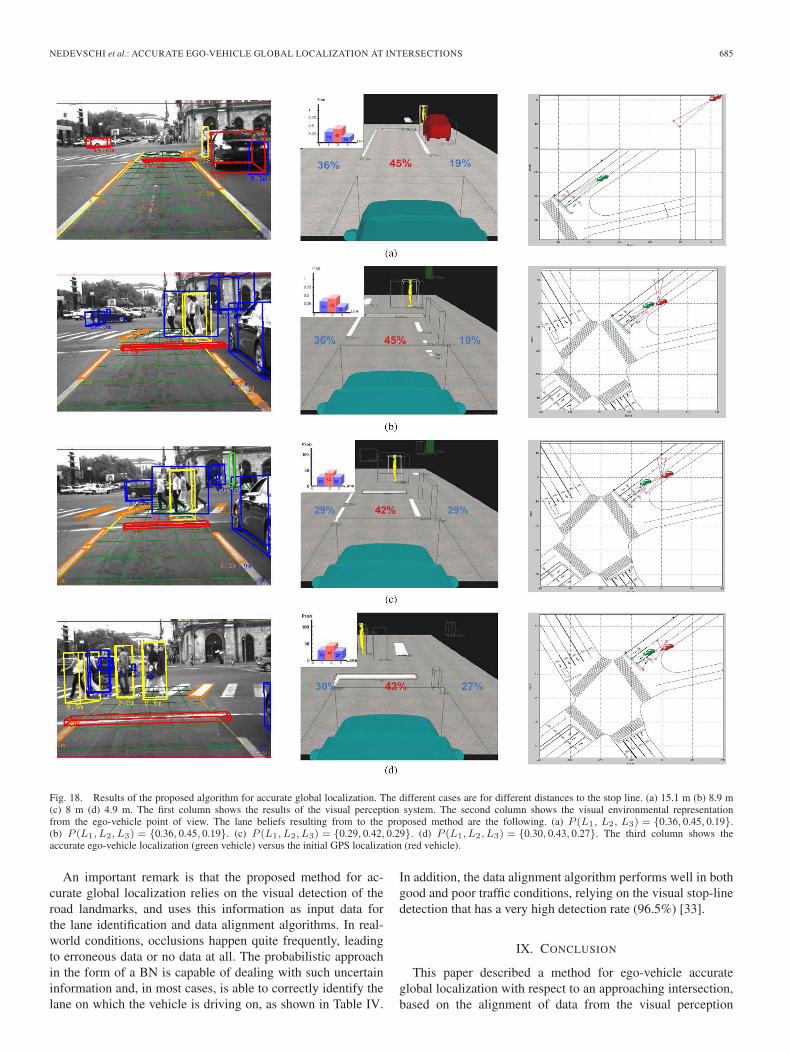
Fig. 18 shows the results of the proposed algorithm foraccurate global localization, on a sequence in which the vehicleis approaching one of the case study intersections. Severalframes from the sequence are considered, in which the vehicleis at different distances from the stop line, as shown in the firstcolumn. The second column shows the correctly identified ego-lane (together with the lane belief resulting from the proposedmethod) and a perspective view of the perceived environmentrepresentation. The third column shows the new and more ac-curate ego-vehicle localization (green vehicle), resulting fromthe data alignment algorithm, versus the initial GPS localization(red vehicle), superimposed on a sketch of the intersection. Theconclusion is that the proposed method considerably improvesthe standard GPS localization, reducing the error from meterslevel to centimeters level.
Table V shows the quantitative results of the proposed local-ization algorithm in terms of lateral and longitudinal error; theground-truth position is provided by a Novatel OEM6 GNSSreceiver, with accuracy of 2 cm. In addition, in Table V, theresults of the proposed method are compared with relatedliterature results. The conclusion is that the proposed methodachieves good results with low-cost technology.
The processing time of each module, for the followingsystem configuration, i.e., Intel Core2 Duo CPU, a 2.66-GHzprocessor, 2 GB of RAM, is presented in Table VI. For laneidentification, the processing time depends on the amount ofvisual information used as evidence.
NEDEVSCHI et al.: ACCURATE EGO-VEHICLE GLOBAL LOCALIZATION AT INTERSECTIONS 685
Fig. 18. Results of the proposed algorithm for accurate global localization. The different cases are for different distances to the stop line. (a) 15.1 m (b) 8.9 m(c) 8 m (d) 4.9 m. The first column shows the results of the visual perception system. The second column shows the visual environmental representationfrom the ego-vehicle point of view. The lane beliefs resulting from to the proposed method are the following. (a) P (L1, L2, L3) = {0.36, 0.45, 0.19}.(b) P (L1, L2, L3) = {0.36, 0.45, 0.19}. (c) P (L1, L2, L3) = {0.29, 0.42, 0.29}. (d) P (L1, L2, L3) = {0.30, 0.43, 0.27}. The third column shows theaccurate ego-vehicle localization (green vehicle) versus the initial GPS localization (red vehicle).
An important remark is that the proposed method for ac-curate global localization relies on the visual detection of theroad landmarks, and uses this information as input data forthe lane identification and data alignment algorithms. In real-world conditions, occlusions happen quite frequently, leadingto erroneous data or no data at all. The probabilistic approachin the form of a BN is capable of dealing with such uncertaininformation and, in most cases, is able to correctly identify thelane on which the vehicle is driving on, as shown in Table IV.
In addition, the data alignment algorithm performs well in bothgood and poor traffic conditions, relying on the visual stop-linedetection that has a very high detection rate (96.5%) [33].
IX. CONCLUSION
This paper described a method for ego-vehicle accurateglobal localization with respect to an approaching intersection,based on the alignment of data from the visual perception

686 IEEE TRANSACTIONS ON INTELLIGENT TRANSPORTATION SYSTEMS, VOL. 14, NO. 2, JUNE 2013
TABLE VDATA ALIGNMENT RESULTS
TABLE VIPROCESSING TIME OF EACH MODULE
system with the information from the proposed EDM. The maincontributions of this paper are related to the following:
• the classification of 3-D lateral delimiters of the lane;• the proposed EDM, which includes the map representation
of the landmarks and supplementary information regard-ing the road geometry and intersection’s configuration;
• the probabilistic method, in the form of a BN, for identi-fying the driving lane using the perceived visual and mapinformation, i.e., the original structure of the network, theautomatic parameter learning based on EDM information,the generic and automatic construction of the BN, the useof the visual information about the other vehicles in thenetwork, and the temporal integration of the frame-by-frame lane identification;
• the algorithm for the alignment of the visual landmarkswith the map landmarks, resulting in the improved globallocalization.
The method was successfully implemented and experi-mented on in several specific intersection scenarios. The pro-posed approach is able to provide increased accuracy in theglobal localization of the ego-vehicle.
The achieved accurate localization allows the fusion of thevisual perceived information with the EDM information, in-creasing the completeness of the intersection representation.
ACKNOWLEDGMENT
The Bayesian Network described in this paper was cre-ated using the GeNIe modeling environment developed by theDecision Systems Laboratory of the University of Pittsburgh(http://dsl.sis.pitt.edu/).
REFERENCES
[1] S. Nedevschi, R. Danescu, T. Marita, F. Oniga, C. Pocol, S. Bota,M.-M. Meinecke, and M. A. Obojski, “Stereovision-based sensor forintersection assistance,” in Proc. Adv. Microsyst. Automot. Appl.––SmartSyst. Safety, Sustainability, 2009, pp. 129–163.
[2] S. Rezaei and R. Sengupta, “Kalman filter-based integration of DGPSand vehicle sensors for localization,” IEEE Trans. Control Syst. Technol.,vol. 15, no. 6, pp. 1080–1088, Nov. 6, 2007.
[3] K. Jo, K. Chu, and M. Sunwoo, “Interacting multiple model filter-basedsensor fusion of GPS with in-vehicle sensors for real-time vehicle posi-tioning,” IEEE Trans. Intell. Transp. Syst., vol. 13, no. 1, pp. 329–343,Mar. 2012.
[4] F. Chausse, J. Laneurit, and R. Chapuis, “Vehicle localization on a digitalmap using particles filtering,” in Proc. IEEE Intell. Veh. Symp., Las Vegas,NV, 2005, pp. 243–248.
[5] N. Mattern, R. Schubert, and G. Wanielik, “High-accurate vehicle local-ization using digital maps and coherency images,” in Proc. IEEE Intell.Veh. Symp., San Diego, CA, 2010, pp. 462–469.
[6] J. Levinson, M. Montemerlo, and S. Thrun, “Map-based precision vehiclelocalization in urban environments,” in Proc. Robot. Sci. Syst. Conf.,Atlanta, GA, 2007.
[7] A. Rae and O. Basir, “Improving vehicle positioning and visual featureestimates through mutual constraint,” in Proc. IEEE Intell. Transp. Syst.Conf., Seattle, WA, 2007, pp. 778–783.
[8] I. Skog and P. Handel, “In-car positioning and navigation technologies:A survey,” IEEE Trans. Intell. Transp. Syst., vol. 10, no. 1, pp. 4–21,Mar. 2009.
[9] R. Haralick, Q. Ji, M. Costa, and L. Shapiro, “A robust linear leastsquares estimation of camera exterior orientation using multiple geomet-ric features,” J. Photogramm. Remote Sens., vol. 55, no. 2, pp. 75–93,Jun. 2000.
[10] W. J. Shomar, G. Seetharaman, and T. Y. Young, “An expert system forrecovering 3D shape and orientation from a single view,” in Proc. Comput.Vis. Image Process., 1992, pp. 459–515.
[11] G. Seetharaman and H. V. Le, “Video-assisted global positioning in terrainnavigation with known landmarks,” Int. J. Distrib. Sensor Netw., vol. 2,no. 2, pp. 103–119, 2006.
[12] Defense Adv. Res. Projects Agency, Arlington, VA, DARPA UrbanChallenge, Route Network Definition File (RNDF) and Mission DataFile (MDF), 2007, Last accesed: October, 2012. [Online]. Available:http://archive.darpa.mil/grandchallenge/docs/RNDF_MDF_Formats_031407.pdf
[13] H. K. Knaup Jorn, “Graph based environmental modelling and functionindependent situation analysis for driver assistance systems,” in Proc.IEEE Intell. Transp. Syst. Conf., 2010, pp. 428–432.
[14] Z. Papp, C. Brown, and C. Bartels, “World modeling for cooperative in-telligent vehicles,” in Proc. IEEE Intell. Veh. Symp., Eindhoven, Holland,2008, pp. 1050–1055.
[15] J. Wang, S. Schroedl, K. Mezger, R. Ortloff, A. Joos, and T. Passegger,“Lane keeping based on location technology,” IEEE Trans. Intell. Transp.Syst., vol. 6, no. 3, pp. 351–356, Sep. 2005.
[16] A. Vu, A. Ramanandan, A. Chen, J. A. Farrell, and M. Barth, “Real-time computer vision/DGPS-aided inertial navigation system for lane-level vehicle navigation,” IEEE Trans. Intell. Transp. Syst., vol. 13, no. 2,pp. 899–913, Jun. 2012.
[17] R. Schubert, K. Schulze, and G. Wanielik, “Situation assessment for auto-matic lane-change maneuvers,” IEEE Trans. Intell. Transp. Syst., vol. 11,no. 3, pp. 607–616, Sep. 2010.
[18] R. Toledo-Moreo, D. Bétaille, F. Peyret, and J. Laneurit, “Fusing GNSS,dead-reckoning, and enhanced maps for road vehicle lane-level naviga-tion,” IEEE J. Sel. Topics Signal Process., vol. 3, no. 5, pp. 798–809,Oct. 2009.
[19] R. Toledo-Moreo, D. Betaille, and F. Peyret, “Lane-level integrity pro-vision for navigation and map matching with GNSS, dead reckoning, andenhanced maps,” IEEE Trans. Intell. Transp. Syst., vol. 11, no. 1, pp. 100–112, Mar. 2010.
[20] J. Du and M. Barth, “Bayesian probabilistic vehicle lane matching forlink-level in-vehicle navigation,” in Proc. IEEE Intell. Veh. Symp., Tokyo,Japan, 2006, pp. 522–527.
[21] T.-S. Dao, K. Y. Leung, C. M. Clark, and J. P. Huissoon, “Markov-basedlane positioning using intervehicle communication,” IEEE Trans. Intell.Transp. Syst., vol. 8, no. 4, pp. 641–650, Dec. 2007.
[22] V. Popescu, M. Bace, and S. Nedevschi, “Lane identification and ego-vehicle accurate global positioning in intersections,” in Proc. IEEE Intell.Veh. Symp., Baden-Baden, Germany, 2011, pp. 870–877.
[23] F. V. Jensen and T. D. Nielsen, Bayesian Networks and Decision Graphs,2nd ed. New York: Springer-Verlag, 2007.
NEDEVSCHI et al.: ACCURATE EGO-VEHICLE GLOBAL LOCALIZATION AT INTERSECTIONS 687
[24] U. B. Kjrulff and A. L. Madsen, Bayesian Networks and Influence Di-agrams: A Guide to Construction and Analysis. New York: Springer-Verlag, 2008.
[25] J. Forbes, T. Huang, K. Kanazawa, and S. Russell, “The BATmobile:Towards a Bayesian automated taxi,” in Proc. Int. Joint Conf. Artif. intell.,Montreal, QC, Canada, 1995, pp. 1878–1885.
[26] E. Besada-Portas, J. A. Lopez-Orozco, and J. M. de la Cruz, “Unifiedfusion system on Bayesian networks for autonomous mobile robots,” inProc. Int. Conf. Inf. Fusion, 2002, pp. 873–880.
[27] C. Cappelle, M. E. El Najjar, D. Pomorski, and F. Charpillet, “Multi-sensors data fusion using dynamic Bayesian network for robotised vehiclegeo-localization,” in Proc. Int. Conf. Inf. Fusion, Cologne, Germany,2008, pp. 1–8.
[28] K. H. Choi, S. Joo, S. I. Cho, and J. H. Park, “Locating intersections forautonomous vehicles: A Bayesian network approach,” ETRI J., vol. 29,no. 2, pp. 249–251, Apr. 2007.
[29] K. H. Choi, S. Y. Park, S. H. Kim, K. S. Lee, J. H. Park, and S. I. Cho,“Methods to detect road features for video-based in-vehicle navigationsystems,” J. Intell. Transp. Syst., vol. 141, no. 1, pp. 13–26, Oct. 20, 2010.
[30] R. Danescu and S. Nedevschi, “Probabilistic lane tracking in difficult roadscenarios using stereovision,” IEEE Trans. Intell. Transp. Syst., vol. 10,no. 2, pp. 272–282, Jun. 2009.
[31] R. Danescu and S. Nedevschi, “Detection and classification of paintedroad objects for intersection assistance applications,” in Proc. IEEE Intell.Transp. Syst. Conf., Funchal, Portugal, 2010, pp. 433–438.
[32] F. Oniga and S. Nedevschi, “Polynomial curb detection based on densestereovision for driving assistance,” in Proc. IEEE Intell. Transp. Syst.Conf., Funchal, Portugal, 2010, pp. 1110–1115.
[33] T. Marita, M. Negru, R. Danescu, and S. Nedevschi, “Stop-line detectionand localization method for intersection scenarios,” in Proc. IEEE Intell.Comput. Commun. Process., Cluj-Napoca, Romania, 2011, pp. 293–298.
[34] S. Bota, S. Nedevschi, and M. Konig, “A framewok for object detection,tracking and classification in urban traffic scenarios using stereovision,”in Proc. IEEE Intell. Comput. Commun. Process., Cluj-Napoca, Romania,2009, pp. 153–156.
[35] J. M. Collado, C. Hilario, A. de la Escalera, and J. M. Armigol, “Detectionand classification of road lanes with a frequency analysis,” in Proc. IEEEIntell. Veh. Symp., Las Vegas, NV, 2005, pp. 78–83.
[36] T. Gavrilovic, J. Ninot, and L. Smadja, “Frequency filtering and connectedcomponents characterization for zebra-crossing and hatched markingsdetection,” in Proc. IAPRS, Saint-Mandé, France, 2010, pp. 43–48.
[37] S. Vacek, C. Schimmel, and R. Dillmann, “Road-marking analysis for au-tonomous vehicle guidance,” in Proc. Eur. Conf. Mobile Robots, Freiburg,Germany, 2007, pp. 1–6.
[38] T. Ojala, M. Pietikainen, and D. Harwood, “A comparative study of tex-ture measures with classification based on feature distributions,” PatternRecognit., vol. 29, no. 1, pp. 51–59, Jan. 1996.
[39] M. Hall, E. Frank, G. Holmes, B. Pfahringer, P. Reutemann, andI. H. Witten, “The WEKA data mining software: An update,” SIGKDDExplor., vol. 11, no. 1, pp. 10–18, Jun. 2009.
[40] N. L. Zhang, “Irrelevance and parameter learning in Bayesian networks,”Artif. Intell., vol. 88, no. 1/2, pp. 359–373, Dec. 1996.
[41] J. Pearl, “Decision making under uncertainty,” ACM Comput. Surveys,vol. 28, no. 1, pp. 89–92, Mar. 1996.
[42] M. Isard and A. Blake, “CONDENSATION––Conditional density propa-gation for visual tracking,” Int. J. Comput. Vis., vol. 29, no. 1, pp. 5–28,Aug. 1998.
[43] S. P. Drake, Converting GPS coordinates to navigation coordinates, De-fence Sci. Technol. Org., Edinburgh, SA, Australia, (2012, Oct. 12).[Online]. Available: http://www.dsto.defence.gov.au/publications/2443/DSTO-TN-0432.pdf
Sergiu Nedevschi (M’99) received the M.S. andPh.D. degrees in electrical engineering from theTechnical University of Cluj-Napoca (TUCN), Cluj-Napoca, Romania, in 1975 and 1993, respectively.
From 1976 to 1983, he was with the Research In-stitute for Computer Technologies, Cluj-Napoca, asa Researcher. In 1998, he was appointed Professor ofcomputer science and founded the Image Processingand Pattern Recognition Group, TUCN. From 2000to 2004, he was a Department Head with the Depart-ment of Computer Science, TUCN. From 2004 to
2012, he was the Dean of the Faculty of Automation and Computer Science,TUCN. He is currently a Vice-Rector with TUCN. He is the author of morethan 200 scientific papers and the Editor of over ten volumes, including booksand conference proceedings. His research interests include image processing,pattern recognition, computer vision, intelligent vehicles, signal processing,and computer architecture.
Voichita Popescu received the Diploma Engineerand the M.S. degrees in computer science from theTechnical University of Cluj-Napoca (TUCN), Cluj-Napoca, Romania, in 2009 and 2011, respectively,where she is currently working toward the Ph.D.degree in computer science.
She is currently with the Image Processing andPattern Recognition Group, TUCN. Her researchinterests include localization, reasoning, anddecision-making under uncertainty, as well assituation assessment with applications in driving
assistance.
Radu Danescu (M’11) received the Diploma En-gineer, the M.S., and the Ph.D. degrees, all incomputer science, from the Technical Universityof Cluj-Napoca (TUCN), Cluj-Napoca, Romania, in2002, 2003, and 2009, respectively.
He is currently a Senior Lecturer with the Depart-ment of Computer Science, TUCN, teaching imageprocessing, pattern recognition, and design with mi-croprocessors. He is also currently a member of theImage Processing and Pattern Recognition Group,TUCN. His main research interests include stereo-
vision and probability-based tracking, with applications in driving assistance.
Tiberiu Marita received the Diploma Engineer-ing and Ph.D. degrees in computer science fromTechnical University of Cluj-Napoca (TUCN), Cluj-Napoca, Romania, in 1995 and 2008.
He is a Cofounder of the Image Processing andPattern Recognition Group, TUCN, where he iscurrently involved in multiple stereovision-relatedresearch projects as a Member or a Team Leader.His main area of expertise is camera calibration foraccurate stereovision-based measurements, and hehas published many scientific papers in this field. His
research interests include software and hardware design, image processing, andcomputer vision.
Florin Oniga received the Diploma Engineer, M.S.,and Ph.D. degrees, all in computer science, fromthe Technical University of Cluj-Napoca, (TUCN),Cluj-Napoca, Romania, in 2002, 2003, and 2011,respectively.
He is a Senior Lecturer with the Department ofComputer Science, TUCN, teaching image process-ing, pattern recognition, and computer architecture.He is also with the Image Processing and PatternRecognition Group, TUCN. His research interests in-clude stereovision, digital elevation map processing,
and vision-based automotive applications.