Embed Size (px)
Citation preview

LUND UNIVERSITY
PO Box 117221 00 Lund+46 46-222 00 00
Accuracy of radiographic and radiostereometric wear measurement of different hipprostheses: an experimental study.
von Schewelov, Thord; Sanzén, Lennart; Börlin, Niclas; Markusson, Patrik; Önsten, Ingemar
Published in:Acta Orthopaedica Scandinavica
DOI:10.1080/00016470410004058
Published: 2004-01-01
Link to publication
Citation for published version (APA):von Schewelov, T., Sanzén, L., Börlin, N., Markusson, P., & Önsten, I. (2004). Accuracy of radiographic andradiostereometric wear measurement of different hip prostheses: an experimental study. Acta OrthopaedicaScandinavica, 75(6), 691-700. DOI: 10.1080/00016470410004058
General rightsCopyright and moral rights for the publications made accessible in the public portal are retained by the authorsand/or other copyright owners and it is a condition of accessing publications that users recognise and abide by thelegal requirements associated with these rights.
• Users may download and print one copy of any publication from the public portal for the purpose of privatestudy or research. • You may not further distribute the material or use it for any profit-making activity or commercial gain • You may freely distribute the URL identifying the publication in the public portal

Take down policyIf you believe that this document breaches copyright please contact us providing details, and we will removeaccess to the work immediately and investigate your claim.
Download date: 13. Jul. 2018

Acta Orthop Scand 2004; 75 (6): 691–700 691
Accuracy of radiographic and radiostereometric wear measurement of different hip prosthesesAn experimental study
Thord von Schewelov1, Lennart Sanzén1, Niclas Börlin2, Patrik Markusson1 and Ingemar Önsten1
Departments of 1Orthopedics, Lund University, Malmö University Hospital, SE-205 02 Malmö, 2Computing Science, Umeå University, SE-901 87 Umeå, SwedenCorrespondence TvS: [email protected] 03-10-31. Accepted 04-03-25
Copyright © Taylor & Francis 2004. ISSN 0001–6470. Printed in Sweden – all rights reserved. DOI 10.1080/00016470410004058
Background In vivo measurement of wear in the ball and socket articulation of total hip arthroplasties is of interest in the evaluation of both existing and new implants. Controversy reigns regarding the accuracy of different radiological measurement techniques and in particular how accuracy has been assessed.
Material and methods We assessed the accuracy of 2 radiostereometric (RSA) techniques for wear measure-ment and 3 standard radiographic techniques, namely Imagika (image analyzing software), Imagika corrected for head center displacement, and the Charnley Duo method. 5 custom-made adjustable phantoms with dif-ferent prosthetic components were used.
Results In 20 measurements of all 5 phantoms at 3 levels of simulated wear (0.2 mm, 1.0 mm and 1.5 mm), the mean measurement error of the digital RSA exami-nations was 0.010 mm (accuracy 0.42). The correspond-ing error values for the three radiographic techniques were 0.19 (accuracy 1.3) for Charnley Duo, 0.13 (accu-racy 1.3) for Imagika corrected, and 1.021 (accuracy 2.99) for Imagika. Measurement error decreased from 0.011 mm with ordinary RSA to 0.004 with RSA digital measurement. Head size, direction of wear in relation to the cup or type of prosthetic component did not influ-ence the measurement error. The results of Charnley Duo and Imagika corrected were similar but the latter had an inexplicable systematic error in measuring one of the phantoms. Imagika had the worst results due to its inability to compensate for the out-of-head center effect. Alumina heads were difficult to analyze with all methods.
Interpretation By using the ISO standard for assess-ing accuracy, RSA can be expected to measure wear with an accuracy of about 0.4 mm irrespective of pros-thetic component studied or direction of wear, whereas the best technique, in our study, based on standard radiographs can be accurate to about 1.3 mm.
■
Rapid polyethylene (PE) wear contributes to oste-olysis and failure of implants (Devane et al. 1997, Oparaugo et al. 2001). Several radiographic meth-ods for measurement of wear have been published (Charnley and Halley 1975, Griffith et al. 1978, Wroblewski 1985, Livermore et al. 1990, Ohlin and Selvik 1993, Bankston et al. 1994, Ilchman et al. 1995, Devane et al. 1997, Martell and Berdia 1997). The accuracy of a measurement method is defined as the closeness in agreement between a test result and the “true” value (International stan-dard ISO 1998). It is the result of the systematic error (bias-agreement between the average value obtained from a large series of test results and the “true reference”) and the random error (closeness of independent measurements). Measurement of accuracy in vivo is thus difficult, but precision can be determined by double examination (testing and retesting).
Radiostereometry (RSA) is considered to be the most accurate method for analysis of micromove-ments of implants (Kärrholm et al. 1997), and

692 Acta Orthop Scand 2004; 75 (6): 691–700
has also been used to measure wear (Franzén and Mjöberg 1990, Önsten 1998). The precision of the method has been determined by double examina-tion. (Kärrholm et al. 1997, Önsten 1998). For RSA, accuracy has been studied by using a phan-tom, and also by double stress examination (Ryd et al. 2000, Bragdon et al. 2002). In this paper, we compare two RSA techniques (3-D) and three stan-dard radiographic techniques (2-D) for measure-ment of wear, and assess the accuracy in a three-dimensional experimental model using a phantom. The first stage of the study was to analyze the sys-tematic error of different methods using a regres-sion model. In the second stage, we compared the accuracy of the five measurement methods. In the third stage, we examined how different materials in the prostheses, the head-size and the direction of wear affect the measurement error of RSA.
Materials and methods
Phantom 1 – metal: An Omnifit PSL (Stryker Howmedica Osteonics) titanium alloy shell, 58 mm in diameter with a 32-mm PE liner, was placed in a custom-made phantom consisting of two alu-minum bars and a plexiglas base plate (Figure 1). Eight 0.8-mm tantalum beads (RSA Biomedical, Umeå, Sweden) had been embedded in the PE liner. The cup was firmly attached to the top of one of the alumina bars with a screw. The line through the cup center and perpendicular to the opening plane of the cup (here called the “center line”) forms a vertical angle of 15° and a horizontal angle of 45° in relation to the long side of the rectangu-lar-shaped base plate, thus simulating a cup fixed in the pelvic bone of a patient (Figure 1). A 28-mm CrCo head (Stryker Howmedica Osteonics) was rigidly attached to a micrometer (Mitutoyo Corp., Japan, model no 153-101) on top of the other bar. According to the manufacturer, the micrometer has a resolution of 0.01 mm and an accuracy of ± 0.003 mm. In the first part of the study, the micrometer head construction was orientated with its longitu-dinal axis directed 5° away from the “center line”, simulating wear in the posterior direction. In the second part, the direction was changed to simu-late wear directed 5 degrees anteriorly (Phantom 5 – anterior direction metal). The angle between the
micrometer head and the baseplate was 20° in the former and 10° in the latter.
The standard radiographic examinations were performed with the phantom placed on a standard X-ray table with the X-ray tube 1 m above the table. The 30 × 40-cm film cassettes were placed 27 cm under the phantom. The uniplanar set-up was used (Selvik 1989) for the RSA part of the study. The phantom was placed on a radiolucent stretcher supplied with two 30 × 40-cm standard radio-graphic cassettes and rasters 27 cm above a cali-bration cage supplied with 0.8-mm tantalum beads (Cage 41, RSA Biomedical, Umeå, Sweden). The two X-ray tubes were positioned 1 m above the phantom, angled 44° in relation to each other and with an interfocal distance of 80 cm.
During the first stage of this study, we per-formed 16 standard radiographic examinations and 16 RSA examinations of Phantom 1 – metal. The first examinations were called “reference exami-nations”. For the examinations that followed, the micrometer was advanced into the cup for 3 mm in steps of 0.2 mm. One exposure was taken at each step. Slight changes in the position of the phantom were done between exposures.
In the second stage we used the same technique, but the femoral head was only advanced into the cup in three steps from the reference examination to 0.2, 1.0 and 1.5 mm, respectively. This procedure was performed 20 times, thus creating 20 indepen-dent measurements (involving Phantom 1 – metal) of the advancement of the head into the cup.
In the third stage of the study, the phantom was rebuilt to explore how different materials affect wear measurement.
Figure 1. Side view of the phantom.
Acta Orthop Scand 2004; 75 (6): 691–700 693
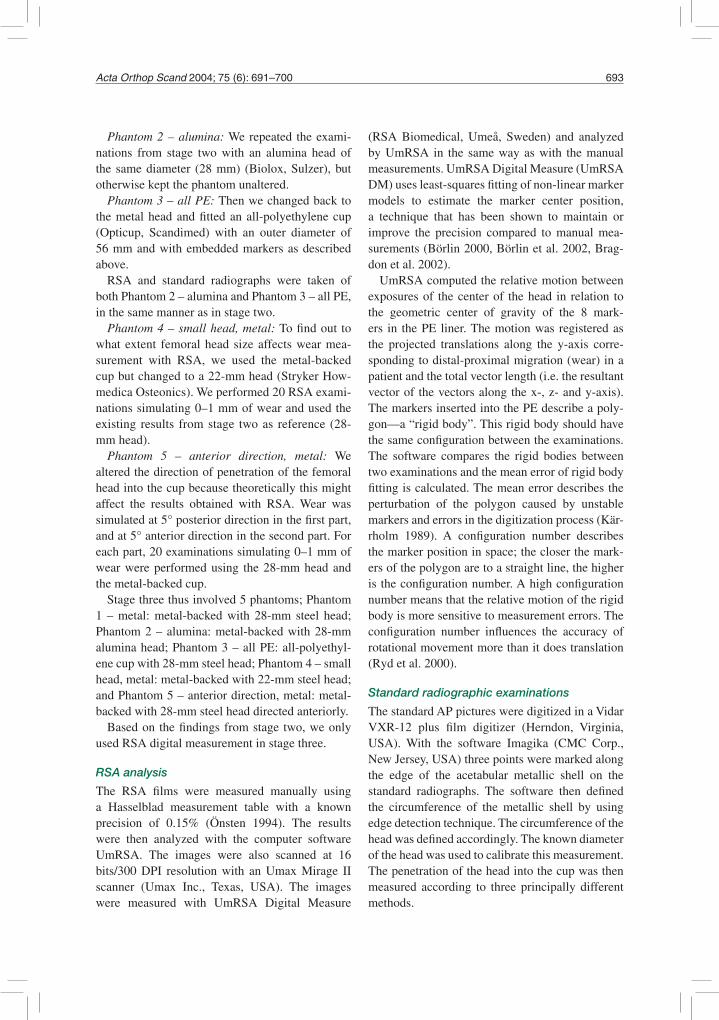
Phantom 2 – alumina: We repeated the exami-nations from stage two with an alumina head of the same diameter (28 mm) (Biolox, Sulzer), but otherwise kept the phantom unaltered.
Phantom 3 – all PE: Then we changed back to the metal head and fitted an all-polyethylene cup (Opticup, Scandimed) with an outer diameter of 56 mm and with embedded markers as described above.
RSA and standard radiographs were taken of both Phantom 2 – alumina and Phantom 3 – all PE, in the same manner as in stage two.
Phantom 4 – small head, metal: To find out to what extent femoral head size affects wear mea-surement with RSA, we used the metal-backed cup but changed to a 22-mm head (Stryker How-medica Osteonics). We performed 20 RSA exami-nations simulating 0–1 mm of wear and used the existing results from stage two as reference (28-mm head).
Phantom 5 – anterior direction, metal: We altered the direction of penetration of the femoral head into the cup because theoretically this might affect the results obtained with RSA. Wear was simulated at 5° posterior direction in the first part, and at 5° anterior direction in the second part. For each part, 20 examinations simulating 0–1 mm of wear were performed using the 28-mm head and the metal-backed cup.
Stage three thus involved 5 phantoms; Phantom 1 – metal: metal-backed with 28-mm steel head; Phantom 2 – alumina: metal-backed with 28-mm alumina head; Phantom 3 – all PE: all-polyethyl-ene cup with 28-mm steel head; Phantom 4 – small head, metal: metal-backed with 22-mm steel head; and Phantom 5 – anterior direction, metal: metal-backed with 28-mm steel head directed anteriorly.
Based on the findings from stage two, we only used RSA digital measurement in stage three.
RSA analysis
The RSA films were measured manually using a Hasselblad measurement table with a known precision of 0.15% (Önsten 1994). The results were then analyzed with the computer software UmRSA. The images were also scanned at 16 bits/300 DPI resolution with an Umax Mirage II scanner (Umax Inc., Texas, USA). The images were measured with UmRSA Digital Measure
(RSA Biomedical, Umeå, Sweden) and analyzed by UmRSA in the same way as with the manual measurements. UmRSA Digital Measure (UmRSA DM) uses least-squares fitting of non-linear marker models to estimate the marker center position, a technique that has been shown to maintain or improve the precision compared to manual mea-surements (Börlin 2000, Börlin et al. 2002, Brag-don et al. 2002).
UmRSA computed the relative motion between exposures of the center of the head in relation to the geometric center of gravity of the 8 mark-ers in the PE liner. The motion was registered as the projected translations along the y-axis corre-sponding to distal-proximal migration (wear) in a patient and the total vector length (i.e. the resultant vector of the vectors along the x-, z- and y-axis). The markers inserted into the PE describe a poly-gon—a “rigid body”. This rigid body should have the same configuration between the examinations. The software compares the rigid bodies between two examinations and the mean error of rigid body fitting is calculated. The mean error describes the perturbation of the polygon caused by unstable markers and errors in the digitization process (Kär-rholm 1989). A configuration number describes the marker position in space; the closer the mark-ers of the polygon are to a straight line, the higher is the configuration number. A high configuration number means that the relative motion of the rigid body is more sensitive to measurement errors. The configuration number influences the accuracy of rotational movement more than it does translation (Ryd et al. 2000).
Standard radiographic examinations
The standard AP pictures were digitized in a Vidar VXR-12 plus film digitizer (Herndon, Virginia, USA). With the software Imagika (CMC Corp., New Jersey, USA) three points were marked along the edge of the acetabular metallic shell on the standard radiographs. The software then defined the circumference of the metallic shell by using edge detection technique. The circumference of the head was defined accordingly. The known diameter of the head was used to calibrate this measurement. The penetration of the head into the cup was then measured according to three principally different methods.

694 Acta Orthop Scand 2004; 75 (6): 691–700
Charnley Duo
Four distances between the center of the head and the edge of the cup, as outlined by the software edge detection technique, were measured in an area where the cup could be expected to be worn (Figure 2). Head penetration was then calculated by subtracting the shortest distance in the latest examination from the shortest distance in the first examination (Charnley and Halley 1975). This distance was measured three times, and their mean was used as “Charnley Duo wear”.
Imagika wear
The distance between the computed centers of the two circumferences of the cup and head was used to measure the head penetration into the cup. Each radiograph was again measured three times, and the mean of these is presented as “Imagika wear” (Figure 2).
Imagika corrected wear
The Imagika technique for measuring wear (see above) assumes that the centers of the head and cup mach exactly at the first examination. This is not the case for several cup designs. When calculating Imagika wear, we subtracted the distance between the centers of the head and cup in the latest exami-nation from the corresponding distance in the first examination. If the head penetration in the latest examination is in a direction other than along a
line between the head center and cup center, this method will introduce a systematic error (Figure 2). To overcome this, we introduced a reference plane that was assumed to be constant between the two examinations. We used a line drawn through the cup ellipse and a parallel to this was placed, transecting the cup center. Thus we could recon-struct the angle (A) opposite the wanted wear side (a). Using the law of cosines (a2 = b2 + c2 – 2bc cos [A]), the actual wear could be calculated. Again, the mean of three separate measurements of each radiograph was taken as Imagika corrected wear.
Statistics
In the first stage of the study, we used a regression model to obtain a visual interpretation of systematic and random errors with successive increments of simulated wear in the interval 0–3 mm. The equa-tion of the line was calculated, giving the slope of the line and the regression coefficient, which under perfect conditions should be 1. The hypothesis that the measured value was equivalent to the microm-eter value was tested and the confidence interval for the regression lines was calculated at the 95% level. The intercept on the y-axis was calculated and the hypothesis tested that it should be 0 (p-value). This indicated the systematic error of the methods (Figure 3 and Table 1).
In the second stage, we did repeated measure-ments at three (stratified) levels. The mean and standard deviation for each simulated wear level (0.2 mm, 1.0 mm and 1.5 mm) were calculated (Table 2). The “true” micrometer value was sub-tracted from each individual measurement, thereby representing each individual error. The mean and standard deviation of the error was calculated. The individual errors were entered in a scatter plot for each method and were related to the mean error of that method according to Bland-Altman (Bland et al. 1986). This plot indicates the systematic errors and the spread of the measurements (Figure 4).
Assuming that the methods both had systematic (bias) and random (repeatability) errors, accuracy was calculated according to the ISO standard (International standard ISO 1998, Ranstam et al. 1999) at the 95% level. According to the ISO standard, accuracy is defined as the closeness of agreement between a test result and the “true” value. Accuracy is the result of the systematic error
Figure 2. Imagika corrected wear. ce = line through cup elipse. cc = cup centre. hc 1 = head centre at first exami-nation. hc 2 = head centre at second examination. b = distance cc to hc at first examination. c = distance cc to hc at second examination. A = angle between b and c. a = actual calculated wear.
Micrometer setting, mm
0.0 0.5 1.0 1.5 2.0 2.5 3.00.0
0.5
1.0
1.5
2.0
2.5
3.0
Measured wear, mm
RSA Y
RSA tot
ChD
Im
Im C
RSA DM Y
RSA DM tot
Acta Orthop Scand 2004; 75 (6): 691–700 695
of a method (agreement between average value obtained from a large series of test results and the “true reference”) and the random error (the close-ness of independent measurements). Accuracy was calculated as the sum of bias and repeatability. The 95% confidence intervals were calculated as the mean ± calculated accuracy.
Bias (systematic error) was calculated according
to the formula: d 0 ±1.96 × Sdo
n
where: Sdo =(d0 − d 0 )2∑
n −1
and repeatability (precision) according to the
formula: 1.96 × 2 ×(d0 − d 0 )2∑
n −1
where d0 = difference between micrometer set-ting and the methods measurement,
d 0 = mean of difference between micrometer set-ting and the methods measurement,
and n = number of measurements. The confidence interval as calculated by the
STATISTICA program (Table 2) at the 95% level is
based on the t-distribution: CI = x ± t × sd
n
(where x = mean, sd = standard deviation, t = 1.73 if n = 19, and t = 1.72 if n = 20).
One-way ANOVA for multiple comparisons was used for statistical analysis between groups, such as when comparing the results of the five phan-toms. The statistical calculations were performed using Statistica 99 Edition software (StatSoft Inc., Tulsa, Oklahoma, USA).
Results
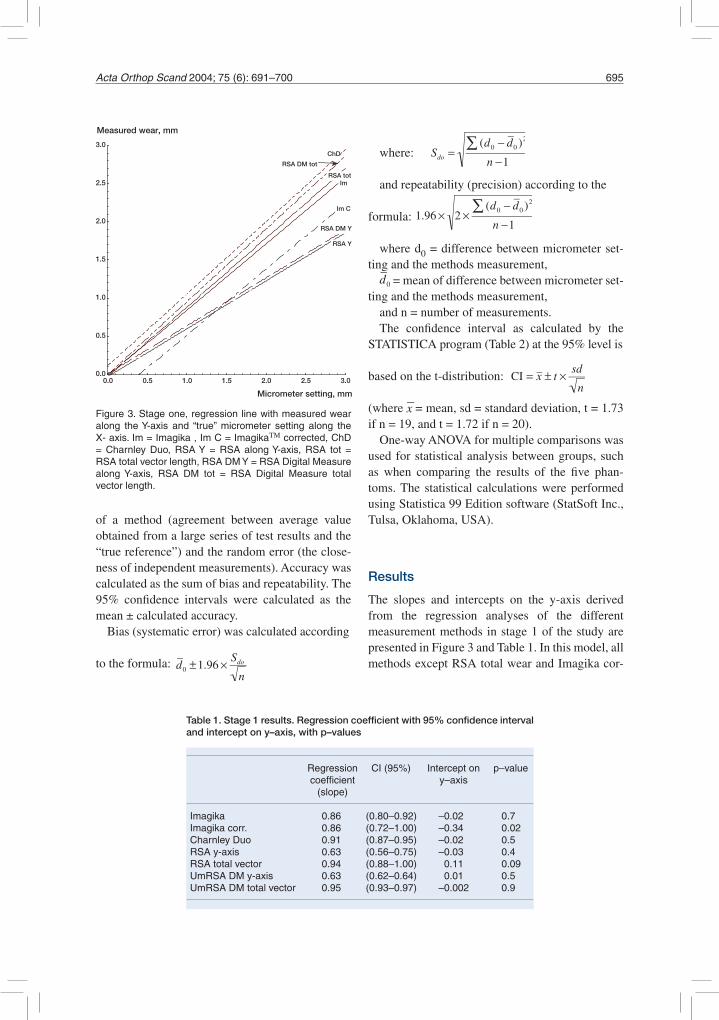
The slopes and intercepts on the y-axis derived from the regression analyses of the different measurement methods in stage 1 of the study are presented in Figure 3 and Table 1. In this model, all methods except RSA total wear and Imagika cor-
Table 1. Stage 1 results. Regression coefficient with 95% confidence interval and intercept on y–axis, with p–values
Regression CI (95%) Intercept on p–value coefficient y–axis (slope)
Imagika 0.86 (0.80–0.92) –0.02 0.7Imagika corr. 0.86 (0.72–1.00) –0.34 0.02Charnley Duo 0.91 (0.87–0.95) –0.02 0.5RSA y-axis 0.63 (0.56–0.75) –0.03 0.4RSA total vector 0.94 (0.88–1.00) 0.11 0.09UmRSA DM y-axis 0.63 (0.62–0.64) 0.01 0.5UmRSA DM total vector 0.95 (0.93–0.97) –0.002 0.9
Figure 3. Stage one, regression line with measured wear along the Y-axis and “true” micrometer setting along the X- axis. Im = Imagika , Im C = ImagikaΤΜ corrected, ChD = Charnley Duo, RSA Y = RSA along Y-axis, RSA tot = RSA total vector length, RSA DM Y = RSA Digital Measure along Y-axis, RSA DM tot = RSA Digital Measure total vector length.
696 Acta Orthop Scand 2004; 75 (6): 691–700
rected had regression coefficients that differed sig-nificantly from 1 at the 95% level. Wear measured by RSA along the proximal-distal axis (y) had low regression coefficients as expected. Imagika corrected had an intercept that was significantly different from 0 (p = 0.2).
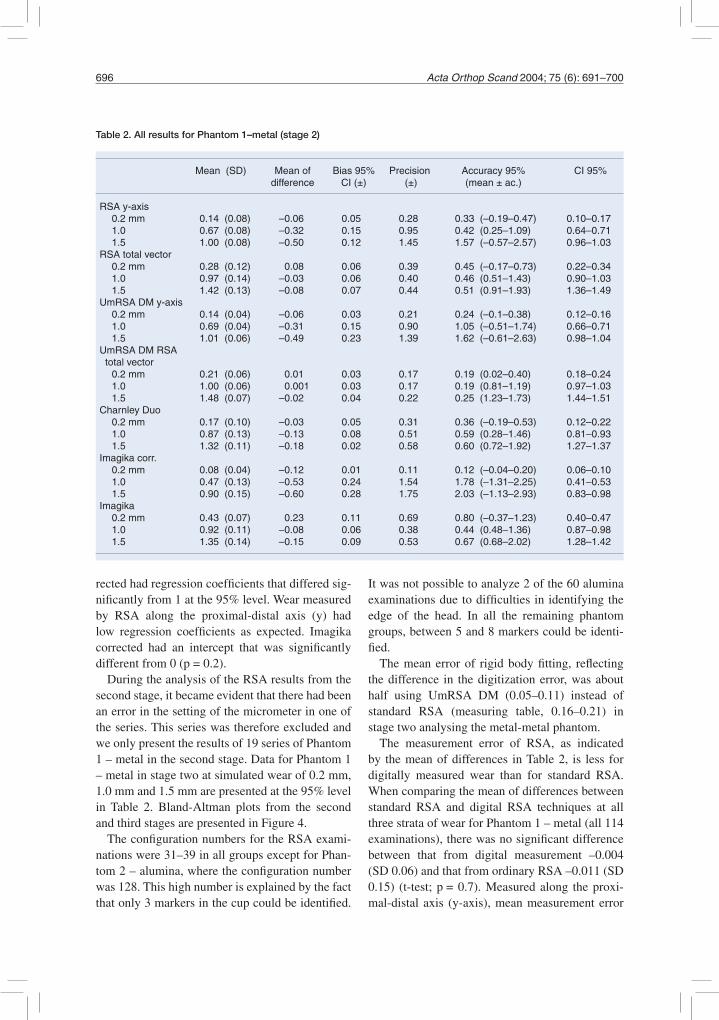
During the analysis of the RSA results from the second stage, it became evident that there had been an error in the setting of the micrometer in one of the series. This series was therefore excluded and we only present the results of 19 series of Phantom 1 – metal in the second stage. Data for Phantom 1 – metal in stage two at simulated wear of 0.2 mm, 1.0 mm and 1.5 mm are presented at the 95% level in Table 2. Bland-Altman plots from the second and third stages are presented in Figure 4.
The configuration numbers for the RSA exami-nations were 31–39 in all groups except for Phan-tom 2 – alumina, where the configuration number was 128. This high number is explained by the fact that only 3 markers in the cup could be identified.
It was not possible to analyze 2 of the 60 alumina examinations due to difficulties in identifying the edge of the head. In all the remaining phantom groups, between 5 and 8 markers could be identi-fied.
The mean error of rigid body fitting, reflecting the difference in the digitization error, was about half using UmRSA DM (0.05–0.11) instead of standard RSA (measuring table, 0.16–0.21) in stage two analysing the metal-metal phantom.
The measurement error of RSA, as indicated by the mean of differences in Table 2, is less for digitally measured wear than for standard RSA. When comparing the mean of differences between standard RSA and digital RSA techniques at all three strata of wear for Phantom 1 – metal (all 114 examinations), there was no significant difference between that from digital measurement –0.004 (SD 0.06) and that from ordinary RSA –0.011 (SD 0.15) (t-test; p = 0.7). Measured along the proxi-mal-distal axis (y-axis), mean measurement error
Table 2. All results for Phantom 1–metal (stage 2)
Mean (SD) Mean of Bias 95% Precision Accuracy 95% CI 95% difference CI (±) (±) (mean ± ac.)
RSA y-axis 0.2 mm 0.14 (0.08) –0.06 0.05 0.28 0.33 (–0.19–0.47) 0.10–0.17 1.0 0.67 (0.08) –0.32 0.15 0.95 0.42 (0.25–1.09) 0.64–0.71 1.5 1.00 (0.08) –0.50 0.12 1.45 1.57 (–0.57–2.57) 0.96–1.03RSA total vector 0.2 mm 0.28 (0.12) 0.08 0.06 0.39 0.45 (–0.17–0.73) 0.22–0.34 1.0 0.97 (0.14) –0.03 0.06 0.40 0.46 (0.51–1.43) 0.90–1.03 1.5 1.42 (0.13) –0.08 0.07 0.44 0.51 (0.91–1.93) 1.36–1.49UmRSA DM y-axis 0.2 mm 0.14 (0.04) –0.06 0.03 0.21 0.24 (–0.1–0.38) 0.12–0.16 1.0 0.69 (0.04) –0.31 0.15 0.90 1.05 (–0.51–1.74) 0.66–0.71 1.5 1.01 (0.06) –0.49 0.23 1.39 1.62 (–0.61–2.63) 0.98–1.04UmRSA DM RSA total vector 0.2 mm 0.21 (0.06) 0.01 0.03 0.17 0.19 (0.02–0.40) 0.18–0.24 1.0 1.00 (0.06) 0.001 0.03 0.17 0.19 (0.81–1.19) 0.97–1.03 1.5 1.48 (0.07) –0.02 0.04 0.22 0.25 (1.23–1.73) 1.44–1.51Charnley Duo 0.2 mm 0.17 (0.10) –0.03 0.05 0.31 0.36 (–0.19–0.53) 0.12–0.22 1.0 0.87 (0.13) –0.13 0.08 0.51 0.59 (0.28–1.46) 0.81–0.93 1.5 1.32 (0.11) –0.18 0.02 0.58 0.60 (0.72–1.92) 1.27–1.37Imagika corr. 0.2 mm 0.08 (0.04) –0.12 0.01 0.11 0.12 (–0.04–0.20) 0.06–0.10 1.0 0.47 (0.13) –0.53 0.24 1.54 1.78 (–1.31–2.25) 0.41–0.53 1.5 0.90 (0.15) –0.60 0.28 1.75 2.03 (–1.13–2.93) 0.83–0.98Imagika 0.2 mm 0.43 (0.07) 0.23 0.11 0.69 0.80 (–0.37–1.23) 0.40–0.47 1.0 0.92 (0.11) –0.08 0.06 0.38 0.44 (0.48–1.36) 0.87–0.98 1.5 1.35 (0.14) –0.15 0.09 0.53 0.67 (0.68–2.02) 1.28–1.42

Acta Orthop Scand 2004; 75 (6): 691–700 697
for digital measure was –0.287, as compared to –0.298 (p = 0.76) for standard RSA. In the remain-ing (third) part of the study, we used UmRSA DM vector as the measurement method.
Along the proximal-distal axis (RSA-y), wear becomes increasingly underestimated as it increases. This is also illustrated by the increasing measurement error with increasing wear (mean of difference in Table 2). There is not the same
problem with RSA total vector wear. The differ-ence between RSA-y and RSA total wear was significant in both the digitally measured and stan-dard RSA measured groups at all levels of wear (p < 0.001), except for digitally measured wear at the 1-mm level (p = 0.300) (ANOVA). RSA wear along the y-axis is thus inferior to RSA total wear, and for stage 3 of the study we only present the results of RSA total wear.
Phantom 1 – metal Phantom 1 – metal
Phantom 2 – aluminaPhantom 2 – aluminaPhantom 2 – alumina2,36
-1,6
2.0
2.5
3.0
3.5
4.0
4.5Phantom 3 – all PEPhantom 3 – all PEPhantom 3 – all PE
Phantom 1 – metal
-1.5
-1.0
-0.5
0.0
0.5
1.0
1.5
Phantom 1 – metal
-1.5
-1.0
-0.5
0.0
0.5
1.0
1.5
Phantom 2 – alumina
0.2 1 1.5
-1.5
-1.0
-0.5
0.0
0.5
1.0
1.5
Phantom 3 – all PE
0.2 1 1.5 0.2 1 1.5 0.2 1 1.5
RSA Duo Imagica corr. Imagika
Figure 4. Stage two and three, Bland-Altman scatterplot of the measurement error, (Error of measurement (dot) = mea-surement (Y-bar) – micrometer setting (X-bar)). Horizontal line indicates the mean of differences). Top row Phantom 1 – metal. Middle row Phantom 2 – Aluminal. Bottom row Phantom 3 – all PE. Column from left to right: RSA total wear digital measure. Charnley Duo. Imagika corrected wear. Imagika. Please note altered Y-axis of Imagika PE (bottom row). * Two outliers of Charnley Duo Alumina are not shown at the 1.5 mm level (2.36 and –1.6).

698 Acta Orthop Scand 2004; 75 (6): 691–700
In comparing all examinations of each phan-tom, the material of the different phantoms did not significantly affect the measurement error of digital RSA total wear (p = 1.0 ANOVA). The material did not affect the error of Charnley Duo, but Imagika corrected overestimated the simulated wear of Phantom 1 – metal, and Imagika overes-timated the wear of Phantom 3 – all PE. Mean measurement error using all examinations with the Charnley Duo method was 0.11 mm for Phantom 1 – metal, 0.18 mm for Phantom 2 – alumina, and 0.30 mm for Phantom 3 – all PE. The difference was not significant (p = 0.2–0.9). The mean mea-surement error using Imagika corrected was -0.41 mm for Phantom 1 – metal, 0.004 for Phantom 2 – alumina and 0.041 mm for Phantom 3 – all PE. The difference was not significant between Phan-tom 2 –alumina and Phantom 3 – all PE (p = 1.0), but was significant between Phantom 1 – metal and the other groups (p < 0.001). The mean measure-ment error of all examinations with Imagika was 0.003 with Phantom 1 – metal, -0.13 with Phantom 2 – alumina and 3.19 with Phantom 3 – all PE. The difference between Phantom 2 – alumina and Phantom 3 – all PE was significant (p < 0.001). The difference between Phantom 1 – metal and Phantom 2 –alumina was not significant (p = 0.8).
There was no significant difference between the measurement errors of the five different phantoms at 0–1mm simulated wear, as measured with digital RSA (p > 0.4, ANOVA). Thus the different materi-als in the phantoms did not significantly affect the measurement error. Measurement error for the Phantom 2 – alumina was –0.03 (SD 0.20), it was 0.004 (SD 0.07) for Phantom 3 – all PE and 0.001 (SD 0.06) for Phantom 1 – metal. The size of head did not alter the mean measurement error for Phan-tom 4 – small head, metal, with the 22-mm head (–0.04 (SD 0.08)), nor did the 10-degree change of direction from posterior to anterior. Measurement error for Phantom 5 – anterior direction, metal, was –0.053 (SD 0.06).
The mean measurement error of all the digital RSA examinations was 0.010 mm (n = 175, SD 0.15, accuracy 0.42). For Charnley Duo, the mean error was 0.19 (n =180, SD 0.39, accuracy 1.3), for Imagika corrected it was 0.13 (n = 180, SD 0.42, accuracy 1.3) and for Imagika it was1.021 (n = 180, SD 1.62, accuracy 2.99). The difference
in measurement errors between digital RSA and Charnley Duo was significant (p = 0.01, logarith-mic ANOVA). The differences in measurement errors between Imagika corrected and digital RSA or Charnley Duo were not significant (p = 0.2 and p = 0.7, respectively). The difference between Imagika and any of the other methods was signifi-cant (p < 0.001).
Discussion
In our study model, the direction of penetration of the head into the cup was out of plane, i.e. directed 20 degrees posteriorly. By this, we were deliberately introducing a systematic error. This systematic error of the observed y-penetration increased with higher degrees of simulated wear. This is to be expected, because y-penetration only represents penetration as measured in one plane. However, the out-of-plane effect did not have any influence on total wear (Figure 3 and Table 2). In fact, RSA total wear was the only method of the 7 investigated in our regression model that did not underestimate penetration. The reason for why the confidence interval for the regression coefficient with respect to the RSA Digital Measure (UmRSA DM) does not include the value 1.0 is obscure, and may indicate that this method underestimates pen-etration. However, this observation is presumably not important, as the systemic error is the lowest for the UmRSA DM method in the subsequent analyses (Figure 4, Table 2).
All three methods for measuring penetration based on standard radiographs, Charnley Duo, Imagika corrected and Imagika, underestimated wear according to the regression model and the remaining analyses (Figure 3, Table 1). The edge enhancement method (Imagika) was the least reli-able.
RSA is an accurate method for measurement of penetration. The UmRSA DM program improves the accuracy further. However, the result should still be interpreted with caution in specific cases. There was no statistically significant difference between Charnley Duo and Imagika corrected in this study, but Charnley Duo systematically under-estimated simulated wear of Phantom 3 – all PE, while Imagika corrected underestimated simulated

Acta Orthop Scand 2004; 75 (6): 691–700 699
wear of Phantom 1 – metal. Our results indicate that measurement of wear in individual patients with the use of methods based on standard AP films should be interpreted with care, because of the unknown magnitude of the out-of-plane effect. Clarke et al. (1976) has previously proposed this.
The alumina head was difficult to define in the radiographs even with UmRSA DM. This is well demonstrated in Figure 4. It also appears that the measurement error increases for alumina heads with increasing penetration. This might be explained by increasing difficulty in identifying the edge of the head as it penetrates into the cup. Wear studies of prostheses with alumina heads may therefore be difficult to interpret.
It is generally agreed that the diameter of the femoral head has an influence on linear and volu-metric wear. An important finding in our study was that head size does not affect the total wear mea-surement error of UmRSA DM.
Wroblewski (1985) described that in 22 sockets studied by the shadow-graphic technique, 9 had worn anteriorly, 2 posteriorly and 11 had been worn in the middle. According to the results of our study, UmRSA DM can detect penetration accu-rately irrespective of the direction of the penetra-tion into the cup.
The aggregated measurement error of the digital RSA technique in the interval 0–1.5 mm of simu-lated wear in our study was 0.01 mm (SD 0.15). In a study using computer-assisted vector wear tech-nique for digital radiographs, Martell and Berdia (1997) performed 9 examinations of a titanium shell with a PE liner. They observed 0.13mm (SD 0.15) of error at 0.5 mm simulated wear and 0.2 mm (SD 0.17) of error at 1.0 mm simulated wear. Ryd et al. (2000) determined the accuracy for RSA by inserting tantalum markers into a plexiglas phantom and performed 22 examinations alto-gether. Their data compilation resulted in SD 0.06 mm for translation, and with a 95% confidence interval the accuracy was determined to be 0.12 mm. Bragdon et al. (2002) reported an accuracy of 0.08 mm at 95% CI in a phantom study with digital RSA, using a metal shell and a metal head. The tantalum beads in the latter study were mounted on towers in order to be clearly visualized. The accuracy for the metal-metal phantom in our study was 0.19–0.25 mm, depending on the degree of
simulated penetration (Table 2). The discrepancy between our results and the results of the Bragdon group can possibly be explained by differences in the setup of the phantom. In our study the position of the entire phantom was varied in all directions and at random, simulating a patient getting on and off the examination table. We inserted the tantalum beads into the plastic cup, i.e. inside the shell, which possibly made them more difficult to visual-ize than in the Bragdon study. Thus, our study cor-responds more to the clinical situation.
The mean of difference of the measurements of Phantom 1 – metal for the Charnley Duo method at all 3 levels of simulated penetration was 0.11 mm (SD 0.13), which compares well with the results from Martell’s computer-assisted vector wear technique (Martell and Berdia 1997). At the 1-mm level of simulated penetration, we measured 0.87 mm (SD 0.13) using Charnley Duo whereas Martell and Berdia (1997) measured 1.20 mm (SD 0.17).
The UmRSA DM technique decreased the mean measurement error along the total vector from 0.01 for ordinary RSA to 0.004 mm, but this dif-ference is not statistically significant. The digital method produced less “noise” when defining the coordinates of the tantalum beads. This “noise” is propagated throughout the whole computation process (Yuan and Ryd 1999). Our study was not primarily designed with digital measurements in mind; the very dark film made it less suitable for digital RSA. A study design aimed at digital RSA measurement would probably have produced even better results and been less time consuming. The RSA method for measuring wear as in this study is based on a mathematical reconstruction of the head center done by the UmRSA software. It has been suggested that the accuracy could be increased fur-ther by altering the calculation routine (N. Börlin, personal communication).
The results of Phantom 3 – all PE illustrate the systematic error of the Imagika measurement method due to its false assumption that the head and cup centers coincide. When mounting the head in the phantom, the center was missed by about 3 mm (Figure 4). The measurement error of Phan-tom 3 – all PE was larger than that of Phantom 1 – metal with all 3 measurement methods based on standard radiographs. This could possibly be

700 Acta Orthop Scand 2004; 75 (6): 691–700
explained by the fact that no cement was applied to the outer surface of the polyethylene cup. The contrast between PE and air was so poor that it was very difficult to identify the edge of the cup in the films. With all three methods that were based on standard radiographs, it was also difficult to iden-tify the edge of the alumina head just as with RSA, although RSA gave better results.
The reason why Imagika corrected systemati-cally underestimates the penetration of the metallic head into the metal cup is obscure, especially as the method was accurate when measuring the remain-ing phantoms (Figure 4).
When presenting wear data, the Bland-Altman method makes systematic differences between var-ious methods more obvious than by simply stating the mean of the differences and standard deviation. Correspondingly, the use of the ISO standards for presenting accuracy makes such systematic errors more apparent than presenting means and stan-dard deviation. Using an internationally accepted standard for the calculation of error, such as the ISO standard, ensures that different authors use the same algorithms in their calculations and the same terminology. Every laboratory should state “Accuracy according to the ISO standard” in its methods.
Bankston B, Ritter M, Keating M, Faris P. Measurement of polyethylene in total hip arthroplasty, J Arthroplasty 1994; 9 (5): 533-8.
Bland J, Altman D. Statistical methods for assessing agree-ment between two methods of clinical measurement. Lancet 1986; Feb 8: 307-10.
Bragdon C, Malchau H, Yuan X, Perinchief R, Kärrholm J, Börlin N, Esok D, Harris W. Experimental assesement of precision and accuracy of radiostereometric analysis for the determination of polyethylene wear in total hip replacement model. J Orthop Res 2002; 20: 688-95.
Börlin N. Model-based measurements in digital radiographs. Thesis, Department of Computing Science, Umeå Univer-sity 2000.
Börlin N, Thien T, Kärrholm J. The precision of radiostereometric measurements–manual vs. digital mea-surements. J Biomech 2002; 35 (1): 69-79.
Charnley J, Halley D. Rate of wear in total hip replacement. Clin Orthop 1975; 12: 170-9.
Clarke I, Black K, Rennie B, Amstutz H. Can wear in total hip arthroplasties be assessed from radiographs? Clin Orthop 1976; 121: 126-40.
Devane P, Robinsson E, Bourne R, Rorabeck C, Nayak N, Horne J. Measurement of polyethylene wear in acetabu-lar components Inserted with and without cement. J Bone Joint Surg (Am) 1997; 79: 685-6.
Franzén H, Mjöberg B. Wear and loosening of the hip pros-thesis. Acta Orthop Scand 1990; 61 (6): 499-501.
Griffith M, Seidenstein M, Williams D, Charnley J. Socket wear in Charnley low friction arthroplasty of the hip. Clin Orthop 1978; 137: 37-47.
Ilchman T, Mjöberg B, Wingstrand H. Measurement accu-racy in acetabular cup wear. J Arthroplasty 1995; 10 (5): 636-42.
International standard ISO 5725-1:1994, Published 1998-02-15.
Kärrholm J. Roentgen stereophotogrammetry. Review of orthopedic applications. Acta Orthop Scand 1989; 60 (4): 491-503.
Kärrholm J, Herberts P, Hultmark P, Malchau H, Nivbrandt B, Thanner J. Radiosterometry of hip protheses. Rewiev of methodology and clinical results. Clin Orthop 1997; 344: 94-110.
Livermore J, Ilustrup D, Morrey B. Effect of femoral head size on wear of the polyethylene acetabular component. J Bone Joint Surg (Am) 1990; 72: 518-28.
Martell J, Berdia S. Determination of polyethylene wear in total hip replacement with use of digital radiographs. J Bone Joint Surg (Am) 1997; 79 (11): 1635-41.
Ohlin A, Selvik G. Socket wear assessment. A comparison of three different radiographic methods. J Arthroplasty 1993; 8 (4): 427-31.
Oparaugo P, Clarke I, Malchau H, Herberts P. Correlation of wear debris-induced osteolysis and revision with volu-metric wear-rates of polyethylene. Acta Orthop Scand 2001; 72 (1): 22-8.
Ranstam J, Ryd L, Önsten I. Accurate accuracy assessement. Acta Orthop Scand 1999; 70 (4): 319-21.
Ryd L, Yuan X, Löfgren H, Methods for determining the accuracy of radiostereometric analasis (RSA). Acta Orthop Scand 2000; 71 (4): 403-8.
Selvik G. Roentgen stereophotogrammetry. A method for the studie of kinematics of the skeletal system. Acta Orthop Scand (Suppl 232) 1989: 60.
Wroblewski B. Direction and rate of socket wear in Charn-ley low-friction arthroplasty. J Bone Joint Surg (Br) 1985; 67 (5): 757-61.
Yuan X, Ryd L. Accuracy analysis for RSA, a computer simulation study on 3D marker reconstruktion. J Biome-chanics 1999; 33: 493-8.
Önsten I. Fixation of total hip components in reumatoid artritis and artrosis. A radiographic, roentgen stereophot-grammetric, densitimetric and histomorfometric study. Thesis, Dept of Orthopaedis, University of Lund, Malmö General Hospital, Malmö, Sweden. 1994.
Önsten I, Carlsson Å, Besjakov J. Wear in uncemented porous and cemented polyethylene sockets. J Bone Joint Surg (Br) 1998; 80: 345-50.