Embed Size (px)
Citation preview

Accuracy of Density Functional Theory for
Predicting Kinetics of Methanol Synthesis
from CO and CO2 Hydrogenation on Copper
Maliheh Shaban Tameh,† Albert K. Dearden,† and Chen Huang∗,‡
†Department of Scienti�c Computing, Florida State University, Tallahassee, Florida 32306,
USA
‡Department of Scienti�c Computing and National High Magnetic Field Laboratory,
Florida State University, Tallahassee, Florida 32306, USA
E-mail: [email protected]
1
Abstract
Density functional theory (DFT) is widely used for investigating heterogeneous
catalysis; however, the predictive power of DFT is determined by the approximation
used in the exchange-correlation (XC) functionals. In this work, we systematically
investigate how the kinetics of methanol synthesis predicted by DFT depends on the
choice of XC functionals. Microkinetic modelings are performed based on the Gibbs
energies calculated with XC functionals that represent three levels of accuracy: Perdew-
Burke-Ernzerhof (PBE) functional, Heyd-Scuseria-Ernzerhof (HSE) hybrid functional,
and the random phase approximation (RPA) functional. We show that the predicted
kinetics strongly depends on the choice of XC functionals. Methanol's turnover fre-
quencies predicted by PBE and HSE are about 30 times faster than the predictions
from RPA. PBE predicts that the overall barrier of CO hydrogenation is 0.56 eV lower
than that of CO2 hydrogenation, therefore suggesting CO as the carbon source for
methanol synthesis on copper. This contradicts previous isotope-labeling experiments
that supported CO2 as the carbon source in industrial methanol synthesis; therefore,
PBE suggests that metallic copper cannot be the active site for CO2 hydrogenation.
On the other hand, the overall barrier of CO hydrogenation, predicted by HSE and
RPA, is lower than the overall barrier of CO2 hydrogenation by 0.22 eV and 0.14 eV,
respectively. This suggests that CO2 hydrogenation is also competitive for methanol
production, and we cannot completely rule out the possibility that metallic copper is the
active site for catalyzing CO2 hydrogenation. In addition, the prediction of the domi-
nating adsorbates also strongly depends on the choice of XC functionals. Our results
show that di�erent XC functionals can predict di�erent kinetics for methanol synthesis,
which calls attention to the accuracy of DFT for modeling methanol synthesis.
2
1 Introduction
Methanol is an important building block for synthesizing many chemicals, and is used as
the fuel for combustion engines and the direct methanol fuel cells. Methanol is synthesized
through CO and CO2 hydrogenations. Low pressure methanol synthesis is performed with
the Cu/ZnO catalyst system.1 The catalytic process involves many competing processes such
as CO hydrogenation, CO2 hydrogenation, and the water-gas shift reaction. These processes
are coupled. In addition, the morphology of the catalysts can change in response to di�erent
adsorbates.2 Due to such complexity, the mechanism of methanol synthesis is under extensive
debate.
A long-term e�ort is to identify the active sites. Metallic copper has long been proposed as
the active site,1,3�17 and oxides are added to maintain large copper surface and to reduce CuO
to metallic copper.18�21 Others suggested that methanol is synthesized over Cu+ at Cu/ZnO
interface,22�25 or over the Cu cations that dissolve in ZnO matrix,26,27 and suggested that
metallic copper only promotes the dissociation of H2.26,28�30
Without pinning down the active sites, it is di�cult to resolve another related puzzle:
what the carbon source is in industrial methanol synthesis. It was suggested that methanol
was mainly produced through CO hydrogenation,31�33 and the role of CO2 was to maintain
the oxidation state of copper and the dispersion of copper particles.30,34,35 This supports the
argument that oxidized copper is the active site. Others suggested that CO and CO2 play
equal roles,36�39 and CO and CO2 hydrogenations take place at di�erent active sites.40�42
CO2 has also been proposed to be the major carbon source.1,40,43�47 The role of CO was
suggested to maintain the reduced state of copper for CO2 hydrogenation1 or to inhibit
the reverse water-gas shift reaction that consumes CO2.48,49 Evidences from isotope-labeling
experiments44,47,50,51 strongly support that CO2 is the major carbon source in methanol
synthesis performed over the industrial catalysts.
Density functional theory (DFT)52,53 can help us resolve these puzzles by, for example,
screening candidate active sites. Unfortunately, the predictive power of DFT is hindered
3
by the approximated exchange-correlation (XC) functionals. For example, the generalized
gradient approximated (GGA) functional is known to overestimate the adsorption energies of
molecules on transition metals.54,55 For methanol synthesis on copper, previous DFT-GGA
calculations39,56 predicted that the overall barrier of CO hydrogenation is lower than the
overall barrier of CO2 hydrogenation, which contradicts the isotope-labeling experiments that
suggested CO2 as the major carbon source. This discrepancy between DFT and experiments
can be due to three reasons: (1) metallic copper is not the active site for CO2 hydrogenation
in industrial methanol synthesis, (2) the isotope-labeling experiments were misinterpreted,
and (3) DFT-GGA gave inaccurate energetics for CO and CO2 hydrogenation on copper. In
this work, we examine the last possible reason.
The question that whether the relatively low overall barrier of CO hydrogenation pre-
dicted by GGA is due to GGA's error was recently investigated by Studt and coworkers.57
By using the BEEF-vdW functional,58 they found that the energies of most intermediates in
the CO2 pathway were lowered. For the CO pathway, BEEF-vdW functional did not have
signi�cant correction. As a result, the overall barrier of CO2 pathway became comparable to
the overall barrier of the CO pathway. The improved energetics were attributed to two rea-
sons: (a) the inclusion of the van der Waals (vdW) interaction in BEEF-vdW functional, and
(b) more accurate bonding energies between adsorbates and copper predicted by BEEF-vdW
functional.57 Microkinetic modeling based on their BEEF-vdW energies were later carried
out,59 which predicted that CO2 was the major carbon source. The error of GGA function-
als was also investigated by Peterson et al..60 They corrected the energies of the molecules
and radicals that contain OCO backbones. In the work of Grabow and Mavrikakis,39 they
lowered the GGA energies of several key intermediates by 0.3∼0.6 eV to better reproduce
the experiment results.
In this work, we examine CO and CO2 hydrogenations on copper using the exact exchange
(EXX) and the direct random phase approximation (RPA) correlation functional61�68 (in
which the exchange-correlation kernel is zero). The accuracy of RPA for describing surface
4
reactions has been assessed recently. RPA provides a reasonable description of the vdW
interaction and signi�cantly improved the adsorption energies of CO on transition metals.69
In the study of water splitting over an iron atom, the RPA predictions agreed well with the
coupled cluster method.70 However, we address that RPA does not always reach the chemical
accuracy (1 kcal/mol) for transition metal chemistry, as demonstrated in Ref.71, in which a
detailed comparison between RPA and many other types of XC functionals was performed
in the context of investigating water splitting over an iron atom.71 RPA gave more accurate
predictions for the reaction barriers than most GGA functionals, but gave poorer predictions
for the reaction energies.71 Therefore, at the end of this work, we assess the RPA's accuracy
for predicting the energies of methanol synthesis over copper.
The paper is organized as follows. We �rst investigate the accuracy of di�erent XC func-
tionals for predicting the thermodynamics of CO and CO2 hydrogenation. We construct
the Gibbs energy diagrams of CO and CO2 hydrogenation on copper using Perdew-Burke-
Ernzerhof (PBE)72 functional, Heyd-Scuseria-Ernzerhof (HSE) 200673,74 hybrid functional,
and EXX and RPA correlation functional. Microkinetic modeling75 is performed to inves-
tigate how the predicted kinetics of CO and CO2 hydrogenation depends on the choice of
XC functionals, which is further explained by solving the microkinetic models analytically.
We show that the prediction of the major carbon source strongly depends on the choice of
XC functionals. In the end, we examine the accuracy of RPA by computing enthalpies of
selected molecules and radicals on Pt(111).
2 Computational details
To investigate the accuracy of di�erent XC functionals for predicting the thermodynam-
ics of CO and CO2 hydrogenations, we de�ne the Gibbs energy changes of CO and CO2
5
hydrogenation as
∆GCO = GH3COH −GCO − 2GH2 (1)
∆GCO2 = GH3COH +GH2O −GCO2 − 3GH2 , (2)
where GX is the Gibbs energy of molecule X at 500 K and the corresponding partial pres-
sures. In this work, the partial pressures of CO, CO2, H2, H3COH, and H2O are 10 bar, 10
bar, 40 bar, 1 bar, and 1 bar, respectively. For molecule X, its Gibbs energy is obtained as
GX = EDFTX + ∆GX. ∆GX is the thermal correction to Gibbs energy and is calculated using
Gaussian 09 program76 using PBE functional at 500 K and the partial pressure of molecule
X. EDFTX is the DFT energy calculated using di�erent levels of XC functionals, including �ve
GGA functional (PBE, PW91,77 RPBE,54 BEEF-vdW, and HLE1678), �ve meta-GGA func-
tionals (Tao-Perdew-Staroverov-Scuseria (TPSS),79 revTPSS,80,81 the strongly constrained
and appropriately normed (SCAN) functional,82 HLE17,83 and M06-L84), three hybrid func-
tionals (PBE0,85 HSE, and B3LYP86), and EXX+RPA. These calculations are performed
using the Vienna Ab-initio Simulation Package (VASP),87�91 except HLE16 and HLE17 func-
tionals which are calculated using Gaussian 09 program with cc-pVQZ basis sets.92 Hybrid
calculations are performed with a kinetic energy cuto� of 400 eV. RPA calculations are per-
formed with a kinetic energy cuto� of 300 eV. In VASP calculations, the molecules are put
in 10× 10× 10 Å cells.
∆GCO and ∆GCO2 predicted by di�erent XC functionals are compared to the references.
To obtain the references, the Gibbs energy of molecule X is calculated as GRefX = ∆fH
ogas,X−
∆HDFTX + ∆GDFT
X . ∆fHogas,X is the molecule X's standard enthalpy of formation, taken
from NIST Chemistry WebBook93 (with the speci�c references given later). ∆fHogas,X is -
1.14 eV,94 -4.07 eV,94 0.0 eV, -2.51 eV,94 and -2.12 eV93 for gas-phase CO, CO2, H2, H2O,
and H3COH, respectively. ∆HDFTX is the thermal correction to enthalpy at the standard
conditions. ∆GDFTX is the correction to Gibbs energy, calculated at 500 K and the molecule
6
X's partial pressure. Both ∆HDFTX and ∆GDFT
X are computed using Gaussian 09 program
with PBE functional and cc-pVQZ basis set.
To model CO and CO2 hydrogenations on copper, a copper face-centered cubic (FCC)
(211) surface is employed to represent surface defects and is modeled by a 3×3 super-cell and
a four-layer slab separated from its periodic image by a 10 Å vacuum. Structures are relaxed
using the Quantum Espresso program95 with PBE functional and a kinetic energy cuto� of
550 eV. Top two Cu layers and adsorbates are free to move. Fermi-Dirac smearing with a
smearing temperature of 0.1 eV is used. A 4×4×1 Monkhorst-Pack96 k-point mesh is used.
Transition states are identi�ed using the string method.97,98 To reduce the computational
cost, images are relaxed with all Cu atoms kept �xed and a smaller 2× 2× 1 k-point mesh.
To model Pt FCC(111) surface, a 3×3 unit cell with a �ve-layer slab is used. A 10
Å vacuum is added to reduce the interaction between the periodic images. Structures are
relaxed with the bottom three Pt layers kept �xed, and are relaxed using VASP with a
kinetic energy cuto� of 500 eV and a k-point mesh of 6 × 6 × 1. Gaussian smearing with
a smearing temperature of 0.1 eV is used. Transition states are identi�ed using the nudged
elastic band (NEB) theory.99�102
The ONIOM method103 is used to obtain the adsorption energies with HSE and RPA
accuracies. With ONOIM, the system's energy is de�ned as
EONIOM = Elowtotal + (Ehigh
cluster − Elowcluster), (3)
where PBE is considered as the low-level method in this work. Elowtotal and Elow
cluster are the
system and cluster's PBE energies. For methanol synthesis over Cu(211), Elowtotal is calculated
with a kinetic energy cuto� of 400 eV and k-point mesh of 4 × 4 × 1. In the study of the
adsorption energies of molecules and radical on Pt(111) surface, Elowtotal is calculated with a
kinetic energy cuto� of 400 eV and a k-point mesh of 6×6×1. In Eq. 3, Ehighcluster is the cluster's
high-level energy calculated using either HSE or RPA. The top three metal (Cu or Pt) layers
7
and the adsorbates are selected to be the clusters. The clusters are chosen to be large enough
to include the interaction between adsorbates and metal surfaces. Clusters' HSE and RPA
calculations are performed with VASP using a reduced kinetic energy cuto� of 300 eV and
a reduced k-point mesh of 2× 2× 1 to lower the computational cost. The costs of the RPA
and HSE calculations are further reduced by reducing the cell sizes in the z direction while
still keeping the periodic images separated by a 10 Å vacuum. The same settings are used to
calculate Elowcluster to achieve the error cancellation between Elow
cluster and Ehighcluster. The integral
over the frequency in RPA correlation energy is evaluated using 16 frequency points.104
In Supporting Information, we tested the convergence of RPA calculations with respect to
di�erent settings of kinetic energy cuto�s, k-point meshes, cell sizes in z direction, and the
numbers of copper layers included in clusters. We �nd that the Gibbs energy di�erence
between H-HCO/Cu(211) and H-HCOOH/Cu(211) can be reasonably predicted with the
above low settings.
Gibbs energies and enthalpies of adsorbates on Cu(211) and Pt(111) are calculated by
only considering the vibrational contributions from the adsorbates. The vibrational frequen-
cies are obtained by diagonalizing the Hessian matrices that are built using the central �nite
di�erence method with the substrate metal atoms kept �xed.
For surface reactions, the rate constants are calculated according to the transition state
theory
k =kBT
he−∆Ga/kBT , (4)
where ∆Ga is forward or reverse Gibbs reaction barriers. kB and h are Boltzmann constant
and Planck constant, respectively. T is 500 K in this work.
The kinetics of CO and CO2 hydrogenation is studied with microkinetic modeling, under
the assumption that the adsoprtion energies are independent of the coverage and the distri-
bution of adsorbates are homogeneous. The elementary steps of CO and CO2 hydrogenations
on Cu(211) are listed in Table 1. The coverages of CO*, H*, H3COH*, CO2*, and H2O*
are calculated by assuming that the adsorption processes are at quasi-equilibrium.105,106 For
8
example, the coverage of CO* is calculated as θCO = K1θ∗ where θ∗ is the percentage of the
free surface and
K1 = e−(GCO∗−GCO(g))/kBT
is the equilibrium constant of the CO adsorption (reaction 1 in Table 1), with GCO∗ and
GCO(g) being the Gibbs energies of adsorbed CO and gas-phase CO, respectively. The rate
equations used for microkinetic modeling are given in the Supporting Information and are
integrated using MATLAB107 until the steady states are reached.
The turnover frequency (TOF) of methanol, R, is given by the rate of reaction 6 in
Table 1
R = k+6 θH3COθH − k−6 θH3COHθ∗, (5)
where k+6 and k−6 are the forward and reverse rate constants of reaction 6. The rate-limiting
steps are determined by calculating the degree of rate control108 of all reaction steps. For
the step i, it is
XRC,i =kiR
(∂R
∂ki
){Ki,kj 6=i}
(6)
where {kj 6=i} are the rate constants of other reaction steps rather than the step i. Ki is the
equilibrium constant of the step i. The derivative ∂R/∂ki is taken with {kj 6=i} and Ki kept
constant.
3 Results and discussions
3.1 Thermodynamics of CO and CO2 hydrogenation predicted by
XC functionals of di�erent levels
We investigate the accuracy of XC functionals for predicting the Gibbs energies of CO
and CO2 hydrogenations (∆GCO and ∆GCO2 de�ned in Eqs. 1 and 2). It is important
9
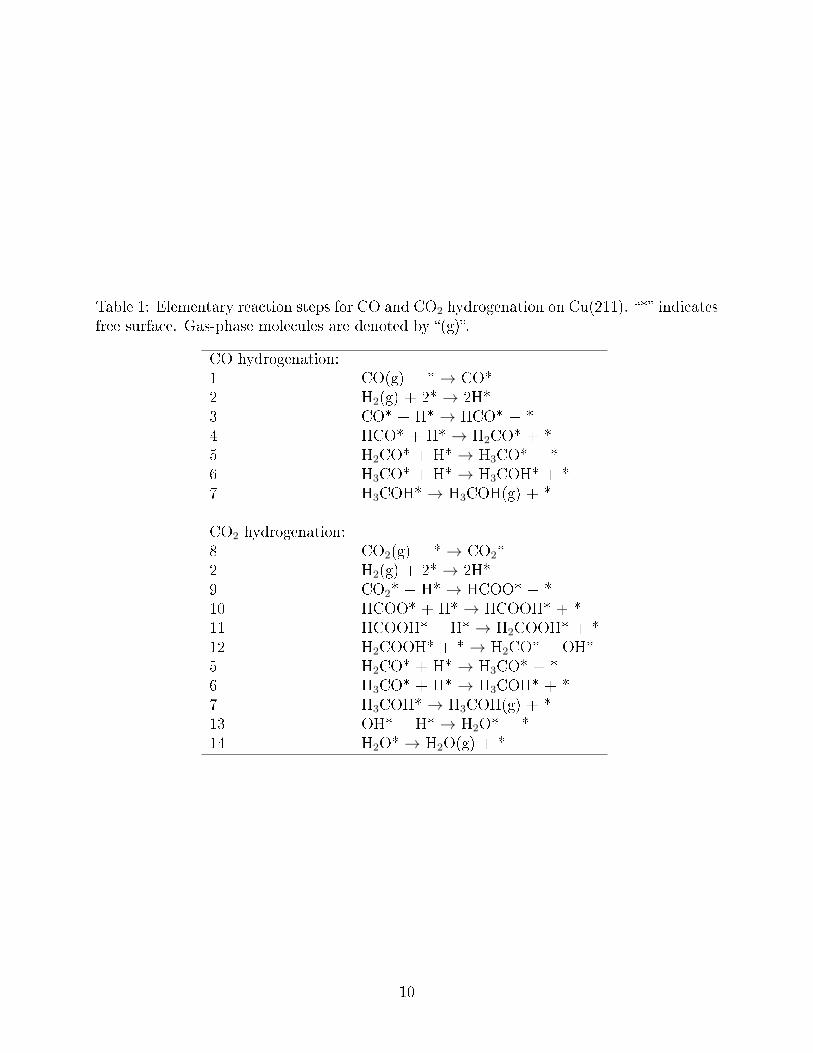
Table 1: Elementary reaction steps for CO and CO2 hydrogenation on Cu(211). �*� indicatesfree surface. Gas-phase molecules are denoted by �(g)�.
CO hydrogenation:1 CO(g) + * → CO*2 H2(g) + 2* → 2H*3 CO* + H* → HCO* + *4 HCO* + H* → H2CO* + *5 H2CO* + H* → H3CO* + *6 H3CO* + H* → H3COH* + *7 H3COH* → H3COH(g) + *
CO2 hydrogenation:8 CO2(g) + * → CO2*2 H2(g) + 2* → 2H*9 CO2* + H* → HCOO* + *10 HCOO* + H* → HCOOH* + *11 HCOOH* + H* → H2COOH* + *12 H2COOH* + * → H2CO* + OH*5 H2CO* + H* → H3CO* + *6 H3CO* + H* → H3COH* + *7 H3COH* → H3COH(g) + *13 OH* + H* → H2O* + *14 H2O* → H2O(g) + *
10
to accurately predict ∆GCO and ∆GCO2 , since they determine whether the hydrogenation
reactions proceed spontaneously. Four di�erent levels of XC functionals are studied: GGA,
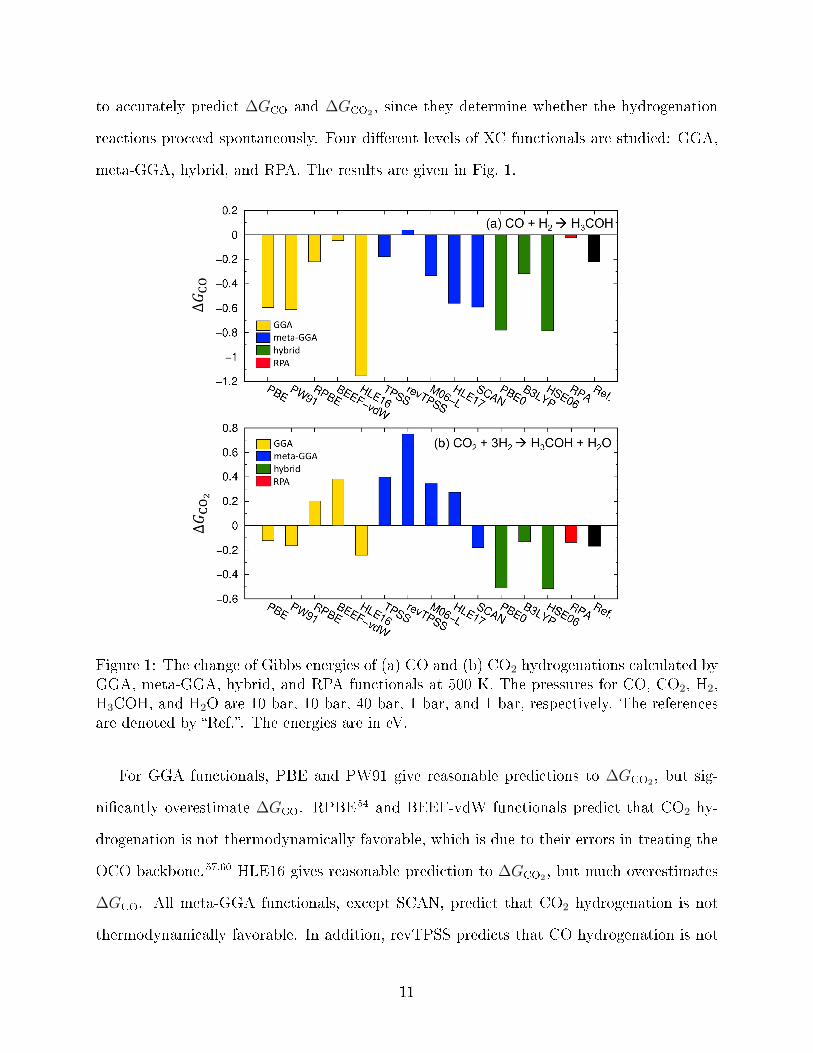
meta-GGA, hybrid, and RPA. The results are given in Fig. 1.
Figure 1: The change of Gibbs energies of (a) CO and (b) CO2 hydrogenations calculated byGGA, meta-GGA, hybrid, and RPA functionals at 500 K. The pressures for CO, CO2, H2,H3COH, and H2O are 10 bar, 10 bar, 40 bar, 1 bar, and 1 bar, respectively. The referencesare denoted by �Ref.�. The energies are in eV.
For GGA functionals, PBE and PW91 give reasonable predictions to ∆GCO2 , but sig-
ni�cantly overestimate ∆GCO. RPBE54 and BEEF-vdW functionals predict that CO2 hy-
drogenation is not thermodynamically favorable, which is due to their errors in treating the
OCO backbone.57,60 HLE16 gives reasonable prediction to ∆GCO2 , but much overestimates
∆GCO. All meta-GGA functionals, except SCAN, predict that CO2 hydrogenation is not
thermodynamically favorable. In addition, revTPSS predicts that CO hydrogenation is not
11
thermodynamically favorable. Therefore, in the following section we only report results from
SCAN functional. For hybrid functionals, the performance of PBE0 and HSE are similar
and they both signi�cantly overestimate the Gibbs energies of CO and CO2 hydrogenations.
B3LYP has a better performance: It slightly overestimates CO hydrogenation and slightly
underestimates CO2 hydrogenation. However B3LYP cannot be used in following studies of
methanol synthesis over Cu(211), since it contains a fraction of Hartree-Fock exchange and
cannot be applied to metals. In the following discussions, HSE functional is employed. For
RPA, it well reproduces ∆GCO2 , but severely underestimates ∆GCO.
3.2 Gibbs energetics of CO and CO2 hydrogenation on Cu(211)
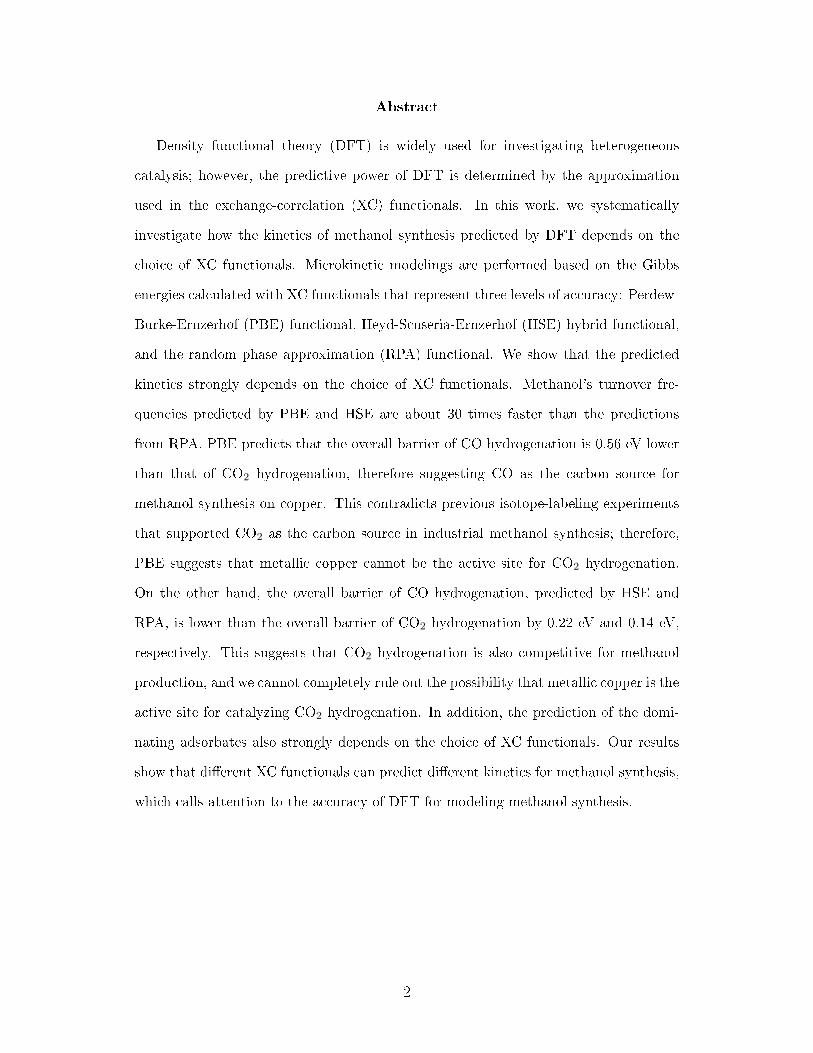
Fig. 2 gives the Gibbs energies calculated using PBE, SCAN, HSE, and RPA. To obtain
a correct prediction of the fastest hydrogenation pathway, an XC functional needs to have
similar errors for gas-phase CO, CO2, H2, H2O, H3COH, and all the intermediates in Fig. 2
to achieve good error cancellations among them. This means that the PBE, SCAN, HSE,
and RPA energy diagrams should overlap, which, however, is not observed in Fig. 2. This
indicates that not all (or none) of these XC functionals have the desired error cancellation.
The fastest hydrogenation pathway is mainly determined by the Gibbs energy di�erence
between H-HCO* and H-HCOOH* (denoted as ∆GRLS). H-HCO* and H-HCOOH* are
the transition states of the rate-limiting steps of the CO and CO2 hydrogenation, respec-
tively, as determined later with microkinetic modeling. PBE promotes CO hydrogenation
by predicting that the Gibbs energy of H-HCO* is 0.56 eV lower than H-HCOOH*, that is,
∆GRLS = 0.56 eV. HSE and RPA much reduce ∆GRLS, and predict ∆GRLS to be 0.22 eV
and 0.14 eV, respectively. Therefore, RPA suggests that CO2 pathway is competitive.
In general, Gibbs energies predicted by SCAN are much lower than the predictions from
PBE, HSE, and RPA. It is known that PBE overestimates the binding energy between
CO and copper surface (the so-called �CO puzzle�).55,109,110 Fig. 2(a) shows that SCAN
overestimates the binding energy more. Therefore, in the following discussions, we focus on
12
PBE, HSE, and RPA functionals.
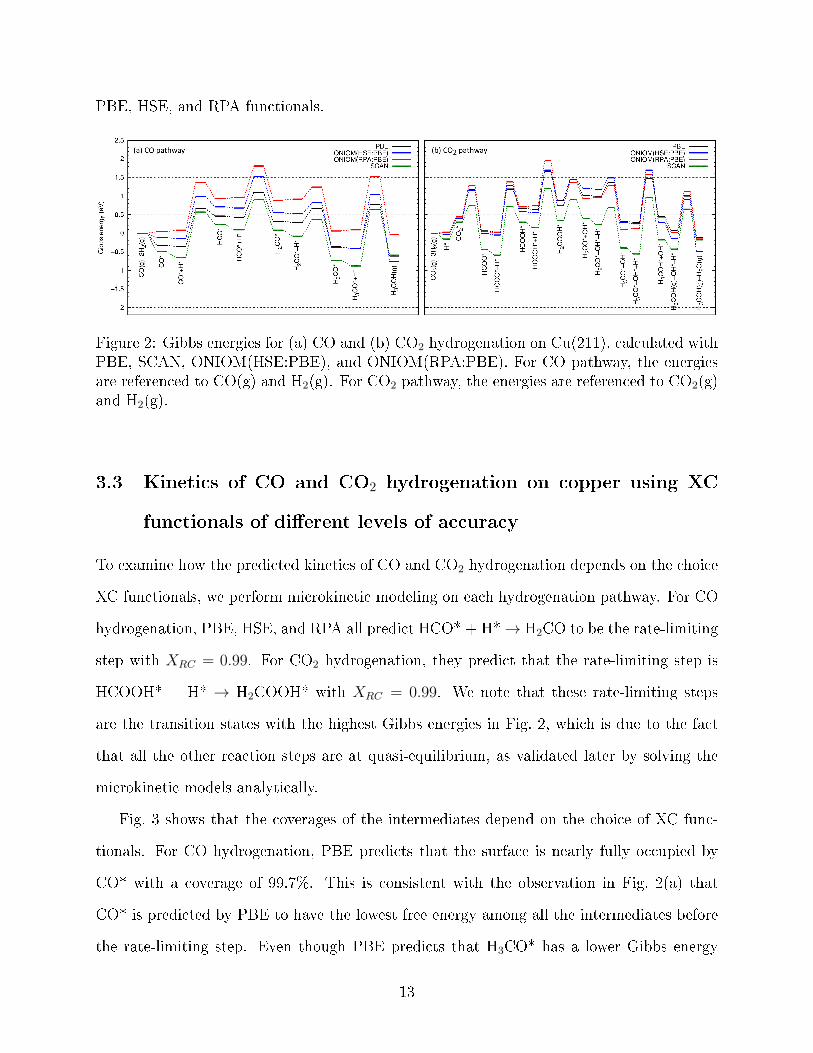
Figure 2: Gibbs energies for (a) CO and (b) CO2 hydrogenation on Cu(211), calculated withPBE, SCAN, ONIOM(HSE:PBE), and ONIOM(RPA:PBE). For CO pathway, the energiesare referenced to CO(g) and H2(g). For CO2 pathway, the energies are referenced to CO2(g)and H2(g).
3.3 Kinetics of CO and CO2 hydrogenation on copper using XC
functionals of di�erent levels of accuracy
To examine how the predicted kinetics of CO and CO2 hydrogenation depends on the choice
XC functionals, we perform microkinetic modeling on each hydrogenation pathway. For CO
hydrogenation, PBE, HSE, and RPA all predict HCO* + H*→ H2CO to be the rate-limiting
step with XRC = 0.99. For CO2 hydrogenation, they predict that the rate-limiting step is
HCOOH* + H* → H2COOH* with XRC = 0.99. We note that these rate-limiting steps
are the transition states with the highest Gibbs energies in Fig. 2, which is due to the fact
that all the other reaction steps are at quasi-equilibrium, as validated later by solving the
microkinetic models analytically.
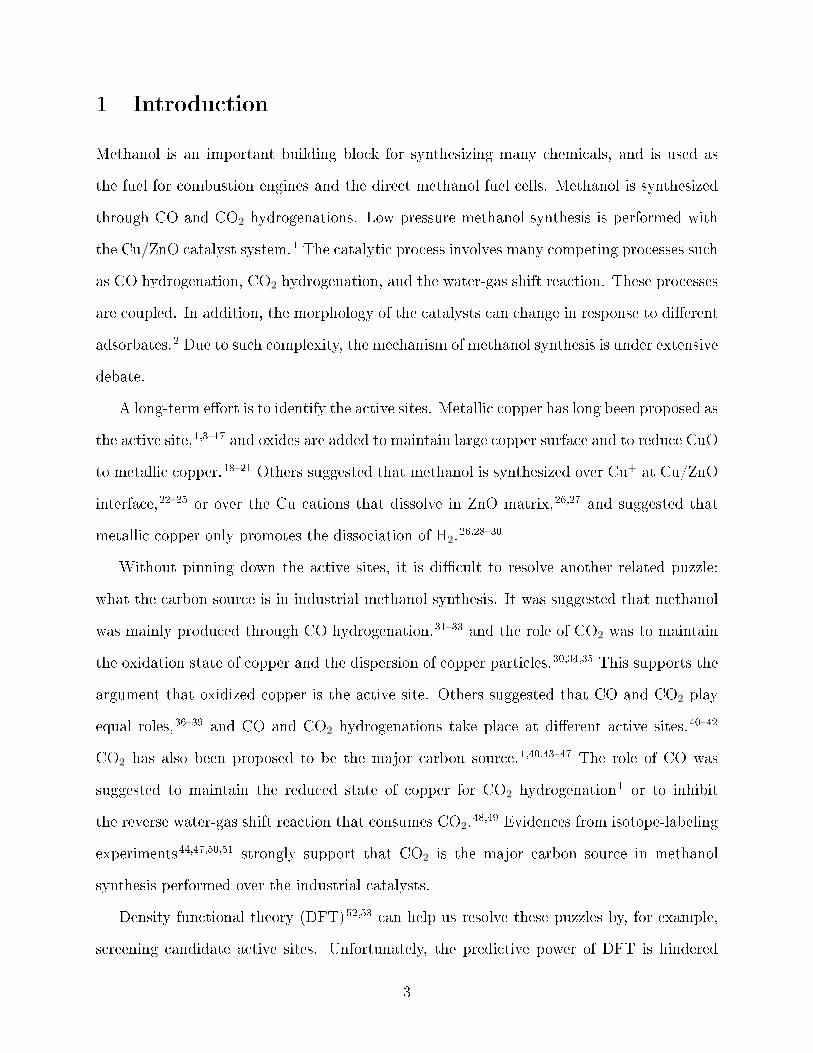
Fig. 3 shows that the coverages of the intermediates depend on the choice of XC func-
tionals. For CO hydrogenation, PBE predicts that the surface is nearly fully occupied by
CO* with a coverage of 99.7%. This is consistent with the observation in Fig. 2(a) that
CO* is predicted by PBE to have the lowest free energy among all the intermediates before
the rate-limiting step. Even though PBE predicts that H3CO* has a lower Gibbs energy
13
than CO*, the coverage of H3CO* predicted by PBE is nearly zero. The reason is that
H3CO* is after the rate-limiting step, and therefore is at quasi-equilibrium with H3COH(g).
Since H3CO* has a higher Gibbs energy than H3COH(g), H3CO* is quickly hydrogenated
to H3COH(g), once it is produced. With HSE and RPA, CO's coverage is much reduced,
because the overbinding problem of CO on copper is much alleviated by HSE and RPA. The
coverages of CO* and H* predicted by RPA are 20.0% and 24.1%, respectively. The reason
for a large coverage for H* is that the Gibbs energy of H* predicted by RPA is 0.01 eV lower
than that of CO*. RPA also predicts a large free surface (52.5%). The HSE prediction is
roughly between PBE and RPA: CO* (84.2%) and H* (10.4%).
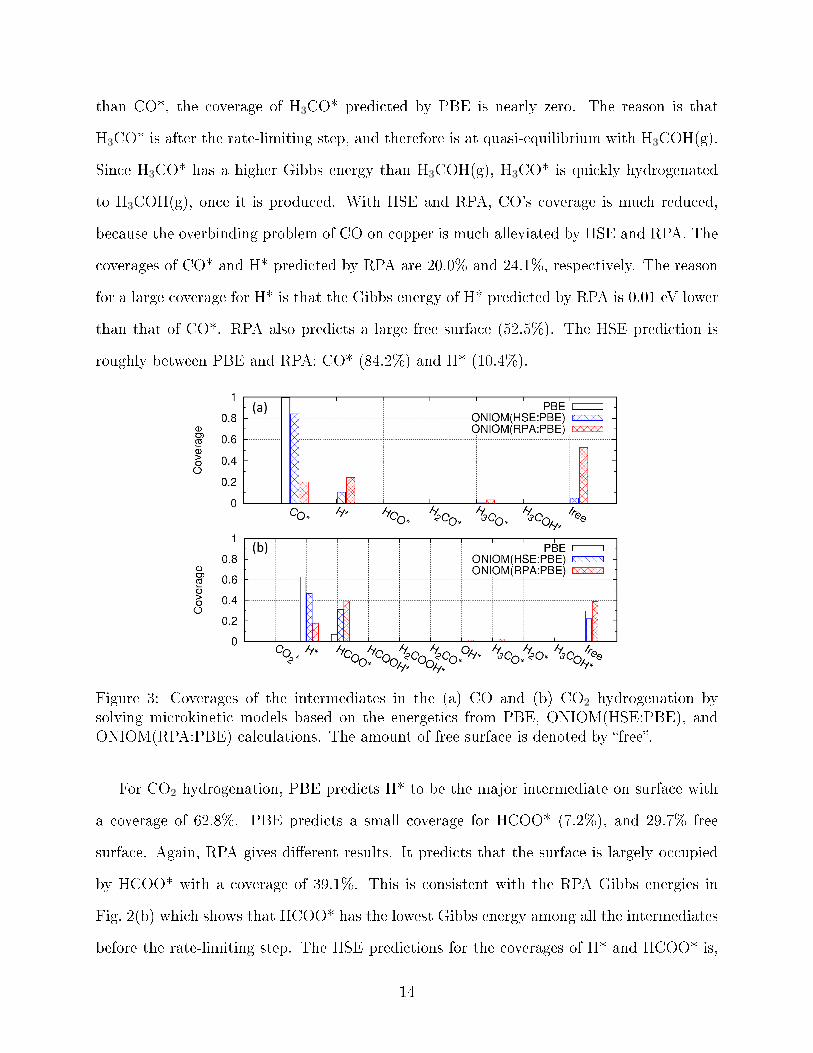
Figure 3: Coverages of the intermediates in the (a) CO and (b) CO2 hydrogenation bysolving microkinetic models based on the energetics from PBE, ONIOM(HSE:PBE), andONIOM(RPA:PBE) calculations. The amount of free surface is denoted by �free�.
For CO2 hydrogenation, PBE predicts H* to be the major intermediate on surface with
a coverage of 62.8%. PBE predicts a small coverage for HCOO* (7.2%), and 29.7% free
surface. Again, RPA gives di�erent results. It predicts that the surface is largely occupied
by HCOO* with a coverage of 39.1%. This is consistent with the RPA Gibbs energies in
Fig. 2(b) which shows that HCOO* has the lowest Gibbs energy among all the intermediates
before the rate-limiting step. The HSE predictions for the coverages of H* and HCOO* is,
14
again, between PBE and RPA.
3.4 Understand the kinetics of CO and CO2 hydrogenation based
on the analytical solutions to the microkinetic models
In Table 2, we �nd that TOFs also much depend on the choice of XC functionals. For
example, RPA TOFs are much smaller than PBE and HSE TOFs. One puzzle is that PBE
and HSE give similar TOFs to the CO pathway, which seems contradictory to the observation
in Fig. 2(a) that HSE predicts a much higher overall barrier for the CO hydrogenation.
To explain these observations, we solved the microkinetic models analytically by assum-
ing that all the reaction steps in Table 1 are at quasi-equilibrium except the rate-limiting
steps (reactions 4 and 11). For a reaction step at quasi-equilibrium, the coverages of its
reactants and products are related by the equilibrium constant of that reaction.106,111 These
assumptions are validated by the good agreement between the analytical solutions to the
TOFs and the TOFs obtained by numerically integrating the rate equations, as shown in
Table 2. This good agreement is, in fact, expected, since the degrees of rate control of these
rate-limiting steps are close to 100%.
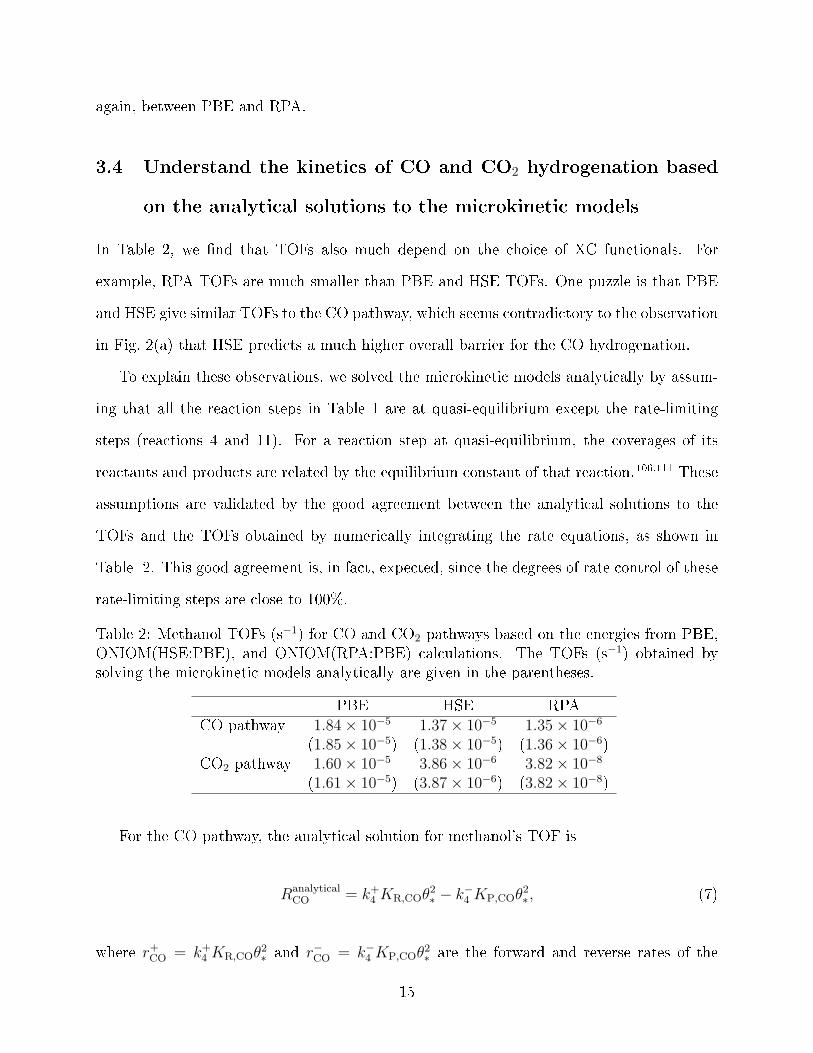
Table 2: Methanol TOFs (s−1) for CO and CO2 pathways based on the energies from PBE,ONIOM(HSE:PBE), and ONIOM(RPA:PBE) calculations. The TOFs (s−1) obtained bysolving the microkinetic models analytically are given in the parentheses.
PBE HSE RPACO pathway 1.84× 10⁻⁵ 1.37× 10⁻⁵ 1.35× 10⁻⁶
(1.85× 10⁻⁵) (1.38× 10⁻⁵) (1.36× 10⁻⁶)CO2 pathway 1.60× 10⁻⁵ 3.86× 10⁻⁶ 3.82× 10⁻⁸
(1.61× 10⁻⁵) (3.87× 10⁻⁶) (3.82× 10⁻⁸)
For the CO pathway, the analytical solution for methanol's TOF is
RanalyticalCO = k+
4 KR,COθ2∗ − k−4 KP,COθ
2∗, (7)
where r+CO = k+
4 KR,COθ2∗ and r−CO = k−4 KP,COθ
2∗ are the forward and reverse rates of the
15
rate-limiting step (reaction 4 in Table 1). KR,CO = K1K2K3 is the equilibrium constant
of the overall reaction CO(g) + H2(g) + 2* → HCO* + H*, which combines reactions 1,
2, and 3 in Table 1. KP,CO = 1/(K5K6K7K2) is the equilibrium constant of the overall
reaction H3COH(g) + * → H2(g) + H2CO* which combines reactions 2, 5, 6, and 7. Since
the intermediates before the rate-limiting step are at quasi-equilibrium, we have KR,COθ2∗ =
θHCOθH. Similarly, we have KP,COθ2∗ = θH3COHθ∗. A larger KR,CO (KP,CO) increases the
coverages of HCO* and H* (H2CO*), therefore promoting the forward (reverse) reaction of
the rate-limiting step. The free surface θ∗ is
θ−1∗ = K1 +
√K2 +
√K2K1K3
+1
K2K5K6K7
+1
K6K7K2
+1
K7
+ 1. (8)
For the CO2 pathway, the TOF of methanol is the di�erence between the forward and
reverse rates of the rate-limiting step (reaction 11 in Table 1)
RanalyticalCO2
= k+11KR,CO2θ
2∗ − k−11KP,CO2θ
2∗, (9)
where KR,CO2 = K3/22 K8K9K10 and KP,CO2 = 1/(K
3/22 K12K13K5K6K7K14) give the equilib-
rium constants of the overall reaction CO2(g) + 3/2H2(g) + 2* → HCOOH* + H* and the
overall reaction H3COH(g) + H2O(g) + * → H2COOH* + 3/2H2(g), respectively. The free
surface θ∗ is
θ−1∗ = K8 +
√K2 +K8
√K2K9 +K8K2K9K10
+1
K7
+1
K14
+1√
K2K6K7
+1√
K2K13K14
+1
K2K5K6K7
+1
K3/22 K12K13K5K6K7K14
+ 1. (10)
16
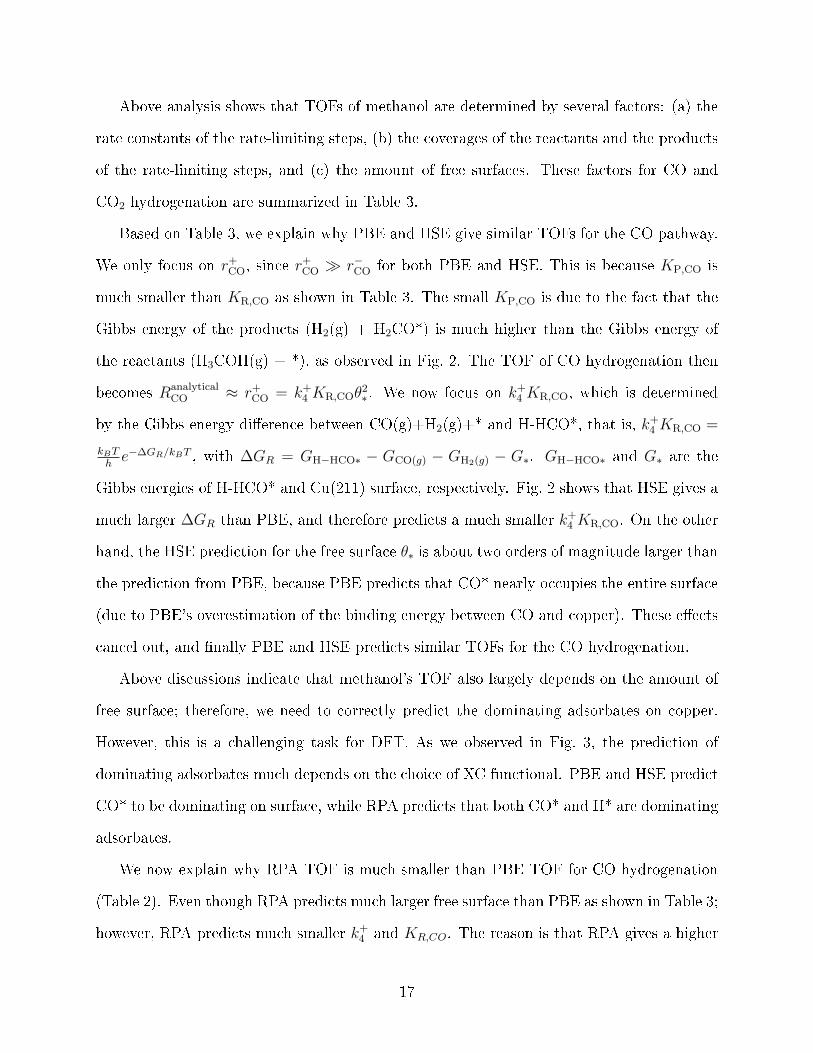
Above analysis shows that TOFs of methanol are determined by several factors: (a) the
rate constants of the rate-limiting steps, (b) the coverages of the reactants and the products
of the rate-limiting steps, and (c) the amount of free surfaces. These factors for CO and
CO2 hydrogenation are summarized in Table 3.
Based on Table 3, we explain why PBE and HSE give similar TOFs for the CO pathway.
We only focus on r+CO, since r
+CO � r−CO for both PBE and HSE. This is because KP,CO is
much smaller than KR,CO as shown in Table 3. The small KP,CO is due to the fact that the
Gibbs energy of the products (H2(g) + H2CO*) is much higher than the Gibbs energy of
the reactants (H3COH(g) + *), as observed in Fig. 2. The TOF of CO hydrogenation then
becomes RanalyticalCO ≈ r+
CO = k+4 KR,COθ
2∗. We now focus on k+
4 KR,CO, which is determined
by the Gibbs energy di�erence between CO(g)+H2(g)+* and H-HCO*, that is, k+4 KR,CO =
kBThe−∆GR/kBT , with ∆GR = GH−HCO∗ − GCO(g) − GH2(g) − G∗. GH−HCO∗ and G∗ are the
Gibbs energies of H-HCO* and Cu(211) surface, respectively. Fig. 2 shows that HSE gives a
much larger ∆GR than PBE, and therefore predicts a much smaller k+4 KR,CO. On the other
hand, the HSE prediction for the free surface θ∗ is about two orders of magnitude larger than
the prediction from PBE, because PBE predicts that CO* nearly occupies the entire surface
(due to PBE's overestimation of the binding energy between CO and copper). These e�ects
cancel out, and �nally PBE and HSE predicts similar TOFs for the CO hydrogenation.
Above discussions indicate that methanol's TOF also largely depends on the amount of
free surface; therefore, we need to correctly predict the dominating adsorbates on copper.
However, this is a challenging task for DFT. As we observed in Fig. 3, the prediction of
dominating adsorbates much depends on the choice of XC functional. PBE and HSE predict
CO* to be dominating on surface, while RPA predicts that both CO* and H* are dominating
adsorbates.
We now explain why RPA TOF is much smaller than PBE TOF for CO hydrogenation
(Table 2). Even though RPA predicts much larger free surface than PBE as shown in Table 3;
however, RPA predicts much smaller k+4 and KR,CO. The reason is that RPA gives a higher
17
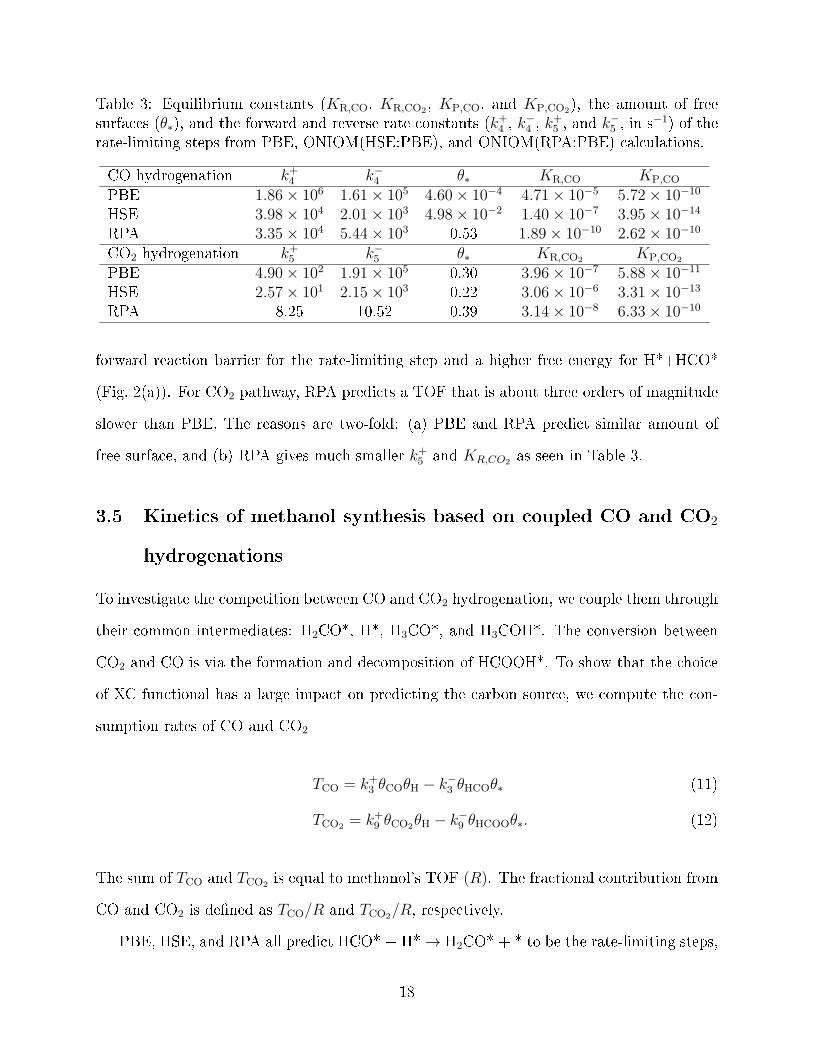
Table 3: Equilibrium constants (KR,CO, KR,CO2 , KP,CO, and KP,CO2), the amount of freesurfaces (θ∗), and the forward and reverse rate constants (k+
4 , k−4 , k
+5 , and k
−5 , in s−1) of the
rate-limiting steps from PBE, ONIOM(HSE:PBE), and ONIOM(RPA:PBE) calculations.
CO hydrogenation k+4 k−4 θ∗ KR,CO KP,CO
PBE 1.86× 10⁶ 1.61× 10⁵ 4.60× 10⁻⁴ 4.71× 10⁻⁵ 5.72× 10⁻¹⁰
HSE 3.98× 10⁴ 2.01× 10³ 4.98× 10⁻² 1.40× 10⁻⁷ 3.95× 10⁻¹⁴
RPA 3.35× 10⁴ 5.44× 10³ 0.53 1.89× 10⁻¹⁰ 2.62× 10⁻¹⁰
CO2 hydrogenation k+5 k−5 θ∗ KR,CO2 KP,CO2
PBE 4.90× 10² 1.91× 10⁵ 0.30 3.96× 10⁻⁷ 5.88× 10⁻¹¹
HSE 2.57× 101 2.15× 10³ 0.22 3.06× 10⁻⁶ 3.31× 10⁻¹³
RPA 8.25 10.52 0.39 3.14× 10⁻⁸ 6.33× 10⁻¹⁰
forward reaction barrier for the rate-limiting step and a higher free energy for H*+HCO*
(Fig. 2(a)). For CO2 pathway, RPA predicts a TOF that is about three orders of magnitude
slower than PBE. The reasons are two-fold: (a) PBE and RPA predict similar amount of
free surface, and (b) RPA gives much smaller k+5 and KR,CO2 as seen in Table 3.
3.5 Kinetics of methanol synthesis based on coupled CO and CO2
hydrogenations
To investigate the competition between CO and CO2 hydrogenation, we couple them through
their common intermediates: H2CO*, H*, H3CO*, and H3COH*. The conversion between
CO2 and CO is via the formation and decomposition of HCOOH*. To show that the choice
of XC functional has a large impact on predicting the carbon source, we compute the con-
sumption rates of CO and CO2
TCO = k+3 θCOθH − k−3 θHCOθ∗ (11)
TCO2 = k+9 θCO2θH − k−9 θHCOOθ∗. (12)
The sum of TCO and TCO2 is equal to methanol's TOF (R). The fractional contribution from
CO and CO2 is de�ned as TCO/R and TCO2/R, respectively.
PBE, HSE, and RPA all predict HCO* + H*→ H2CO* + * to be the rate-limiting steps,
18
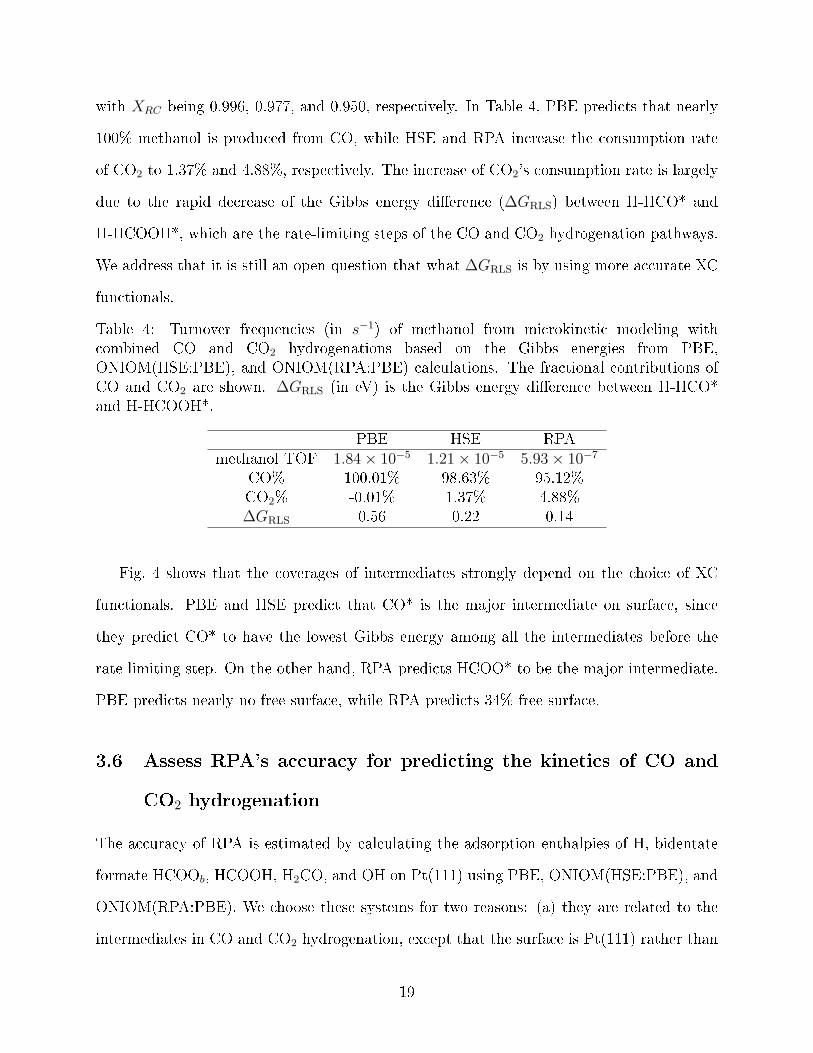
with XRC being 0.996, 0.977, and 0.950, respectively. In Table 4, PBE predicts that nearly
100% methanol is produced from CO, while HSE and RPA increase the consumption rate
of CO2 to 1.37% and 4.88%, respectively. The increase of CO2's consumption rate is largely
due to the rapid decrease of the Gibbs energy di�erence (∆GRLS) between H-HCO* and
H-HCOOH*, which are the rate-limiting steps of the CO and CO2 hydrogenation pathways.
We address that it is still an open question that what ∆GRLS is by using more accurate XC
functionals.
Table 4: Turnover frequencies (in s−1) of methanol from microkinetic modeling withcombined CO and CO2 hydrogenations based on the Gibbs energies from PBE,ONIOM(HSE:PBE), and ONIOM(RPA:PBE) calculations. The fractional contributions ofCO and CO2 are shown. ∆GRLS (in eV) is the Gibbs energy di�erence between H-HCO*and H-HCOOH*.
PBE HSE RPAmethanol TOF 1.84× 10⁻⁵ 1.21× 10⁻⁵ 5.93× 10⁻⁷
CO% 100.01% 98.63% 95.12%CO2% -0.01% 1.37% 4.88%∆GRLS 0.56 0.22 0.14
Fig. 4 shows that the coverages of intermediates strongly depend on the choice of XC
functionals. PBE and HSE predict that CO* is the major intermediate on surface, since
they predict CO* to have the lowest Gibbs energy among all the intermediates before the
rate-limiting step. On the other hand, RPA predicts HCOO* to be the major intermediate.
PBE predicts nearly no free surface, while RPA predicts 34% free surface.
3.6 Assess RPA's accuracy for predicting the kinetics of CO and
CO2 hydrogenation
The accuracy of RPA is estimated by calculating the adsorption enthalpies of H, bidentate
formate HCOOb, HCOOH, H2CO, and OH on Pt(111) using PBE, ONIOM(HSE:PBE), and
ONIOM(RPA:PBE). We choose these systems for two reasons: (a) they are related to the
intermediates in CO and CO2 hydrogenation, except that the surface is Pt(111) rather than
19
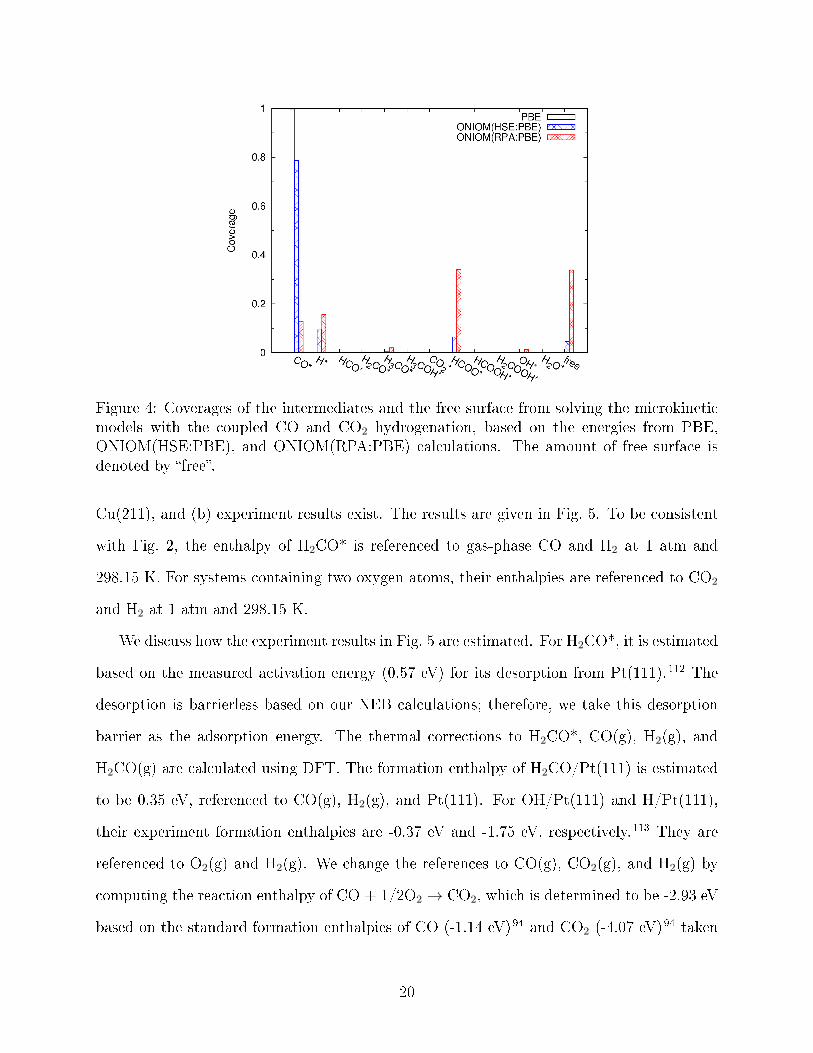
Figure 4: Coverages of the intermediates and the free surface from solving the microkineticmodels with the coupled CO and CO2 hydrogenation, based on the energies from PBE,ONIOM(HSE:PBE), and ONIOM(RPA:PBE) calculations. The amount of free surface isdenoted by �free�.
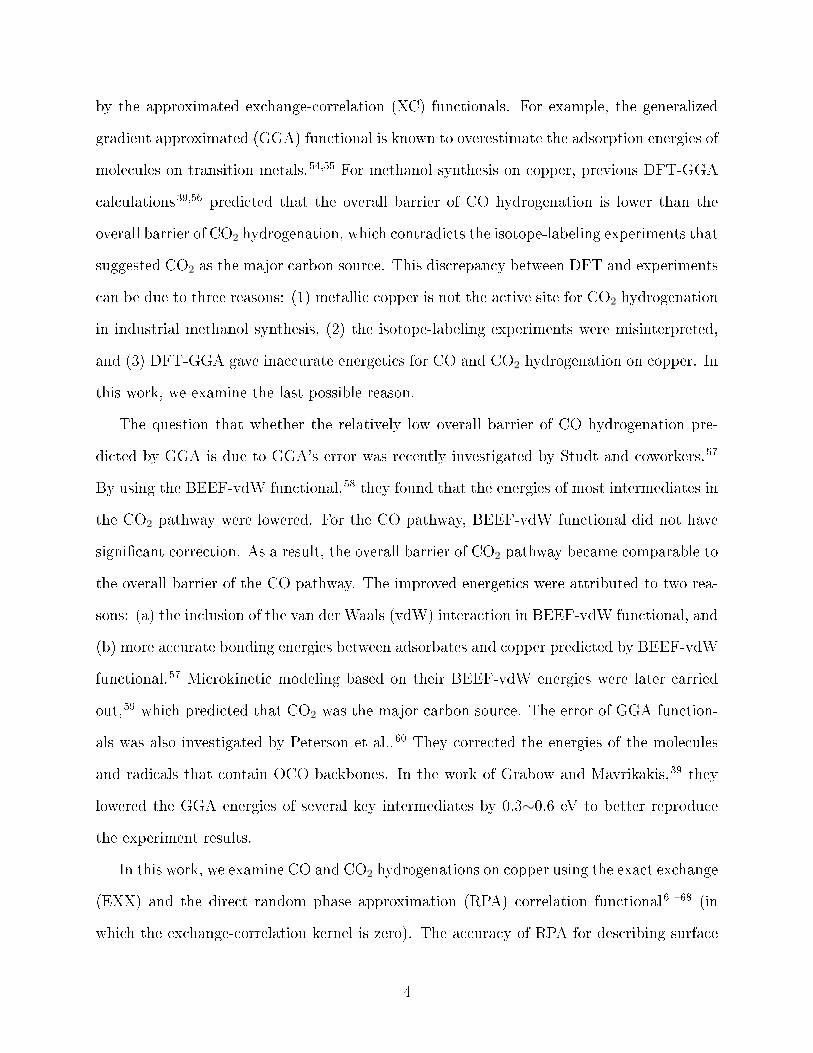
Cu(211), and (b) experiment results exist. The results are given in Fig. 5. To be consistent
with Fig. 2, the enthalpy of H2CO* is referenced to gas-phase CO and H2 at 1 atm and
298.15 K. For systems containing two oxygen atoms, their enthalpies are referenced to CO2
and H2 at 1 atm and 298.15 K.
We discuss how the experiment results in Fig. 5 are estimated. For H2CO*, it is estimated
based on the measured activation energy (0.57 eV) for its desorption from Pt(111).112 The
desorption is barrierless based on our NEB calculations; therefore, we take this desorption
barrier as the adsorption energy. The thermal corrections to H2CO*, CO(g), H2(g), and
H2CO(g) are calculated using DFT. The formation enthalpy of H2CO/Pt(111) is estimated
to be 0.35 eV, referenced to CO(g), H2(g), and Pt(111). For OH/Pt(111) and H/Pt(111),
their experiment formation enthalpies are -0.37 eV and -1.75 eV, respectively.113 They are
referenced to O2(g) and H2(g). We change the references to CO(g), CO2(g), and H2(g) by
computing the reaction enthalpy of CO + 1/2O2 → CO2, which is determined to be -2.93 eV
based on the standard formation enthalpies of CO (-1.14 eV)94 and CO2 (-4.07 eV)94 taken
20
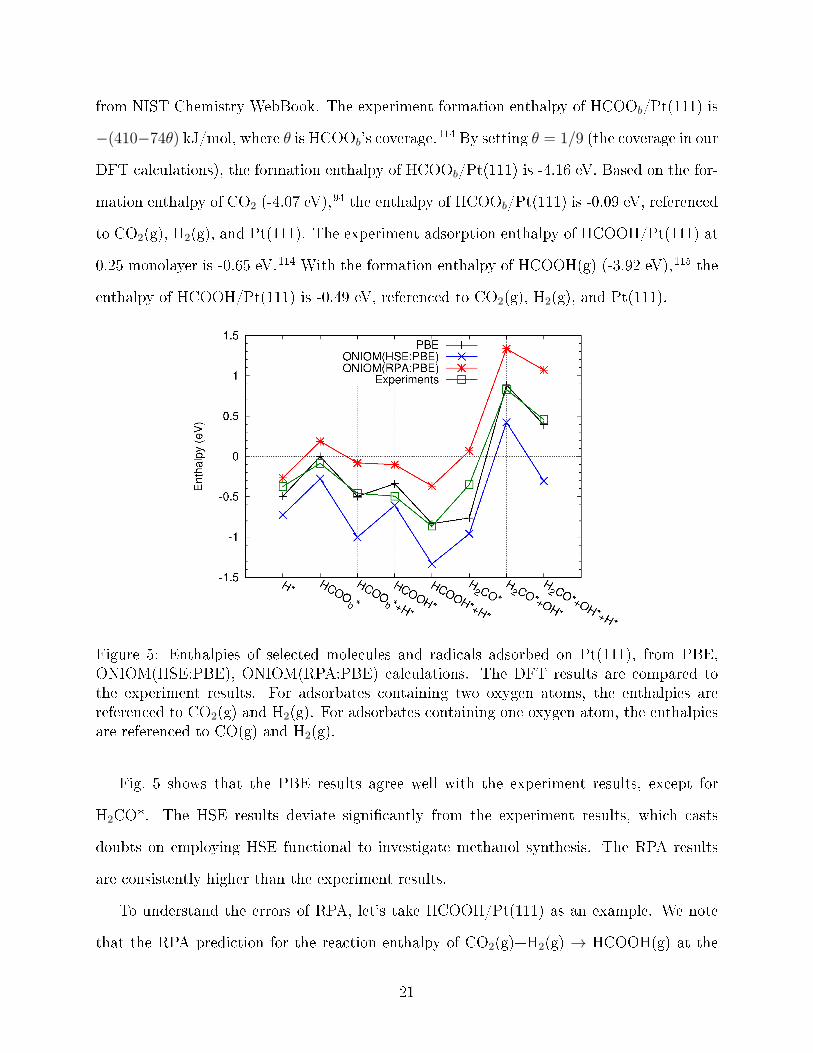
from NIST Chemistry WebBook. The experiment formation enthalpy of HCOOb/Pt(111) is
−(410−74θ) kJ/mol, where θ is HCOOb's coverage.114 By setting θ = 1/9 (the coverage in our
DFT calculations), the formation enthalpy of HCOOb/Pt(111) is -4.16 eV. Based on the for-
mation enthalpy of CO2 (-4.07 eV),94 the enthalpy of HCOOb/Pt(111) is -0.09 eV, referenced
to CO2(g), H2(g), and Pt(111). The experiment adsorption enthalpy of HCOOH/Pt(111) at
0.25 monolayer is -0.65 eV.114 With the formation enthalpy of HCOOH(g) (-3.92 eV),115 the
enthalpy of HCOOH/Pt(111) is -0.49 eV, referenced to CO2(g), H2(g), and Pt(111).
Figure 5: Enthalpies of selected molecules and radicals adsorbed on Pt(111), from PBE,ONIOM(HSE:PBE), ONIOM(RPA:PBE) calculations. The DFT results are compared tothe experiment results. For adsorbates containing two oxygen atoms, the enthalpies arereferenced to CO2(g) and H2(g). For adsorbates containing one oxygen atom, the enthalpiesare referenced to CO(g) and H2(g).
Fig. 5 shows that the PBE results agree well with the experiment results, except for
H2CO*. The HSE results deviate signi�cantly from the experiment results, which casts
doubts on employing HSE functional to investigate methanol synthesis. The RPA results
are consistently higher than the experiment results.
To understand the errors of RPA, let's take HCOOH/Pt(111) as an example. We note
that the RPA prediction for the reaction enthalpy of CO2(g)+H2(g) → HCOOH(g) at the
21
standard conditions is 0.13 eV, which agrees well with the experiment value 0.16 eV. There-
fore, the reason for RPA's underestimation of the enthalpies of HCOOH/Pt(111) is due to its
underestimation of the binding energy between HCOOH and Pt(111). This is a known short-
coming of RPA: RPA tends to underestimate binding energies.68,116�118 We also perform a
similar analysis on H2CO/Pt(111). The RPA reaction enthalpy of CO(g)+H2(g)→ H2CO(g)
at the standard conditions is 0.13 eV higher than the experiment value. Fig. 5 shows that
RPA underestimates the enthalpy of H2CO/Pt(111) by 0.42 eV. Combining these two, RPA
underestimates the binding energy between H2CO and Pt(111) by 0.29 eV (= 0.42− 0.13).
This, again, is due to the underbinding problem of RPA.
The above mentioned errors of RPA bring up the question: How much can we trust
the RPA predictions for the kinetics of methanol synthesis? Another question is that, since
PBE gives good predictions to all adsorbates except H2CO/Pt(111), shall we trust the ki-
netics of methanol synthesis predicted by PBE? The key di�erence between the RPA and
PBE predictions is whether CO2 contributes to the methanol synthesis on copper, which
largely depends on the relative energy between the transition states H-HCO/Cu(211) and H-
HCOOH/Cu(211). Therefore, in the following we focus on the energies of HCOOH+H/Pt(111)
and H2CO/Pt(111) which are the reactant and product associated with these two transition
states, except that the surface is Pt(111) rather than Cu(211).
The following discussions are based on the assumption that the errors of PBE and
RPA in predicting the energies of H2CO/Pt(111) and H+HCOOH/Pt(111) are similar with
their errors for predicting the energies of H-HCO/Cu(211) and H-HCOOH/Cu(211). Fig. 5
shows that PBE has no error cancellation between H+HCOOH/Pt(111) and H2CO/Pt(111).
PBE gives an accurate prediction to H+HCOOH/Pt(111); however, the PBE prediction for
H2CO/Pt(111) is−0.41 eV lower than the experiment. In Fig. 2, PBE predicts that the Gibbs
energy of H-HCOOH/Cu(211) is 0.56 eV higher than H-HCO/Cu(211) after the correction.
With the above assumption, we correct the PBE energies, and �nd that HCOOH-H/Cu(211)
is only 0.12 eV (= 0.56 − 0.41) higher than H-HCO/Cu(111). The corrected PBE results
22
suggest that CO2 hydrogenation is competitive.
On the other hand, Fig. 5 shows that RPA has a good error cancellation between
HCOOH+H/Pt(111) and H2CO/Pt(111): the RPA errors for HCOOH-H/Pt(111) and H2CO/Pt(111)
are 0.49 eV and 0.41 eV, respectively. In Fig. 2, RPA predicts that the Gibbs energy of H-
HCOOH/Cu(211) is 0.14 eV higher than H-HCO/Cu(211). Again, with the above assump-
tion, we can correct the RPA energies, and �nd that H-HCOOH/Cu(211) is only 0.06 eV
higher than H-HCO/Cu(211) after the correction. The corrected RPA results still suggest
that CO2 hydrogenation is competitive for methanol synthesis over Cu(211).
4 Conclusions
In this work, we investigated di�erent types of XC functionals for predicting the thermo-
dynamics and kinetics of methanol synthesis over copper. We showed that the kinetics of
methanol synthesis strongly depends on the choice of XC functionals, due to the presence of
competing reaction pathways (i.e., CO and CO2 hydrogenations). PBE predicted that the
surface is almost fully occupied by CO with nearly no free surface left, while RPA predicted
that the surface is largely occupied by formate with a large amount (34%) of free surface. It
is found that the turnover frequencies of methanol do not only depend on the overall barriers
of the reactions, but also depend on the amount of free surface. PBE predicted that CO
is the carbon source, which contradicts the previous isotope-labeling experiments that sug-
gested CO2 as the carbon source. PBE results, therefore, suggest that metallic copper is not
the active site for CO2 hydrogenation in industrial methanol synthesis. A di�erent picture is
given by RPA. RPA predicted that CO2 hydrogenation is also competitive, therefore suggest-
ing that metallic copper is still a possible active site for catalyzing CO2 hydrogenation. We
note that the reaction networks employed in this work is rather simpli�ed; therefore, future
modeling using more comprehensive reaction networks is required to resolve the mechanism
of methanol synthesis on copper.
23
We examined the accuracy of RPA by computing the adsorption energies of selected
molecules and radicals on Pt(111). We focused on the enthalpies of HCOOH+H/Pt(111)
and H2CO/Pt(111), which are closely related to the rate-limiting steps in methanol synthe-
sis, except that the substrate is Pt(111) rather than Cu(211). Their enthalpies predicted
by RPA are consistently higher than the benchmarks, which is attributed to RPA's under-
estimation of binding energies. Nevertheless, RPA has a good error cancellation between
HCOOH+H/Pt(111) and H2CO/Pt(111). By assuming that the similar error cancellation
exists for H-HCO/Cu(211) and H-HCOOH/Cu(211), RPA's prediction that CO2 hydrogena-
tion is completive may be true. However, we address that it is still an open question that
whether copper is the active site for catalyzing CO2 hydrogenation in industrial methanol
synthesis. To answer this question, further development of accurate and computationally
e�cient XC functional is required.
Supporting Information Available
Details of the rate equations for microkinetic modeling. This material is available free of
charge via the Internet at http://pubs.acs.org.
Acknowledgement
This work is supported by the Florida State University (start-up fund) and National Science
Foundation under CHE-1752769.
References
(1) Waugh, K. Methanol Synthesis. Catal. Today 1992, 15, 51 � 75.
(2) Hansen, P. L.; Wagner, J. B.; Helveg, S.; Rostrup-Nielsen, J. R.; Clausen, B. S.;
24
Topsøe, H. Atom-resolved imaging of dynamic shape changes in supported copper
nanocrystals. Science 2002, 295, 2053�2055.
(3) Bart, J.; Sneeden, R. Copper-zinc oxide-alumina methanol catalysts revisited. Catal.
Today 1987, 2, 1 � 124.
(4) Chinchen, G.; Waugh, K.; Whan, D. The activity and state of the copper surface in
methanol synthesis catalysts. Appl. Catal. 1986, 25, 101 � 107.
(5) Chinchen, G.; Denny, P.; Jennings, J.; Spencer, M.; Waugh, K. Synthesis of methanol.
Appl. Catal. 1988, 36, 1 � 65.
(6) Pan, W.; Cao, R.; Roberts, D.; Gri�n, G. Methanol synthesis activity of CuZnO
catalysts. J. Catal 1988, 114, 440 � 446.
(7) Burch, R.; Golunski, S. E.; Spencer, M. S. The role of copper and zinc oxide in
methanol synthesis catalysts. J. Chem. Soc., Faraday Trans. 1990, 86, 2683�2691.
(8) Burch, R.; Golunski, S. E.; Spencer, M. S. The role of hydrogen in methanol synthesis
over copper catalysts. Catal. Lett. 1990, 5, 55�60.
(9) Rasmussen, P.; Kazuta, M.; Chorkendor�, I. Synthesis of methanol from a mixture of
H2 and CO2 on Cu(100). Surf. Sci. 1994, 318, 267 � 280.
(10) Yoshihara, J.; Parker, S. C.; Schafer, A.; Campbell, C. T. Methanol synthesis and
reverse water-gas shift kinetics over clean polycrystalline copper. Catal. Lett. 1995,
31, 313�324.
(11) Ovesen, C.; Clausen, B.; Schiøtz, J.; Stoltze, P.; Topsøe, H.; Nørskov, J. K. Kinetic
implications of dynamical changes in catalyst morphology during methanol synthesis
over Cu/ZnO catalysts. Journal of Catalysis 1997, 168, 133�142.
25
(12) Jun, K.-W.; Shen, W.-J.; Rao, K. R.; Lee, K.-W. Residual sodium e�ect on the cat-
alytic activity of Cu/ZnO/Al2O3 in methanol synthesis from CO2 hydrogenation. Appl.
Catal., A 1998, 174, 231 � 238.
(13) Twigg, M. V.; Spencer, M. S. Deactivation of supported copper metal catalysts for
hydrogenation reactions. Appl. Catal., A 2001, 212, 161 � 174.
(14) Hong, Z. S.; Cao, Y.; Deng, J. F.; Fan, K. N. CO2 hydrogenation to methanol over
Cu/ZnO/Al2O3 catalysts prepared by a novel gel-network-coprecipitation method.
Catal. Lett. 2002, 82, 37�44.
(15) Baltes, C.; Vukojevi¢, S.; Schüth, F. Correlations between synthesis, precursor, and
catalyst structure and activity of a large set of CuO/ZnO/Al2O3 catalysts for methanol
synthesis. J. Catal. 2008, 258, 334�344.
(16) Lim, H. W.; Park, M. J.; Kang, S. H.; Chae, H. J.; Bae, J. W.; Jun, K. W. Modeling of
the kinetics for methanol synthesis using Cu/ZnO/Al2O3/ZrO2 catalyst: in�uence of
carbon dioxide during hydrogenation. Ind. Eng. Chem. Res. 2009, 48, 10448�10455.
(17) Yang, Y.; Evans, J.; Rodriguez, J. A.; White, M. G.; Liu, P. Fundamental stud-
ies of methanol synthesis from CO2 hydrogenation on Cu (111), Cu clusters, and
Cu/ZnO(0001). Phys. Chem. Chem. Phys. 2010, 12, 9909�9917.
(18) Inui, T.; Hara, H.; Takeguchi, T.; Kim, J.-B. Structure and function of Cu-based
composite catalysts for highly e�ective synthesis of methanol by hydrogenation of
CO2 and CO. Catal. Today 1997, 36, 25 � 32.
(19) Toyir, J.; de la Piscina, P. R.; Fierro, J. L. G.; Homs, N. Highly e�ective conversion
of CO2 to methanol over supported and promoted copper-based catalysts: in�uence
of support and promoter. Appl. Catal., B 2001, 29, 207�215.
26
(20) Sªoczy«ski, J.; Grabowski, R.; Olszewski, P.; Kozªowska, A.; Stoch, J.; La-
chowska, M.; Skrzypek, J. E�ect of metal oxide additives on the activity and sta-
bility of Cu/ZnO/ZrO2 catalysts in the synthesis of methanol from CO2 and H2. Appl.
Catal., A 2006, 310, 127�137.
(21) Clancy, P.; Breen, J. P.; Ross, J. R. The preparation and properties of coprecipitated
Cu-Zr-Y and Cu-Zr-La catalysts used for the steam reforming of methanol. Catal.
Today 2007, 127, 291 � 294.
(22) Millar, G. J.; Rochester, C. H.; Waugh, K. C. Evidence for the adsorption of molecules
at special sites located at copper/zinc oxide interfaces. Part 3.-Fourier-transform in-
frared study of methyl formate adsorption on reduced and oxidised Cu/ZnO/SiO2
catalysts. J. Chem. Soc., Faraday Trans. 1992, 88, 3497�3503.
(23) Bussche, K. V.; Froment, G. Nature of formate in methanol synthesis on
Cu/ZnO/Al2O3. Appl. Catal., A 1994, 112, 37 � 55.
(24) Bailie, J. E.; Rochester, C. H.; Millar, G. J. Spectroscopic evidence for adsorption
sites located at Cu/ZnO interfaces. Catal. Lett. 1995, 31, 333�340.
(25) Poels, E.; Brands, D. Modi�cation of Cu/ZnO/SiO2 catalysts by high temperature
reduction. Appl. Catal., A 2000, 191, 83 � 96.
(26) Herman, R.; Klier, K.; Simmons, G.; Finn, B.; Bulko, J.; Kobylinski, T. Catalytic
synthesis of methanol from COH2: I. Phase composition, electronic properties, and
activities of the Cu/ZnO/M2O3 catalysts. J. Catal 1979, 56, 407 � 429.
(27) Mehta, S.; Simmons, G.; Klier, K.; Herman, R. Catalytic synthesis of methanol from
COH2: II. Electron microscopy (TEM, STEM, microdi�raction, and energy dispersive
analysis) of the CuZnO and Cu/ZnO/Cr2O3 catalysts. J. Catal 1979, 57, 339�360.
27
(28) Spencer, M. The role of zinc oxide in Cu/ZnO catalysts for methanol synthesis and
the water-gas shift reaction. Top. Catal 1999, 8, 259�266.
(29) Fujitani, T.; Nakamura, I.; Uchijima, T.; Nakamura, J. The kinetics and mechanism
of methanol synthesis by hydrogenation of CO2 over a Zn-deposited Cu(111) surface.
Surf. Sci. 1997, 383, 285 � 298.
(30) Klier, K.; Chatikavanij, V.; Herman, R.; Simmons, G. Catalytic synthesis of methanol
from COH2. J. Catal 1982, 74, 343 � 360.
(31) Klier, K. Advances in Catalysis ; Elsevier, 1982; Vol. 31; pp 243�313.
(32) Lim, K. H.; Chen, Z. X.; Neyman, K. M.; Rösch, N. Comparative theoretical study of
formaldehyde decomposition on PdZn, Cu, and Pd surfaces. J. Phys. Chem. C 2006,
110, 14890�14897.
(33) Tang, Q. L.; Hong, Q. J.; Liu, Z. P. CO2 �xation into methanol at Cu/ZrO2 interface
from �rst principles kinetic Monte Carlo. J. Catal 2009, 263, 114 � 122.
(34) Chinchen, G.; Waugh, K. The chemical state of copper during methanol synthesis. J.
Catal 1986, 97, 280 � 283.
(35) Baussart, H.; Delobel, R.; Bras, M. L.; Maguer, D. L.; Leroy, J.-M. A macroscopic
study of Cu/Zn/Al catalyst for carbon dioxide hydrogenation. Appl. Catal. 1985, 14,
381 � 389.
(36) Vedage, G. A.; Himelfarb, P. B.; Simmons, G. W.; Klier, K. Solid State Chemistry in
Catalysis ; Chapter 19, pp 295�312.
(37) Graaf, G.; Stamhuis, E.; Beenackers, A. Kinetics of low-pressure methanol synthesis.
Chem. Eng. Sci. 1988, 43, 3185 � 3195.
28
(38) Calverley, E. M.; Smith, K. J. Kinetic model for alcohol synthesis over a promoted
copper/zinc oxide/chromium oxide (Cr2O3) catalyst. Ind. Eng. Chem. Res. 1992, 31,
792�803.
(39) Grabow, L. C.; Mavrikakis, M. Mechanism of methanol synthesis on Cu through CO2
and CO hydrogenation. ACS Catalysis 2011, 1, 365�384.
(40) Liu, G.; Willcox, D.; Garland, M.; Kung, H. The role of CO2 in methanol synthesis
on Cu/Zn oxide: An isotope labeling study. J. Catal 1985, 96, 251 � 260.
(41) Denise, B.; Sneeden, R.; Beguin, B.; Cheri�, O. Supported copper catalysts in the
synthesis of methanol: N2O-titrations. Appl. Catal. 1987, 30, 353 � 363.
(42) Jackson, S. D. Isotopic exchange of carbon dioxide and its interaction with carbon
monoxide over copper catalysts. J. Catal 1989, 115, 247 � 249.
(43) Denise, B.; Sneeden, R.; Hamon, C. Hydrocondensation of carbon dioxide: IV. J. Mol.
Catal. 1982, 17, 359 � 366.
(44) Chinchen, G.; Denny, P.; Parker, D.; Spencer, M.; Whan, D. Mechanism of methanol
synthesis from CO2/CO/H2 mixtures over copper/zinc oxide/alumina catalysts: use
of 14C-labelled reactants. Appl. Catal. 1987, 30, 333 � 338.
(45) Takagawa, M.; Ohsugi, M. Study on reaction rates for methanol synthesis from carbon
monoxide, carbon dioxide, and hydrogen. J. Catal 1987, 107, 161 � 172.
(46) Hansen, J. B.; Højlund Nielsen, P. E. In Handbook of Heterogeneous Catalysis ; Ertl, G.,
Knözinger, H., Schüth, F., Weitkamp, J., Eds.; Wiley-VCH Verlag GmbH & Co.
KGaA, 2008.
(47) Studt, F.; Behrens, M.; Kunkes, E. L.; Thomas, N.; Zander, S.; Tarasov, A.; Schu-
mann, J.; Frei, E.; Varley, J. B.; Abild-Pedersen, F. et al. The mechanism of CO
29
and CO2 hydrogenation to methanol over Cu-based catalysts. ChemCatChem 2015,
7, 1105�1111.
(48) Sun, Q.; Liu, C. W.; Pan, W.; Zhu, Q. M.; Deng, J. F. In situ IR studies on the mech-
anism of methanol synthesis over an ultra�ne Cu/ZnO/Al2O3 catalyst. Appl Catal.,
A 1998, 171, 301 � 308.
(49) Sun, Q. On the catalytic mechanism of Cu/ZnO/Al2O3 for COx hydrogenation. Nat-
ural Gas Conversion VII: Proceedings of the 7th Natural Gas Conversion Symposium.
Dalian, China, June 2004.
(50) Kagan, Y. B.; Liberov, L. G.; Slivinski, E. V.; Lotkev, S. M.; Liu, G. I.; Ro-
zovskii, A. Y.; Bashkirov, A. N. Dokl. Akad. Nauk. SSSR 1975, 221, 1093.
(51) Chinchen, G.; Denny, P.; Parker, D.; Short, D.; Spencer, M.; Waugh, K.; Whan, D.
Prepr. Amer. Chem. Soc. Div. Fuel Chem. 1984, 29, 178.
(52) Hohenberg, P.; Kohn, W. Inhomogeneous electron gas. Phys. Rev. 1964, 136, B864�
B871.
(53) Kohn, W.; Sham, L. J. Self-consistent equations including exchange and correlation
e�ects. Phys. Rev. 1965, 140, A1133�A1138.
(54) Hammer, B.; Hansen, L. B.; Nørskov, J. K. Improved adsorption energetics within
density-functional theory using revised Perdew-Burke-Ernzerhof functionals. Phys.
Rev. B 1999, 59, 7413�7421.
(55) Feibelman, P. J.; Hammer, B.; Nørskov, J. K.; Wagner, F.; Sche�er, M.; Stumpf, R.;
Watwe, R.; Dumesic, J. The CO/Pt (111) puzzle. J. Phys. Chem. B 2001, 105, 4018�
4025.
(56) Behrens, M.; Studt, F.; Kasatkin, I.; Kühl, S.; Hävecker, M.; Abild-Pedersen, F.;
30
Zander, S.; Girgsdies, F.; Kurr, P.; Kniep, B.-L. et al. The active site of methanol
synthesis over Cu/ZnO/Al2O3 industrial catalysts. Science 2012, 336, 893�897.
(57) Studt, F.; Abild-Pedersen, F.; Varley, J. B.; Nørskov, J. K. CO and CO2 hydrogenation
to methanol calculated using the BEEF-vdW functional. Catal. Lett. 2013, 143, 71�
73.
(58) Wellendor�, J.; Lundgaard, K. T.; Møgelhøj, A.; Petzold, V.; Landis, D. D.;
Nørskov, J. K.; Bligaard, T.; Jacobsen, K. W. Density functionals for surface sci-
ence: Exchange-correlation model development with Bayesian error estimation. Phys.
Rev. B 2012, 85, 235149.
(59) Van Rensburg, W. J.; Petersen, M. A.; Datt, M. S.; den Berg, J.-A.; Helden, P.
On the kinetic interpretation of DFT-derived energy pro�les: Cu-catalyzed methanol
synthesis. Catal. Lett. 2015, 2, 559�568.
(60) Peterson, A. A.; Abild-Pedersen, F.; Studt, F.; Rossmeisl, J.; Nørskov, J. K. How
copper catalyzes the electroreduction of carbon dioxide into hydrocarbon fuels. Energy
Environ. Sci. 2010, 3, 1311�1315.
(61) Bohm, D.; Pines, D. A collective description of electron interactions. I. magnetic In-
teractions. Phys. Rev. 1951, 82, 625�634.
(62) McLachlan, A. D.; Ball, M. A. Time-dependent Hartree-Fock theory for molecules.
Rev. Mod. Phys. 1964, 36, 844�855.
(63) Langreth, D. C.; Perdew, J. P. The exchange-correlation energy of a metallic surface.
Solid State Commun. 1975, 17, 1425�1429.
(64) Gunnarsson, O.; Lundqvist, B. I. Exchange and correlation in atoms, molecules, and
solids by the spin-density-functional formalism. Phys. Rev. B 1976, 13, 4274�4298.
31
(65) Langreth, D. C.; Perdew, J. P. Exchange-correlation energy of a metallic surface wave-
vector analysis. Phys. Rev. B 1977, 15, 2884.
(66) Andersson, Y.; Langreth, D. C.; Lundqvist, B. I. van der Waals interactions in density-
functional theory. Phys. Rev. Lett. 1996, 76, 102�105.
(67) Dobson, J. F.; Wang, J. Successful test of a seamless van der Waals density functional.
Phys. Rev. Lett. 1999, 82, 2123�2126.
(68) Furche, F. Molecular tests of the random phase approximation to the exchange-
correlation energy functional. Phys. Rev. B 2001, 64, 195120.
(69) Schimka, L.; Harl, J.; Stroppa, A.; Grüneis, A.; Marsman, M.; Mittendorfer, F.;
Kresse, G. Accurate surface and adsorption energies from many-body perturbation
theory. Nature Materials 2010, 9, 741�744.
(70) Karlický, Franti²ek and Lazar, Petr and Dubecký, Matu² and Otyepka, Michal, Ran-
dom phase approximation in surface chemistry: Water splitting on iron. J. Chem.
Theory Comput. 2013, 9, 3670�3676.
(71) Bao, J. L.; Yu, H. S.; Duanmu, K.; Makeev, M. A.; Xu, X.; Truhlar, D. G. Density
functional theory of the water splitting reaction on Fe(0): comparison of local and
nonlocal correlation functionals. ACS Catalysis 2015, 5, 2070�2080.
(72) Perdew, J. P.; Burke, K.; Ernzerhof, M. Generalized gradient approximation made
simple. Phys. Rev. Lett. 1996, 77, 3865.
(73) Heyd, J.; Scuseria, G. E.; Ernzerhof, M. Hybrid functionals based on a screened
Coulomb potential. J. Chem. Phys. 2003, 118, 8207�8215.
(74) Krukau, A. V.; Vydrov, O. A.; Izmaylov, A. F.; Scuseria, G. E. In�uence of the
exchange screening parameter on the performance of screened hybrid functionals. The
Journal of Chemical Physics 2006, 125, 224106.
32
(75) Dumesic, J. A.; Rudd, D. F.; Aparicio, L. M.; Rekoske, J. E.; Treviño, A. A. The
microkinetics of heterogeneous catalysis ; ACS Professional Reference Book, American
Chemical Society, Washington, DC, 1993; p 315.
(76) Frisch, M. J.; Trucks, G. W.; Schlegel, H. B.; Scuseria, G. E.; Robb, M. A.; Cheese-
man, J. R.; Scalmani, G.; Barone, V.; Petersson, G. A.; Nakatsuji, H. et al. Gaussian 09
Revision E.01. Gaussian Inc. Wallingford CT 2009.
(77) Perdew, J. P.; Wang, Y. Accurate and simple analytic representation of the electron-
gas correlation energy. Physical Review B 1992, 45, 13244�13249.
(78) Verma, P.; Truhlar, D. G. HLE16: A local Kohn-Sham gradient approximation with
good performance for semiconductor band gaps and molecular excitation energies. The
Journal of Physical Chemistry Letters 2017, 8, 380�387.
(79) Tao, J.; Perdew, J. P.; Staroverov, V. N.; Scuseria, G. E. Climbing the density func-
tional ladder: nonempirical meta�generalized gradient approximation designed for
molecules and solids. Physical Review Letters 2003, 91, 146401.
(80) Perdew, J. P.; Ruzsinszky, A.; Csonka, G. I.; Constantin, L. A.; Sun, J. Workhorse
semilocal density functional for condensed matter physics and quantum chemistry.
Physical Review Letters 2009, 103, 026403.
(81) Perdew, J. P.; Ruzsinszky, A.; Csonka, G. I.; Constantin, L. A.; Sun, J. Erratum:
workhorse semilocal density functional for condensed matter physics and quantum
chemistry [Phys. Rev. Lett.103, 026403 (2009)]. Physical Review Letters 2011, 106,
179902.
(82) Sun, J.; Ruzsinszky, A.; Perdew, J. Strongly constrained and appropriately normed
semilocal density functional. Physical Review Letters 2015, 115, 036402.
33
(83) Verma, P.; Truhlar, D. G. HLE17: An improved local exchange-correlation functional
for computing semiconductor band gaps and molecular excitation energies. The Jour-
nal of Physical Chemistry C 2017, 121, 7144�7154.
(84) Zhao, Y.; Truhlar, D. G. A new local density functional for main-group thermochem-
istry, transition metal bonding, thermochemical kinetics, and noncovalent interactions.
The Journal of Chemical Physics 2006, 125, 194101.
(85) Perdew, J. P.; Ernzerhof, M.; Burke, K. Rationale for mixing exact exchange with
density functional approximations. The Journal of Chemical Physics 1996, 105, 9982�
9985.
(86) Becke, A. D. Density-functional thermochemistry. III. The role of exact exchange. The
Journal of Chemical Physics 1993, 98, 5648�5652.
(87) Kresse, G.; Hafner, J. Ab initio molecular dynamics for liquid metals. Phys. Rev. B
1993, 47, 558.
(88) Kresse, G.; Hafner, J. Ab initio molecular-dynamics simulation of the liquid-metal�
amorphous-semiconductor transition in germanium. Phys. Rev. B 1994, 49, 14251.
(89) Kresse, G.; Furthmüller, J. E�ciency of ab-initio total energy calculations for metals
and semiconductors using a plane-wave basis set. Comput. Mater. Sci. 1996, 6, 15�50.
(90) Kresse, G.; Furthmüller, J. E�cient iterative schemes for ab initio total-energy calcu-
lations using a plane-wave basis set. Phys. Rev. B 1996, 54, 11169.
(91) Kresse, G.; Joubert, D. From ultrasoft pseudopotentials to the projector augmented-
wave method. Phys. Rev. B 1999, 59, 1758.
(92) Dunning Jr, T. H. Gaussian basis sets for use in correlated molecular calculations. I.
The atoms boron through neon and hydrogen. J. Chem. Phys. 1989, 90, 1007�1023.
34
(93) Linstrom, P., Mallard, W., Eds. NIST Chemistry WebBook, NIST Standard Reference
Database Number 69 ; National Institute of Standards and Technology, Gaithersburg
MD, 20899, retrieved January 16, 2018.
(94) Cox, J.; Wagman, D.; Medvedev, V. CODATA Key Values for Thermodynamics ;
Hemisphere Publishing Corp., New York, 1984.
(95) Giannozzi, P.; Baroni, S.; Bonini, N.; Calandra, M.; Car, R.; Cavazzoni, C.;
Ceresoli, D.; Chiarotti, G. L.; Cococcioni, M.; Dabo, I. et al. QUANTUM ESPRESSO:
a modular and open-source software project for quantum simulations of materials. J.
Phys. Condens. Matter 2009, 21, 395502.
(96) Monkhorst, H. J.; Pack, J. D. Special points for Brillouin-zone integrations. Phys. Rev.
B 1976, 13, 5188.
(97) Weinan, E.; Ren, W.; Vanden-Eijnden, E. String method for the study of rare events.
Phys. Rev. B 2002, 66, 052301.
(98) Weinan, E.; Ren, W.; Vanden-Eijnden, E. Simpli�ed and improved string method
for computing the minimum energy paths in barrier-crossing events. J. Chem. Phys.
2007,
(99) Mills, G.; Jónsson, H. Quantum and thermal e�ects in H2 dissociative adsorption:
Evaluation of free energy barriers in multidimensional quantum systems. Phys. Rev.
Lett. 1994, 72, 1124�1127.
(100) Mills, G.; Jónsson, H.; Schenter, G. K. Reversible work transition state theory: Ap-
plication to dissociative adsorption of hydrogen. Surf. Sci. 1995, 324, 305 � 337.
(101) Jónsson, H.; Mills, G.; Jacobsen, K. W. Classical and quantum dynamics in condensed
phase simulations ; World Scienti�c, 1998; pp 385�404.
35
(102) Henkelman, G.; Uberuaga, B. P.; Jónsson, H. A climbing image nudged elastic band
method for �nding saddle points and minimum energy paths. J. Chem. Phys. 2000,
113, 9901�9904.
(103) Svensson, M.; Humbel, S.; Froese, R. D.; Matsubara, T.; Sieber, S.; Morokuma, K.
ONIOM: A multilayered integrated MO+MM method for geometry optimizations and
single point energy predictions. A test for Diels-Alder reactions and Pt(P(t-Bu)3)2+H2
oxidative addition. J. Phys. Chem. 1996, 100, 19357�19363.
(104) Kaltak, M.; Klime², J.; Kresse, G. Low scaling algorithms for the random phase ap-
proximation: Imaginary time and Laplace transformations. Journal of chemical theory
and computation 2014, 10, 2498�2507.
(105) Fowler, R.; Guggenheim, E. A. Statistical Thermodynamics ; Cambridge Univ. Press,
Cambridge, England, 1960.
(106) Stoltze, P.; Nørskov, J. Bridging the pressure gap between ultrahigh-vacuum surface
physics and high-pressure catalysis. Phys. Rev. Lett. 1985, 55, 2502.
(107) MATLAB version R2017a. The MathWorks, Inc., Natick, Massachusetts, United
States.
(108) Campbell, C. T. Finding the rate-determining step in a mechanism: comparing De-
Donder relations with the �degree of rate control�. J. Catal 2001, 204, 520 �
524.
(109) Wellendor�, J.; Silbaugh, T. L.; Garcia-Pintos, D.; Nørskov, J. K.; Bligaard, T.;
Studt, F.; Campbell, C. T. A benchmark database for adsorption bond energies to
transition metal surfaces and comparison to selected DFT functionals. Surf. Sci. 2015,
640, 36 � 44, Reactivity Concepts at Surfaces: Coupling Theory with Experiment.
36
(110) Duanmu, K.; Truhlar, D. G. Validation of density functionals for adsorption energies
on transition metal surfaces. Journal of Chemical Theory and Computation 2017, 13,
835�842.
(111) Stoltze, P. Surface science as the basis for the understanding of the catalytic synthesis
of ammonia. Phys. Scr. 1987, 36, 824.
(112) Abbas, N. M.; Madix, R. J. The e�ects of structured overlayers of sulfur on the kinetics
and mechanism of simple reactions on Pt (111): I. Formaldehyde decomposition. Solid
State Commun. 1981, 7, 241�275.
(113) Karp, E. M.; Campbell, C. T.; Studt, F.; Abild-Pedersen, F.; Nørskov, J. K. Energetics
of oxygen adatoms, hydroxyl species and water dissociation on Pt(111). J. Phys. Chem.
C 2012, 116, 25772�25776.
(114) Silbaugh, T. L.; Karp, E. M.; Campbell, C. T. Energetics of formic acid conversion
to adsorbed formates on Pt (111) by transient calorimetry. J. Am. Chem. Soc. 2014,
136, 3964�3971.
(115) Guthrie, J. P. Hydration of carboxamides. Evaluation of the free energy change for
addition of water to acetamide and formamide derivatives. J. Am. Chem. Soc. 1974,
96, 3608�3615.
(116) Harl, J.; Kresse, G. Accurate bulk properties from approximate many-body techniques.
Phys. Rev. Lett. 2009, 103, 056401.
(117) Ren, X.; Rinke, P.; Sche�er, M. Exploring the random phase approximation: Appli-
cation to CO adsorbed on Cu (111). Phys. Rev. B 2009, 80, 045402.
(118) Harl, J.; Schimka, L.; Kresse, G. Assessing the quality of the random phase approx-
imation for lattice constants and atomization energies of solids. Phys. Rev. B 2010,
81, 115126.
37
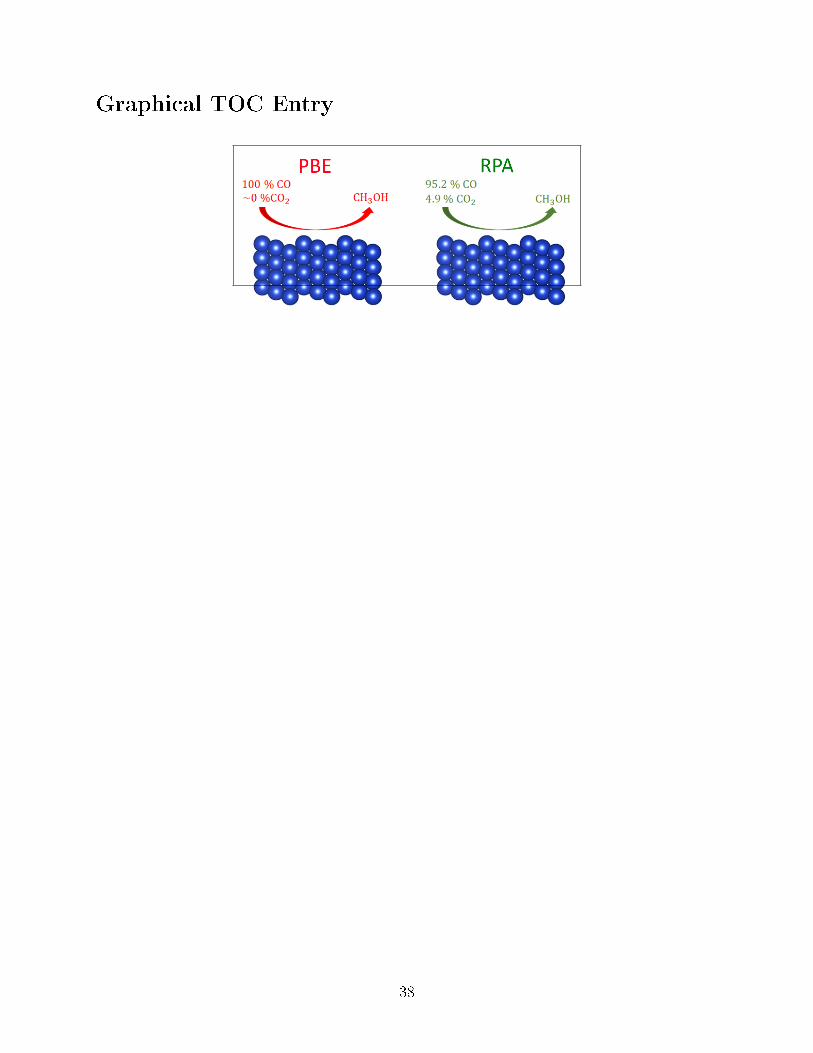
Graphical TOC Entry
38