Embed Size (px)
Citation preview
HAL Id: hal-00577333https://hal.archives-ouvertes.fr/hal-00577333
Submitted on 17 Mar 2011
HAL is a multi-disciplinary open accessarchive for the deposit and dissemination of sci-entific research documents, whether they are pub-lished or not. The documents may come fromteaching and research institutions in France orabroad, or from public or private research centers.
L’archive ouverte pluridisciplinaire HAL, estdestinée au dépôt et à la diffusion de documentsscientifiques de niveau recherche, publiés ou non,émanant des établissements d’enseignement et derecherche français ou étrangers, des laboratoirespublics ou privés.
Accumulation of trace elements in cattle from rural andindustrial areas in Belgium
Nadia Waegeneers, Jean-Christophe Pizzolon, Michel Hoenig, Ludwig deTemmerman
To cite this version:Nadia Waegeneers, Jean-Christophe Pizzolon, Michel Hoenig, Ludwig de Temmerman. Accumulationof trace elements in cattle from rural and industrial areas in Belgium. Food Additives and Contami-nants, 2009, 26 (03), pp.326-332. �10.1080/02652030802429096�. �hal-00577333�
For Peer Review O
nly
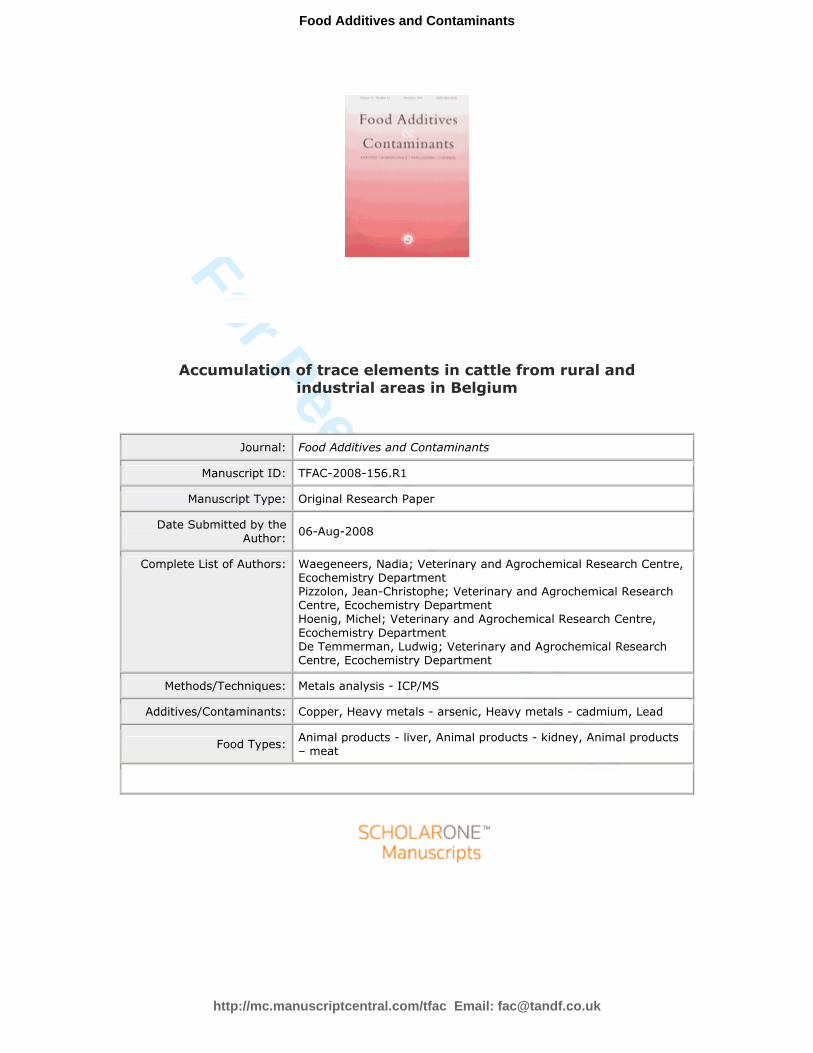
Accumulation of trace elements in cattle from rural and industrial areas in Belgium
Journal: Food Additives and Contaminants
Manuscript ID: TFAC-2008-156.R1
Manuscript Type: Original Research Paper
Date Submitted by the Author:
06-Aug-2008
Complete List of Authors: Waegeneers, Nadia; Veterinary and Agrochemical Research Centre, Ecochemistry Department Pizzolon, Jean-Christophe; Veterinary and Agrochemical Research Centre, Ecochemistry Department Hoenig, Michel; Veterinary and Agrochemical Research Centre,
Ecochemistry Department De Temmerman, Ludwig; Veterinary and Agrochemical Research Centre, Ecochemistry Department
Methods/Techniques: Metals analysis - ICP/MS
Additives/Contaminants: Copper, Heavy metals - arsenic, Heavy metals - cadmium, Lead
Food Types: Animal products - liver, Animal products - kidney, Animal products – meat
http://mc.manuscriptcentral.com/tfac Email: [email protected]
Food Additives and Contaminants
For Peer Review O
nly
1
Accumulation of trace elements in cattle from rural and industrial
areas in Belgium
N. Waegeneers∗, J.-C. Pizzolon, M. Hoenig & L. De Temmerman
Veterinary and Agrochemical Research Centre (VAR-CODA-CERVA), Ecochemistry
Department, Leuvensesteenweg 17, B-3080 Tervuren (Belgium)
∗ Corresponding author. E-mail: [email protected]
Page 1 of 26
http://mc.manuscriptcentral.com/tfac Email: [email protected]
Food Additives and Contaminants
123456789101112131415161718192021222324252627282930313233343536373839404142434445464748495051525354555657585960
For Peer Review O
nly
2
Abstract
Trace element concentrations were determined in meat, kidney and liver tissue of
cattle, which had resided more than 18 months in areas historically contaminated
by emissions from the non-ferrous metal industry or in regions with normal
background metal contamination levels in Belgium. Trace element levels were
determined by inductively coupled plasma-mass spectrometry. Lead, arsenic and
cadmium concentrations in meat were low for all cattle. The concentrations in
kidneys were respectively 1.8-, 2.2- and 2.5-fold higher in cattle from the
contaminated areas compared to animals from reference areas. The European
maximum level for cadmium in kidney was exceeded by 75% of the kidneys from
contaminated areas and 47% of the kidneys from reference areas. Lead, arsenic
and cadmium concentrations in bovine livers from contaminated areas were
increased by about a factor of 2.3. Zinc levels in livers and kidneys were within
normal ranges, but 20% higher in the contaminated areas compared to reference
areas. Copper levels in livers were high in all areas. Dairy cattle accumulated
significantly higher levels of cadmium in kidneys and of lead in liver and kidneys
than did beef cattle.
Keywords : cadmium, lead, arsenic, zinc, copper, kidney, liver, meat
Page 2 of 26
http://mc.manuscriptcentral.com/tfac Email: [email protected]
Food Additives and Contaminants
123456789101112131415161718192021222324252627282930313233343536373839404142434445464748495051525354555657585960
For Peer Review O
nly
3
Introduction
Industrial and agricultural processes have resulted in the release of toxic trace elements
into the environment, although for some specific elements relatively high concentrations
can naturally occur in the soil. Cadmium, lead and arsenic are causing most concern
because of their transfer through the food chain, bearing a potential risk to animals and
humans (Friberg et al., 1979; López-Alonso et al., 2002). The major sources of toxic
trace elements in agricultural soils include atmospheric deposition (De Temmerman et
al. 2003), animal manure, agrochemicals and mineral fertilizers (Nicholson et al., 1999).
Cattle originating from farms located within a 20-km radius around zinc refinery plants
in the Netherlands, had 2.5 times higher average cadmium levels and 1.5 times higher
average lead levels in organs when compared to controls (Spierenburg et al., 1988).
Cadmium and lead levels in calves from a polluted area in northern Spain, were
significantly higher than those in calves raised in a rural area, whereas arsenic levels in
no case differed between calves from both areas (Miranda et al., 2005). In Belgium,
some rural areas have been contaminated by emissions of the non-ferrous metal industry
(Lauwerys et al., 1990). This has led to increased trace element levels in soils and
humans (Staessen et al., 1994; Cornelis et al., 2006). Trace element concentrations in
tissues of animals raised in these regions have, however, not yet been studied.
The objective of this study was to determine toxic and trace element concentrations in
tissues of cattle that resided for more than 18 months in areas close to non-ferrous metal
plants, and to compare the results with cattle from areas at ambient metal levels in the
environment.
Page 3 of 26
http://mc.manuscriptcentral.com/tfac Email: [email protected]
Food Additives and Contaminants
123456789101112131415161718192021222324252627282930313233343536373839404142434445464748495051525354555657585960
For Peer Review O
nly
4
Materials and methods
Sampling
Kidneys, livers and muscle tissue of bovine animals were sampled at random by the
Belgium Federal Agency for the Safety of the Food Chain (FASFC) in 2005. The
samples were taken as part of the official control program of the FASFC in three
contaminated areas and in regions with normal background metal levels in the
environment, which will be further called the reference area. The contaminated areas
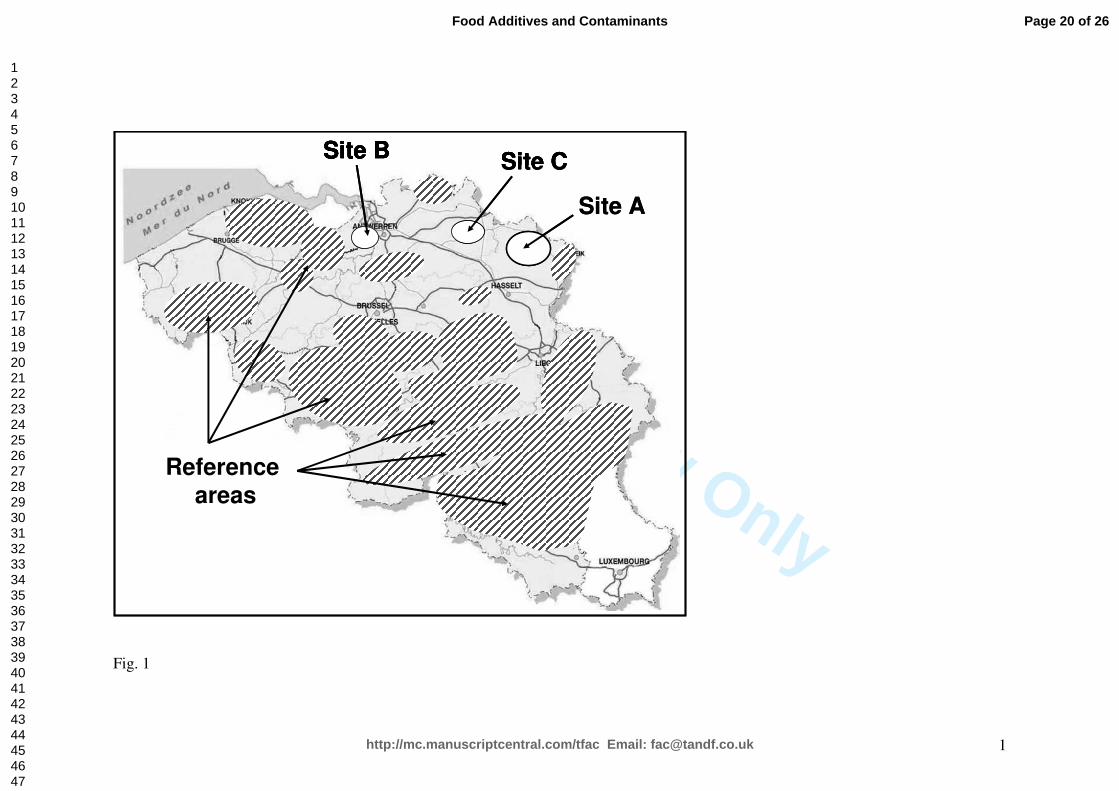
were (i) site A - a rural area in the north-eastern part of the Kempen region near three
primary zinc smelters, of which one has been closed since the 1970s, (ii) site B - a rural
area south of the city of Antwerp near a precious metals refining facility, which
processes secondary raw materials and wastes to extract and refine non-ferrous metals
such as lead, copper and precious metals, and (iii) site C - a rural area in the south of the
Antwerp Kempen region near a copper refining facility and a cobalt production plant
(Figure 1). The so-called reference area consists of several rural areas throughout
Belgium, away from point sources of toxic and trace elements. Belgium is divided in 10
major agricultural regions, from which seven were included in the current research
(Zandstreek, Zandleemstreek, Leemstreek, Kempen, Weidestreek, Condroz and
Ardennen). The division is based on differences in soil geochemical properties.
[insert Figure 1 about here]
Besides sites A, B & C there are other contaminated areas in Belgium, but no samples
were taken in those areas because of the their negligible cattle or milk production
activities. The number of samples taken by the FASFC was determined in the official
Page 4 of 26
http://mc.manuscriptcentral.com/tfac Email: [email protected]
Food Additives and Contaminants
123456789101112131415161718192021222324252627282930313233343536373839404142434445464748495051525354555657585960
For Peer Review O
nly
5
control program. The methodology developed for the program is based on risk
evaluation, statistical tools and current scientific knowledge (Maudoux et al., 2006). In
total, 99 animals from the reference area and 53 animals from the contaminated areas
were investigated. Each bovine animal in Belgium is obligatory marked by an ear tag
and has a bovine passport. Together with each sample, a copy of the passport was
received, containing information on the date of birth, sex and type of the animal and on
the farms where the animal resided. Farms where the animals had resided for more than
18 months, were contacted and the farmers were asked to further participate voluntarily.
A questionnaire was filled out with the farmers, rendering information about, amongst
others, the feed supplied to the animals. In total, 19 farmers in the reference area
(covering 20 animals) and 34 farmers in the contaminated areas (covering 38 animals)
were visited.
Analytical methods
The animal tissues were sampled by officially appointed veterinarians and according to
the rules outlined in the control program of the FASFC. The animal tissues were
immediately deep frozen and stored in a freezer until analysis. At the time of analysis,
the tissues were partially thawed and mixed in a home mixer to homogenize the
samples. Consequently, the kidney cortex and medulla, which contain unequal trace
element concentrations, were homogeneously mixed and metal concentrations are
expressed on the whole organ. For each tissue, two homogenized sub-samples were
mineralised by acid digestion (nitric acid) in pressure vessels of an X-PRESS
microwave digestion system (CEM Corporation, Matthews, NC, USA). Trace element
concentrations in all digests were quantified by inductively coupled plasma-mass
Page 5 of 26
http://mc.manuscriptcentral.com/tfac Email: [email protected]
Food Additives and Contaminants
123456789101112131415161718192021222324252627282930313233343536373839404142434445464748495051525354555657585960
For Peer Review O
nly
6
spectrometry (ICP-MS, VG PQ-ExCell, TJA, US). Each batch of 20 samples
additionally included one procedure blank, one certified reference material (IAEA-407
Fish tissue) and one laboratory control material. In case of deviations from a set of
common criteria for tolerable variations of blanks, and for values obtained for the
reference materials, the analyses in a batch had to be repeated. The analyses of As, Cd
and Pb in meat and organs were performed under accreditation, following the 17025
ISO norm. The limit of quantification (LOQ) for the analyzed trace elements was
calculated as 10 times the standard deviation of 10 procedure blanks, multiplied with
the dilution factor. The LOQ values, expressed on a fresh weight basis, equalled to
0.002 mg Cd kg-1, 0.006 mg Pb kg-1, 0.030 mg As kg-1, 0.04 mg Cu kg-1 and 0.90 mg Zn
kg-1, respectively.
Statistical analysis
Statistical analyses were performed with UNISTAT Statistical Package, Version 5.5.06
(UNISTAT Ltd, London, UK). Measured values were used for samples below the LOQ,
unless stated otherwise, so that distributions would not be distorted. The normal
distribution of data was verified by the Kolmogorov-Smirnov test with Lilliefors
correction. Basic statistics were calculated on untransformed data. Data that were log-
normally distributed, were log-transformed before further analysis. Data were analysed
by one-way analysis of variance (ANOVA) followed by Duncan’s multiple range test
(α = 0.05). Two animals from the reference areas were excluded from statistical
analysis because they were highly contaminated with metals and the source of
contamination could not be traced.
Page 6 of 26
http://mc.manuscriptcentral.com/tfac Email: [email protected]
Food Additives and Contaminants
123456789101112131415161718192021222324252627282930313233343536373839404142434445464748495051525354555657585960
For Peer Review O
nly
7
Results and discussion
Many animal studies have shown that in chronic exposure experiments, the largest
amounts of Cd are found in the liver and the kidneys (e.g. Kotsonis and Klaassen,
1978). Muscles, on the other hand, contain a relatively small part of the total body Cd
(Neathery et al., 1974). Lead is distributed to both soft tissues (blood, kidney, liver, …)
and mineralising systems (bones, teeth). Among soft tissues, the liver and kidney
contain the highest Pb concentrations in mammals while muscles contain the lowest
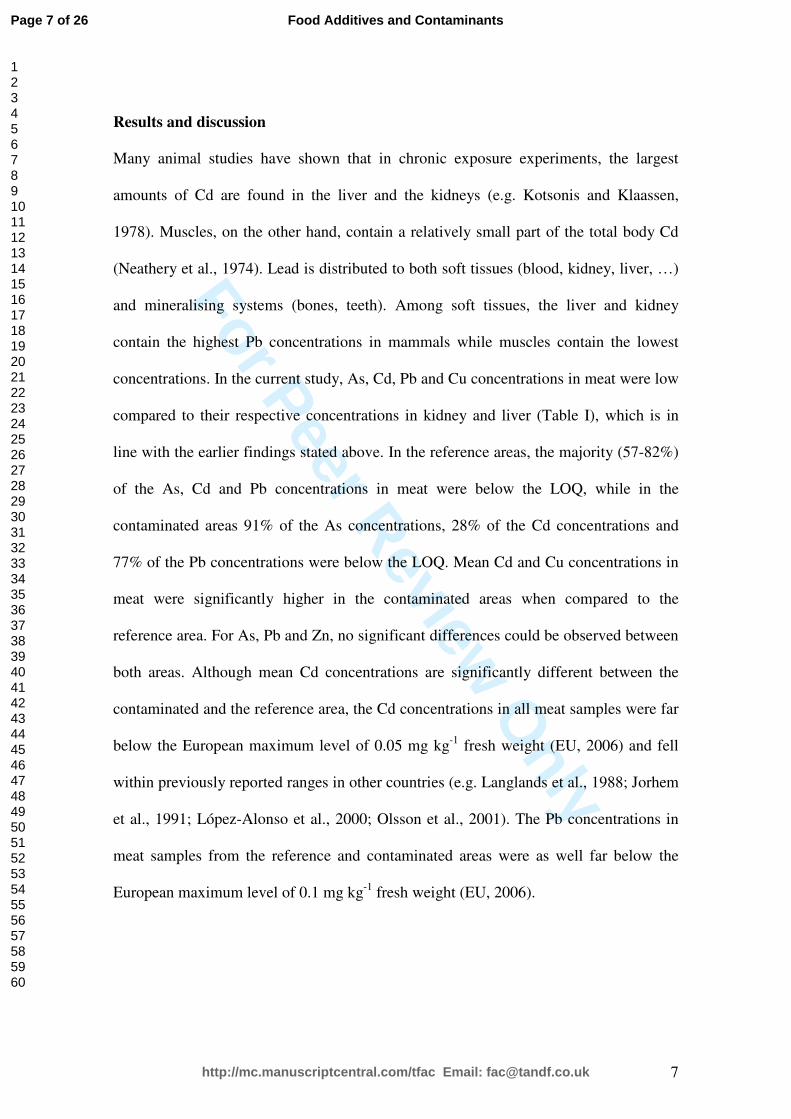
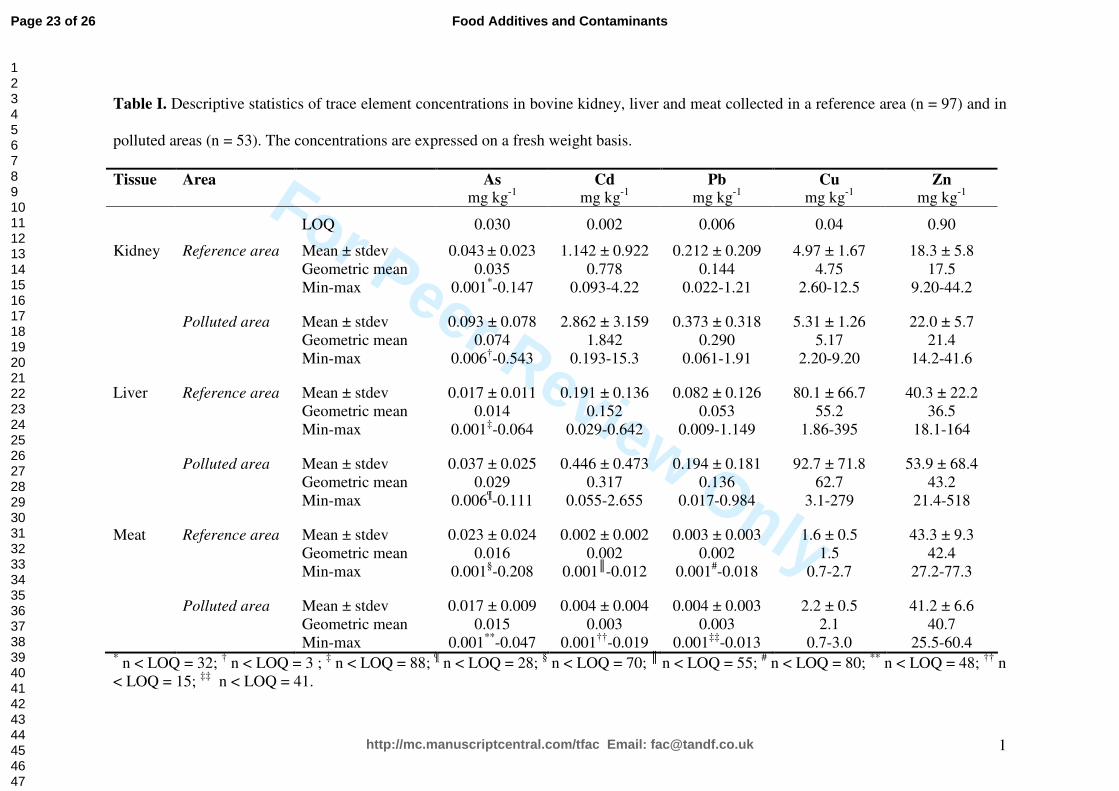
concentrations. In the current study, As, Cd, Pb and Cu concentrations in meat were low
compared to their respective concentrations in kidney and liver (Table I), which is in
line with the earlier findings stated above. In the reference areas, the majority (57-82%)
of the As, Cd and Pb concentrations in meat were below the LOQ, while in the
contaminated areas 91% of the As concentrations, 28% of the Cd concentrations and
77% of the Pb concentrations were below the LOQ. Mean Cd and Cu concentrations in
meat were significantly higher in the contaminated areas when compared to the
reference area. For As, Pb and Zn, no significant differences could be observed between
both areas. Although mean Cd concentrations are significantly different between the
contaminated and the reference area, the Cd concentrations in all meat samples were far
below the European maximum level of 0.05 mg kg-1 fresh weight (EU, 2006) and fell
within previously reported ranges in other countries (e.g. Langlands et al., 1988; Jorhem
et al., 1991; López-Alonso et al., 2000; Olsson et al., 2001). The Pb concentrations in
meat samples from the reference and contaminated areas were as well far below the
European maximum level of 0.1 mg kg-1 fresh weight (EU, 2006).
Page 7 of 26
http://mc.manuscriptcentral.com/tfac Email: [email protected]
Food Additives and Contaminants
123456789101112131415161718192021222324252627282930313233343536373839404142434445464748495051525354555657585960
For Peer Review O
nly
8
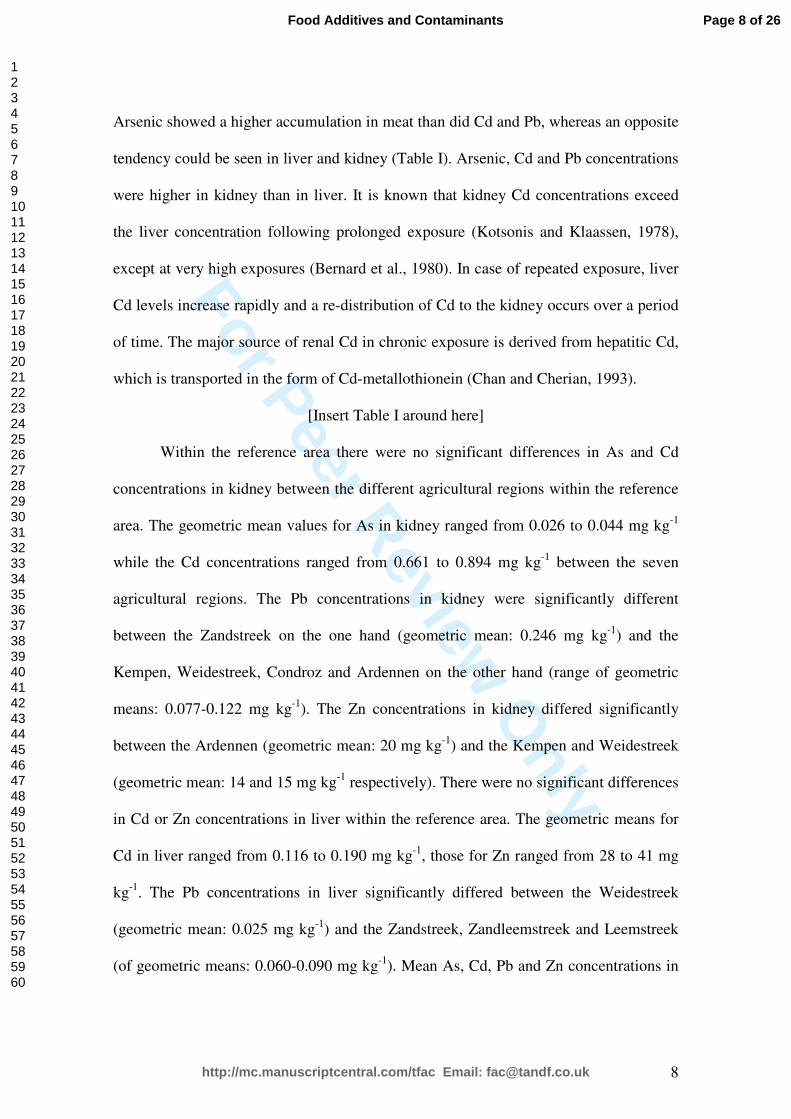
Arsenic showed a higher accumulation in meat than did Cd and Pb, whereas an opposite
tendency could be seen in liver and kidney (Table I). Arsenic, Cd and Pb concentrations
were higher in kidney than in liver. It is known that kidney Cd concentrations exceed
the liver concentration following prolonged exposure (Kotsonis and Klaassen, 1978),
except at very high exposures (Bernard et al., 1980). In case of repeated exposure, liver
Cd levels increase rapidly and a re-distribution of Cd to the kidney occurs over a period
of time. The major source of renal Cd in chronic exposure is derived from hepatitic Cd,
which is transported in the form of Cd-metallothionein (Chan and Cherian, 1993).
[Insert Table I around here]
Within the reference area there were no significant differences in As and Cd
concentrations in kidney between the different agricultural regions within the reference
area. The geometric mean values for As in kidney ranged from 0.026 to 0.044 mg kg-1
while the Cd concentrations ranged from 0.661 to 0.894 mg kg-1 between the seven
agricultural regions. The Pb concentrations in kidney were significantly different
between the Zandstreek on the one hand (geometric mean: 0.246 mg kg-1) and the
Kempen, Weidestreek, Condroz and Ardennen on the other hand (range of geometric
means: 0.077-0.122 mg kg-1). The Zn concentrations in kidney differed significantly
between the Ardennen (geometric mean: 20 mg kg-1) and the Kempen and Weidestreek
(geometric mean: 14 and 15 mg kg-1 respectively). There were no significant differences
in Cd or Zn concentrations in liver within the reference area. The geometric means for
Cd in liver ranged from 0.116 to 0.190 mg kg-1, those for Zn ranged from 28 to 41 mg
kg-1. The Pb concentrations in liver significantly differed between the Weidestreek
(geometric mean: 0.025 mg kg-1) and the Zandstreek, Zandleemstreek and Leemstreek
(of geometric means: 0.060-0.090 mg kg-1). Mean As, Cd, Pb and Zn concentrations in
Page 8 of 26
http://mc.manuscriptcentral.com/tfac Email: [email protected]
Food Additives and Contaminants
123456789101112131415161718192021222324252627282930313233343536373839404142434445464748495051525354555657585960
For Peer Review O
nly
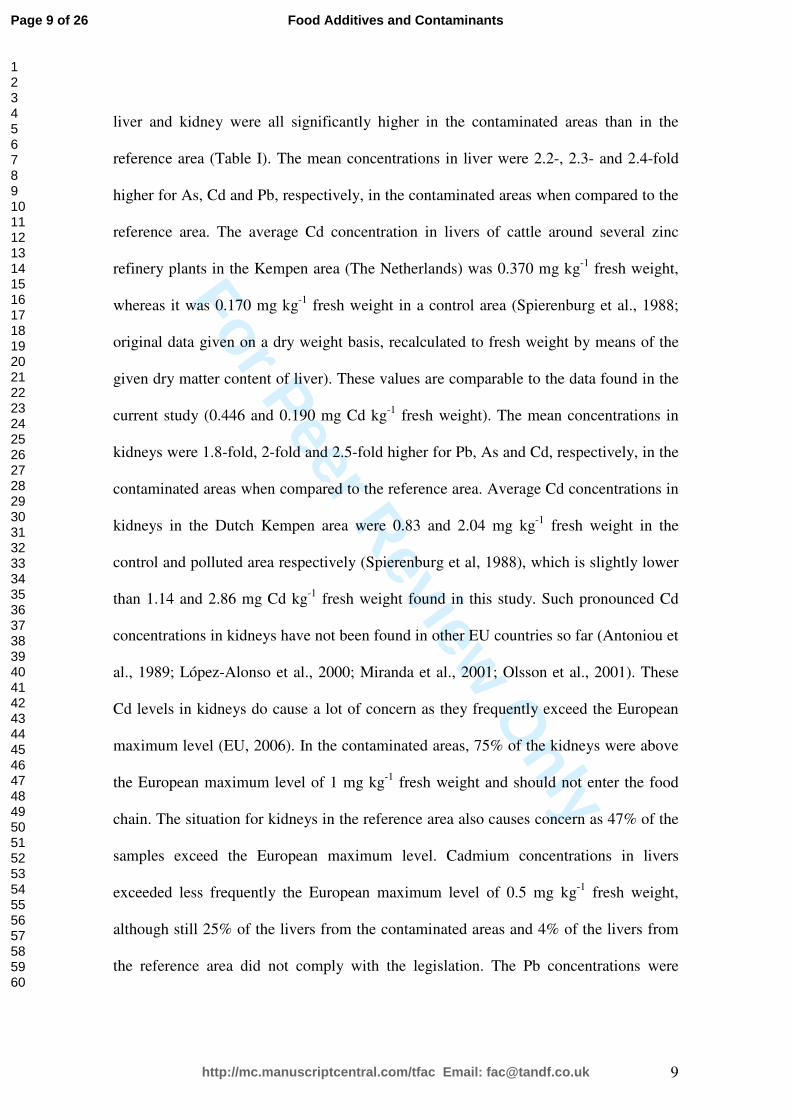
9
liver and kidney were all significantly higher in the contaminated areas than in the
reference area (Table I). The mean concentrations in liver were 2.2-, 2.3- and 2.4-fold
higher for As, Cd and Pb, respectively, in the contaminated areas when compared to the
reference area. The average Cd concentration in livers of cattle around several zinc
refinery plants in the Kempen area (The Netherlands) was 0.370 mg kg-1 fresh weight,
whereas it was 0.170 mg kg-1 fresh weight in a control area (Spierenburg et al., 1988;
original data given on a dry weight basis, recalculated to fresh weight by means of the
given dry matter content of liver). These values are comparable to the data found in the
current study (0.446 and 0.190 mg Cd kg-1 fresh weight). The mean concentrations in
kidneys were 1.8-fold, 2-fold and 2.5-fold higher for Pb, As and Cd, respectively, in the
contaminated areas when compared to the reference area. Average Cd concentrations in
kidneys in the Dutch Kempen area were 0.83 and 2.04 mg kg-1 fresh weight in the
control and polluted area respectively (Spierenburg et al, 1988), which is slightly lower
than 1.14 and 2.86 mg Cd kg-1 fresh weight found in this study. Such pronounced Cd
concentrations in kidneys have not been found in other EU countries so far (Antoniou et
al., 1989; López-Alonso et al., 2000; Miranda et al., 2001; Olsson et al., 2001). These
Cd levels in kidneys do cause a lot of concern as they frequently exceed the European
maximum level (EU, 2006). In the contaminated areas, 75% of the kidneys were above
the European maximum level of 1 mg kg-1 fresh weight and should not enter the food
chain. The situation for kidneys in the reference area also causes concern as 47% of the
samples exceed the European maximum level. Cadmium concentrations in livers
exceeded less frequently the European maximum level of 0.5 mg kg-1 fresh weight,
although still 25% of the livers from the contaminated areas and 4% of the livers from
the reference area did not comply with the legislation. The Pb concentrations were
Page 9 of 26
http://mc.manuscriptcentral.com/tfac Email: [email protected]
Food Additives and Contaminants
123456789101112131415161718192021222324252627282930313233343536373839404142434445464748495051525354555657585960
For Peer Review O
nly
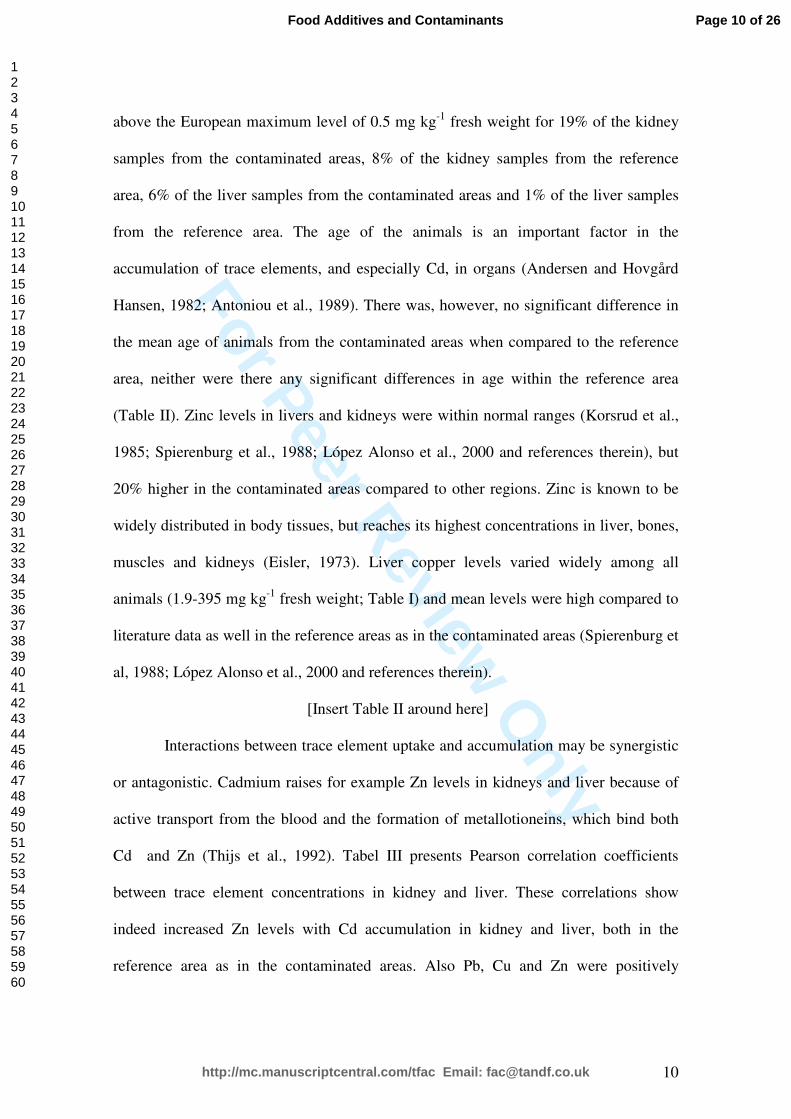
10
above the European maximum level of 0.5 mg kg-1 fresh weight for 19% of the kidney
samples from the contaminated areas, 8% of the kidney samples from the reference
area, 6% of the liver samples from the contaminated areas and 1% of the liver samples
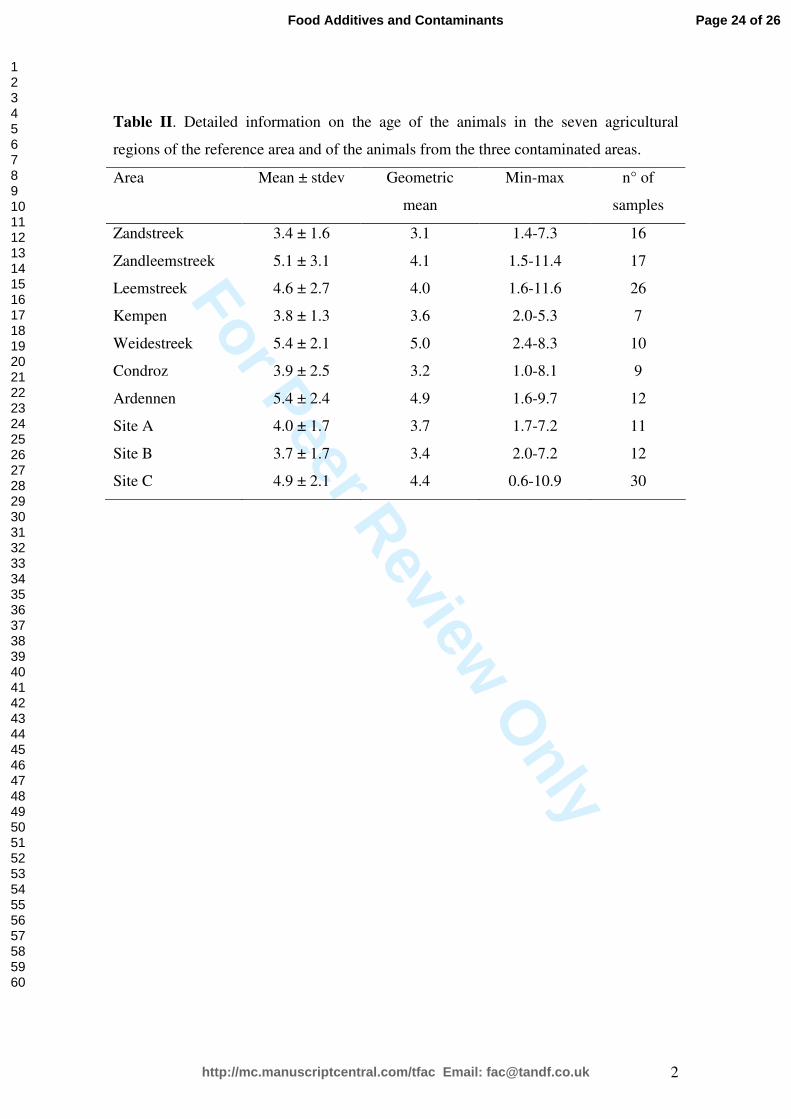
from the reference area. The age of the animals is an important factor in the
accumulation of trace elements, and especially Cd, in organs (Andersen and Hovgård
Hansen, 1982; Antoniou et al., 1989). There was, however, no significant difference in
the mean age of animals from the contaminated areas when compared to the reference
area, neither were there any significant differences in age within the reference area
(Table II). Zinc levels in livers and kidneys were within normal ranges (Korsrud et al.,
1985; Spierenburg et al., 1988; López Alonso et al., 2000 and references therein), but
20% higher in the contaminated areas compared to other regions. Zinc is known to be
widely distributed in body tissues, but reaches its highest concentrations in liver, bones,
muscles and kidneys (Eisler, 1973). Liver copper levels varied widely among all
animals (1.9-395 mg kg-1 fresh weight; Table I) and mean levels were high compared to
literature data as well in the reference areas as in the contaminated areas (Spierenburg et
al, 1988; López Alonso et al., 2000 and references therein).
[Insert Table II around here]
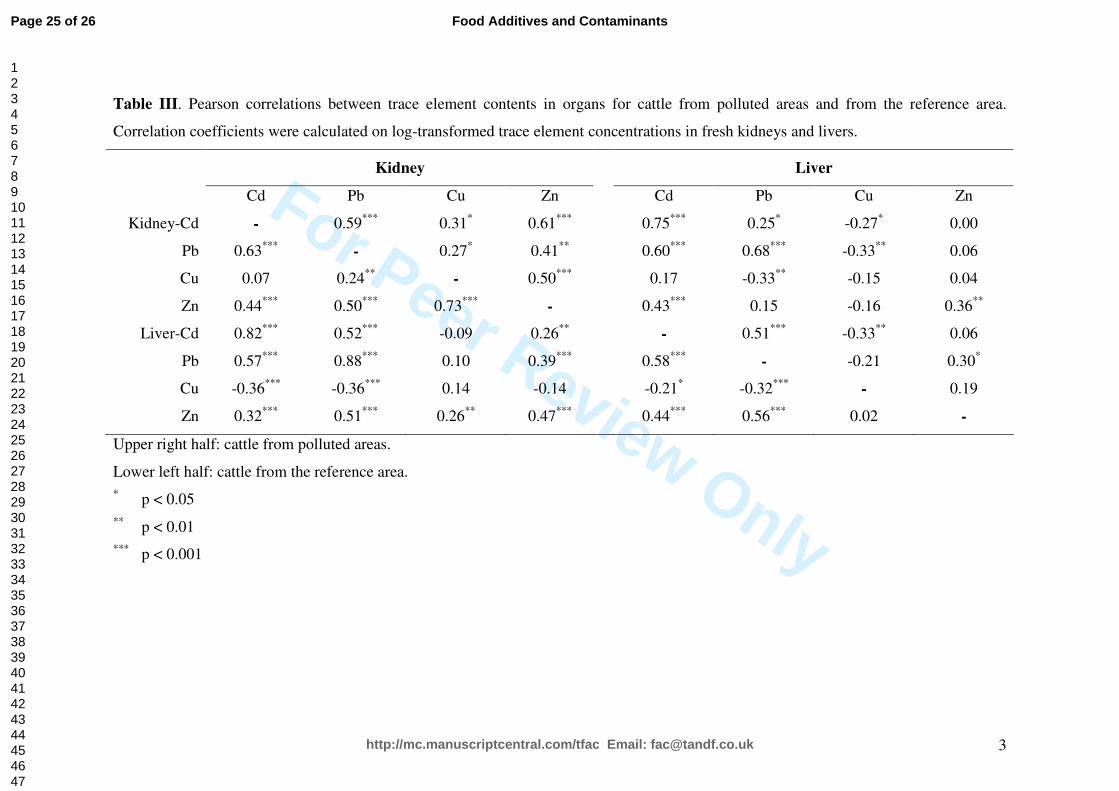
Interactions between trace element uptake and accumulation may be synergistic
or antagonistic. Cadmium raises for example Zn levels in kidneys and liver because of
active transport from the blood and the formation of metallotioneins, which bind both
Cd and Zn (Thijs et al., 1992). Tabel III presents Pearson correlation coefficients
between trace element concentrations in kidney and liver. These correlations show
indeed increased Zn levels with Cd accumulation in kidney and liver, both in the
reference area as in the contaminated areas. Also Pb, Cu and Zn were positively
Page 10 of 26
http://mc.manuscriptcentral.com/tfac Email: [email protected]
Food Additives and Contaminants
123456789101112131415161718192021222324252627282930313233343536373839404142434445464748495051525354555657585960
For Peer Review O
nly
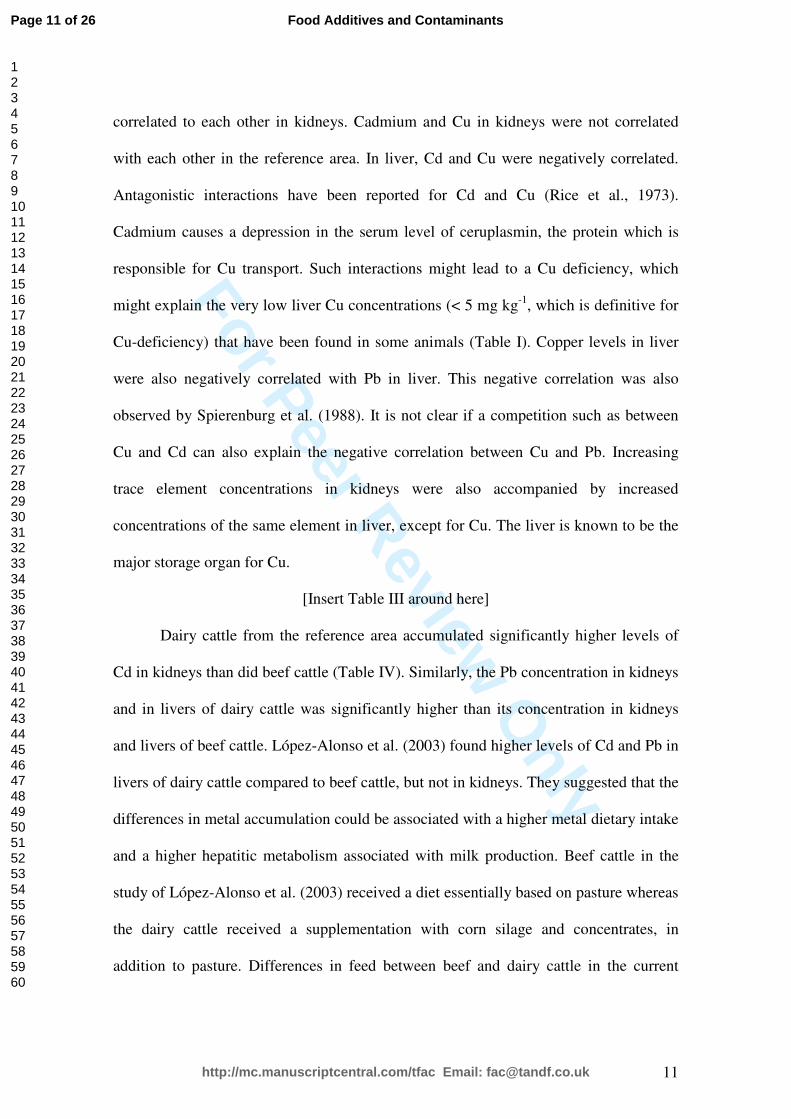
11
correlated to each other in kidneys. Cadmium and Cu in kidneys were not correlated
with each other in the reference area. In liver, Cd and Cu were negatively correlated.
Antagonistic interactions have been reported for Cd and Cu (Rice et al., 1973).
Cadmium causes a depression in the serum level of ceruplasmin, the protein which is
responsible for Cu transport. Such interactions might lead to a Cu deficiency, which
might explain the very low liver Cu concentrations (< 5 mg kg-1, which is definitive for
Cu-deficiency) that have been found in some animals (Table I). Copper levels in liver
were also negatively correlated with Pb in liver. This negative correlation was also
observed by Spierenburg et al. (1988). It is not clear if a competition such as between
Cu and Cd can also explain the negative correlation between Cu and Pb. Increasing
trace element concentrations in kidneys were also accompanied by increased
concentrations of the same element in liver, except for Cu. The liver is known to be the
major storage organ for Cu.
[Insert Table III around here]
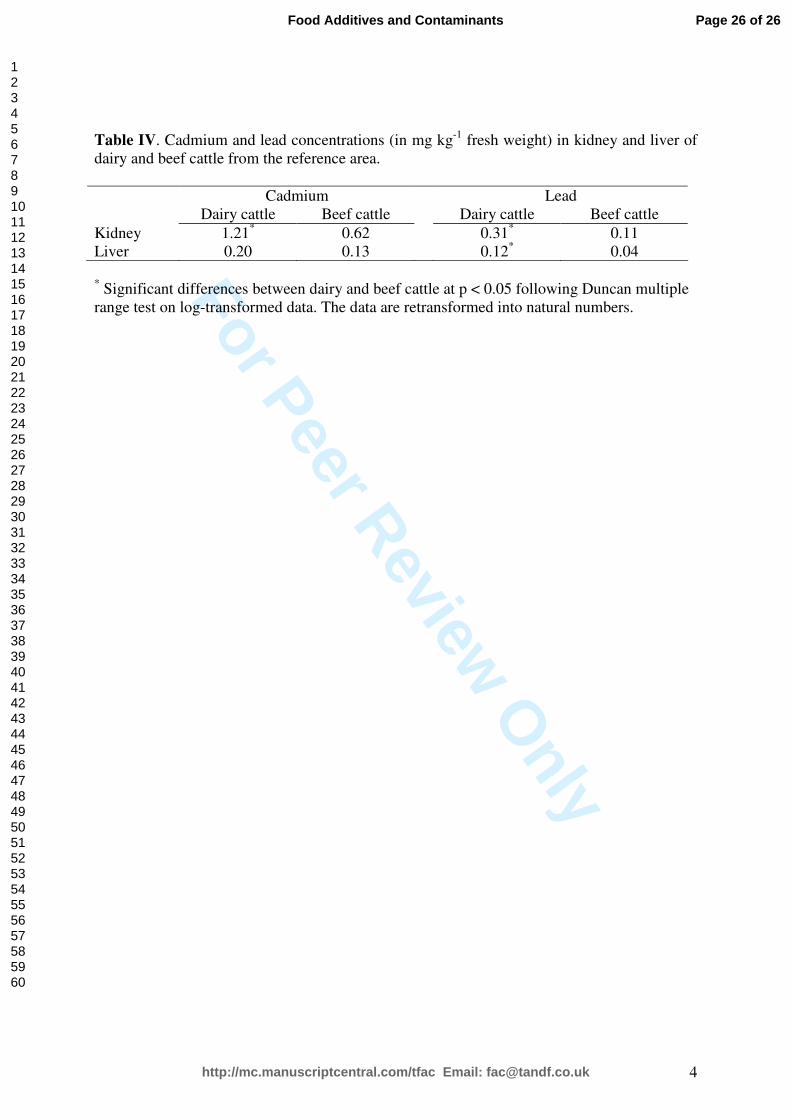
Dairy cattle from the reference area accumulated significantly higher levels of
Cd in kidneys than did beef cattle (Table IV). Similarly, the Pb concentration in kidneys
and in livers of dairy cattle was significantly higher than its concentration in kidneys
and livers of beef cattle. López-Alonso et al. (2003) found higher levels of Cd and Pb in
livers of dairy cattle compared to beef cattle, but not in kidneys. They suggested that the
differences in metal accumulation could be associated with a higher metal dietary intake
and a higher hepatitic metabolism associated with milk production. Beef cattle in the
study of López-Alonso et al. (2003) received a diet essentially based on pasture whereas
the dairy cattle received a supplementation with corn silage and concentrates, in
addition to pasture. Differences in feed between beef and dairy cattle in the current
Page 11 of 26
http://mc.manuscriptcentral.com/tfac Email: [email protected]
Food Additives and Contaminants
123456789101112131415161718192021222324252627282930313233343536373839404142434445464748495051525354555657585960
For Peer Review O
nly
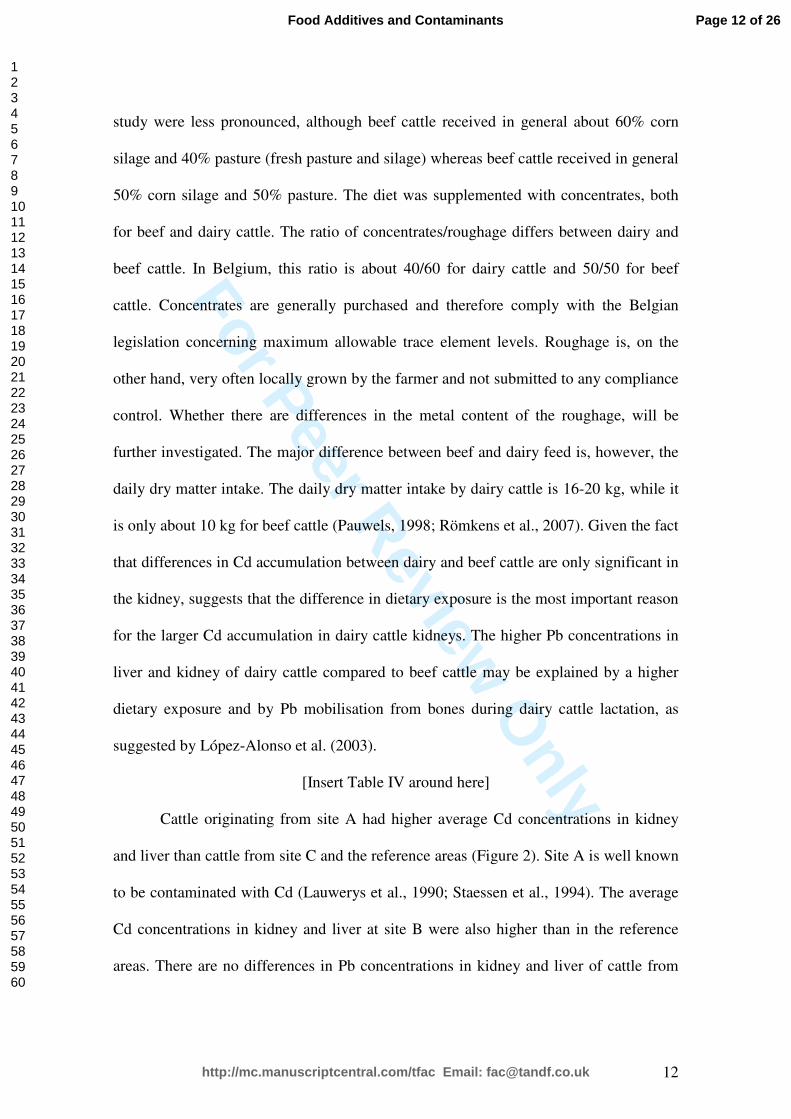
12
study were less pronounced, although beef cattle received in general about 60% corn
silage and 40% pasture (fresh pasture and silage) whereas beef cattle received in general
50% corn silage and 50% pasture. The diet was supplemented with concentrates, both
for beef and dairy cattle. The ratio of concentrates/roughage differs between dairy and
beef cattle. In Belgium, this ratio is about 40/60 for dairy cattle and 50/50 for beef
cattle. Concentrates are generally purchased and therefore comply with the Belgian
legislation concerning maximum allowable trace element levels. Roughage is, on the
other hand, very often locally grown by the farmer and not submitted to any compliance
control. Whether there are differences in the metal content of the roughage, will be
further investigated. The major difference between beef and dairy feed is, however, the
daily dry matter intake. The daily dry matter intake by dairy cattle is 16-20 kg, while it
is only about 10 kg for beef cattle (Pauwels, 1998; Römkens et al., 2007). Given the fact
that differences in Cd accumulation between dairy and beef cattle are only significant in
the kidney, suggests that the difference in dietary exposure is the most important reason
for the larger Cd accumulation in dairy cattle kidneys. The higher Pb concentrations in
liver and kidney of dairy cattle compared to beef cattle may be explained by a higher
dietary exposure and by Pb mobilisation from bones during dairy cattle lactation, as
suggested by López-Alonso et al. (2003).
[Insert Table IV around here]
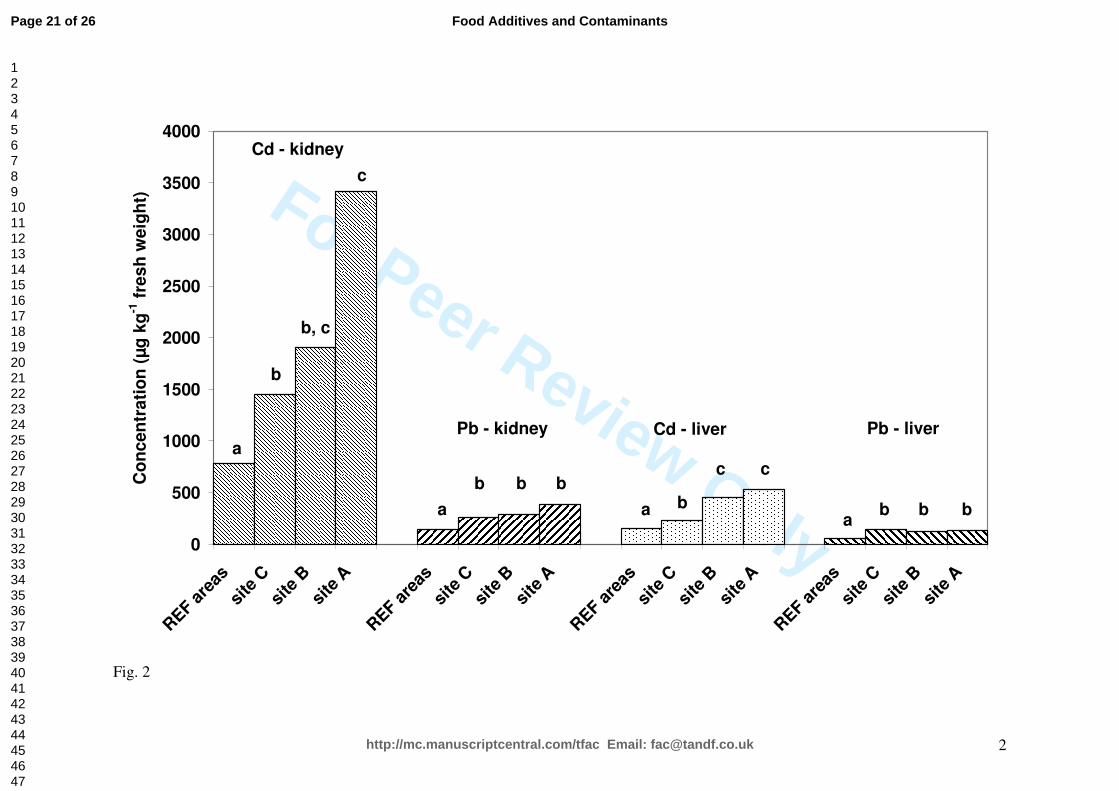
Cattle originating from site A had higher average Cd concentrations in kidney
and liver than cattle from site C and the reference areas (Figure 2). Site A is well known
to be contaminated with Cd (Lauwerys et al., 1990; Staessen et al., 1994). The average
Cd concentrations in kidney and liver at site B were also higher than in the reference
areas. There are no differences in Pb concentrations in kidney and liver of cattle from
Page 12 of 26
http://mc.manuscriptcentral.com/tfac Email: [email protected]
Food Additives and Contaminants
123456789101112131415161718192021222324252627282930313233343536373839404142434445464748495051525354555657585960
For Peer Review O
nly
13
the three contaminated sites although the yearly average air Pb concentration in PM10
dust at site B (173 ng m-3 in 2006) was increased compared to air Pb emissions at site A
(33 ng m-3 in 2006) and ambient background concentrations (13 ng m-3 in 2006), and
the yearly average air Pb deposition level at site B (274 µg m-2 d-1 in 2006) was
increased compared to ambient background concentrations (8 µg m-2 d-1 in 2006)
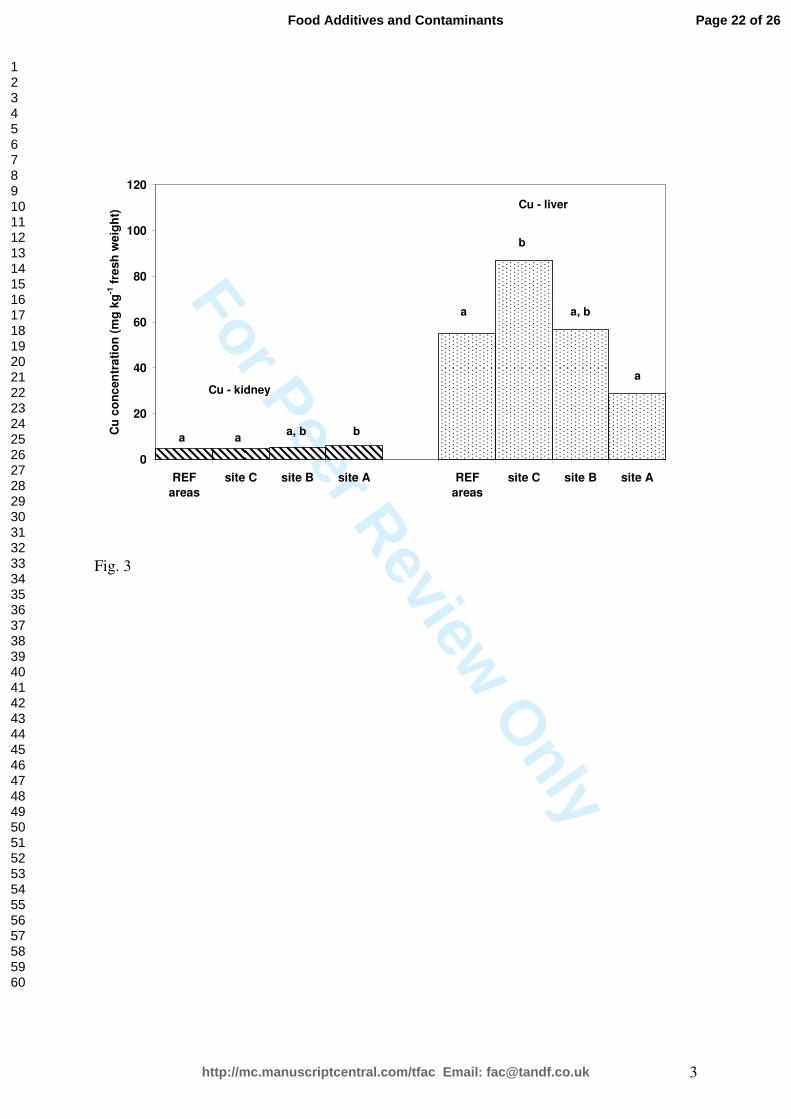
(MIRA, 2007; VMM, 2007). Copper concentrations were elevated in liver of cattle
originating from site C, near a Cu refining plant, but not in kidney (Figure 3).
[Insert Figure 2 around here]
[Insert Figure 3 around here]
Conclusion
Toxic and trace element concentrations have been measured in meat, kidney and liver
samples of cattle from contaminated and reference areas in Belgium. Although As , Cd
and Pb concentrations in meat were low in all areas, Cd and Pb concentrations in kidney
and liver regularly exceeded the European maximum levels, both in the contaminated
and the uncontaminated areas. Zinc levels in livers and kidneys were within normal
ranges, while.liver copper levels varied widely among all animals and mean levels were
high compared to literature data. Dairy cattle accumulated significantly more Cd in
kidneys and Pb in liver and kidneys compared to beef cattle, which is probably due to a
larger dietary exposure compared of dairy cattle and by Pb mobilisation from bones
during lactation. It is important to pay attention to the fact that a considerable
contamination of toxic elements takes place in cattle originating from Belgium, as
heavy metals can be transferred through the human food chain and cause food safety
problems.
Page 13 of 26
http://mc.manuscriptcentral.com/tfac Email: [email protected]
Food Additives and Contaminants
123456789101112131415161718192021222324252627282930313233343536373839404142434445464748495051525354555657585960
For Peer Review O
nly
14
References
Andersen A, Hovgård Hansen H. 1982. Cadmium and zinc in kidneys from Danish
cattle. Nord Vet Med. 34: 340-349.
Anatoniou V, Tsoukali-Papadopoulou H, Epivatianos P, Nathanael B. 1989. Cadmium
concentrations in beef consumable tissues in relation to age of animals and area
of breeding. B Environ Contam Tox. 43:915-919.
Bernard A, Goret A, Buchet JP, Roels H, Lauwerys R. 1980. Significance of cadmium
levels in blood and urine during long-term exposure of rats to cadmium. J
Toxicol Environ Health. 6: 175-184.
Chan HM, Cherian MG. 1993. Mobilization of hepatic cadmium in pregnant rats.
Toxicol Appl Pharm. 120: 308-314.
Cornelis C, Berghmans, P, Van Sprundel M, Van der Auwera J-C. 2006. Use of the
IEUBK model for determination of exposure routes in view of site remediation.
Hum Ecol Risk Assess. 12: 963-982.
De Temmerman L, Vanongeval L, Boon W, Hoenig M, Geypens M. 2003. Heavy metal
content of arable soils in northern Belgium. Water Air Soil Poll. 148: 61-76.
Eisler R. 1997. Zinc hazards to plants and animals with emphasis on fishery and
wildlife resources. In Cheremisinoff PN, editor. Ecological issues and
environmental impact assessment. Houston: Gulf Publishers Company. p 443.
EU 2006. Commission Regulation (EC) No 1881/2006 of 19 December 2006 setting
maximum levels for certain contaminants in foodstuffs. Off J Eur Union L364/5.
Friberg L, Nordberg GF, Vouk VB. 1979. Handbook on the toxicology of metals.
Elsevier/North-Holland Biomedical Press, Amsterdam.
Page 14 of 26
http://mc.manuscriptcentral.com/tfac Email: [email protected]
Food Additives and Contaminants
123456789101112131415161718192021222324252627282930313233343536373839404142434445464748495051525354555657585960
For Peer Review O
nly
15
Jorhem L, Slorach S, Sundström B, Ohlin B. 1991. Lead, cadmium, arsenic, and
mercury in meat, liver and kidney of Swedish pigs and cattle in 1984-88. Food
Addit Contam. 8:201-212.
Korsrud GO, Meldrum JB, Salisbury CD, Houlahan BJ, Saschenbrecker PW, Tittiger F.
1985. Trace element levels in liver and kidney from cattle, swine and poultry
slaughtered in Canada. Can J Comp Med. 49: 159-163.
Kotsonis FN, Klaassen CD. 1978. The relationship of metallothionein to the toxicity of
cadmium after prolonged administration to rats. Toxicol Appl Pharm 46: 39-54.
Langlands JP, Donald GE, Bowles JE. 1988. Cadmium concentrations in liver, kidney
and muscle in Australian sheep and cattle. Aust J Exp Agr. 28:291-297.
Lauwerys R, Amery A, Bernard A, Bruaux P, Buchet J-P, Claeys F, De Plaen P,
Ducoffre G, Fagard R, Lijnen P, Nick L, Roels H, Rondia D, Saint-Remy A,
Sartor F, Staessen J. 1990. Health effects of environmental exposure to
cadmium. Objectives, design and organization of the Cadmibel Study: a cross-
sectional morbidity study carried out in Belgium from 1985 to 1989. Environ
Health Persp. 87: 283-289.
López-Alonso M, Benedito JL, Miranda M, Castillo C, Hernández J, Shore RF. 2000.
Toxic and trace elements in liver, kidney and meat from cattle slaughtered in
Galicia (NW Spain). Food Addit Contam. 17:447-457.
López-Alonso M, Benedito JL, Miranda M, Castillo C, Hernández J, Shore RF. 2002.
Interactions between toxic and essential trace metals in cattle from a region with
low levels of pollution. Arch Environ Con Tox. 42: 165-172.
Page 15 of 26
http://mc.manuscriptcentral.com/tfac Email: [email protected]
Food Additives and Contaminants
123456789101112131415161718192021222324252627282930313233343536373839404142434445464748495051525354555657585960
For Peer Review O
nly
16
López-Alonso M, Prieto-Montaña F, Miranda M, Castillo C, Hernández J, Benedito JL.
2003. Cadmium and lead accumulation in cattle in NW Spain. Vet Hum Toxicol.
45: 128-130.
Maudoux JP, Saegerman C, Rettinger C, Houins G, Van Huffel X, Berkvens D. 2006.
Food safety surveillance through a risk based control programme: approach
employed by the Belgian Federal Agency for the Safety of the Food Chain. Vet
Quart. 28: 140-154.
MIRA. 2007. State of the Environment Report on the Flemish region of Belgium.
Available:
http://www.milieurapport.be/default.aspx?pageID=86&ChapID=2611&NodeID
=2617 via the INTERNET. Last accessed 2008 April 15. In Dutch.
Miranda M, López Alonso M, Castillo C, Hernández J, Benedito JL. 2001. Cadmium
levels in liver, kidney and meat in calves from Asturias (North Spain). Eur Food
Res Technol. 212:426-430.
Miranda M, López Alonso M, Castillo C, Hernández J, Benedito JL. 2005. Effects of
moderate pollution on toxic and trace metal levels in calves from a polluted area
of northern Spain. Environ Int. 31: 543-548.
Neathery MW, Miller WJ, Gentry RP, Stake PE, Blackmon DM. 1974. Cadmium-109
and methyl mercury-203 metabolism, tissue distribution and secretion into milk
of cows. J Dairy Sci. 57: 1177-1183.
Nicholson FA, Chambers BJ, Williams JR, Unwin RJ. 1999. Heavy metal contents of
livestock feeds and animal manures in England and Wales. Bioresource
Technol. 70: 23-31.
Page 16 of 26
http://mc.manuscriptcentral.com/tfac Email: [email protected]
Food Additives and Contaminants
123456789101112131415161718192021222324252627282930313233343536373839404142434445464748495051525354555657585960
For Peer Review O
nly
17
Olsson I-M, Jonsson S, Oskarsson A. 2001. Cadmium and zinc in kidney, liver, muscle
and mammary tissue from dairy cows in conventional and organic farming. J
Environ Monitor. 3:531-538.
Pauwels, H. 1998. Rundvleesproductie: voeding van vleesstieren. Ministerie van
Middenstand en Landbouw, Bestuur Onderzoek en Ontwikkeling - DG 6, Dienst
Ontwikkeling Dierlijke productie, Hasselt. pp. 40. (in Dutch)
Rice DP, Murthy L, Shirly T, Menden E, Petering HG. 1973. The impact of low level
cadmium feeding on blood chemicals in male, Sprague-Dawley rats. Trace Subst
Environ Health. 7: 305-311.
Römkens PFAM, Zeilmaker MJ, Rietra RPJJ, Kan CA, van Eijkeren JCH, van
Raamsdonk LWD, Lijzen JPA. 2007. Blootstelling en opname van cadmium
door runderen in de Kempen: een modelstudie. Alterra-rapport 1438. Alterra,
Wageningen, pp 70. (in Dutch)
Spierenburg TJ, De Graaf GJ, Baars AJ, Brus DHJ, Tielen MJM, Arts BJ. 1988.
Cadmium, zinc, lead, and copper in livers and kidneys of cattle in the
neighbourhood of zinc refineries. Environ Monit and Assess. 11: 107-114.
Staessen JA, Lauwerys RR, Ide G, Roels HA, Vyncke G, Amery A. 1994. Renal
function and historical environmental cadmium pollution from zinc smelters.
Lancet. 343: 1523-1527.
Thijs L, Staessen J, Amery A, Bruaux P, Buchet JP, Claeys F, De Plaen P, Ducoffre G,
Lauwerys R, Lijnen P, Nick L, Remys AS, Roels, H, Rondia D, Sartor F. 1992.
Determination of serum zinc in a random population of four Belgian towns with
different degrees of environmental exposure to cadmium. Environ Health
Perspect. 98: 251-258.
Page 17 of 26
http://mc.manuscriptcentral.com/tfac Email: [email protected]
Food Additives and Contaminants
123456789101112131415161718192021222324252627282930313233343536373839404142434445464748495051525354555657585960
For Peer Review O
nly
18
VMM. 2007. Luchtkwaliteit in het Vlaamse Gewest - 2006. Vlaamse
Milieumaatschappij, Aalst. pp. 148 + bijlagen (in Dutch).
Page 18 of 26
http://mc.manuscriptcentral.com/tfac Email: [email protected]
Food Additives and Contaminants
123456789101112131415161718192021222324252627282930313233343536373839404142434445464748495051525354555657585960
For Peer Review O
nly
19
Figure 1. Geographical location of the sampling areas. The contaminated sites A, B and C are
indicated as white ovals. Shaded areas represent sampling areas at ambient environmental
metal levels, which are considered as reference areas.
Figure 2. Average cadmium and lead concentration in kidney and liver as a function of the
origin of the cattle. Bars with the same letter on top are not significantly different (p < 0.05)
following Duncan multiple range test on log-transformed data. The data are retransformed
into natural numbers.
Figure 3. Average copper concentration in kidney and liver as a function of the origin of the
cattle. Bars with the same letter on top are not significantly different (p < 0.05) following
Duncan multiple range test on log-transformed data. The data are retransformed into natural
numbers.
Page 19 of 26
http://mc.manuscriptcentral.com/tfac Email: [email protected]
Food Additives and Contaminants
123456789101112131415161718192021222324252627282930313233343536373839404142434445464748495051525354555657585960
For Peer Review Only
1
Site A
Site B Site C
Referenceareas
Site A
Site B Site C
Referenceareas
Site A
Site B Site C
Site A
Site B Site C
Site A
Site B Site C
Referenceareas
Fig. 1
Page 20 of 26
http://mc.manuscriptcentral.com/tfac Email: [email protected]
Food Additives and Contaminants
123456789101112131415161718192021222324252627282930313233343536373839404142434445464748495051525354555657585960
For Peer Review Only
2
0
500
1000
1500
2000
2500
3000
3500
4000
REF a
reas
site
Csi
te B
site
A
REF a
reas
site
Csi
te B
site
A
REF a
reas
site
Csi
te B
site
A
REF a
reas
site
Csi
te B
site
AC
on
cen
tra
tio
n (
µg
kg
-1 f
res
h w
eig
ht)
Cd - kidney
Pb - kidney Cd - liver Pb - livera
b
b, c
c
a
b b b
a b
c c
ab b b
Fig. 2
Page 21 of 26
http://mc.manuscriptcentral.com/tfac Email: [email protected]
Food Additives and Contaminants
123456789101112131415161718192021222324252627282930313233343536373839404142434445464748495051525354555657585960
For Peer Review O
nly
3
0
20
40
60
80
100
120
REF
areas
site C site B site A REF
areas
site C site B site A
Cu
co
nc
en
tra
tio
n (
mg
kg
-1 f
resh
we
igh
t)
a aa, b b
a
b
a, b
a
Cu - kidney
Cu - liver
Fig. 3
Page 22 of 26
http://mc.manuscriptcentral.com/tfac Email: [email protected]
Food Additives and Contaminants
123456789101112131415161718192021222324252627282930313233343536373839404142434445464748495051525354555657585960
For Peer Review Only
1
Table I. Descriptive statistics of trace element concentrations in bovine kidney, liver and meat collected in a reference area (n = 97) and in
polluted areas (n = 53). The concentrations are expressed on a fresh weight basis.
Tissue Area As Cd Pb Cu Zn
mg kg-1
mg kg-1
mg kg-1
mg kg-1
mg kg-1
LOQ 0.030 0.002 0.006 0.04 0.90
Kidney Reference area Mean ± stdev 0.043 ± 0.023 1.142 ± 0.922 0.212 ± 0.209 4.97 ± 1.67 18.3 ± 5.8
Geometric mean 0.035 0.778 0.144 4.75 17.5
Min-max 0.001*-0.147 0.093-4.22 0.022-1.21 2.60-12.5 9.20-44.2
Polluted area Mean ± stdev 0.093 ± 0.078 2.862 ± 3.159 0.373 ± 0.318 5.31 ± 1.26 22.0 ± 5.7
Geometric mean 0.074 1.842 0.290 5.17 21.4
Min-max 0.006†-0.543 0.193-15.3 0.061-1.91 2.20-9.20 14.2-41.6
Liver Reference area Mean ± stdev 0.017 ± 0.011 0.191 ± 0.136 0.082 ± 0.126 80.1 ± 66.7 40.3 ± 22.2
Geometric mean 0.014 0.152 0.053 55.2 36.5
Min-max 0.001‡-0.064 0.029-0.642 0.009-1.149 1.86-395 18.1-164
Polluted area Mean ± stdev 0.037 ± 0.025 0.446 ± 0.473 0.194 ± 0.181 92.7 ± 71.8 53.9 ± 68.4
Geometric mean 0.029 0.317 0.136 62.7 43.2
Min-max 0.006¶-0.111 0.055-2.655 0.017-0.984 3.1-279 21.4-518
Meat Reference area Mean ± stdev 0.023 ± 0.024 0.002 ± 0.002 0.003 ± 0.003 1.6 ± 0.5 43.3 ± 9.3
Geometric mean 0.016 0.002 0.002 1.5 42.4
Min-max 0.001§-0.208 0.001
║-0.012 0.001
#-0.018 0.7-2.7 27.2-77.3
Polluted area Mean ± stdev 0.017 ± 0.009 0.004 ± 0.004 0.004 ± 0.003 2.2 ± 0.5 41.2 ± 6.6
Geometric mean 0.015 0.003 0.003 2.1 40.7
Min-max 0.001**
-0.047 0.001††
-0.019 0.001‡‡
-0.013 0.7-3.0 25.5-60.4 * n < LOQ = 32;
† n < LOQ = 3 ;
‡ n < LOQ = 88;
¶ n < LOQ = 28;
§ n < LOQ = 70;
║ n < LOQ = 55;
# n < LOQ = 80;
** n < LOQ = 48;
†† n
< LOQ = 15; ‡‡
n < LOQ = 41.
Page 23 of 26
http://mc.manuscriptcentral.com/tfac Email: [email protected]
Food Additives and Contaminants
123456789101112131415161718192021222324252627282930313233343536373839404142434445464748495051525354555657585960
For Peer Review O
nly
2
Table II. Detailed information on the age of the animals in the seven agricultural
regions of the reference area and of the animals from the three contaminated areas.
Area Mean ± stdev Geometric
mean
Min-max n° of
samples
Zandstreek 3.4 ± 1.6 3.1 1.4-7.3 16
Zandleemstreek 5.1 ± 3.1 4.1 1.5-11.4 17
Leemstreek 4.6 ± 2.7 4.0 1.6-11.6 26
Kempen 3.8 ± 1.3 3.6 2.0-5.3 7
Weidestreek 5.4 ± 2.1 5.0 2.4-8.3 10
Condroz 3.9 ± 2.5 3.2 1.0-8.1 9
Ardennen 5.4 ± 2.4 4.9 1.6-9.7 12
Site A 4.0 ± 1.7 3.7 1.7-7.2 11
Site B 3.7 ± 1.7 3.4 2.0-7.2 12
Site C 4.9 ± 2.1 4.4 0.6-10.9 30
Page 24 of 26
http://mc.manuscriptcentral.com/tfac Email: [email protected]
Food Additives and Contaminants
123456789101112131415161718192021222324252627282930313233343536373839404142434445464748495051525354555657585960
For Peer Review Only
3
Table III. Pearson correlations between trace element contents in organs for cattle from polluted areas and from the reference area.
Correlation coefficients were calculated on log-transformed trace element concentrations in fresh kidneys and livers.
Kidney Liver
Cd Pb Cu Zn Cd Pb Cu Zn
Kidney-Cd - 0.59***
0.31*
0.61***
0.75***
0.25*
-0.27*
0.00
Pb 0.63***
- 0.27*
0.41**
0.60***
0.68***
-0.33**
0.06
Cu 0.07 0.24**
- 0.50***
0.17 -0.33**
-0.15 0.04
Zn 0.44***
0.50***
0.73***
- 0.43***
0.15 -0.16 0.36**
Liver-Cd 0.82***
0.52***
-0.09 0.26**
- 0.51***
-0.33**
0.06
Pb 0.57***
0.88***
0.10 0.39***
0.58***
- -0.21 0.30*
Cu -0.36***
-0.36***
0.14 -0.14 -0.21*
-0.32***
- 0.19
Zn 0.32***
0.51***
0.26**
0.47***
0.44***
0.56***
0.02 -
Upper right half: cattle from polluted areas.
Lower left half: cattle from the reference area.
* p < 0.05
** p < 0.01
*** p < 0.001
Page 25 of 26
http://mc.manuscriptcentral.com/tfac Email: [email protected]
Food Additives and Contaminants
123456789101112131415161718192021222324252627282930313233343536373839404142434445464748495051525354555657585960
For Peer Review O
nly
4
Table IV. Cadmium and lead concentrations (in mg kg-1
fresh weight) in kidney and liver of
dairy and beef cattle from the reference area.
Cadmium Lead
Dairy cattle Beef cattle Dairy cattle Beef cattle
Kidney 1.21*
0.62
0.31*
0.11
Liver 0.20
0.13
0.12*
0.04
* Significant differences between dairy and beef cattle at p < 0.05 following Duncan multiple
range test on log-transformed data. The data are retransformed into natural numbers.
Page 26 of 26
http://mc.manuscriptcentral.com/tfac Email: [email protected]
Food Additives and Contaminants
123456789101112131415161718192021222324252627282930313233343536373839404142434445464748495051525354555657585960