Embed Size (px)
Citation preview

Using plant growth regulators and Vesicular Arbuscular Mycorrhiza to improve
growth of the slow growing indigenous Mimusops zeyheri seedlings and
accumulation of essential nutrient elements
By
Mosibudi Glad Radzuma
MINI-DISSERTATION submitted in partial fulfilment of the requirements for the
degree of
Master of Science in agriculture (Horticulture)
FACULTY OF SCIENCE AND AGRICULTURE
(School of agricultural and environmental sciences)
At the
UNIVERSITY OF LIMPOPO
SUPERVISOR: PROFESSOR P.W. MASHELA
2017

ii
TABLE OF CONTENTS
PAGE
DECLARATION vi
DEDICATION vii
ACKNOWLEDGEMENTS viii
LIST OF LEGENDS x
LIST OF TABLES xi
LIST OF FIGURES xiii
LIST OF APPENDICES xiv
ABSTRACT xxii
CHAPTER 1: RESEARCH PROBLEM 1
1.1 Background 1
1.2 Problem statement 2
1.3 Rationale of the study 2
1.4 Purpose of the study 3
1.4.1 Aim 3
1.4.2 Objectives 3
1.5 Hypotheses 3
1.6 Scientific contribution 4
1.7 Reliability, validity and objectivity 4
1.8 Bias 4
1.9 Structure of mini-dissertation 4
CHAPTER 2: LITERATURE REVIEW 6

iii
2.1 Introduction 6
2.2 Work done on research problem 6
2.2.1 Propagation of Mimusops zeyheri seedlings 6
2.2.2 Characteristics of Mimusops zeyheri 7
2.2.3 Natural habitat 9
2.2.4 Influence of salinity 10
2.2.5 Genetic variability 10
2.2.6 Functional nutrients in Mimusops zeyheri fruit 11
2.2.7 Regional effect 12
2.2.8 Pests on Mimusops zeyheri 13
2.3 Improving growth in other plant species 14
2.3.1 Plant growth regulators and selective uses in horticulture 14
2.3.2 Use of vesicular arbuscular mycorrhiza in agriculture 16
2.4 Work not done on problem statement 18
CHAPTER 3: RESPONSE OF MIMUSOPS ZEYHERI TO PLANT
GROWTH REGULATORS
19
3.1 Introduction 19
3.2 Materials and methods 20
3.2.1 Growth conditions and preparation of materials 20
3.2.2 Experimental design 20
3.2.3 Cultural practices 22
3.2.4 Data collection 23
3.2.5 Data analysis 23
3.3 Results 24
3.3.1 Effects of indole-3-acetic acid 24
iv
3.3.2 Effects of gibberellic acid 30
3.3.3 Effects of 6-benzylaminopurine 35
3.4 Discussion 43
3.4.1 Effects of indole-3-acetic acid 43
3.4.2 Effects of gibberellic acid 45
3.4.3 Effects of 6-benzylaminopurine 47
3.4.4 Density-dependent growth patterns 49
3.5 Conclusion 50
CHAPTER 4: RESPONSE OF MIMUSOPS ZEYHERI TO VESICULAR
ARBUSCULAR MYCORRHIZA
51
4.1 Introduction 51
4.2 Materials and methods 51
4.2.1 Growth conditions and preparations 51
4.2.2 Experimental design and inoculation 52
4.2.3 Cultural practices 52
4.2.4 Data collection 52
4.2.5 Data analysis 53
4.3 Results 53
4.3.1 Response of Mimusops zeyheri growth to VAM 53
4.3.2 Response of Mimusops zeyheri foliar nutrient elements to VAM 54
4.4 Discussion 57
4.5 Conclusion 58
CHAPTER 5: SUMMARY, SIGNIFICANCE OF FINDINGS,
RECOMMENDATIONS AND CONCLUSIONS
59
5.1 Summary 59

v
5.2 Significance of findings 59
5.3 Recommendations 60
5.4 Conclusions 60
REFERENCES 61
APPENDICES 70

vi
DECLARATION
I declare that the mini-dissertation hereby submitted to the University of Limpopo, for
the degree of Master of Science in Agriculture (Horticulture) has not previously been
submitted by me for a degree at this or any other University; that it is my work in
design and in execution, and that all materials contained herein had been duly
acknowledged.
Radzuma M.G (Ms) Date

vii
DEDICATION
To my son Tshegofatso Radzuma and mother Mokgadi Jane Radzuma.

viii
ACKNOWLEDGEMENTS
I would like to give thanks to the God of possibilities, for making it possible to for me
to carry out this project successfully. Indeed, nothing is impossible when the Lord
God almighty is in charge. Thank you for giving me good health, strength and ability
to work hard and consistently throughout this project. Truly you deserve the honour
and glory. To my beloved parents, Mrs Mokgadi Jane Radzuma and Mr. Nkoshilo
Phineas Radzuma, words will never be enough to express my gratitude. You have
been my pillar of strength and supported me from the day I was brought into this
world till now – for that I am endlessly grateful. I would also like to appreciate my
brothers Simon, Alfred and Thomas for their support and patience throughout my
study life, may the God Almighty continue to bless you in all areas of your lives. To
my son Tshegofatso, may all my achievements be a motivation for you to be a better
person in life. Kea leboga, Ditlou. I would also like to appreciate the mutual support
received from everyone who assisted me to complete this study, for their
hardworking, training and assistance in various areas of the project and for also
giving me strength to keep on moving forward. To my supervisor, Professor P.W.
Mashela, thank you for your patience, advices, guidance, support and for being my
academic parent. Thank you for steering this ship to the right direction. The scientific,
statistical knowledge and the life lessons I have received through your mentorship
will forever be treasured and used effectively and efficiently. I also appreciate the
assistance received from Dr Z.P. Dube and Dr Y.M. Maila all the assistance,
suggestions and taking interest in my research field. I would also like to thank all my
colleagues at the Green Technologies Research Centre (GTRC); it was an honour to
work with you side by side. The assistance I received from the GTRC employees, Ms

ix
S.M. Seabela, Ms M.A. Mawasha, Ms R.S. Mawasha, Mr M.K. Ralefatana, Mr L.T.
Letswalo and Mr E.M. Letswalo is highly appreciated. I would like to appreciate the
financial support I have received from the National Research Foundation of South
Africa and the Agricultural Research Council-Universities Collaboration Centreꞌ for
scholarship and research, respectively. I would also like to appreciate my fellow
postgraduate students in the School of Agricultural and Environmental Sciences for
all the assistance I had received, one way or the other, during the execution of this
study.
x
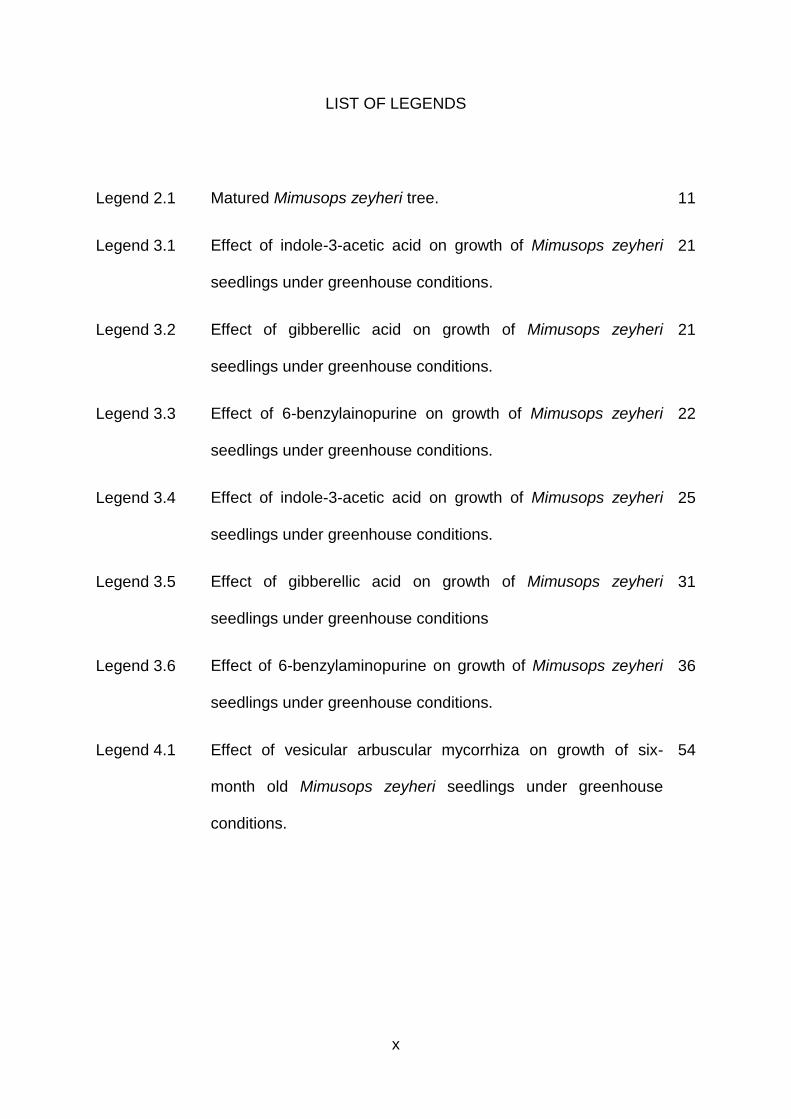
LIST OF LEGENDS
Legend 2.1 Matured Mimusops zeyheri tree. 11
Legend 3.1 Effect of indole-3-acetic acid on growth of Mimusops zeyheri
seedlings under greenhouse conditions.
21
Legend 3.2 Effect of gibberellic acid on growth of Mimusops zeyheri
seedlings under greenhouse conditions.
21
Legend 3.3 Effect of 6-benzylainopurine on growth of Mimusops zeyheri
seedlings under greenhouse conditions.
22
Legend 3.4 Effect of indole-3-acetic acid on growth of Mimusops zeyheri
seedlings under greenhouse conditions.
25
Legend 3.5 Effect of gibberellic acid on growth of Mimusops zeyheri
seedlings under greenhouse conditions
31
Legend 3.6 Effect of 6-benzylaminopurine on growth of Mimusops zeyheri
seedlings under greenhouse conditions.
36
Legend 4.1 Effect of vesicular arbuscular mycorrhiza on growth of six-
month old Mimusops zeyheri seedlings under greenhouse
conditions.
54

xi
LIST OF TABLES
Table 3.1 Partitioning mean sum of squares for leaf number and stem diameter
of Mimusops zeyheri as affected by indole-3-acetic acid.
26
Table 3.2 Effect of indole-3-indoleacetic acid (IAA) on leaf number and stem
diameter of Mimusops zeyheri seedlings.
26
Table 3.3 Quadratic relationship, coefficient of determination and computed
optimum response concentration of indole-3-acetic acid for leaf number
and stem diameter of Mimusops zeyheri.
28
Table 3.4 Partitioning mean sum of squares for accumulation of magnesium
(Mg), iron (Fe), phosphorus (P), potassium (K), calcium (Ca) and zinc
(Zn) on Mimusops zeyheri as affected by indole-3-acetic acid.
29
Table 3.5 Partitioning mean sum of squares for leaf number and stem diameter
of Mimusops zeyheri as affected by application of gibberellic acid.
31
Tables 3.6 Effect of gibberellic acid on leaf number and plant height of Mimusops
zeyheri seedlings.
32
Table 3.7 Quadratic relationship, coefficient of determination and computed
optimum response concentration of gibberellic acid for leaf number,
plant height of Mimusops zeyheri.
33
Table 3.8 Partitioning mean sum of squares for accumulation of magnesium
(Mg), iron (Fe), phosphorus (P), potassium (K), calcium (Ca) and zinc
(Zn) on Mimusops zeyheri as affected by gibberellic acid.
34
Table 3.9 Partitioning mean sum of squares for leaf number, fresh root mass,
stem diameter and dry shoot mass of Mimusops zeyheri when treated
with 6-benzylaminopurine.
37

xii
Table 3.10 Effect of 6-benzylaminopurine on leaf number and stem diameter of
Mimusops zeyheri seedlings.
38
Table 3.11 Effect of 6-benzylaminopurine on fresh root mass, dry and shoot mass of
Mimusops zeyheri seedlings.
38
Table 3.12 Quadratic relationship, coefficient of determination and computed optimum
response concentration of 6-benzylaminopurine for leaf number, fresh root
mass, dry shoot mass and stem diameter of Mimusops zeyheri.
41
Table 3.13 Partitioning mean sum of squares for accumulation of magnesium (Mg),
iron (Fe), phosphorus (P), potassium (K), calcium (Ca) and zinc (Zn) on
Mimusops zeyheri as affected by 6-benzylaminopurine.
42
Table 4.1 Partitioning mean sum of squares for selected growth variables in
Mimusops zeyheri as affected by vesicular arbuscular mycorrhiza fungi.
55
Table 4.2 Partitioning of mean sum of squares for accumulation of selected essential
nutrient elements in leaves of Mimusops zeyheri as affected by vesicular
arbuscular mycorrhiza fungi.
56

xiii
LIST OF FIGURES
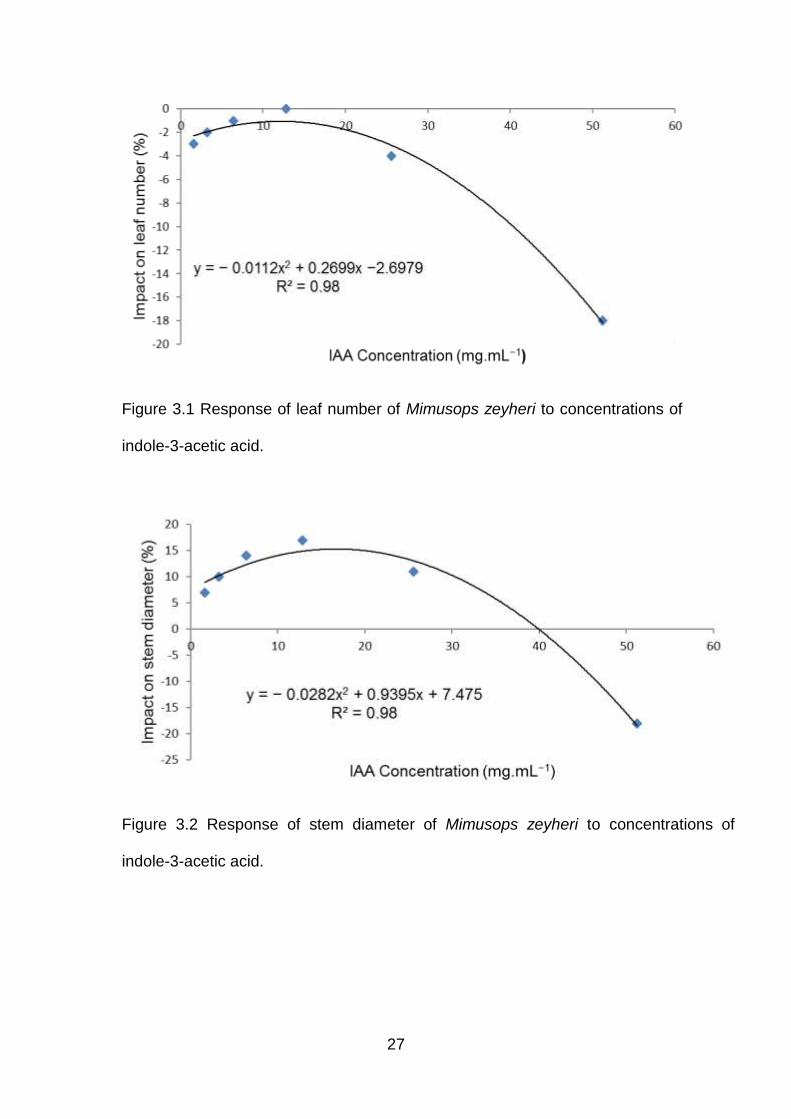
Figure 3.1 Response of leaf number of Mimusops zeyheri to concentrations of indole-
3-acetic acid.
27
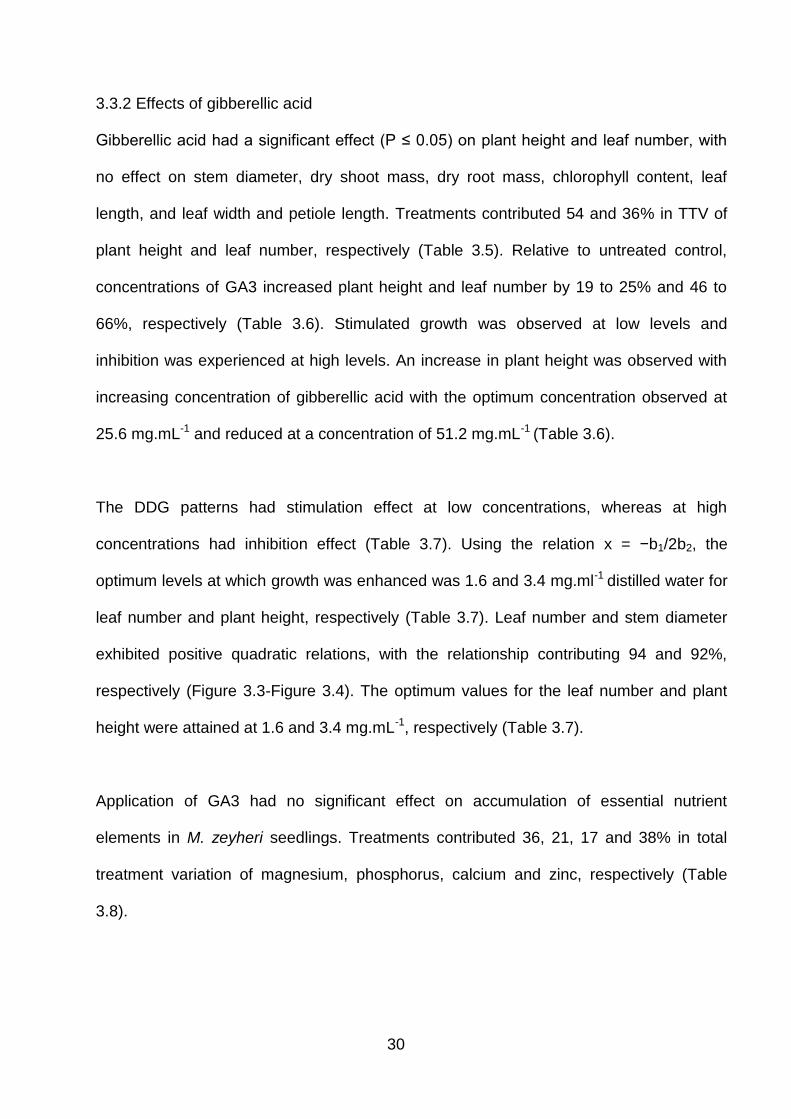
Figure 3.2 Response of stem diameter of Mimusops zeyheri to concentrations of
indole-3-acetic acid.
27
Figure 3.3 Response of leaf number of Mimusops zeyheri to concentrations of
gibberellic acid.
32
Figure 3.4 Response of plant height of Mimusops zeyheri to concentrations of
gibberellic acid.
33
Figure 3.5 Response of leaf number of Mimusops zeyheri to concentrations of 6-
benzylaminopurine.
39
Figure 3.6 Response of dry root mass of Mimusops zeyheri to concentrations of 6-
benzylaminopurine.
39
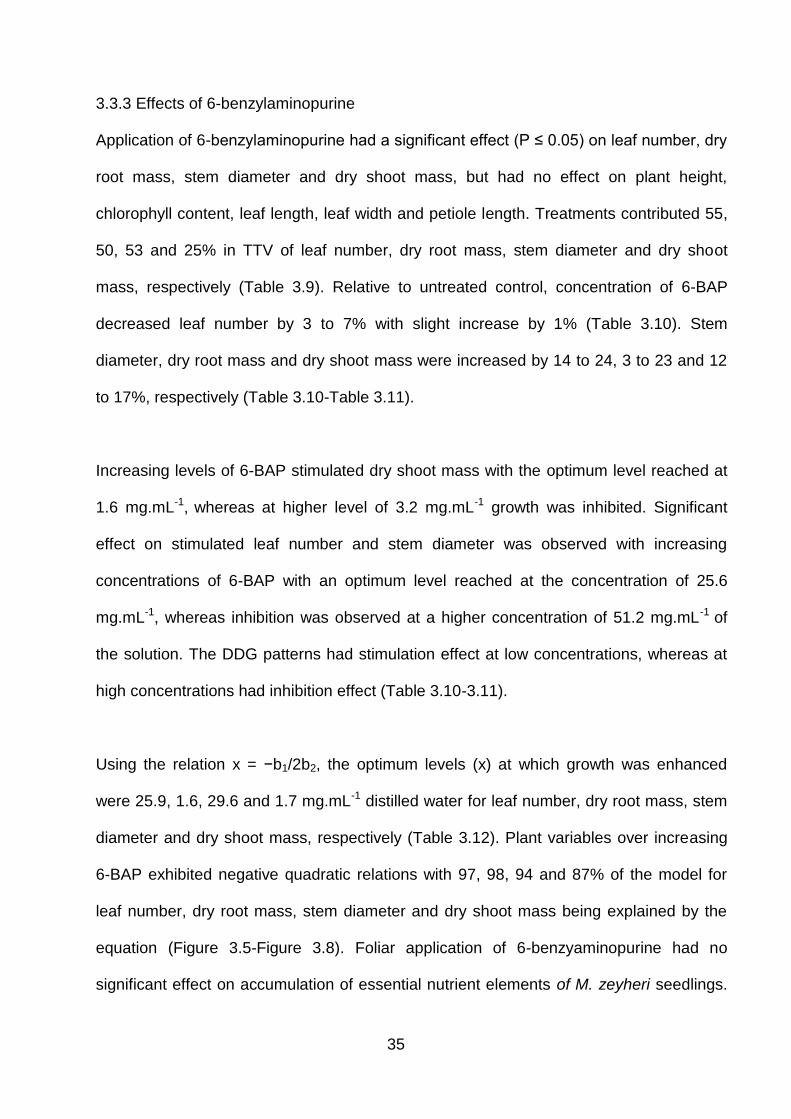
Figure 3.7 Response of stem diameter of Mimusops zeyheri to concentrations of 6-
benzylaminopurine.
40
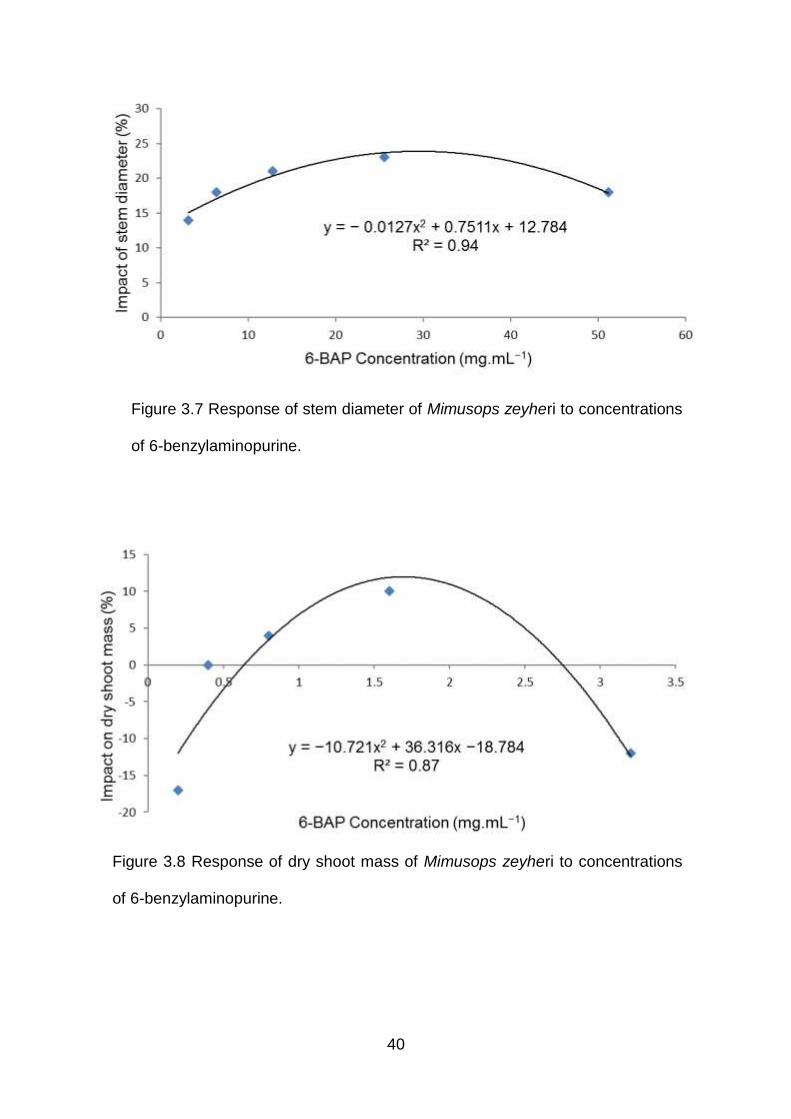
Figure 3.8 Response of dry shoot mass of Mimusops zeyheri to concentrations of 6-
benzylaminopurine.
40

xiv
LIST OF APPENDICES
8
Appendix 3.1 Analysis of variance for leaf number of Mimusops zeyheri in response to
indole-3- acetic acid under greenhouse conditions at 84 days after
initiation and application of treatments.
70
Appendix 3.2 Analysis of variance for stem diameter of Mimusops zeyheri in response
to indole-3-acetic acid under greenhouse conditions at 84 days after
initiation and application of treatments.
70
Appendix 3.3 Analysis of variance for plant height of Mimusops zeyheri in response to
indole-3-acetic acid under greenhouse conditions at 84 days after
initiation and application of treatments.
71
Appendix 3.4 Analysis of variance for leaf length of Mimusops zeyheri in response to
indole-3-acetic acid under greenhouse conditions at 84 days after
initiation and application of treatments.
71
Appendix 3.5 Analysis of variance for leaf width of Mimusops zeyheri in response to
indole-3-acetic acid under greenhouse conditions at 84 days after
initiation and application of treatments.
72
Appendix 3.6 Analysis of variance for petiole length of Mimusops zeyheri in response to
indole-3-acetic acid under greenhouse conditions at 84 days after
initiation and application of treatments.
72
Appendix 3.7 Analysis of variance for dry shoot mass of Mimusops zeyheri in response
to indole-3-acetic acid under greenhouse conditions at 84 days after
initiation and application of treatments.
73
xv
Appendix 3.8 Analysis of variance for dry root mass of Mimusops zeyheri in response
to indole-3-acetic acid under greenhouse conditions at 84 days after
initiation and application of treatments.
73
Appendix 3.9 Analysis of variance for chlorophyll content of Mimusops zeyheri in
response to indole-3-acetic acid under greenhouse conditions at 84 days
after initiation and application of treatments.
74
Appendix 3.10 Analysis of variance for Magnesium (Mg) accumulation in Mimusops
zeyheri in response to indole-3-acetic acid under greenhouse conditions
at 84 days after initiation and application of treatments.
74
Appendix 3.11 Analysis of variance for iron (Fe) accumulation in Mimusops zeyheri in
response to indole-3-acetic acid under greenhouse conditions at 84 days
after initiation and application of treatments.
75
Appendix 3.12 Analysis of variance for phosphorus (P) accumulation in Mimusops
zeyheri in response to indole-3-acetic acid under greenhouse conditions
at 84 days after initiation and application of treatments.
75
Appendix 3.13 Analysis of variance for potassium (K) accumulation in Mimusops zeyheri
in response to indole-3-acetic acid under greenhouse conditions at 84
days after initiation and application of treatments
76
Appendix 3.14 Analysis of variance for calcium (Ca) accumulation in Mimusops zeyheri
in response to indole-3-acetic acid under greenhouse conditions at 84
days after initiation and application of treatments.
76
Appendix 3.15 Analysis of variance for Zinc (Zn) accumulation in Mimusops zeyheri in
response to indole-3-acetic acid under greenhouse conditions at 84 days
after initiation and application of treatments.
77

xvi
Appendix 3.16 Analysis of variance for leaf number of Mimusops zeyheri in response to
gibberellic acid under greenhouse conditions at 84 days after initiation
and application of treatments.
77
Appendix 3.17 Analysis of variance for stem diameter of Mimusops zeyheri in response
to gibberellic acid under greenhouse conditions at 84 days after initiation
and application of treatments.
78
Appendix 3.18 Analysis of variance for plant height of Mimusops zeyheri in response to
gibberellic acid under greenhouse conditions at 84 days after initiation
and application of treatments.
78
Appendix 3.19 Analysis of variance for leaf length of Mimusops zeyheri in response to
gibberellic acid under greenhouse conditions at 84 days after initiation
and application of treatments.
79
Appendix 3.20 Analysis of variance for leaf width of Mimusops zeyheri in response to
gibberellic acid under greenhouse conditions at 84 days after initiation
and application of treatments.
79
Appendix 3.21 Analysis of variance for petiole length of Mimusops zeyheri in response to
gibberellic acid under greenhouse conditions at 84 days after initiation
and application of treatments.
80
Appendix 3.22 Analysis of variance for dry shoot mass of Mimusops zeyheri in response
to gibberellic acid under greenhouse conditions at 84 days after initiation
and application of treatments.
80
Appendix 3.23 Analysis of variance for dry root mass of Mimusops zeyheri in response to
gibberellic acid under greenhouse conditions at 84 days after initiation
and application of treatments.
81

xvii
Appendix 3.24 Analysis of variance for chlorophyll content of Mimusops zeyheri in
response to gibberellic acid under greenhouse conditions at 84 days after
initiation and application of treatments.
81
Appendix 3.25 Analysis of variance for magnesium (Mg) accumulation in Mimusops
zeyheri in response to gibberellic acid under greenhouse conditions at 84
days after initiation and application of treatments.
82
Appendix 3.26 Analysis of variance for iron (Fe) accumulation in Mimusops zeyheri in
response to gibberellic acid under greenhouse conditions at 84 days after
initiation and application of treatments.
82
Appendix 3.27 Analysis of variance for phosphorus (P) accumulation in Mimusops
zeyheri in response to gibberellic acid under greenhouse conditions at 84
days after initiation and application of treatments.
83
Appendix 3.28 Analysis of variance for potassium (K) accumulation in Mimusops zeyheri
in response to gibberellic acid under greenhouse conditions at 84 days
after initiation and application of treatments.
83
Appendix 3.29 Analysis of variance for calcium (Ca) accumulation in Mimusops zeyheri
in response to gibberellic acid under greenhouse conditions at 84 days
after initiation and application of treatments.
84
Appendix 3.30 Analysis of variance for Zinc (Zn) accumulation in Mimusops zeyheri in
response to gibberellic acid under greenhouse conditions at 84 days after
initiation and application of treatments.
84
Appendix 3.31 Analysis of variance for leaf number of Mimusops zeyheri in response to
6-benzylaminopurine under greenhouse conditions at 84 days after
initiation and application of treatments.
85
xviii
Appendix 3.32 Analysis of variance for stem diameter of Mimusops zeyheri in response
to 6-benzylaminopurine under greenhouse conditions at 84 days after
initiation and application of treatments.
85
Appendix 3.33 Analysis of variance for plant height of Mimusops zeyheri in response to
6-benzylaminopurine under greenhouse conditions at 84 days after
initiation and application of treatments.
86
Appendix 3.34 Analysis of variance for leaf length of Mimusops zeyheri in response to 6-
benzylaminopurine under greenhouse conditions at 84 days after
initiation and application of treatments.
86
Appendix 3.35 Analysis of variance for leaf width of Mimusops zeyheri in response to 6-
benzylaminopurine under greenhouse conditions at 84 days after initiation
and application of treatments.
87
Appendix 3.36 Analysis of variance for petiole length of Mimusops zeyheri in response to
6-benzylaminopurine under greenhouse conditions at 84 days after
initiation and application of treatments.
87
Appendix 3.37 Analysis of variance for dry shoot mass of Mimusops zeyheri in response
to 6-benzylaminopurine under greenhouse conditions at 84 days after
initiation and application of treatments.
88
Appendix 3.38 Analysis of variance for dry root mass of Mimusops zeyheri in response to
6-benzylaminopurine under greenhouse conditions at 84 days after
initiation and application of treatments.
88
Appendix 3.39 Analysis of variance for chlorophyll content of Mimusops zeyheri in
response to 6-benzylaminopurine under greenhouse conditions at 84
days after initiation and application of treatments.
89

xix
Appendix 3.40 Analysis of variance for magnesium (Mg) accumulation in Mimusops
zeyheri in response to 6-benzylaminopurine under greenhouse conditions
at 84 days after initiation and application of treatments.
89
Appendix 3.41 Analysis of variance for iron (Fe) accumulation in Mimusops zeyheri in
response to 6-benzylaminopurine under greenhouse conditions at 84
days after initiation and application of treatments.
90
Appendix 3.42 Analysis of variance for phosphorus (P) accumulation in Mimusops
zeyheri in response to 6-benzylaminopurine under greenhouse conditions
at 84 days after initiation and application of treatments.
90
Appendix 3.43 Analysis of variance for potassium (K) accumulation in Mimusops zeyheri
in response to 6-benzylaminopurine under greenhouse conditions at 84
days after initiation and application of treatments.
91
Appendix 3.44 Analysis of variance for calcium (Ca) accumulation in Mimusops zeyheri
in response to 6-benzylaminopurine under greenhouse conditions at 84
days after initiation and application of treatments.
91
Appendix 3.45 Analysis of variance for Zinc (Zn) accumulation in Mimusops zeyheri in
response to 6-benzylaminopurine under greenhouse conditions at 84
days after initiation and application of treatments.
92
Appendix 4.1 Analysis of variance for leaf number of Mimusops zeyheri in response to
vesicular arbuscular mycorrhiza fungi under greenhouse conditions at 90
days after initiation, inoculation and application of treatments.
92
Appendix 4.2 Analysis of variance for stem diameter of Mimusops zeyheri in response
to vesicular arbuscular mycorrhiza fungi under greenhouse conditions at
90 days after initiation, inoculation and application of treatments.
93

xx
Appendix 4.3 Analysis of variance for plant height of Mimusops zeyheri in response to
vesicular arbuscular mycorrhiza fungi under greenhouse conditions at 90
days after initiation, inoculation and application of treatments.
93
Appendix 4.4 Analysis of variance for leaf length of Mimusops zeyheri in response to
vesicular arbuscular mycorrhiza fungi under greenhouse conditions at 90
days after initiation, inoculation and application of treatments.
94
Appendix 4.5 Analysis of variance for leaf width of Mimusops zeyheri in response to
vesicular arbuscular mycorrhiza fungi under greenhouse conditions at 90
days after initiation, inoculation and application of treatments.
94
Appendix 4.6 Analysis of variance for petiole length of Mimusops zeyheri in response to
vesicular arbuscular mycorrhiza fungi under greenhouse conditions at 90
days after initiation, inoculation and application of treatments.
95
Appendix 4.7 Analysis of variance for dry shoot mass of Mimusops zeyheri in response
to vesicular arbuscular mycorrhiza fungi under greenhouse conditions at
90 days after initiation, inoculation and application of treatments.
95
Appendix 4.8 Analysis of variance for dry root mass of Mimusops zeyheri in response to
vesicular arbuscular mycorrhiza fungi under greenhouse conditions at 90
days after initiation, inoculation and application of treatments.
96
Appendix 4.9 Analysis of variance for chlorophyll content of Mimusops zeyheri in
response to vesicular arbuscular mycorrhiza fungi under greenhouse
conditions at 90 days after initiation, inoculation and application of
treatments.
96
Appendix 4.10 Analysis of variance for magnesium (Mg) accumulation in Mimusops
zeyheri in response to vesicular arbuscular mycorrhiza fungi under
greenhouse conditions at 90 days after initiation and application of
97

xxi
treatments.
Appendix 4.11 Analysis of variance for iron (Fe) accumulation in Mimusops zeyheri in
response to vesicular arbuscular mycorrhiza fungi under greenhouse
conditions at 90 days after initiation and application of treatments.
97
Appendix 4.12 Analysis of variance for phosphorus (P) accumulation in Mimusops
zeyheri in response to vesicular arbuscular mycorrhiza fungi under
greenhouse conditions at 90 days after initiation and application of
treatments.
98
Appendix 4.13 Analysis of variance for accumulation of potassium (K) in Mimusops
zeyheri in response to vesicular arbuscular mycorrhiza fungi under
greenhouse conditions at 90 days after initiation and application of
treatments
98
Appendix 4.14 Analysis of variance for accumulation calcium (Ca) in Mimusops zeyheri
in response to vesicular arbuscular mycorrhiza fungi under greenhouse
conditions at 90 days after initiation and application of treatments.
99
Appendix 4.15 Analysis of variance for accumulation of zinc (Zn) in Mimusops zeyheri in
response to vesicular arbuscular mycorrhiza fungi under greenhouse
conditions at 90 days after initiation and application of treatments.
99

xxii
ABSTRACT
The evergreen Transvaal Red Milkwood (Mimusops zeyheri) had been targeted as
an urban- and rural-greening tree in Limpopo Province due to its excellent nutritional,
medicinal and aesthetic attributes. However, in various surveys, the slow growth
characteristics of this plant species were ranked as the highest demotivator for
adoption. Slow growth in M. zeyheri limits the potential for domestication and
commercialisation of the tree and also restricts the marginal farmers to adopt the
tree as a source of income. Various sustainable products are being used for various
purposes in plant production including promotion of plant growth. The objective of
this study was to determine the effect of indole-3-acetic acid (IAA), gibberellic acid
(GA3), 6-benzylaminopurine (6-BAP) and vesicular arbuscular mycorrhiza (VAM)
each on growth and accumulation of nutrient elements, respectively, in M. zeyheri
seedlings. Six-month old seedlings were transplanted into 30-cm diameter plastic
pots containing steam-pasteurised loam soil and river sand at 3:1 (v/v) ratio. Stock
solutions of IAA, GA3 and 6-BAP were prepared in 100 mL plastic containers, with
102.2 mg of each being first dissolved in 2 mL methanol and then diluted in 98 mL
distilled water. Treatments, 0.0, 0.2, 0.4, 0.8, 1.6, 3.2, 6.4, 12.8, 25.6 and 51.2
mg.mL-1 for each plant growth regulator, were arranged in a randomised complete
block design, with five replications. At 84 days after application of treatments, plant
height, stem diameter, leaf number, leaf area, petiole length, dry root mass and dry
shoot mass were collected. The IAA concentrations had significant effects on stem
diameter and leaf number. Stem diameter and leaf number each over increasing
concentration of IAA exhibited positive curvilinear quadratic relations, with the
relationships explaining the model by 98 and 94% in respective variables. Leaf

xxiii
number and plant height over increasing GA3 concentrations exhibited positive
curvilinear quadratic relations, with the relationships being explained by 94 and 92%
of the model, respectively. Leaf number, dry root mass, stem diameter and dry shoot
mass over increasing 6-BAP concentrations exhibited positive curvilinear quadratic
relations, with the relationships being explained by 97, 98, 94 and 87%, respectively,
of the model. Vesicular arbuscular mycorrhiza had no significant effects on all plant
variables and accumulation of selected essential nutrient elements in M. zeyheri
seedlings. In conclusion, the use of IAA, GA3 and 6-BAP as foliar sprays on M.
zeyheri demonstrated for the first time the existence of density-dependent growth
(DDG) patterns in various organs on M. zeyheri, with the possibility of using the
optimum concentrations to promote growth of this plant species, M. zeyheri. Plant
growth regulators and VAM had no effect on nutrient content of M. zeyheri seedlings.
Also, VAM had no significant effect on plant growth variables. Therefore, plant
growth regulators could be used to increase the growth of the slow growing M.
zeyheri seedlings.

1
CHAPTER 1 RESEARCH PROBLEM
1.1 Background
Slow growth in indigenous trees is a challenge as it results in prolonged waiting
period prior to reproduction during which time various production inputs are required.
Slow growing plants occupy the land for an extended period of time without
reproduction, while the occupied land could have been used for other agricultural
practices to generate income. Slow growth of indigenous plants particularly, the
Transvaal red milkwood (Mimusops zeyheri), is a disadvantage to rural
entrepreneurs who would like to make a living from the tree (Mashela et al., 2013a).
Fruit of M. zeyheri provide the highest vitamin C among most edible fruits, ranging
from 50-80 mg.g-1 fresh fruit, which is much more than that in guava fruit, which
produce vitamin C content of approximately 20 mg.g-1 fresh fruit (Venter and Venter,
1996). Fruit of this tree are harvested from September through November, when
exotic fresh fruits are scarce. A team of researchers in Limpopo Province, South
Africa, had been researching and developing M. zeyheri trees for commercialisation.
However, the slow growth of M. zeyheri had been limiting its economic potential
adoption in marginal communities. Generally, the intensive exploitation of this fruit
tree had since led to its extinction in some parts of South Africa.
Exposure of plants to unfavourable environmental and, extreme climatic conditions in
particular, could produce stress on plants, resulting in stunted plant growth. South
African soils are also low in phosphorus (P), and due to widespread high soil pH; P
could exist in unavailable forms (Mangesha, 2008). Plant growth regulators (PGRs)
have been an important component of best agricultural practices, but most of their

2
uses had been restricted to high value horticultural crops, with a few exceptional
uses in indigenous plant species (Abdelgadir and Johnson, 2009). Hence, the
research intended to investigate the potential effects of using synthetic plant growth
regulators and mycorrhiza in improving growth of M. zeyheri trees.
1.2 Problem statement
Slow growth of M. zeyheri starts from seed germination through the seedling phases
to maturity. Mkhabela (2003) demonstrated that seed germination of M. zeyheri took
as long as eight weeks, with the optimum occurring at six weeks. Mimusops zeyheri,
like other fruit trees, has clearly defined shoot flushes, which alternate with root
flushes. Generally, when shoot flushes occur, root growth is dormant, vice versa
(Hartmann et al., 1988). In M. zeyheri, two shoot flushes were observed, one in
winter (May-July) and the other during flowering, which occurred at fruit ripening from
late spring (August-September) to early summer (October-December) (Mashela et
al., 2013a). Under natural conditions, M. zeyheri trees grow under marginal
conditions, particularly in rocky places, where there was a diversity of limiting factors
in terms of moisture and nutrient elements availability. The fruit tree is believed to be
highly drought tolerant (Mashela et al., 2013a).
1.3 Rationale of the study
Mimusops zeyheri trees have high nutritional and medicinal values, but had been
overlooked because they were previously viewed as weeds (Mashela and Mollel,
2002). The tree appears to be predisposed for flourishing under marginal conditions
(Mashela et al., 2013a). The use of bio-stimulants such as plant growth regulators
and vesicular arbuscular mycorrhiza (VAM) improve the availability of phosphorus

3
thereby promoting plant growth. Information on improved growth of M. zeyheri
seedlings would promote the use of M. zeyheri as source of vitamin C supplements,
particularly during the period when fresh fruits are in scarce supply. This tree is
classified as an evergreen tree and therefore, could serve invasions aesthetic roles.
Additionally, the domestication of M. zeyheri would avoid extinction and over
utilisation of this heritage plant in South Africa as articulated in the greening policies.
1.4 Purpose of the study
1.4.1 Aim
The aim of the study was to develop technologies that could improve the slow growth
rates in M. zeyheri seedlings.
1.4.2 Objectives
1. To determine the optimum level at which plant growth regulators would
enhance growth and accumulation of essential nutrient elements in M. zeyheri
seedlings.
2. To investigate the potential effects of vesicular arbuscular mycorrhiza on
growth and accumulation of essential nutrient elements in M. zeyheri trees.
1.5 Hypotheses
1. The optimum level at which plant growth regulators would enhance growth
and accumulation of nutrient elements in M. zeyheri trees can be established.
2. Vesicular arbuscular mycorrhiza would play a role on growth and accumulation
of essential nutrient elements in M. zeyheri seedlings.

4
1.6 Scientific contribution
Findings of the study would expand knowledge and provide the opportunity to
propagate this indigenous plant as a future crop. Improved growth of M. zeyheri
seedlings would encourage commercialisation of this plant species for its nutritional
and aesthetic attributes.
1.7 Reliability, validity and objectivity
Reliability of data would be based on statistical analysis of data at the probability
level of 5%. Validity would be achieved by testing treatments at various levels.
Objectivity would be achieved by ensuring that the results were discussed on the
basis of empirical evidence, thereby, eliminating all attributes of subjectivity (Leedy
and Ormrod, 2005).
1.8 Bias
Bias was minimised by ensuring that the experimental error in each experiment was
contained through sufficient replications. Also, treatments were assigned at random
within the selected research designs (Leedy and Ormrod, 2005).
1.9 Structure of mini-dissertation
Chapter 1 would focus on description of the research problem, followed by Chapter 2
that addressed work done on the research problem. Chapters 3 and 4 would focus
on addressing Objectives 1 and 2, respectively. In the final Chapter (Chapter 5),
findings in all Chapters would be summarised and integrated to provide the
significance of the findings and recommendations with respect to future research,

5
followed by conclusions. The citation in text and listing of references adopted the
Harvard style as approved by the Senate of the University of Limpopo.

6
CHAPTER 2 LITERATURE REVIEW
2.1 Introduction
Indigenous plants, adapted to semi-arid and arid areas, are usually slow growers
(Venter and Venter, 1996). Mimusops zeyheri is indigenous to the northern parts of
the former Transvaal Province of South Africa (Mashela et al., 2013a), which is
currently most of the Limpopo Province. The region is characterised by semi-arid
climate with low rainfall, which occurs mainly during hot summers (October–
December). Generally, slow growing plants invest their growth strategies in the
development of the deep root systems (Krieg, 1983). Slow growth in fruit trees limits
the commercialisation and domestication for local and international markets, which
could affect the competitiveness of indigenous fruits on fresh produce markets.
Indigenous fruit crops are gaining popularity within the agricultural industry and
efforts to improve their growth rates are underway (Garner, 1991). Plant growth
regulators (PGRs) and vesicular arbuscular mycorrhiza (VAM) had been used
successfully in agriculture to manipulate plant growth and development. However,
the effects of PRG and VAM on growth of M. zeyheri seedlings had not been
documented.
2.2 Work done on problem statement
2.2.1 Propagation of Mimusops zeyheri
Mimusops zeyheri is propagated mainly sexually through seeds (Venter and Venter,
1996). However, sexual propagation has inherent challenges of producing seedlings
that are not true-to-type (Hartmann et al., 1988). In addition, the seedlings emerge
after an extended period, while the seeds have a short-lifespan (Venter and Venter,
7
1996). Attempts were made to enhance seed germination through scarification using
sulphuric acid, hot water and mechanical techniques (Mkhabela, 2003). The results
demonstrated that seed germination under all treatments occurred mainly from five
to six weeks. Hot water treatment had moderate effects on seedling emergence,
whereas and acid scarification reduced seedling emergence (Mkhabela, 2003).
Using shoot tips, Maila (2005) developed tissue culture protocols for asexually
propagating M. zeyheri trees. The technology resulted in uniform and true-to-type
plantlets that could be used in the commercialisation of the plant. The study
eliminated any genetic variation by producing clonal rootstocks. However, the
process of shoot proliferation, initiation of roots and the subsequent weaning in the
greenhouse occurred after an extended period for at least 31 weeks (Maila, 2005).
The low multiplication rates confirmed the slow growth status in this plant species.
The protocols were improved using bio-char to shorten the extended period by half
(Maila, 2005).
2.2.2 Characteristics of Mimusops zeyheri
Mimusops zeyheri trees are evergreen and could grow to the height of 15 m under
favourable conditions (DAFF, 2012; Mashela et al., 2013a; Venter and Venter,
1996). The tree has non-aggressive root systems which enable growth under
marginal conditions (Van Wyk, 1974). However, the non-aggressive root systems
could limit the potential of M. zeyheri trees to absorb sufficient moisture and
nutrients, which promote growth. Venter and Venter (1996) noted that M. zeyheri
trees had attributes which had been associated with drought-tolerance, such as
heavily waxed leaves. Generally, drought-tolerant plants are slow growers, since

8
plant growth is partitioned in favour to root growth as opposed to shoot growth
(Krieg, 1983). Mimusops zeyheri leaves are glossy, dark green and are borne on a
spreading crown (DAFF, 2012). Mimusops zeyheri organs contain high latex content
and due to hairy shoots and young leaves, they appear to be leathery (Venter and
Venter, 1996). Young leaves and twigs are covered in rusty-brown, velvety hairs,
whereas mature leaves are dark and pale green on the dorsal and ventral sides,
respectively. The creamy white flowers, originally covered by brown petals, are
strongly scented and borne in clusters, whereas the yellow to deep orange fleshy
fruit with a glossy brittle skin, are borne on lateral ends of the previous year shoots
(Mashela et al., 2013a). In pomology, two types of fruit bearing had been identified,
namely, lateral- and tip-bearing habits. Generally, in lateral-bearing fruit trees, tree
pruning is mandatory, whereas in tip-bearing trees, pruning is not essential for
promoting yield.
The M. zeyheri trees have a strong alternate fruit bearing habit, unless they are
properly irrigated and fertilised throughout the year, but especially after the winter
shoot flushes (Mashela et al., 2013a). Mimusops zeyheri fruit contain shiny brown to
black pigmented seeds, whereby each fruit could carry one to two seed (Motlhanka
et al., 2008), with other fruit containing three seeds (Mashela et al., 2013a),
depending on the area of origin of the trees. Historically, the fruit carpus was dried
and ground for use as food during wars and long journeys (Mashela et al., 2013a).
The tree bark is grey and rough on mature trees or dark brown and smooth in small
trees (Venter and Venter, 1996). Upon emergence, the epicotyls are etiolated and
should be hardened-off to brown colours prior to transplanting into plastic bags. The
9
bark of M. zeyheri trees also contains latex (Janick and Paull, 2008). This tree had
been considered to be a multipurpose tree, since it could be used for general
purpose timber, as food supplements and aesthetic purposes (Mashela et al.,
2013a). Apparently, as the tree gains popularity, other uses would be realised.
2.2.3 Natural habitat
Mimusops zeyheri flourished in marginal areas in rocky hillsides, kloof and riverine
vegetation (Venter and Venter, 1996). In South Africa the tree is found in the wild in
Limpopo, Gauteng, North West, Mpumalanga, KwaZulu-Natal and Free State
Provinces (Venter and Venter, 1996). This indigenous tree grows best at
temperature ranges from 12 to 25ºC, with the average annual rainfall of 464 mm and
is believed to have some potential to withstand moderate frost (Venter and Venter,
1996).
Soil type plays a major role in the productivity of M. zeyheri seedlings. Most
environmental factors could have an effect on the morphology of the M. zeyheri
(Ledwaba, 2008). Incidentally, sandy soils were observed to reduce productivity of
M. zeyheri seedlings, whereas loam and clay soils had no significant effect on
different parameters (Ndhukula, 2006). Similarly, in a pot study conducted to observe
the performance of M. zeyheri seedlings in three different soil types, it was observed
that relative to loam, clay soil increased leaf growth by 19 to 20% and 9 to 58% at 9
and 12 months, respectively, after transplanting (Mashela et al., 2013a). Relative to
loam, sandy soil improved leaf and petiole growth by 10 to 88% and 21 to 49% at 9
to 12 months, respectively, after transplanting (Mashela et al., 2013a). The results of
that study suggested that M. zeyheri trees could be grown successfully in clay and
10
sandy soils, where the majority of marginal communities in Limpopo Province had
been historically settled.
2.2.4 Influence of salinity
Nchabeleng (2004) investigated the effect of potassium chloride, sodium chloride,
sodium carbonate and calcium chloride salts on growth of M. zeyheri seedlings for
two seasons, namely, summer and winter, under greenhouse conditions. Sodium
carbonate reduced chlorophyll content and increased soil pH during both growing
seasons, whereas the other salts increased electrical conductivity. Generally, sodium
carbonate impacted negatively on growth of M. zeyheri seedlings through binding
with calcium to form calcium carbonate (Nchabeleng, 2004), with calcium becoming
unavailable to plants. It could be concluded that growth of M. zeyheri trees was
improved under chloride salinity, whereas growth was inhibited under carbonate
salinity. It was evident that M. zeyheri required sodium ion, which is an essential
element in C4 plants (Nchabeleng, 2004). However, it is not clear whether M. zeyheri
is a C3 or a C4 plant.
2.2.5 Genetic variability
The genetic diversity of M. zeyheri in Limpopo Province was investigated using a
cluster analysis technique through the unweighted pair group method with arithmetic
means separating individual M. zeyheri bans into distinct clusters with average
genetic similarity estimates ranging from 47 to 89% (Maputla, 2002). Approximately
91% generic variability occurred among M. zeyheri populations in Limpopo Province,
with within population variation being at 9% (Maputla, 2002). The report provided

11
information on genetic variability and partitioning of genetic diversity, which could
help in species identification and classification within the breeding programmes.
Legend 2.1 Matured Mimusops zeyheri tree.
2.2.6 Functional nutrients in Mimusops zeyheri fruit
Mimusops zeyheri fruits have high vitamin C content which could be used as a
supplement to eliminate diseases associated with vitamin C deficiencies (Venter and
Venter, 1996). Mimusops zeyheri trees could close vitamin C deficiency gap during
spring since the trees produce fruits from mid-spring to mid-summer when most
indigenous and exotic fruit tress produce their fruits in summer (Mashela and Mollel,
2002). According to Chivandi (2012), M. zeyheri seeds were observed to have a high
vitamin E content, which ranged from 0.50 to 48.7 µg g-1, whereas Venter and Venter
(1996) reported that fruit contained 50-80 mg.g-1 fresh fruit. Seed oil in this plant
species contains glutamic acid at the highest concentration, when compared to other
amino acids, which had 1.38% of the crude protein content of total fat. Mimusops
zeyheri seed oil also contains oleic acid and the essential fatty acids, linoleic acid
and α-linoleic acid (Chivandi, 2012). The fatty acid profile of seed oil in this plant
species did not have squalene, which is a fat soluble anti-oxidant that is produced
12
naturally during cholesterol synthesis. The findings demonstrated that M. zeyheri
seeds could further be exploited as source of oleic acid, but due to low crude protein
concentration the seeds could not serve as a potential source of protein concentrate
in animal feeds (Chivandi, 2012).
2.2.7 Regional effect
Accumulation of essential nutrient elements in soil and leaves of M. zeyheri trees
after fruiting differed with location and harvest time throughout the three locations
(Ledwaba, 2008). At Cheunespoort, leaf copper and phosphorus were not affected,
whereas soil copper increased by 19%. Accumulation of zinc in leaves was observed
in high quantities in Chuenespoort after fruiting. There was an observed decrease in
leaf magnesium and leaf manganese in M. zeyheri trees. Mimusops zeyheri trees in
Bochum had an increase in accumulation of leaf manganese, leaf phosphorus and
soil zinc, whereas there was a decrease in soil copper, leaf zinc and leaf magnesium
after fruiting.
At Sekgosese, M. zeyheri trees displayed an increase in leaf manganese and a
decrease in leaf magnesium and copper, whereas there was no change in zinc and
phosphorus. From these findings it can be concluded that soil conditions and
different environmental and climatic conditions across the three regions could play a
major role on availability of essential nutrient elements in soil and leaves of M.
zeyheri seedlings. Location and time were demonstrated to play a major role on
accumulation of essential nutrient elements of M. zeyheri seedlings. Soil pH and soil
electrical conductivity were observed to have an effect on M. zeyheri trees across
Chuenespoort, Bochum and Sekgosese, which are climatically different

13
(Ledwaba, 2008). Electrical conductivity values were significantly higher in
Chuenespoort when compared to those in Bochum and Sekgosese, whereas soil pH
was significantly higher in Bochum when compared to Sekgosese and Chuenespoort
(Ledwaba, 2008).
2.2.8 Pests on Mimusops zeyheri
Claims abound that the aboveground organs of M. zeyheri trees are pest-free due to
the high latex content, whereas the fruits were host to an unidentified fruit borer
(DAFF, 2012). Mimusops zeyheri trees were observed to be resistant to the highly
injurious root-knot (Meloidogyne species) nematodes, which is a pest to a wide
range of crops (Mashela et al., 2013b). Generally, exposed to various levels of M.
incognita, it was observed that the nematode was not able to feed and reproduce on
roots of M. zeyheri seedlings. However, plant resistance to pathogens could be lost
when the tree is stressed either through environmental conditions or attack by
certain foliar pests. Under greenhouse conditions, M. zeyheri seedlings attracted
aphids and mealybugs, which was a concern since aphids carry viruses which could
result in reduced yields, while both pests release copious quantities of honeydew,
which could result in failure of nematode resistance (Pofu et al., 2011).
Mimusops zeyheri fruit were recently shown to be a host to the Mediterranean fruit
fly (Ceratitis capitata). A study was conducted after observing symptoms of the
Mediterranean fruit fly on M. zeyheri fruits, whereby M. zeyheri fruit were collected
and kept in plastic pots containing steam pasteurised growing media covered with
mesh sheath for 16 to 21 days (Dube et al., 2016). The findings of the study led to
the conclusion that M. zeyheri fruits were hosts to C. capitata. Mimusops zeyheri

14
trees, with their fruit occurring in spring to mid-summer could serve as a reservoir of
C. capitata for the tropical and subtropical fruit industries in South Africa (Dube et al.,
2016).
2.3 Improving growth in other plant species
All best agricultural practices are intended to improve plant growth and productivity.
In this literature review, only plant growth regulators and VAM were reviewed.
2.3.1 Plant growth regulators and selective uses in horticulture
Plant growth regulators (PGRs) are chemical compounds that modify plant
physiological processes (Harms and Oplinger, 1988). The PGRs had been used over
the years for their beneficial qualities of either stimulating or inhibiting plant growth
through cell division, cell enlargement and cell differentiation. Synthetic PGRs are
widely used commercially to facilitate physiological processes such as flowering, fruit
development and ripening. Post bloom application of benzyl adenine had been
documented in the successful thinning of young fruitlets of mature Empire apple
trees (Elfving and Cline, 1993). The product, when used for thinning of apple fruitlets,
it produced better results individually than when mixed with naphthalene acetic acid
or carbaryl (Elfving and Cline, 1993).
A combined use of auxins, gibberellins and cytokinins was observed to improve fruit
production in kiwifruit when applied after flower development (Lorenzo et al., 2007).
Generally, when plant growth regulators were applied together, combining two or all
three, there could be positive synergistic effects that increased fruit size, growth, fruit
diameter and length (Lorenzo et al., 2007). Gibberellic acid was successfully used in

15
improving height of tamarind (Tamarindus indica), whereas there were no significant
treatment effects in variables such as stem diameter, root length, shoot and root dry
mass and the dry root mass to dry shoot mass ratio (Dantas et al., 2012).
An increase in the number of branches was observed in both field and shade house
conditions when Jatropha curcas plants were treated with foliar application of BA at
3.0, 6.0, 9.0 and 12.0 mM (Abdelgadir and Johnson, 2009). A significant increase in
branch number and leaf number was observed at the concentration of 15 Mm and 12
mM in the greenhouse and field conditions, respectively (Abdelgadir and Johnson,
2009). However, plant height was reduced under greenhouse conditions in all tested
concentrations. Similar results were observed in baby rubber plant (Peperomia
obtusifolia) plants treated with BA where there was a significant increase in branch
number, but a decrease in plant height was observed, with a rosette of leaves
(Henny, 1986). The latter suggested that BA application in P. obtusifolia induced zinc
deficiency.
Plant growth regulators are used mainly in plant tissue culture for root and shoot
initiation in explants. Nishiwaki et al. (2000) observed the formation of somatic
embryos directly from the epidermal cells of carrot (Daucus carota) seedlings in the
medium containing ABA produced somatic embryos in sunflower (Helianthus
annuus) plants (Charriere and Hahne, 1998). Maila and Mashela (2009) observed a
highly significant effect on shoot regeneration and increased root number in Cucumis
africanus plants treated with BAP and IBA with treatment levels 0.0, 0.2, 0.4, 0.6, 0.8
and 1.0 mg.L-1 under in vitro conditions. The optimum levels at which stimulated
shoot number were observed occurred at 0.80 mg.L-1, whereas that which was
16
required for regenerating the optimum number of roots was at 0.50 mg.L-1 IBA in full
strength Murashige and Skoog (MS) medium.
2.3.2 Use of vesicular arbuscular mycorrhiza fungi in agriculture
Vesicular arbuscular mycorrhiza (VAM) fungi had been documented to form a
symbiotic relationship with plant roots aiding in environmentally stressed soil
conditions such as drought, salinity and water logging, which has direct impact on
plant growth parameters (Sharma and Yadav, 2013). Plant-VAM symbiosis also
improves nutrient absorption, especially in phosphorus deficient soils. According to
Berea and Jeffries (1995), VAM fungi obtain carbon compounds and essential
nutrient elements from the symbiotic plant roots and supply the plants with immobile
nutrient elements from the soil solution.
Improved growth of semi-wood olive trees was observed when the plants were
treated with VAM fungi (Sidhoum and Fortas, 2013). Powell and Nakrishnan (1986)
observed an increase in plant height on hardwood cuttings of kiwifruit treated with
VAM and phosphorus. A significant difference in shoot length was observed at 28
days, but at 39 days there were no significant differences in shoot length. Improved
growth on VAM-infested plants had often been related with the more efficient uptake
of nutrients, especially phosphorus from soil (Bolan, 1991). Jayne and Quigley
(2013) observed an improved growth of both annuals and perennials through
symbiosis, with perennials responding more favourably to colonisation than annuals.
Plants inoculated with VAM had better growth and reproductive response than
control plants.
17
The VAM colonised roots of cucumber (Cucumis sativus), resulting in better plant
growth and yield (Ortas, 2010). The efficacy of VAM varies with plant species since
the application depends on plant size. Generally, bigger plants require higher levels
of VAM when compared to small horticultural crops (Dames, 2016: Personal com.).
The effect of VAM could be observed after an extended period of time, mainly
because the plant at early exposure periods had failed to form symbiosis with the
VAM. According to Borkowska (2008), VAM symbiosis could take a long period since
the fungi can utilise the soil nutrients during the first year which were supposed to be
supplied to the tree and as a result the tree does not benefit from the symbiotic
relationship.
However, the VAM could improve plant growth in nutrient deficient soils. The VAM
has the ability to acquire nutrients and moisture from long distances where plant
roots are unable to reach through the developed fungal structures. Incidentally, VAM
in a dose of 1000 units per plant and a half dose of fertilisers without phosphorus
had a significant influence on vegetative growth of plum trees expressed by the trunk
cross-sectional area, whereas there was no significant effect on vigour of growth of
sour cherry trees treated with VAM (Świerczyński and Stachowiak, 2010). Therefore,
it appears that the relationship could benefit organs in plants.
Application of VAM could effectively improve growth of stressed plants. When
applied on drought stressed Orchard grass (Dacrylis glomerata) plants, VAM showed
a significant increase in shoot dry weight, tiller weight and the number of leaves
relative to the untreated control (Kyriazopoulos et al., 2014). Salt stress in plants
could be a major challenge and new salt tolerant crops are being bred in order to

18
minimise crop losses. Aliasgharzadeh et al. (2001) observed that the VAM spores
were not significantly reduced by soil salinity, but an increase in spore numbers was
observed (mean of 100 in 10 g soil). The use of VAM therefore could enable the
survival of trees under salt stress conditions, which would allow farmers an
opportunity to grow trees of their choice.
2.4 Work not yet done on problem statement
Work on improving growth in M. zeyheri seedlings under greenhouse conditions
using PGRs and VAM had not been documented. Indigenous fruits are greatly
consumed in rural areas, but research carried out on these crops is scanty, mainly
due to lack of interest in M. zeyheri for commercialisation due to its slow growing
traits. Based on the fact that no research had been conducted on about improving
the inherent slow growth of M. zeyheri using bio-stimulants, it was imperative that an
assessment be made using PGRs and VAM.

19
CHAPTER 3 RESPONSE OF MIMUSOPS ZEYHERI SEEDLINGS TO PLANT GROWTH
REGULATORS
3.1 Introduction
Slow tree growth of agricultural crops is an undesirable trait since trees occupy the land
for an extended period of time without producing fruits, while costs are incurred for
maintenance of the crop (Venter and Venter, 1996). Commercialisation and
domestication of indigenous trees is limited by slow growth which results in extinction of
the trees since they are viewed as weeds. Indigenous crops are documented to contain
high nutritional benefits and medicinal value but slow tree growth limits the use of such
crops for economic purposes by local farmers. Slow tree growth results in decreased
number of consumable crops, over exploitation of natural resources and extinction of
known food sources.
Slow tree growth can be as a result of changes in hormonal balance in response to
environmental stresses since the tree responds by frequently producing more abscisic
acid and less cytokines (Chapin et al., 1988). According to Chapin (1991), hormonal
changes triggers reduced growth in response to environmental stress and low availability
of resource supply which activates the stress response system. Plant growth regulators
are the most important component of agricultural production but their use is limited to
high value horticultural crops as opposed to field crops (Abdelgadir and Johnson, 2009).
The objective of this study was to determine the effect of indole-3-acetic acid (IAA),
gibberellic acid (GA3) and 6-benzylaminopurine (BAP) each on growth and accumulation
of essential nutrient elements of M. zeyheri seedlings.

20
3.2 Materials and methods
3.2.1 Growth conditions and preparation of materials
The study was conducted under greenhouse conditions at the Green Technologies
Research Centre (GTRC), University of Limpopo, South Africa (23°53'10"S, 29°44'15"E).
Three separate experiments were conducted with IAA, GA3 and 6-BAP as treatments
(Legend 3.1-Legend 3.6). Mimusops zeyheri seeds were extracted from fresh fruits and
shade dried. Two-month old seedlings were transplanted into 20-cm diameter plastic pots
containing steam pasteurised loam soil and sand growing mixture at 3: (v/v) ratio. The
experiments were laid on greenhouse benches with the inter and intra row spacing of 30
cm (Legend 3.1-Legend 3.6). Stock solutions of indole-3-acetic acid (IAA), gibberellic
acid (GA3) and 6-benzylaminopurine (6BAP) were prepared in 100 mL plastic containers
whereby 102.2 mg material was dissolved in 2 mL of alcohol (methanol) and 98 mL of
distilled water was added into the solution. A pipette was used to draw different
concentrations from the container into the spray bottles, which were topped up with 100
appropriate volumes of distilled water mixed with a sticker and wetter. The plants were
treated weekly with foliar application using 20 mL test solution per seedling. The foliar
sprays were applied in such a way that the test solution covered the entire plant in direct
contact of leaves, stem and meristem.
3.2.2 Experimental design
Indole-3-acetic acid trials: The experiment was carried out under greenhouse conditions
with ten treatments, namely, 0.0, 0.2, 0.4, 0.8, 1.6, 3.2, 6.4, 12.8, 25.6 and 51.2 mg.mL-1
PRGs arranged in a randomised complete block design, with five replications.

21
Legend 3.1: Effect of indole-3-acetic acid on growth of Mimusops zeyheri seedlings
under greenhouse conditions.
Gibberellic acid trials: The experiment was laid in a randomised complete block design
under greenhouse conditions with ten treatments, namely, 0.0, 0.2, 0.4, 0.8, 1.6, 3.2, 6.4,
12.8, 25.6 and 51.2 mg.mL-1, with five replicates.
Legend 3.2: Effect of gibberellic acid on growth of Mimusops zeyheri seedlings under
greenhouse conditions.

22
6-benzylaminopurine trials: The experiment was conducted under greenhouse conditions
with ten treatments, namely, 0.0, 0.2, 0.4, 0.8, 1.6, 3.2, 6.4, 12.8, 25.6 and 51.2 mg.mL-1,
replicated five times.
Legend 3.3: Effect of 6-benzylainopurine on growth of Mimusops zeyheri seedlings under
greenhouse conditions.
3.2.3 Cultural practices
NPK fertilisers were applied a day after transplanting with 5 g of 2:3:2 (26)+ 0.5% Zn +
5% S + 5% Ca fertiliser mixture per plant which provided a total of 155 mg N, 105 mg P,
and 130 mg K per ml water. Multifeed fertilisers was applied twice a month to provide
0.47 N, 0.43 K, 0.43 P, 121 Mg,1 Fe, 0.10 Cu, 0.47 Zn, 1.34 B, 4.02 Mn and 0.09 mg Mo
per mL water (Mashela, 2002). Plants were irrigated every other day with 250 mL
tapwater. Pest management was achieved through monitoring. Aphids were observed
and managed with Malasol and weeding of plants that attracts aphids.

23
3.2.4 Data collection
Plant variables: At 84 days after initiation and application of treatments, chlorophyll
content was measured from three mature leaves per plant using chlorophyll meter
(Minolta Spad-502). Plant height was measured from the soil surface to the tip of the flag
leaf and numbers of leaves per plant were counted. Stem diameter was measured 2 cm
from the distal end of stem before oven drying for 70 ºC for 72 h and weighed. Root
system were removed from pots, immersed in water, blotted dry and weighed. Area of the
leaf was obtained through measuring the leaf length and leaf width (AM350 Portable Leaf
Area Meter). Petiole length was also measured.
Nutrient analysis: At 84 days after initiation and application of treatments, plants were
severed 2 cm from the soil surface and oven dried at 70 ºC for 72 h. Dried leaves were
separated from the stem and ground into powder form using pestle and mortar. The
powdered sample was digested in 5% nitric acid, which was then mixed with a vortex
meter. The samples were then incubated in a warm water bath for an hour at 95 ºC,
cooled at room temperature and filtered, with the container covered with a foil (SW-846
EPA Method 3050B). Samples were then submitted to Limpopo Agro-food Technology
Station (LATS), where they were quantified using the Inductively coupled plasma atomic
emission spectrometry (ICP) for mineral elements.
3.2.5 Data analysis
Data for plant variables and mineral nutrient elements were subjected to analysis of
variance using SAS (SAS Institude 2008). Discrete data for leaf number was transformed
through log10(x + 1) to homogenise the variances (Gomez and Gomez, 1984), but
untransformed means were reported. The degree of freedom and their mean sum of

24
squares were partitioned to provide the total treatment variation (TTV) for different
sources of variation. The Waller-Duncan multiple range test was used to separate means
which were significant at 5% level of probability. Significant plant variables were
subjected to lines of the best fit, with quadratic equations generated used to compute
optimum concentration values. Unless stated otherwise, treatment effects were
discussed at 5% level of probability.
3.3 Results
3.3.1 Effects of indole-3-acetic acid
Effects of IAA concentrations were highly significant (P ≤ 0.01) on leaf number and stem
diameter, but had no effect on plant height, dry shoot mass, dry root mass, chlorophyll
content, leaf length, leaf width and petiole length. Treatments contributed 55 and 40% in
TTV of leaf number and stem diameter, respectively (Table 3.1). Relative to untreated
control, concentrations of IAA decreased leaf number from 18 to 1% and stem diameter
was increased by 7 to 17% (Table 3.2). The optimum values for the stem diameter and
leaf number were attained at 16.6 and 12.0 mg.mL-1, respectively. (Table 3.3)
The density-dependent growth patterns (DDG) had stimulation effect at low
concentrations, whereas at high concentrations there was inhibition effect (Table 3.2).
Using the relation x = −b1/2b2, the optimum level at which growth was enhanced 14.0
mg.mL-1 distilled water for stem diameter (Table 3.3). Plant variables over increasing IAA
exhibited negative quadratic relations for leaf number with 98% of the model being
explained by the equation (Figure 3.1), whereas there was a positive quadratic relation
for stem diameter with the model being explained by 98% (Figure 3.2). There was no
optimum value for leaf number due to reduced growth (Figure 3.1). Foliar application of

25
IAA had no significant difference on leaf nutrient content of M. zeyheri seedlings.
Treatments contributed 48, 22, 27, 24, 34 and 20% in total treatment variation of
magnesium, phosphorus, calcium and zinc, respectively (Table 3.4).
Legend 3.4: Effect of indole-3-acetic acid on growth of Mimusops zeyheri seedlings
under greenhouse conditions.

26
Table 3.1 Partitioning of mean sum of squares for leaf number and stem diameter
affected of Mimusops zeyheri as affected by indole-3-acetic acid.
Leaf number Stem diameter
Source DF MS TTV (%) MS TTV (%)
Rep 4 0.00617 27 0.22881 42
Treatment 9 0.01263 55*** 0.21473 40**
Error 36 0.00422 18 0.09839 18
Total 49 0.02302 100 0.54193 100
**Significant at P ≤ 0.05, ***Significant at P ≤ 0.01.
Table 3.2 Effect of indole-3-acetic acid on leaf number (LN) and stem diameter (STD) of
Mimusops zeyheri seedlings.
Treatment (%) Leaf numbery Impact (%)z STD (mm) Impact (%)z
0.0 78.49a − 78.00a −
1.6 76.13a −3 83.20b 7
3.2 77.15b −2 85.80b 10
6.4 78.07c −1 88.80b 14
12.8 78.68a 0 91.00c 17
25.6 75.23e −4 86.20b 11
51.2 64.02f −18 64.00d −18
yColumn means followed by the same letter were not different (P ≤ 0.05) according to
Waller-Duncan Multiple Range test.
zImpact (%) = [(treatment/control) –1] × 100.
27
Figure 3.1 Response of leaf number of Mimusops zeyheri to concentrations of
indole-3-acetic acid.
Figure 3.2 Response of stem diameter of Mimusops zeyheri to concentrations of
indole-3-acetic acid.

28
Table 3.3 Quadratic relationship, coefficient of determination and computed optimum
response concentration of indole-3-acetic acid for leaf number and stem diameter (SDM)
of Mimusops zeyheri.
Variable Quadratic relation R2 (x) mg/ml
Leaf number y = − 0.0112x2 + 0.2699x − 2.697 0.94 12.0
Stem diameter y = − 0.0282x2 + 0.9395x + 7.475 0.98 16.6
Mean optimum 14.3
x = −b1/2b2, where x is optimum concentration.

29
Table 3.4 Partitioning of mean sum of squares for accumulation of magnesium (Mg), calcium (Ca), phosphorus (P) and zinc (Zn) on
Mimusops zeyheri as affected by indole-3-acetic acid.
Magnesium Calcium Phosphorus Zinc
Source DF MS TTV (%) MS TTV (%) MS TTV (%) MS TTV (%)
Replication 4 0.58430 14 60.9057 28 249.778 47 0.65694 50
Treatment 9 1.99647 48ns 72.8943 34ns 142.668 27ns 0.26166 20ns
Error 36 1.53597 37 82.8548 38 142.329 27 0.38863 30
Total 49 4.11674 99 216.654 100 534.775 101 1.30723 100
nsNot significant at P ≥ 0.05.
30
3.3.2 Effects of gibberellic acid
Gibberellic acid had a significant effect (P ≤ 0.05) on plant height and leaf number, with
no effect on stem diameter, dry shoot mass, dry root mass, chlorophyll content, leaf
length, and leaf width and petiole length. Treatments contributed 54 and 36% in TTV of
plant height and leaf number, respectively (Table 3.5). Relative to untreated control,
concentrations of GA3 increased plant height and leaf number by 19 to 25% and 46 to
66%, respectively (Table 3.6). Stimulated growth was observed at low levels and
inhibition was experienced at high levels. An increase in plant height was observed with
increasing concentration of gibberellic acid with the optimum concentration observed at
25.6 mg.mL-1 and reduced at a concentration of 51.2 mg.mL-1 (Table 3.6).
The DDG patterns had stimulation effect at low concentrations, whereas at high
concentrations had inhibition effect (Table 3.7). Using the relation x = −b1/2b2, the
optimum levels at which growth was enhanced was 1.6 and 3.4 mg.ml-1 distilled water for
leaf number and plant height, respectively (Table 3.7). Leaf number and stem diameter
exhibited positive quadratic relations, with the relationship contributing 94 and 92%,
respectively (Figure 3.3-Figure 3.4). The optimum values for the leaf number and plant
height were attained at 1.6 and 3.4 mg.mL-1, respectively (Table 3.7).
Application of GA3 had no significant effect on accumulation of essential nutrient
elements in M. zeyheri seedlings. Treatments contributed 36, 21, 17 and 38% in total
treatment variation of magnesium, phosphorus, calcium and zinc, respectively (Table
3.8).

31
Legend 3.5: Effect of gibberellic acid on growth of Mimusops zeyheri seedlings
under greenhouse conditions.
Table 3.5 Partitioning of mean sum of squares for plant height and leaf number of
Mimusops zeyheri as affected by of gibberellic acid.
Plant height Leave number
Source DF MS TTV (%) MS TTV (%)
Rep 4 30.6988 35 0.03061 52
Treatment 9 47.5396 54** 0.02108 36**
Error 36 9.7670 11 0.0073 12
Total 49 88.0054 100 0.05904 100
**Significant at P ≤ 0.05.

32
Table 3.6 Effect of gibberellic acid on plant height and leave number of Mimusops
zeyheri seedlings.
Treatment (%) Plant heighty (cm) Impact (%)z Leaf number Impact (%)
0.0 78.49a − 5.20a −
3.2 93.27b 19 7.80a 50
6.4 93.58b 19 8.20b 58
12.8 97.20c 24 8.65c 66
25.6 97.99c 25 8.65c 66
51.2 93.07b 19 7.60d 46
yColumn means followed by the same letter were not different (P ≤ 0.05) according to
Waller-Duncan Multiple Range test.
zImpact (%) = [(treatment/control) −1] × 100.
Figure 3.3 Response of leaf number of Mimusops zeyheri to concentrations of
gibberellic acid.

33
Figure 3.4 Response of plant height of Mimusops zeyheri to concentrations of
gibberellic acid.
Table 3.7 Quadratic relationship, coefficient of determination and computed optimum
response concentration of gibberellic acid (GA3) for leaf number (NOL) and plant
height (PTH) of Mimusops zeyheri.
Variable Quadratic relation R2 (x) mg/ml
Leaf number y = −8.444x2 + 26.471x + 47.412 0.94 1.6
Plant height y = −2.9807x2 + 10.277x + 16.588 0.92 3.4
Mean optimum value 2.5
x = −b1/2b2, where x is optimum concentration.

34
Table 3.8 Partitioning of mean sum of squares for accumulation of magnesium (Mg), phosphorus (P), calcium (Ca) and zinc (Zn) on
Mimusops zeyheri as affected by gibberellic acid.
Magnesium Calcium Phosphorus Zinc
Source DF MS TTV (%) MS TTV (%) MS TTV (%) MS TTV (%)
Replication 4 0.4243 35 57.851 63 299.84 50 0.048 18
Treatment 9 0.4311 36ns 15.949 17ns 127.37 21ns 0.100 38ns
Error 36 0.3424 29 18.692 20 132.61 24 0.112 43
Total 49 1.1978 100 92.4936 100 559.826 95 0.26 100
nsNot significant P ≥ 0.05.
35
3.3.3 Effects of 6-benzylaminopurine
Application of 6-benzylaminopurine had a significant effect (P ≤ 0.05) on leaf number, dry
root mass, stem diameter and dry shoot mass, but had no effect on plant height,
chlorophyll content, leaf length, leaf width and petiole length. Treatments contributed 55,
50, 53 and 25% in TTV of leaf number, dry root mass, stem diameter and dry shoot
mass, respectively (Table 3.9). Relative to untreated control, concentration of 6-BAP
decreased leaf number by 3 to 7% with slight increase by 1% (Table 3.10). Stem
diameter, dry root mass and dry shoot mass were increased by 14 to 24, 3 to 23 and 12
to 17%, respectively (Table 3.10-Table 3.11).
Increasing levels of 6-BAP stimulated dry shoot mass with the optimum level reached at
1.6 mg.mL-1, whereas at higher level of 3.2 mg.mL-1 growth was inhibited. Significant
effect on stimulated leaf number and stem diameter was observed with increasing
concentrations of 6-BAP with an optimum level reached at the concentration of 25.6
mg.mL-1, whereas inhibition was observed at a higher concentration of 51.2 mg.mL-1 of
the solution. The DDG patterns had stimulation effect at low concentrations, whereas at
high concentrations had inhibition effect (Table 3.10-3.11).
Using the relation x = −b1/2b2, the optimum levels (x) at which growth was enhanced
were 25.9, 1.6, 29.6 and 1.7 mg.mL-1 distilled water for leaf number, dry root mass, stem
diameter and dry shoot mass, respectively (Table 3.12). Plant variables over increasing
6-BAP exhibited negative quadratic relations with 97, 98, 94 and 87% of the model for
leaf number, dry root mass, stem diameter and dry shoot mass being explained by the
equation (Figure 3.5-Figure 3.8). Foliar application of 6-benzyaminopurine had no
significant effect on accumulation of essential nutrient elements of M. zeyheri seedlings.

36
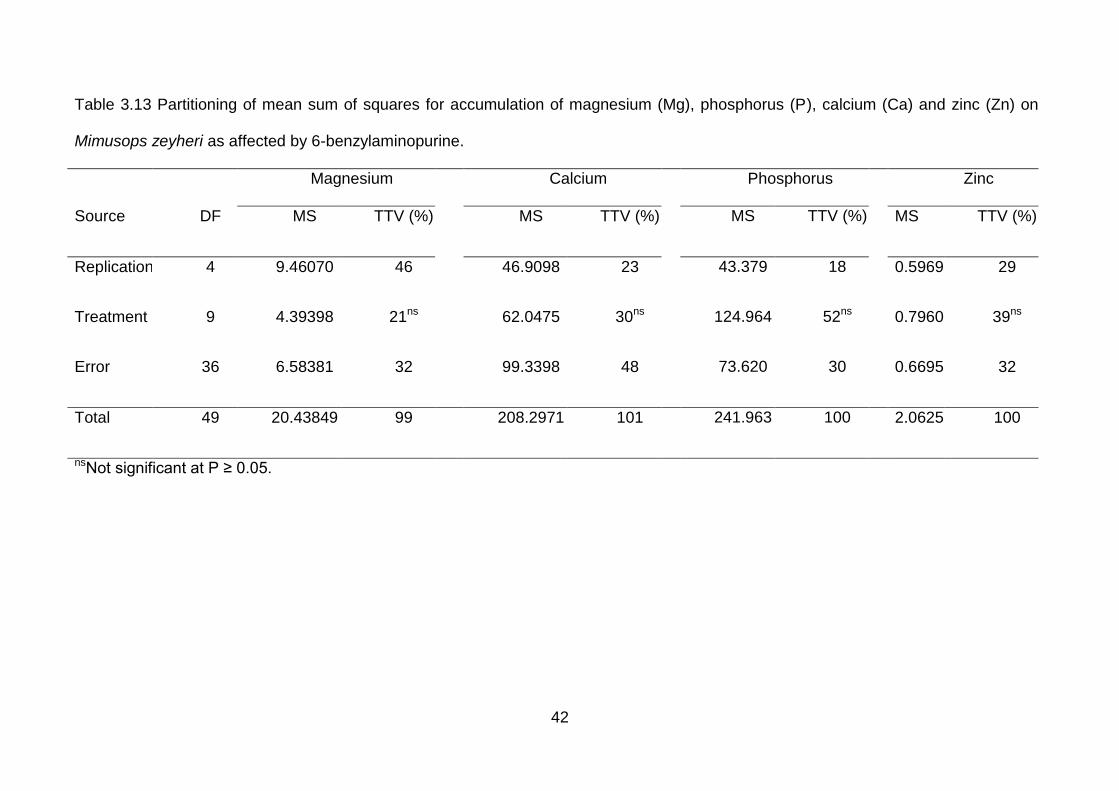
Treatments contributed 21, 29, 52, 57, 30 and 39% in total treatment variation for
magnesium, phosphorus, calcium, and zinc, respectively (Table 3.13).
Legend 3.6: Effect of 6-benzylaminopurine on growth of Mimusops zeyheri
seedlings under greenhouse conditions.

37
Table 3.9 Partitioning of mean sum of squares for leaf number, dry shoot mass, stem diameter and dry root mass of Mimusops zeyheri
as affected by 6-benzylaminapurine.
Leaf number Dry root mass Stem diameter Dry shoot mass
Source DF MS TTV (%) MS TTV (%) MS TTV (%) MS TTV (%)
Rep 4 0.21600 23 0.14650 37 0.11887 25 1.34780 64
Treatment 9 0.52106 55** 0.19744 50** 0.25344 53** 0.52480 25**
Error 36 0.206 22 0.05283 13 0.10954 23 0.23758 11
Total 49 0.94306 100 0.39677 100 0.48185 100 2.1102 100
** Significant at P ≤ 0.05.

38
Table 3.10 Effect of 6-Benzylaminopurine on leaf number and stem diameter of Mimusops
zeyheri seedlings.
Treatment (%) Leaf numbery Impact (%)z Stem diameter (cm) Impact (%)z
0.0 84.33a − 46.60a −
3.2 79.15b −6 53.00b 14
6.4 81.59a −3 54.80b 18
12.8 84.17a 0 56.60b 21
25.6 85.59a 1 57.60b 24
51.2 78.73b −7 55.40b 19
yColumn means followed by the same letter were not different (P ≤ 0.05) according to
Waller-Duncan Multiple Range test.
zImpact (%) = [(treatment/control) − 1] × 100.
Table 3.11 Effect of 6-Benzylaminopurine on dry root mass and dry shoot mass of Mimusops
zeyheri seedlings.
Treatment (%) Dry root massy (g) Impact (%)z Dry shoot mass (g) Impact (%)
0 1.40a – 1.80b –
0.2 1.52a 9 1.50a –17
0.4 1.58a 13 1.80b 0
0.8 1.62a 16 1.88b 4
1.6 1.72a 23 1.98c 10
3.2 1.44ab 3 1.58a –12
yColumn means followed by the same letter were not different (P ≤ 0.05) according to Waller-
Duncan Multiple Range test.
zImpact (%) = [(treatment/control) −1] × 100.

39
Figure 3.5 Response of leaf number of Mimusops zeyheri to concentrations of
6-benzylaminopurine.
Figure 3.6 Response of dry root mass of Mimusops zeyheri to concentrations
of 6-benzylaminopurine.
40
Figure 3.7 Response of stem diameter of Mimusops zeyheri to concentrations
of 6-benzylaminopurine.
Figure 3.8 Response of dry shoot mass of Mimusops zeyheri to concentrations
of 6-benzylaminopurine.

41
Table 3.12 Quadratic relationship, coefficient of determination and computed minimum
response concentration of 6-benzylaminopurine for leaf number, dry root mass, stem
diameter and dry shoot mass of Mimusops zeyheri.
Variable Quadratic relation R2 (x) mg/ml
Leaf number y = −0.0134x2 + 0.6933x − 7.3725 0.97 25.9
Dry root mass y = −7.092x2 + 22.256x + 4.549 0.98 1.6
Stem diameter y = −0.0127x2 + 0.7511x + 12.784 0.94 29.6
Dry shoot mass y = −10.721x2 + 36.316 − 18.784 0.87 1.7
Mean optimum value 14.63
x = −b1/2b2, where x is optimum concentration.
42
Table 3.13 Partitioning of mean sum of squares for accumulation of magnesium (Mg), phosphorus (P), calcium (Ca) and zinc (Zn) on
Mimusops zeyheri as affected by 6-benzylaminopurine.
Magnesium Calcium Phosphorus Zinc
Source DF MS TTV (%) MS TTV (%) MS TTV (%) MS TTV (%)
Replication 4 9.46070 46 46.9098 23 43.379 18 0.59697 29
Treatment 9 4.39398 21ns 62.0475 30ns 124.964 52ns 0.79605 39ns
Error 36 6.58381 32 99.3398 48 73.620 30 0.66953 32
Total 49 20.43849 99 208.2971 101 241.963 100 2.06255 100
nsNot significant at P ≥ 0.05.

43
3.4 Discussion
3.4.1 Effects of indole-3-acetic acid
Increasing concentrations of IAA had significant effect on leaf number and stem diameter
of M. zeyheri seedlings. Incidentally, IAA is the main auxin in plants, regulating growth
and developmental processes such as cell division and elongation, tissue differentiation,
apical dominance, and responses to light, gravity, and pathogens (Aloni et al., 2006).
Application of IAA did not increase total root biomass of M. zeyheri seedlings. Lack of
significant effect on dry root mass could be as a result of trees being insensitive to very
low IAA levels. Ahmed et al. (2012) observed gradual increase in shoot height with
increasing concentrations of IAA on Valencia oranges but increased shoot diameter at
low concentrations.
Indole-3-acetic acid had no significant effect on plant height which resulted in short and
bushier trees, which could be as a result of apical dominance caused by auxins being
localised at the terminal buds. Similarly, IAA reduced shoot height in eucalyptus trees by
causing a reduction in both cell numbers and cell length (Bachelard, 1968). Findings of
this study displayed no significant effect on leaf area, plant height, chlorophyll content,
petiole length, dry root and shoot mass of M. zeyheri trees treated with IAA. Contradictory
results were observed by Khudhur and Omer (2015), who observed a significant effect on
stem cuttings, number of main branches, diameter of main branches, root length, number
of main roots, leaf area, fresh and dry weight of shoot, fresh and dry weight of root, dry
matter of shoot and root, biomass of shoot and root on Dalbergia sissoo trees treated
with 500 ppm IAA.
44
Increasing concentration of IAA had inhibited dry shoot and root mass which are said to
be poor indicators of growth (Maila, 2005). Incidentally, plant height, stem diameter are
considered to be good indicators of M. zeyheri tree growth in variety of soil types. The
significant effect in stem diameter in trees treated with IAA could be due to cell division in
the cambium and xylem development which proceed in an intact stem (Little and
Savidge, 1987). Variations in cambial growth patterns along the stem have been
explained by the postulated existence of longitudinal concentration gradients of IAA
(Aloni and Zimmermann, 1983).
Plant growth regulators operate at a cellular level through cell enlargement, cell
elongation and cell division (Harms and Oplinger, 1988). Plant growth regulators were
observed to have no significant effect on the nutrient content of M. zeyheri seedlings.
According to Mashela et al. (2013b), accumulation of a certain nutrient in M. zeyheri trees
during and after fruiting resulted in an increase or decrease of the other essential
element. Leaf accumulation of magnesium, potassium, phosphorus and calcium resulted
in limiting the content of zinc and iron in M. zeyheri trees.
Soil factors are said to greatly influence availability of essential nutrient elements in the
soil systems (Mashela et al., 2013b). Extremely low iron levels were observed in all trees
treated with plant growth regulators with level which were below detection in other
treatments. Zinc was also observed to be available at low levels in M. zeyheri seedlings
subjected to foliar applications of plant growth regulators. However, findings of this
research demonstrated increased levels of magnesium, phosphorus, potassium and
calcium.

45
Increasing concentrations of foliar application of IAA had no significant effect of
accumulation of zinc in M. zeyheri seedlings. Zinc was available in extremely content in
M. zeyheri seedlings. Contradictory results were observed when foliar application of IAA
in Valencia orange trees increased zinc concentration in trees (Ahmed et al., 2012).
Incidentally, zinc is required for the synthesis of IAA. Also, low levels of iron were
observed in M. zeyheri trees treated with increasing concentrations of IAA. Similarly, low
iron content were recorded in leaves of Valencia orange trees sprays with 100, 200 and
300 ppm of IAA under zinc deficiency relative to the untreated control (Ahmed et al.,
2012).
3.4.2 Effects of gibberellic acid
Gibberellic acid had a significant effect on plant height and leaf number of M. zeyheri
seedlings. At lower levels which were below the optimum level, increase in leaf number
and plant height was observed. Similarly, application of gibberellins was observed to
promote shoot elongation mainly through internode extension and inhibited terminal bud
development in 'Manzanillo' but not in 'Ascolano' olive cultivars (Badr and Hartmann,
1972). The highest average of branches length of 26.26 and 28.19 cm for both seasons,
respectively, were observed on 3 year old peach trees treated with 100 mg.L-1 GA3 (Al-
Rawi et al., 2016). This could be due to the counter effect of gibberellic acid which when
applied in high concentrations inhibits growth of terminal buds. Generally, gibberellic acid
controls cell elongation and division in plant shoots (Harms and Oplinger, 1988).
Similarly, an increase in shoot length was also observed in eucalyptus trees sown from
seeds treated with 50 mg/L gibberellic acid solution. However, seedling growth was
accompanied by smaller dry weight (Bachelard, 1968). Increasing concentration of GA3
46
had no significant effect on root growth and development of M. zeyheri seedlings which
resulted in a small root to shoot ratio. Similarly in eucalyptus trees treated with GA roots
were observed to be shorter and lighter than the untreated seeds. Gibberellic acid had no
effect on stem diameter of M. zeyheri seedlings. Contradictory results were observed
where an increase in stem diameter of 8.63 and 18.68 mm for two consecutive seasons
were observed on 3 year old peach trees treated with 100 mg.L-1 GA3 (Al-Rawi et al.,
2016).
Application of increasing concentrations of GA3 resulted in a lack of significant effect on
leaf area of M. zeyheri seedlings, which contradicts with the findings that demonstrated a
significant increase in leaf area of 2168 and 2897 cm2 of 3 year old peach trees treated
with GA3 sprays at 100 mg.L-1 (Al-Rawi et al., 2016). Mimusops zeyheri trees treated with
GA had long leaves which were thinner when compared to tree leaves treated with IAA
and 6-BAP. Leaf length was greater than leaf width in M. zeyheri trees treated with foliar
application of GA3. Similar observations were recorded in eucalyptus leaves where
application of GA3 caused alterations in leaf shape and leaf thickness whereby the
leaves appeared to be thinner than the control (Bachelard, 1968). The alterations were
attributed to changes in cell division rather than cell elongation.
The response of a plant organ to a hormone is dependent on the concentration of the
hormone. Incidentally, one hormone can stimulate one process, while inhibiting other
processes within one organ (Hartmann et al., 1988). This research demonstrated an
increase in height of M. zeyheri trees treated with GA3, whereas trees treated with 6-BAP
and IAA were short and had more branches. Treatment of seeds with GA3 prior to
planting could modify hypocotyl growth. The increased shoot length following seed

47
treatment of seeds with GA3 was due primarily to increased hypocotyl extension and to a
lesser extent, to extension of the first internode. This can be due to the counter effect of
gibberellic acid which when applied in high concentrations inhibits growth of terminal
buds. Generally, gibberellic acid controls cell elongation and division in plant shoots
(Harms and Oplinger, 1988). The most consistent and obvious effect of GA on plant
growth is increased internode extension (Brian, 1959).
Application of increasing concentration of GA3 had no effect on accumulation of
potassium and phosphorus in M. zeyheri seedlings. The leaf content of phosphorus and
potassium was higher than that of zinc and iron in tree leaves. An increase in phosphorus
and potassium was observed in peach trees treated with foliar sprays of GA3, however, a
lack in the significant effect on leaf zinc, manganese and iron was observed (Al-rawi et
al., 2016). The result agrees with the findings of this study where there were no
significant effect on leaf zinc and iron.
3.4.3 Effects of 6-benzylaminopurine
Application of 6-BAP had a significant effect on leaf number, stem diameter, dry root
mass and plant dry shoot mass of M. zeyheri seedlings. Stimulated growth was observed
at low levels and inhibition was experienced at high levels. An increase in dry shoot mass
was observed with increasing concentration of 6-BAP with the optimum concentration
observed at 1.6 mg.mL-1 and reduced at a concentration of 3.2 mg.mL-1. Maila and
Mashela (2009), demonstrated an optimum level of 0.80 and 0.35 µM BAP for shoot
regeneration of C. myriocarpus and C. africanus, respectively, under in vitro propagation
conditions which contradicted with the relatively high optimum levels obtained in this

48
study. This could be explained in terms of the resistance induced by physical structures
such as suberins and waxes in the current study.
Increasing 6-BAP concentrations inhibited leaf area of M. zeyheri seedlings.
Contradictory results were observed when the cytokine BA had a significant effect on leaf
area of olive tree at 3.91 and 3.90 cm2 for two consecutive seasons with the control being
lowest at 3.59 and 3.62 cm2 also for two consecutive seasons (Abou-Aziz et al., 2011).
Lack of significant effect on leaf area of M. zeyheri trees treated with 6-BAP could be as
a result of a documented high content of latex on leaves of M. zeyheri leaves
(Mashela et al., 2013a) which could inhibit leaf expansion. However, an increase in leaf
width and petiole length of M. zeyheri trees by 19% was observed when trees were
grown in clay soil within a period of 9 to 12 months (Mashela et al., 2013a).
Application of 6-BAP had a stimulating effect on leaf number of M. zeyheri seedlings and
similarly it was observed that foliar application of the cytokinin BA at a concentration of
15 mmol.L-1 had a significant increase in number of leaves of five month old Jatropha
curcas trees relative to the control under shade house conditions (Abdelgadir and
Johnson, 2009). However, application of BA was reported to have no significant effect on
plant height, crown and stem diameter under field conditions. At high treatment levels
which were above the optimum, 6-BAP had an inhibitive effect on plant growth.
Incidentally, application of 6-BAP had a significant effect on stem diameter and plant
height of M. zeyheri seedlings. Mimusops zeyheri trees treated with 6-BAP were short
and highly branched with a significant effect on increase in number of leaves and stem
diameter relative to untreated control. Consequently, results of this study exhibited an
49
increase in both dry root and shoot biomass. Incidentally, Cytokinins, including BAP,
promote cell division, bud formation and stem branching in trees.
Ledwaba C.R (2008) observed increased potassium leaf content and decreased
phosphorus and magnesium contents, which contradicts with findings of this study. This
could imply that the nutrients supplied to the plant during the cause of the experiment
were not sufficient and further studies should increase fertiliser application taking into
consideration the law of the minimum quantities. When applied to morula (Sclerocarya
birrea) trees, 150 mg/L BA significantly increased morula tree mineral uptake of leaf
phosphorus, sodium, calcium, magnesium, nitrogen and potassium when compared to
the control. However, at lower levels of 50 and 100mg/L BA there were no significant
differences with respect to leaf phosphorus, sodium, nitrogen and potassium contents
whereas at 100 mg/L BA there was an observed significant increase in leaf calcium and
magnesium content relative to the control (Moashe et al., 2011).
3.4.4 Density-dependent growth patterns in Mimusops zeyheri trials
The extend at which plant organs respond to treatment depends on concentration applied
(Maila and Mashela, 2009) and as a result one hormone can stimulate one process,
while inhibiting other processes within the same plant organ (Hartmann et al., 1988).
Consequently, increased, concentration of the applied plant growth regulator beyond the
optimum level inhibited growth of M. zeyheri seedlings. The density-dependent growth
(DDG) patterns observed in all trials afforded an opportunity to compute the
concentrations that would confer optimum growth (Salisbury and Ross, 1992). The DDG
patterns are characterised by three phases, namely, stimulation, neutral and inhibition
(Liu et al., 2003).
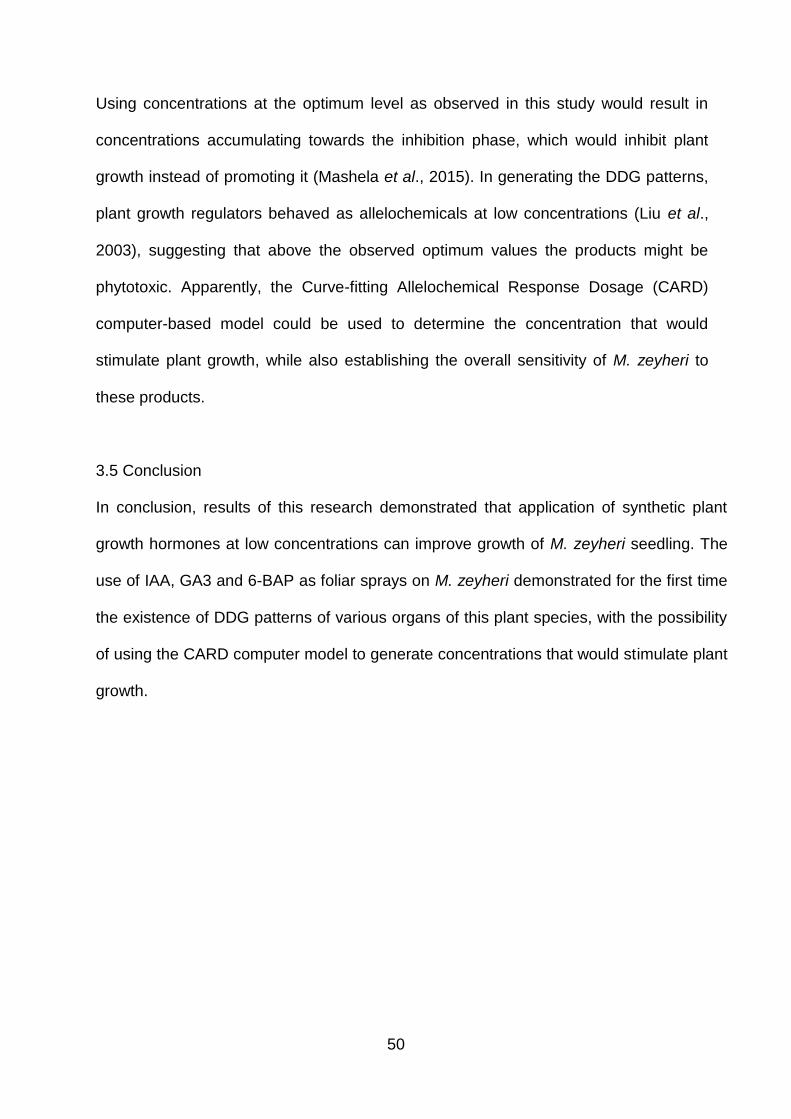
50
Using concentrations at the optimum level as observed in this study would result in
concentrations accumulating towards the inhibition phase, which would inhibit plant
growth instead of promoting it (Mashela et al., 2015). In generating the DDG patterns,
plant growth regulators behaved as allelochemicals at low concentrations (Liu et al.,
2003), suggesting that above the observed optimum values the products might be
phytotoxic. Apparently, the Curve-fitting Allelochemical Response Dosage (CARD)
computer-based model could be used to determine the concentration that would
stimulate plant growth, while also establishing the overall sensitivity of M. zeyheri to
these products.
3.5 Conclusion
In conclusion, results of this research demonstrated that application of synthetic plant
growth hormones at low concentrations can improve growth of M. zeyheri seedling. The
use of IAA, GA3 and 6-BAP as foliar sprays on M. zeyheri demonstrated for the first time
the existence of DDG patterns of various organs of this plant species, with the possibility
of using the CARD computer model to generate concentrations that would stimulate plant
growth.

51
CHAPTER 4 RESPONSE OF MIMUSOPS ZEYHERI TO VESICULAR ARBUSCULAR
MYCORRHIZA
4.1 Introduction
Mimusops zeyheri fruit trees are being assessed as alternative crops in marginal
communities of Limpopo Province, Republic of South Africa where conditions are
suboptimal (Mashela and Mollel, 2002). The introduction of indigenous trees, which are
recorded to contain high nutritional values, is a practice that could ensure food security.
However, M. zeyheri trees are slow growers. The use of vesicular arbuscular mycorrhiza
(VAM) could be effective in improving growth of M. zeyheri due to its ability to enhance
moisture and nutrient uptake (Gavito et al., 2002). However, the effect of VAM on growth
and nutrient accumulation in leaves of M. zeyheri is not documented. The objective of
this study was to investigate the effect of VAM fungi on growth and accumulation of
essential nutrient elements in M. zeyheri trees.
4.2 Materials and methods
4.2.1 Growth conditions and preparations
The study would be conducted under greenhouse conditions at the Green Technology
Research Centre (GTRC), University of Limpopo, South Africa (23◦53’10’’S, 29◦44’15’’E).
Day/night temperatures averaged 28/21oC, with maximum temperatures controlled using
thermostatically-activated fans. Relative humidity will be maintained at a high level
through wet walls.
52
4.2.2 Experimental design and inoculation
The VAM experiment contained eight treatments, namely, 0, 10, 20, 30, 40, 50, 60 and
70 g VAM, as recommended by the supplier (MycorootTM, Pietermaritzburg). Treatments
were replicated seven times and arranged in a randomised complete block design
(legend 4.1). Uniform M. zeyheri seedlings were hardened-off by exposing seedlings to
the natural environment for five hours per day for a week before transplanting. Seedlings
were transplanted in 30-cm-diameter plastic pots containing steam-pasteurised loam soil
and river sand at 3:1 (v\v) ratio. The seedlings were placed on greenhouse benches with
an inter-row spacing of 45 cm and intra-row spacing of 45 cm.
4.2.3 Cultural practices
Fertilisers were applied a day after transplanting using 5g 2:3:2 (26) fertiliser mixture per
plant which provided a total of 155 mg N, 105 mg P and 130 mg K per ml water.
Multifeed fertiliser was applied twice a month to provide 0.47 N, 0.43 k, 0.43 P, 121 Mg, 1
Fe, 0.10 Cu, 0.47 Zn, 1.34 B, 4.02 Mn and 0.09 mg Mo per ml water (Mashela, 2002).
Plants were irrigated with 500 ml chlorine-free tap water every other day. Pests were
scouted and aphids were controlled using Malasol as per label instruction.
4.2.4 Data collection
At 84 days after initiation of treatments, stem diameter, plant height, number of leaves,
number of shoots, chlorophyll content, dry shoot mass, dry root, leaf length, leaf width,
petiole length and leaf. Tops were severed at the soil surface and oven-dried at 70ºC for
72 h. Mature dried leaves were separated from the stem and ground into powder using
pestle and mortar. The powdered sample was digested in 5% nitric acid, which was then
mixed with a vortex meter. The samples were then incubated in a warm water bath for an

53
hour at 95ºC, cooled at room temperature and filtered, when the containers were each
covered with a foil (SW-846 EPA Method 3050B). Samples were then submitted to the
Limpopo Agrofood Station (LATS), where they were quantified using the Inductively
coupled plasma atomic emission spectrometry (ICP) for mineral elements.
4.2.5 Data analysis
Data were subjected to analysis of variance through the SAS software version 10.0 (SAS
Institute, 2008). Mean separation was achieved using Waller-Duncan Multiple Range
test.
4.3 Results
4.3.1 Responses of Mimusops zeyheri growth to VAM
Application of VAM had no significant effects on plant height, stem diameter, leaf
number, leaf width, leaf length, petiole length, chlorophyll content, dry root and dry shoot
mass (Table 4.1).
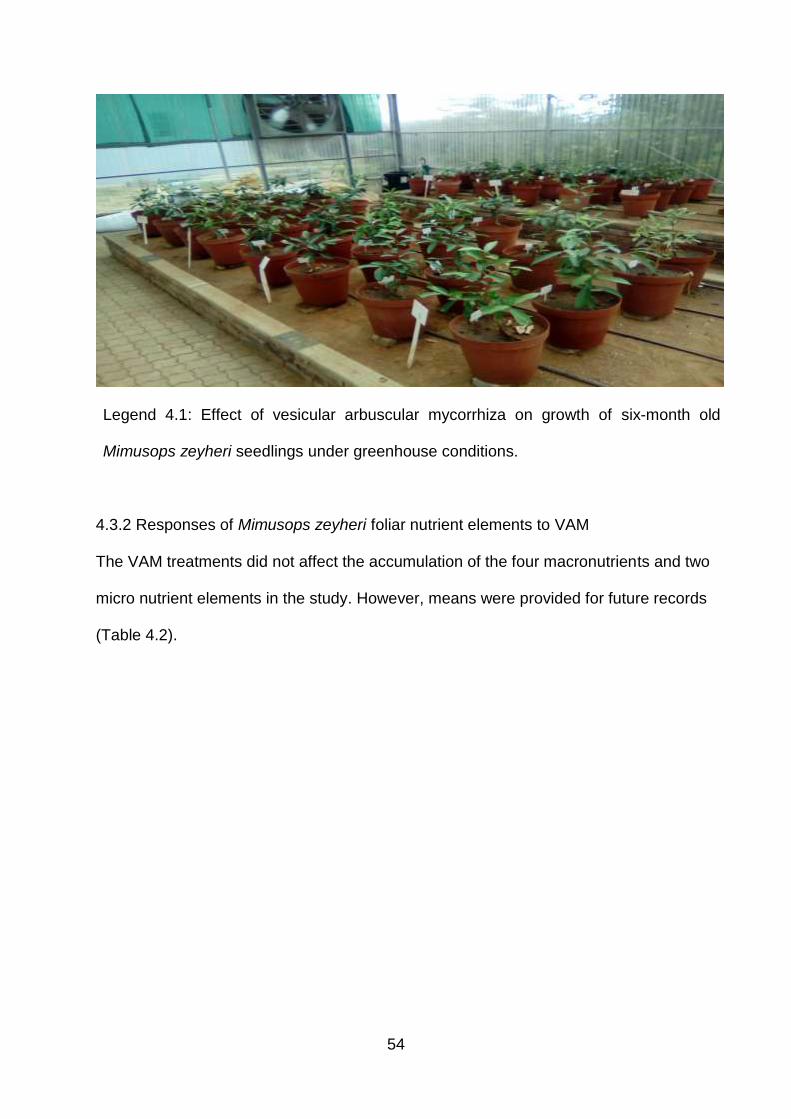
54
Legend 4.1: Effect of vesicular arbuscular mycorrhiza on growth of six-month old
Mimusops zeyheri seedlings under greenhouse conditions.
4.3.2 Responses of Mimusops zeyheri foliar nutrient elements to VAM
The VAM treatments did not affect the accumulation of the four macronutrients and two
micro nutrient elements in the study. However, means were provided for future records
(Table 4.2).

55
Table 4.1 Effect of vesicular arbuscular mycorrhiza on selected growth variables in Mimusops zeyheri seedlings.
Treatment (%) Stem diameter (cm)y Leaf number Dry shoot mass (g) Plant height (cm) Leaf length (cm)
0 1.3014 123.71 43.833 73.829 11.457
10 1.2786 108.00 43.556 61.057 12.000
20 1.2771 106.43 38.079 59.257 11.900
30 1.1957 104.14 41.583 62.000 11.557
40 1.2286 121.29 36.633 58.557 10.629
50 1.4557 115.71 47.790 68.571 11.157
60 1.3329 122.57 42.110 58.214 10.914
70 1.2629 82.14 41.336 63.457 11.671
LSD0.05 0.2453 37.055 12.405 13.954 1.4818
yColumn means followed by the same letter were not different according to Waller-Duncan Multiple range test.

56
Table 4.2 Effect of vesicular arbuscular mycorrhiza on selected essential nutrients elements in leaves of Mimusops zeyheri
seedlings.
Treatments (%) Magnesium (mg.ml-1)y Calcium (mg.ml-1) Phosphorus (mg.ml-1) Potassium (mg.ml-1) Zinc (mg.ml-1)
0 17.786 31.629 23.229 22.514 0.3209
10 18.943 39.586 26.700 24.386 0.4539
20 16.34 39.729 25.586 25.857 1.4967
30 19.100 36.100 21.857 22.921 1.4343
40 19.743 40.200 26.114 25.771 0.4223
50 18.600 36.957 19.229 18.157 0.5376
60 18.757 37.300 26.957 24.357 0.3503
70 18.557 38.871 17.714 27.543 0.4630
LSD0.05 4.5024 16.153 7.7427 6.6154 1.6161
yColumn means followed by the same letter were not different according to Waller-Duncan Multiple range test.

57
4.4 Discussion
Application of VAM had no significant effect on plant height, stem diameter, leaf number,
leaf width, leaf length, petiole length, chlorophyll content, dry root mass and shoot mass
of M. zeyheri seedlings. The observations in the current study did not support those in
woody plants (Sidhoum and Fortas, 2013; Powell and Nakrishnan, 1986; Świerczyński
and Stachowiak, 2010). The VAM treatments resulted in depressed growth of sour
orange (Citrus aurantium) seedlings under high phosphorus supply (Jifon et al., 2002).
Contradictory results were observed when a significant increase in leaf area, plant height,
stem diameter and plant biomass was observed in Orange (Citrus sinensis) seedlings
during screening of five Glomus species of VAM, namely, Glomus, mosseae (UK), G.
mosseae (USA), G. clarium, G. caledonium and G. etunicatum (Ortas, 2002). Mycorrhiza
symbiosis in plants results in enhanced moisture and nutrient uptake, which can be
observed through increased plant height, stem diameter, leaf number and total biomass
(Sharma et al., 2012; Usha et al., 2004). Extensive experimental trials demonstrated
improved tree growth when VAM symbiosis was successful (Świerczyński and
Stachowiak, 2010; Tong et al., 2006). However, lack of a significant effect on all tested
plant growth variables of M. zeyheri seedlings in the current study could not be
exclusively attributed to lack of mycorrhiza symbiosis. Generally, VAM treatment is
effective under stressful conditions such as nutrient deficiency and salinity (Juniper and
Abbott, 1993). Apparently, in the current study there were no stressful conditions.
Increasing the levels of VAM applied on M. zeyheri trees had no significant effect on tree
growth and neither accumulation of essential nutrient elements, which could imply that
the relation was at the neutral phase, where there was no observed stimulation nor

58
inhibition of plant growth. The levels of VAM used in this experiment should be adjusted
in another experiment to investigate the effect on plant growth under stressful conditions.
Generally, VAM is used to enhance the absorption of phosphorus (Calvet et al., 2004),
particularly in South Africa where the soils are deficient in this element (DOA, 2003). In
the current study, phosphorus or any essential element was not deficient. Apparently,
under luxurious soil conditions, the efficacy of VAM on absorption of nutrients is curtailed.
Extensive studies had proven that mycorrhiza application on trees enhance nutrient
uptake especially of scarce and immobile nutrients such as phosphorus and nitrogen
(Bolan, 1991; Sidhoum and Fortas, 2013).
4.5 Conclusion
The findings of the current study demonstrated that M. zeyheri seedlings had no
symbiotic association with the used VAM. A screening experiment should be conducted
using various species of the VAM on M. zeyheri seedlings to observe the suitable fungus
under different stressful conditions such as in phosphorus- deficient and/or saline soils.

59
CHAPTER 5 SUMMARY, SIGNIFICANCE OF FINDINGS, RECOMMENDATIONS AND
CONCLUSIONS
5.1 Summary
At 84 days after initiation and application of treatments plant height, stem diameter, leaf
number, leaf area, petiole length, dry root mass and dry shoot mass were collected. The
IAA concentrations had significant effects on stem diameter and leaf number. Stem
diameter and leaf number each over increasing concentration of IAA exhibited positive
curvilinear quadratic relations, with the relationships explaining the model by 98 and 94%
in respective variables. Leaf number and plant height over increasing GA3
concentrations exhibited positive curvilinear quadratic relations, with the relationships
being explained by 94 and 92% of the model, respectively. Leaf number, dry root mass,
stem diameter and dry shoot mass over increasing 6-BAP concentrations exhibited
positive curvilinear quadratic relations, with the relationships explaining 97, 98, 94 and
87%, respectively, of the model. Applying IAA, GA3 and 6-BAP at 14.3, 2.5 and 14.63%,
respectively, would improve growth of M. zeyheri seedlings. Application of vesicular
arbuscular mycorrhiza (VAM) fungi had no significant effects on all plant variables and
accumulation of selected essential nutrient elements.
5.2 Significance of findings
The observed quadratic relations between various plant variables of M. zeyheri and the
increasing concentrations of plant growth regulators (PGRs) allowed the determination of
optimum quantities of PGRs for improving growth of M. zeyheri seedlings under nursery
conditions. Also, lack of growth and nutrient accumulation in M. zeyheri leaves was
important since this provided some clue as to where VAM should be used to improve
growth in this plant species.

60
5.3 Recommendations
Synthetic plant growth regulators could be effectively used in enhancing growth of the
slow growing M. zeyheri seedlings at the obtained optimum levels. The recommended
optimum levels are 14.3, 2.5 and 14.63% for IAA, GA3 and 6-BAP, respectively, should
be validated under various conditions, including field conditions. Another experiment
should be conducted using VAM on M. zeyheri seedlings under stressful conditions such
as phosphorus-deficient or salinity-affected soils. Additionally, screening for suitable
Glomus species strain could be considered for future studies.
5.4 Conclusions
Application of indole-3-acetic acid, gibberellic acid and 6-benzylaminopurine could be
used to improve growth of M. zeyheri seedlings using the derived optimum
concentrations. The use of PGRs and VAM to stimulate growth of M. zeyheri seedlings,
should promote the potential commercialisation of this important alternative underutilised
indigenous fruit tree.
61
REFERENCES
ABOU-AZIZ, A.B., HEGAZI, E.S., YEHIA, T.A., KASSIM, N.E. and T.S. MAHMOUD. 2011.
Growth, flowering and fruiting of Manzalo olive trees as affected by benzyladenine.
Journal of Horticultural Science and Ornamental Plants 3:244–251.
ALIASGHARZADEH, N., RASTIN, N.S. and H.T.A. ALIZADEH. 2001. Occurrence of
arbuscular mycorrhiza fungi in saline soils of the Tabriz Plain of Iran in relation to
some physical and chemical properties of soil. Mycorrhiza 11:119–122.
ALONI, R. and M.H. ZIMMERMAN. 1983. The control of vessel size and density along the
plant axis. Differentiation 24:203–208.
ALONI, R., ALONI, E., LANGHANS, M. and C.I. ULLRICH. 2006. Role of cytokinin and
auxin in shaping root architecture: Regulating vascular differentiation, lateral root
initiation, root apical dominance and root gravitropism. Annals of Botany 97:883–893.
AL-RAWI, W.A.A., AL-HADETHI, M.E.A. and A. KAREEM. 2016. Effect of foliar application
of gibberellic acid and seaweed extract spray on growth and leaf mineral content on
peach trees. Iraqi Journal of Agricultural Sciences 47:98–105.
ABDELGADIR, H.A. and S.D. JOHNSON. 2009. Promoting branching of a potential biofuel
crop Jatropha curcas by foliar application of plant growth regulators. Journal of Plant
Growth Regulation 58:287–295.
AHMED, A.A.H., KHALIL, M.K., ABD EI-RAHMAN, A.M. and N.A.M. HAMED. 2012. Effect
of zinc, tryptophan and indole acetic acid on growth, yield and chemical composition
of Valencia orange trees. Journal of Applied Sciences Research 8:901–914.
BACHELARD, E.P. 1968. Effects of seed treatment with gibberellic acid on subsequent
growth of some Eucalyptus seedlings. New Phytologist 67:595–604.
62
BADR, S.A. and H.T. HARTMANN. 1972. Flowering response of the olive (Olea europaea)
to certain growth regulators applied under inductive and noninductive environments.
Botanical Gazette 133:387–392.
BAREA, J.M. and P. JEFFRIES. 1995. Arbuscular mycorrhizas in sustainable soil plant
systems. In Mycorrhiza: Structure, Function, Molecular Biology and Biotechnology,
Varma, A. and B. Hock (eds.). Springer-Verlag, Berlin:
BRIAN, P.W. 1959. Effects of gibberellins on plant growth and development. Cambridge
Philosophical Society 43:37–77.
BOLAN, N.S. 1991. A critical review on the role of mycorrhiza fungi on the uptake of
phosphorus by plants. Plant and Soil 134:189–207.
BORKOWSKA, B., BALLA, I., SZUCS, E. and B. MICHA-CZUK. 2008. Evaluation of the
response of micropropagated peach rootstock ‘Cadman’ and cv. ‘Cresthaven’ to
mycorrhization using chlorophyll a fluo-rescence method. Journal of Fruit and
Ornamental Plant Research 16:243–260.
CALVET, C., ESTAUN, V., CAMPRUBI, A., HERNANDEZ-DORREGO, A., PINOCHET, J.
and M.A MORENO. 2004. Aptitude for mycorrhiza root colonization in Prunus
rootstocks. Scientia Horticulturae 100:39–49.
CHARRIERE, F. and G. HAHNE. 1998. Induction of embryogenesis versus caulogenesis on
in vitro cultured sunflower (Helianthus annuus L.) immature zygotic embryos: Role of
plant growth regulators. Plant Science 137:63–71.
CHAPIN, F.S. 1991. Integrated response of plants to stress. BioScience 41:29–36.
CHAPIN, F.S. and I.F. WARDLAW. 1988. Effect of phosphorus deficiency on source-sink
interactions between the flag leaf and developing grain of barley. Journal of
Experimental Botany 39:165–177.
63
CHIVANDI, E. 2012. In vitro and in vivo chemical characterisation of Kigelia africana,
Mimusops zeyheri and ximenia caffra nuts and nut meals. PhD Thesis submitted to
the University of Witwatersrand, Johannesburg. South Africa.
DANTAS, A.C.V.L., QUEIROZ, J.M.O., VIEIRA, E.L. and V.D. ALMEIDA. 2012. Effect of
gibberellic acid and the biostimulant stimulate® on the initial growth of Tamarind
Revista Brasileira de Fruticultura, Jaboticabal 34:1–11.
DEPARTMENT OF AGRICULTURE. 2003. Using kraal manure as a fertiliser. Pretoria.
South Africa.
DEPARTMENT OF AGRICULTURE, FORESTRY and FISHERIES. 2012. Red milkwood.
Pretoria, South Africa.
DUBE, Z.P., MASHELA, P.W. and R.V. MATHABATHA. 2016. Mediterranean fruit fly on
Mimusops zeyheri indigenous to South Africa: A threat to the horticulture industry.
Pest Management Science 72:1517–1520.
ELFVING, D.C. and R.A. CLINE. 1993. Benzyladenine and other chemicals for thinning
‘Empire’ Apples. Journal of American Society for Horticultural Science 118:593–598.
GARNER, J.C. 1991. Alternative crop production research: A progress report. North Dakota
State University, USA.
GAVITO, M.E., BRUHN, D. and I. JAKOBSEN. 2002. Phosphorus uptake by arbuscular
mycorrhizal hyphae does not increase when the host plant grows under atmospheric
CO2 enrichment. New Physiologist 154:751–760.
GOMEZ, K.A. and A.A. GOMEZ. 1984. Statistical procedure for agricultural research. Wiley:
New York.
HARMS, C.L. and E.S. OPLINGER. 1988. Plant growth regulators: Their use in crop
production. North Central Region Extension Publication 303.

64
HARTMANN, H.T., KESTER, D.E., DAVIES, F.T. and R.L. GENEVE. 1988. Plant
propagation: Principles and practices. Prentice Hall: New Jersey.
HENNY, R.J. 1986. BA induces lateral branching of Peperomia obtusifolia. Journal of
American Society for Horticultural Science 20:115–116.
JANICK, J. and R.E. PAULL. 2008. Mimusops zeyheri Transvaal red milkwood. In: Janick,
J. and R.E. Paull (eds.). The Encyclopaedia of Fruit and Nuts. CABI: Wallingford,
United Kingdom.
JAYNE, B. and M. QUIGLEY. 2013. Influence of arbuscular mycorrhiza on growth and
reproductive response of plants under water deficit: A meta-analysis. Mycorrhiza
24:109–119.
JIFON, J.L., GRAHAM, J.H., DROUILLARD, D.L. and J.P. SYVERTSEN. 2002. Growth
depression of mycorrhizal citrus seedlings grown at high phosphorus supply is
mitigated by elevated CO2. New Phytologist 153:133–142.
JUNIPER, S. and L. ABBOTT. 1993. Vesicular-arbuscular mycorrhiza and soil salinity.
Mycorrhiza 4:45–57.
KHUDHUR, S.A. and T.J. OMER. 2015. Effect of NAA and IAA on stem cuttings of
Dalbergia sissoo (Roxb). Journal of Biology and Life Sciences 6:2157–6076.
KRIEG, D.R. 1983. Sorghum. In: Teare, J.D. and M.M. Peet (eds.). Crop water relations.
Wiley: New York.
KYRIAZOPOULOS, A.P., ORFANOUDAKIS, M., ABRAHAM, E.M., PARISSI, Z.M. and N.
SERAFIDOU. 2014. Effects of arbuscular mycorrhiza fungi on growth characteristics
of Dactylis glomerata L. under drought stress conditions. Notulae Botanicae Horti
Agrobotanici 42:132–137.
LEEDY, P.D. and J.E. ORMROD. 2005. Practical research: Planning and design. Prentice
Hall: Upper Saddle River, New Jersey.

65
LEDWABA, R.C. 2008. Baseline of selected essential nutrient elements of an indigenous
fruit tree (Mimusops zeyheri) under natural conditions. Dissertation University of
Limpopo, South Africa.
LEMMENS, R.H.M.J. 2008. Mimusops zeyheri Sond. In: Louppe, D. (ed.). Plant resource of
tropical Africa (PROTA) 7: Timbers/Bios d’oeuvre. [CD-Rom]. Wageningen,
Netherlands, Plant Resource of Tropical Africa 89–94.
LITTLE, C.H.A. and R.A. SAVIDGE. 1987. The role of plant growth regulators in forest tree
cambial growth. Plant Growth Regulation 6:137–169.
LIU, D.L., AN, M., JOHNSON, I.R. and J.V. LOVETT. 2003. Mathematical modelling of
allelopathy. III. A model for Curve-fitting Allelochemical Response Dosage. Non–
linearity in Biology, Toxicology and Medicine 1:37–50.
LORENZO, E.R., LASTRA, B., OTERO, V. and P.P. GALLEGO. 2007. Effect of three plant
growth regulators on kiwifruit development. Acta Horticulturae 5:1–6.
MAILA, Y.M. 2005. In-vitro propagation of Mmupudu (Mimusops zeyheri) fruit tree. Master
Dissertation submitted to the University of the North, Sovenga, South Africa.
MAILA, Y.M. and P.W. MASHELA. 2009. Optimisation of hormones for in vitro propagation
of Cucumis africanus to serve as nematode-resistant rootstocks in watermelon
production. African Crop Science Conference Proceedings 11:187–189.
MANGESHA, A.T. 2008. Characterizing phosphate desorption kinetics from soil: An
approach to predicting plant available phosphorus. PhD Thesis submitted to the
University of Pretoria, Johannesburg. South Africa.
MAPUTLA, M.D. 2002. Evaluation of genetic diversity of Mmupudu (Mimusops zeyheri) in
three regions of Limpopo Province. Master Dissertation submitted to the University of
the North, Sovenga, South Africa.

66
MASHELA, P.W. 2002. Ground wild cucumber fruits supress number of Meloidogyne
incognita on tomato in micro-plot. Nematropica 32:13–19.
MASHELA, P.W. and N. MOLLEL. 2002. Farmer–identified and selected indigenous fruit
tree with suitable attributes for smallholder farming systems in South Africa’s
Northern Province. South African Journal for Agricultural Extension 30:1–12.
MASHELA, P.W., DUBE, Z.P. and K.M. POFU. 2015. Managing the phytotoxicity and
inconsistent nematode suppression in soil amended with phytonematicides. In:
Meghvansi, M.K. and A. Varma (eds.). Organic amendments and soil
suppressiveness in plant disease management. Springer International Publishing:
Heidelberg, Switzerland.
MASHELA, P.W., POFU, K.M. and B. NZANZA. 2013a. Responses of Mmupudu
(Mimusops zeyheri) indigenous fruit tree to three soil types. African Journal of
Agricultural Research 8:1066–1069.
MASHELA, P.W., TSEKE, P.E., POFU, K.M. and T.P. MAFEO. 2013b. Potential
commercialisation of Mimusops zeyheri: An indigenous tree selected for research
and development through indigenous knowledge systems. African Crop Science
Conference Proceedings 11:667–669.
MKHABELA, B.N. 2003. Influence of various scarification methods on emergence of
Mimusops zeyheri seeds. Master Dissertation submitted to the University of the
North, Sovenga, South Africa.
MOATSHE, O.G., EMONGOR, V.E. and O. OAGILE. 2011. Effect of benzyladenine (BA) on
fruit set and mineral nutrition of morula (Sclerocarya birrea subspecies caffra).
African Journal of Plant Science 5:268–272.
MOTLHANKA, D.M.T., MOTLHANKA, P. and T. SELEBATSO. 2008. Edible indigenous wild
fruit plants of eastern Botswana. International Journal of Poultry Science 7:457–460.
67
NCHABELENG, M.M. 2004. Influence of chloride and carbonate salts on productivity of
Mimusops zeyheri in greenhouse conditions. Master Dissertation submitted to the
University of Limpopo, Sovenga, South Africa.
NDHUKULA, J.P. 2006. Influence of soil type, temperature and fertilizer on growth of
Mimusops zeyheri. Master Dissertation submitted to the University of Limpopo,
Sovenga, South Africa.
NISHIWAKI, N., FUJINO, K., KODA, Y., MASUDA, K. and Y. KIKUTA. 2000. Somatic
embryogenesis induced by the simple application of abscisic acid to carrot (Daucus
carota) seedling in culture. Planta 211:756–759.
ORTAS, I. 2010. Effect of mycorrhiza application on plant growth and nutrient uptake in
cucumber production under field conditions. Spanish Journal of Agricultural Research
8:116–122.
ORTAS, I. 2002. Mycorrhiza in citrus: Growth and nutrition. ResearchGate. Adana, Turkey.
POFU, K.M., MASHELA, P.W., MOKGALONG, M.N. and D. DE WAELE. 2011. Greenhouse
whitefly infection on wild watermelon break resistance to the root-knot nematode. In
10th African Crop Science Conference Proceedings, Maputo, Mozambique 239–244.
POFU, K.M., MASHELA P.W. and D. DE WAELE. 2012. Survival, flowering and productivity
of watermelon (Citrullus lanatus) cultivars in inter-generic grafting on nematode-
resistant Cucumis seedling rootstocks in Meloidogyne-infested fields. International
Journal of Agricultural and Biological Engineering 14:217–222.
POWELL, C.L.I. and P.S. NAKRISHNAN. 1986. Effect of mycorrhiza inoculation and
phosphorus fertiliser on the growth of hardwood cuttings of kiwifruit (Actinidia
deliciosa cv. Hayward) in containers. New Zealand Journal of Agricultural Research
29:263–266.
SAS Institute. 2008. Statistical analysis systems computer package, Cary, New York, USA.

68
SALISBURY, F.B. and C.W. ROSS. 1992. Plant physiology. Wadsworth: Belmont,
California.
SIDHOUM, W. and Z. FORTAS. 2013. Effect of Arbuscular mycorrhizal fungi on growth of
semi-woody olive cuttings of the variety 'Sigoise' in Algeria. American Journal of
Research Communication 11:244–257.
SHARMA, A and S. YADAV. 2013. Review on role of VAM fungi in crop plant-soil system.
International Journal of Agricultural Science and Research 3:17–24.
SHARMA, S.D., SHARMA, N.C., SHARMA, C.L., KUMAR, P. and A. CHANDEL. 2012.
Glomus-Azotobacter symbiosis in apple under reduced inorganic nutrient fertilization
for sustainable and economic orcharding enterprise. Scientia Horticulturae 146:175–
181.
SW-846 EPA Method 3050B. Acid digestion of sediments, sludges and soils: Test methods
for evaluating solid waste. US Environmental Protection Agency: Washington DC.
ŚWIERCZYŃSKI, S. and A. STACHOWIAK. 2010. The influence of mycorrhizal fungi on the
growth and yielding of plum and sour cherry trees. Journal of Fruit and Ornamental
Plant Research 18:71–77.
TONG, R., YANG, X. and D. LI. 2006. Effect of interspecific differences of arbuscular
mycorrhizal fungi on Citrus gradis cv 'Changshou Shatian' You seedlings vegetative
growth and mineral contents. Yingyong Shengtai Xeuebao 17:1229–1233.
USHA, K. SAXENA, A. and B. SINGH. 2004. Rhizosphere dynamics influenced by
arbuscular mycorrhizal fungus (Glomus deserticola) and related changes in leaf
nutrient status and yield of Kinnow mandarin King (Citrus nobilis) x Willow Leaf
(Citrus deliciosa). Australian Journal of Agricultural Research 55:571–576.
VAN WYK, P. 1974. Trees of the Kruger National Park. Vol: 2. National Parks of South
Africa: Purnell.

69
VENTER, F. and J.A. VENTER. 1996. Making the most of indigenous trees. Briza
Publications: Pretoria.
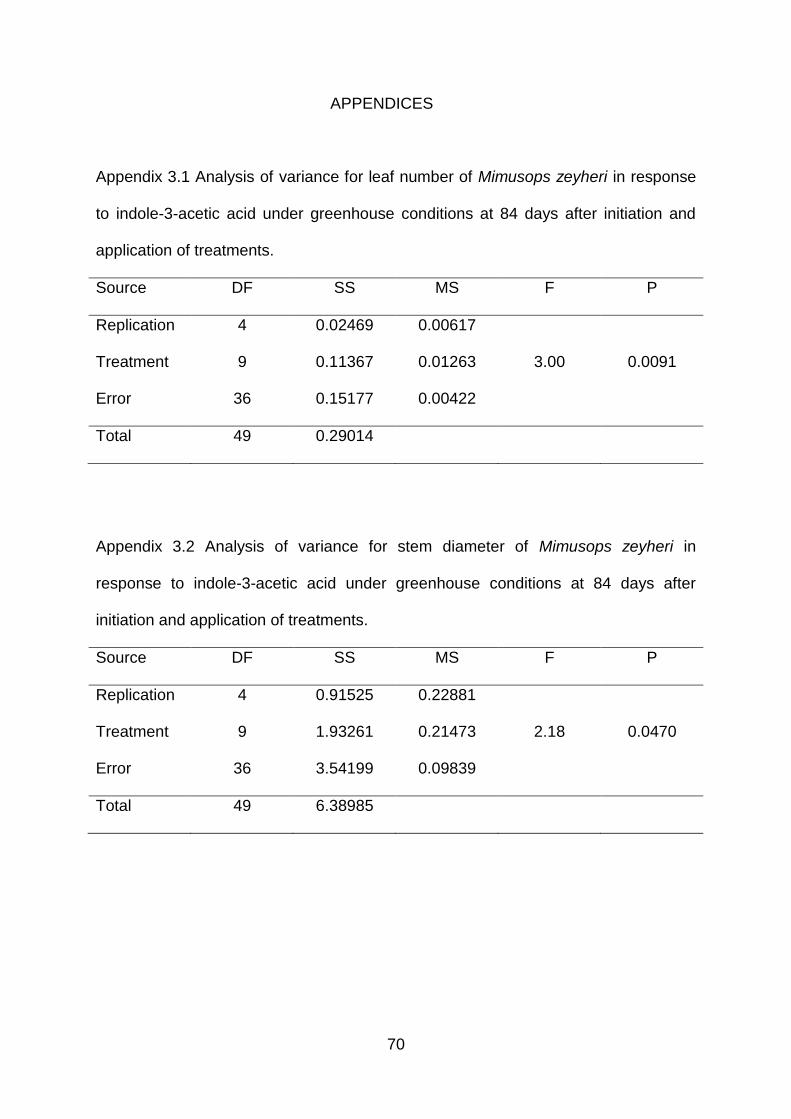
70
APPENDICES
Appendix 3.1 Analysis of variance for leaf number of Mimusops zeyheri in response
to indole-3-acetic acid under greenhouse conditions at 84 days after initiation and
application of treatments.
Source DF SS MS F P
Replication 4 0.02469 0.00617
Treatment 9 0.11367 0.01263 3.00 0.0091
Error 36 0.15177 0.00422
Total 49 0.29014
Appendix 3.2 Analysis of variance for stem diameter of Mimusops zeyheri in
response to indole-3-acetic acid under greenhouse conditions at 84 days after
initiation and application of treatments.
Source DF SS MS F P
Replication 4 0.91525 0.22881
Treatment 9 1.93261 0.21473 2.18 0.0470
Error 36 3.54199 0.09839
Total 49 6.38985

71
Appendix 3.3 Analysis of variance for plant height of Mimusops zeyheri in response
to indole-3-acetic acid under greenhouse conditions at 84 days after initiation and
application of treatments.
Source DF SS MS F P
Replication 4 22.661 5.6652
Treatment 9 94.166 10.4629 1.58 0.1592
Error 36 238.695 6.6304
Total 49 355.522
Appendix 3.4 Analysis of variance for leaf length of Mimusops zeyheri in response to
indole-3-acetic acid under greenhouse conditions at 84 days after initiation and
application of treatments.
Source DF SS MS F P
Replication 4 8.5781 2.14451
Treatment 9 16.7412 1.86013 1.37 0.2398
Error 36 49.0404 1.36223
Total 49 74.3596
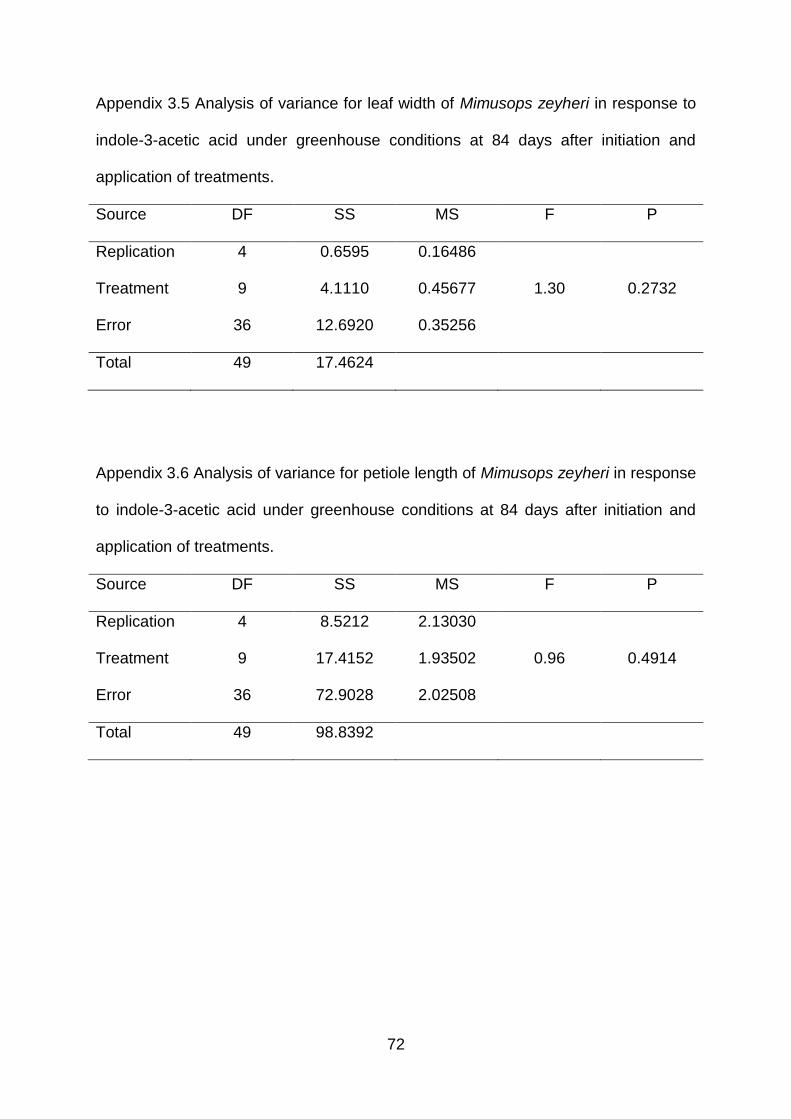
72
Appendix 3.5 Analysis of variance for leaf width of Mimusops zeyheri in response to
indole-3-acetic acid under greenhouse conditions at 84 days after initiation and
application of treatments.
Source DF SS MS F P
Replication 4 0.6595 0.16486
Treatment 9 4.1110 0.45677 1.30 0.2732
Error 36 12.6920 0.35256
Total 49 17.4624
Appendix 3.6 Analysis of variance for petiole length of Mimusops zeyheri in response
to indole-3-acetic acid under greenhouse conditions at 84 days after initiation and
application of treatments.
Source DF SS MS F P
Replication 4 8.5212 2.13030
Treatment 9 17.4152 1.93502 0.96 0.4914
Error 36 72.9028 2.02508
Total 49 98.8392

73
Appendix 3.7 Analysis of variance for dry shoot mass of Mimusops zeyheri in
response to indole-3-acetic acid under greenhouse conditions at 84 days after
initiation and application of treatments.
Source DF SS MS F P
Replication 4 0.10421 0.02605
Treatment 9 0.48947 0.05439 0.67 0.1331
Error 36 1.17327 0.03259
Total 49 1.76695
Appendix 3.8 Analysis of variance for dry root mass of Mimusops zeyheri in
response to indole-3-acetic acid under greenhouse conditions at 84 days after
initiation and application of treatments.
Source DF SS MS F P
Replication 4 0.17372 0.04343
Treatment 9 0.68480 0.07609 1.20 0.3270
Error 36 2.28908 0.06359
Total 49 3.14760

74
Appendix 3.9 Analysis of variance for chlorophyll content of Mimusops zeyheri in
response to indole-3-acetic acid under greenhouse conditions at 84 days after
initiation and application of treatments.
Source DF SS MS F P
Replication 4 243.09 60.7727
Treatment 9 420.34 46.7041 0.94 0.5003
Error 36 1780.98 49.4716
Total 49 2444.40
Appendix 3.10 Analysis of variance for Magnesium (Mg) accumulation in Mimusops
zeyheri in response to indole-3-aceticacid under greenhouse conditions at 84 days
after initiation and application of treatments.
Source DF SS MS F P
Replication 4 2.3372 0.58430
Treatment 9 17.9682 1.99647 1.30 0.2710
Error 36 55.2948 1.53597
Total 49 75.6002
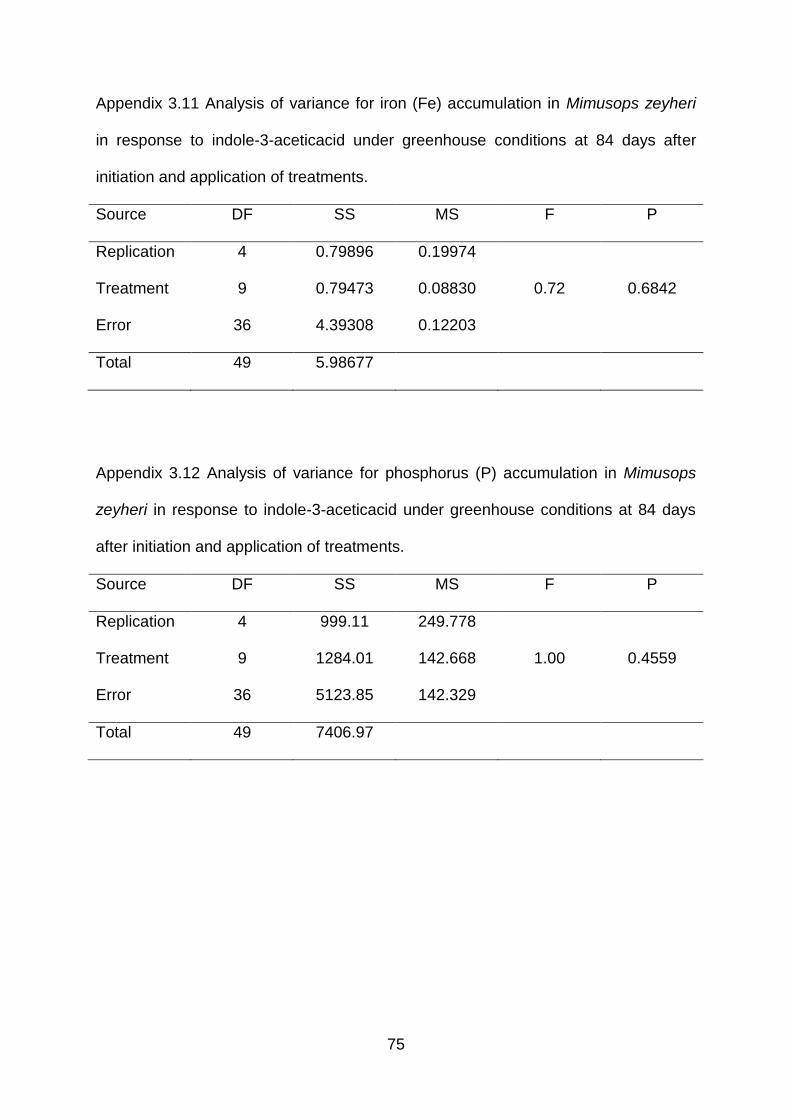
75
Appendix 3.11 Analysis of variance for iron (Fe) accumulation in Mimusops zeyheri
in response to indole-3-aceticacid under greenhouse conditions at 84 days after
initiation and application of treatments.
Source DF SS MS F P
Replication 4 0.79896 0.19974
Treatment 9 0.79473 0.08830 0.72 0.6842
Error 36 4.39308 0.12203
Total 49 5.98677
Appendix 3.12 Analysis of variance for phosphorus (P) accumulation in Mimusops
zeyheri in response to indole-3-aceticacid under greenhouse conditions at 84 days
after initiation and application of treatments.
Source DF SS MS F P
Replication 4 999.11 249.778
Treatment 9 1284.01 142.668 1.00 0.4559
Error 36 5123.85 142.329
Total 49 7406.97

76
Appendix 3.13 Analysis of variance for potassium (K) accumulation in Mimusops
zeyheri in response to indole-3-aceticacid under greenhouse conditions at 84 days
after initiation and application of treatments.
Source DF SS MS F P
Replication 4 156.05 39.0125
Treatment 9 220.72 24.5244 0.61 0.7774
Error 36 1439.15 39.9764
Total 49 1815.92
Appendix 3.14 Analysis of variance for calcium (Ca) accumulation in Mimusops
zeyheri in response to indole-3-aceticacid under greenhouse conditions at 84 days
after initiation and application of treatments.
Source DF SS MS F P
Replication 4 243.62 60.9057
Treatment 9 656.05 72.8943 0.88 0.5519
Error 36 2982.77 82.8548
Total 49 3882.44

77
Appendix 3.15 Analysis of variance for Zinc (Zn) accumulation of Mimusops zeyheri
in response to indole-3-aceticacid under greenhouse conditions at 84 days after
initiation and application of treatments.
Source DF SS MS F P
Replication 4 2.6278 0.65694
Treatment 9 2.3550 0.26166 0.67 0.7273
Error 36 13.9908 0.38863
Total 49 18.9736
Appendix 3.16 Analysis of variance for leaf number of Mimusops zeyheri in response
to gibberellic acid under greenhouse conditions at 84 days after initiation and
application of treatments.
Source DF SS MS F P
Replication 4 0.12246 0.03061
Treatment 9 0.18972 0.02108 2.87 0.0117
Error 36 0.26456 0.00735
Total 49 0.57673

78
Appendix 3.17 Analysis of variance for stem diameter of Mimusops zeyheri in
response to gibberellic acid under greenhouse conditions at 84 days after initiation
and application of treatments.
Source DF SS MS F P
Replication 4 1.98117 0.49529
Treatment 9 2.52679 0.28075 1.99 0.0697
Error 36 5.08047 0.14112
Total 49 9.58843
Appendix 3.18 Analysis of variance for plant height of Mimusops zeyheri in response
to gibberellic acid under greenhouse conditions at 84 days after initiation and
application of treatments.
Source DF SS MS F P
Replication 4 122.795 30.6988
Treatment 9 427.856 47.5396 4.87 0.0003
Error 36 351.613 9.7670
Total 49 902.264

79
Appendix 3.19 Analysis of variance for leaf length of Mimusops zeyheri in response
to gibberellic acid under greenhouse conditions at 84 days after initiation and
application of treatments.
Source DF SS MS F P
Replication 4 23.0689 5.76722
Treatment 9 10.0238 1.11376 0.89 0.5411
Error 36 44.9018 1.24727
Total 49 77.9945
Appendix 3.20 Analysis of variance for leaf width of Mimusops zeyheri in response to
gibberellic acid under greenhouse conditions at 84 days after initiation and
application of treatments.
Source DF SS MS F P
Replication 4 1.7876 0.44690
Treatment 9 4.1203 0.45781 2.00 0.0681
Error 36 8.2369 0.22880
Total 49 14.1448
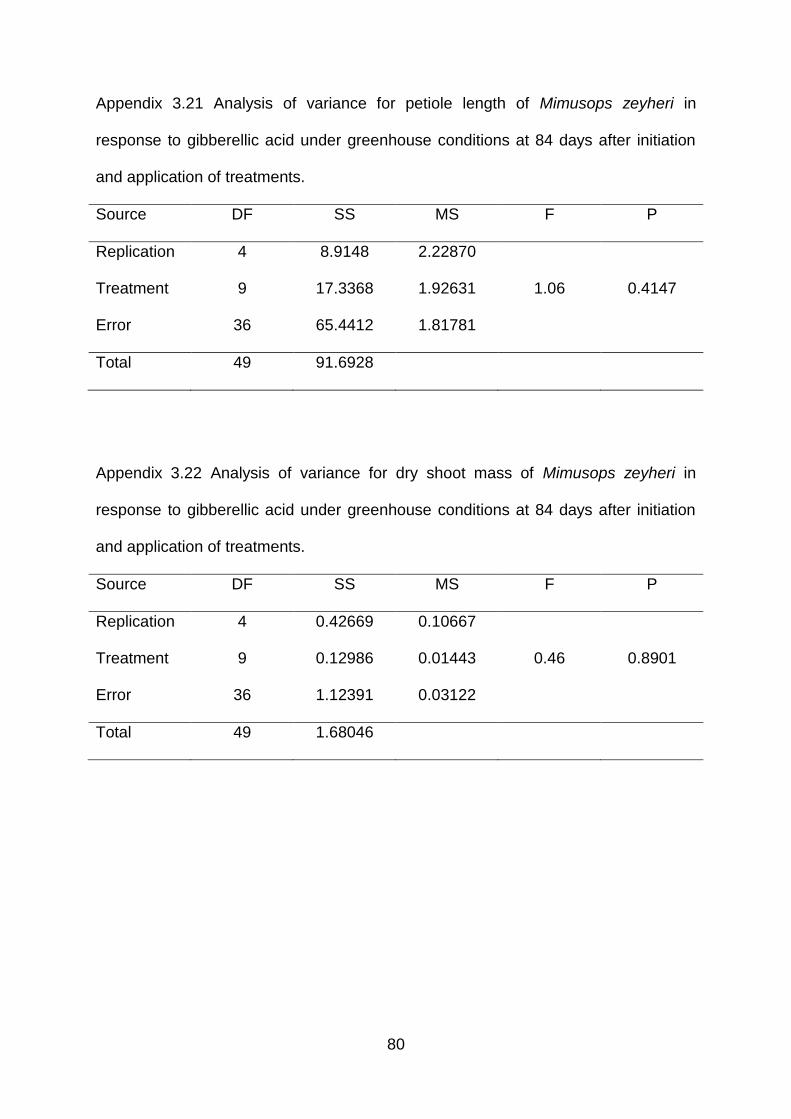
80
Appendix 3.21 Analysis of variance for petiole length of Mimusops zeyheri in
response to gibberellic acid under greenhouse conditions at 84 days after initiation
and application of treatments.
Source DF SS MS F P
Replication 4 8.9148 2.22870
Treatment 9 17.3368 1.92631 1.06 0.4147
Error 36 65.4412 1.81781
Total 49 91.6928
Appendix 3.22 Analysis of variance for dry shoot mass of Mimusops zeyheri in
response to gibberellic acid under greenhouse conditions at 84 days after initiation
and application of treatments.
Source DF SS MS F P
Replication 4 0.42669 0.10667
Treatment 9 0.12986 0.01443 0.46 0.8901
Error 36 1.12391 0.03122
Total 49 1.68046

81
Appendix 3.23 Analysis of variance for dry root mass of Mimusops zeyheri in
response to gibberellic acid under greenhouse conditions at 84 days after initiation
and application of treatments.
Source DF SS MS F P
Replication 4 0.07701 0.01925
Treatment 9 0.09395 0.01044 0.85 0.5804
Error 36 0.44455 0.01235
Total 49 0.61551
Appendix 3.24 Analysis of variance for chlorophyll content of Mimusops zeyheri in
response to gibberellic acid under greenhouse conditions at 84 days after initiation
and application of treatments.
Source DF SS MS F P
Replication 4 516.46 129.114
Treatment 9 329.97 36.664 0.51 0.8600
Error 36 2606.01 72.389
Total 49 3452.44

82
Appendix 3.25 Analysis of variance for magnesium (Mg) accumulation in Mimusops
zeyheri in response to gibberellic acid under greenhouse conditions at 84 days after
initiation and application of treatments.
Source DF SS MS F P
Replication 4 1.6972 0.42430
Treatment 9 3.8802 0.43113 1.26 0.2921
Error 36 12.3268 0.34241
Total 49 17.9042
Appendix 3.26 Analysis of variance for iron (Fe) accumulation in Mimusops zeyheri
in response to gibberellic acid under greenhouse conditions at 84 days after initiation
and application of treatments.
Source DF SS MS F P
Replication 4 2.8312 0.70781
Treatment 9 3.3857 0.37618 1.59 0.1557
Error 36 8.5219 0.23672
Total 49 14.7388

83
Appendix 3.27 Analysis of variance for phosphorus (P) accumulation in Mimusops
zeyheri in response to gibberellic acid under greenhouse conditions at 84 days after
initiation and application of treatments.
Source DF SS MS F P
Replication 4 1199.37 299.844
Treatment 9 1146.34 127.371 0.96 0.4876
Error 36 4773.99 132.611
Total 49 7119.71
Appendix 3.28 Analysis of variance for potassium (K) accumulation in Mimusops
zeyheri in response to gibberellic acid under greenhouse conditions at 84 days after
initiation and application of treatments.
Source DF SS MS F P
Replication 4 218.20 54.5503
Treatment 9 252.67 28.0742 1.59 0.1548
Error 36 634.68 17.6301
Total 49 1105.55

84
Appendix 3.29 Analysis of variance for calcium (Ca) accumulation in Mimusops
zeyheri in response to gibberellic acid under greenhouse conditions at 84 days after
initiation and application of treatments.
Source DF SS MS F P
Replication 4 231.41 57.8513
Treatment 9 143.55 15.9497 0.85 0.5738
Error 36 672.93 18.6926
Total 49 1047.89
Appendix 3.30 Analysis of variance for Zinc (Zn) accumulation in Mimusops zeyheri
in response to gibberellic acid under greenhouse conditions at 84 days after initiation
and application of treatments.
Source DF SS MS F P
Replication 4 0.19357 0.04839
Treatment 9 0.90239 0.10027 0.89 0.5415
Error 36 4.04426 0.11234
Total 49 5.14022

85
Appendix 3.31 Analysis of variance for leaf number of Mimusops zeyheri in response
to 6-benzylaminopurine under greenhouse conditions at 84 days after initiation and
application of treatments.
Source DF SS MS F P
Replication 4 0.08865 0.02216
Treatment 9 0.09578 0.01064 2.50 0.0246
Error 36 0.15326 0.00426
Total 49 0.33769
Appendix 3.32 Analysis of variance for stem diameter of Mimusops zeyheri in
response to 6-benzylaminopurine under greenhouse conditions at 84 days after
initiation and application of treatments.
Source DF SS MS F P
Replication 4 0.47547 0.11887
Treatment 9 2.28092 0.25344 2.31 0.0360
Error 36 3.94349 0.10954
Total 49 6.69988

86
Appendix 3.33 Analysis of variance for plant height of Mimusops zeyheri in response
to 6-benzylaminopurine under greenhouse conditions at 84 days after initiation and
application of treatments.
Source DF SS MS F P
Replication 4 76.517 19.1293
Treatment 9 35.764 3.9738 0.61 0.7837
Error 36 236.179 6.5605
Total 49 348.460
Appendix 3.34 Analysis of variance for leaf length of Mimusops zeyheri in response
to 6-benzylaminopurine under greenhouse conditions at 84 days after initiation and
application of treatments.
Source DF SS MS F P
Replication 4 357.88 89.4701
Treatment 9 738.02 82.0022 1.00 0.4604
Error 36 2962.95 82.3042
Total 49 40.58.85
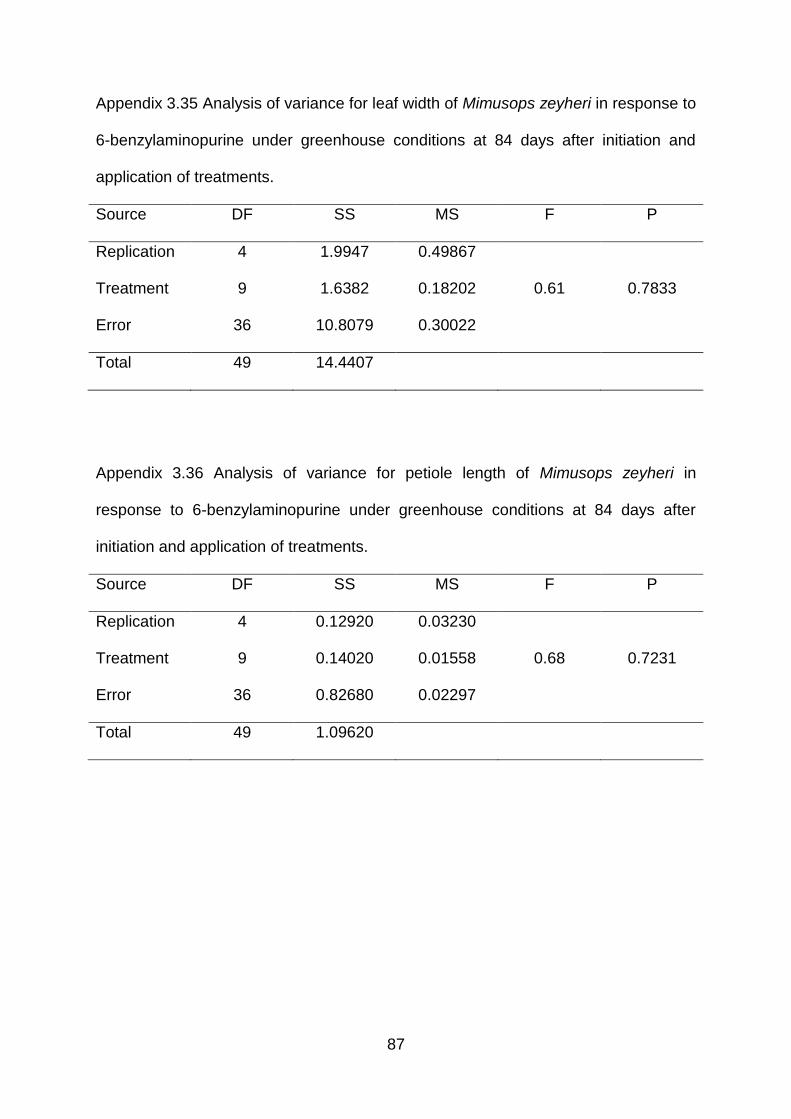
87
Appendix 3.35 Analysis of variance for leaf width of Mimusops zeyheri in response to
6-benzylaminopurine under greenhouse conditions at 84 days after initiation and
application of treatments.
Source DF SS MS F P
Replication 4 1.9947 0.49867
Treatment 9 1.6382 0.18202 0.61 0.7833
Error 36 10.8079 0.30022
Total 49 14.4407
Appendix 3.36 Analysis of variance for petiole length of Mimusops zeyheri in
response to 6-benzylaminopurine under greenhouse conditions at 84 days after
initiation and application of treatments.
Source DF SS MS F P
Replication 4 0.12920 0.03230
Treatment 9 0.14020 0.01558 0.68 0.7231
Error 36 0.82680 0.02297
Total 49 1.09620

88
Appendix 3.37 Analysis of variance for dry shoot mass of Mimusops zeyheri in
response to 6-benzylaminopurine under greenhouse conditions at 84 days after
initiation and application of treatments.
Source DF SS MS F P
Replication 4 5.3912 1.34780
Treatment 9 4.7232 0.52480 2.21 0.0446
Error 36 8.5528 0.23758
Total 49 18.6672
Appendix 3.38 Analysis of variance for dry root mass of Mimusops zeyheri in
response to 6-benzylaminopurine under greenhouse conditions at 84 days after
initiation and application of treatments.
Source DF SS MS F P
Replication 4 0.58600 0.14650
Treatment 9 1.77700 0.19744 3.74 0.0021
Error 36 1.90200 0.05283
Total 49 4.26500

89
Appendix 3.39 Analysis of variance for chlorophyll content of Mimusops zeyheri in
response to 6-benzylaminopurine under greenhouse conditions at 84 days after
initiation and application of treatments.
Source DF SS MS F P
Replication 4 156.89 39.2213
Treatment 9 541.10 60.1218 1.03 0.4370
Error 36 2104.88 58.4689
Total 49 2802.86
Appendix 3.40 Analysis of variance for magnesium (Mg) accumulation in Mimusops
zeyheri in response to 6-benzylaminopurine under greenhouse conditions at 84 days
after initiation and application of treatments.
Source DF SS MS F P
Replication 4 37.843 9.46070
Treatment 9 39.546 4.39398 0.67 0.7323
Error 36 237.017 6.58381
Total 49 314.406

90
Appendix 3.41 Analysis of variance for iron (Fe) accumulation in Mimusops zeyheri
in response to 6-benzylaminopurine under greenhouse conditions at 84 days after
initiation and application of treatments.
Source DF SS MS F P
Replication 4 1.14958 0.28739
Treatment 9 1.66318 0.18480 1.07 0.4088
Error 36 6.22734 0.17298
Total 49 9.04009
Appendix 3.42 Analysis of variance for phosphorus (P) accumulation in Mimusops
zeyheri in response to 6-benzylaminopurine under greenhouse conditions at 84 days
after initiation and application of treatments.
Source DF SS MS F P
Replication 4 173.52 43.379
Treatment 9 1124.67 124.964 1.70 0.1257
Error 36 2650.31 73.620
Total 49 3948.50

91
Appendix 3.43 Analysis of variance for accumulation of potassium (K) in Mimusops
zeyheri in response to 6-benzylaminopurine under greenhouse conditions at 84 days
after initiation and application of treatments.
Source DF SS MS F P
Replication 4 183.73 45.9333
Treatment 9 272.06 30.2294 0.86 0.5710
Error 36 1270.50 35.2917
Total 49 1726.30
Appendix 3.44 Analysis of variance for accumulation calcium (Ca) in Mimusops
zeyheri in response to 6-benzylaminopurine under greenhouse conditions at 84 days
after initiation and application of treatments.
Source DF SS MS F P
Replication 4 187.64 46.9098
Treatment 9 558.43 62.0475 0.62 0.7682
Error 36 3576.23 99.3398
Total 49 4322.30
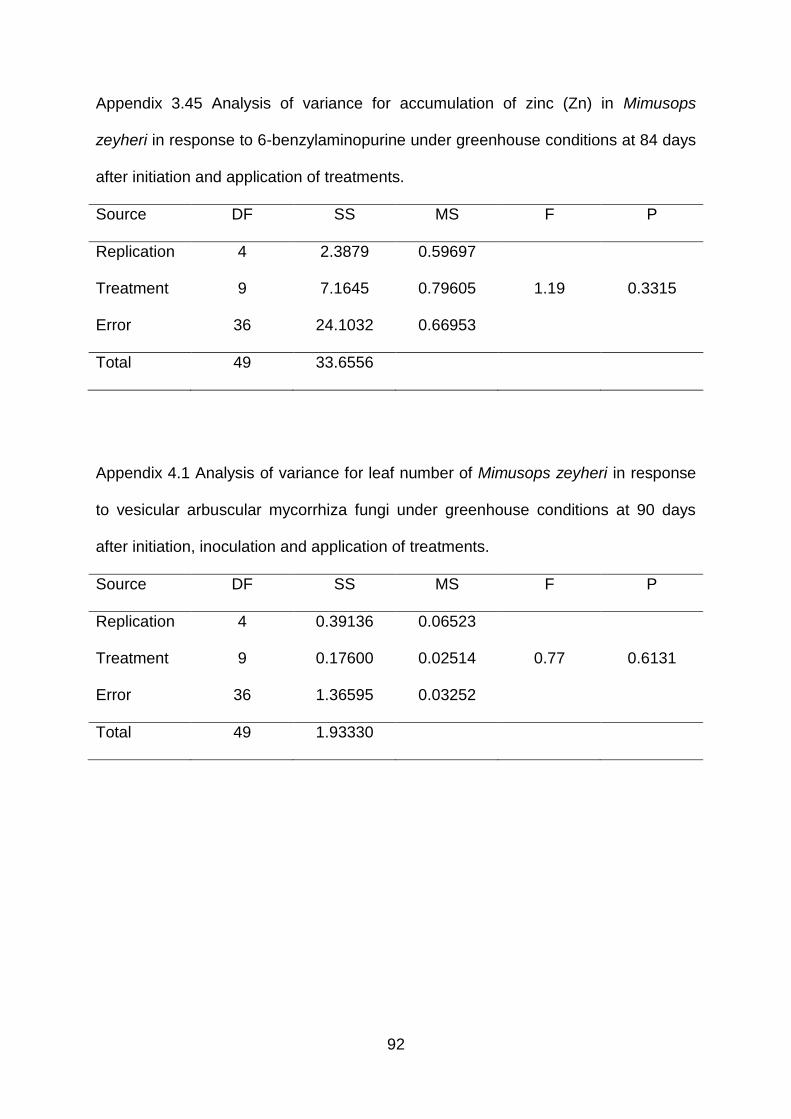
92
Appendix 3.45 Analysis of variance for accumulation of zinc (Zn) in Mimusops
zeyheri in response to 6-benzylaminopurine under greenhouse conditions at 84 days
after initiation and application of treatments.
Source DF SS MS F P
Replication 4 2.3879 0.59697
Treatment 9 7.1645 0.79605 1.19 0.3315
Error 36 24.1032 0.66953
Total 49 33.6556
Appendix 4.1 Analysis of variance for leaf number of Mimusops zeyheri in response
to vesicular arbuscular mycorrhiza fungi under greenhouse conditions at 90 days
after initiation, inoculation and application of treatments.
Source DF SS MS F P
Replication 4 0.39136 0.06523
Treatment 9 0.17600 0.02514 0.77 0.6131
Error 36 1.36595 0.03252
Total 49 1.93330

93
Appendix 4.2 Analysis of variance for plant height of Mimusops zeyheri in response
to vesicular arbuscular mycorrhiza fungi under greenhouse conditions at 90 days
after initiation, inoculation and application of treatments.
Source DF SS MS F P
Replication 4 6208.9 1034.82
Treatment 9 1468.8 209.82 1.25 0.2962
Error 36 7028.3 167.34
Total 49 14706.0
Appendix 4.3 Analysis of variance for stem diameter of Mimusops zeyheri in
response to vesicular arbuscular mycorrhiza fungi under greenhouse conditions at
90 days after initiation, inoculation and application of treatments.
Source DF SS MS F P
Replication 4 0.45914 0.07652
Treatment 9 0.30173 0.04310 0.84 0.5611
Error 36 2.15649 0.05134
Total 49 2.91736
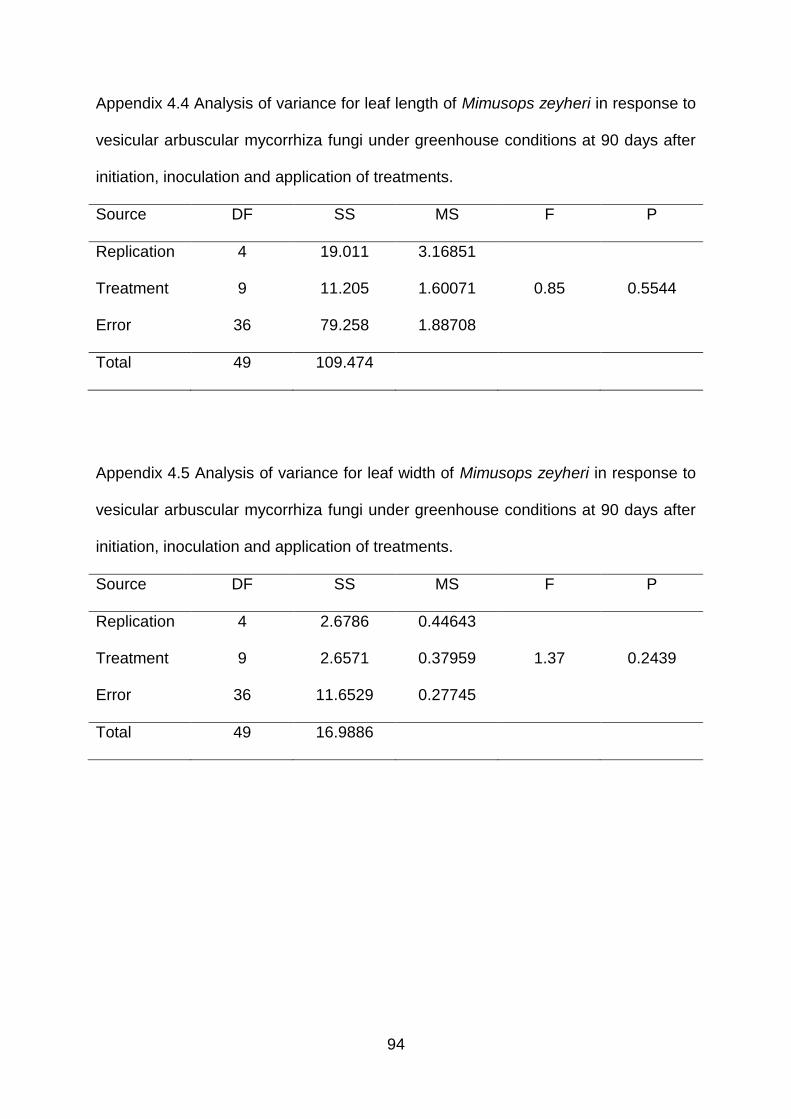
94
Appendix 4.4 Analysis of variance for leaf length of Mimusops zeyheri in response to
vesicular arbuscular mycorrhiza fungi under greenhouse conditions at 90 days after
initiation, inoculation and application of treatments.
Source DF SS MS F P
Replication 4 19.011 3.16851
Treatment 9 11.205 1.60071 0.85 0.5544
Error 36 79.258 1.88708
Total 49 109.474
Appendix 4.5 Analysis of variance for leaf width of Mimusops zeyheri in response to
vesicular arbuscular mycorrhiza fungi under greenhouse conditions at 90 days after
initiation, inoculation and application of treatments.
Source DF SS MS F P
Replication 4 2.6786 0.44643
Treatment 9 2.6571 0.37959 1.37 0.2439
Error 36 11.6529 0.27745
Total 49 16.9886

95
Appendix 4.6 Analysis of variance for petiole length of Mimusops zeyheri in response
to vesicular arbuscular mycorrhiza fungi under greenhouse conditions at 90 days
after initiation, inoculation and application of treatments.
Source DF SS MS F P
Replication 4 0.14750 0.02458
Treatment 9 0.45839 0.06548 1.29 0.2797
Error 36 2.13536 0.05084
Total 49 2.74125
Appendix 4.7 Analysis of variance for dry shoot mass of Mimusops zeyheri in
response to vesicular arbuscular mycorrhiza fungi under greenhouse conditions at
90 days after initiation, inoculation and application of treatments.
Source DF SS MS F P
Replication 4 3216.03 536.005
Treatment 9 587.79 83.970 0.63 0.7243
Error 36 5554.15 132.242
Total 49 9357.97

96
Appendix 4.8 Analysis of variance for dry root mass of Mimusops zeyheri in
response to vesicular arbuscular mycorrhiza fungi under greenhouse conditions at
90 days after initiation, inoculation and application of treatments.
Source DF SS MS F P
Replication 4 3255.9 542.642
Treatment 9 1230.5 175.791 0.65 0.7150
Error 36 11420.5 271.917
Total 49
Appendix 4.9 Analysis of variance for chlorophyll content of Mimusops zeyheri in
response to vesicular arbuscular mycorrhiza fungi under greenhouse conditions at
90 days after initiation, inoculation and application of treatments.
Source DF SS MS F P
Replication 4 770.54 128.424
Treatment 9 653.18 93.311 0.55 0.7889
Error 36 7081.99 168.619
Total 49 8505.71

97
Appendix 4.10 Analysis of variance for magnesium (Mg) accumulation in
Mimusops zeyheri in response to vesicular arbuscular mycorrhiza under
greenhouse conditions at 90 days after initiation and application of treatments.
Source DF SS MS F P
Replication 6 185.65 30.9420
Treatment 7 74.56 10.6514 0.57 0.7749
Error 42 782.99 18.6427
Total 55 1043.21
Appendix 4.11 Analysis of variance for iron (Fe) accumulation in Mimusops zeyheri
in response to vesicular arbuscular mycorrhiza under greenhouse conditions at 90
days after initiation and application of treatments.
Source DF SS MS F P
Replication 6 1.04144 0.17357
Treatment 7 0.79147 0.11307 0.97 0.4673
Error 42 4.90986 0.11690
Total 55 6.74277
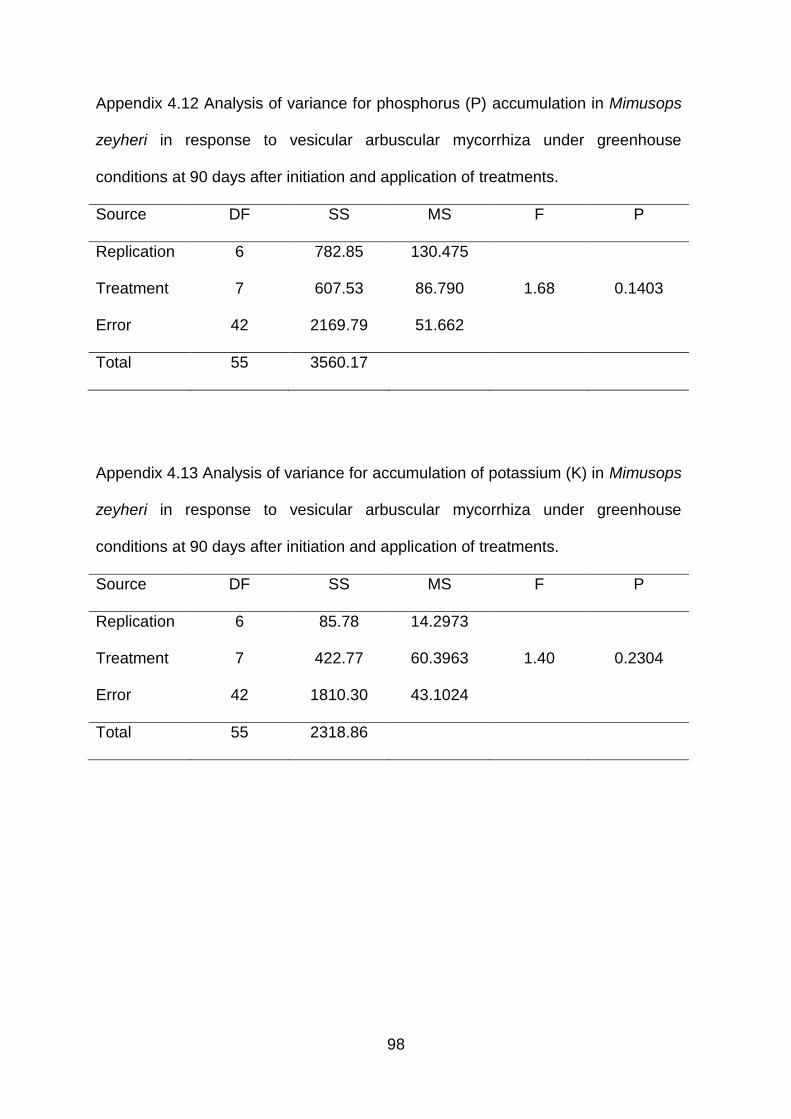
98
Appendix 4.12 Analysis of variance for phosphorus (P) accumulation in Mimusops
zeyheri in response to vesicular arbuscular mycorrhiza under greenhouse
conditions at 90 days after initiation and application of treatments.
Source DF SS MS F P
Replication 6 782.85 130.475
Treatment 7 607.53 86.790 1.68 0.1403
Error 42 2169.79 51.662
Total 55 3560.17
Appendix 4.13 Analysis of variance for accumulation of potassium (K) in Mimusops
zeyheri in response to vesicular arbuscular mycorrhiza under greenhouse
conditions at 90 days after initiation and application of treatments.
Source DF SS MS F P
Replication 6 85.78 14.2973
Treatment 7 422.77 60.3963 1.40 0.2304
Error 42 1810.30 43.1024
Total 55 2318.86

99
Appendix 4.14 Analysis of variance for accumulation calcium (Ca) in Mimusops
zeyheri in response to vesicular arbuscular mycorrhiza under greenhouse
conditions at 90 days after initiation and application of treatments.
Source DF SS MS F P
Replication 6 1012.2 168.694
Treatment 7 457.8 65.395 0.29 0.9537
Error 42 9431.8 224.566
Total 55 10901.7
Appendix 4.15 Analysis of variance for accumulation of zinc (Zn) in Mimusops
zeyheri in response to vesicular arbuscular mycorrhiza under greenhouse
conditions at 90 days after initiation and application of treatments.
Source DF SS MS F P
Replication 6 9.632 1.60535
Treatment 7 11.860 1.69426 0.76 0.6246
Error 42 93.798 2.23327
Total 55 115.289