Embed Size (px)
Citation preview
Electronic copy available at: http://ssrn.com/abstract=789985Electronic copy of this paper is available at: http://ssrn.com/abstract=789985
Accruals Quality and Internal Control over Financial Reporting
Jeffrey Doyle College of Business
Utah State University 3540 Old Main Hill Logan, UT 84322
Weili Ge University of Washington Business School
University of Washington Mackenzie Hall, Box 353200
Seattle, WA 98195 [email protected]
Sarah McVay
Stern School of Business New York University
44 West Fourth Street, Suite 10–94 New York, NY 10012 [email protected]
January 24, 2007
The Accounting Review, forthcoming
We would like to thank two anonymous reviewers, Dan Cohen, Patty Dechow, Dan Dhaliwal (the Editor), Ilia Dichev, Kalin Kolev, Russ Lundholm, Matt Magilke, Zoe-Vonna Palmrose, Christine Petrovits, Cathy Shakespeare, Tom Smith, and Suraj Srinivasan for their helpful comments and suggestions. This paper has also benefited from comments received at the 2005 4-School Conference at Columbia University, the 2005 AAA Mid-West Regional Meeting, the 2006 AAA FARS Mid-Year Meeting, the 2006 Accounting and Finance Association of Australia and New Zealand Annual Meeting, the 2006 International Symposium on Audit Research Conference, and the University of Michigan.
Electronic copy available at: http://ssrn.com/abstract=789985Electronic copy of this paper is available at: http://ssrn.com/abstract=789985
Accruals Quality and Internal Control over Financial Reporting
ABSTRACT
We examine the relation between accruals quality and internal controls using 705 firms that disclosed at least one material weakness from August 2002 to November 2005 and find that weaknesses are generally associated with poorly estimated accruals that are not realized as cash flows. Further, we find that this relation between weak internal controls and lower accruals quality is driven by weakness disclosures that relate to overall company-level controls, which may be more difficult to “audit around.” We find no such relation for more auditable, account-specific weaknesses. We find similar results using four additional measures of accruals quality: discretionary accruals, average accruals quality, historical accounting restatements, and earnings persistence. Our results are robust to the inclusion of firm characteristics that proxy for difficulty in accrual estimation, known determinants of material weaknesses, and corrections for self-selection bias.
Keywords: earnings quality; accruals quality; internal control; material weaknesses.
Data Availability: All data used in the paper are available from publicly available sources noted
in the text; the data on internal control weaknesses are available in machine-readable form from
the authors upon request.
Electronic copy available at: http://ssrn.com/abstract=789985Electronic copy of this paper is available at: http://ssrn.com/abstract=789985
1
I. INTRODUCTION
In this paper we examine the relation between accruals quality and the internal control
environment of the firm. By definition, when there is a material weakness in internal control,
there is “more than a remote likelihood that a material misstatement of the annual or interim
financial statements will not be prevented or detected” (PCAOB 2004, emphasis added). A
weak control environment has the potential to allow both 1) intentionally biased accruals through
earnings management (e.g., lack of segregation of duties) and 2) unintentional errors in accrual
estimation (e.g., lack of experience in estimating the bad-debt expense provision). Therefore, we
hypothesize that reported material weaknesses will be associated with lower accruals quality.
While this relation has been suggested in prior literature (Kinney 2000), the lack of
internal control data has generally precluded an empirical investigation and, therefore, the
literature on earnings quality has been relatively silent on the matter of internal control over
financial reporting. For example, neither of the two recent publications on earnings quality
(Schipper and Vincent 2003; Dechow and Schrand 2004) mentions a possible relation between
internal control and earnings/accruals quality. In this paper, we investigate this relation using a
sample of 705 companies that disclosed material weaknesses in internal control over financial
reporting from August 2002 to November 2005 under the new requirements of Sections 302 and
404 of the Sarbanes-Oxley Act of 2002.1
Using the accruals quality measure developed by Dechow and Dichev (2002), as
modified by McNichols (2002) and Francis et al. (2005), we generally find that weak internal
1 Section 302 (applicable to all SEC filers and effective August 2002) requires that officers certify the financial statements, including the effectiveness of the internal control over financial reporting, and disclose any material changes in internal control. Section 404 (thus far effective November 2004 for accelerated filers only) requires management to issue a report on internal control over financial reporting that is subject to auditor attestation. Additional details are provided in Section II. Regardless of the origin of the material weakness disclosure, all else equal we expect these disclosures to be informative about the quality of firms’ accruals. We provide sample material weaknesses in Appendix A, Section II, and Section III.
2
controls are associated with relatively low quality accruals, as measured by weaker mappings of
accruals into cash flows. This relation is robust to the inclusion of innate firm characteristics that
proxy for the inherent difficulty in accrual estimation (e.g., length of the operating cycle and cash
flow volatility; Dechow and Dichev 2002) and additional determinants of material weaknesses
that are likely to be directly correlated with accruals quality (e.g., profitability and complexity;
Ge and McVay 2005; Ashbaugh-Skaife et al. 2007; Doyle et al. 2007).
Although our focus is on the Dechow and Dichev (2002) measure, which we feel is both
theoretically and intuitively appealing, we also consider other common proxies for accruals
quality: discretionary accruals (Jones 1991), average accruals quality (Dechow and Dichev
2002), historical restatements (Anderson and Yohn 2002), and earnings persistence (Schipper
and Vincent 2003). For each of these measures, we find that weak internal controls are
associated with lower accruals quality.
Finally, we find that the relation between weak internal controls and lower accruals
quality is stronger for two groups of firms. First, only those firms with company-level material
weaknesses rather than more auditable, account-specific problems have lower accruals quality.
The finding that account-specific material weaknesses are not associated with lower accruals
quality is consistent with auditors detecting and correcting auditable weaknesses through
increased substantive testing prior to the issuance of the financial statements (e.g., Hogan and
Wilkins 2006).
Second, material weakness disclosures made under Section 302 (versus those under
Section 404) seem to be more strongly associated with lower accruals quality. We find that, on
average, Section 404 disclosures are not associated with poorer accruals quality. However, when
disclosures are broken down by account-specific versus company-level weaknesses, company-
3
level Section 404 weaknesses are associated with poorer accruals quality. Although there are
several plausible explanations for the weaker results using the Section 404 disclosures, one
obvious difference between Sections 302 and 404 is the increased level of scrutiny under Section
404, which requires an audit opinion on the internal controls by the external auditors. It is
possible that external auditors applied a lower effective threshold for Section 404 compared to
management’s threshold under Section 302 and therefore identified a greater number of material
weaknesses that lacked real financial reporting consequences. We discuss these results and other
possible explanations later in Section IV.
Our paper makes two primary contributions. First, we extend the literature on
earnings/accruals quality. Conceptually, it makes sense that a good internal control system is the
foundation for high-quality financial reporting, since strong internal controls likely curtail both
procedural and estimation errors, as well as earnings management. Our findings present
empirical evidence to support this fundamental link between internal controls and accruals
quality. In addition, our paper extends this basic research question by 1) examining the types of
material weaknesses (company-level versus account-specific), 2) distinguishing between the
Section 302 versus 404 reporting regimes, 3) using a cross-section of five earnings/accruals
quality measures, and 4) controlling for self-selection bias through the use of both a Heckman
(1979) two-stage process and a propensity score matching approach (LaLonde 1986).
Second, our paper provides empirical evidence on the effectiveness of Sections 302 and
404 of Sarbanes-Oxley. These sections have been among the most cumbersome of the new
legislation, with many critics alleging that the costs of compliance far exceed any benefits. We
find that the most informative material weakness disclosures (i.e., those that are associated with
real economic events such as lower accruals quality) are those that relate to more serious,
4
company-wide problems for both Sections 302 and 404. Furthermore, the company-wide
disclosures made under Section 302 seem to be more strongly related to lower accruals quality
than the company-wide disclosures under Section 404. The disclosures of material weaknesses
that report less serious, account-specific problems under both Sections 302 and 404 do not
appear to be effective in our tests at identifying firms with lower financial reporting quality.
Since the implementation of Sections 302 and 404 of Sarbanes-Oxley is fairly new, there
are a number of concurrent papers in this area. Our findings are generally consistent with and
complementary to these other papers. First, our main finding—that material weaknesses are
associated with lower accruals quality—is consistent with several other papers that examine this
relation employing varying time periods, accruals quality proxies, and types of deficiencies
(Ashbaugh-Skaife et al. 2006; Bedard 2006; Chan et al. 2005, Hogan and Wilkins 2005).2
Second, our finding that the more auditable account-specific weaknesses are not associated with
lower accruals quality is complementary to Hogan and Wilkins (2006) who find that audit fees
are abnormally high for firms with an internal control deficiency in the year preceding the
deficiency disclosure, indicating that auditors are able to reduce the impact of poor controls
through substantive testing. Finally, our conclusion that it is the internal control problem that is
the root cause of the lower accruals quality is supported by Ashbaugh-Skaife et al. (2006) and
Bedard (2006) who find that accruals quality improves in the year following the reported internal
control problem for firms that appear to have remediated their deficiencies.3 In sum, the papers
2 This finding also complements and motivates recent studies that examine market reactions to these disclosures as well as differences in the implied cost of capital for firms with weak internal controls (e.g., Beneish et al. 2006; DeFranco et al. 2005; Hammersley et al. 2007; Ogneva et al. 2006). 3 Altamuro and Beatty (2006) examine the impact of the FDICIA-mandated internal control reforms within the banking industry and find that these reforms led to improvements in earnings quality for banks affected by the regulation relative to unaffected banks during the same period. Their findings are also consistent with poorer internal control resulting in lower earnings quality.
5
in this area jointly present a fairly cohesive picture of how internal controls affect accruals
quality.
The paper proceeds as follows. The next section motivates our hypotheses, and Section
III describes our sample selection and variable definitions. Section IV presents our main results,
and Section V describes our robustness tests. A summary and concluding remarks are offered in
the final section.
II. HYPOTHESES
Internal control over financial reporting is defined as “a process…to provide reasonable
assurance regarding the reliability of financial reporting …” (PCAOB 2004, emphasis added).
By definition, good internal control is supposed to result in more reliable financial information.
Internal controls aim to prevent and/or detect errors or fraud that could result in a misstatement
of the financial statements. However, there is limited empirical evidence in the existing
literature regarding the relation between the quality of internal control and the quality of
accounting information.4 A major reason is lack of data on internal control; in general, it is
difficult to directly observe or verify internal control (Kinney 2000).
Our sample is generated from the disclosures of material weaknesses in internal controls
that first appeared as a result of Section 302 of Sarbanes-Oxley, which requires that officers
certify the financial statements, including the effectiveness of the internal control over financial
reporting, and any material changes in internal control. Material weaknesses have also been
disclosed in conjunction with Section 404 requirements, which became effective for accelerated
4 In related work, Krishnan (2005) finds that internal control problems are negatively associated with the quality of the audit committee. To the extent that audit committee quality and internal control quality are positively associated, this finding supports our hypothesis. As noted in the introduction, there are several concurrent works examining earnings quality and internal control problems (e.g., Ashbaugh-Skaife et al. 2006; Hogan and Wilkins 2005).
6
filers for fiscal years ending after November 15, 2004.5 Section 404 requires that management
issue a report on internal control over financial reporting, and that auditors attest to their
findings. The non-audited internal control disclosures under Section 302 are meant to be a
transition to the full “attestation” regime under Section 404, with Section 404 becoming the
ongoing internal control reporting mechanism. However, as the date for non-accelerated filers to
comply with Section 404 has been extended several times (most recently to December 15, 2008
for full attestation), internal control disclosures continue to be reported under Section 302 for
these smaller companies. Regardless of the origin of the material weakness disclosure, all else
equal we expect these disclosures to be informative about the quality of firms’ accruals.
Prior research on earnings quality is generally related to accruals quality (Dechow and
Schrand 2004), and that is also the focus in this paper. Accruals can be of poor quality for two
basic reasons: 1) management could intentionally bias accruals through earnings management
and 2) unintentional errors in accrual estimation could occur because it is difficult to predict an
uncertain future, or simply because there are insufficient controls in place to catch errors. Both
of these roles have been investigated in the existing literature. With respect to earnings
management, managers have been shown to use “discretionary accruals” to manage earnings in
various settings, such as prior to equity offerings (e.g., Rangan 1998; Teoh et al. 1998). As for
unintentional errors, Dechow and Dichev (2002) point out that the quality of accruals and
earnings are not limited to managerial opportunism but are also related to the inherent difficulty
5 Section 302 of the Sarbanes-Oxley Act became effective for fiscal years ending after August 29, 2002 for all SEC registrants. Section 404 became effective for fiscal years ending after November 15, 2004 for accelerated filers, a classification that generally includes public firms with a market capitalization of at least $75 million (the due date was extended an additional 45 days for accelerated filers with a market capitalization of less than $700 million in November 2004). For non-accelerated filers, Section 404 will be effective for years ending on or after December 15, 2007 for management assessment of the effectiveness of internal control and December 15, 2008 for the auditor’s attestation report. Since the reporting requirements differ on important dimensions that are likely correlated with accruals quality, we conduct sensitivity analyses that differentiate between Section 302 and 404 disclosures. These alternative results are discussed in Section IV.
7
in estimating accruals for firms with certain characteristics (e.g., longer operating cycles). They
measure the quality of accruals by the extent to which the accruals map into cash flows. In
general, they find that the quality of accruals is poorer for firms with certain characteristics, such
as a high proportion of losses, more volatile sales and cash flows, lower total assets, and longer
operating cycles.
We expect that weaknesses in internal control will result in lower accruals quality
because, by definition, they have the potential to allow errors in accrual estimation to occur and
impact the reported financial statements. These potential errors include both intentional
(earnings management) and unintentional (poor estimation ability) errors. For a company with
weak controls, intentionally biased “discretionary” accruals could be greater by failing to limit
management’s ability to manage earnings (e.g., by segregating duties). Unintentional errors
could be higher if weak controls result in more estimation errors for difficult to estimate accruals
(e.g., by failing to ensure that qualified personnel are calculating estimates) and allow more
procedural errors (e.g., by failing to have appropriate reconciliations and reviews in place). As
an example, Cardiodynamic International disclosed a material weakness related to the frequency
of their analysis of the inventory obsolescence provision. This material weakness most likely
resulted in estimation errors related to its inventory accounts, which may have been intentional to
allow the understatement of expenses. These estimation errors, caused by the material weakness
in internal control, likely resulted in lower overall accruals quality for Cardiodynamic. This
leads to our first hypothesis:
H1: Material weaknesses in internal control are negatively associated with accruals
quality.
8
Our first hypothesis is based on the notion that good internal control over financial
reporting is an effective internal monitoring device and results in higher quality financial
reporting. However, the hypothesis does not consider external monitors. It is possible that
auditors increase substantive testing when encountering weak internal controls. In other words,
internal controls and substantive testing could be substitutes in producing high quality accruals
(e.g., Wright and Wright 1996). Our next hypothesis, therefore, is related to the “auditability” or
potential severity of the internal control weaknesses.
While a material weakness is the most severe type of internal control deficiency, within
the material weakness classification the severity of internal control problems varies substantially.
Moody’s (the bond-rating company) proposes that material weaknesses fall into one of two
categories. Account-specific material weaknesses relate to controls over specific account
balances or transaction-level processes. Moody’s suggests that these types of material
weaknesses are “auditable,” and thus do not represent as serious a concern regarding the
reliability of the financial statements. Company-level material weaknesses, however, relate to
more fundamental problems such as the control environment or the overall financial reporting
process, which auditors may not be able to “audit around” effectively. Moody’s suggests that
company-level material weaknesses call into question not only management’s ability to prepare
accurate financial reports but also its ability to control the business (Doss and Jonas 2004).6 The
disclosure by Nitches, Inc., illustrates a typical “company-level” material weakness:
In October 2004, our management concluded that there were certain material weaknesses in our internal controls and procedures. The material weaknesses noted related to segregation of duties in the payroll process and in the monthly closing process; inadequate review and approval of
6 It might seem that auditors should also be able to substantively test company-level weaknesses, however, the general nature of these weaknesses does not pinpoint where additional substantive testing should occur, while the account-specific weaknesses highlight a specific area where auditors can then focus more attention.
9
management-level adjustments and entries. We have discussed these material weaknesses with our auditors, Moss Adams, LLP, who have recommended taking steps to alleviate the inadequate segregation of duties within these areas….
This internal control problem could feasibly affect accruals quality. The lack of proper checks
and balances might result in procedural errors, while inadequate review of managerial
adjustments might facilitate earnings management. Thus, we expect Nitches to exhibit poorer
accruals quality than a similar firm (with respect to size, operating cycle, etc.) without a material
weakness in internal control. A seemingly less severe “auditable” material weakness was
reported by I-Flow Corporation:
As part of the annual audit process, a material weakness was identified in our controls related to the application of generally accepted accounting principles, specifically related to the classification of the Company’s short-term investments, resulting in the Company reclassifying approximately $34 million of cash and cash equivalents to short-term investments....
It is not clear that this weakness would result in lower accruals quality. The distinction between
company-level and account-specific material weaknesses is especially important for the more
recent material weakness disclosures in our sample. These disclosures appear to be more
conservative, and, per discussions with auditors, might be overly conservative. This leads to our
second hypothesis:
H2: Company-level material weaknesses have a stronger negative relation with accruals quality than account-specific material weaknesses.
10
III. DATA, SAMPLE SELECTION, AND VARIABLE DEFINITIONS
Identifying and Classifying Firms with Material Weaknesses
As mentioned above, material weaknesses in internal control have only been widely
disclosed in SEC filings since August of 2002. To collect our test firms, we search
10Kwizard.com (10-Ks, 10-Qs, and 8-Ks) using the keywords “material weakness” and
“material weaknesses” from August 1, 2002 to October 31, 2005. We include only those firms
that classify their internal control problem(s) as a material weakness, the most severe internal
control deficiency.7 We focus on material weaknesses for two reasons. First, it is the most
severe type of deficiency in internal control and the most likely to affect accruals quality.
Second, the disclosure of material weaknesses is effectively mandatory, while the disclosure of
lesser “significant deficiencies” is unambiguously voluntary (see footnote 19). Focusing on the
more mandatory disclosures helps avoid self-selection issues associated with voluntary
disclosures.
This procedure identifies 1,210 firms that disclosed at least one material weakness from
August 2002 to November 2005, outlined in Table 1, Panel A. Of these firms, 164 are not
covered by Compustat, and 79 companies in our sample disclosed a material weakness related to
lease accounting in 2005. These disclosures were responses to the views expressed by the Office
of the Chief Accountant of the SEC in a February 7, 2005 letter to the AICPA. Due to the
narrow, technical nature of this issue, we exclude these firms from our analysis (the inclusion of
these firms leads to very similar results). If a parent and subsidiary both file with the SEC and 7 A material weakness is “a significant deficiency, or combination of significant deficiencies, that results in more than a remote likelihood that a material misstatement of the annual or interim financial statements will not be prevented or detected,” as defined by the Public Company Accounting Oversight Board (PCAOB) under Auditing Standard No. 2. A significant deficiency is defined as “a control deficiency, or combination of control deficiencies, that adversely affects the company’s ability to initiate, authorize, record, process, or report external financial data reliably in accordance with generally accepted accounting principles such that there is more than a remote likelihood that a misstatement of the company’s annual or interim financial statements that is more than inconsequential will not be prevented or detected” (PCAOB 2004, Paragraph 9).
11
report the same material weakness, we include only the parent company and remove the
subsidiary from our control firms if the subsidiary is covered by Compustat (17 firms). We also
exclude from our control sample the 100 firms identified by Compliance Week
(www.complianceweek.com) as having a significant deficiency that does not reach the severity
of a material weakness, in order to create a more powerful test between firms with clear internal
control problems (firms reporting material weaknesses) and those with no apparent internal
control problems. Next, 259 (1,974) of our material weakness (control) sample firms have
insufficient data to calculate our measure of accruals quality. We also eliminate three material
weakness firms and 14 control firms that were involved in a significant merger (greater than 50
percent of sales) during the accruals quality estimation period, because the merger could result in
mismatched current accruals and future cash flows (Hribar and Collins 2002). A significant
merger is identified in Compustat footnote 1 as “AB.” These restrictions result in a sample of
705 (3,280) material weakness (control) firms with non-missing accruals quality data and 645
(2,943) material weakness (control) firms in our multivariate tests.8 We summarize our sample
selection process in Table 1, Panel A.
[Insert Table 1 about here]
We next classify firms as having either a company-level or account-specific material
weakness in order to test the hypothesis that more severe, company-level, weaknesses will be
more negatively associated with accruals quality. We provide examples of each category in
Appendix A. These classifications are mutually exclusive; if a firm has both company-level and
account-specific weaknesses, we code the firm as having a company-level material weakness. In
8 Of the 645 material weakness firms in our final sample, eight were disclosed in 2002, 55 in 2003, 207 in 2004, and the remaining 375 in 2005. Of the 375 disclosures in 2005, 276 (74 percent) correspond to our estimate of 404 filers (a float greater than or equal to $75 million). Only 15 (7 percent) of the disclosures from 2004 correspond to 404 filers (a float of greater than or equal to $75 million and a filing date after November 14, 2004).
12
some cases, it is straightforward to categorize a disclosure as company-level; for example, when
“ineffective control environment” or “management override” is specifically identified as a
material weakness in the disclosure. However, most disclosures are not so forthcoming. Thus, if
a firm has material weaknesses related to at least three account-specific problems, we classify the
firm as having a company-level material weakness. In two cases, the firm has insufficient
information to code the disclosure; we classify both of these disclosures as company-level. Of
our 705 firms with non-missing accruals quality data, 426 are classified as account-specific and
279 as company-level.
Accruals Quality Measures
We use the measure of accrual estimation error developed in Dechow and Dichev (2002)
and modified in McNichols (2002) and Francis et al. (2005) as our main measure of accruals
quality. This measure defines the quality of accruals as the extent to which they map into past,
current, and future cash flows. We assume that this measure can capture the effect of internal
control on accruals quality for two reasons. First, a large number of disclosed material
weaknesses are related to specific accounts (e.g., inventory; Ge and McVay 2005). These
specific accounts could have estimation errors that will be captured by this measure. For
example, if the inventory account is overstated, the obsolete inventory will not result in cash
inflows in the next period, resulting in a low correlation between the accrual and realized cash
flows. Second, compared to other measures of accruals quality, the measure in Dechow and
Dichev (2002) does not rely solely on earnings management or assumptions related to market
efficiency (e.g., value-relevance). This measure can capture both biased “discretionary” accruals
13
and unintentionally poorly estimated accruals, which we predict will be the result of an internal
control system with material weaknesses.9
Specifically, the proxy for accruals quality is measured by estimating the following
regression by industry and year:
�WCt = β0 + β1 CFOt–1 + β2 CFOt + β3 CFOt+1 + β4 �REVt + β5PPEt + �t (1)
The residuals from the regression measure the extent to which current accruals (�WC) do not
effectively map into past, present, or future cash flows (CFO).10 Following both McNichols
(2002) and Francis et al. (2005), we also include the current year change in sales (�REV = �(data
item 12)) and the current year level of property, plant, and equipment (PPE = data item 7) in
equation (1). The inclusion of these two variables links the Dechow and Dichev (2002) measure
to the Jones (1991) model of discretionary accruals.
Following Francis et al. (2005), we estimate the above regression cross-sectionally, by
year, within each of the 48 Fama and French (1997) industry classifications. If an industry group
has fewer than 20 observations in any given year, those observations pertaining to that industry
are deleted. We use annual Compustat data spanning 1995–2003, which results in seven years of
observations (1996–2002), since the regression requires data from the past and future years. We
then aggregate the residuals by firm and calculate the standard deviation of residuals (AQ), by
firm, requiring a minimum of four years of data out of the seven years. A higher standard
deviation indicates lower accruals quality.
9 Roychowdhury (2006), among others, shows that firms appear to manipulate real operating activities in order to “manage” earnings. However, such an action is not a violation of generally accepted accounting principles, and thus we do not expect good internal control to constrain this behavior. 10 We define the change in working capital accruals from year t–1 to t as �WC = �Accounts Receivable + �Inventory – �Accounts Payable – �Taxes Payable + �Other Assets, or �WC = –(data item 302 + data item 303 + data item 304 + data item 305 + data item 307). CFO is cash flow from operations (data item 308). All variables in equation (1) are scaled by average total assets (data item 6) and winsorized at the 1st and 99th percentiles, by year.
14
As with any proxy, our measure of accruals quality has limitations. As noted in
McNichols (2002), the Dechow and Dichev approach limits the applicability of the model to
accruals that are short term in nature (i.e., working capital accruals). In addition, the definition
of accruals quality is symmetric for estimation errors that overstate and understate cash flow
realizations by an equal amount, which may be problematic in certain settings, although less of a
concern in our setting as unintentional errors are not expected to be systematically over- or
understated. Moreover, a sizable fraction of the explanatory power of the measure is attributable
to the negative contemporaneous association between accruals and cash flows. To the extent that
this contemporaneous component does not capture accruals quality, it can handicap the ability of
the Dechow and Dichev model to capture accruals quality (Wysocki 2006). Finally, as with any
measure, to the extent that we do not properly control for the joint determinants of both accruals
quality and material weaknesses, our conclusions would not be warranted.
In order to further validate our results and to enhance comparison with other research on
earnings quality, we also examine four additional proxies of earnings/accruals quality. The first
is Discretionary Accruals, which is the average of the absolute value of discretionary accruals,
estimated following Becker et al. (1998) and Kothari et al. (2005).11 Our second alternative
proxy, Average Accruals Quality, is suggested in Dechow and Dichev (2002). This measure, the
average of the absolute value of the firm residuals from equation (1), is estimated in the cross-
section and is highly correlated with our main accruals quality measure (the standard deviation of
the residuals). The third alternative proxy of accruals quality is Historical Restatement, which is
11 Discretionary accruals are estimated using the following OLS regression: Total Accrualst/Total Assetst-1 = �0+�1(1/Total Assetst-1) + �2 (�Revenuet/Total Assetst-1) + �3( PPEt/Total Assetst-1) + et. Total Accruals are calculated as the difference between income before extraordinary items (Compustat item 123) and operating cash flows (Compustat item 308). We estimate the above regression by two-digit SIC code, requiring at least 20 observations in each industry group. Our main tests present the Becker et al. (1998) specification. We also consider the performance-adjusted discretionary accruals prescribed by Kothari et al. (2005) as a robustness check.
15
an indicator variable that is equal to one if the firm was listed by the General Accounting Office
(GAO) as having had a restatement from January 1997 through December 2002. Intuitively, in
order for a restatement to occur, an error (either intentional or unintentional) must have been
made. Therefore, while our Dechow and Dichev (2002) measure attempts to capture these errors
through the realization of cash flows, restatements provide explicit evidence of these errors.12
Our final alternative measure of accruals quality is Earnings Persistence (Dechow and Dichev
2002; Schipper and Vincent 2003). These four alternative measures are defined in Table 1,
Panel B.
Timing of the Measurement of Accruals Quality
Since internal control disclosures were not widely available prior to the Sarbanes-Oxley
Act of 2002, it is difficult to determine how long the newly disclosed weaknesses have existed in
the company. This has implications for the time period over which we measure our accruals
quality variable. In our paper, we assume that the weaknesses, on average, have existed several
years prior to their disclosure, if not since the firm’s inception. Each of our proxies for accruals
quality is measured from 1996 to 2002, which results in almost no overlap with the financial
periods in which the weaknesses were reported. We can infer from the descriptions that many of
the disclosures have been around for some time. For example, 3D Systems had the following
disclosure:
Specifically, our revenue recognition policies and procedures were poorly documented and not readily accessible to most of our employees. Our documentation for machine sales transactions was inconsistent and not adequately defined. Furthermore, the then existing policies and procedures [were] broad-based, and did not include specific procedures and controls by department or
12 It is possible that the causality is reversed. Ashbaugh-Skaife et al. (2007) suggest that a recent restatement results in increased auditor and regulator scrutiny, which may result in additional search procedures or increase the likelihood of a voluntary disclosure of a significant deficiency.
16
function. Moreover, our accounting and finance staff were inadequate to meet the needs of an international public company.
It seems unlikely that 3D Systems did not have these problems in the recent years preceding the
disclosure. Rather, it seems likely that Sarbanes-Oxley led to the disclosure of a situation that
had existed for some time. As another example, Sonix Research Inc., reported the following:
Due to its small size and limited financial resources, however, the Company’s chief financial officer, a member of management, has been the only employee involved in accounting and financial reporting. The Board of Directors has recognized that as a result, there is no segregation of duties within the accounting function, leaving all aspects of financial reporting and physical control of cash and equivalents in the hands of the same employee. Usually, this lack of segregation of duties represents a material weakness in a company’s internal control over financial reporting; however, based on the demonstrated integrity and trustworthiness of the Company’s chief financial officer, the Board of Directors has had confidence that there have been no irregularities in the Company’s financial reporting or in the protection of its assets.
The above condition has probably existed since the firm’s inception. Clearly, not all the material
weakness disclosures are long-standing; however, in our study we operate under the assumption
that, on average, these problems have been around for multiple years, and measure our accruals
quality proxies over the preceding seven years (1996–2002).
An alternative approach is to measure accruals quality in the same period that the
material weakness was reported. We choose not to use this approach because the impending
disclosure of an internal control weakness may cause management and/or the auditor to intensify
their search for misestimated accruals, resulting in more write-downs and thereby lower accruals
quality (Hogan and Wilkins 2005). If these low-quality accruals do not result from the
company’s poor internal controls per se, a lower concurrent accruals quality measure could be
misattributed to the control system. Our use of an accruals quality measure that is calculated in
the periods preceding the material weakness disclosure helps to address this competing
17
explanation that auditors applied additional scrutiny and conservatism to the firms that they
knew would be publicly disclosing their internal control problems.
Innate Firm Characteristics that Affect the Quality of Accruals
Dechow and Dichev (2002) find that accruals quality is poorer for firms with certain
characteristics, such as for smaller firms. We expect that internal control weaknesses will reduce
accruals quality beyond that explained by these innate firm characteristics. While Dechow and
Dichev (2002) find that smaller firms tend to have lower quality accruals, we expect that, for two
equally small firms, the company with weak internal controls will have lower accruals quality.
For this reason, we include these five innate firm variables as controls in our analysis: Loss
Proportion, Sales Volatility, Cash Flow (CFO) Volatility, Total Assets, and Operating Cycle, as
we wish to focus on the effect of the internal control problem, rather than generic volatility or a
firm’s operating cycle (see Table 1, Panel B for variable definitions).
Prior research has also identified determinants of material weaknesses in internal control.
Material weakness firms tend to be less profitable, smaller, younger, more complex, growing
rapidly, or undergoing restructuring (e.g., Krishnan 2005; Ge and McVay 2005; Ashbaugh-
Skaife et al. 2007; Doyle et al. 2007).13 As these characteristics may have a direct effect on
accruals quality, we include one proxy for each of these constructs in our main regressions as
follows: the size of the firm (Total Assets), the age of the firm (Firm Age), profitability (Loss
Proportion), the complexity of the firm’s operations (Segments), rapid growth (Extreme Sales
Growth), and restructurings (Restructuring Charge); see Table 1, Panel B for definitions.
13 Krishnan (2005) finds that internal control problems and audit committee quality are negatively associated. We examine this variable in a sensitivity analysis in Section V; our results are not sensitive to its inclusion.
18
IV. RESULTS
Descriptive Statistics and Univariate Analysis
Table 2, Panel A presents descriptive statistics for our sample of firms reporting material
weaknesses. As our comparison group, we present all 2003 Compustat firms that were not
identified as having an internal control deficiency and do not have missing data for our accruals
quality measure; we report the results of a difference in means under a two-tailed t-test for each
of the variables. Turning first to Accruals Quality (AQ), a higher AQ indicates a higher standard
deviation of residuals, and thus lower accruals quality. The mean of AQ is higher for the
material weakness firms compared to the control sample (0.070 versus 0.057; p-value of 0.001),
providing initial support for H1. This univariate result extends to each of our proxies for
accruals quality. The average absolute value of discretionary accruals is significantly higher for
material weakness firms (0.166 versus 0.133; p-value of 0.001), and their proportion of historical
accounting restatements is also higher (0.139 versus 0.092; p-value of 0.001). Finally, earnings
persistence is lower for the material weakness firms (0.697 versus 0.736; p < 0.001 under an F-
test).
[Insert Table 2 about here]
Overall, the univariate results support H1; however, as noted above, we expect material
weakness firms to also have lower innate accruals quality, an expectation supported by Table 2,
Panel A. Material weakness firms have more losses, have higher sales and cash flow volatility,
and are smaller than the control firms. In addition, in results measured from 1996 through 2002
(scaled by average total assets and not tabulated), material weakness firms have lower average
cash flows from operations (–0.012 versus 0.020) and lower average earnings before
extraordinary items (–0.100 versus –0.063), but higher average working capital accruals (0.072
19
versus 0.057). Since the material weakness firms tend to be more volatile and in worse financial
condition, it is vital to control for these innate characteristics in our multivariate tests.14
In Table 2, Panel B we compare account-specific material weakness firms to company-
level material weakness firms. AQ is significantly higher for firms that disclose company-level
material weaknesses than for firms that disclose account-specific material weaknesses (mean of
0.080 versus 0.063). Discretionary Accruals (0.191 versus 0.149), Average Accruals Quality
(0.069 versus 0.056), and Historical Restatement (0.183 versus 0.110) are all higher for the
company-level weakness firms as well. Finally, Earnings Persistence is lower for the company-
level group at 0.668 versus 0.728. Overall, the univariate results seem to provide initial support
for H2; firms with company-level weaknesses have lower accruals quality than firms with
account-specific weaknesses. The innate variables associated with lower accruals quality also
tend to be higher for the company-level disclosure firms, supporting the need for these control
variables when testing H2. For example, firms with company-level disclosures tend to have
more losses and greater sales and cash flow volatility compared to their account-specific
counterparts. They also have lower average cash flows and earnings before extraordinary items,
and higher working capital accruals (not tabulated). Account-specific disclosure firms tend to be
slightly larger and older and have more segments than company-level disclosure firms,
consistent with the notion that the additional complexity associated with size and
decentralization creates unique challenges for these firms (Doyle et al. 2007).
Turning to Table 3, which presents a correlation matrix for the main variables, material
weakness firms are positively correlated with most of the innate characteristics of firms with
14 Interestingly, while the bulk of the determinants of material weaknesses in internal control are consistent with prior literature, our sample does not exhibit univariate differences for rapid growth. Upon further inspection, this difference is a function of our stringent data requirements to calculate accruals quality; if the means are compared before requiring accruals quality data, results are consistent with prior research.
20
poor accruals quality identified in Dechow and Dichev (2002). Material weakness disclosures
are positively associated with a higher proportion of losses, higher cash flow and sales volatility,
and longer operating cycles, which raises the possibility that these innate firm characteristics are
driving the lower accruals quality, and not the material weaknesses per se. Our multivariate
analyses below investigate our hypotheses further.15
[Insert Table 3 about here]
Multivariate Analysis of Accruals Quality and Material Weaknesses
The first column of results in Table 4 contains the regression estimates of accruals quality
on an indicator variable, material weakness (MW), where MW is equal to one if the firm reports a
material weakness and zero if the firm is in the control group. We present our primary accruals
quality measure (AQ) as the dependent variable (recall that a higher value represents lower
accruals quality) and control for the innate firm characteristics related to accruals quality as well
as the determinants of material weaknesses. As noted above, we include only one proxy for each
of the determinants of material weaknesses for succinctness. Results are not sensitive to the
inclusion of the comprehensive list of variables; the coefficient on MW is 0.004 with a p-value of
0.003 when all variables are included.
[Insert Table 4 about here]
Our main variable of interest, MW, is positively related to the accruals quality measure (t-
statistic = 2.51), supporting H1 and suggesting material weakness firms have poorer accruals
quality. The economic magnitude of the coefficient on MW (α = 0.004) is also significant. For
the typical control firm (median Accruals Quality of 0.042 from Table 2, Panel A) a switch from
15 As several of our variables are correlated at 0.40 or more, we examine the variance inflation factors (VIFs) for each of our multivariate regressions below to help ensure that multicollinearity is not a major concern. None of our calculated VIFs exceed two, which is well below the level indicating harmful multicollinearity (Kennedy 1998, p. 190).
21
MW=0 to MW=1 results in a 9.5 percent (0.004 divided by 0.042) increase in the accruals quality
metric (implying poorer accruals quality), after controlling for other known determinants of
accruals quality. Turning to our control variables, each of the variables measuring innate firm
characteristics that are expected to affect accruals quality is significant in the predicted direction
(Dechow and Dichev 2002). Finally, the additional controls we identified through our
examination of the internal control literature are largely insignificant.
We next examine the relation between accruals quality and the different types of internal
control deficiencies. H2 predicts that company-level material weaknesses will have a stronger
association with accruals quality than will account-specific material weaknesses, since company-
level internal control deficiencies are less “auditable” and thus more likely to result in erroneous
accruals in the filed financial statements. As in our earlier tests, we control for the innate firm
characteristics that proxy for the inherent difficulty in accrual estimation and the determinants of
material weaknesses.
Referring to the second column of results in Table 4, account-specific material
weaknesses are not significantly associated with accruals quality (t-statistic = 0.94) while
company-level material weaknesses are positively related to AQ (t-statistic = 3.09). Consistent
with H2, the magnitude of the coefficient on account-specific weaknesses (α = 0.002) is
significantly lower than the magnitude of the coefficient on company-level weaknesses (α =
0.007) under an F-test (p = 0.057, two-tailed). Economically speaking, the presence of a
company-level (account-specific) material weakness is expected to be associated with a standard
deviation that is 16.7 (4.8) percent larger than the control firms.
Our finding that account-specific internal control problems are not significantly
associated with lower accruals quality complements Hogan and Wilkins (2006), who find that
22
auditor fees were significantly higher for material weakness firms in the year prior to the
disclosure of a significant deficiency. Thus, our combined results are consistent with auditors
historically “auditing around” the account-specific internal control problems, thereby mitigating
the negative impact on accruals quality.
Multivariate Analysis of Additional Accruals Quality Variables
In Table 5, we replicate our main results for our four additional measures of accruals
quality. Referring to the first column of results in Table 5, consistent with Ashbaugh-Skaife et
al. (2006), material weakness disclosures are positively associated with Discretionary Accruals
(t-statistic = 1.89).16 We parse out account-specific and company-level problems in the second
column of results. While the coefficient on company-level problems appears to be larger in
magnitude than that on account-specific weaknesses, consistent with our main results, the
coefficients are not significantly different from one another under an F-test (p = 0.410, two-
tailed).
[Insert Table 5 about here]
Our second alternative proxy, Average Accruals Quality, is presented in the third and
fourth columns of results in Table 5. Given the fact that this variable is highly correlated with
our primary accruals quality measure, it is not surprising that the results are very similar to those
shown in Table 4 and continue to support H1 and H2; the coefficients on account-specific and
company-level weaknesses are significantly different under an F-test (p = 0.063, two-tailed).
In the third set of columns in Table 5 we present the estimates from a logistic regression,
where Historical Restatement is equal to one if the company had a restatement from 1997–2002.
The coefficient on MW is positive and significant (�2 = 12.21), and the breakdown by type is 16 The results remain similar if we use performance-matched discretionary accruals (t = 1.82) following Kothari et al. (2005).
23
consistent with the results above—lower accruals quality is driven by the company-level
weaknesses. The difference between the coefficients is statistically significant under an F-test (p
= 0.008, two-tailed).
Our final alternative measure of accruals quality is Earnings Persistence, presented in the
final two columns in Table 5. We interact MW with Earnings (Compustat data item #123 scaled
by average total assets) to evaluate the incremental persistence of material weakness firms for
2002. The interaction term on MW is negative and significant (–0.067; t-statistic = 2.73),
suggesting again that the earnings/accruals quality of material weakness firms is poorer than that
of our control firms. Finally, referring to the final column of results, MW is only negatively
related to earnings persistence for company-level weaknesses, and this coefficient is statistically
different from that on account-specific weaknesses under an F-test (p = 0.001, two-tailed).
Overall, the multivariate results support the notion that accruals quality is lower when a
firm has a weak internal control system (H1) and that this relation is stronger when the internal
control problems are at the company level (H2). These results are consistent across the different
proxies for accruals quality.
Analysis by Reporting Regime
As mentioned earlier, material weakness disclosures under Section 404 are likely to be
different than those under Section 302. In this section, we investigate how these differences
affect our study. In Table 6, we re-estimate our regressions separately for the 302 and 404 sub-
groups. The coefficients on the MW variable (t-statistic = 3.22) and the company-level variable
(t-statistic = 3.73) are strongly positive for 302 reporters, consistent with the full sample results.
For Section 404 filers, the results are similar, but quite a bit weaker. The main driver of lower
accruals quality, company-wide material weaknesses, is still significant (t-statistic = 2.00), but
24
the coefficient value for Section 404 (0.005) is about half of the coefficient for Section 302
(0.011). This reduced effect translates into an overall coefficient on the MW variable that is now
insignificant for the average Section 404 material weakness disclosure (t-statistic = 0.95).17
[Insert Table 6 about here]
There are several possible explanations for the weaker results for the Section 404 sub-
group. First, the increased scrutiny of a full Section 404 audit and the fact that the external
auditor must sign off on an opinion regarding the company’s controls may be causing auditors to
be unduly cautious in identifying material weaknesses. This lower effective threshold for
Section 404 material weaknesses could result in many reported weaknesses that are not related to
real financial reporting consequences. Supporting this idea, the percentage of less-severe,
account-specific material weaknesses rises from 58 percent of our Section 302 disclosures to 64
percent of our Section 404 disclosures.18
Next, since non-accelerated filers are not yet subject to Section 404, it is possible that the
bias in our existing Section 404 sample (e.g., 404 reporters are bigger and financially stronger) is
leading to our finding of no relation between material weaknesses and accruals quality. For
example, the median of total assets and market capitalization is $327 million and $377 million
for Section 404 reporters versus $109 million and $49 million for Section 302 reporters. The
Section 404 firms also have lower Loss Proportion (0.39 versus 0.46), Sales Volatility (0.266
versus 0.311), and CFO Volatility (0.105 versus 0.118) than the Section 302 firms. Although we
17 Interestingly, if we exclude the 86 Section 404 material weakness disclosure firms that also filed a material weakness under Section 302, the remaining 291 Section 404 material weakness disclosures are not associated with accruals quality in any of our regressions. Unfortunately, we are not able to discern how long the 291 internal control problems have been in existence (see Section 3). Because our accruals quality variable is measured from 1996–2002, new internal control problems are not expected to be associated with our measure. 18 Note that this increase in account-specific weaknesses would not explain our result showing a weaker relation for company-level disclosures. However, it is also possible that the language imposed by auditors describing weaknesses is more severe under Section 404 causing us to code some account-specific weaknesses as more severe, company-level types, which would dilute the power of our tests.
25
control for these specific factors in our tests in Table 6, these controls may be incomplete. Future
tests on Section 404 disclosures that include smaller, non-accelerated filers may yield different
results from those shown in Table 6.
Finally, while the disclosure of material weaknesses is mandatory under Section 404,
ambiguity exists as to whether material weaknesses are required to be disclosed under Section
302.19 If a large number of firms are treating material weakness disclosures under Section 302 as
voluntary, it is possible that many firms are choosing not to report less severe Section 302
material weaknesses, thus leaving a reported 302 sample that is more serious in nature and more
correlated with poor accruals quality.
Overall, the results seem to indicate that the Section 404 material weakness disclosures
are less informative in identifying firms with real financial reporting concerns (e.g., lower
accruals/earnings quality). This finding is especially important given the high cost of
compliance with Section 404. However, given the limitations noted above for the initial Section
404 disclosures in our sample, future tests using a longer time-series and a more inclusive 404
sample may find different results.
19 While Question 9 of the SEC’s Frequently Asked Questions (SEC 2004) seems to imply that firms should only “carefully consider” whether to publicly disclose material weaknesses under Section 302, Question 11 states without reserve that “[a] registrant is obligated to identify and publicly disclose all material weaknesses.” Confusion arises due to the existence of two largely overlapping definitions of controls (“disclosure controls and procedures” and “internal controls over financial reporting”), two reporting regimes (Sections 302 and 404), and two tiers of reporting requirements (accelerated vs. non-accelerated filers). Although some firms might interpret the material weakness disclosure requirement under Section 302 as voluntary, our reading of the bulk of SEC guidance and many firms’ begrudging material weakness disclosures seems to indicate that most firms are treating the disclosure as mandatory.
26
V. ROBUSTNESS CHECKS
Self-Selection of Internal Control Quality
In our main analysis, we include known determinants of material weaknesses as
independent variables and focus on material weaknesses (the most severe problems), which are
effectively required to be disclosed, thereby eliminating much of the choice to disclose (see
footnote 19). Nevertheless, it is still possible that firms can choose both the quality of their
internal controls and their efforts to discover and disclose any known weaknesses (Ashbaugh-
Skaife et al. 2007). This choice introduces possible self-selection bias into our observed sample.
In this section, we econometrically control for self-selection bias in two ways. First, we use a
two-stage approach and estimate a probit regression of MW on the determinants of material
weaknesses. This first-stage regression closely follows Doyle et al. (2007) and is presented in
Appendix B. From this first-stage regression, which identifies the likelihood of a firm being
“selected” as a material weakness firm, we calculate the inverse Mills ratio (see Heckman 1979;
Leuz and Verrecchia 2000) and include this ratio in our accruals quality regressions. Including
the ratio in our main regressions helps control for the likelihood of self-selecting into the
material weakness group. As shown in Table 7, after including the inverse Mills ratio, the results
are similar to those in Table 4. The coefficient estimate of MW in the first column of Table 7
becomes 0.010 (t-statistic = 2.08) and the coefficient for the company-level material weaknesses
in the second column is 0.013 (t-statistic = 2.53).20
[Insert Table 7 about here]
20 We consider multiple additional variables in our first stage regression to ensure that we are properly controlling for volatility and performance. Specifically, we have considered: sales volatility, cash flow volatility, the rank of market-adjusted stock returns, and an indicator variable if sales growth falls into the lowest quintile in a given industry. Results are qualitatively and quantitatively consistent with those presented.
27
Second, we control for self-selection by creating a matched sample based on the
predicted probabilities from the first-stage probit regression. This method, known as propensity
score matching (LaLonde 1986), creates a nonmaterial-weakness control sample with the same
predicted probabilities of having a material weakness. The propensity score matching method
produces a matched sample of 645 control firms, which meet the data requirements to test H1.
When using a matched sample, the results shown in the third and fourth columns of Table 7 are
similar to those in Table 4. The coefficient estimate on MW in the third column of Table 7 is
0.004 (t-statistic = 1.71) and the coefficient for the company-level material weaknesses in the
fourth column is 0.007 (t-statistic = 2.39).21
Auditor Type and Auditor Changes Sensitivity Analysis
Both auditor type and auditor changes have been shown to be associated with disclosing
an internal control problem. Ge and McVay (2005) and Ashbaugh-Skaife et al. (2007) document
a positive association between being audited by large auditors (the Big N, BDO Seidman and
Grant Thornton) and disclosing internal control problems. Ashbaugh-Skaife et al. (2007)
document that auditor changes are also positively associated with the disclosure of internal
control problems. Both auditor type and auditor changes have also been shown to be associated
with accruals quality (Becker et al. 1998; DeFond and Subramanyam 1998; Francis et al. 1999).
In this section, we consider the effects of both auditor type and auditor changes on the
association between accruals quality and material weakness disclosures.
21 An alternative way to test our hypotheses using the propensity score match approach is to take the differences of the variables between the test and matched control firms and test the significance of the intercept coefficient. Results are very similar using this alternative approach. For all material weaknesses, the intercept coefficient is positive and significant; 0.004 with a p-value of 0.051. The intercept coefficient is insignificant for account-specific weaknesses (p-value of 0.348) and positive and significant for company-level weaknesses (0.007 with a p-value of 0.044).
28
As our accruals quality measure spans 1996–2002, we track the auditor for each of the
firms in our sample across these years. We then create three new variables. Big N is the
proportion of years the company was audited by a Big N audit firm; this variable has an in-
sample mean of 86 percent. Large Auditor is the proportion of years the company was audited
by a large auditor (described above); this variable has an in-sample mean of 91 percent. We also
create a variable Auditor Change, which is the proportion of years the company changed its audit
firm (excluding changes due to mergers); this variable has an in-sample mean of nine percent. In
general, we expect firms audited by larger auditors to have higher accruals quality (i.e., we
expect a negative sign on auditor type). As DeFond and Subramanyam (1998) only consider the
two years around the auditor change, while we consider a seven-year span, we do not have a
predicted sign on auditor change.
We find that across both measures of auditor size (Big N and Large Auditor), the larger
auditors are associated with higher accruals quality, and Auditor Change is associated with lower
accruals quality. Including these additional controls does not affect our inferences regarding
internal control quality—material weakness disclosures continue to be associated with poorer
accruals quality (t-statistic = 2.60 and 2.66 with Big N and Large Auditor, respectively).
Audit Committee Quality Sensitivity Analysis
Krishnan (2005) documents that internal control deficiencies are negatively associated
with audit committee quality, including audit committee independence, in her sample of firms
that changed auditors from 1994 through 2000. Relatedly, Klein (2002) finds that audit
committee independence is associated with lower levels of abnormal accruals and suggests that
independent audit committees are able to constrain earnings management. Therefore, audit
committee independence could be a correlated omitted variable. To investigate this possibility,
29
we collect 2002 audit committee independence data from the Investor Research Responsibility
Center’s (IRRC) corporate governance dataset and re-estimate our regressions for the 1,133
observations with sufficient data. We find that MW remains strongly associated with poorer
accruals quality (t-statistic = 3.15), while the percentage of independent directors is associated
with better accruals quality (t-statistic = 1.80). This finding suggests that the relation between
internal control and accruals quality goes beyond the effect of corporate governance on accruals
quality documented in the prior literature.
VI. CONCLUSION
We examine the relation between accruals quality and internal control quality and find
that firms with weak internal control over financial reporting generally have lower accruals
quality. We measure accruals quality as the extent to which accruals are realized as cash flows,
following Dechow and Dichev (2002). We identify weak internal control firms as those that
disclosed a material weakness in internal control from August 2002 to November 2005 under
Sections 302 and 404 of Sarbanes-Oxley. The relation between weak internal controls and poor
accruals quality holds after controlling for known determinants of both accruals quality and
internal control deficiencies. Moreover, the results are robust to corrections for self-selection
bias using both the inverse Mills ratio approach and propensity score matching.
We examine four additional proxies of accruals quality: discretionary accruals, the
average absolute value of the Dechow and Dichev (2002) residuals, historical restatements, and
earnings persistence. Our results are consistent using each of these alternative proxies. The
results also seem to be consistent when measuring these variables concurrently in the year of
material weakness disclosure, rather than over a preceding time period.
30
Finally, we explore the severity of the material weaknesses (account-specific versus
company-level) and the reporting regime (Section 302 versus Section 404). We find that those
firms with company-level material weaknesses rather than more auditable, account-specific
problems drive the relation between weak internal controls and lower accruals quality. This
result is consistent for both Sections 302 and 404 disclosures, although we find that material
weakness disclosures made under Section 302 are more strongly associated with lower accruals
quality than those under Section 404.
Our study has several limitations. First, we rely on the disclosure of a material weakness
to proxy for the actual presence of an internal control problem. Therefore, to the extent that
there is a systematic bias in the choice to identify and disclose material weaknesses—beyond
those variables used as controls—our sample may not represent the true underlying population of
firms with internal control problems. Second, we assume that the material weaknesses have been
present for multiple years; our accruals quality measure is constructed from 1996–2002.
However, it is hard to pinpoint the exact timing of the weaknesses and this assumption may not
be valid. Third, since Sarbanes-Oxley has been in effect for a relatively short time, our ability to
infer causality between internal control problems and accruals quality is limited. Finally, we
must rely on a proxy for accruals quality. We use the model developed by Dechow and Dichev
(2002) as modified by McNichols (2002) and Francis et al. (2005). As with any measure, ours is
subject to certain limitations (e.g., McNichols 2002; Wysocki 2006) and might measure the
accruals quality construct with noise.
Our findings have implications for regulators, auditors, managers, and researchers. First,
our findings support the notion that the internal control environment is a fundamental element in
the production of high quality accruals, a link that has long been suggested (Kinney 2000) but
31
was largely untestable prior to the introduction of Sarbanes-Oxley Sections 302 and 404.
Second, our findings add to the debate on the benefits of Sarbanes-Oxley, suggesting that
company-level material weakness disclosures are, at least in part, appropriately identifying “poor
quality” firms—specifically, those with poor accruals quality. However, the results in this paper
show no such benefits from the disclosure of more auditable, account-specific weaknesses.
Finally, our findings support the notion that at least some portion of accruals quality is
incremental to the innate drivers of poor accruals quality, such as firm size or sales volatility, and
thus subject to improvement by managers.
32
References
Altamuro, J. and A. Beatty. 2006. Do internal control reforms improve earnings quality?
Working paper, Ohio State University.
Anderson, K. and T. Yohn. 2002. The effect of 10-K restatements on firm value, information
asymmetries, and investors’ reliance on earnings. Working paper, Georgetown and
University of Massachusetts.
Ashbaugh-Skaife, H., D. Collins, and W. Kinney. 2007. The discovery and reporting of internal
control deficiencies prior to SOX-mandated audits. Journal of Accounting and
Economics, forthcoming.
Ashbaugh-Skaife, H., D. Collins, W. Kinney, and R. LaFond. 2006. Internal control deficiencies,
remediation and accrual quality. Working paper, University of Wisconsin, University of
Iowa, University of Texas at Austin, and MIT.
Becker, C., M. DeFond, J. Jiambalvo and K.R. Subramanyam. 1998. The effect of audit quality
on earnings management. Contemporary Accounting Research 15: 1–24.
Bedard, J. 2006. Sarbanes Oxley internal control requirements and earnings quality. Working
paper, Laval University.
Beneish, D., B. Billings, and L. Hodder. 2006. Internal control weaknesses and information
uncertainty. Working paper, Indiana University.
Chan, K., B. Farrell, and P. Lee. 2005. Earnings management and return-earnings association of
firms reporting material internal control weaknesses under Section 404 of the Sarbanes-
Oxley Act. Working paper, Pace University.
Dechow, P., and I. Dichev. 2002. The quality of accruals and earnings. The Accounting Review
77: 35–59.
33
Dechow, P., and C. Schrand. 2004. Earnings quality. The Research Foundation of CFA Institute.
DeFond, M. and K.R. Subramanyam. 1998. Auditor changes and discretionary accruals.
Journal of Accounting and Economics 25: 35–67.
DeFranco, G., Y. Guan, and H. Lu. 2005. The wealth change and redistribution effects of
Sarbanes-Oxley internal control disclosures. Working paper, University of Toronto.
Doss, M., and G. Jonas. 2004. Section 404 reports on internal control: Impact on ratings will
depend on nature of material weaknesses reported. Moody’s Investors Service, Global
Credit Research. October.
Doyle, J., W. Ge, and S. McVay. 2007. Determinants of weaknesses in internal control over
financial reporting. Journal of Accounting and Economics, forthcoming.
Fama, E., and K. French. 1997. Industry costs of equity. Journal of Financial Economics 43:
153–193.
Francis, J., R. LaFond, P. Olsson, and K. Schipper. 2005. The market pricing of accruals quality.
Journal of Accounting and Economics 39: 295–327.
Francis, J., E. Maydew and H. Sparks. 1999. The role of Big 6 auditors in the credible reporting
of accruals. Auditing: A Journal of Practice and Theory 18: 17–34.
Ge, W., and S. McVay. 2005. The disclosure of material weaknesses in internal control after the
Sarbanes-Oxley Act. Accounting Horizons 19: 137–158.
Hammersley, J., L. Myers, and C. Shakespeare. 2007. Market reactions to the disclosure of
internal control weaknesses and to the characteristics of those weaknesses under Section
302 of the Sarbanes Oxley Act of 2002. Working paper, University of Georgia, University
of Illinois at Urbana-Champaign, and University of Michigan.
Heckman, J. 1979. Sample selection bias as a specification error. Econometrica 47: 153–161.
34
Hogan, C., and M. Wilkins. 2005. Internal control weaknesses and earnings management.
Working paper, Southern Methodist University and Texas A&M University.
Hogan, C., and M. Wilkins. 2006. Evidence on the audit risk model: Do auditors increase audit
effort in the presence of internal control weaknesses? Working paper, Southern Methodist
University and Texas A&M University.
Hribar, P., and D. Collins. 2002. Errors in estimating accruals: Implications for empirical
research. Journal of Accounting Research 40: 105–134.
Jones, J. 1991. Earnings management during import relief investigations. Journal of Accounting
Research 29: 193–228.
Kennedy, P. 1998. A guide to econometrics. Cambridge, MA: MIT Press.
Kinney, W. 2000. Research opportunities in internal control quality and quality assurance.
Auditing 19: 83–90.
Klein, A. 2002. Audit committee, board of director characteristics, and earnings management.
Journal of Accounting and Economics 33: 375–400.
Kothari, S. P., A. Leone, and C. Wasley. 2005. Performance matched discretionary accrual
measures. Journal of Accounting and Economics 39: 163–197.
Krishnan, J. 2005. Audit committee quality and internal control: An empirical analysis. The
Accounting Review 80: 649–675.
LaLonde, R. 1986. Evaluating the econometric evaluations of training programs with
experimental data. American Economic Review 76: 604–620.
Leuz, C., and R. Verrecchia. 2000. The economic consequences of increased disclosure. Journal
of Accounting Research 38: 91–124.
35
McNichols, M. 2002. Discussion of the quality of accruals and earnings: The role of accrual
estimation errors. The Accounting Review 77: 61–69.
Ogneva, M., K. Raghunandan, and K.R. Subramanyam. 2006. Internal control weakness and cost
of equity: Evidence from SOX Section 404 disclosures. Working paper, University of
Southern California and Florida International University.
Public Company Accounting Oversight Board (PCAOB). 2004. Auditing Standard No. 2 – An
audit of internal control over financial reporting performed in conjunction with an audit of
financial statements.
Rangan, S. 1998. Earnings management and the performance of seasoned equity offerings.
Journal of Financial Economics 50: 101–122.
Roychowdhury, S. 2006. Earnings management through real activities manipulation. Journal of
Accounting and Economics 42: 335–370.
Schipper, K., and L. Vincent. 2003. Earnings quality. Accounting Horizons Supplement: 97–110.
SEC. 2003. Management’s Reports on Internal Control Over Financial Reporting and
Certification of Disclosure in Exchange Act Periodic Reports, Final Rule 33-8238 (June
5), Washington, D.C.
SEC. 2004. Management’s Reports on Internal Control Over Financial Reporting and
Certification of Disclosure in Exchange Act Periodic Reports – Frequently Asked
Questions, (October 6), Washington, D.C.
Teoh, S., I. Welch, and T. Wong. 1998. Earnings management and the underperformance of
seasoned equity offerings. Journal of Financial Economics 50: 63–99.
36
Wright, A., and S. Wright. 1996. The relationship between assessments of internal control
strength and error occurrence, impact and cause. Accounting and Business Research 27:
58–71.
Wysocki, P. 2006. Assessing earnings and accruals quality: U.S. and international evidence.
Working paper, MIT.
37
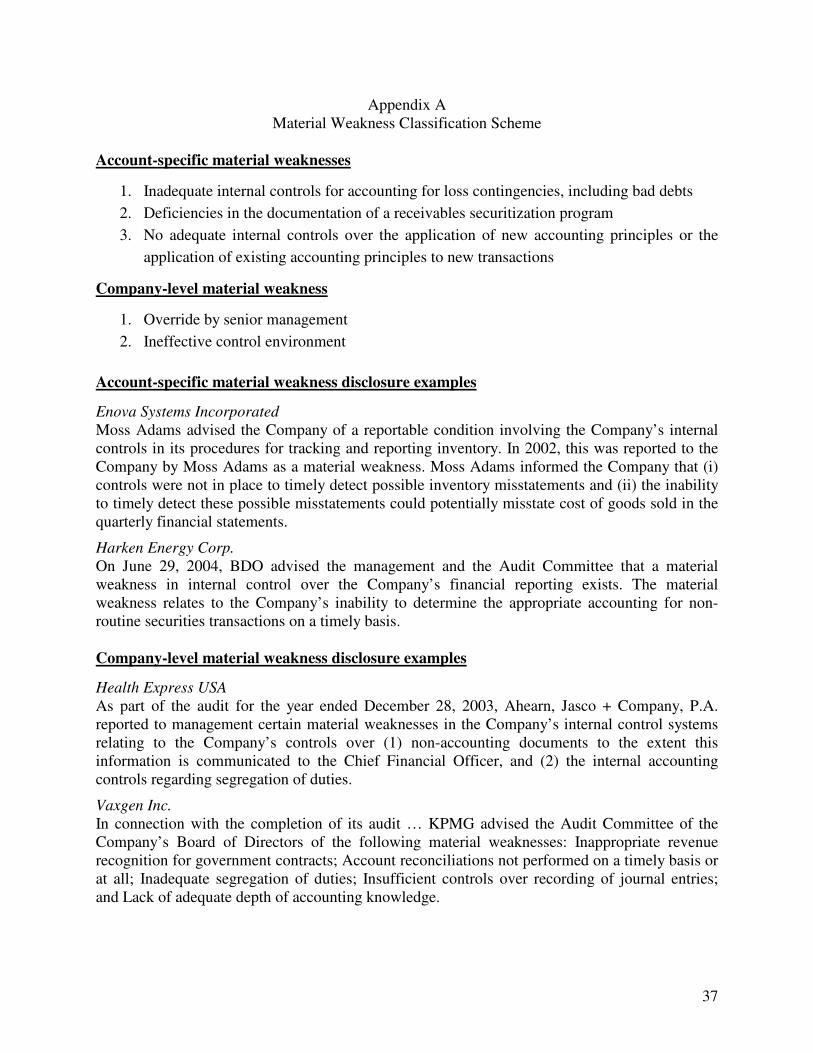
Appendix A Material Weakness Classification Scheme
Account-specific material weaknesses
1. Inadequate internal controls for accounting for loss contingencies, including bad debts 2. Deficiencies in the documentation of a receivables securitization program 3. No adequate internal controls over the application of new accounting principles or the
application of existing accounting principles to new transactions
Company-level material weakness
1. Override by senior management 2. Ineffective control environment
Account-specific material weakness disclosure examples
Enova Systems Incorporated Moss Adams advised the Company of a reportable condition involving the Company’s internal controls in its procedures for tracking and reporting inventory. In 2002, this was reported to the Company by Moss Adams as a material weakness. Moss Adams informed the Company that (i) controls were not in place to timely detect possible inventory misstatements and (ii) the inability to timely detect these possible misstatements could potentially misstate cost of goods sold in the quarterly financial statements.
Harken Energy Corp. On June 29, 2004, BDO advised the management and the Audit Committee that a material weakness in internal control over the Company’s financial reporting exists. The material weakness relates to the Company’s inability to determine the appropriate accounting for non-routine securities transactions on a timely basis. Company-level material weakness disclosure examples
Health Express USA As part of the audit for the year ended December 28, 2003, Ahearn, Jasco + Company, P.A. reported to management certain material weaknesses in the Company’s internal control systems relating to the Company’s controls over (1) non-accounting documents to the extent this information is communicated to the Chief Financial Officer, and (2) the internal accounting controls regarding segregation of duties.
Vaxgen Inc. In connection with the completion of its audit … KPMG advised the Audit Committee of the Company’s Board of Directors of the following material weaknesses: Inappropriate revenue recognition for government contracts; Account reconciliations not performed on a timely basis or at all; Inadequate segregation of duties; Insufficient controls over recording of journal entries; and Lack of adequate depth of accounting knowledge.
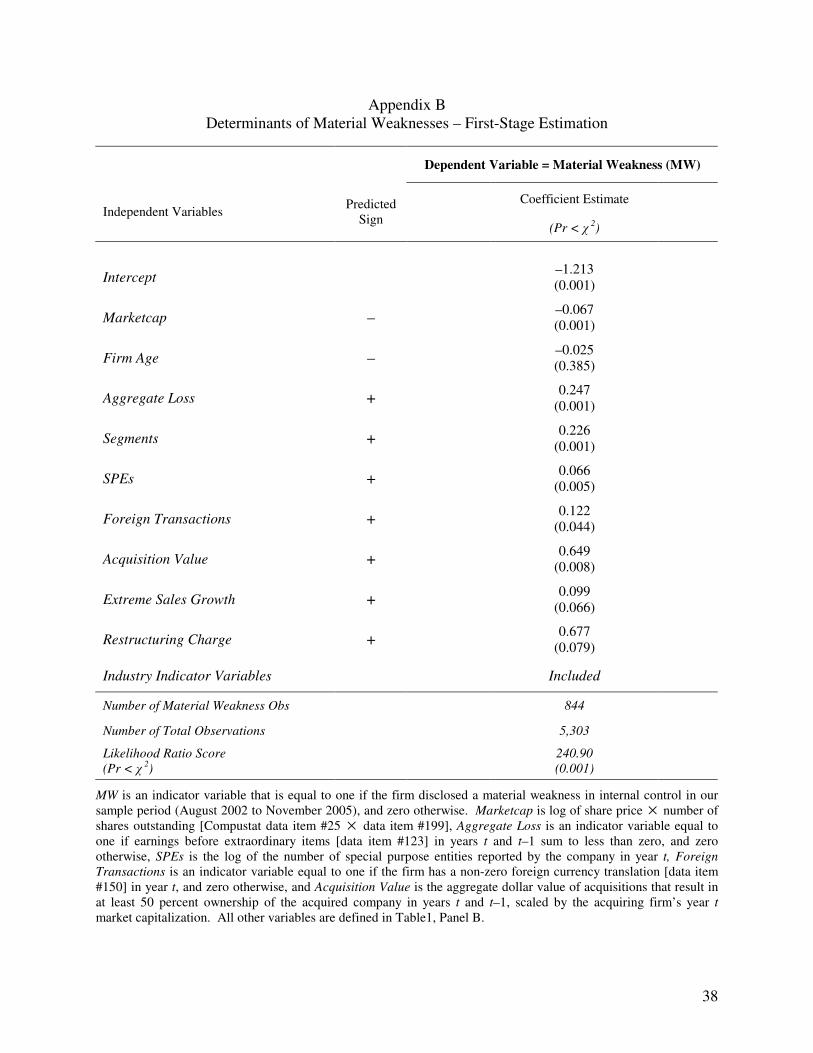
38
Appendix B Determinants of Material Weaknesses – First-Stage Estimation
Dependent Variable = Material Weakness (MW)
Coefficient Estimate Independent Variables Predicted
Sign (Pr < � 2)
Intercept
–1.213 (0.001)
Marketcap – –0.067 (0.001)
Firm Age – –0.025 (0.385)
Aggregate Loss + 0.247 (0.001)
Segments + 0.226 (0.001)
SPEs + 0.066 (0.005)
Foreign Transactions + 0.122 (0.044)
Acquisition Value + 0.649 (0.008)
Extreme Sales Growth + 0.099 (0.066)
Restructuring Charge + 0.677 (0.079)
Industry Indicator Variables Included
Number of Material Weakness Obs 844
Number of Total Observations 5,303
Likelihood Ratio Score (Pr < � 2)
240.90
(0.001)
MW is an indicator variable that is equal to one if the firm disclosed a material weakness in internal control in our sample period (August 2002 to November 2005), and zero otherwise. Marketcap is log of share price × number of shares outstanding [Compustat data item #25 × data item #199], Aggregate Loss is an indicator variable equal to one if earnings before extraordinary items [data item #123] in years t and t–1 sum to less than zero, and zero otherwise, SPEs is the log of the number of special purpose entities reported by the company in year t, Foreign Transactions is an indicator variable equal to one if the firm has a non-zero foreign currency translation [data item #150] in year t, and zero otherwise, and Acquisition Value is the aggregate dollar value of acquisitions that result in at least 50 percent ownership of the acquired company in years t and t–1, scaled by the acquiring firm’s year t market capitalization. All other variables are defined in Table1, Panel B.
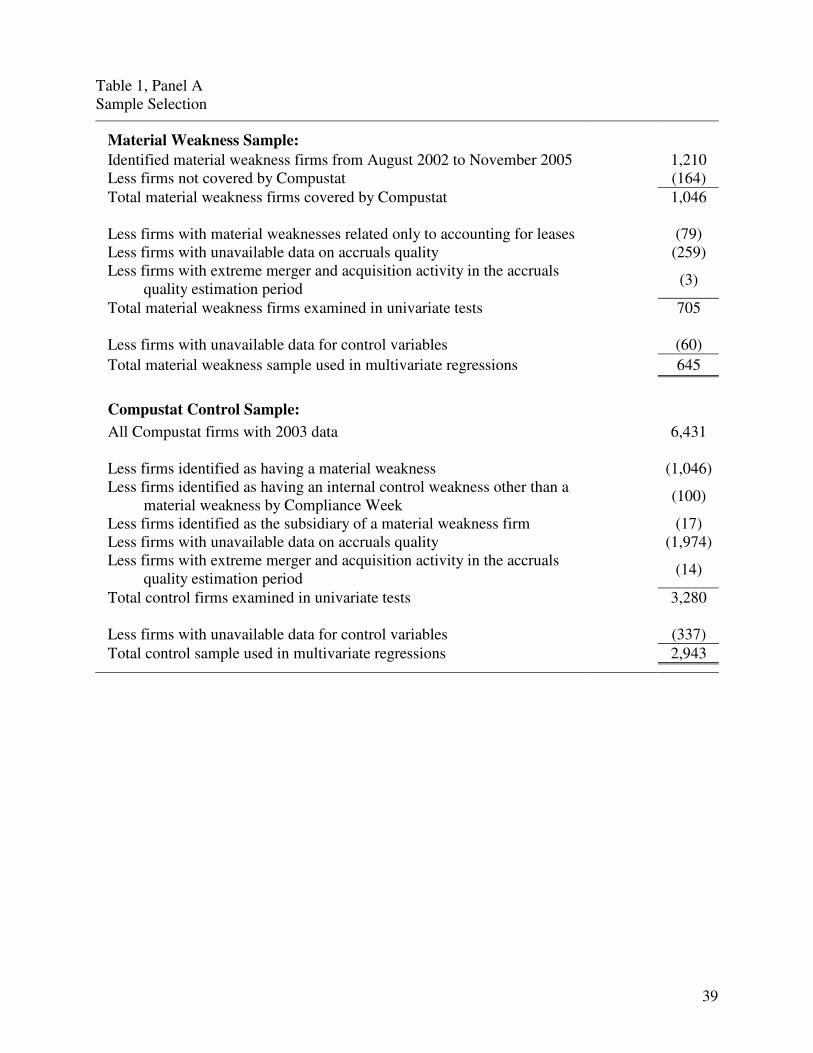
39
Table 1, Panel A Sample Selection
Material Weakness Sample: Identified material weakness firms from August 2002 to November 2005 1,210 Less firms not covered by Compustat (164) Total material weakness firms covered by Compustat 1,046 Less firms with material weaknesses related only to accounting for leases (79) Less firms with unavailable data on accruals quality (259) Less firms with extreme merger and acquisition activity in the accruals
quality estimation period (3)
Total material weakness firms examined in univariate tests 705 Less firms with unavailable data for control variables (60) Total material weakness sample used in multivariate regressions 645 Compustat Control Sample: All Compustat firms with 2003 data 6,431 Less firms identified as having a material weakness (1,046) Less firms identified as having an internal control weakness other than a
material weakness by Compliance Week (100)
Less firms identified as the subsidiary of a material weakness firm (17) Less firms with unavailable data on accruals quality (1,974) Less firms with extreme merger and acquisition activity in the accruals
quality estimation period (14)
Total control firms examined in univariate tests 3,280 Less firms with unavailable data for control variables (337) Total control sample used in multivariate regressions 2,943
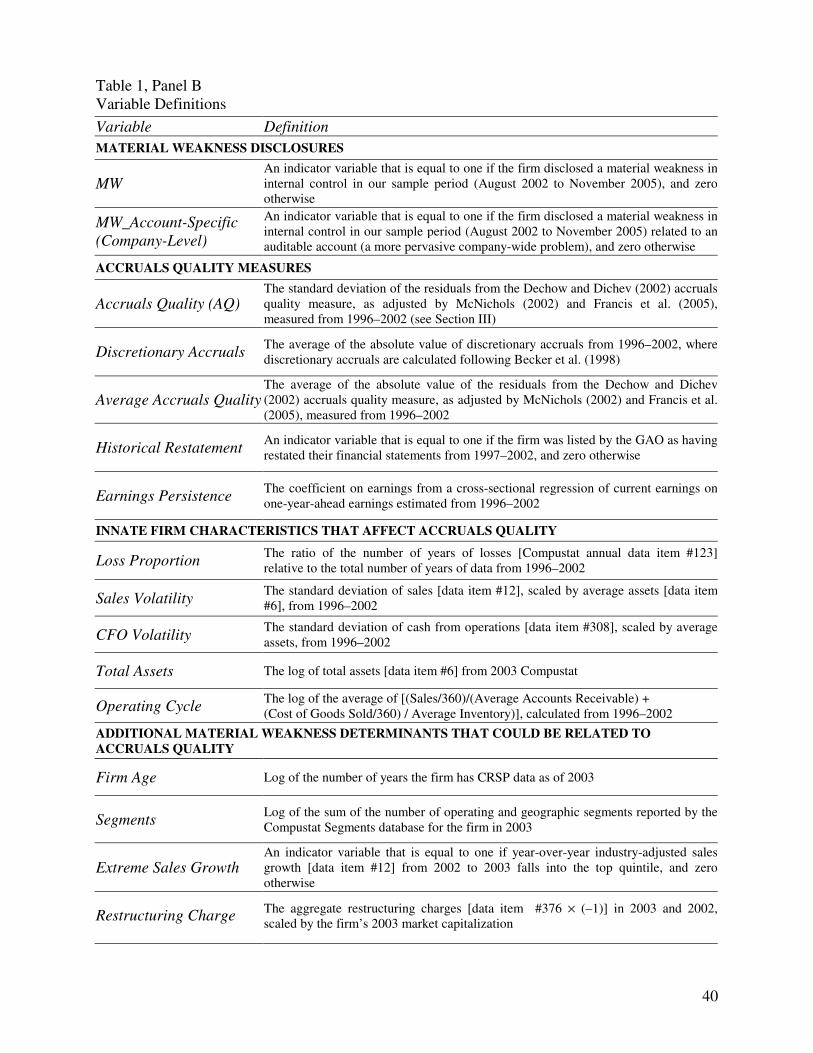
40
Table 1, Panel B Variable Definitions
Variable Definition MATERIAL WEAKNESS DISCLOSURES
MW An indicator variable that is equal to one if the firm disclosed a material weakness in internal control in our sample period (August 2002 to November 2005), and zero otherwise
MW_Account-Specific (Company-Level)
An indicator variable that is equal to one if the firm disclosed a material weakness in internal control in our sample period (August 2002 to November 2005) related to an auditable account (a more pervasive company-wide problem), and zero otherwise
ACCRUALS QUALITY MEASURES
Accruals Quality (AQ) The standard deviation of the residuals from the Dechow and Dichev (2002) accruals quality measure, as adjusted by McNichols (2002) and Francis et al. (2005), measured from 1996–2002 (see Section III)
Discretionary Accruals The average of the absolute value of discretionary accruals from 1996–2002, where discretionary accruals are calculated following Becker et al. (1998)
Average Accruals Quality The average of the absolute value of the residuals from the Dechow and Dichev (2002) accruals quality measure, as adjusted by McNichols (2002) and Francis et al. (2005), measured from 1996–2002
Historical Restatement An indicator variable that is equal to one if the firm was listed by the GAO as having restated their financial statements from 1997–2002, and zero otherwise
Earnings Persistence The coefficient on earnings from a cross-sectional regression of current earnings on one-year-ahead earnings estimated from 1996–2002
INNATE FIRM CHARACTERISTICS THAT AFFECT ACCRUALS QUALITY
Loss Proportion The ratio of the number of years of losses [Compustat annual data item #123] relative to the total number of years of data from 1996–2002
Sales Volatility The standard deviation of sales [data item #12], scaled by average assets [data item #6], from 1996–2002
CFO Volatility The standard deviation of cash from operations [data item #308], scaled by average assets, from 1996–2002
Total Assets The log of total assets [data item #6] from 2003 Compustat
Operating Cycle The log of the average of [(Sales/360)/(Average Accounts Receivable) + (Cost of Goods Sold/360) / Average Inventory)], calculated from 1996–2002
ADDITIONAL MATERIAL WEAKNESS DETERMINANTS THAT COULD BE RELATED TO ACCRUALS QUALITY
Firm Age Log of the number of years the firm has CRSP data as of 2003
Segments Log of the sum of the number of operating and geographic segments reported by the Compustat Segments database for the firm in 2003
Extreme Sales Growth An indicator variable that is equal to one if year-over-year industry-adjusted sales growth [data item #12] from 2002 to 2003 falls into the top quintile, and zero otherwise
Restructuring Charge The aggregate restructuring charges [data item #376 × (–1)] in 2003 and 2002,scaled by the firm’s 2003 market capitalization
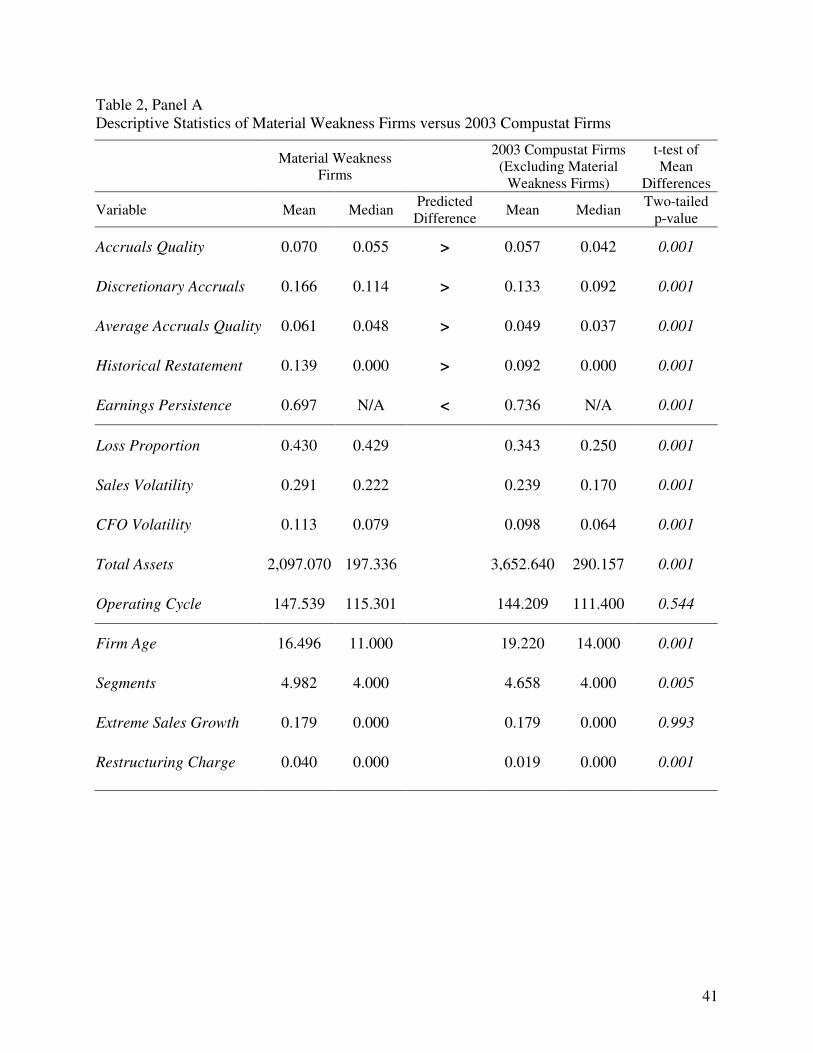
41
Table 2, Panel A Descriptive Statistics of Material Weakness Firms versus 2003 Compustat Firms
Material Weakness Firms
2003 Compustat Firms (Excluding Material
Weakness Firms)
t-test of Mean
Differences
Variable Mean Median Predicted Difference Mean Median Two-tailed
p-value
Accruals Quality 0.070 0.055 > 0.057 0.042 0.001
Discretionary Accruals 0.166 0.114 > 0.133 0.092 0.001
Average Accruals Quality 0.061 0.048 > 0.049 0.037 0.001
Historical Restatement 0.139 0.000 > 0.092 0.000 0.001
Earnings Persistence 0.697 N/A < 0.736 N/A 0.001
Loss Proportion 0.430 0.429 0.343 0.250 0.001
Sales Volatility 0.291 0.222 0.239 0.170 0.001
CFO Volatility 0.113 0.079 0.098 0.064 0.001
Total Assets 2,097.070 197.336 3,652.640 290.157 0.001
Operating Cycle 147.539 115.301 144.209 111.400 0.544
Firm Age 16.496 11.000 19.220 14.000 0.001
Segments 4.982 4.000 4.658 4.000 0.005
Extreme Sales Growth 0.179 0.000 0.179 0.000 0.993
Restructuring Charge 0.040 0.000 0.019 0.000 0.001
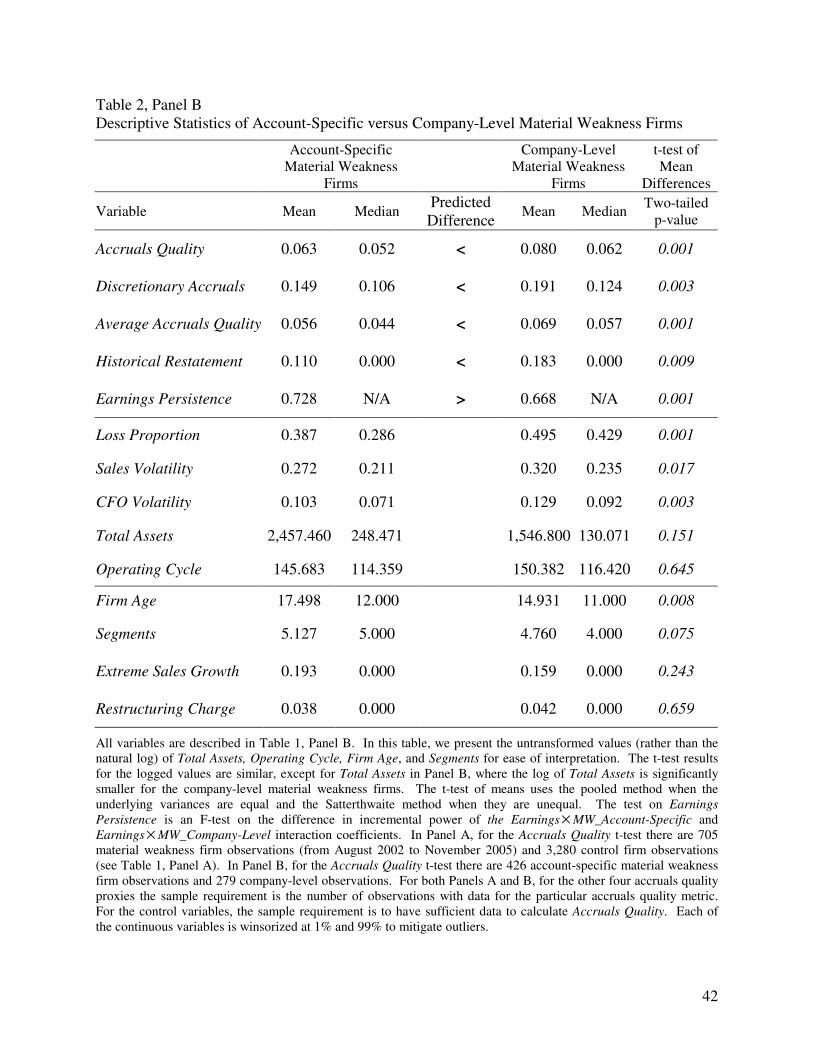
42
Table 2, Panel B Descriptive Statistics of Account-Specific versus Company-Level Material Weakness Firms
Account-Specific
Material Weakness Firms
Company-Level
Material Weakness Firms
t-test of Mean
Differences
Variable Mean Median Predicted Difference
Mean Median Two-tailed p-value
Accruals Quality 0.063 0.052 < 0.080 0.062 0.001
Discretionary Accruals 0.149 0.106 < 0.191 0.124 0.003
Average Accruals Quality 0.056 0.044 < 0.069 0.057 0.001
Historical Restatement 0.110 0.000 < 0.183 0.000 0.009
Earnings Persistence 0.728 N/A > 0.668 N/A 0.001
Loss Proportion 0.387 0.286 0.495 0.429 0.001
Sales Volatility 0.272 0.211 0.320 0.235 0.017
CFO Volatility 0.103 0.071 0.129 0.092 0.003
Total Assets 2,457.460 248.471 1,546.800 130.071 0.151
Operating Cycle 145.683 114.359 150.382 116.420 0.645
Firm Age 17.498 12.000 14.931 11.000 0.008
Segments 5.127 5.000 4.760 4.000 0.075
Extreme Sales Growth 0.193 0.000 0.159 0.000 0.243
Restructuring Charge 0.038 0.000 0.042 0.000 0.659
All variables are described in Table 1, Panel B. In this table, we present the untransformed values (rather than the natural log) of Total Assets, Operating Cycle, Firm Age, and Segments for ease of interpretation. The t-test results for the logged values are similar, except for Total Assets in Panel B, where the log of Total Assets is significantly smaller for the company-level material weakness firms. The t-test of means uses the pooled method when the underlying variances are equal and the Satterthwaite method when they are unequal. The test on Earnings Persistence is an F-test on the difference in incremental power of the Earnings × MW_Account-Specific and Earnings × MW_Company-Level interaction coefficients. In Panel A, for the Accruals Quality t-test there are 705 material weakness firm observations (from August 2002 to November 2005) and 3,280 control firm observations (see Table 1, Panel A). In Panel B, for the Accruals Quality t-test there are 426 account-specific material weakness firm observations and 279 company-level observations. For both Panels A and B, for the other four accruals quality proxies the sample requirement is the number of observations with data for the particular accruals quality metric. For the control variables, the sample requirement is to have sufficient data to calculate Accruals Quality. Each of the continuous variables is winsorized at 1% and 99% to mitigate outliers.
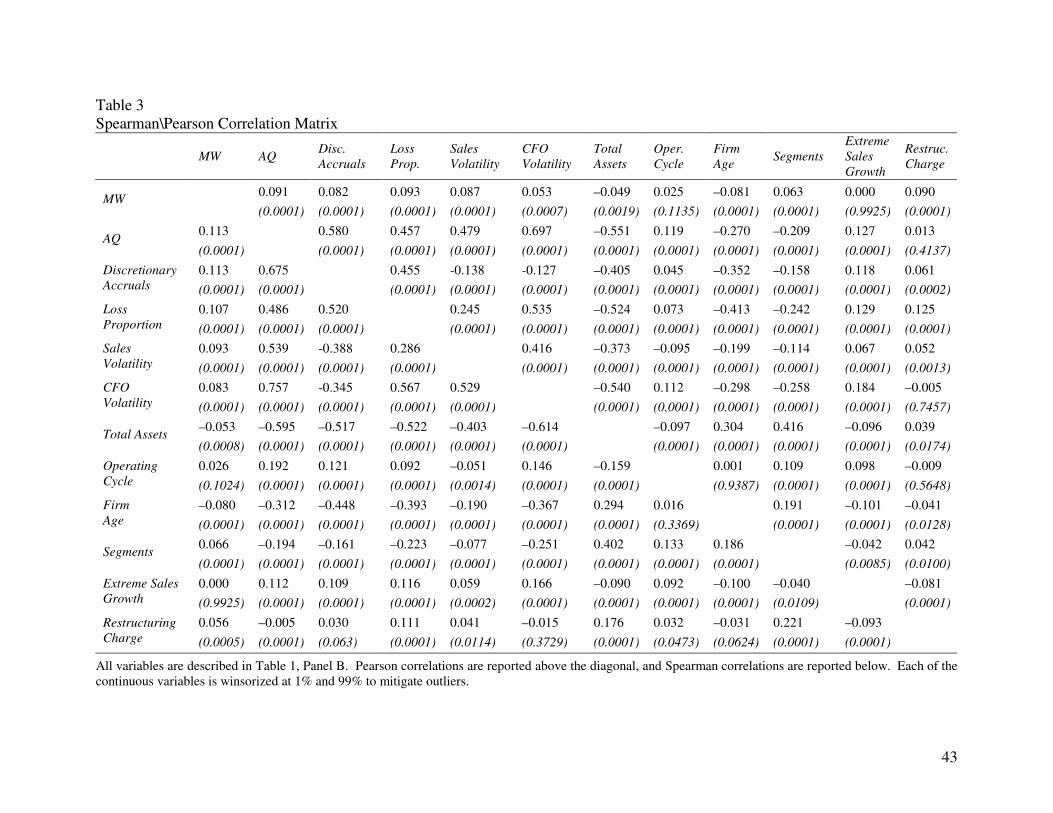
43
Table 3 Spearman\Pearson Correlation Matrix
MW AQ Disc.
Accruals Loss Prop.
Sales Volatility
CFO Volatility
Total Assets
Oper. Cycle
Firm Age Segments
Extreme Sales Growth
Restruc. Charge
0.091 0.082 0.093 0.087 0.053 –0.049 0.025 –0.081 0.063 0.000 0.090 MW (0.0001) (0.0001) (0.0001) (0.0001) (0.0007) (0.0019) (0.1135) (0.0001) (0.0001) (0.9925) (0.0001) 0.113 0.580 0.457 0.479 0.697 –0.551 0.119 –0.270 –0.209 0.127 0.013 AQ
(0.0001) (0.0001) (0.0001) (0.0001) (0.0001) (0.0001) (0.0001) (0.0001) (0.0001) (0.0001) (0.4137) 0.113 0.675 0.455 -0.138 -0.127 –0.405 0.045 –0.352 –0.158 0.118 0.061 Discretionary
Accruals (0.0001) (0.0001) (0.0001) (0.0001) (0.0001) (0.0001) (0.0001) (0.0001) (0.0001) (0.0001) (0.0002) 0.107 0.486 0.520 0.245 0.535 –0.524 0.073 –0.413 –0.242 0.129 0.125 Loss
Proportion (0.0001) (0.0001) (0.0001) (0.0001) (0.0001) (0.0001) (0.0001) (0.0001) (0.0001) (0.0001) (0.0001) 0.093 0.539 -0.388 0.286 0.416 –0.373 –0.095 –0.199 –0.114 0.067 0.052 Sales
Volatility (0.0001) (0.0001) (0.0001) (0.0001) (0.0001) (0.0001) (0.0001) (0.0001) (0.0001) (0.0001) (0.0013) 0.083 0.757 -0.345 0.567 0.529 –0.540 0.112 –0.298 –0.258 0.184 –0.005 CFO
Volatility (0.0001) (0.0001) (0.0001) (0.0001) (0.0001) (0.0001) (0.0001) (0.0001) (0.0001) (0.0001) (0.7457) –0.053 –0.595 –0.517 –0.522 –0.403 –0.614 –0.097 0.304 0.416 –0.096 0.039 Total Assets
(0.0008) (0.0001) (0.0001) (0.0001) (0.0001) (0.0001) (0.0001) (0.0001) (0.0001) (0.0001) (0.0174) 0.026 0.192 0.121 0.092 –0.051 0.146 –0.159 0.001 0.109 0.098 –0.009 Operating
Cycle (0.1024) (0.0001) (0.0001) (0.0001) (0.0014) (0.0001) (0.0001) (0.9387) (0.0001) (0.0001) (0.5648) –0.080 –0.312 –0.448 –0.393 –0.190 –0.367 0.294 0.016 0.191 –0.101 –0.041 Firm
Age (0.0001) (0.0001) (0.0001) (0.0001) (0.0001) (0.0001) (0.0001) (0.3369) (0.0001) (0.0001) (0.0128) 0.066 –0.194 –0.161 –0.223 –0.077 –0.251 0.402 0.133 0.186 –0.042 0.042 Segments
(0.0001) (0.0001) (0.0001) (0.0001) (0.0001) (0.0001) (0.0001) (0.0001) (0.0001) (0.0085) (0.0100) 0.000 0.112 0.109 0.116 0.059 0.166 –0.090 0.092 –0.100 –0.040 –0.081 Extreme Sales
Growth (0.9925) (0.0001) (0.0001) (0.0001) (0.0002) (0.0001) (0.0001) (0.0001) (0.0001) (0.0109) (0.0001) 0.056 –0.005 0.030 0.111 0.041 –0.015 0.176 0.032 –0.031 0.221 –0.093 Restructuring
Charge (0.0005) (0.0001) (0.063) (0.0001) (0.0114) (0.3729) (0.0001) (0.0473) (0.0624) (0.0001) (0.0001)
All variables are described in Table 1, Panel B. Pearson correlations are reported above the diagonal, and Spearman correlations are reported below. Each of the continuous variables is winsorized at 1% and 99% to mitigate outliers.
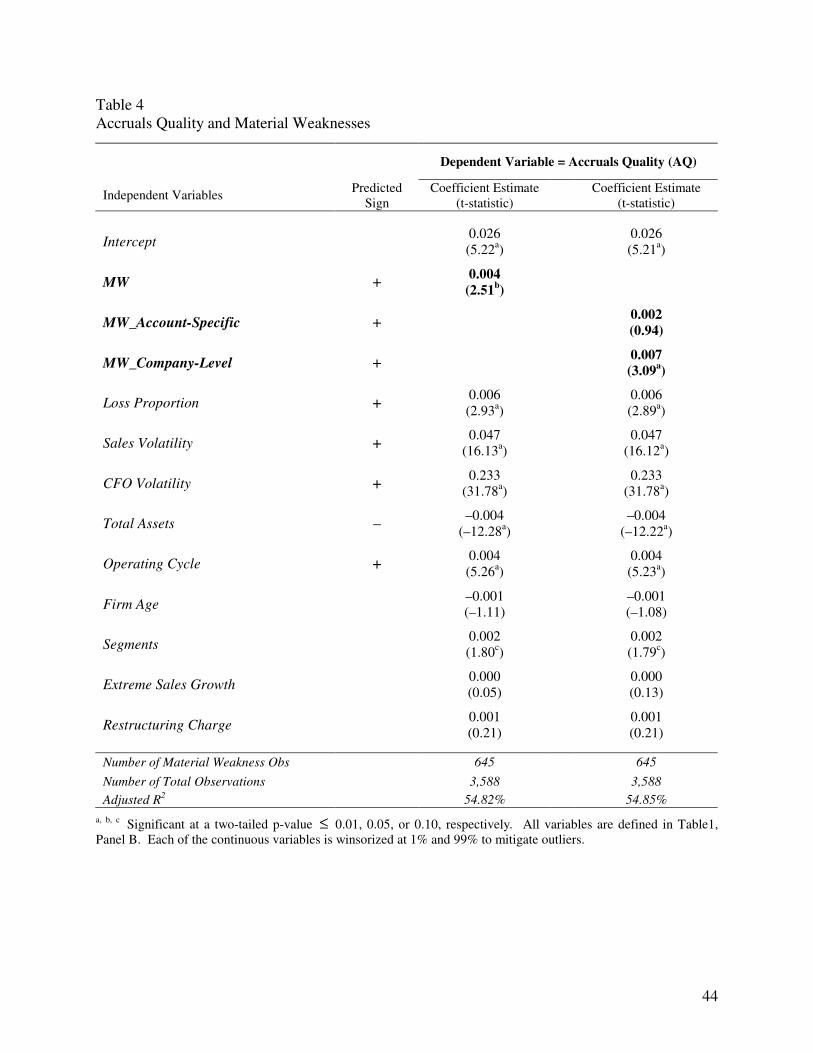
44
Table 4 Accruals Quality and Material Weaknesses
Dependent Variable = Accruals Quality (AQ)
Coefficient Estimate Coefficient Estimate Independent Variables Predicted Sign (t-statistic) (t-statistic)
Intercept 0.026
(5.22a) 0.026 (5.21a)
MW + 0.004 (2.51b)
MW_Account-Specific + 0.002 (0.94)
MW_Company-Level + 0.007 (3.09a)
Loss Proportion + 0.006 (2.93a) 0.006
(2.89a)
Sales Volatility + 0.047 (16.13a) 0.047
(16.12a)
CFO Volatility + 0.233 (31.78a) 0.233
(31.78a)
Total Assets – –0.004 (–12.28a) –0.004
(–12.22a)
Operating Cycle + 0.004 (5.26a) 0.004
(5.23a)
Firm Age –0.001 (–1.11) –0.001
(–1.08)
Segments 0.002 (1.80c) 0.002
(1.79c)
Extreme Sales Growth 0.000 (0.05) 0.000
(0.13)
Restructuring Charge 0.001 (0.21) 0.001
(0.21)
Number of Material Weakness Obs 645 645 Number of Total Observations 3,588 3,588 Adjusted R2 54.82% 54.85%
a, b, c Significant at a two-tailed p-value ≤ 0.01, 0.05, or 0.10, respectively. All variables are defined in Table1, Panel B. Each of the continuous variables is winsorized at 1% and 99% to mitigate outliers.
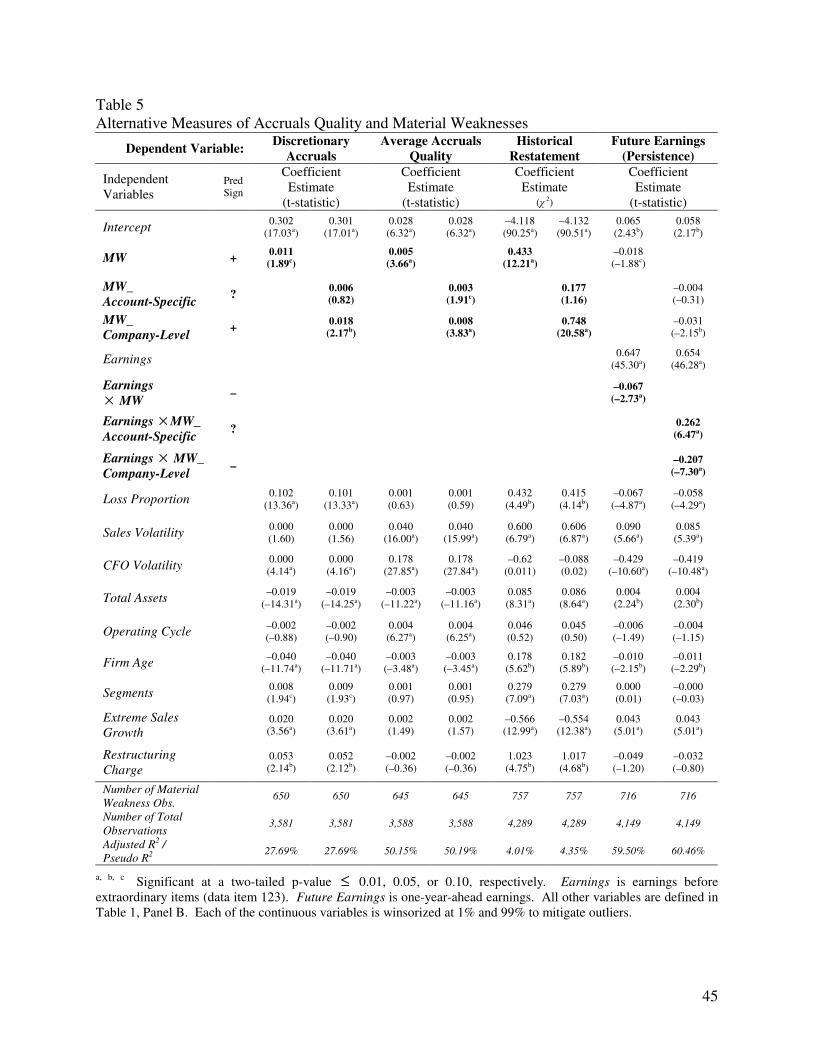
45
Table 5 Alternative Measures of Accruals Quality and Material Weaknesses
Dependent Variable: Discretionary Accruals
Average Accruals Quality
Historical Restatement
Future Earnings (Persistence)
Coefficient Estimate
Coefficient Estimate
Coefficient Estimate
Coefficient Estimate
Independent Variables
PredSign
(t-statistic) (t-statistic) (� 2) (t-statistic)
Intercept 0.302 (17.03a)
0.301 (17.01a)
0.028 (6.32a)
0.028 (6.32a)
–4.118 (90.25a)
–4.132 (90.51a)
0.065 (2.43b)
0.058 (2.17b)
MW + 0.011 (1.89c) 0.005
(3.66a) 0.433 (12.21a) –0.018
(–1.88c)
MW_ Account-Specific ? 0.006
(0.82) 0.003 (1.91c) 0.177
(1.16) –0.004 (–0.31)
MW_ Company-Level + 0.018
(2.17b) 0.008 (3.83a) 0.748
(20.58a) –0.031 (–2.15b)
Earnings 0.647 (45.30a)
0.654 (46.28a)
Earnings × MW – –0.067
(–2.73a)
Earnings × MW_ Account-Specific ? 0.262
(6.47a)
Earnings × MW_ Company-Level – –0.207
(–7.30a)
Loss Proportion 0.102 (13.36a)
0.101 (13.33a)
0.001 (0.63)
0.001 (0.59)
0.432 (4.49b)
0.415 (4.14b)
–0.067 (–4.87a)
–0.058 (–4.29a)
Sales Volatility 0.000 (1.60)
0.000 (1.56)
0.040 (16.00a)
0.040 (15.99a)
0.600 (6.79a)
0.606 (6.87a)
0.090 (5.66a)
0.085 (5.39a)
CFO Volatility 0.000 (4.14a)
0.000 (4.16a)
0.178 (27.85a)
0.178 (27.84a)
–0.62 (0.011)
–0.088 (0.02)
–0.429 (–10.60a)
–0.419 (–10.48a)
Total Assets –0.019 (–14.31a)
–0.019 (–14.25a)
–0.003 (–11.22a)
–0.003 (–11.16a)
0.085 (8.31a)
0.086 (8.64a)
0.004 (2.24b)
0.004 (2.30b)
Operating Cycle –0.002 (–0.88)
–0.002 (–0.90)
0.004 (6.27a)
0.004 (6.25a)
0.046 (0.52)
0.045 (0.50)
–0.006 (–1.49)
–0.004 (–1.15)
Firm Age –0.040 (–11.74a)
–0.040 (–11.71a)
–0.003 (–3.48a)
–0.003 (–3.45a)
0.178 (5.62b)
0.182 (5.89b)
–0.010 (–2.15b)
–0.011 (–2.29b)
Segments 0.008 (1.94c)
0.009 (1.93c)
0.001 (0.97)
0.001 (0.95)
0.279 (7.09a)
0.279 (7.03a)
0.000 (0.01)
–0.000 (–0.03)
Extreme Sales Growth 0.020
(3.56a) 0.020 (3.61a)
0.002 (1.49)
0.002 (1.57)
–0.566 (12.99a)
–0.554 (12.38a)
0.043 (5.01a)
0.043 (5.01a)
Restructuring Charge 0.053
(2.14b) 0.052 (2.12b)
–0.002 (–0.36)
–0.002 (–0.36)
1.023 (4.75b)
1.017 (4.68b)
–0.049 (–1.20)
–0.032 (–0.80)
Number of Material Weakness Obs. 650 650 645 645 757 757 716 716
Number of Total Observations 3,581 3,581 3,588 3,588 4,289 4,289 4,149 4,149
Adjusted R2 / Pseudo R2 27.69% 27.69% 50.15% 50.19% 4.01% 4.35% 59.50% 60.46%
a, b, c Significant at a two-tailed p-value ≤ 0.01, 0.05, or 0.10, respectively. Earnings is earnings before extraordinary items (data item 123). Future Earnings is one-year-ahead earnings. All other variables are defined in Table 1, Panel B. Each of the continuous variables is winsorized at 1% and 99% to mitigate outliers.
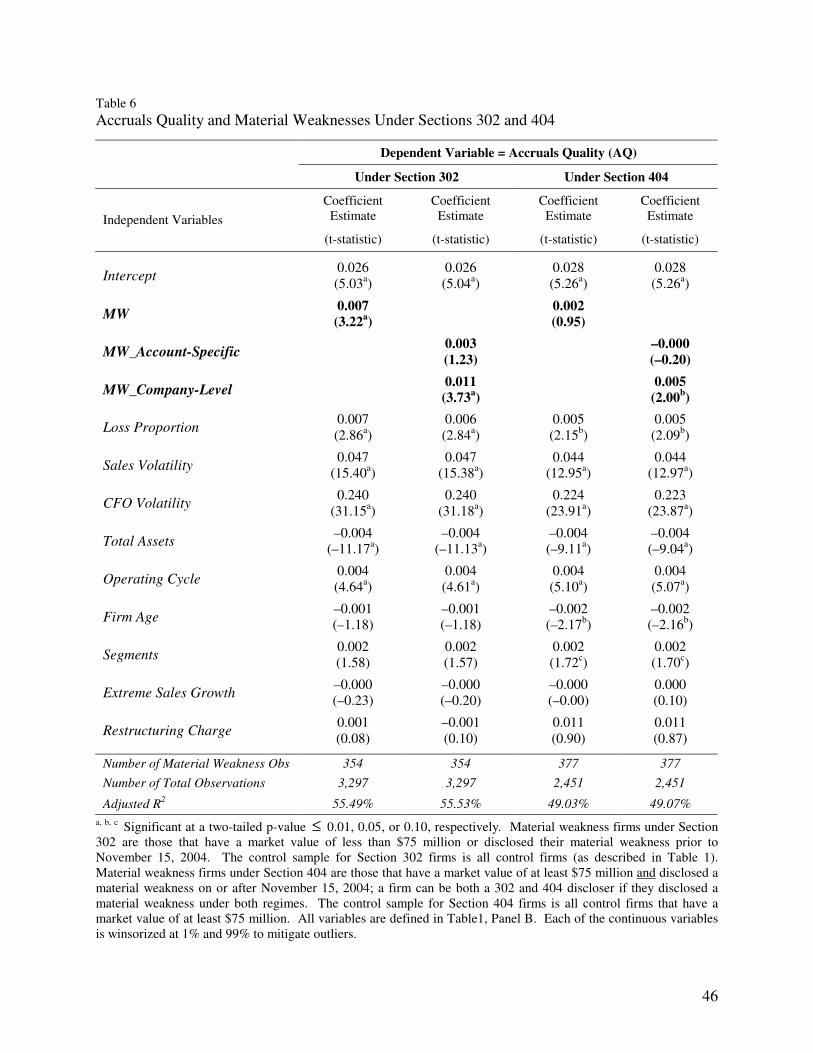
46
Table 6 Accruals Quality and Material Weaknesses Under Sections 302 and 404
Dependent Variable = Accruals Quality (AQ)
Under Section 302 Under Section 404
Coefficient Estimate
Coefficient Estimate
Coefficient Estimate
Coefficient Estimate Independent Variables
(t-statistic) (t-statistic) (t-statistic) (t-statistic)
Intercept 0.026 (5.03a)
0.026 (5.04a)
0.028 (5.26a)
0.028 (5.26a)
MW 0.007 (3.22a) 0.002
(0.95)
MW_Account-Specific 0.003 (1.23) –0.000
(–0.20)
MW_Company-Level 0.011 (3.73a) 0.005
(2.00b)
Loss Proportion 0.007 (2.86a)
0.006 (2.84a)
0.005 (2.15b)
0.005 (2.09b)
Sales Volatility 0.047 (15.40a)
0.047 (15.38a)
0.044 (12.95a)
0.044 (12.97a)
CFO Volatility 0.240 (31.15a)
0.240 (31.18a)
0.224 (23.91a)
0.223 (23.87a)
Total Assets –0.004 (–11.17a)
–0.004 (–11.13a)
–0.004 (–9.11a)
–0.004 (–9.04a)
Operating Cycle 0.004 (4.64a)
0.004 (4.61a)
0.004 (5.10a)
0.004 (5.07a)
Firm Age –0.001 (–1.18)
–0.001 (–1.18)
–0.002 (–2.17b)
–0.002 (–2.16b)
Segments 0.002 (1.58)
0.002 (1.57)
0.002 (1.72c)
0.002 (1.70c)
Extreme Sales Growth –0.000 (–0.23)
–0.000 (–0.20)
–0.000 (–0.00)
0.000 (0.10)
Restructuring Charge 0.001 (0.08)
–0.001 (0.10)
0.011 (0.90)
0.011 (0.87)
Number of Material Weakness Obs 354 354 377 377 Number of Total Observations 3,297 3,297 2,451 2,451
Adjusted R2 55.49% 55.53% 49.03% 49.07%
a, b, c Significant at a two-tailed p-value ≤ 0.01, 0.05, or 0.10, respectively. Material weakness firms under Section 302 are those that have a market value of less than $75 million or disclosed their material weakness prior to November 15, 2004. The control sample for Section 302 firms is all control firms (as described in Table 1). Material weakness firms under Section 404 are those that have a market value of at least $75 million and disclosed a material weakness on or after November 15, 2004; a firm can be both a 302 and 404 discloser if they disclosed a material weakness under both regimes. The control sample for Section 404 firms is all control firms that have a market value of at least $75 million. All variables are defined in Table1, Panel B. Each of the continuous variables is winsorized at 1% and 99% to mitigate outliers.
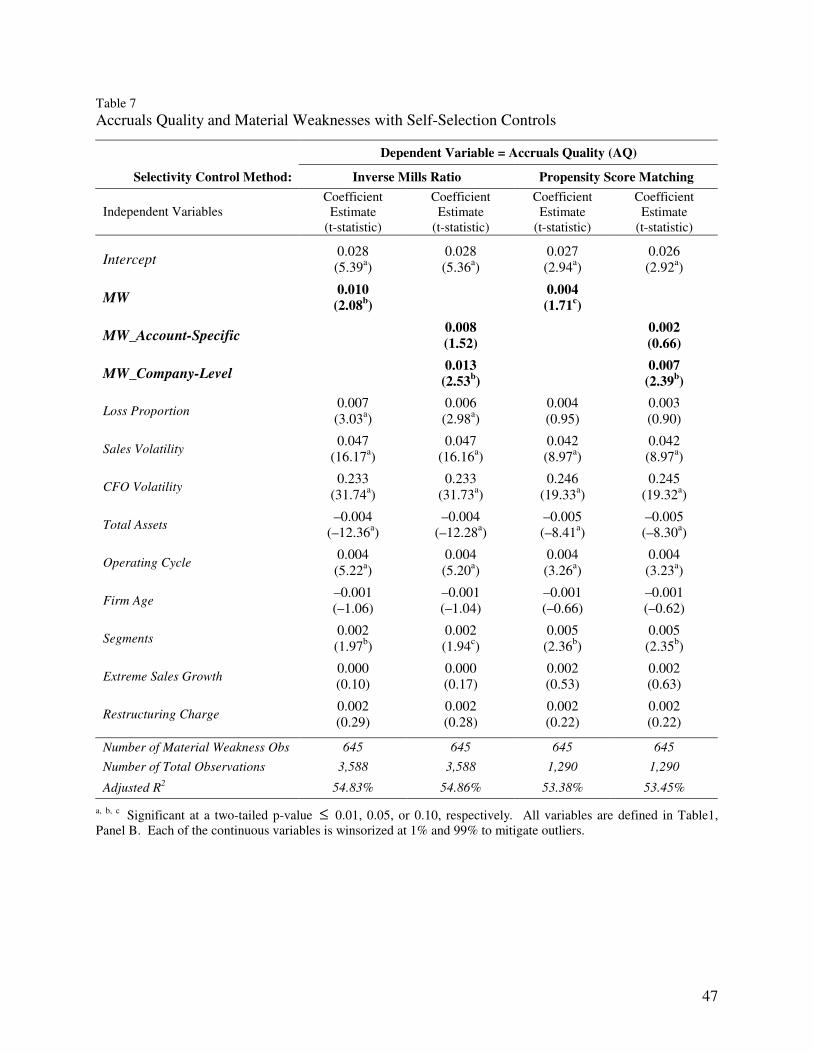
47
Table 7 Accruals Quality and Material Weaknesses with Self-Selection Controls
Dependent Variable = Accruals Quality (AQ)
Selectivity Control Method: Inverse Mills Ratio Propensity Score Matching Coefficient
Estimate Coefficient
Estimate Coefficient Estimate
Coefficient Estimate Independent Variables
(t-statistic) (t-statistic) (t-statistic) (t-statistic)
Intercept 0.028 (5.39a)
0.028 (5.36a)
0.027 (2.94a)
0.026 (2.92a)
MW 0.010 (2.08b) 0.004
(1.71c)
MW_Account-Specific 0.008 (1.52) 0.002
(0.66)
MW_Company-Level 0.013 (2.53b) 0.007
(2.39b)
Loss Proportion 0.007 (3.03a)
0.006 (2.98a)
0.004 (0.95)
0.003 (0.90)
Sales Volatility 0.047 (16.17a)
0.047 (16.16a)
0.042 (8.97a)
0.042 (8.97a)
CFO Volatility 0.233 (31.74a)
0.233 (31.73a)
0.246 (19.33a)
0.245 (19.32a)
Total Assets –0.004 (–12.36a)
–0.004 (–12.28a)
–0.005 (–8.41a)
–0.005 (–8.30a)
Operating Cycle 0.004 (5.22a)
0.004 (5.20a)
0.004 (3.26a)
0.004 (3.23a)
Firm Age –0.001 (–1.06)
–0.001 (–1.04)
–0.001 (–0.66)
–0.001 (–0.62)
Segments 0.002 (1.97b)
0.002 (1.94c)
0.005 (2.36b)
0.005 (2.35b)
Extreme Sales Growth 0.000 (0.10)
0.000 (0.17)
0.002 (0.53)
0.002 (0.63)
Restructuring Charge 0.002 (0.29)
0.002 (0.28)
0.002 (0.22)
0.002 (0.22)
Number of Material Weakness Obs 645 645 645 645 Number of Total Observations 3,588 3,588 1,290 1,290
Adjusted R2 54.83% 54.86% 53.38% 53.45% a, b, c Significant at a two-tailed p-value ≤ 0.01, 0.05, or 0.10, respectively. All variables are defined in Table1, Panel B. Each of the continuous variables is winsorized at 1% and 99% to mitigate outliers.