Embed Size (px)
Citation preview
Public Accounts
ofONTARIO
An n u A l Re p o R t A n d
Co n s o l i d A t e d Fi n A n C i A l st A t e m e n t s
2009–2010
mi n i s t R y o F Fi n A n C e
This publication is available in English and French. CD-ROM copies in either language may be obtained from:
ServiceOntario PublicationsTelephone: (416) 326-5300Toll-free: 1-800-668-9938
TTY Toll-free: 1-800-268-7095Website: www.serviceontario.ca/publications
For electronic access, visit the Ministry of Finance website at www.fin.gov.on.ca
Le présent document est publié en français et en anglais.On peut en obtenir une version sur CD-ROM dans l’une ou l’autre langue auprès de :
Publications ServiceOntarioTéléphone : 416 326-5300Sans frais : 1 800 668-9938
Téléimprimeur (ATS) sans frais : 1 800 268-7095Site Web : www.serviceontario.ca/publications
Pour en obtenir une version électronique, il suffit de consulter le site Web du ministère des Finances à www.fin.gov.on.ca
© Queen’s Printer for Ontario, 2010ISSN 0381-2375 (Print)
ISSN 1913-5556 (Online)
Please address your comments on this report to:
The Honourable Dwight DuncanMinister of Finance
7th FloorFrost Building South
7 Queen’s Park CrescentToronto, Ontario
M7A 1Y7
You can also send your comments to the Minister byelectronic mail to:

Public Accounts
ofONTARIO
An n u A l Re p o R t A n d
Co n s o l i d A t e d Fi n A n C i A l st A t e m e n t s
2009–2010
mi n i s t R y o F Fi n A n C e

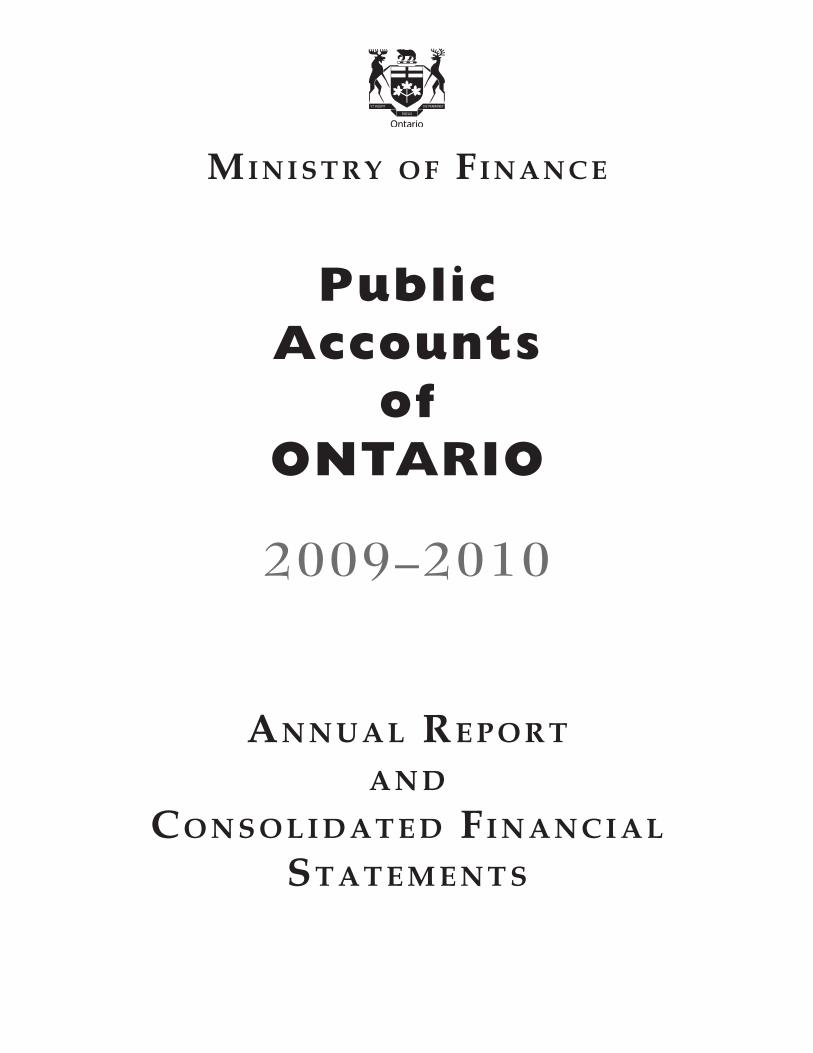
To The Honourable David C. Onley Lieutenant Governor of Ontario
May It Please Your Honour:
The undersigned has the honour to present the Public Accounts of the Province of Ontario for the fiscal year ended March 31, 2010, in accordance with the requirements of the Financial Administration Act.
Respectfully submitted,
The Honourable Dwight Duncan Minister of Finance Toronto, August 2010

TABLE OF CONTENTS
Foreword ............................................................................................................................................................iii Introduction ........................................................................................................................................................1 Guide to the Public Accounts ..........................................................................................................................3
Annual Report..............................................................................................................................................3 Supporting Volumes ...................................................................................................................................4
Statement of Responsibility ..............................................................................................................................5
FINANCIAL STATEMENT DISCUSSION AND ANALYSIS Highlights ............................................................................................................................................................9 Responding to changes in global economic conditions .............................................................................11
The plan to return to balance ..................................................................................................................12 Analysis of 2009–10 results......................................................................................................................13 The downturn’s impact on revenues ......................................................................................................14 Impact on government expenditures .....................................................................................................15 Impact on borrowing and financial position.........................................................................................17 Indicators of financial condition .............................................................................................................19
Sustainable recovery.........................................................................................................................................20 Improving transparency, accountability and financial management..................................................20
Delivering results..............................................................................................................................................22 Investing in education and training ........................................................................................................22 Making health care more accessible........................................................................................................23 Working toward a greener future............................................................................................................24
Actual to interim results in 2010 Budget ......................................................................................................25
CONSOLIDATED FINANCIAL STATEMENTS Auditor’s Report...............................................................................................................................................29 Consolidated Statement of Operations.........................................................................................................31 Consolidated Statement of Financial Position.............................................................................................32 Consolidated Statement of Change in Net Debt.........................................................................................33 Consolidated Statement of Change in Accumulated Deficit .....................................................................34 Consolidated Statement of Cash Flow..........................................................................................................35 Notes to the Consolidated Financial Statements.........................................................................................36 Schedules to the Consolidated Financial Statements..................................................................................61 Glossary .............................................................................................................................................................80 Sources of Additional Information................................................................................................................85
Financial Statement Discussion and Analysis, 2009–2010 i

ii Financial Statement Discussion and Analysis, 2009–2010
FOREWORD
I am pleased to present the Province of Ontario’s Public Accounts for the year 2009–2010.
Over the 2009–10 year we experienced both the depths of the effects of the global recession as well as some signs of economic stabilization in Ontario.
In our 2010 Budget, the McGuinty government launched the Open Ontario plan. Open Ontario is a five-year plan that is opening the province to new opportunities, new jobs and new growth. Part of our plan is to pay down the deficit in a responsible way. We will not put jobs or economic growth at risk.
We also recognize the need to continue to manage spending in a prudent manner. From 2003 until the global economic recession occurred, government revenues grew more quickly than spending on programs and services. In response to the downturn, we made a choice to help lessen the impact on Ontarians through short-term stimulus investments that helped create jobs and growth.
We are making record infrastructure investments in 2009–10 and 2010–11. This is creating jobs today while also building jobs and opportunities in the long term. These investments will contribute to Ontario’s future competitiveness by enhancing the province’s infrastructure base. In total, more than 6,800 projects have been approved to date and are expected to be completed by March 31, 2011. A recent Conference Board of Canada report concluded that the extra boost to infrastructure spending helped sustain Ontario’s economy in 2009 and will enhance growth in 2010.
As economies begin to recover, the key role for government is to create the best possible climate to promote investment and job creation by the business sector. July 1, 2010 saw the implementation of the harmonized sales tax (HST) first announced in the 2009 Budget. The HST and our tax plan for jobs and growth will transform Ontario into one of the most tax-competitive jurisdictions in the industrialized world for new business investment. According to prominent Canadian economist Jack Mintz, our plan will help create almost 600,000 jobs, raise incomes and boost investment in the next ten years.
Since 2003, the McGuinty government has undertaken a number of measures to modernize public services and create efficiencies in its own operations. With the global recession affecting revenues, further action was needed to manage the growth of spending in order to preserve key public services in the coming years and for future generations.
Rising health care costs account for a significant share of the provincial budget. Ontario is meeting the challenge of managing health care spending by implementing reforms such as our generic drug plan, which came into effect this summer.
Financial Statement Discussion and Analysis, 2009–2010 iii

Almost 55 per cent of government program spending goes to compensation, either directly or through transfers. MPP salaries have been frozen for three years. The government is freezing the compensation structures of non-bargained political and legislative staff, as well as those in the broader public sector and the Ontario public service for all non-bargained employees for two years.
While the government will respect all current collective agreements, the fiscal plan provides no funding for incremental compensation increases for any future collective agreements. These initiatives will help manage spending pressures and protect the public services that Ontarians rely on.
We have seen improvements in the economy this year which will strengthen revenues. At the same time, progress has been made on the expense side. Our deficit for the 2009–10 fiscal year is $19.3 billion, $2.0 billion lower than estimated at the time of the 2010 Budget.
While we have seen some stabilization and positive signs in the Ontario economy, recovery globally remains fragile. The European Union and the United States continue to experience very modest or slow growth. China, which has led the world in growth in recent years, is showing some signs that its growth may slow. These and other factors will affect Ontario’s growth. In the coming year, we will continue to monitor the global economy while continuing to make investments through our Open Ontario plan to stimulate the economy and ensure future jobs and growth.
By working together, Ontarians created a strong, growing economy in the past, and are doing so again. With the government’s plan to manage effectively, the province will return to a balanced budget while creating jobs and protecting public services, ensuring greater prosperity.
The Honourable Dwight Duncan Minister of Finance
iv Financial Statement Discussion and Analysis, 2009–2010
INTRODUCTION
The Annual Report is a key part of the Public Accounts of the Province of Ontario and a core element of the Province’s financial accountability. This Report outlines Ontario’s financial results, activities and position for the year ending March 31, 2010. It compares actual financial results for the 2009–10 fiscal year to the initial Budget plan set out in March 2009. In providing an overview of results, the Annual Report helps readers to understand the impact through the year of the deepening global recession on the Province’s finances.
Over the past two years, the severe economic downturn has tested the robustness of government financial management around the world. Ontario’s hard work over the past several years to strengthen its capacity in the areas of governance, management and accountability is allowing it to respond quickly and manage appropriately through this difficult situation. Ontario continues to adjust its fiscal strategy as changing conditions require, while building on these strong foundations.
Producing the Public Accounts of Ontario requires the teamwork and cooperation of many staff members across the provincial government and the broader public sector. In addition, the Office of the Auditor General plays a critical role in reviewing and reporting on the Province’s financial statements. I would like to thank everyone who was involved in preparing the 2009–10 Public Accounts for their valued contribution.
We welcome your comments on the Public Accounts. Please share your thoughts by email at [email protected], or by writing to the Office of the Provincial Controller, Re: Annual Report, Ontario Ministry of Finance, Second Floor, Frost Building South, 7 Queen’s Park Crescent, Toronto, ON M7A 1Y7.
Bruce L. Bennett, CA Assistant Deputy Minister and Provincial Controller Ontario Ministry of Finance
Financial Statement Discussion and Analysis, 2009–2010 1

2 Financial Statement Discussion and Analysis, 2009–2010
GUIDE TO THE PUBLIC ACCOUNTS
The Public Accounts of the Province of Ontario comprise this Annual Report and three supporting volumes.
Annual Report The Annual Report includes a Financial Statement Discussion and Analysis that explains the Province’s financial and other results, as well as the Consolidated Financial Statements.
The Consolidated Financial Statements are made up of several documents and schedules:
The Auditor General’s Report expresses the opinion of the Auditor General as to whether the statements fairly report the activities of the government in accordance with Canadian generally accepted accounting principles.
The Consolidated Statement of Operations reports the annual surplus or deficit from operations in the period. It shows government revenue against the cost of providing services, financing debt and paying other expenses. The difference is the annual surplus or deficit. The statement also provides a comparison to the Budget plan.
The Consolidated Statement of Financial Position shows the assets of the Province, which are classified as financial or non-financial, against its obligations. The Province’s net debt consists of its obligations less its financial resources. The Province’s accumulated deficit is its net debt less the value of its non-financial assets.
The Consolidated Statement of Change in Net Debt shows the impact of financing the annual deficit and investments in capital assets. As well, this statement reflects the annual change in the fair market value of Ontario Nuclear Funds Agreement (ONFA) investments.
The Consolidated Statement of Change in Accumulated Deficit shows the impact of the annual deficit and changes in elements of the fair market value of ONFA funds on the Province’s accumulated deficit.
The Consolidated Statement of Cash Flow shows the sources and uses of cash over the period. The government’s operations either use or provide cash over the fiscal year, as do other activities such as capital investments and financing activities. Sources of cash include increases in debt and decreases in financial investments, while uses of cash include investments in infrastructure and other assets. The Consolidated Statement of Cash Flow shows the impact of all these activities on the Province’s holdings of cash and cash equivalents over the year.
Notes and schedules provide further information on the items in the various statements and form an integral part of the Consolidated Financial Statements. The notes also include a summary of the significant accounting policies that reflect the basis on which the Province’s financial statements are prepared.
Financial Statement Discussion and Analysis, 2009–2010 3
Supporting Volumes Volume 1 contains ministry statements and detailed schedules of debt and other items. The ministry statements, which are presented on the accrual basis of accounting, compare the amounts that were appropriated by the Legislative Assembly with actual expenses incurred. The expenses of government organizations including provincial corporations, boards, commissions, hospitals, school boards and colleges, are not appropriated. However, the impact of these organizations on the government’s finances is reflected in the Consolidated Financial Statements.
Volume 2 contains the financial statements of significant provincial corporations, boards and commissions that are part of the government’s reporting entity, and other miscellaneous financial statements.
Volume 3 contains detailed schedules of ministry payments.
4 Financial Statement Discussion and Analysis, 2009–2010
STATEMENT OF RESPONSIBILITY
The Consolidated Financial Statements and Financial Statement Discussion and Analysis are prepared by the Government of Ontario in compliance with legislation and in accordance with generally accepted accounting principles for governments in Canada.
The government accepts responsibility for the objectivity and integrity of these Consolidated Financial Statements and the Financial Statement Discussion and Analysis.
The government is also responsible for maintaining systems of financial management and internal control to provide reasonable assurance that transactions recorded in the Consolidated Financial Statements are within statutory authority, assets are properly safeguarded and reliable financial information is available for preparation of these Consolidated Financial Statements.
The Consolidated Financial Statements have been audited by the Auditor General of Ontario and his report appears on page 29 of this document.
Peter Wallace Bruce L. Bennett, CA Deputy Minister July 30, 2010
Assistant Deputy Minister and Provincial Controller
July 30, 2010
Financial Statement Discussion and Analysis, 2009–2010 5

6 Financial Statement Discussion and Analysis, 2009–2010

FINANCIAL STATEMENT DISCUSSION AND ANALYSIS
Financial Statement Discussion and Analysis, 2009–2010 7

8 Financial Statement Discussion and Analysis, 2009–2010
HIGHLIGHTS
For most of the last two years, the global economy has suffered through a deep recession. Although signs of a recovery are growing, many jurisdictions continue to struggle with the impacts.
To protect people and jobs, governments, including that of Ontario, acted quickly as the global recession took hold. Over the past two years, Ontario has provided key stimulus investments, helped laid-off workers who needed training to upgrade their skills, and supported the important public services on which people rely more than ever during tough economic times.
There are clear signs that economic recovery is well under way in Ontario. Economic activity expanded in the last half of 2009, although not strongly enough to reverse a 3.0 per cent decline in real gross domestic product (GDP) for the year as a whole. The first quarter of 2010 saw further growth in real GDP of 1.5 per cent. Despite these gains, many sectors continue to feel the impact of global economic challenges. Economic conditions in the United States, Ontario’s largest trading partner, are still uncertain.
The government has responded to the difficult economic environment of the past two years with strategic actions that are yielding positive results. Through its Open Ontario plan, it is:
Creating jobs and encouraging companies to invest in Ontario by reducing personal and corporate income tax rates and introducing a harmonized sales tax that will lower the cost of doing business.
Making investments in infrastructure that are expected to create and protect more than 300,000 jobs over two years. These investments are creating better infrastructure to attract business investment and improve the quality of life in Ontario.
Investing to ensure long-term academic success. The government has reduced primary class sizes, ensured that more students finish high school, and increased spaces in postsecondary institutions. Student performance has improved across the board. Ontario should be well positioned for a future economy in which 70 per cent of new jobs are expected to require postsecondary education.
Giving people in Ontario better access to employment and training services by committing roughly $1.6 billion in each of 2009–10 and 2010–11 through Employment Ontario, focusing in particular on workers affected by the recession. Ontario’s Second Career program is a first for Canada because it provides training and living expenses for up to two years of training.
Moving forward on the Green Energy Act, which is expected to create up to 50,000 jobs in Ontario in its first three years, and has already attracted a $7 billion investment by a consortium that will generate roughly 16,000 green jobs in Ontario.
Financial Statement Discussion and Analysis, 2009–2010 9
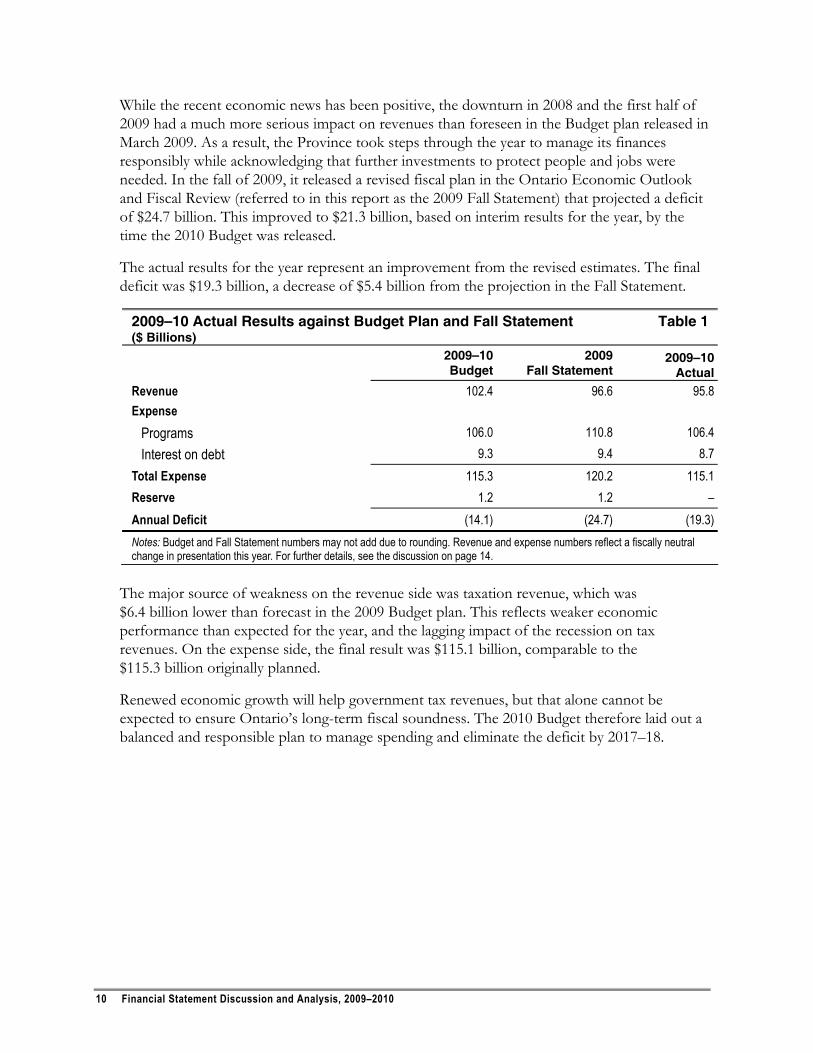
While the recent economic news has been positive, the downturn in 2008 and the first half of 2009 had a much more serious impact on revenues than foreseen in the Budget plan released in March 2009. As a result, the Province took steps through the year to manage its finances responsibly while acknowledging that further investments to protect people and jobs were needed. In the fall of 2009, it released a revised fiscal plan in the Ontario Economic Outlook and Fiscal Review (referred to in this report as the 2009 Fall Statement) that projected a deficit of $24.7 billion. This improved to $21.3 billion, based on interim results for the year, by the time the 2010 Budget was released.
The actual results for the year represent an improvement from the revised estimates. The final deficit was $19.3 billion, a decrease of $5.4 billion from the projection in the Fall Statement.
2009–10 Actual Results against Budget Plan and Fall Statement Table 1 ($ Billions)
2009–10 Budget
2009 Fall Statement
2009–10 Actual
Revenue 102.4 96.6 95.8 Expense
Programs 106.0 110.8 106.4 Interest on debt 9.3 9.4 8.7
Total Expense 115.3 120.2 115.1 Reserve 1.2 1.2 – Annual Deficit (14.1) (24.7) (19.3) Notes: Budget and Fall Statement numbers may not add due to rounding. Revenue and expense numbers reflect a fiscally neutral change in presentation this year. For further details, see the discussion on page 14.
The major source of weakness on the revenue side was taxation revenue, which was $6.4 billion lower than forecast in the 2009 Budget plan. This reflects weaker economic performance than expected for the year, and the lagging impact of the recession on tax revenues. On the expense side, the final result was $115.1 billion, comparable to the $115.3 billion originally planned.
Renewed economic growth will help government tax revenues, but that alone cannot be expected to ensure Ontario’s long-term fiscal soundness. The 2010 Budget therefore laid out a balanced and responsible plan to manage spending and eliminate the deficit by 2017–18.
10 Financial Statement Discussion and Analysis, 2009–2010
RESPONDING TO CHANGES IN GLOBAL ECONOMIC CONDITIONS
Ontario’s government has acted decisively over the past two years to protect people and jobs and build the base for recovery. Its actions are keeping people working and stimulating the economy. The government’s commitment to effective management will help return its books to fiscal balance.
The 2009–10 fiscal year presented significant challenges, which the government successfully navigated. At the time the Budget plan for 2009–10 was drawn up, Ontario –– like other jurisdictions –– was in the midst of a global downturn whose duration and ultimate severity were unknown. There were strong concerns about manufacturing and the automotive sector in particular. The government recognized the need to respond quickly and effectively. Its 2009 Budget provided stimulus through short-term infrastructure projects and supported workers with major investments in skills training. It also continued its ongoing support for such critical public services as health and education. The Budget projected a $14.1 billion deficit for the year, and outlined risks to the Ontario economy that might require government action, including changes to the fiscal plan.
In July 2009, in its results for the first quarter, the Province revised its 2009–10 deficit projection to $18.5 billion. This reflected a decision in June, in concert with the U.S. and Canadian governments, to make major investments in the auto sector, as well as weaker-than-expected economic activity that resulted in revenues below forecast.
At the time of the 2009 Fall Statement, the government took further steps to acknowledge and address the severity of the situation. At that point the consensus among private-sector forecasts was that Ontario’s economy would shrink by 3.3 per cent in real terms in 2009. Ontario assumed a more cautious outlook of a 3.5 per cent decline, and further reduced the revenue forecast. The Province foresaw that further stimulus funding might be needed to respond to economic conditions, and it also had to make provision for a possible H1N1 flu pandemic. Together, the changes resulted in a projected deficit for 2009–10 of $24.7 billion.
At the same time, the government recognized the need to help maintain Ontario’s public services over the long term by ensuring a strong and sustainable fiscal footing. It announced the launch of an expenditure management review and other measures to restrain the growth in spending.
By the time the 2010 Budget was published in March of this year, the Province’s actions had already begun to yield positive results. Based on interim results for 2009–10, the revised estimate for the deficit was $21.3 billion, lower than projected in the fall. In-year measures helped to achieve fiscal savings and allowed the Province to improve on the earlier deficit projections, as did lower-than-expected cost for the provincial response to the H1N1 flu virus and lower-than-projected interest on debt expense.
Financial Statement Discussion and Analysis, 2009–2010 11
The deficit picture has since improved further, largely as a result of lower-than-projected expenses. Growth in the Ontario economy is reviving, and with it taxation revenues will begin to increase, but this alone cannot be guaranteed to bring about budgetary balance. It is also necessary to moderate the growth in expenses. The Province is therefore following a realistic and responsible plan to eliminate the deficit.
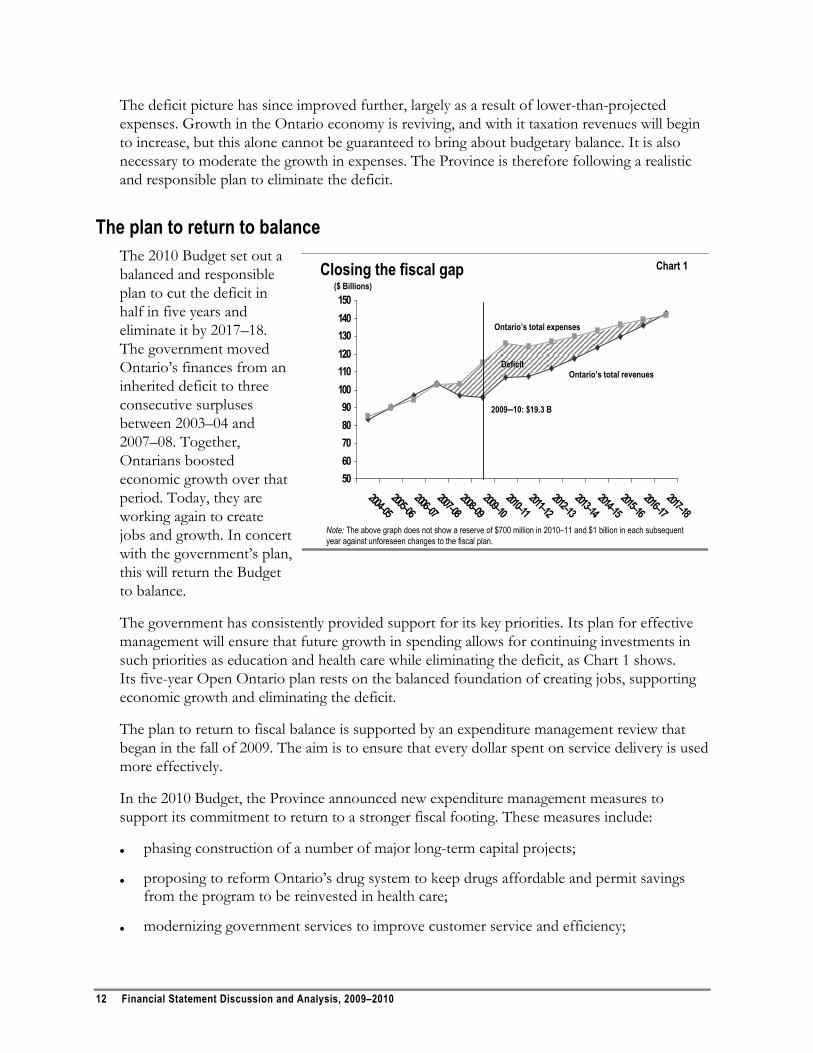
The plan to return to balance The 2010 Budget set out a balanced and responsible plan to cut the deficit in half in five years and eliminate it by 2017–18. The government moved Ontario’s finances from an inherited deficit to three consecutive surpluses between 2003–04 and 2007–08. Together, Ontarians boosted economic growth over that period. Today, they are working again to create jobs and growth. In concert with the government’s plan, this will return the Budget to balance.
5060708090
100110120130140150
2004–052005–06
2006–072007–08
2008–092009–10
2010–112011–12
2012–132013–14
2014–152015–16
2016–172017–18
Closing the fiscal gap Chart 1
Deficit
2009–10: $19.3 B
Ontario’s total revenues
Ontario’s total expenses
Note: The above graph does not show a reserve of $700 million in 2010–11 and $1 billion in each subsequent year against unforeseen changes to the fiscal plan.
($ Billions)
The government has consistently provided support for its key priorities. Its plan for effective management will ensure that future growth in spending allows for continuing investments in such priorities as education and health care while eliminating the deficit, as Chart 1 shows. Its five-year Open Ontario plan rests on the balanced foundation of creating jobs, supporting economic growth and eliminating the deficit.
The plan to return to fiscal balance is supported by an expenditure management review that began in the fall of 2009. The aim is to ensure that every dollar spent on service delivery is used more effectively.
In the 2010 Budget, the Province announced new expenditure management measures to support its commitment to return to a stronger fiscal footing. These measures include:
phasing construction of a number of major long-term capital projects;
proposing to reform Ontario’s drug system to keep drugs affordable and permit savings from the program to be reinvested in health care;
modernizing government services to improve customer service and efficiency;
12 Financial Statement Discussion and Analysis, 2009–2010
freezing internal operating expenses at or below 2010–11 levels;
extending a 2009–10 freeze on pay for members of the provincial Parliament for an additional two years and taking other compensation measures, including passing the Public Sector Compensation Restraint to Protect Public Services Act, 2010; and
launching a comprehensive expenditure management review process.
Ontario has been consistently among the lowest-spending provinces on general government services since 2003–04. In 2008–09, spending on general government services was $134 per person, 28 per cent below the $186 average per person of other provincial governments and the second lowest among the provinces.
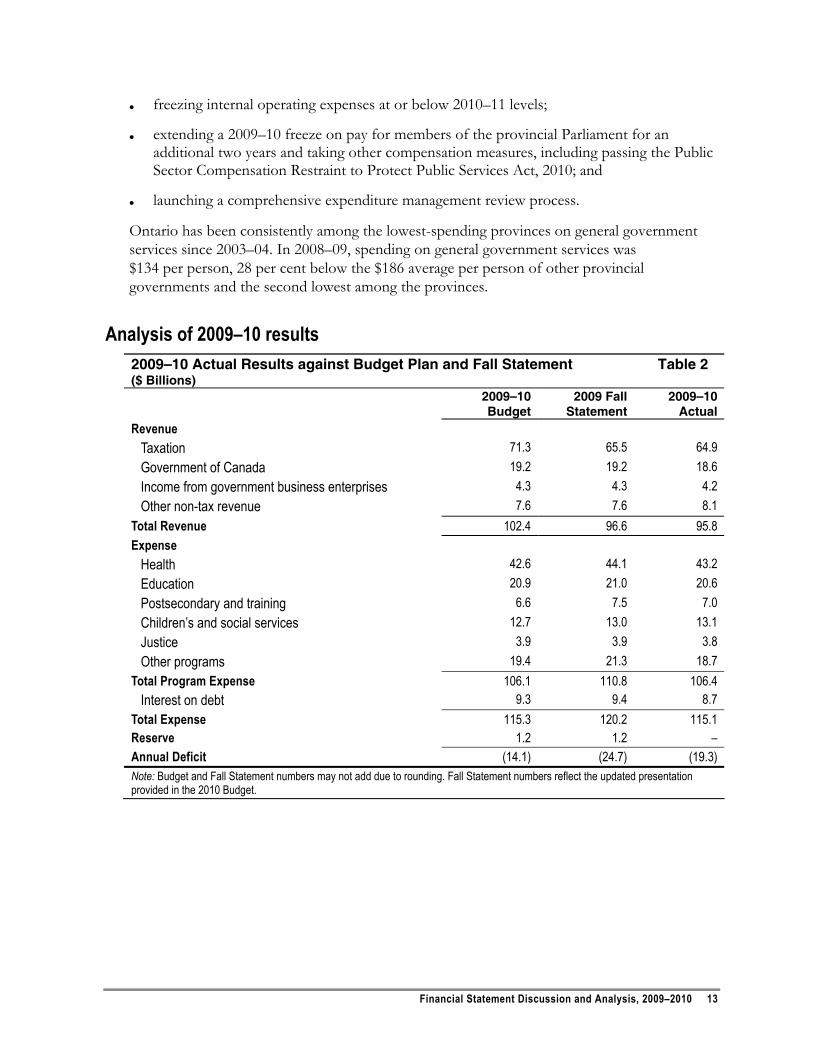
Analysis of 2009–10 results 2009–10 Actual Results against Budget Plan and Fall Statement Table 2 ($ Billions) 2009–10
Budget 2009 Fall
Statement 2009–10
Actual Revenue
Taxation 71.3 65.5 64.9 Government of Canada 19.2 19.2 18.6 Income from government business enterprises 4.3 4.3 4.2 Other non-tax revenue 7.6 7.6 8.1
Total Revenue 102.4 96.6 95.8 Expense
Health 42.6 44.1 43.2 Education 20.9 21.0 20.6 Postsecondary and training 6.6 7.5 7.0 Children’s and social services 12.7 13.0 13.1 Justice 3.9 3.9 3.8 Other programs 19.4 21.3 18.7
Total Program Expense 106.1 110.8 106.4 Interest on debt 9.3 9.4 8.7
Total Expense 115.3 120.2 115.1 Reserve 1.2 1.2 – Annual Deficit (14.1) (24.7) (19.3) Note: Budget and Fall Statement numbers may not add due to rounding. Fall Statement numbers reflect the updated presentation provided in the 2010 Budget.
Financial Statement Discussion and Analysis, 2009–2010 13
14 Financial Statement Discussion and Analysis, 2009–2010
The presentation of both revenue and expenses has changed in this year’s Consolidated Financial Statements and Annual Report, providing greater transparency in financial reporting. This presentation is also more in line with standards recently issued by the Public Sector Accounting Board for tax revenues and consolidation of organizations in the broader public sector.
Starting this year, education property tax is now included with other provincial revenue in the Consolidated Financial Statements and related documents. This taxation revenue was previously netted against the Province’s school board expense. Because school board expense increases by the same amount, this change in presentation has no impact on the deficit. In 2009–10, the new presentation had the impact of increasing both revenue and expenses by $6.5 billion. The 2009 Budget plan and Fall Statement have been restated throughout this analysis to make them easier to compare to the actual results.
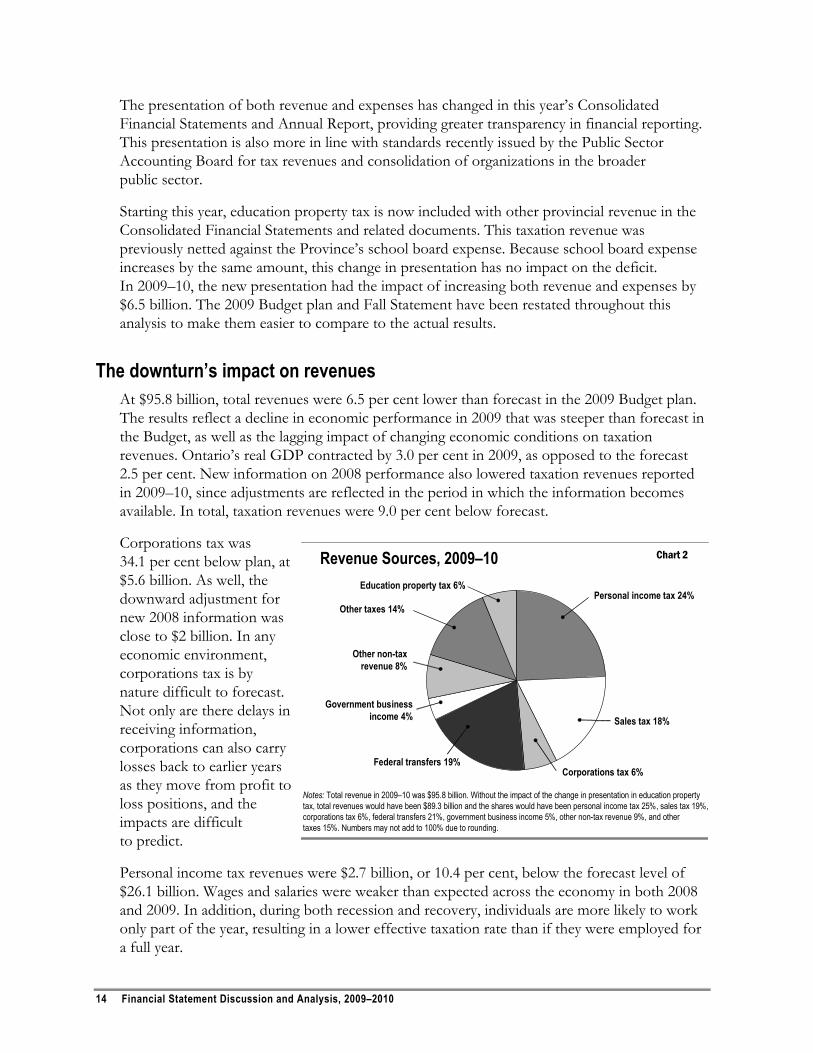
The downturn’s impact on revenues At $95.8 billion, total revenues were 6.5 per cent lower than forecast in the 2009 Budget plan. The results reflect a decline in economic performance in 2009 that was steeper than forecast in the Budget, as well as the lagging impact of changing economic conditions on taxation revenues. Ontario’s real GDP contracted by 3.0 per cent in 2009, as opposed to the forecast 2.5 per cent. New information on 2008 performance also lowered taxation revenues reported in 2009–10, since adjustments are reflected in the period in which the information becomes available. In total, taxation revenues were 9.0 per cent below forecast.
Corporations tax was 34.1 per cent below plan, at $5.6 billion. As well, the downward adjustment for new 2008 information was close to $2 billion. In any economic environment, corporations tax is by nature difficult to forecast. Not only are there delays in receiving information, corporations can also carry losses back to earlier years as they move from profit to loss positions, and the impacts are difficult to predict.
Personal income tax revenues were $2.7 billion, or 10.4 per cent, below the forecast level of $26.1 billion. Wages and salaries were weaker than expected across the economy in both 2008 and 2009. In addition, during both recession and recovery, individuals are more likely to work only part of the year, resulting in a lower effective taxation rate than if they were employed for a full year.
Revenue Sources, 2009–10 Chart 2
Notes: Total revenue in 2009–10 was $95.8 billion. Without the impact of the change in presentation in education propertytax, total revenues would have been $89.3 billion and the shares would have been personal income tax 25%, sales tax 19%, corporations tax 6%, federal transfers 21%, government business income 5%, other non-tax revenue 9%, and other taxes 15%. Numbers may not add to 100% due to rounding.
Personal income tax 24%
Other non-tax revenue 8%
Government business income 4%
Other taxes 14%
Federal transfers 19%
Sales tax 18%
Corporations tax 6%
Education property tax 6%
All other taxes were $780 million, or 2.1 per cent, lower than forecast. As with corporations tax and personal income tax revenue, the main reason was weaker-than-expected economic performance.
Among non-tax sources, actual revenues were $30.9 billion, close to the Budget plan of $31.1 billion. Federal transfers for such programs as infrastructure investment were lower because of the revised scheduling of some projects, leading to a decline of $626 million from the Budget plan. This was largely offset by lower provincial spending in those areas in 2009–10.
Impact on government expenditures Despite a global economic crisis of a severity unforeseen by most economists, Ontario’s government has stood by its key priorities over the past two years, knowing that Ontarians were depending on them more than ever. It also invested in short-term stimulus measures to see the economy through the worst of the downturn. In doing so, it not only protected people and jobs, it also set the stage for recovery. Investments in training, green energy and innovation have positioned Ontario for longer-term prosperity.
Ontario has recognized the value of infrastructure investment for several years. With the additional need to provide short-term stimulus through the recession, investment reached a record level in the 2009–10 fiscal year. These investments, which will continue in 2010–11, build on the $30-billion-plus ReNew Ontario plan that was successfully completed in 2008–09.
In total, more than 6,800 stimulus projects have been approved to date and are expected to be completed by March 31, 2011. Projects include:
reconstructing roads and bridges;
renewing and expanding the capacity of facilities at colleges and universities;
replacing watermains and upgrades to water systems;
improving arenas, other sports facilities, libraries and other cultural assets; and
upgrading social and affordable housing, with projects ranging from roof and window replacements to major renovations.
To meet the goal of economic stimulus, an important consideration was that projects were “shovel-ready” so that work could begin quickly. To enhance the impact of the Province’s stimulus investments, Ontario’s program is designed to work in concert with federal government initiatives that have the same goal.
The stimulus investments were made in addition to ongoing commitments to improve and rebuild the public assets on which the economy and quality of life in Ontario depend. These include expanding transit and highways to help lower travel times and transportation costs and making improvements to schools, colleges and universities to help equip Ontarians for future jobs and build a more prosperous future.
Financial Statement Discussion and Analysis, 2009–2010 15
In November 2009, Ontario won the rights to host the 2015 Pan/Parapan American Games, which will also shape infrastructure investments. This will be the first major international multi-sport games hosted in the province since the 1930s. Construction on the GO Transit Georgetown south service expansion is under way and expected to be completed by 2015. This will facilitate a rail connection between Toronto Pearson International Airport and Union Station and allow participants and spectators to travel more easily during the Games.
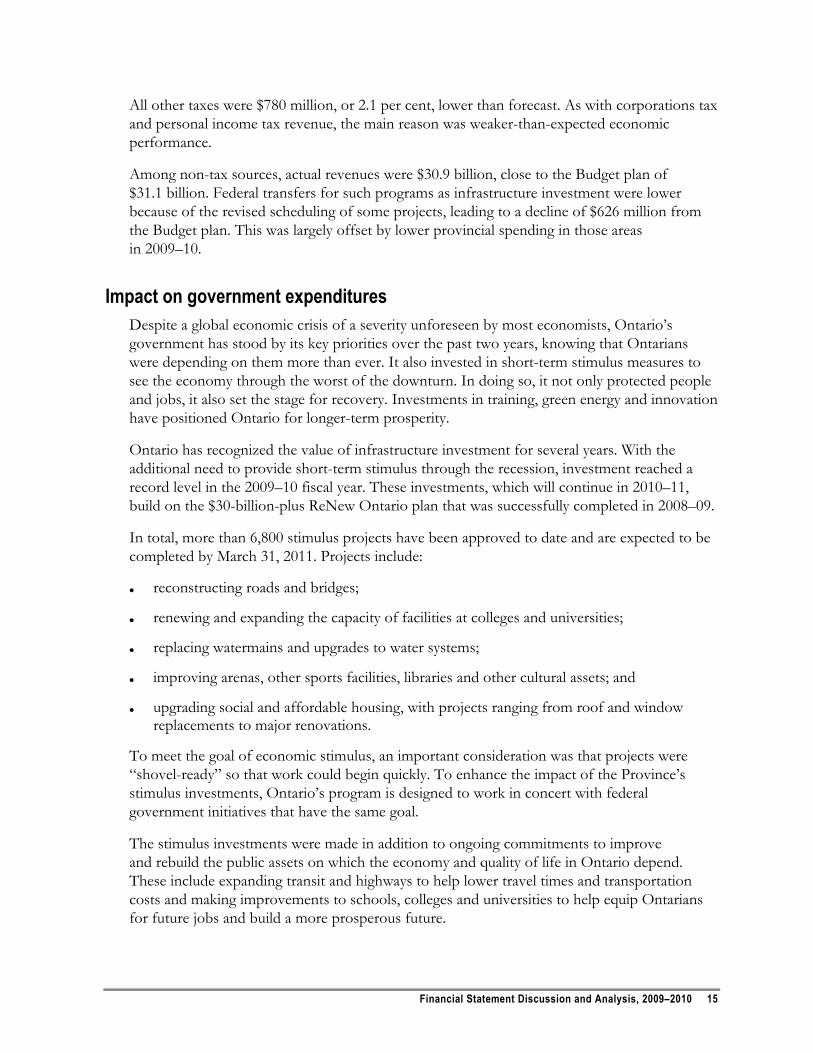
Infrastructure Expenditures, 2009–10 Table 3 ($ Billions)
Sector Investment
in Capital Assets Transfers
and Other1 Totals, 2009–10
Actual Transportation and transit 3.6 0.6 4.2 Health 2.7 0.2 2.9 Education, Postsecondary and Training 1.9 0.1 2.0 Municipal and other2 0.9 2.6 3.5 Totals 9.1 3.5 12.6 1 The totals consist of transfers for capital purposes to municipalities and universities and expenditures for capital repairs. Transfers
for capital-related purposes and other infrastructure expenditures are recorded as expenses in the Province’s Consolidated Statement of Operations.
2 Including stimulus spending.
The Conference Board of Canada recently released a report which concluded that the extra boost to infrastructure spending, owing in part to new stimulus measures to counter the global recession, helped sustain Ontario’s real GDP in 2009 and is expected to enhance growth in 2010.
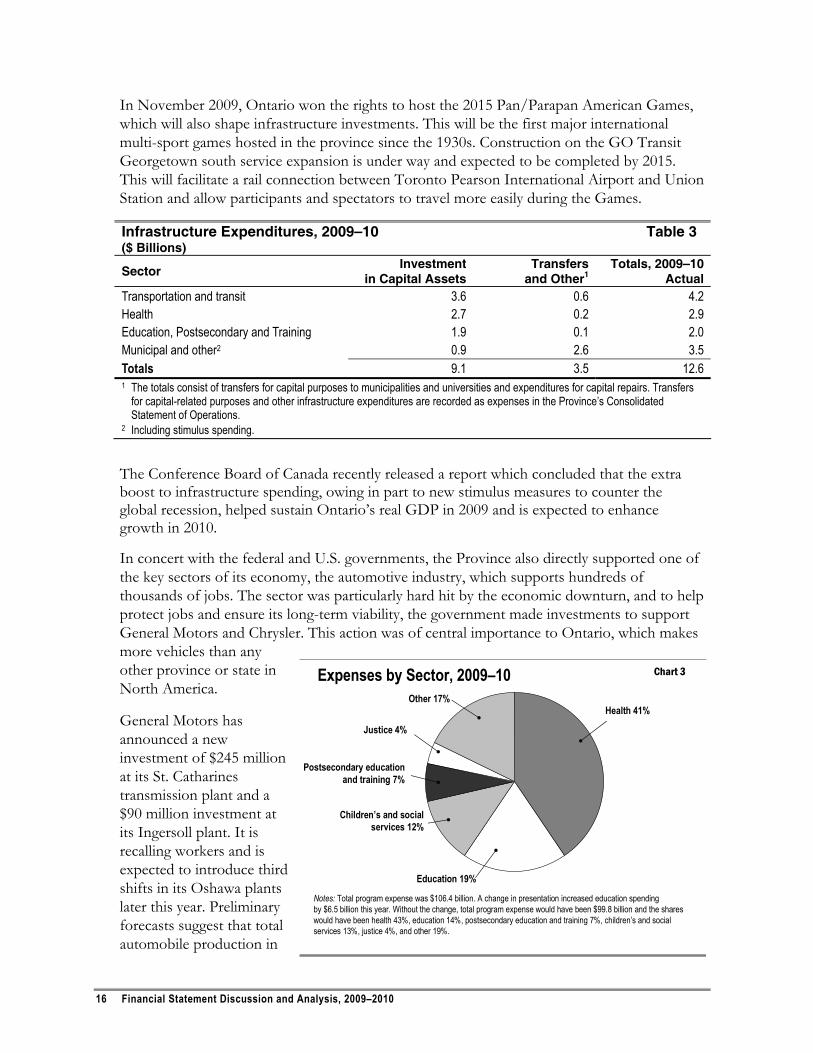
In concert with the federal and U.S. governments, the Province also directly supported one of the key sectors of its economy, the automotive industry, which supports hundreds of thousands of jobs. The sector was particularly hard hit by the economic downturn, and to help protect jobs and ensure its long-term viability, the government made investments to support General Motors and Chrysler. This action was of central importance to Ontario, which makes more vehicles than any other province or state in North America.
Expenses by Sector, 2009–10 Chart 3
Notes: Total program expense was $106.4 billion. A change in presentation increased education spending by $6.5 billion this year. Without the change, total program expense would have been $99.8 billion and the shares would have been health 43%, education 14%, postsecondary education and training 7%, children’s and social services 13%, justice 4%, and other 19%.
Health 41%
Postsecondary education and training 7%
Children’s and social services 12%
Justice 4%
Other 17%
Education 19%
General Motors has announced a new investment of $245 million at its St. Catharines transmission plant and a $90 million investment at its Ingersoll plant. It is recalling workers and is expected to introduce third shifts in its Oshawa plants later this year. Preliminary forecasts suggest that total automobile production in
16 Financial Statement Discussion and Analysis, 2009–2010
Ontario could rise to roughly 1.9 million vehicles this year, from 1.5 million in 2009. While the industry has gone through a difficult period, government support will help to ensure that Ontario retains its leading position in North America as the recovery takes hold.
Total program spending was up by $289 million or 0.3 per cent from the 2009 Budget plan. Increases reflecting additional support for people affected by the economic downturn, such as increased training for laid-off workers and higher social assistance costs, were largely offset by lower spending in other areas.
Total expense, including interest expense, was $115.1 billion, $292 million less than outlined in the 2009 Budget plan. Interest on debt was $582 million lower than forecast, reflecting mainly the impact of lower-than-forecast interest rates and financing at shorter-term maturities.
Impact on borrowing and financial position The debt of the Province increased by $35.2 billion in 2009–10, rising from $176.9 billion to $212.1 billion. The increase went mainly to financing the deficit and investing in capital infrastructure.
Ontario successfully completed its largest annual borrowing program in 2009–10, despite continuing challenges in global financial markets. It did so mainly through greater diversification in international bond markets and responsiveness to its bond investors.
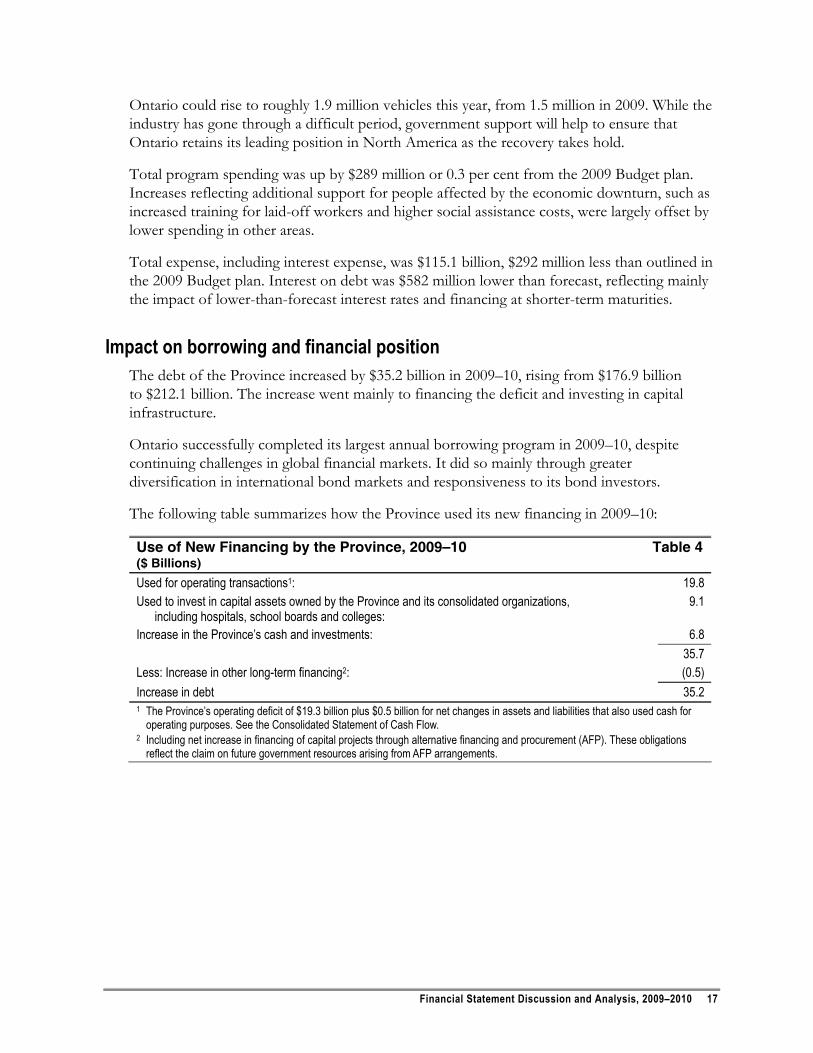
The following table summarizes how the Province used its new financing in 2009–10:
Use of New Financing by the Province, 2009–10 Table 4 ($ Billions)
Used for operating transactions1: 19.8 Used to invest in capital assets owned by the Province and its consolidated organizations,
including hospitals, school boards and colleges: 9.1
Increase in the Province’s cash and investments: 6.8 35.7 Less: Increase in other long-term financing2: (0.5) Increase in debt 35.2 1 The Province’s operating deficit of $19.3 billion plus $0.5 billion for net changes in assets and liabilities that also used cash for
operating purposes. See the Consolidated Statement of Cash Flow. 2 Including net increase in financing of capital projects through alternative financing and procurement (AFP). These obligations
reflect the claim on future government resources arising from AFP arrangements.
Financial Statement Discussion and Analysis, 2009–2010 17
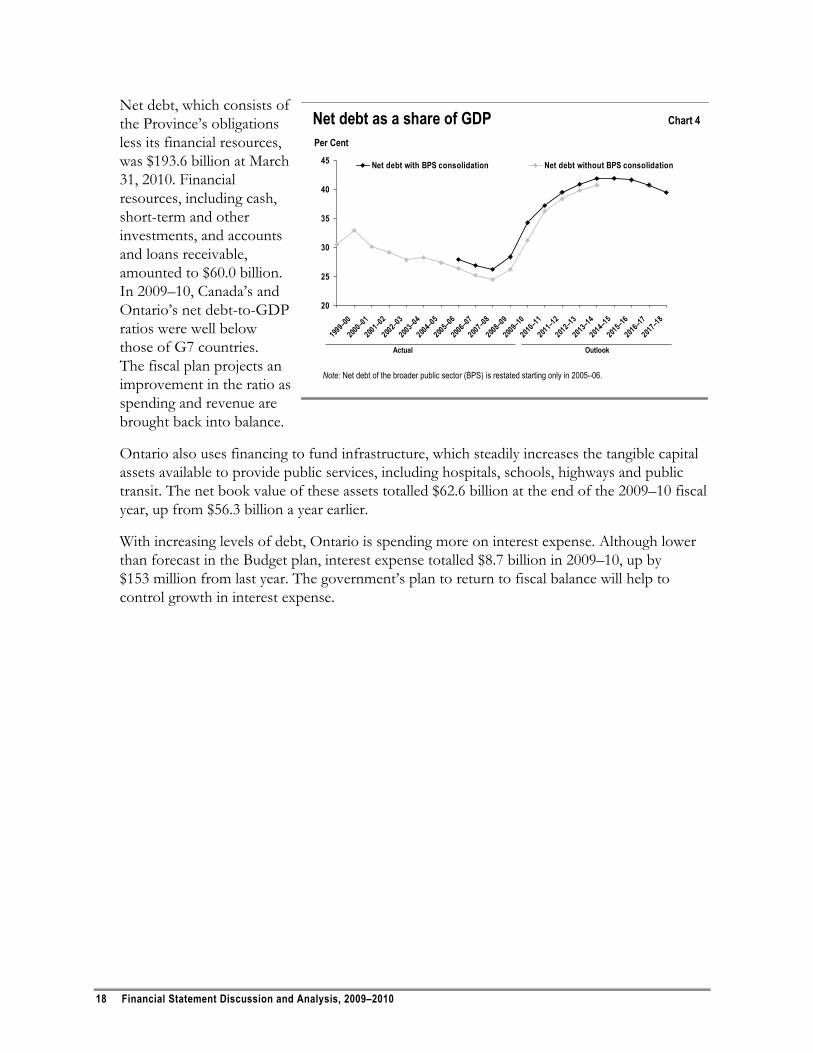
Net debt, which consists of the Province’s obligations less its financial resources, was $193.6 billion at March 31, 2010. Financial resources, including cash, short-term and other investments, and accounts and loans receivable, amounted to $60.0 billion. In 2009–10, Canada’s and Ontario’s net debt-to-GDP ratios were well below those of G7 countries. The fiscal plan projects an improvement in the ratio as spending and revenue are brought back into balance.
20
25
30
35
40
45
1999–0
0
2000–01
2001–02
2002–03
2003–0
4
2004–05
2005–06
2006–07
2007–08
2008–09
2009–1
0
2010–11
2011–12
2012–1
3
2013–14
2014–15
2015–16
2016–17
2017–18
Net debt with BPS consolidation Net debt without BPS consolidation
Net debt as a share of GDP Chart 4
Note: Net debt of the broader public sector (BPS) is restated starting only in 2005–06.
Per Cent
Actual Outlook
Ontario also uses financing to fund infrastructure, which steadily increases the tangible capital assets available to provide public services, including hospitals, schools, highways and public transit. The net book value of these assets totalled $62.6 billion at the end of the 2009–10 fiscal year, up from $56.3 billion a year earlier.
With increasing levels of debt, Ontario is spending more on interest expense. Although lower than forecast in the Budget plan, interest expense totalled $8.7 billion in 2009–10, up by $153 million from last year. The government’s plan to return to fiscal balance will help to control growth in interest expense.
18 Financial Statement Discussion and Analysis, 2009–2010
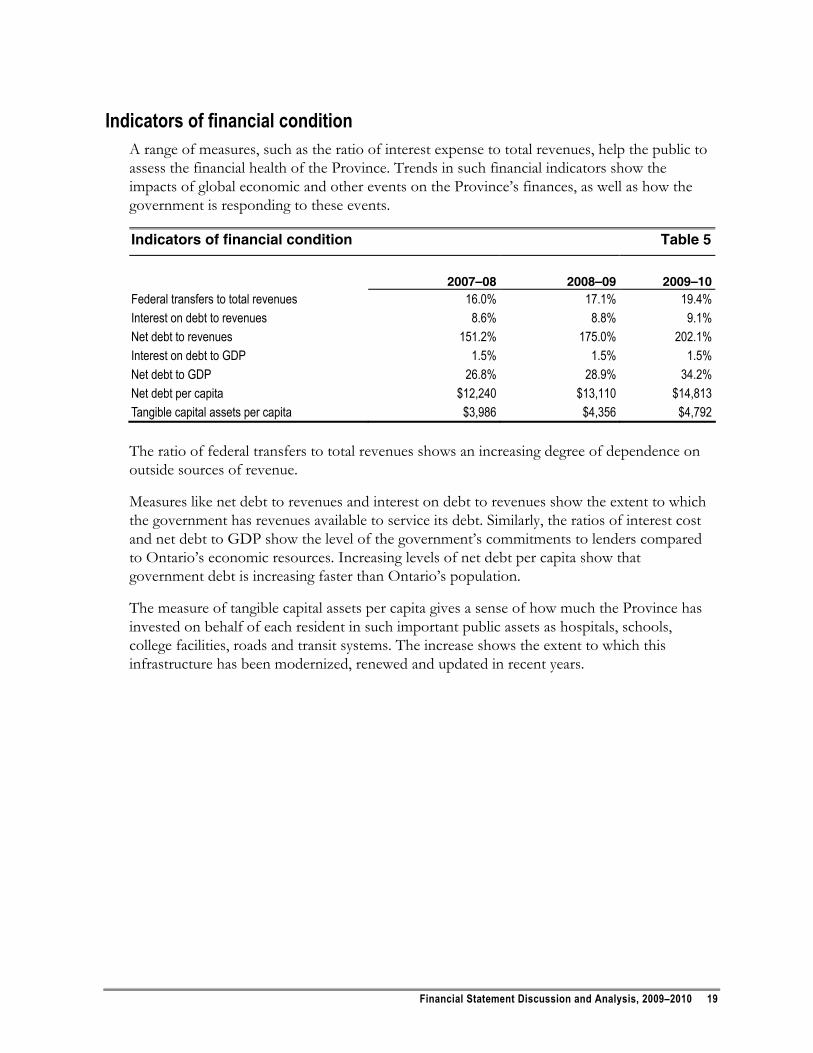
Indicators of financial condition A range of measures, such as the ratio of interest expense to total revenues, help the public to assess the financial health of the Province. Trends in such financial indicators show the impacts of global economic and other events on the Province’s finances, as well as how the government is responding to these events.
Indicators of financial condition Table 5
2007–08 2008–09 2009–10
Federal transfers to total revenues 16.0% 17.1% 19.4% Interest on debt to revenues 8.6% 8.8% 9.1% Net debt to revenues 151.2% 175.0% 202.1% Interest on debt to GDP 1.5% 1.5% 1.5% Net debt to GDP 26.8% 28.9% 34.2% Net debt per capita $12,240 $13,110 $14,813 Tangible capital assets per capita $3,986 $4,356 $4,792 The ratio of federal transfers to total revenues shows an increasing degree of dependence on outside sources of revenue.
Measures like net debt to revenues and interest on debt to revenues show the extent to which the government has revenues available to service its debt. Similarly, the ratios of interest cost and net debt to GDP show the level of the government’s commitments to lenders compared to Ontario’s economic resources. Increasing levels of net debt per capita show that government debt is increasing faster than Ontario’s population.
The measure of tangible capital assets per capita gives a sense of how much the Province has invested on behalf of each resident in such important public assets as hospitals, schools, college facilities, roads and transit systems. The increase shows the extent to which this infrastructure has been modernized, renewed and updated in recent years.
Financial Statement Discussion and Analysis, 2009–2010 19
SUSTAINABLE RECOVERY
While using sound financial management to control the growth of debt and interest expense, the government continues to provide support to take Ontario to a higher and more sustainable position in the global economy through the Open Ontario plan. Central elements of its strategy include:
Ensuring a climate where business can thrive, create jobs and build innovative new products to sell to the world.
Making Ontario more competitive and modernizing the tax system by cutting personal and corporate income tax rates, eliminating the capital tax and introducing the harmonized sales tax. These tax measures will boost the competitiveness of Ontario companies and make Ontario one of the most tax-competitive jurisdictions in the industrialized world for new business investment. Moreover, these measures will be in effect as short-term stimulus investments begin to wind down and are expected to help create nearly 600,000 net new Ontario jobs over the next 10 years, including more than 100,000 in manufacturing alone.
Putting the Green Energy Act into action, providing a stable price for clean energy producers so they will invest here, and create up to 50,000 Ontario jobs in new, clean industries that did not exist a few years ago.
Streamlining services for business through the Open for Business strategy.
Supporting economic development and people in Ontario’s north by reducing energy costs, which are higher than in the south, funding training for Aboriginal Peoples and northern Ontarians, to help them take part in such opportunities as the mineral-rich region known as the Ring of Fire, and investing in regional infrastructure.
Helping the province’s important financial services sector through such initiatives as partnering with the City of Toronto and the Toronto Financial Services Alliance to advance Toronto’s position as a global leader in the sector and creating the Centre of Excellence in Financial Services Education.
Tabling the proposed Water Opportunities and Water Conservation Act in the spring of 2010. Its purpose is to build on Ontario’s expertise in clean-water technology, laying the foundation for new jobs and making Ontario a North American leader in the creation and export of new products and services for water conservation and treatment. The act would also support water conservation measures.
Improving transparency, accountability and financial management The government is committed to ensuring Ontarians receive value for their tax dollars. To this end, it continues to make its finances clearer and easier to understand and strengthen accountability for public spending.
Through the Fiscal Transparency and Accountability Act, 2004, the government provided greater transparency in budgets, improved its financial reporting and enhanced the fiscal accountability framework. It also extended the authority of the Auditor General to carry out
20 Financial Statement Discussion and Analysis, 2009–2010
value-for-money audits of organizations in the broader public sector that use taxpayer dollars to deliver public services, including health care and education.
Starting with the 2005–06 Public Accounts and 2006 Budget, the government showed taxpayers more clearly how funds were used by organizations largely supported by their tax dollars, by including the financial results of hospitals, school boards and colleges in its financial reports. In line with standards recently updated by the Public Sector Accounting Board, as of the 2009–10 fiscal year the government is also including the net debt of these organizations in its consolidated net debt, a change in presentation that has no fiscal impact. The consolidation of these organizations is explained in more detail in Note 1 to the Consolidated Financial Statements under “Principles of Consolidation.”
The government continually improves accountability for taxpayer dollars. In 2007, it introduced more stringent accountability requirements around transfer payments to strengthen assurance that public funds are being spent by recipient organizations for their intended purposes.
More recently, the government strengthened oversight for provincial agencies. Ontario’s more than 250 agencies range in size from such large organizations as Metrolinx, which runs the GO Transit system, to small advisory panels. The new policy strengthens governance, accountability and oversight, including requirements around business planning, regular reporting, evaluation by the ministry to which the agency reports, clarification of roles and responsibilities, and consequences for non-compliance.
The government has taken other major steps to strengthen assurance that Ontario’s ministries and government agencies are spending taxpayer dollars wisely. It has recently introduced strict new guidelines on business expenses, and has revised procurement policies to ensure ministries and agencies use open, competitive practices. In addition, revised travel, meal and hospitality policies are being put in place. To strengthen compliance, increased audits of ministry and agency expenses are also being undertaken. As of April 1, 2010, the travel and hospitality expenses of senior government and agency officials are being publicly reported by government at www.ontario.ca/en/expense_claim/index.htm.
In making major infrastructure investments through transfer payments, for example the $1.1 billion provided to municipalities in 2008 under the Investing in Ontario Act and the short-term stimulus spending in 2009–10, the Province sets out several measures to ensure accountability. Recipients must report back on the planned and actual use of the funds, and the Province maintains the right to carry out audits to ensure funds are used for the purposes intended and to recover any funds not used as intended.
To provide more information about investments in such public assets as roads, schools, libraries, university buildings, water systems, bridges and recreational facilities, the Ministry of Energy and Infrastructure provides a website that tracks stimulus projects being funded with provincial help. Through the site, at www.ontario.ca/infrastructure, users can click on an interactive map to learn about the nature of each project, its completion stage, how much it costs, and what share the Province is providing. This site supports the goals of rebuilding Ontario’s infrastructure and providing economic stimulus while ensuring accountability and transparency.
Financial Statement Discussion and Analysis, 2009–2010 21
DELIVERING RESULTS
The Ontario government has committed to enhancing existing services and introducing innovative new ones to create measurable improvements in people’s lives in Ontario. Over the past seven years, these investments have raised the quality of life and are helping the Ontario economy and its people to adapt to sweeping global changes.
Investing in education and training Major investments in knowledge and skills through the primary, secondary and postsecondary educational systems, as well as training and job programs, support prosperity today and in future. The results show the value of these investments.
As of 2009–10, all primary classes in Ontario had 23 or fewer students, and 90.5 per cent had 20 or fewer. Class sizes by school are available at www.edu.gov.on.ca/eng/cst/.
Between 2003–04 and 2008–09, the percentage of Grade 3 students who performed at or above the standard on provincial tests increased by seven percentage points in reading, 10 percentage points in writing and six percentage points in mathematics. Among Grade 6 students, the increases were 11 percentage points in reading, 13 in writing and six in math. For Grade 9 students taking academic math, the share who performed at or above the provincial standard increased from 68 to 77 per cent. Detailed results are available on the Education Quality and Accountability Office website at www.eqao.com.
In the 2008–09 school year, 79 per cent of Ontario students graduated with a high school diploma, up from 77 per cent a year earlier and 68 per cent in 2003–04. The Province remains committed to achieving 85 per cent in this important measure.
As a result of the government’s five-year, $6.2 billion Reaching Higher plan, which ended in 2009–10, more students were attending postsecondary education. With 120,000 more students than in 2002–03, a rise of 31 per cent, the government far surpassed its goal of 102,000 students by 2009–10.
Ontario is also making sure that people already in the workforce have the right skills. These efforts intensified in 2009–10, reflecting the impact of economic conditions.
The government boosted Employment Ontario spending on jobs and skills training, making an investment of more than $1.5 billion in 2009–10. Through this and previous investments, more than 28,000 laid-off workers enrolled to receive short- or long-term training under the Second Career initiative. Second Career, which was launched in June 2008, exceeded its three-year goal of helping 20,000 people after only 16 months.
22 Financial Statement Discussion and Analysis, 2009–2010
Making health care more accessible The government has built and continues to strengthen a system of health services that people in Ontario can access when and where they are needed — at home, in the community or in hospital. The results show that these efforts are succeeding.
Wait times for adult surgical procedures in the province are now within provincial targets. The 2010 report card by the Wait Time Alliance gave Ontario straight As for reducing wait times for hip, knee, cancer, cataract and cardiac surgeries for the second consecutive year. The website www.ontario.ca/waittimes provides the most comprehensive surgical wait time information in Canada.
As part of its plan to reduce emergency room (ER) wait times, the government launched a one-of-its-kind North American initiative that sets targets for reductions, tracks hospital performance and posts monthly local ER data at the www.ontario.ca/waittimes website. Overall wait time fell by 13.3 per cent between April 2008 and June 2010.
The government is on track to meeting a commitment to provide access to a family doctor to 500,000 more Ontarians by 2011–12. According to the Primary Care Access Survey, about 300,000 more Ontarians had a regular family doctor in September 2009 compared to 2007. About 900,000 more Ontarians have a family physician now than in 2003.
Between 2003 and 2009, the increase in the number of physicians in Ontario has outpaced the province’s population growth.
Making sure Ontario has enough health care professionals in future is another priority.
In 2009–10, an additional 100 medical school spaces were allocated to five medical schools. With actions already taken in 2008–09, this represents a 38 per cent overall increase since 2004–05, or 260 new first-year spaces overall.
The Ministry of Health and Long-Term Care continues to fund the expansion of family medicine residency positions. By 2013–14, an additional 175 family medicine positions will be in place. This represents 326 new training positions between 2004–05 and 2013–14, a 128 per cent increase.
Three new medical education campuses, in St. Catharines, Kitchener-Waterloo and Windsor, are already operating. A fourth is scheduled to open in Mississauga in the fall of 2011.
The Northern Ontario School of Medicine, which opened in 2005, graduated its first class of 55 students in the spring of 2009.
Financial Statement Discussion and Analysis, 2009–2010 23
Working toward a greener future Ontario’s green energy plan has been lauded by former U.S. vice-president Al Gore as the single best such plan in North America.
Since October 2003, about 1,300 megawatts (MW) of clean electricity from wind, water, sun and bio-based resources have come online. In March and April 2010, the Ontario Power Authority announced contract offers for a further 2,500 MW of renewable energy through its new Feed-In Tariff program.
Conservation and new supply from green energy and other sources of cleaner supply will enable the Province to meet its commitment to eliminate coal from Ontario’s supply mix by the end of 2014. In 2009, Ontario’s coal plants generated less than 10 terawatt-hours of electricity — a drop of about 60 per cent from 2008 levels and the lowest output in 45 years.
The most recent report of the Chief Conservation Officer confirmed that Ontario’s first conservation target has been met, and that Ontario was making progress toward the 2010 target of an additional 1,350 MW of peak-demand reduction. The report is available at www.powerauthority.on.ca.
24 Financial Statement Discussion and Analysis, 2009–2010
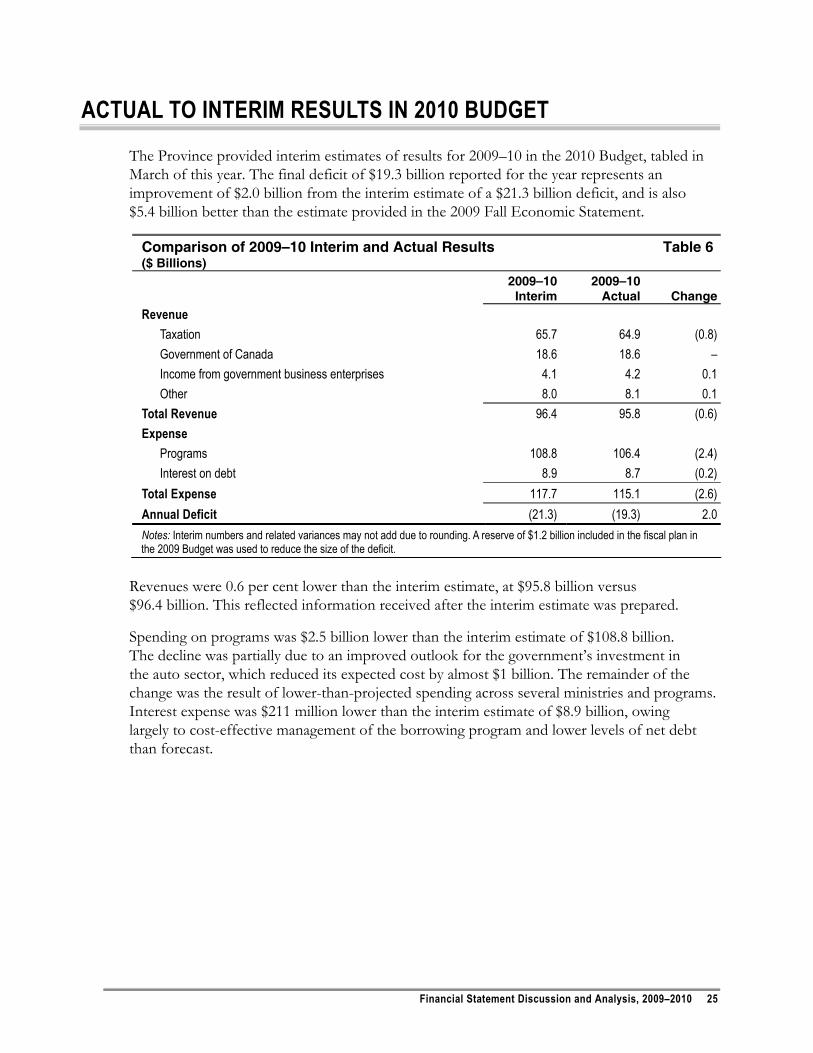
ACTUAL TO INTERIM RESULTS IN 2010 BUDGET
The Province provided interim estimates of results for 2009–10 in the 2010 Budget, tabled in March of this year. The final deficit of $19.3 billion reported for the year represents an improvement of $2.0 billion from the interim estimate of a $21.3 billion deficit, and is also $5.4 billion better than the estimate provided in the 2009 Fall Economic Statement.
Comparison of 2009–10 Interim and Actual Results Table 6 ($ Billions)
2009–10 Interim
2009–10 Actual Change
Revenue Taxation 65.7 64.9 (0.8) Government of Canada 18.6 18.6 – Income from government business enterprises 4.1 4.2 0.1 Other 8.0 8.1 0.1 Total Revenue 96.4 95.8 (0.6) Expense Programs 108.8 106.4 (2.4) Interest on debt 8.9 8.7 (0.2) Total Expense 117.7 115.1 (2.6) Annual Deficit (21.3) (19.3) 2.0 Notes: Interim numbers and related variances may not add due to rounding. A reserve of $1.2 billion included in the fiscal plan in the 2009 Budget was used to reduce the size of the deficit.
Revenues were 0.6 per cent lower than the interim estimate, at $95.8 billion versus $96.4 billion. This reflected information received after the interim estimate was prepared.
Spending on programs was $2.5 billion lower than the interim estimate of $108.8 billion. The decline was partially due to an improved outlook for the government’s investment in the auto sector, which reduced its expected cost by almost $1 billion. The remainder of the change was the result of lower-than-projected spending across several ministries and programs. Interest expense was $211 million lower than the interim estimate of $8.9 billion, owing largely to cost-effective management of the borrowing program and lower levels of net debt than forecast.
Financial Statement Discussion and Analysis, 2009–2010 25

26 Financial Statement Discussion and Analysis, 2009–2010

Consolidated Financial Statements, 2009–2010 27
CONSOLIDATED FINANCIAL STATEMENTS

28 Consolidated Financial Statements, 2009–2010
Consolidated Financial Statements, 2009–2010 29

30 Consolidated Financial Statements, 2009–2010
Consolidated Financial Statements, 2009–2010 31
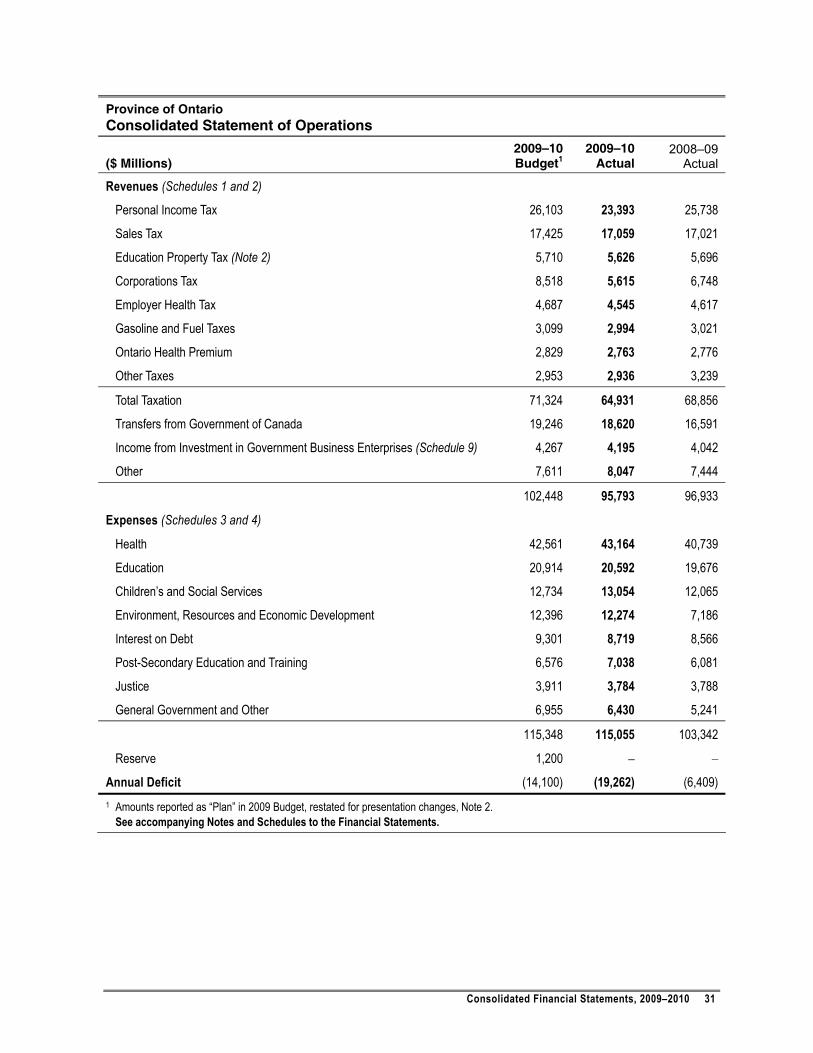
Province of Ontario Consolidated Statement of Operations
($ Millions) 2009–10 Budget1
2009–10 Actual
2008–09Actual
Revenues (Schedules 1 and 2)
Personal Income Tax 26,103 23,393 25,738
Sales Tax 17,425 17,059 17,021
Education Property Tax (Note 2) 5,710 5,626 5,696
Corporations Tax 8,518 5,615 6,748
Employer Health Tax 4,687 4,545 4,617
Gasoline and Fuel Taxes 3,099 2,994 3,021
Ontario Health Premium 2,829 2,763 2,776
Other Taxes 2,953 2,936 3,239
Total Taxation 71,324 64,931 68,856
Transfers from Government of Canada 19,246 18,620 16,591
Income from Investment in Government Business Enterprises (Schedule 9) 4,267 4,195 4,042
Other 7,611 8,047 7,444
102,448 95,793 96,933
Expenses (Schedules 3 and 4) Health 42,561 43,164 40,739
Education 20,914 20,592 19,676
Children’s and Social Services 12,734 13,054 12,065
Environment, Resources and Economic Development 12,396 12,274 7,186
Interest on Debt 9,301 8,719 8,566
Post-Secondary Education and Training 6,576 7,038 6,081
Justice 3,911 3,784 3,788
General Government and Other 6,955 6,430 5,241
115,348 115,055 103,342
Reserve 1,200 – –
Annual Deficit (14,100) (19,262) (6,409) 1 Amounts reported as “Plan” in 2009 Budget, restated for presentation changes, Note 2. See accompanying Notes and Schedules to the Financial Statements.
32 Consolidated Financial Statements, 2009–2010
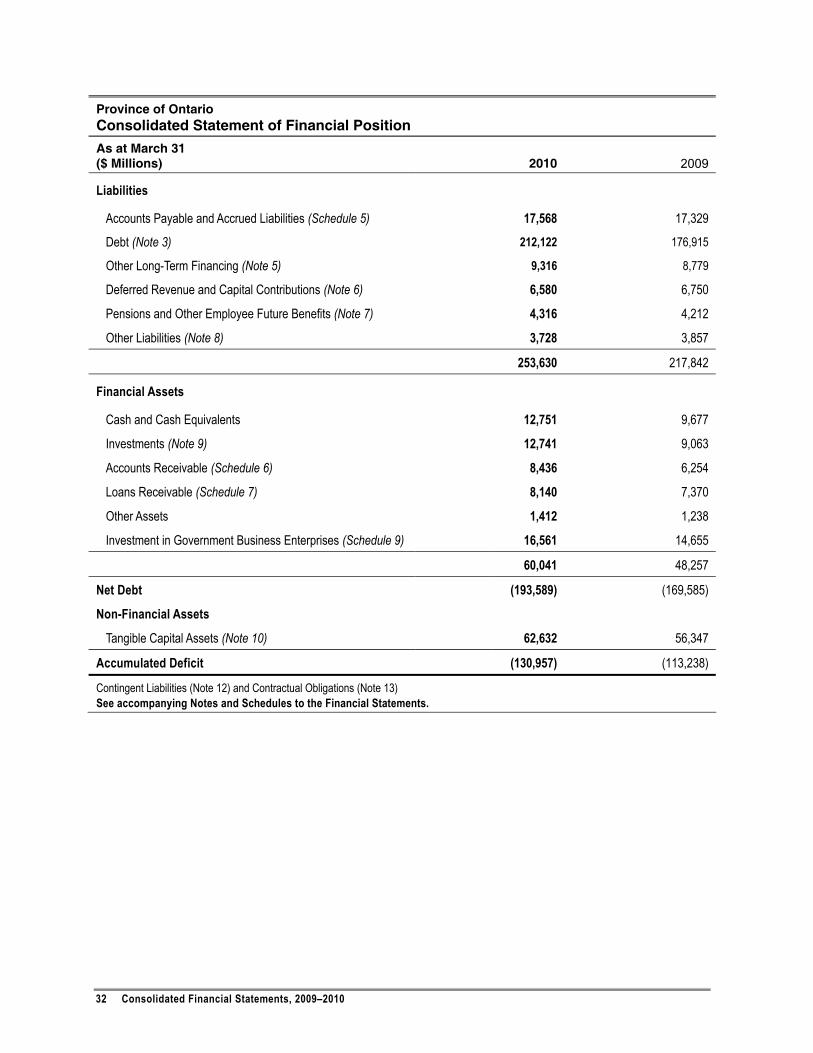
Province of Ontario Consolidated Statement of Financial Position
As at March 31 ($ Millions)
2010 2009
Liabilities Accounts Payable and Accrued Liabilities (Schedule 5) 17,568 17,329
Debt (Note 3) 212,122 176,915
Other Long-Term Financing (Note 5) 9,316 8,779
Deferred Revenue and Capital Contributions (Note 6) 6,580 6,750
Pensions and Other Employee Future Benefits (Note 7) 4,316 4,212
Other Liabilities (Note 8) 3,728 3,857
253,630 217,842
Financial Assets
Cash and Cash Equivalents 12,751 9,677
Investments (Note 9) 12,741 9,063
Accounts Receivable (Schedule 6) 8,436 6,254
Loans Receivable (Schedule 7) 8,140 7,370
Other Assets 1,412 1,238
Investment in Government Business Enterprises (Schedule 9) 16,561 14,655
60,041 48,257
Net Debt (193,589) (169,585)
Non-Financial Assets
Tangible Capital Assets (Note 10) 62,632 56,347
Accumulated Deficit (130,957) (113,238)
Contingent Liabilities (Note 12) and Contractual Obligations (Note 13) See accompanying Notes and Schedules to the Financial Statements.
Consolidated Financial Statements, 2009–2010 33
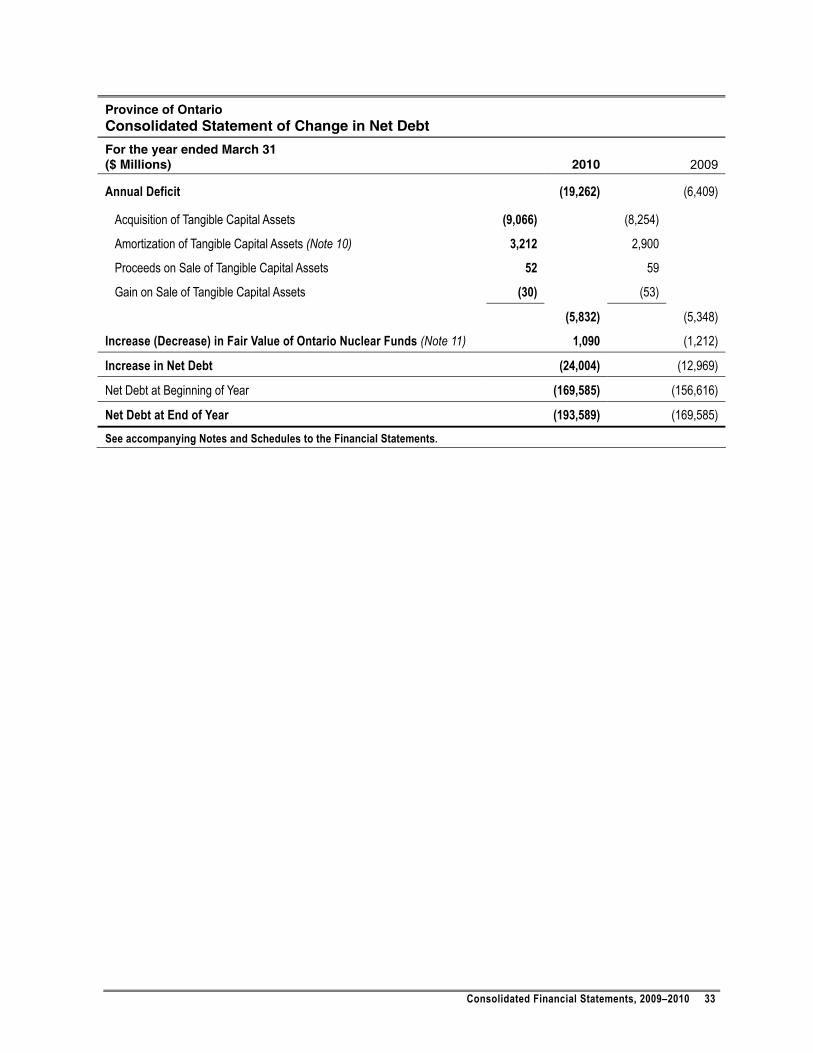
Province of Ontario Consolidated Statement of Change in Net Debt
For the year ended March 31 ($ Millions) 2010 2009
Annual Deficit (19,262) (6,409)
Acquisition of Tangible Capital Assets (9,066) (8,254) Amortization of Tangible Capital Assets (Note 10) 3,212 2,900 Proceeds on Sale of Tangible Capital Assets 52 59 Gain on Sale of Tangible Capital Assets (30) (53)
(5,832) (5,348)
Increase (Decrease) in Fair Value of Ontario Nuclear Funds (Note 11) 1,090 (1,212)
Increase in Net Debt (24,004) (12,969)
Net Debt at Beginning of Year (169,585) (156,616)
Net Debt at End of Year (193,589) (169,585) See accompanying Notes and Schedules to the Financial Statements.
34 Consolidated Financial Statements, 2009–2010
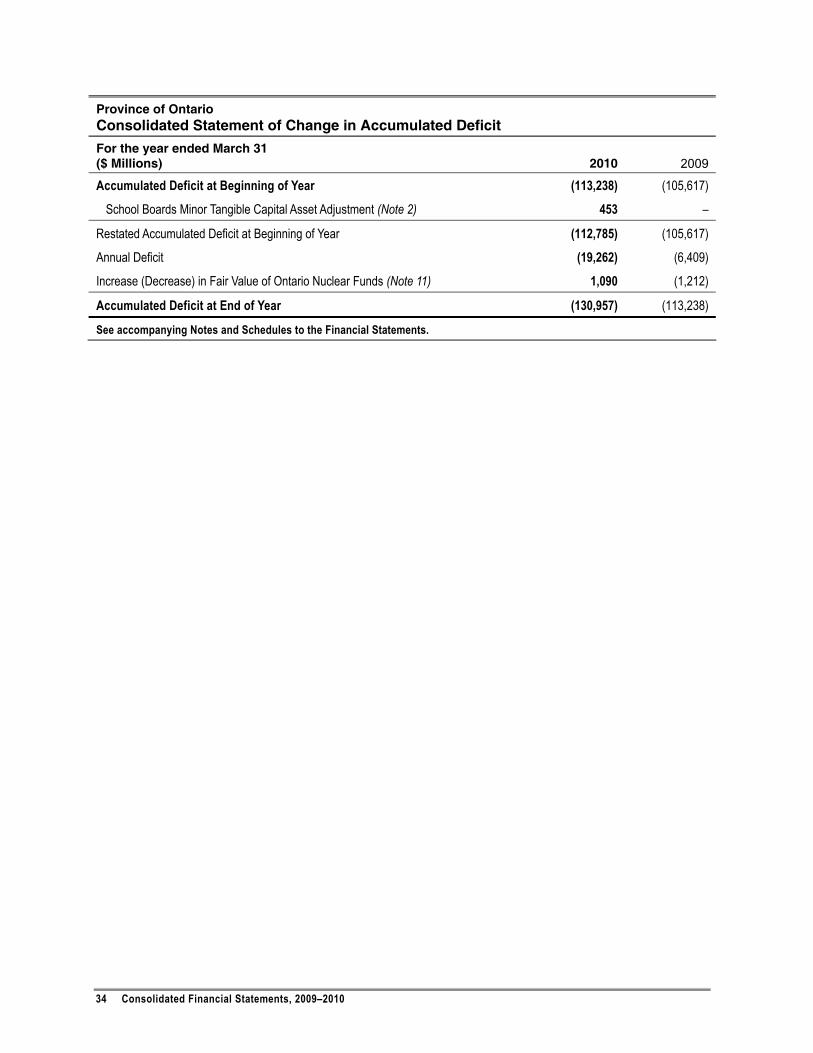
Province of Ontario Consolidated Statement of Change in Accumulated Deficit
For the year ended March 31 ($ Millions) 2010 2009
Accumulated Deficit at Beginning of Year (113,238) (105,617)
School Boards Minor Tangible Capital Asset Adjustment (Note 2) 453 –
Restated Accumulated Deficit at Beginning of Year (112,785) (105,617)
Annual Deficit (19,262) (6,409)
Increase (Decrease) in Fair Value of Ontario Nuclear Funds (Note 11) 1,090 (1,212)
Accumulated Deficit at End of Year (130,957) (113,238)
See accompanying Notes and Schedules to the Financial Statements.
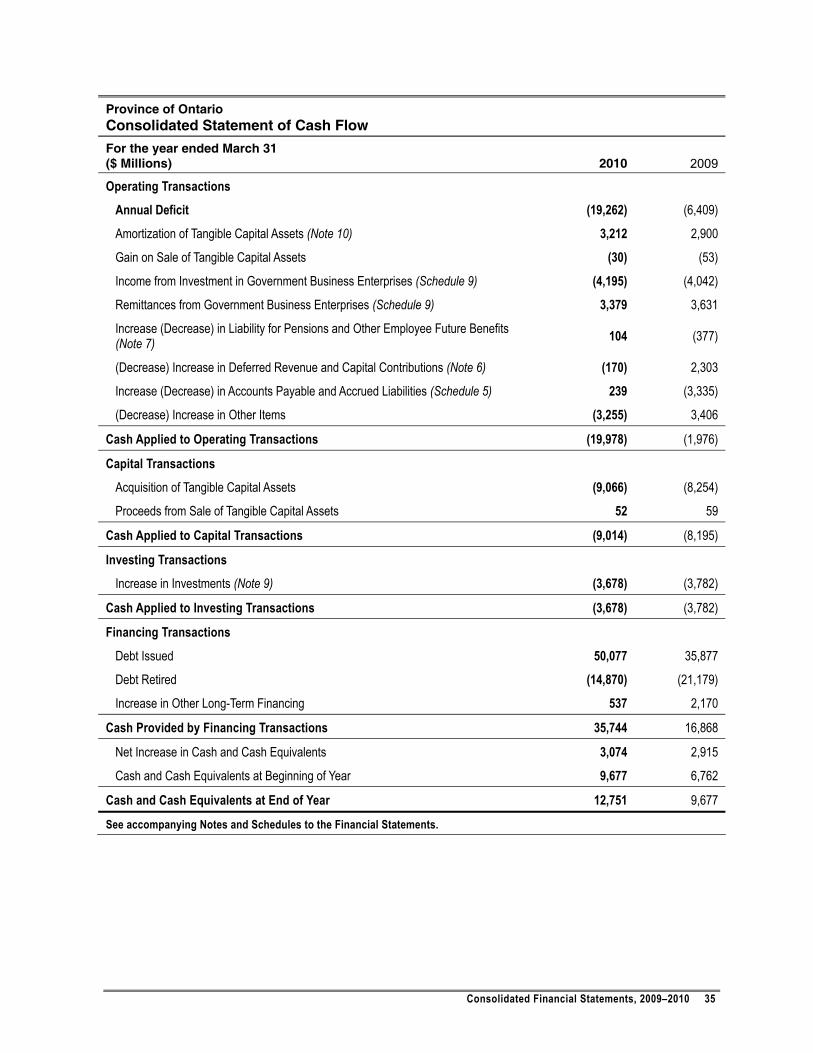
Consolidated Financial Statements, 2009–2010 35
Province of Ontario Consolidated Statement of Cash Flow
For the year ended March 31 ($ Millions) 2010 2009
Operating Transactions
Annual Deficit (19,262) (6,409)
Amortization of Tangible Capital Assets (Note 10) 3,212 2,900
Gain on Sale of Tangible Capital Assets (30) (53)
Income from Investment in Government Business Enterprises (Schedule 9) (4,195) (4,042)
Remittances from Government Business Enterprises (Schedule 9) 3,379 3,631
Increase (Decrease) in Liability for Pensions and Other Employee Future Benefits (Note 7) 104 (377)
(Decrease) Increase in Deferred Revenue and Capital Contributions (Note 6) (170) 2,303
Increase (Decrease) in Accounts Payable and Accrued Liabilities (Schedule 5) 239 (3,335)
(Decrease) Increase in Other Items (3,255) 3,406
Cash Applied to Operating Transactions (19,978) (1,976)
Capital Transactions
Acquisition of Tangible Capital Assets (9,066) (8,254)
Proceeds from Sale of Tangible Capital Assets 52 59
Cash Applied to Capital Transactions (9,014) (8,195)
Investing Transactions
Increase in Investments (Note 9) (3,678) (3,782)
Cash Applied to Investing Transactions (3,678) (3,782)
Financing Transactions
Debt Issued 50,077 35,877
Debt Retired (14,870) (21,179)
Increase in Other Long-Term Financing 537 2,170
Cash Provided by Financing Transactions 35,744 16,868
Net Increase in Cash and Cash Equivalents 3,074 2,915
Cash and Cash Equivalents at Beginning of Year 9,677 6,762
Cash and Cash Equivalents at End of Year 12,751 9,677
See accompanying Notes and Schedules to the Financial Statements.
36 Consolidated Financial Statements, 2009–2010
NOTES TO THE CONSOLIDATED FINANCIAL STATEMENTS (ALL TABLES IN MILLIONS OF DOLLARS)
1. Summary of Significant Accounting Policies
Basis of Accounting The Consolidated Financial Statements are prepared in accordance with the accounting principles for governments recommended by the Public Sector Accounting Board (PSAB) of the Canadian Institute of Chartered Accountants (CICA) and, where applicable, the recommendations of the Accounting Standards Board (AcSB) of the CICA.
Reporting Entity These financial statements report the activities of the Consolidated Revenue Fund combined with those organizations that are controlled by the Province.
Government business enterprises, broader public sector (BPS) organizations (i.e., hospitals, school boards and colleges) and other government organizations controlled by the Province are included in these financial statements. All BPS organizations are consolidated. However, other government organizations are individually consolidated if they meet one of the following criteria: i) their revenues, expenses, assets or liabilities are greater than $50 million, or ii) their outside sources of revenue, deficit or surplus are greater than $10 million. A listing of consolidated government organizations is provided in Schedule 8.
The activities of organizations that do not meet the materiality thresholds for consolidation are reflected in these financial statements through the accounts of the ministries responsible for them.
Trusts administered by the Province on behalf of other parties are excluded from the reporting entity but are disclosed in Note 14.
Principles of Consolidation Government business enterprises are defined as those government organizations that i) are separate legal entities with the power to contract in their own name and that can sue and be sued; ii) have the financial and operating authority to carry on a business; iii) have as their principal activity and source of revenue the selling of goods and services to individuals and non-government organizations; and iv) are able to maintain their operations and meet their obligations from revenues generated outside the government reporting entity. The activities of government business enterprises are recorded in the financial statements using the modified equity method. Under this method, government business enterprises are reported in accordance with the accounting principles generally accepted for business enterprises. Their combined net assets are included in the financial statements as Investment in Government Business Enterprises on the Consolidated Statement of Financial Position and their net income is shown as a separate item, Income from Investment in Government Business Enterprises, on the Consolidated Statement of Operations.
Consolidated Financial Statements, 2009–2010 37
Effective April 1, 2009, the assets and liabilities of the BPS organizations are consolidated with those of the Province on a line-by-line basis on the Consolidated Statement of Financial Position. As such, the net debt of hospitals, school boards and colleges is included in the consolidated net debt of the Province. The total annual expenses of these BPS organizations, net of revenues they receive directly from the public, such as tuition fees, patient fees, donations and other recoveries, are included with the consolidated expenses of the Province. The expenses of hospitals are included with Health expenses, school boards with Education expenses, and colleges with Post-Secondary Education and Training expenses on the Consolidated Statement of Operations. Where necessary, adjustments are made to present the accounts of these organizations on a basis consistent with the accounting policies of the Province, and to eliminate significant inter-organizational accounts and transactions.
Other government organizations are included on a line-by-line basis with the consolidated assets, liabilities, revenues and expenses of the Province. Where necessary, adjustments are also made to present the accounts of these organizations on a basis consistent with the accounting policies of the Province, and to eliminate significant inter-organizational accounts and transactions.
Measurement Uncertainty Uncertainty in the determination of the amount at which an item is recognized or disclosed in the financial statements is known as measurement uncertainty. Such uncertainty exists when there could be a material variance between the recognized or disclosed amount and another reasonably possible amount.
Measurement uncertainty in these financial statements and notes thereto exists in the valuation of pensions and other employee future benefits obligations, the value of tangible capital assets, the estimation of personal income and corporations tax revenue accruals, the valuation of the Canada Health Transfer and Canada Social Transfer entitlements, the valuation of auto sector investments and the valuation of asset-backed term notes.
Uncertainty related to pensions and other employee future benefits accruals arises because actual results may differ significantly from the Province’s best estimate of expected results (for example, the difference between actual results and actuarial assumptions regarding return on investment of pension fund assets and health care cost trend rates for retiree benefits). Uncertainty in the value of tangible capital assets exists because of differences between estimated useful lives of the assets and their actual useful lives. Uncertainty related to the accrual for personal income tax and corporations tax revenues arises due to possible subsequent revisions of estimates based on forthcoming information from past-year tax return processing. Uncertainty in the estimation of the Canada Health Transfer and Canada Social Transfer entitlements arises from variances between the estimated and actual Ontario shares of the Canada-wide personal income and corporations tax base and population. Uncertainty related to the estimated net realizable value of the investments in the auto sector arises due to the reliance on market assumptions used in the Province’s valuation of the enterprises. Actual market results may vary from these assumptions. The uncertainties relating to the valuation of the Canadian third-party asset-backed term notes are detailed in Note 9 to these financial statements.
38 Consolidated Financial Statements, 2009–2010
Estimates are based on the best information available at the time of preparation of the financial statements and are reviewed annually to reflect new information as it becomes available.
Revenues Revenues are recognized in the fiscal year that the events giving rise to the revenues occur and they are earned. Amounts received prior to the end of the year, which relate to revenues that will be earned in a subsequent fiscal year, are deferred and reported as liabilities.
Deferred capital contributions are amortized into revenue over the estimated useful life of the related tangible capital assets.
Expenses Expenses are recognized in the fiscal year that the events giving rise to the expenses occur and resources are consumed.
Transfer payments are recognized in the year during which the events giving rise to them occur, provided that the transfer is authorized, all eligibility criteria are met and a reasonable estimate of the amount can be made.
Interest on debt includes: i) interest on outstanding debt net of interest income on investments and loans; ii) amortization of foreign exchange gains or losses; iii) amortization of debt discounts, premiums and commissions; iv) amortization of deferred hedging gains and losses; and v) servicing and other costs.
Employee future benefits such as pensions, other retirement benefits and entitlements upon termination are recognized as expenses over the years in which the benefits are earned by employees. These expenses are the government’s share of the current year’s cost of benefits, interest on the net benefits liability or asset, amortization of actuarial gains or losses, cost of or gain on plan amendment, and other adjustments.
Other employee future benefits are recognized in the period when the event that obligates the government occurs or in the period when the benefits are earned and accumulated by employees.
The costs of buildings, transportation infrastructure, vehicles, aircraft, leased assets, machinery, equipment and information technology infrastructure and systems owned by the Province and its consolidated organizations are amortized and recognized as expenses over their estimated useful lives on a straight-line basis.
Liabilities Liabilities are recorded to the extent that they represent present obligations of the government to outside parties as a result of events and transactions occurring prior to the end of the fiscal year. The settlement of liabilities will result in the sacrifice of economic benefits in the future.
Liabilities include present obligations for environmental costs, probable losses on loan guarantees issued by the government, and contingencies when it is likely that a loss will be realized and the amount can be reasonably determined.
Consolidated Financial Statements, 2009–2010 39
Liabilities also include obligations to government business enterprises.
Alternative financing and procurement (AFP) refers to the Province using private-sector partners to procure and finance infrastructure assets. Assets procured via AFP are recognized as tangible capital assets and the related obligations are recognized as other long-term financing liabilities in these financial statements as the assets are constructed.
Debt Debt consists of treasury bills, commercial paper, medium- and long-term notes, savings bonds, debentures and loans.
Debt denominated in foreign currencies that has been hedged is recorded at the Canadian dollar equivalent using the rates of exchange established by the terms of the hedge agreements. Other foreign currency denominated debt, liabilities and assets are translated to Canadian dollars at year-end rates of exchange and any exchange gains or losses are amortized over the remaining term to maturity.
The Province uses derivative financial instruments (derivatives) for the purposes of minimizing interest costs and managing risk. The Province does not use derivatives for speculative purposes. Derivatives are financial contracts, the value of which is derived from underlying instruments. Gains or losses arising from derivative transactions are deferred and amortized over the remaining life of the related debt issue.
Pensions and Other Employee Future Benefits The liabilities for pensions and other employee future benefits are calculated on an actuarial basis using the government’s best estimates of future inflation rates, investment returns, employee salary levels and other underlying assumptions, and, where applicable, the government’s borrowing rate. When actual plan experience of pensions, other retirement benefits and termination pay differs from that expected, or when assumptions are revised, actuarial gains and losses arise. These gains and losses are amortized over the expected average remaining service life of plan members.
The liabilities for selected employee future benefits (such as pensions, other retirement benefits and termination pay) represent the government’s share of the actuarial present values of benefits attributed to services rendered by employees and former employees, less its share of the assets of the plans. In addition, the liability includes the Province’s share of the unamortized balance of actuarial gains or losses, and other adjustments primarily for differences between the fiscal year-end of the pension plans and that of the Province.
Assets Assets are resources controlled by the government from which it will derive future benefits. Assets are recognized in the year the events giving rise to the government’s control of the benefit occur.
40 Consolidated Financial Statements, 2009–2010
Financial Assets Financial assets are resources that can be used to discharge existing liabilities or finance future operations. They include cash and cash equivalents, investments, accounts receivable, loans receivable, advances, and investments in government business enterprises.
Investments include temporary investments, investments in the auto sector, asset-backed term notes, and portfolio investments. Temporary investments are recorded at the lower of cost or market value. Investments in the auto sector, asset-backed term notes and portfolio investments are recorded at the lower of cost or their estimated net realizable value.
Accounts receivables are recorded at cost. A valuation allowance is recorded when collection of the receivable is considered doubtful.
Loans receivable include loans to government business enterprises and loans under the student loans program, advanced manufacturing investment program, and the automotive investment strategy fund. Loans receivable with significant concessionary terms are considered in part to be grants and are recorded on the date of issuance at face value discounted by the amount of the grant portion. The grant portion is recognized as an expense at the date of issuance of the loan. The amount of the loan discount is amortized to revenue over the term of the loan.
Investment in government business enterprises represents the net assets of government business enterprises recorded on the modified equity basis as described under Principles of Consolidation.
Tangible Capital Assets Tangible capital assets are recorded at historical cost less accumulated amortization. Historical cost includes the costs directly related to the acquisition, design, construction, development, improvement or betterment of tangible capital assets. Cost includes overheads directly attributable to construction and development, as well as interest related to financing during construction. Estimated historical cost was used to record existing tangible capital assets if actual cost was unknown when the Province first implemented tangible capital assets accounting. Tangible capital assets, except land, are amortized over the estimated useful lives of the assets on a straight-line basis.
The following categories are included under tangible capital assets: land, buildings, transportation infrastructure, vehicles, aircraft, leased assets, machinery, equipment and information technology infrastructure and systems, and construction in progress.
Maintenance and repair costs are recognized as an expense when incurred. Betterments or improvements that significantly increase or prolong the service life or capacity of a tangible capital asset are capitalized. External contributions for acquisition of tangible capital assets are recorded as deferred capital contributions and amortized to revenue consistent with the amortization to expense of the related tangible capital assets.
Future Changes in Accounting Standards In December 2009, PSAB confirmed that government business enterprises will be required to adopt International Financial Reporting Standards (IFRS) in fiscal years beginning on or after
Consolidated Financial Statements, 2009–2010 41
January 1, 2011. On July 28, 2010, the CICA issued an Exposure Draft proposing that qualifying entities with rate-regulated activities be permitted to defer the adoption of IFRS until January 1, 2013. The Province’s Consolidated Financial Statements will be affected by these changes to the extent that government business enterprises are impacted.
Other consolidated government organizations may also be impacted by PSAB’s recent proposals for Government Not-for-Profit Organizations that could impact the basis upon which these entities report. The Ministry of Finance continues to assess these proposals and has initiated a process to consult with the potentially impacted public-sector organizations. The final PSAB standard and the result of the consultations may result in changes to the classification and basis of reporting for some government organizations and enterprises in future periods.
The potential future impact on the Province’s Consolidated Financial Statements of these proposed future changes in accounting standards is not reasonably determinable at this time.
2. Accounting and Financial Presentation Changes These financial statements reflect the following changes in accounting policies and financial statement presentation:
Accounting Policy Changes
Minor Tangible Capital Assets During fiscal year 2009–10, the Province extended its accounting policy for tangible capital assets in accordance with PSAB standards to include building leasehold improvements, assets acquired through capital leases, vehicles, aircraft and information technology infrastructure and systems.
Starting in the 2009–10 fiscal year, the costs of assets acquired in these classifications are being capitalized and amortized over their estimated useful lives. Previously these items were expensed in their year of acquisition.
Except for the tangible capital assets in these classifications for school boards, these items are being capitalized on a prospective basis as the information necessary to restate opening balances is not readily available.
At March 31, 2009, the net book value of the minor tangible capital assets of the school board sector was $404 million and the net book value of their leased assets was $49 million. The revised accounting policy as discussed above has been implemented retroactively as the information necessary to restate was available. The net impact of the restatement was to decrease the Province’s Accumulated Deficit at April 1, 2009 by $453 million with a corresponding increase in tangible capital assets.
The impact of the accounting policy change was a decrease in total expenses and the 2009–10 Annual Deficit of $215 million.
42 Consolidated Financial Statements, 2009–2010
Interest Capitalization on Constructed Assets Effective April 1, 2009, interest relating to the financing of the construction of tangible capital assets owned by the Province is being capitalized consistent with the accounting practice of consolidated BPS organizations.
The net impact of the accounting policy change was to decrease interest on debt expense and the 2009–10 Annual Deficit by $148 million.
Financial Statement Presentation Changes
Broader Public Sector Presentation In accordance with PSAB, effective fiscal 2005–06, the Province’s reporting entity was expanded to include public hospitals, school boards, and colleges, collectively referred to as BPS organizations. As permitted under PSAB standards, these BPS organizations were consolidated in the Province’s financial statements on a one-line equity basis of accounting until March 31, 2009. Effective April 1, 2009, the BPS organizations are being consolidated in the Province’s financial statements on a line-by-line basis as described in Note 1.
With this change in presentation, the consolidated net debt of the Province as at April 1, 2009 was increased by $16.3 billion. There is no impact on the Province’s annual deficit or accumulated deficit as a result of adoption of this financial presentation change.
The comparative results from the 2008–09 fiscal year have been restated to reflect the revised financial presentation.
Education Property Tax In prior years, Education Property Tax revenue was netted against Education Expenses consistent with the one-line basis of presenting consolidated BPS expenses of school boards described above. Effective April 1, 2009, with the change in presentation of consolidated BPS organizations described in Note 1, Education Property Tax revenue is no longer being netted against school board expenses but shown separately in revenue. This change results in an increase in total Revenues of $6.5 billion (2008–09, $6.5 billion). Education Property Tax revenue increased by $5.6 billion (2008–09, $5.7 billion) and Personal Income Tax revenue by $912 million (2008–09, $765 million) reflecting the reclassification of refundable property tax credits from Personal Income Tax consistent with PSAB’s recommended presentation. The related increase in Education Expenses is $6.5 billion (2008–09, $6.5 billion). There is no impact on the Province’s annual deficit or accumulated deficit as a result of adoption of this financial presentation change.
Consolidated Financial Statements, 2009–2010 43
3. Debt The Province borrows in both domestic and international markets. Debt of $212.1 billion, as at March 31, 2010 (2009, $176.9 billion), is composed mainly of bonds and debentures issued in both the short- and long-term public capital markets and non-public debt held by certain federal and provincial public-sector pension funds. Debt comprises Debt Issued for Provincial Purposes of $184.7 billion (2009, $149.2 billion) and Ontario Electricity Financial Corporation (OEFC) Debt of $27.4 billion (2009, $27.7 billion). The following table presents the maturity schedule of the Province’s outstanding debt, by currency of repayment, expressed in Canadian dollars, and reflects the effects of related derivative contracts.
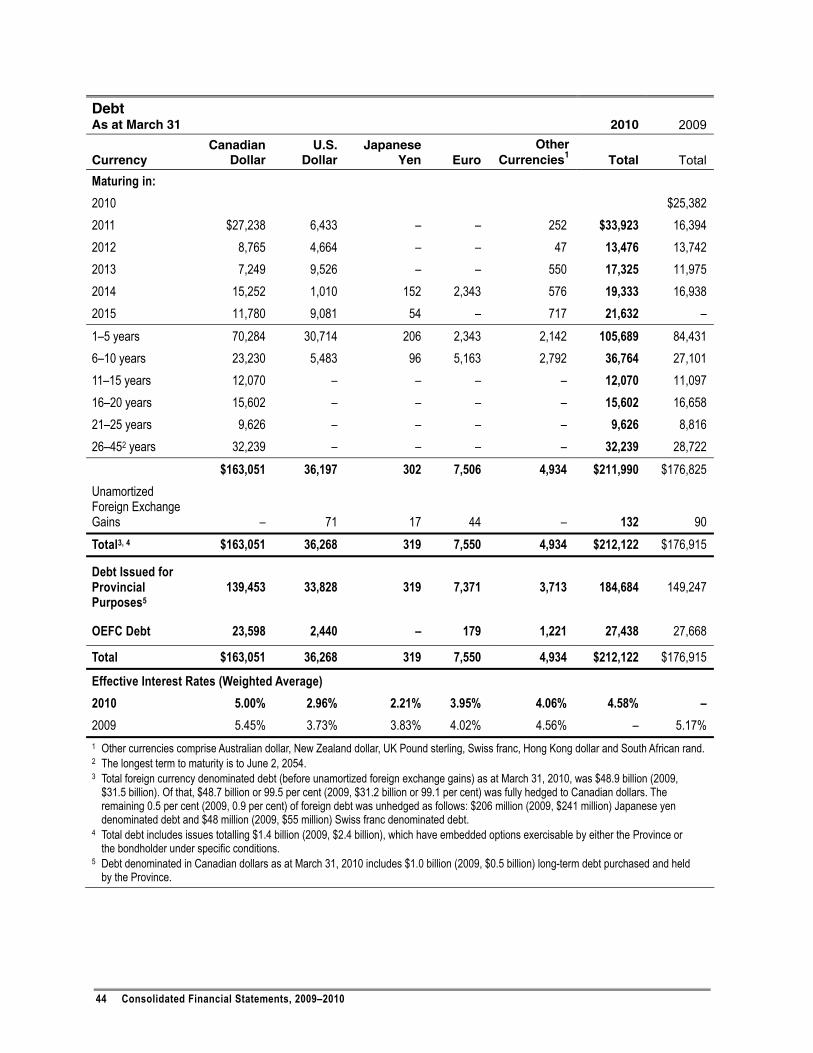
44 Consolidated Financial Statements, 2009–2010
Debt As at March 31 2010 2009
Currency Canadian
Dollar U.S.
Dollar Japanese
Yen Euro Other
Currencies1 Total Total
Maturing in: 2010 $25,382 2011 $27,238 6,433 – – 252 $33,923 16,394 2012 8,765 4,664 – – 47 13,476 13,742 2013 7,249 9,526 – – 550 17,325 11,975 2014 15,252 1,010 152 2,343 576 19,333 16,938 2015 11,780 9,081 54 – 717 21,632 – 1–5 years 70,284 30,714 206 2,343 2,142 105,689 84,431 6–10 years 23,230 5,483 96 5,163 2,792 36,764 27,101 11–15 years 12,070 – – – – 12,070 11,097 16–20 years 15,602 – – – – 15,602 16,658 21–25 years 9,626 – – – – 9,626 8,816 26–452 years 32,239 – – – – 32,239 28,722 $163,051 36,197 302 7,506 4,934 $211,990 $176,825 Unamortized Foreign Exchange Gains – 71 17 44 – 132 90 Total3, 4 $163,051 36,268 319 7,550 4,934 $212,122 $176,915
Debt Issued for Provincial Purposes5
139,453 33,828 319 7,371 3,713 184,684 149,247
OEFC Debt 23,598 2,440 – 179 1,221 27,438 27,668
Total $163,051 36,268 319 7,550 4,934 $212,122 $176,915
Effective Interest Rates (Weighted Average) 2010 5.00% 2.96% 2.21% 3.95% 4.06% 4.58% – 2009 5.45% 3.73% 3.83% 4.02% 4.56% – 5.17% 1 Other currencies comprise Australian dollar, New Zealand dollar, UK Pound sterling, Swiss franc, Hong Kong dollar and South African rand. 2 The longest term to maturity is to June 2, 2054. 3 Total foreign currency denominated debt (before unamortized foreign exchange gains) as at March 31, 2010, was $48.9 billion (2009,
$31.5 billion). Of that, $48.7 billion or 99.5 per cent (2009, $31.2 billion or 99.1 per cent) was fully hedged to Canadian dollars. The remaining 0.5 per cent (2009, 0.9 per cent) of foreign debt was unhedged as follows: $206 million (2009, $241 million) Japanese yen denominated debt and $48 million (2009, $55 million) Swiss franc denominated debt.
4 Total debt includes issues totalling $1.4 billion (2009, $2.4 billion), which have embedded options exercisable by either the Province or the bondholder under specific conditions.
5 Debt denominated in Canadian dollars as at March 31, 2010 includes $1.0 billion (2009, $0.5 billion) long-term debt purchased and held by the Province.
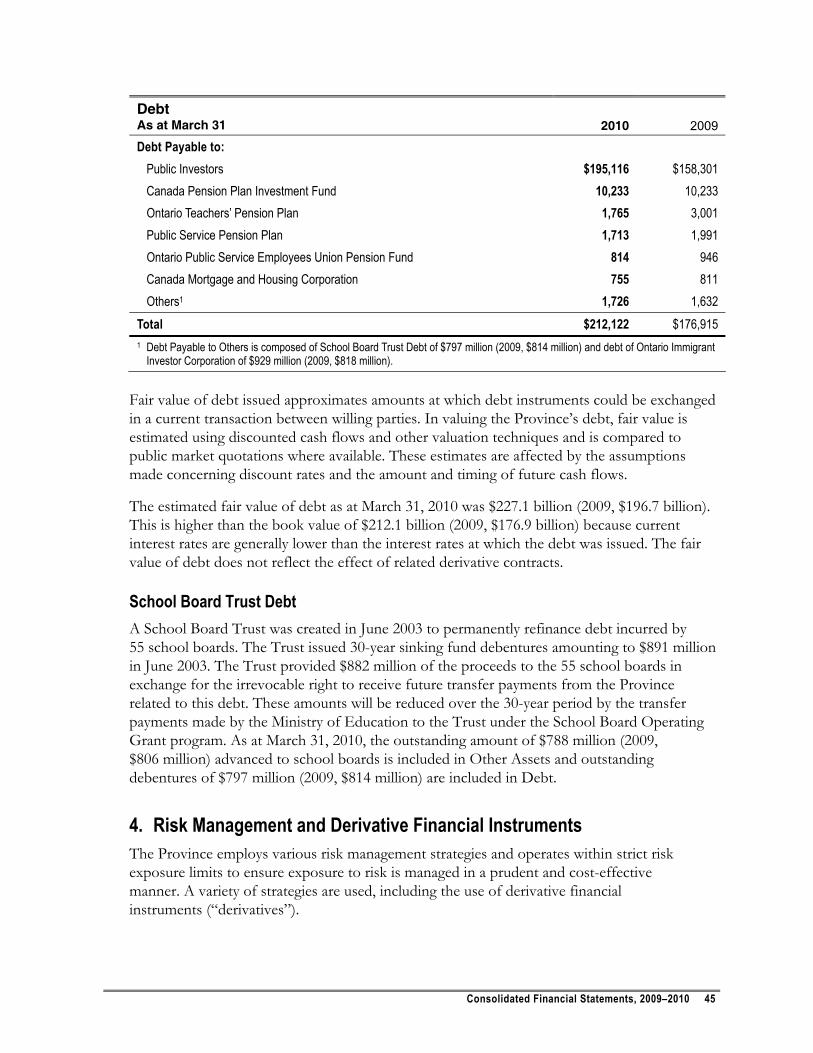
Consolidated Financial Statements, 2009–2010 45
Debt As at March 31 2010 2009
Debt Payable to: Public Investors $195,116 $158,301 Canada Pension Plan Investment Fund 10,233 10,233 Ontario Teachers’ Pension Plan 1,765 3,001 Public Service Pension Plan 1,713 1,991 Ontario Public Service Employees Union Pension Fund 814 946 Canada Mortgage and Housing Corporation 755 811 Others1 1,726 1,632
Total $212,122 $176,915 1 Debt Payable to Others is composed of School Board Trust Debt of $797 million (2009, $814 million) and debt of Ontario Immigrant
Investor Corporation of $929 million (2009, $818 million).
Fair value of debt issued approximates amounts at which debt instruments could be exchanged in a current transaction between willing parties. In valuing the Province’s debt, fair value is estimated using discounted cash flows and other valuation techniques and is compared to public market quotations where available. These estimates are affected by the assumptions made concerning discount rates and the amount and timing of future cash flows.
The estimated fair value of debt as at March 31, 2010 was $227.1 billion (2009, $196.7 billion). This is higher than the book value of $212.1 billion (2009, $176.9 billion) because current interest rates are generally lower than the interest rates at which the debt was issued. The fair value of debt does not reflect the effect of related derivative contracts.
School Board Trust Debt A School Board Trust was created in June 2003 to permanently refinance debt incurred by 55 school boards. The Trust issued 30-year sinking fund debentures amounting to $891 million in June 2003. The Trust provided $882 million of the proceeds to the 55 school boards in exchange for the irrevocable right to receive future transfer payments from the Province related to this debt. These amounts will be reduced over the 30-year period by the transfer payments made by the Ministry of Education to the Trust under the School Board Operating Grant program. As at March 31, 2010, the outstanding amount of $788 million (2009, $806 million) advanced to school boards is included in Other Assets and outstanding debentures of $797 million (2009, $814 million) are included in Debt.
4. Risk Management and Derivative Financial Instruments The Province employs various risk management strategies and operates within strict risk exposure limits to ensure exposure to risk is managed in a prudent and cost-effective manner. A variety of strategies are used, including the use of derivative financial instruments (“derivatives”).
46 Consolidated Financial Statements, 2009–2010
Derivatives are financial contracts, the value of which is derived from underlying instruments. The Province uses derivatives to hedge and to minimize interest costs. Hedges are created primarily through swaps, which are legal contracts under which the Province agrees with another party to exchange cash flows based on one or more notional amounts using stipulated reference interest rates for a specified period. Swaps allow the Province to offset its existing obligations and thereby effectively convert them into obligations with more desirable characteristics. Other derivative instruments used by the Province include forward foreign exchange contracts, forward rate agreements, futures, options, caps and floors.
Foreign exchange or currency risk is the risk that foreign currency debt principal and interest payments and foreign currency transactions will vary in Canadian dollar terms due to fluctuations in foreign exchange rates. To manage currency risk, the Province uses derivative contracts including foreign exchange forward contracts, futures, options and swaps to convert foreign currency cash flows into Canadian dollar denominated cash flows. Most of the derivative contracts hedge the underlying debt by matching all the critical terms to achieve effectiveness. In the instances where the term of foreign exchange forward contracts used for hedging is shorter than the term of the underlying debt, the effectiveness is maintained by continuously rolling the foreign exchange forward contract over the remaining term of the underlying debt, or until replaced with a long-term derivative contract.
The current policy allows the amount of unhedged foreign currency debt principal net of foreign currency holdings to reach a maximum of 5 per cent of Debt Issued for Provincial Purposes and OEFC Debt. At March 31, 2010, the respective unhedged levels were 0.1 and nil per cent (2009, 0.2 and nil per cent). The Province’s unhedged level of 0.1 per cent was primarily related to Japanese yen denominated debt. For every one Japanese yen decrease versus the Canadian dollar, there would be an increase in debt of $2.3 million (2009, $3.1 million) and an increase in Interest on Debt of $0.6 million (2009, $0.9 million). Total foreign exchange gains recognized in the Statement of Operations for 2009–10 were $30 million (2008–09, $67 million).
Interest on Debt expense may also vary as a result of changes in interest rates. In respect of Debt Issued for Provincial Purposes and OEFC Debt, the risk is measured as interest rate resetting risk, which is the net of floating rate exposure, liquid reserves and fixed-rate debt maturing within the next 12-month period as a percentage of Debt Issued for Provincial Purposes and OEFC Debt respectively. Depending on market conditions, the Province creates or reduces its exposure to interest rate changes by issuing or retiring short-term debt, or by entering into or closing out derivative positions. The current policy limits interest rate resetting risk for Debt Issued for Provincial Purposes and OEFC Debt to a maximum of 35 per cent.
As at March 31, 2010, interest rate resetting risk for Debt Issued for Provincial Purposes and OEFC Debt was 11.4 per cent and 16.4 per cent respectively (2009, 11.5 per cent and 19.5 per cent). Based on floating rate interest-bearing financial instruments on hand at the balance sheet date plus planned refinancing of maturing debt in the coming year, a one per cent (100 basis points) increase in interest rates would result in an increase in Interest on Debt of $240 million (2009, $230 million).
Liquidity risk is the risk that the Province will not be able to meet its current short-term financial obligations. To reduce liquidity risk, the Province maintains liquid reserves, that is,
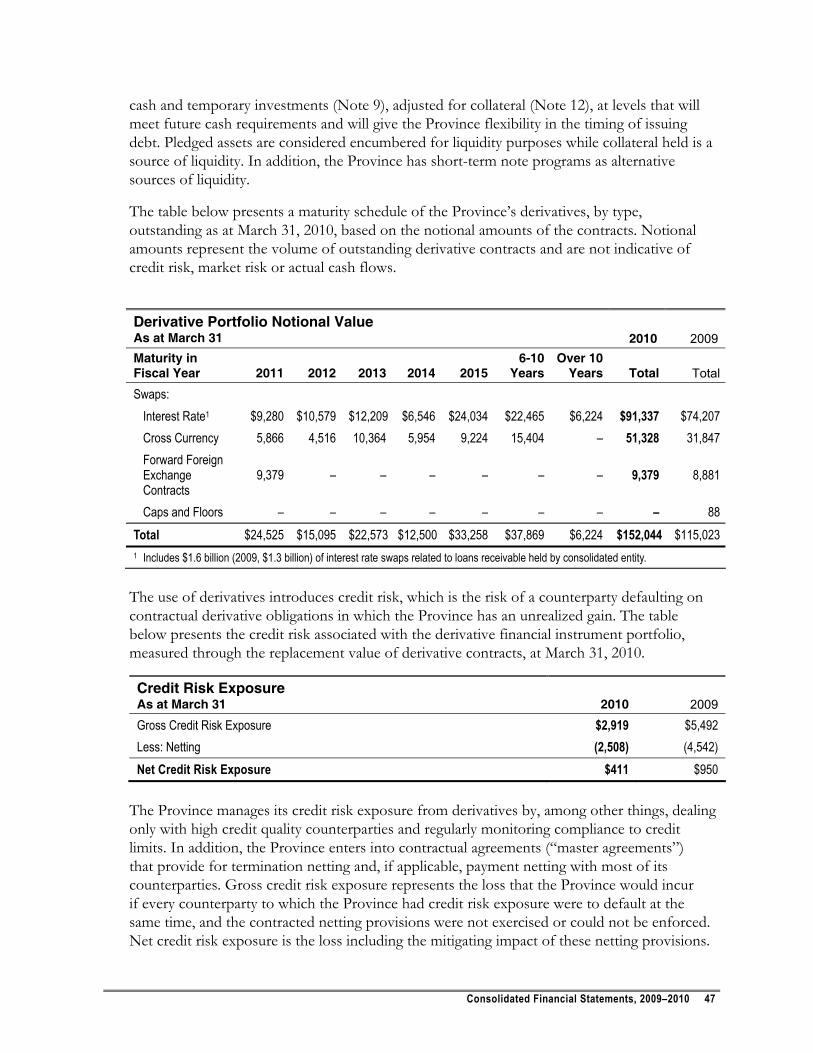
Consolidated Financial Statements, 2009–2010 47
cash and temporary investments (Note 9), adjusted for collateral (Note 12), at levels that will meet future cash requirements and will give the Province flexibility in the timing of issuing debt. Pledged assets are considered encumbered for liquidity purposes while collateral held is a source of liquidity. In addition, the Province has short-term note programs as alternative sources of liquidity.
The table below presents a maturity schedule of the Province’s derivatives, by type, outstanding as at March 31, 2010, based on the notional amounts of the contracts. Notional amounts represent the volume of outstanding derivative contracts and are not indicative of credit risk, market risk or actual cash flows.
Derivative Portfolio Notional Value As at March 31 2010 2009 Maturity in Fiscal Year 2011 2012 2013 2014 2015
6-10 Years
Over 10 Years Total Total
Swaps: Interest Rate1 $9,280 $10,579 $12,209 $6,546 $24,034 $22,465 $6,224 $91,337 $74,207 Cross Currency 5,866 4,516 10,364 5,954 9,224 15,404 – 51,328 31,847 Forward Foreign Exchange Contracts
9,379 – – – – – – 9,379 8,881
Caps and Floors – – – – – – – – 88 Total $24,525 $15,095 $22,573 $12,500 $33,258 $37,869 $6,224 $152,044 $115,023 1 Includes $1.6 billion (2009, $1.3 billion) of interest rate swaps related to loans receivable held by consolidated entity.
The use of derivatives introduces credit risk, which is the risk of a counterparty defaulting on contractual derivative obligations in which the Province has an unrealized gain. The table below presents the credit risk associated with the derivative financial instrument portfolio, measured through the replacement value of derivative contracts, at March 31, 2010.
Credit Risk Exposure As at March 31 2010 2009
Gross Credit Risk Exposure $2,919 $5,492 Less: Netting (2,508) (4,542) Net Credit Risk Exposure $411 $950
The Province manages its credit risk exposure from derivatives by, among other things, dealing only with high credit quality counterparties and regularly monitoring compliance to credit limits. In addition, the Province enters into contractual agreements (“master agreements”) that provide for termination netting and, if applicable, payment netting with most of its counterparties. Gross credit risk exposure represents the loss that the Province would incur if every counterparty to which the Province had credit risk exposure were to default at the same time, and the contracted netting provisions were not exercised or could not be enforced. Net credit risk exposure is the loss including the mitigating impact of these netting provisions.
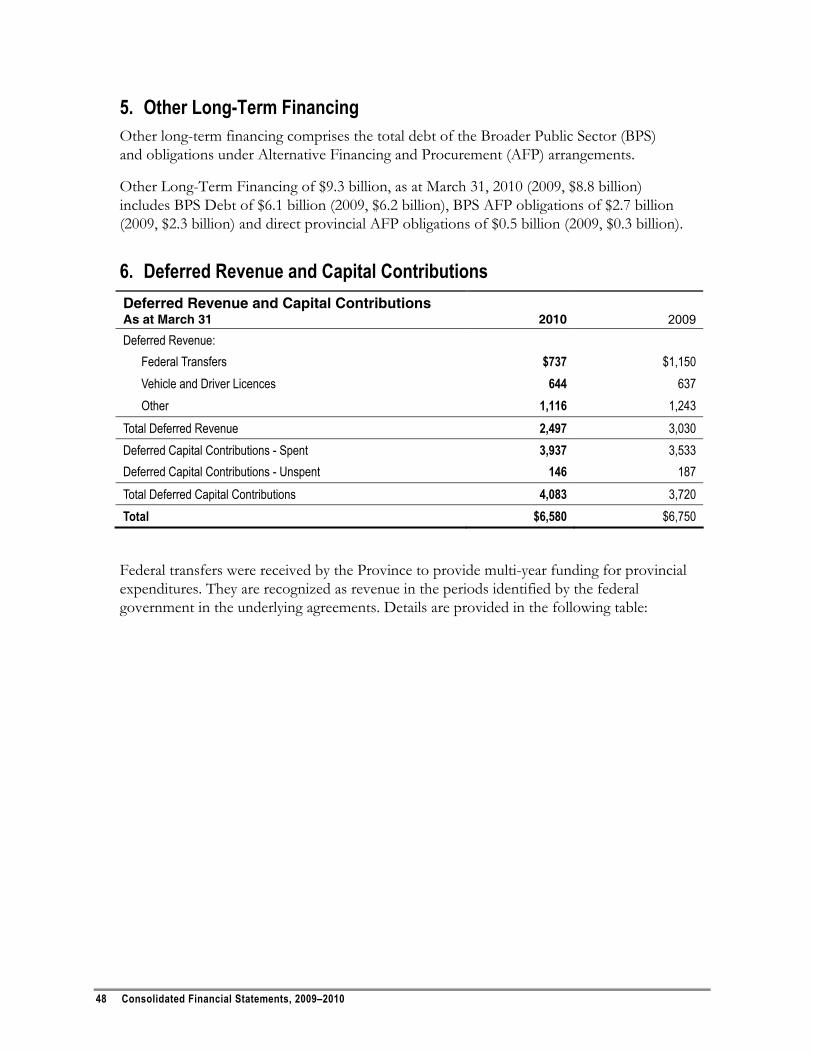
48 Consolidated Financial Statements, 2009–2010
5. Other Long-Term Financing Other long-term financing comprises the total debt of the Broader Public Sector (BPS) and obligations under Alternative Financing and Procurement (AFP) arrangements.
Other Long-Term Financing of $9.3 billion, as at March 31, 2010 (2009, $8.8 billion) includes BPS Debt of $6.1 billion (2009, $6.2 billion), BPS AFP obligations of $2.7 billion (2009, $2.3 billion) and direct provincial AFP obligations of $0.5 billion (2009, $0.3 billion).
6. Deferred Revenue and Capital Contributions Deferred Revenue and Capital Contributions As at March 31 2010 2009
Deferred Revenue: Federal Transfers $737 $1,150 Vehicle and Driver Licences 644 637 Other 1,116 1,243 Total Deferred Revenue 2,497 3,030 Deferred Capital Contributions - Spent 3,937 3,533 Deferred Capital Contributions - Unspent 146 187 Total Deferred Capital Contributions 4,083 3,720 Total $6,580 $6,750
Federal transfers were received by the Province to provide multi-year funding for provincial expenditures. They are recognized as revenue in the periods identified by the federal government in the underlying agreements. Details are provided in the following table:
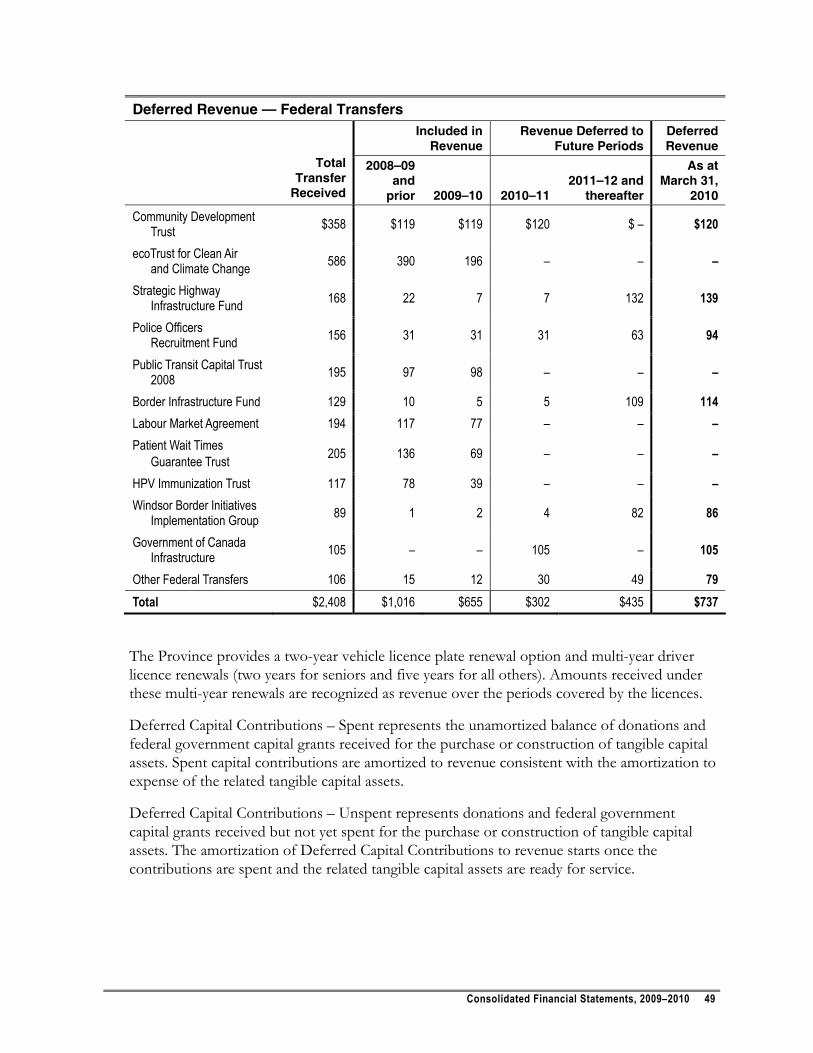
Consolidated Financial Statements, 2009–2010 49
Deferred Revenue — Federal Transfers
Included in
Revenue Revenue Deferred to
Future Periods Deferred Revenue
Total
Transfer Received
2008–09 and
prior 2009–10 2010–11 2011–12 and
thereafter
As at March 31,
2010
Community Development Trust $358 $119 $119 $120 $ – $120
ecoTrust for Clean Air and Climate Change 586 390 196 – – –
Strategic Highway Infrastructure Fund 168 22 7 7 132 139
Police Officers Recruitment Fund 156 31 31 31 63 94
Public Transit Capital Trust 2008 195 97 98 – – –
Border Infrastructure Fund 129 10 5 5 109 114 Labour Market Agreement 194 117 77 – – – Patient Wait Times
Guarantee Trust 205 136 69 – – –
HPV Immunization Trust 117 78 39 – – – Windsor Border Initiatives
Implementation Group 89 1 2 4 82 86
Government of Canada Infrastructure 105 – – 105 – 105
Other Federal Transfers 106 15 12 30 49 79 Total $2,408 $1,016 $655 $302 $435 $737
The Province provides a two-year vehicle licence plate renewal option and multi-year driver licence renewals (two years for seniors and five years for all others). Amounts received under these multi-year renewals are recognized as revenue over the periods covered by the licences.
Deferred Capital Contributions – Spent represents the unamortized balance of donations and federal government capital grants received for the purchase or construction of tangible capital assets. Spent capital contributions are amortized to revenue consistent with the amortization to expense of the related tangible capital assets.
Deferred Capital Contributions – Unspent represents donations and federal government capital grants received but not yet spent for the purchase or construction of tangible capital assets. The amortization of Deferred Capital Contributions to revenue starts once the contributions are spent and the related tangible capital assets are ready for service.
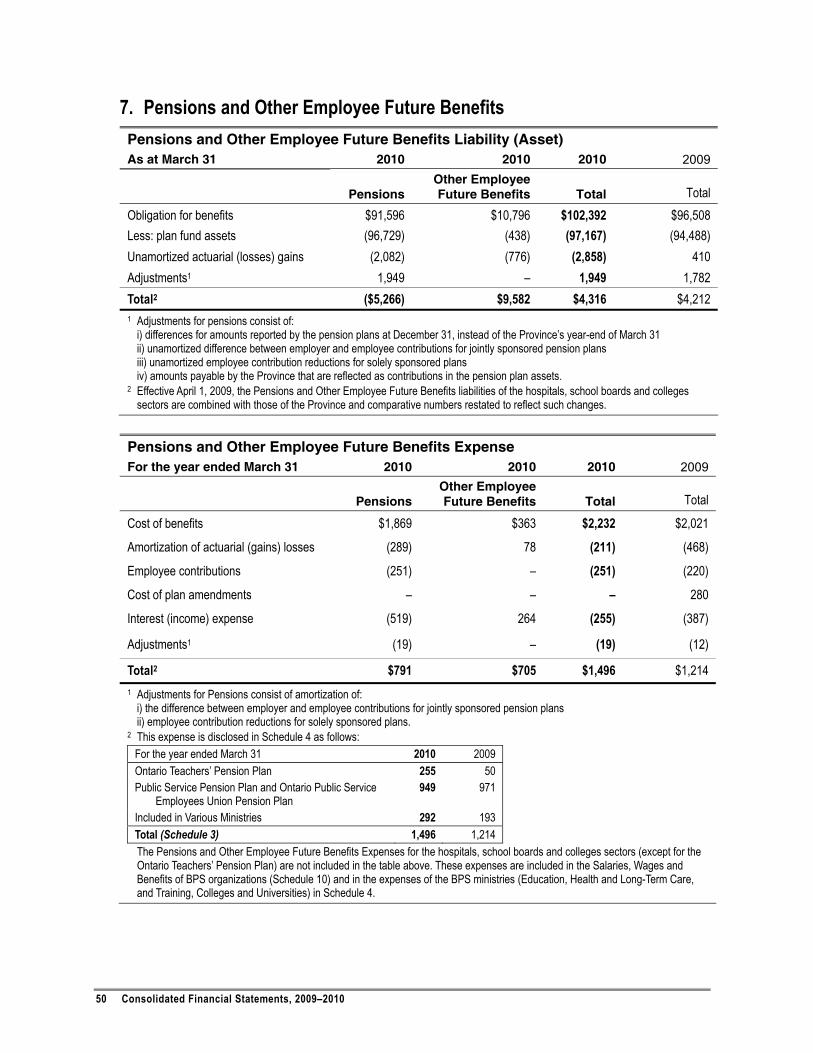
50 Consolidated Financial Statements, 2009–2010
7. Pensions and Other Employee Future Benefits Pensions and Other Employee Future Benefits Liability (Asset) As at March 31 2010 2010 2010 2009
Pensions Other Employee Future Benefits Total Total
Obligation for benefits $91,596 $10,796 $102,392 $96,508 Less: plan fund assets (96,729) (438) (97,167) (94,488) Unamortized actuarial (losses) gains (2,082) (776) (2,858) 410 Adjustments1 1,949 – 1,949 1,782 Total2 ($5,266) $9,582 $4,316 $4,212 1 Adjustments for pensions consist of:
i) differences for amounts reported by the pension plans at December 31, instead of the Province’s year-end of March 31 ii) unamortized difference between employer and employee contributions for jointly sponsored pension plans iii) unamortized employee contribution reductions for solely sponsored plans iv) amounts payable by the Province that are reflected as contributions in the pension plan assets.
2 Effective April 1, 2009, the Pensions and Other Employee Future Benefits liabilities of the hospitals, school boards and colleges sectors are combined with those of the Province and comparative numbers restated to reflect such changes.
Pensions and Other Employee Future Benefits Expense For the year ended March 31 2010 2010 2010 2009
Pensions Other Employee Future Benefits Total Total
Cost of benefits $1,869 $363 $2,232 $2,021
Amortization of actuarial (gains) losses (289) 78 (211) (468)
Employee contributions (251) – (251) (220)
Cost of plan amendments – – – 280
Interest (income) expense (519) 264 (255) (387)
Adjustments1 (19) – (19) (12)
Total2 $791 $705 $1,496 $1,214 1 Adjustments for Pensions consist of amortization of:
i) the difference between employer and employee contributions for jointly sponsored pension plans ii) employee contribution reductions for solely sponsored plans.
2 This expense is disclosed in Schedule 4 as follows: For the year ended March 31 2010 2009 Ontario Teachers’ Pension Plan 255 50 Public Service Pension Plan and Ontario Public Service
Employees Union Pension Plan 949 971
Included in Various Ministries 292 193 Total (Schedule 3) 1,496 1,214
The Pensions and Other Employee Future Benefits Expenses for the hospitals, school boards and colleges sectors (except for the Ontario Teachers’ Pension Plan) are not included in the table above. These expenses are included in the Salaries, Wages and Benefits of BPS organizations (Schedule 10) and in the expenses of the BPS ministries (Education, Health and Long-Term Care, and Training, Colleges and Universities) in Schedule 4.
Consolidated Financial Statements, 2009–2010 51
Pensions The Province sponsors several pension plans. It is the sole sponsor of the Public Service Pension Plan (PSPP) and joint sponsor of the Ontario Public Service Employees Union (OPSEU) Pension Plan and the Ontario Teachers’ Pension Plan (OTPP).
These three plans are contributory defined benefit plans that provide Ontario government employees and elementary and secondary school teachers and administrators with a guaranteed amount of retirement income. Benefits are based primarily on the best five-year average salary of members and their length of service, and are indexed to changes in the Consumer Price Index to provide protection against inflation. Plan members normally contribute seven to eleven per cent of their salaries to these plans. The Province matches these contributions.
Funding of these plans is based on statutory actuarial funding valuations undertaken at least once every three years. The Province contributed $1,246 million to OTPP in 2009–10 (2008–09, $1,073 million), $240 million (including a $4 million special payment) to PSPP (2008–09, $227 million including a $4 million special payment) and $157 million to OPSEU Pension Plan (2008–09, $157 million). During calendar year 2009, OTPP paid benefits, including transfers to other plans, of $4.4 billion (2008, $4.2 billion), PSPP paid $914 million (2008, $881 million) and OPSEU Pension Plan paid $718 million (2008, $590 million). Under agreements between the Province and OPSEU, and between the Province and the Ontario Teachers’ Federation (OTF), gains and losses arising from statutory actuarial funding valuations are shared by the co-sponsors.
The government’s best estimate of the long-term annual inflation rate used in the pension and other employee future benefits calculations disclosed in these financial statements is 2.5 per cent; the salary escalation rate is 3.5 per cent; and the discount rate and expected rate of return on pension plan assets are 6.75 per cent for OTPP, 6.5 per cent for PSPP and 6.75 per cent for OPSEU Pension Plan. Actuarial gains or losses are amortized over periods of 11.4 to 14 years.
The Province is also responsible for sponsoring the Ontario Teachers’ Retirement Compensation Arrangement and the Public Service Supplementary Benefits Plan. Expenses and liabilities of these plans are included in the Pensions Expense and Pensions Liability reported in the above tables.
Pension benefits for employees in the hospital and colleges sectors are provided by the Healthcare of Ontario Pension Plan (HOOPP) and the Colleges of Applied Arts and Technology Pension Plan (CAATPP).
HOOPP is a multi-employer pension plan covering employees of Ontario’s healthcare community. CAATPP is a multi-employer pension plan covering employees of the Colleges of Applied Arts and Technology in Ontario, the Board of Trustees, the Ontario College Application Services and, effective December 1, 2009, the Ontario College Library Services. Both of these plans are contributory defined benefit plans that provide eligible members with a retirement income based on a formula that takes into account a member’s earnings history and length of service in the plan. The plans are financed by contributions from participating members and employers, and by investment earnings.
52 Consolidated Financial Statements, 2009–2010
Expenses for HOOPP of $956 million (2008–09, $853 million) and CAATPP of $153 million (2008–09, $94 million) are included in the Salaries, Wages and Benefits expenses of the hospital and colleges sectors respectively (Schedule 10) and in the expenses of the related ministries (Schedule 4). The related liabilities are included in the Pensions and Other Employee Future Benefits liability on the Consolidated Statement of Financial Position.
Other Employee Future Benefits Other Employee Future Benefits are non-pension retirement benefits, post-employment benefits, compensated absences and termination benefits.
Non-Pension Retirement Benefits The Province provides dental, basic life insurance, supplementary health and hospital benefits to retired employees through a self-insured, unfunded defined benefit plan. The liability for non-pension retirement benefits of $7.3 billion as at March 31, 2010 (2009, $6.7 billion) is included in the Other Employee Future Benefits Liability. The expense for 2009–10 of $413 million (2008–09, $650 million) (excluding the expense for BPS sector organizations) is included in the Other Employee Future Benefits Expense. The BPS sector expense of $168 million in 2009–10 (2008–09, $205 million) is included in the Salaries, Wages and Benefits expense of BPS organizations (Schedule 10) and in the expenses of the related ministries (Schedule 4).
The discount rate used in the non-pension retirement benefits calculation for 2009–10 is 5.3 per cent (2008–09, 5.1 per cent).
Post-Employment Benefits, Compensated Absences and Termination Benefits The Province provides, on a self-insured basis, workers’ compensation benefits, long-term disability benefits and regular benefits to employees who are on long-term disability. For employees who have completed five years of service, the Province provides termination pay equal to one week’s salary for each year of service up to a maximum of 50 per cent of their annual salary. Employees who have completed one year of service but less than five years are also entitled to termination pay in the event of death, retirement or release from employment. The total post-employment benefits liability of $2.3 billion as at March 31, 2010 (2009, $2.1 billion) is included in the Other Employee Future Benefits Liability. The total post-employment benefits expense for 2009–10 of $292 million (2008–09, $193 million) (excluding the expense for BPS sector organizations) is included in the Other Employee Future Benefits Expense. The BPS sector total post-employment benefits expense of $386 million for 2009–10 (2008–09, $346 million) is included in the Salaries, Wages and Benefits expense of BPS organizations (Schedule 10) and in the expenses of the related ministries (Schedule 4).
The discount rate used in the post-employment benefits, compensated absences and termination benefits calculations for 2009–10 is 4.80 per cent (2008–09, 4.95 per cent).
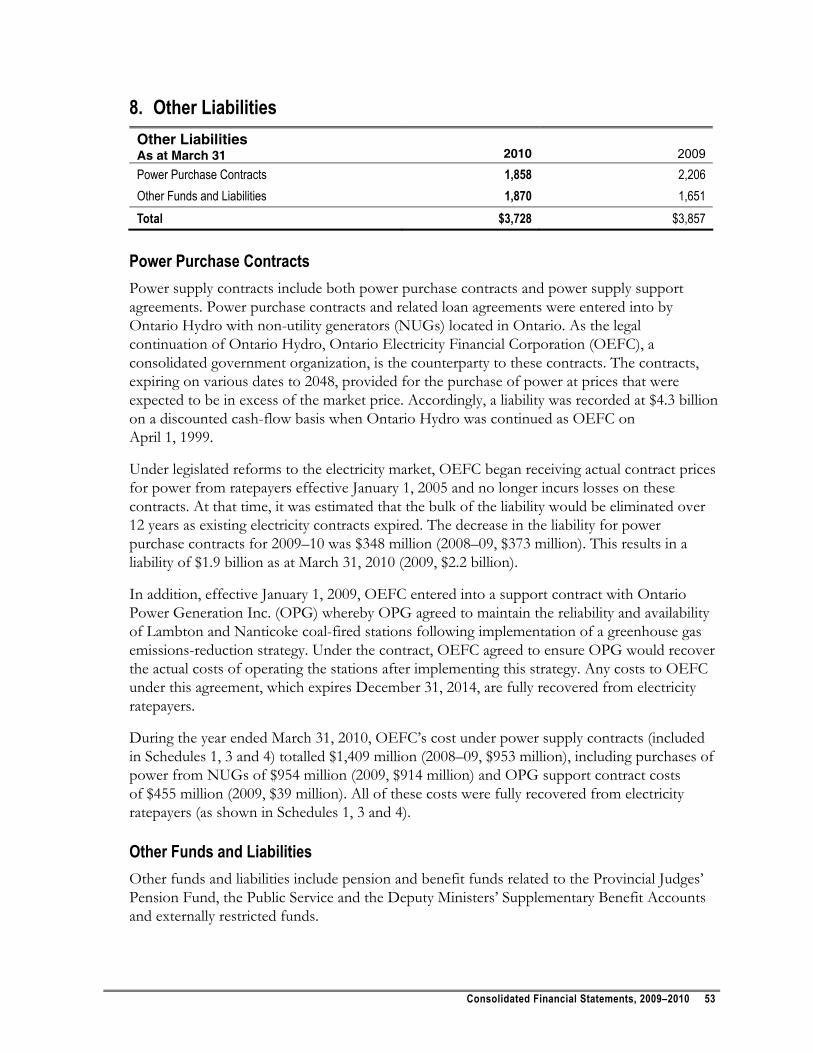
Consolidated Financial Statements, 2009–2010 53
8. Other Liabilities Other Liabilities As at March 31 2010 2009
Power Purchase Contracts 1,858 2,206 Other Funds and Liabilities 1,870 1,651 Total $3,728 $3,857
Power Purchase Contracts Power supply contracts include both power purchase contracts and power supply support agreements. Power purchase contracts and related loan agreements were entered into by Ontario Hydro with non-utility generators (NUGs) located in Ontario. As the legal continuation of Ontario Hydro, Ontario Electricity Financial Corporation (OEFC), a consolidated government organization, is the counterparty to these contracts. The contracts, expiring on various dates to 2048, provided for the purchase of power at prices that were expected to be in excess of the market price. Accordingly, a liability was recorded at $4.3 billion on a discounted cash-flow basis when Ontario Hydro was continued as OEFC on April 1, 1999.
Under legislated reforms to the electricity market, OEFC began receiving actual contract prices for power from ratepayers effective January 1, 2005 and no longer incurs losses on these contracts. At that time, it was estimated that the bulk of the liability would be eliminated over 12 years as existing electricity contracts expired. The decrease in the liability for power purchase contracts for 2009–10 was $348 million (2008–09, $373 million). This results in a liability of $1.9 billion as at March 31, 2010 (2009, $2.2 billion).
In addition, effective January 1, 2009, OEFC entered into a support contract with Ontario Power Generation Inc. (OPG) whereby OPG agreed to maintain the reliability and availability of Lambton and Nanticoke coal-fired stations following implementation of a greenhouse gas emissions-reduction strategy. Under the contract, OEFC agreed to ensure OPG would recover the actual costs of operating the stations after implementing this strategy. Any costs to OEFC under this agreement, which expires December 31, 2014, are fully recovered from electricity ratepayers.
During the year ended March 31, 2010, OEFC’s cost under power supply contracts (included in Schedules 1, 3 and 4) totalled $1,409 million (2008–09, $953 million), including purchases of power from NUGs of $954 million (2009, $914 million) and OPG support contract costs of $455 million (2009, $39 million). All of these costs were fully recovered from electricity ratepayers (as shown in Schedules 1, 3 and 4).
Other Funds and Liabilities Other funds and liabilities include pension and benefit funds related to the Provincial Judges’ Pension Fund, the Public Service and the Deputy Ministers’ Supplementary Benefit Accounts and externally restricted funds.
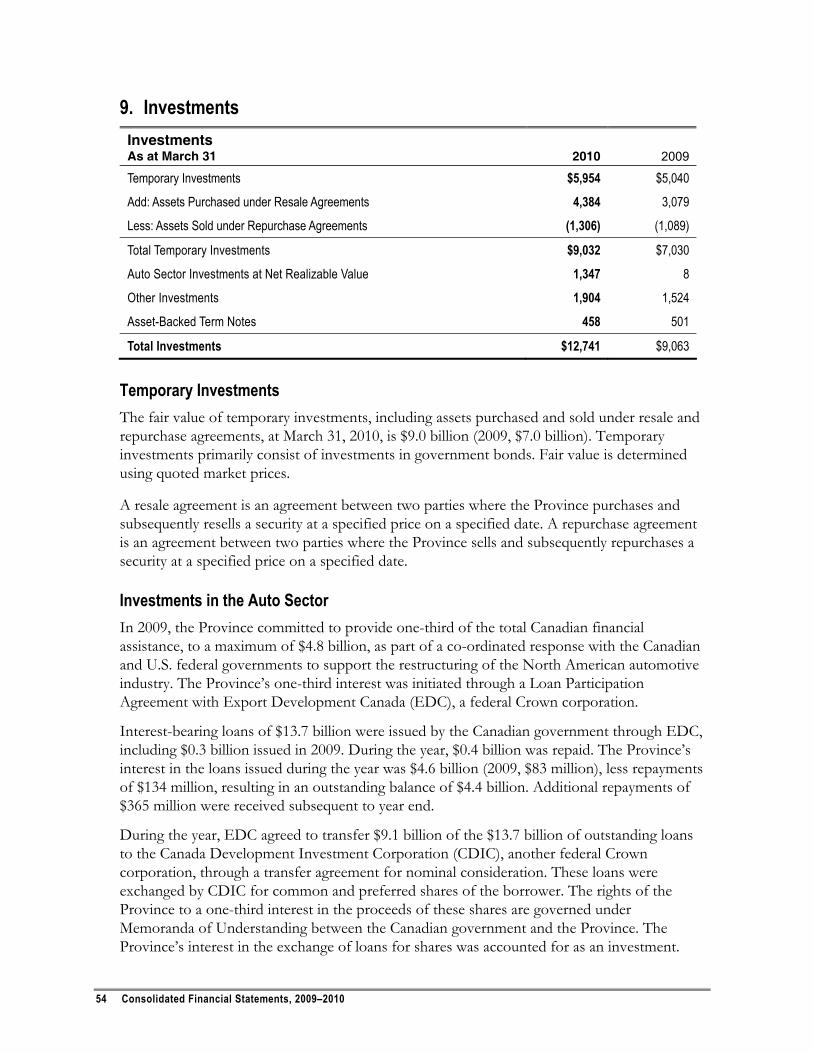
54 Consolidated Financial Statements, 2009–2010
9. Investments Investments As at March 31 2010 2009
Temporary Investments $5,954 $5,040
Add: Assets Purchased under Resale Agreements 4,384 3,079
Less: Assets Sold under Repurchase Agreements (1,306) (1,089)
Total Temporary Investments $9,032 $7,030
Auto Sector Investments at Net Realizable Value 1,347 8
Other Investments 1,904 1,524
Asset-Backed Term Notes 458 501
Total Investments $12,741 $9,063
Temporary Investments The fair value of temporary investments, including assets purchased and sold under resale and repurchase agreements, at March 31, 2010, is $9.0 billion (2009, $7.0 billion). Temporary investments primarily consist of investments in government bonds. Fair value is determined using quoted market prices.
A resale agreement is an agreement between two parties where the Province purchases and subsequently resells a security at a specified price on a specified date. A repurchase agreement is an agreement between two parties where the Province sells and subsequently repurchases a security at a specified price on a specified date.
Investments in the Auto Sector In 2009, the Province committed to provide one-third of the total Canadian financial assistance, to a maximum of $4.8 billion, as part of a co-ordinated response with the Canadian and U.S. federal governments to support the restructuring of the North American automotive industry. The Province’s one-third interest was initiated through a Loan Participation Agreement with Export Development Canada (EDC), a federal Crown corporation.
Interest-bearing loans of $13.7 billion were issued by the Canadian government through EDC, including $0.3 billion issued in 2009. During the year, $0.4 billion was repaid. The Province’s interest in the loans issued during the year was $4.6 billion (2009, $83 million), less repayments of $134 million, resulting in an outstanding balance of $4.4 billion. Additional repayments of $365 million were received subsequent to year end.
During the year, EDC agreed to transfer $9.1 billion of the $13.7 billion of outstanding loans to the Canada Development Investment Corporation (CDIC), another federal Crown corporation, through a transfer agreement for nominal consideration. These loans were exchanged by CDIC for common and preferred shares of the borrower. The rights of the Province to a one-third interest in the proceeds of these shares are governed under Memoranda of Understanding between the Canadian government and the Province. The Province’s interest in the exchange of loans for shares was accounted for as an investment.
Consolidated Financial Statements, 2009–2010 55
The Province has accounted for its participative interests in the auto sector as investments in these financial statements. The net realizable value of these investments at March 31, 2010 is estimated at $1,347 million (2009, $8 million), based on enterprise valuation using discounted future cash flows and other methods. The difference between the outstanding balance of $4.4 billion and the net realizable value of $1,347 million is reflected in the expense of the Environment, Resources and Economic Development sector.
Asset-Backed Term Notes On January 21, 2009, the restructuring of the frozen Canadian third-party asset-backed commercial paper (ABCP) was completed. Under the agreement, the Province along with the federal government, Alberta and Quebec provided assistance to the ABCP restructuring efforts through a Senior Funding Facility (SFF). Ontario’s contribution to the SFF was $250 million, and is not expected to be called upon. A small indemnity fee will be received annually.
As at March 31, 2010, the Province held $609.8 million (2009, $636.8 million) in restructured long-term notes that were issued by the Master Asset Vehicle (MAV) in 2009 as a result of the restructuring of the ABCP. Management’s best estimate of the net recoverable value of the MAV notes, as at March 31, 2010, is approximately $458.4 million (2009, $501.1 million), which includes a principal repayment of $19.8 million received in 2009–10.
Other Investments Other investments represent the investments of BPS organizations. These investments primarily consist of fixed income securities. The fair value of these investments approximates book value.
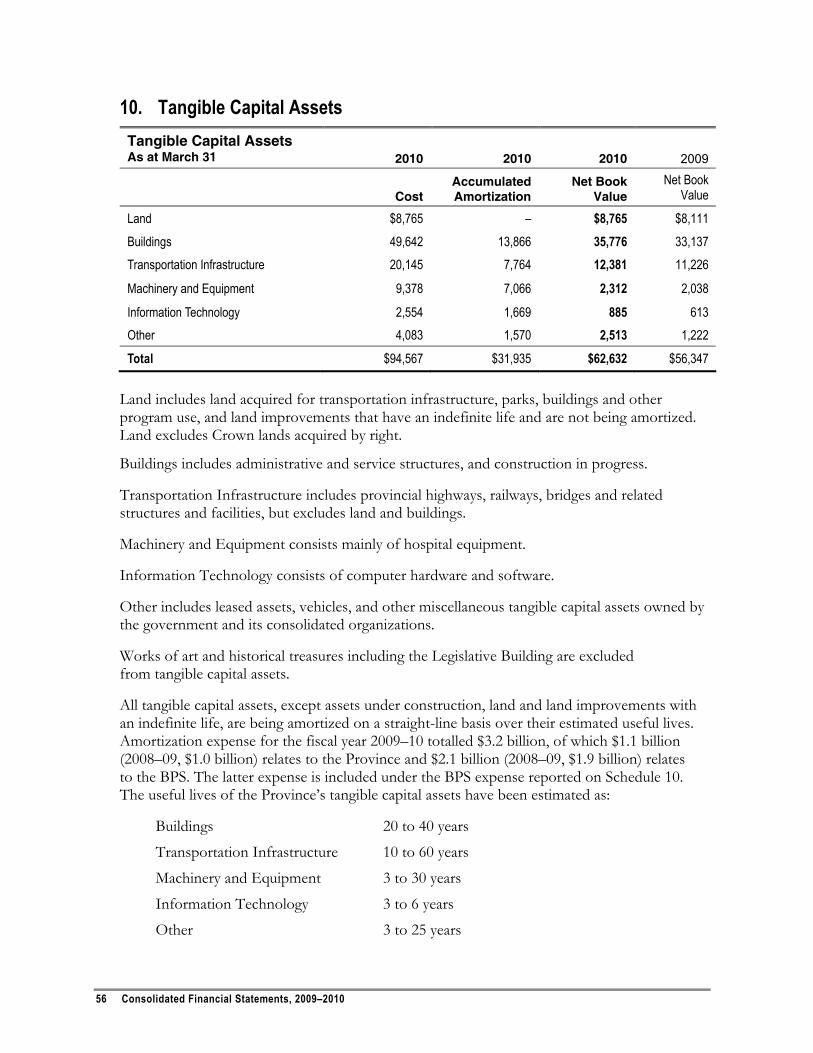
56 Consolidated Financial Statements, 2009–2010
10. Tangible Capital Assets Tangible Capital Assets As at March 31 2010 2010 2010 2009
Cost
Accumulated Amortization
Net Book Value
Net Book Value
Land $8,765 – $8,765 $8,111 Buildings 49,642 13,866 35,776 33,137 Transportation Infrastructure 20,145 7,764 12,381 11,226
Machinery and Equipment 9,378 7,066 2,312 2,038
Information Technology 2,554 1,669 885 613 Other 4,083 1,570 2,513 1,222
Total $94,567 $31,935 $62,632 $56,347 Land includes land acquired for transportation infrastructure, parks, buildings and other program use, and land improvements that have an indefinite life and are not being amortized. Land excludes Crown lands acquired by right.
Buildings includes administrative and service structures, and construction in progress.
Transportation Infrastructure includes provincial highways, railways, bridges and related structures and facilities, but excludes land and buildings.
Machinery and Equipment consists mainly of hospital equipment.
Information Technology consists of computer hardware and software.
Other includes leased assets, vehicles, and other miscellaneous tangible capital assets owned by the government and its consolidated organizations.
Works of art and historical treasures including the Legislative Building are excluded from tangible capital assets.
All tangible capital assets, except assets under construction, land and land improvements with an indefinite life, are being amortized on a straight-line basis over their estimated useful lives. Amortization expense for the fiscal year 2009–10 totalled $3.2 billion, of which $1.1 billion (2008–09, $1.0 billion) relates to the Province and $2.1 billion (2008–09, $1.9 billion) relates to the BPS. The latter expense is included under the BPS expense reported on Schedule 10. The useful lives of the Province’s tangible capital assets have been estimated as:
Buildings 20 to 40 years
Transportation Infrastructure 10 to 60 years
Machinery and Equipment 3 to 30 years
Information Technology 3 to 6 years
Other 3 to 25 years
Consolidated Financial Statements, 2009–2010 57
11. Changes in the Fair Value of Ontario Nuclear Funds The Ontario Nuclear Funds Agreement (ONFA) Funds were established by Ontario Power Generation Inc. (OPG) to ensure that sufficient funds will be available to pay for the costs of nuclear station decommissioning and nuclear used fuel waste management. Effective January 1, 2007, OPG adopted the new accounting standards issued by the Canadian Institute of Chartered Accountants on the recognition and measurement of financial instruments. As a result, the ONFA Funds are carried at fair value in OPG’s financial statements.
Since April 1, 2007, the fair value of ONFA Funds has been reflected in the Province’s consolidated financial statements. Unrealized gains and losses of ONFA Funds are included in Investment in Government Business Enterprises and recorded as an Increase (Decrease) in Fair Value of Ontario Nuclear Funds in the Consolidated Statement of Change in Net Debt and the Consolidated Statement of Change in Accumulated Deficit. Realized gains and losses of ONFA Funds are included in Income from Investment in Government Business Enterprises. Inter-organizational balances related to ONFA Funds are eliminated.
ONFA Funds incurred unrealized gains in 2009–10 of $1.1 billion (unrealized losses in 2008–09, $1.2 billion) that resulted in an increase in Investment in Government Business Enterprises, and a corresponding decrease in Net Debt and Accumulated Deficit.
12. Contingent Liabilities
Obligations Guaranteed by the Province The authorized limit for loans guaranteed by the Province as at March 31, 2010 was $826 million (2009, $912 million). The outstanding loans guaranteed and other contingencies amounted to $734 million as at March 31, 2010 (2009, $721 million). A provision of $26 million (2009, $36 million) based on an estimate of the likely loss arising from guarantees under the Student Support Programs has been reflected in these financial statements.
Ontario Nuclear Funds Agreement (ONFA) Under ONFA, the Province is liable to make payments should the cost estimate for nuclear used fuel waste management rise above specified thresholds, for a fixed volume of used fuel. The likelihood and amount by which the cost estimate could rise above these thresholds cannot be determined at this time. The cost estimate will be updated periodically to reflect new developments in the management of nuclear used fuel waste.
As well, under ONFA, the Province guarantees a return of 3.25 per cent over the Ontario Consumer Price Index for the portion of the nuclear used fuel waste management segregated fund related to the fixed volume of used fuel. If the earnings on assets in that fund related to the fixed volume exceed the guaranteed rate, the Province is entitled to the excess.
Two agreements are in place to satisfy the Canadian Nuclear Safety Commission (CNSC) licensing requirements for financial guarantees in respect of OPG’s nuclear station decommissioning and nuclear waste management obligations. One agreement gives the CNSC access (in prescribed circumstances) to the segregated funds established under ONFA.
58 Consolidated Financial Statements, 2009–2010
The other agreement provides a direct provincial guarantee to the CNSC on behalf of OPG. This guarantee, for up to $1.5 billion, effective March 1, 2010, relates to the portion of the decommissioning and waste management obligations not funded by the value of the segregated funds as at January 1, 2009. In return, the Province receives from OPG an annual fee equal to 0.5 per cent of the value of the direct provincial guarantee.
Social Housing — Loan Insurance Agreements For all non-profit housing projects in the provincial portfolio, the Province is liable to indemnify and reimburse the Canada Mortgage and Housing Corporation (CMHC) for any net costs, including any environmental liabilities, incurred as a result of project defaults through the Ministry of Municipal Affairs and Housing or the Ontario Housing Corporation.
At March 31, 2010, there were $7.4 billion (2009, $7.7 billion) of mortgage loans outstanding. As operating subsidies provided by the Province are sufficient to ensure that all mortgage payments can be made when due, default is unlikely. To date, there have been no claims for defaults on insured mortgage loans.
Claims Against the Crown There are claims outstanding against the Crown of which 69 (2009, 66) are for amounts over $50 million. These claims arise from legal action, either in progress or threatened, in respect of aboriginal land claims, breach of contract, damages to persons and property, and like items. The cost to the Province, if any, cannot be determined because the outcome of these actions is uncertain.
Canadian Blood Services The provincial and territorial governments of Canada have entered into a Canadian Blood Services Excess Insurance Captive Support Agreement (the “Captive Support Agreement”) with Canadian Blood Services (CBS) and Canadian Blood Services Captive Insurance Company Limited (CBSI), a wholly owned subsidiary of CBS. Under the Captive Support Agreement, each government indemnifies CBSI for its pro-rata share of any payments that CBSI becomes obliged to make under a comprehensive blood risks insurance policy it provides to CBS. The policy has an overall limit of $750 million, which may cover settlements, judgments and defence costs. The policy is in excess of, and secondary to, a $250 million comprehensive insurance policy underwritten by CBS Insurance Company Limited, a subsidiary of CBS. Given current populations, Ontario’s maximum potential liability under the Captive Support Agreement is approximately $376 million. The Province is not aware of any proceedings that could lead to a claim against it under the Captive Support Agreement.
Collateral The Province has financial instrument repurchase agreements in place providing for the exchange of collateral with counterparties. Starting in 2009–10, the Province also entered into collateral agreements with certain derivatives counterparties that are generally conducted under terms that are usual and customary to derivatives transactions. In the normal course of business, the Province may be required to pledge and/or receive assets relating to obligations
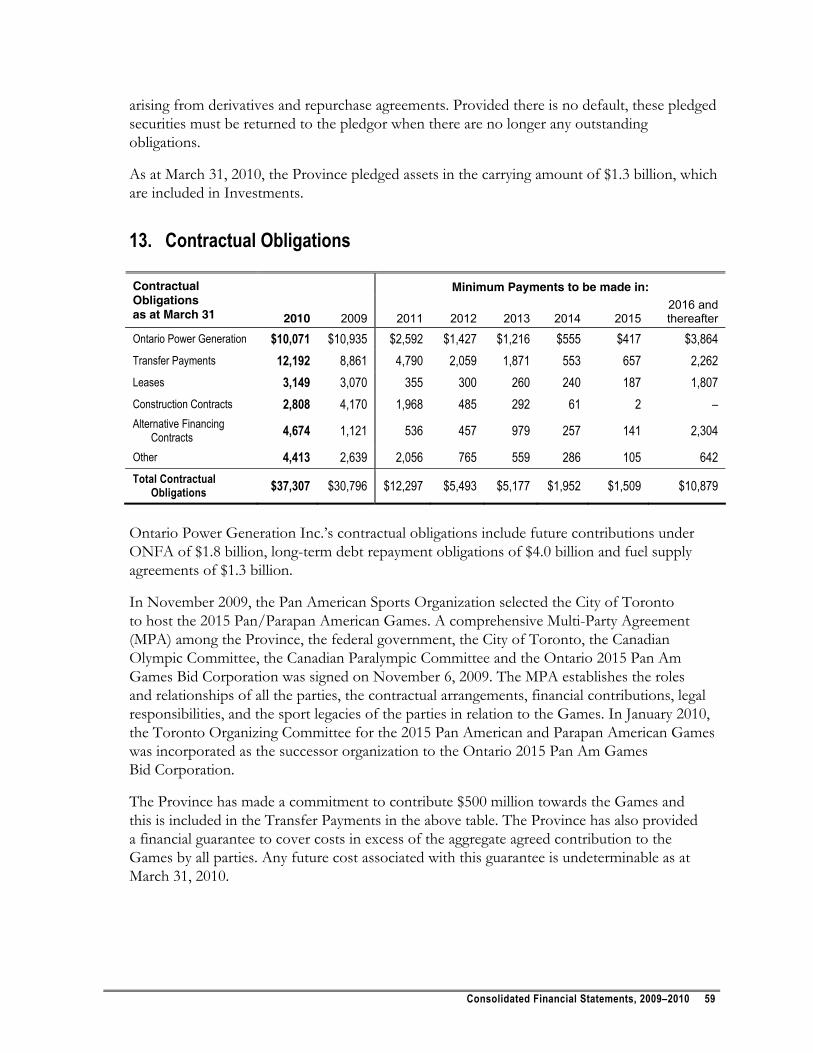
Consolidated Financial Statements, 2009–2010 59
arising from derivatives and repurchase agreements. Provided there is no default, these pledged securities must be returned to the pledgor when there are no longer any outstanding obligations.
As at March 31, 2010, the Province pledged assets in the carrying amount of $1.3 billion, which are included in Investments.
13. Contractual Obligations
Minimum Payments to be made in: Contractual Obligations as at March 31 2010 2009 2011 2012 2013 2014 2015
2016 andthereafter
Ontario Power Generation $10,071 $10,935 $2,592 $1,427 $1,216 $555 $417 $3,864 Transfer Payments 12,192 8,861 4,790 2,059 1,871 553 657 2,262 Leases 3,149 3,070 355 300 260 240 187 1,807 Construction Contracts 2,808 4,170 1,968 485 292 61 2 – Alternative Financing
Contracts 4,674 1,121 536 457 979 257 141 2,304
Other 4,413 2,639 2,056 765 559 286 105 642 Total Contractual
Obligations $37,307 $30,796 $12,297 $5,493 $5,177 $1,952 $1,509 $10,879
Ontario Power Generation Inc.’s contractual obligations include future contributions under ONFA of $1.8 billion, long-term debt repayment obligations of $4.0 billion and fuel supply agreements of $1.3 billion.
In November 2009, the Pan American Sports Organization selected the City of Toronto to host the 2015 Pan/Parapan American Games. A comprehensive Multi-Party Agreement (MPA) among the Province, the federal government, the City of Toronto, the Canadian Olympic Committee, the Canadian Paralympic Committee and the Ontario 2015 Pan Am Games Bid Corporation was signed on November 6, 2009. The MPA establishes the roles and relationships of all the parties, the contractual arrangements, financial contributions, legal responsibilities, and the sport legacies of the parties in relation to the Games. In January 2010, the Toronto Organizing Committee for the 2015 Pan American and Parapan American Games was incorporated as the successor organization to the Ontario 2015 Pan Am Games Bid Corporation.
The Province has made a commitment to contribute $500 million towards the Games and this is included in the Transfer Payments in the above table. The Province has also provided a financial guarantee to cover costs in excess of the aggregate agreed contribution to the Games by all parties. Any future cost associated with this guarantee is undeterminable as at March 31, 2010.
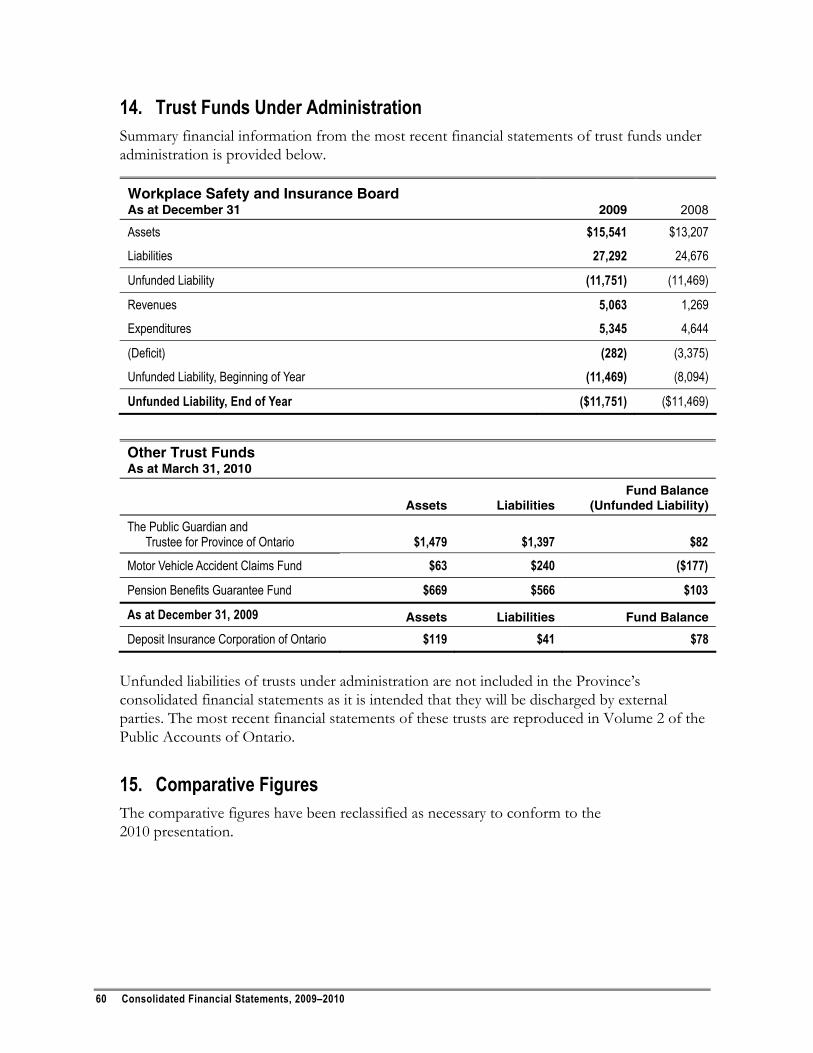
60 Consolidated Financial Statements, 2009–2010
14. Trust Funds Under Administration Summary financial information from the most recent financial statements of trust funds under administration is provided below.
Workplace Safety and Insurance Board As at December 31 2009 2008
Assets $15,541 $13,207
Liabilities 27,292 24,676
Unfunded Liability (11,751) (11,469)
Revenues 5,063 1,269
Expenditures 5,345 4,644
(Deficit) (282) (3,375)
Unfunded Liability, Beginning of Year (11,469) (8,094)
Unfunded Liability, End of Year ($11,751) ($11,469)
Other Trust Funds As at March 31, 2010
Assets Liabilities Fund Balance
(Unfunded Liability)
The Public Guardian and Trustee for Province of Ontario $1,479 $1,397 $82
Motor Vehicle Accident Claims Fund $63 $240 ($177)
Pension Benefits Guarantee Fund $669 $566 $103
As at December 31, 2009 Assets Liabilities Fund Balance
Deposit Insurance Corporation of Ontario $119 $41 $78 Unfunded liabilities of trusts under administration are not included in the Province’s consolidated financial statements as it is intended that they will be discharged by external parties. The most recent financial statements of these trusts are reproduced in Volume 2 of the Public Accounts of Ontario.
15. Comparative Figures The comparative figures have been reclassified as necessary to conform to the 2010 presentation.
Consolidated Financial Statements, 2009–2010 61
SCHEDULES TO THE CONSOLIDATED FINANCIAL STATEMENTS
Schedule 1 Revenues by Source ................................................................................................... 62
Schedule 2 Revenues by Sector .................................................................................................... 64
Schedule 3 Expenses by Sector..................................................................................................... 66
Schedule 4 Expenses by Ministry .................................................................................................. 68
Schedule 5 Accounts Payable and Accrued Liabilities ................................................................. 69
Schedule 6 Accounts Receivable................................................................................................... 69
Schedule 7 Loans Receivable ........................................................................................................ 70
Schedule 8 Government Organizations......................................................................................... 71
Schedule 9 Government Business Enterprises............................................................................. 76
Schedule 10 Broader Public Sector Organizations ......................................................................... 79
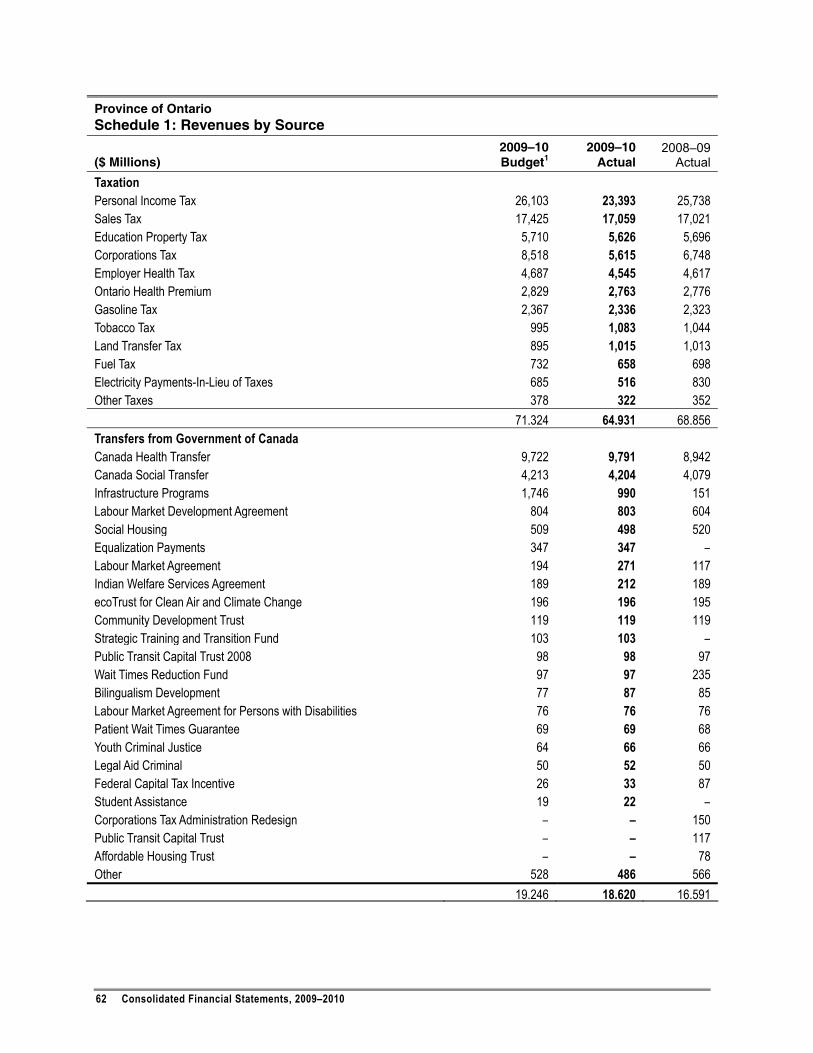
62 Consolidated Financial Statements, 2009–2010
Province of Ontario Schedule 1: Revenues by Source
($ Millions) 2009–10 Budget1
2009–10 Actual
2008–09Actual
Taxation Personal Income Tax 26,103 23,393 25,738 Sales Tax 17,425 17,059 17,021 Education Property Tax 5,710 5,626 5,696 Corporations Tax 8,518 5,615 6,748 Employer Health Tax 4,687 4,545 4,617 Ontario Health Premium 2,829 2,763 2,776 Gasoline Tax 2,367 2,336 2,323 Tobacco Tax 995 1,083 1,044 Land Transfer Tax 895 1,015 1,013 Fuel Tax 732 658 698 Electricity Payments-In-Lieu of Taxes 685 516 830 Other Taxes 378 322 352
71,324 64,931 68,856 Transfers from Government of Canada Canada Health Transfer 9,722 9,791 8,942 Canada Social Transfer 4,213 4,204 4,079 Infrastructure Programs 1,746 990 151 Labour Market Development Agreement 804 803 604 Social Housing 509 498 520 Equalization Payments 347 347 – Labour Market Agreement 194 271 117 Indian Welfare Services Agreement 189 212 189 ecoTrust for Clean Air and Climate Change 196 196 195 Community Development Trust 119 119 119 Strategic Training and Transition Fund 103 103 – Public Transit Capital Trust 2008 98 98 97 Wait Times Reduction Fund 97 97 235 Bilingualism Development 77 87 85 Labour Market Agreement for Persons with Disabilities 76 76 76 Patient Wait Times Guarantee 69 69 68 Youth Criminal Justice 64 66 66 Legal Aid Criminal 50 52 50 Federal Capital Tax Incentive 26 33 87 Student Assistance 19 22 – Corporations Tax Administration Redesign – – 150 Public Transit Capital Trust – – 117 Affordable Housing Trust – – 78 Other 528 486 566
19,246 18,620 16,591
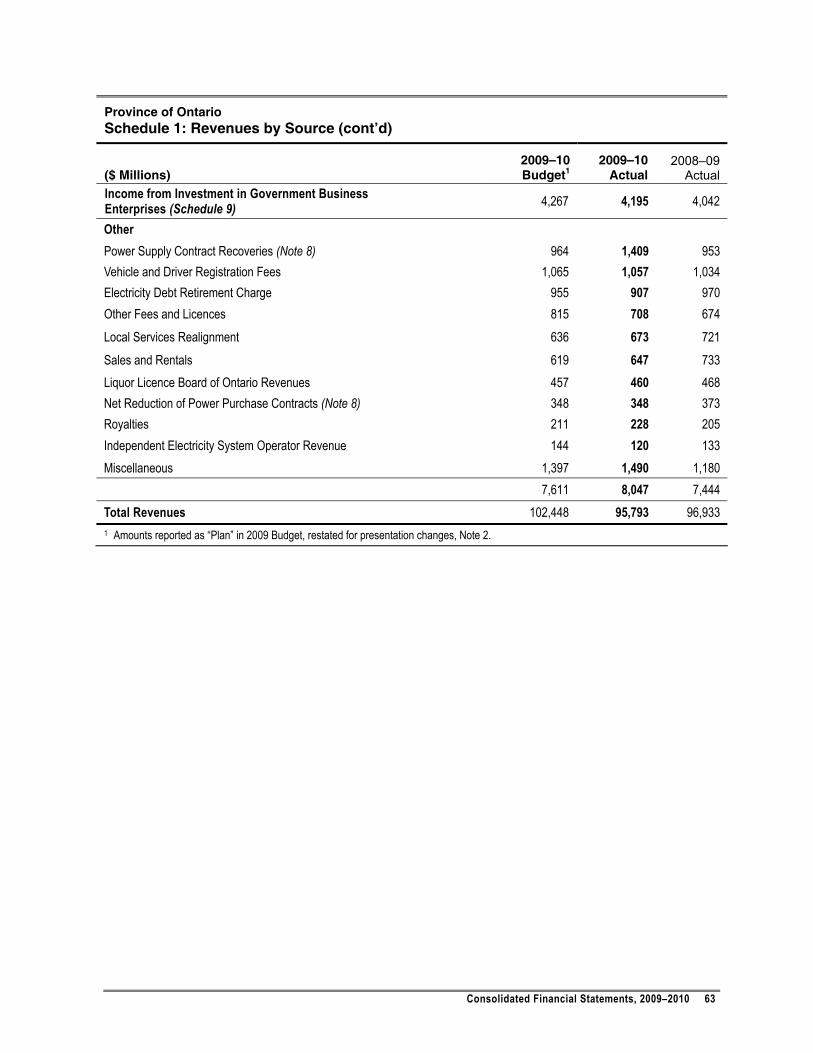
Consolidated Financial Statements, 2009–2010 63
Province of Ontario Schedule 1: Revenues by Source (cont’d)
($ Millions) 2009–10 Budget1
2009–10 Actual
2008–09Actual
Income from Investment in Government Business Enterprises (Schedule 9) 4,267 4,195 4,042
Other Power Supply Contract Recoveries (Note 8) 964 1,409 953 Vehicle and Driver Registration Fees 1,065 1,057 1,034 Electricity Debt Retirement Charge 955 907 970 Other Fees and Licences 815 708 674 Local Services Realignment 636 673 721 Sales and Rentals 619 647 733 Liquor Licence Board of Ontario Revenues 457 460 468 Net Reduction of Power Purchase Contracts (Note 8) 348 348 373 Royalties 211 228 205 Independent Electricity System Operator Revenue 144 120 133 Miscellaneous 1,397 1,490 1,180 7,611 8,047 7,444 Total Revenues 102,448 95,793 96,933 1 Amounts reported as “Plan” in 2009 Budget, restated for presentation changes, Note 2.
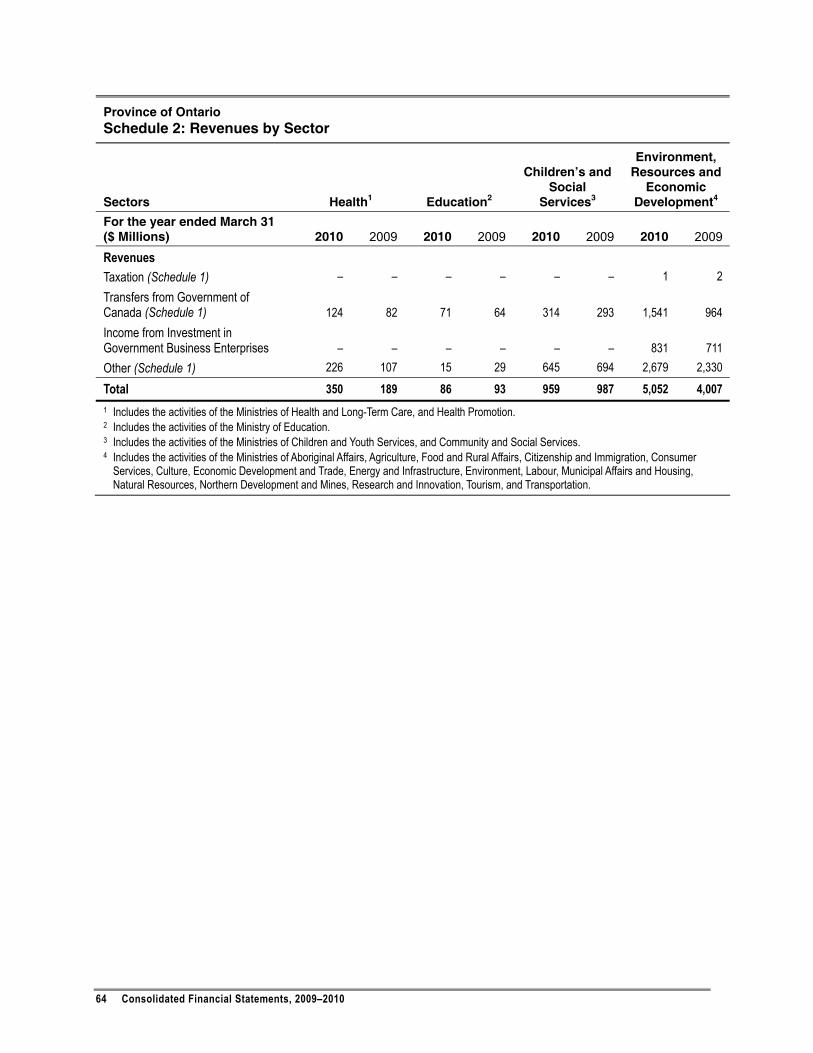
64 Consolidated Financial Statements, 2009–2010
Province of Ontario Schedule 2: Revenues by Sector
Sectors Health1 Education2
Children’s and Social
Services3
Environment, Resources and
Economic Development4
For the year ended March 31 ($ Millions) 2010 2009 2010 2009 2010 2009 2010 2009
Revenues Taxation (Schedule 1) – – – – – – 1 2 Transfers from Government of Canada (Schedule 1) 124 82 71 64 314 293 1,541 964 Income from Investment in Government Business Enterprises – – – – – – 831 711 Other (Schedule 1) 226 107 15 29 645 694 2,679 2,330 Total 350 189 86 93 959 987 5,052 4,007 1 Includes the activities of the Ministries of Health and Long-Term Care, and Health Promotion. 2 Includes the activities of the Ministry of Education. 3 Includes the activities of the Ministries of Children and Youth Services, and Community and Social Services. 4 Includes the activities of the Ministries of Aboriginal Affairs, Agriculture, Food and Rural Affairs, Citizenship and Immigration, Consumer
Services, Culture, Economic Development and Trade, Energy and Infrastructure, Environment, Labour, Municipal Affairs and Housing, Natural Resources, Northern Development and Mines, Research and Innovation, Tourism, and Transportation.
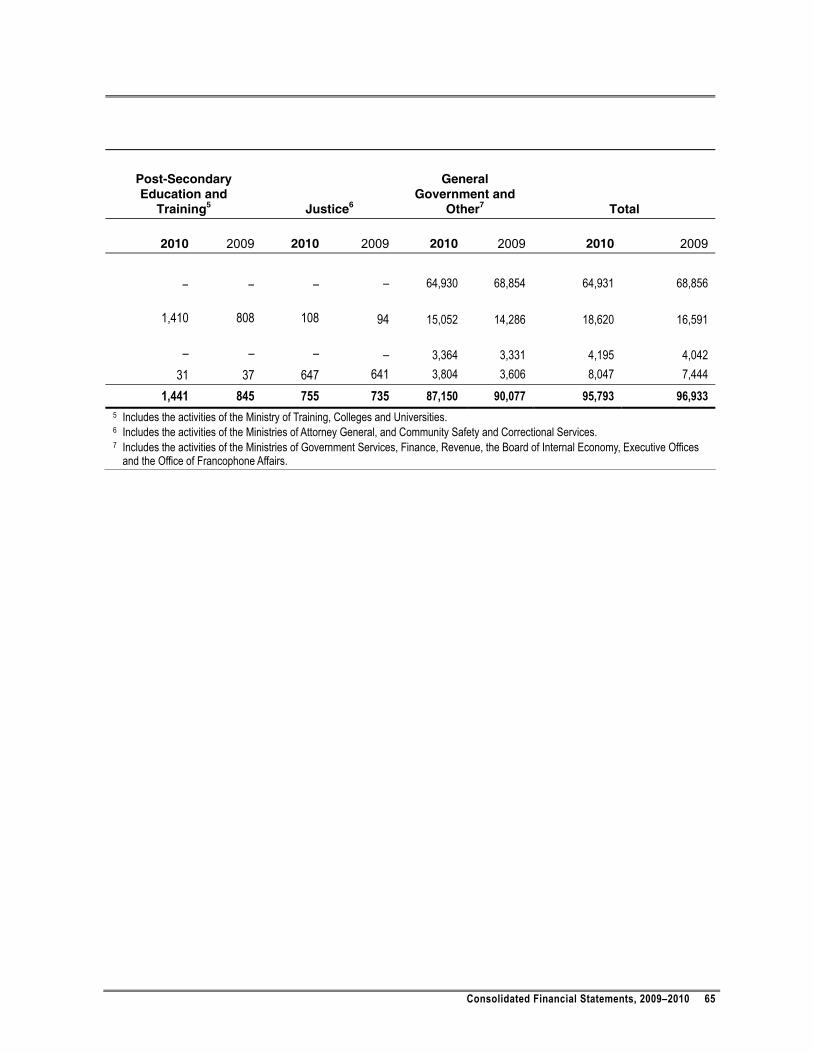
Consolidated Financial Statements, 2009–2010 65
Post-Secondary Education and
Training5 Justice6
General Government and
Other7 Total
2010 2009 2010 2009 2010 2009 2010 2009
– – – – 64,930 68,854 64,931 68,856
1,410 808 108 94 15,052 14,286 18,620 16,591
– – – – 3,364 3,331 4,195 4,042 31 37 647 641 3,804 3,606 8,047 7,444
1,441 845 755 735 87,150 90,077 95,793 96,933 5 Includes the activities of the Ministry of Training, Colleges and Universities. 6 Includes the activities of the Ministries of Attorney General, and Community Safety and Correctional Services. 7 Includes the activities of the Ministries of Government Services, Finance, Revenue, the Board of Internal Economy, Executive Offices
and the Office of Francophone Affairs.
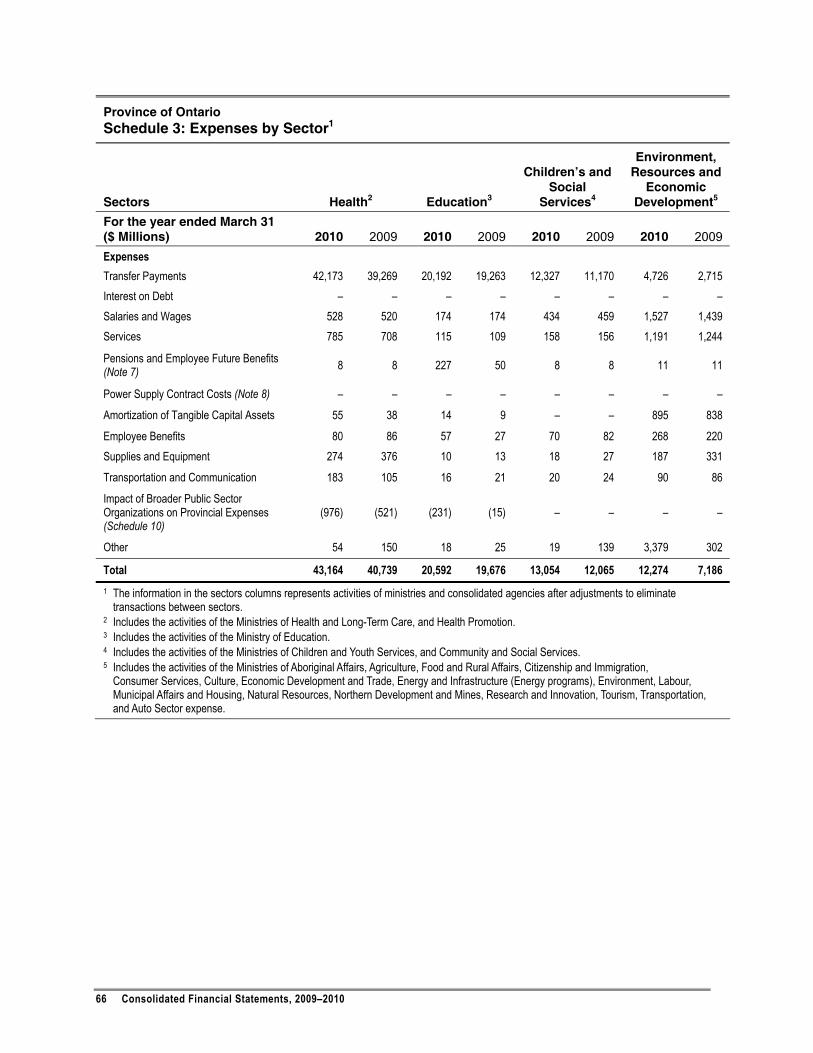
66 Consolidated Financial Statements, 2009–2010
Province of Ontario Schedule 3: Expenses by Sector1
Sectors Health2 Education3
Children’s and Social
Services4
Environment, Resources and
Economic Development5
For the year ended March 31 ($ Millions) 2010 2009 2010 2009 2010 2009 2010 2009 Expenses Transfer Payments 42,173 39,269 20,192 19,263 12,327 11,170 4,726 2,715 Interest on Debt – – – – – – – – Salaries and Wages 528 520 174 174 434 459 1,527 1,439 Services 785 708 115 109 158 156 1,191 1,244
Pensions and Employee Future Benefits (Note 7) 8 8 227 50 8 8 11 11
Power Supply Contract Costs (Note 8) – – – – – – – –
Amortization of Tangible Capital Assets 55 38 14 9 – – 895 838
Employee Benefits 80 86 57 27 70 82 268 220 Supplies and Equipment 274 376 10 13 18 27 187 331
Transportation and Communication 183 105 16 21 20 24 90 86
Impact of Broader Public Sector Organizations on Provincial Expenses (Schedule 10)
(976) (521) (231) (15) – – – –
Other 54 150 18 25 19 139 3,379 302
Total 43,164 40,739 20,592 19,676 13,054 12,065 12,274 7,186 1 The information in the sectors columns represents activities of ministries and consolidated agencies after adjustments to eliminate
transactions between sectors. 2 Includes the activities of the Ministries of Health and Long-Term Care, and Health Promotion. 3 Includes the activities of the Ministry of Education. 4 Includes the activities of the Ministries of Children and Youth Services, and Community and Social Services. 5 Includes the activities of the Ministries of Aboriginal Affairs, Agriculture, Food and Rural Affairs, Citizenship and Immigration,
Consumer Services, Culture, Economic Development and Trade, Energy and Infrastructure (Energy programs), Environment, Labour, Municipal Affairs and Housing, Natural Resources, Northern Development and Mines, Research and Innovation, Tourism, Transportation, and Auto Sector expense.
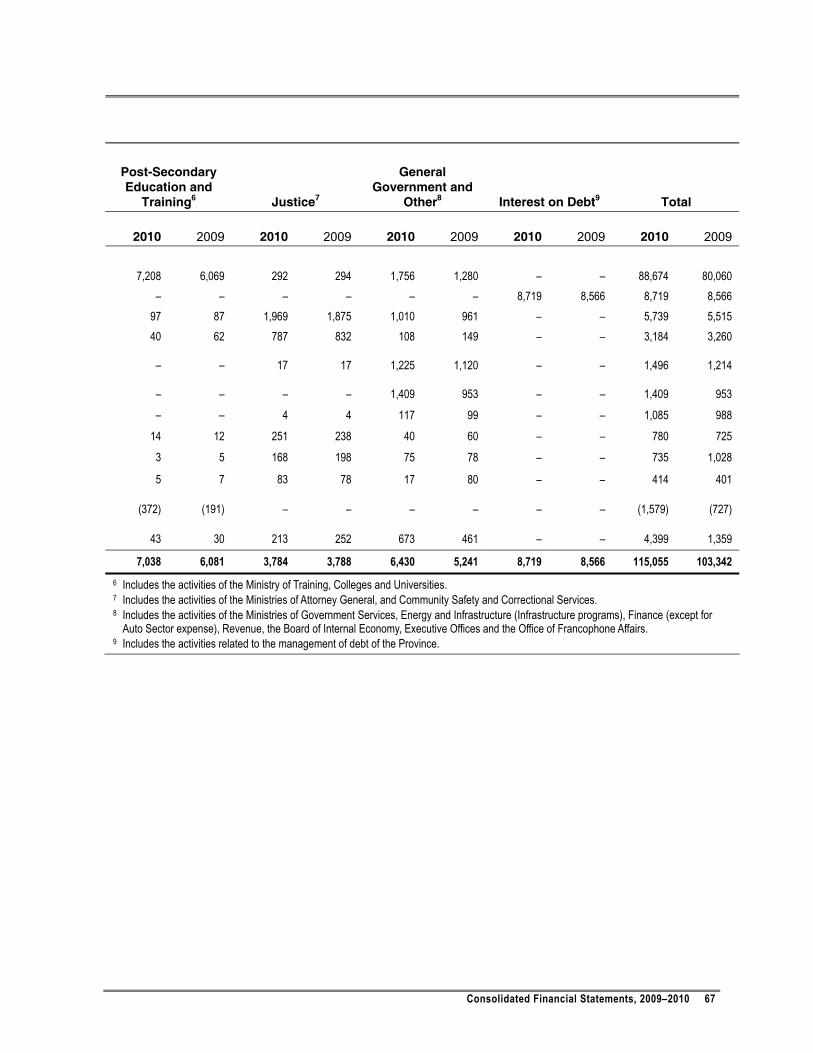
Consolidated Financial Statements, 2009–2010 67
Post-Secondary Education and
Training6 Justice7
General Government and
Other8 Interest on Debt9 Total
2010 2009 2010 2009 2010 2009 2010 2009 2010 2009
7,208 6,069 292 294 1,756 1,280 – – 88,674 80,060
– – – – – – 8,719 8,566 8,719 8,566 97 87 1,969 1,875 1,010 961 – – 5,739 5,515 40 62 787 832 108 149 – – 3,184 3,260
– – 17 17 1,225 1,120 – – 1,496 1,214
– – – – 1,409 953 – – 1,409 953
– – 4 4 117 99 – – 1,085 988
14 12 251 238 40 60 – – 780 725
3 5 168 198 75 78 – – 735 1,028
5 7 83 78 17 80 – – 414 401
(372) (191) – – – – – – (1,579) (727)
43 30 213 252 673 461 – – 4,399 1,359
7,038 6,081 3,784 3,788 6,430 5,241 8,719 8,566 115,055 103,342 6 Includes the activities of the Ministry of Training, Colleges and Universities. 7 Includes the activities of the Ministries of Attorney General, and Community Safety and Correctional Services. 8 Includes the activities of the Ministries of Government Services, Energy and Infrastructure (Infrastructure programs), Finance (except for
Auto Sector expense), Revenue, the Board of Internal Economy, Executive Offices and the Office of Francophone Affairs. 9 Includes the activities related to the management of debt of the Province.
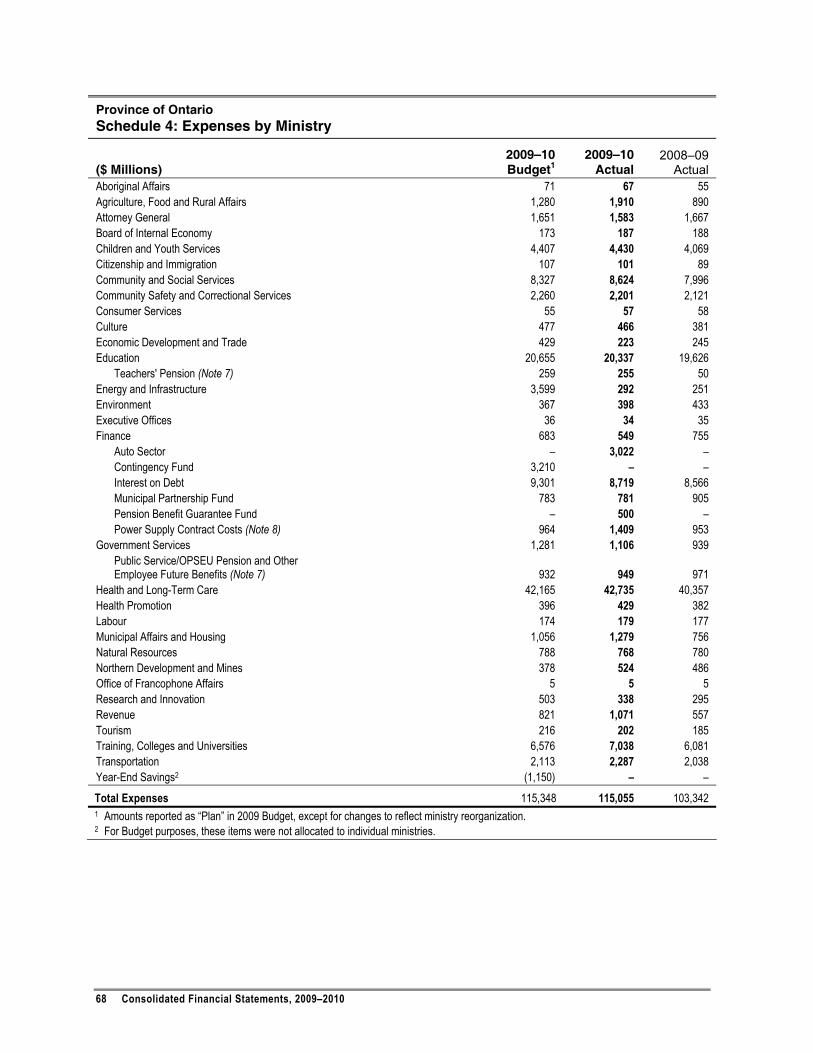
68 Consolidated Financial Statements, 2009–2010
Province of Ontario
Schedule 4: Expenses by Ministry
($ Millions) 2009–10 Budget1
2009–10 Actual
2008–09Actual
Aboriginal Affairs 71 67 55 Agriculture, Food and Rural Affairs 1,280 1,910 890 Attorney General 1,651 1,583 1,667 Board of Internal Economy 173 187 188 Children and Youth Services 4,407 4,430 4,069 Citizenship and Immigration 107 101 89 Community and Social Services 8,327 8,624 7,996 Community Safety and Correctional Services 2,260 2,201 2,121 Consumer Services 55 57 58 Culture 477 466 381 Economic Development and Trade 429 223 245 Education 20,655 20,337 19,626 Teachers' Pension (Note 7) 259 255 50 Energy and Infrastructure 3,599 292 251 Environment 367 398 433 Executive Offices 36 34 35 Finance 683 549 755 Auto Sector – 3,022 – Contingency Fund 3,210 – – Interest on Debt 9,301 8,719 8,566 Municipal Partnership Fund 783 781 905 Pension Benefit Guarantee Fund – 500 – Power Supply Contract Costs (Note 8) 964 1,409 953 Government Services 1,281 1,106 939 Public Service/OPSEU Pension and Other
Employee Future Benefits (Note 7)
932 949 971 Health and Long-Term Care 42,165 42,735 40,357 Health Promotion 396 429 382 Labour 174 179 177 Municipal Affairs and Housing 1,056 1,279 756 Natural Resources 788 768 780 Northern Development and Mines 378 524 486 Office of Francophone Affairs 5 5 5 Research and Innovation 503 338 295 Revenue 821 1,071 557 Tourism 216 202 185 Training, Colleges and Universities 6,576 7,038 6,081 Transportation 2,113 2,287 2,038 Year-End Savings2 (1,150) – –
Total Expenses 115,348 115,055 103,342 1 Amounts reported as “Plan” in 2009 Budget, except for changes to reflect ministry reorganization. 2 For Budget purposes, these items were not allocated to individual ministries.
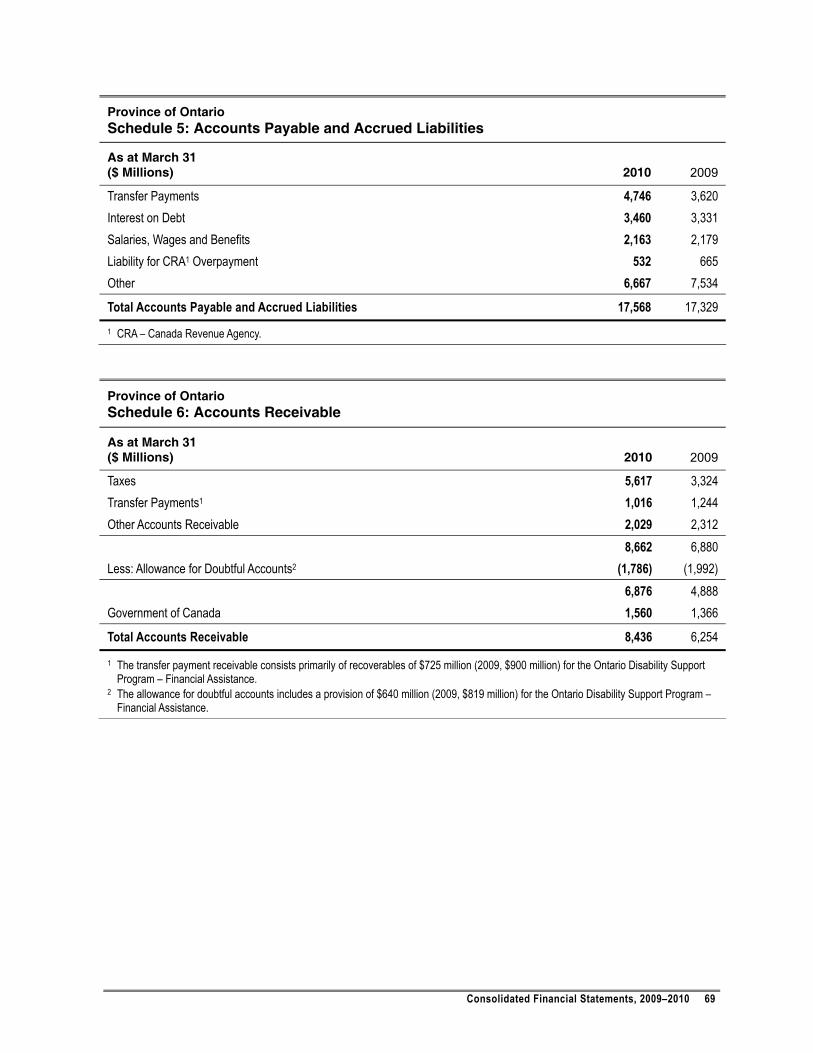
Consolidated Financial Statements, 2009–2010 69
Province of Ontario Schedule 5: Accounts Payable and Accrued Liabilities
As at March 31 ($ Millions) 2010 2009
Transfer Payments 4,746 3,620 Interest on Debt 3,460 3,331 Salaries, Wages and Benefits 2,163 2,179 Liability for CRA1 Overpayment 532 665 Other 6,667 7,534
Total Accounts Payable and Accrued Liabilities 17,568 17,329 1 CRA – Canada Revenue Agency.
Province of Ontario Schedule 6: Accounts Receivable
As at March 31 ($ Millions) 2010 2009
Taxes 5,617 3,324 Transfer Payments1 1,016 1,244 Other Accounts Receivable 2,029 2,312 8,662 6,880 Less: Allowance for Doubtful Accounts2 (1,786) (1,992) 6,876 4,888 Government of Canada 1,560 1,366
Total Accounts Receivable 8,436 6,254
1 The transfer payment receivable consists primarily of recoverables of $725 million (2009, $900 million) for the Ontario Disability Support Program – Financial Assistance.
2 The allowance for doubtful accounts includes a provision of $640 million (2009, $819 million) for the Ontario Disability Support Program – Financial Assistance.
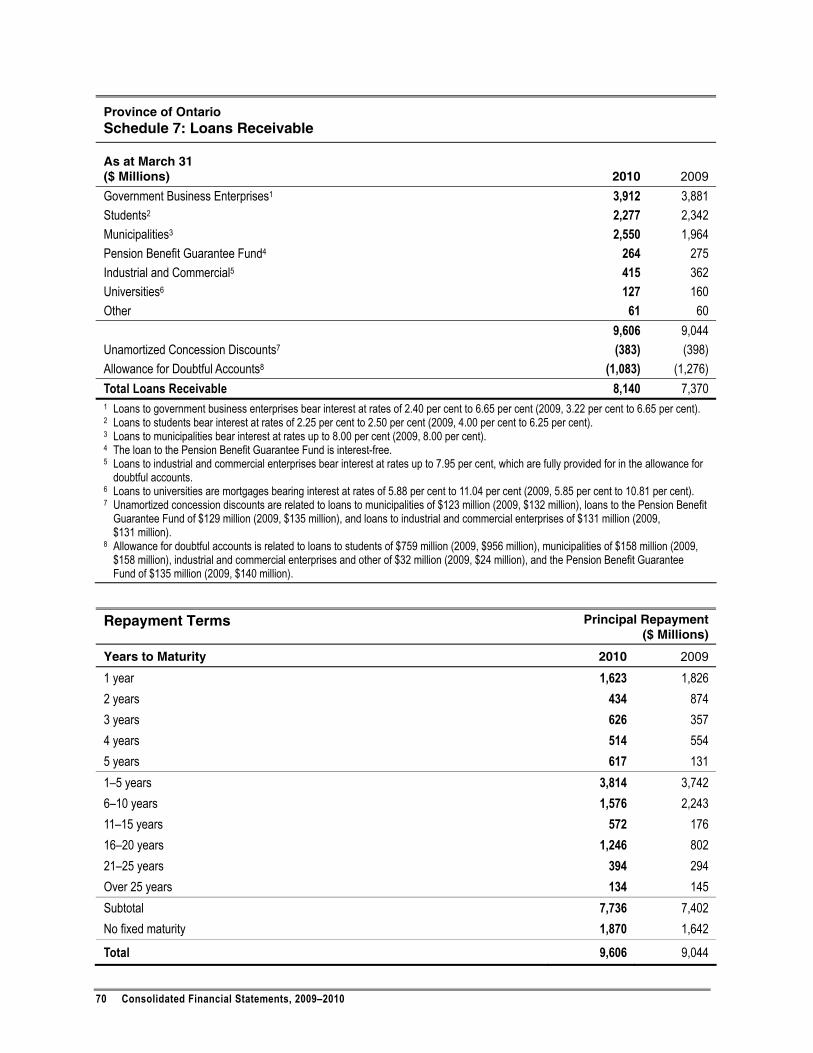
70 Consolidated Financial Statements, 2009–2010
Province of Ontario Schedule 7: Loans Receivable
As at March 31 ($ Millions) 2010 2009 Government Business Enterprises1 3,912 3,881 Students2 2,277 2,342 Municipalities3 2,550 1,964 Pension Benefit Guarantee Fund4 264 275 Industrial and Commercial5 415 362 Universities6 127 160 Other 61 60 9,606 9,044 Unamortized Concession Discounts7 (383) (398) Allowance for Doubtful Accounts8 (1,083) (1,276) Total Loans Receivable 8,140 7,370 1 Loans to government business enterprises bear interest at rates of 2.40 per cent to 6.65 per cent (2009, 3.22 per cent to 6.65 per cent). 2 Loans to students bear interest at rates of 2.25 per cent to 2.50 per cent (2009, 4.00 per cent to 6.25 per cent). 3 Loans to municipalities bear interest at rates up to 8.00 per cent (2009, 8.00 per cent). 4 The loan to the Pension Benefit Guarantee Fund is interest-free. 5 Loans to industrial and commercial enterprises bear interest at rates up to 7.95 per cent, which are fully provided for in the allowance for
doubtful accounts. 6 Loans to universities are mortgages bearing interest at rates of 5.88 per cent to 11.04 per cent (2009, 5.85 per cent to 10.81 per cent). 7 Unamortized concession discounts are related to loans to municipalities of $123 million (2009, $132 million), loans to the Pension Benefit
Guarantee Fund of $129 million (2009, $135 million), and loans to industrial and commercial enterprises of $131 million (2009, $131 million).
8 Allowance for doubtful accounts is related to loans to students of $759 million (2009, $956 million), municipalities of $158 million (2009, $158 million), industrial and commercial enterprises and other of $32 million (2009, $24 million), and the Pension Benefit Guarantee Fund of $135 million (2009, $140 million).
Repayment Terms Principal Repayment ($ Millions)
Years to Maturity 2010 2009
1 year 1,623 1,826 2 years 434 874 3 years 626 357 4 years 514 554 5 years 617 131 1–5 years 3,814 3,742 6–10 years 1,576 2,243 11–15 years 572 176 16–20 years 1,246 802 21–25 years 394 294 Over 25 years 134 145 Subtotal 7,736 7,402 No fixed maturity 1,870 1,642
Total 9,606 9,044
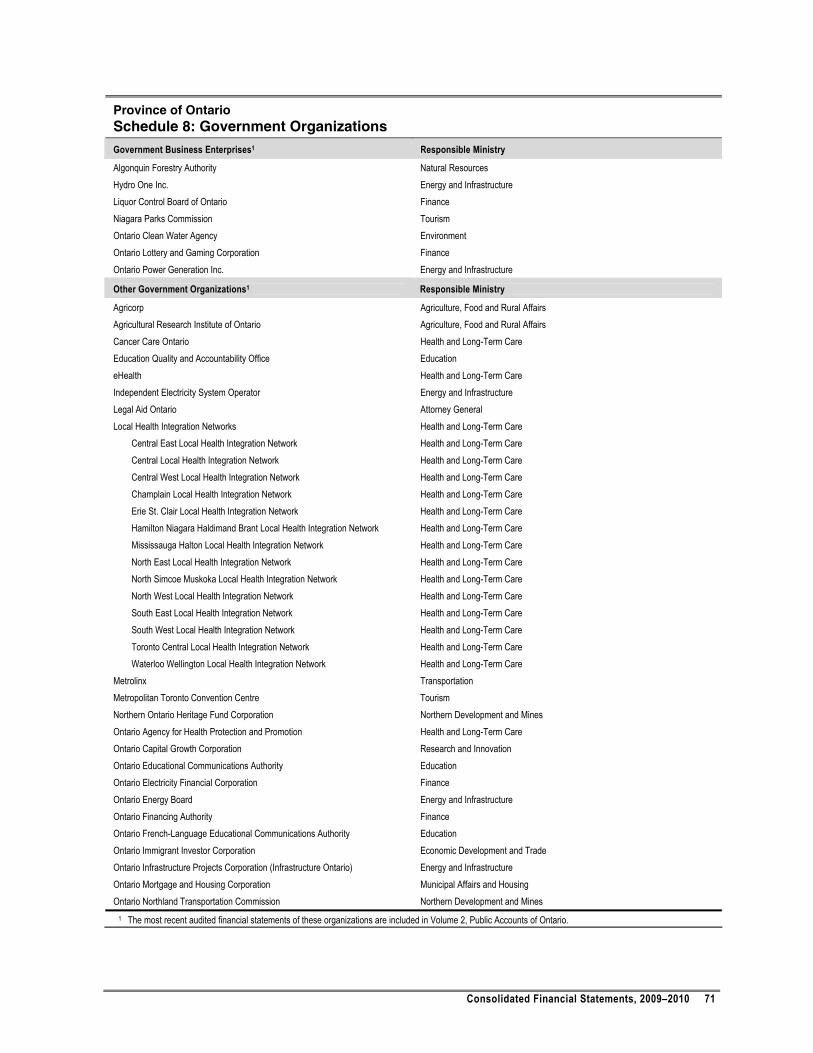
Consolidated Financial Statements, 2009–2010 71
Province of Ontario Schedule 8: Government Organizations Government Business Enterprises1 Responsible Ministry
Algonquin Forestry Authority Natural Resources Hydro One Inc. Energy and Infrastructure Liquor Control Board of Ontario Finance Niagara Parks Commission Tourism Ontario Clean Water Agency Environment Ontario Lottery and Gaming Corporation Finance Ontario Power Generation Inc. Energy and Infrastructure
Other Government Organizations1 Responsible Ministry
Agricorp Agriculture, Food and Rural Affairs Agricultural Research Institute of Ontario Agriculture, Food and Rural Affairs Cancer Care Ontario Health and Long-Term Care Education Quality and Accountability Office Education eHealth Health and Long-Term Care Independent Electricity System Operator Energy and Infrastructure Legal Aid Ontario Attorney General Local Health Integration Networks Health and Long-Term Care Central East Local Health Integration Network Health and Long-Term Care Central Local Health Integration Network Health and Long-Term Care Central West Local Health Integration Network Health and Long-Term Care Champlain Local Health Integration Network Health and Long-Term Care Erie St. Clair Local Health Integration Network Health and Long-Term Care Hamilton Niagara Haldimand Brant Local Health Integration Network Health and Long-Term Care Mississauga Halton Local Health Integration Network Health and Long-Term Care North East Local Health Integration Network Health and Long-Term Care North Simcoe Muskoka Local Health Integration Network Health and Long-Term Care North West Local Health Integration Network Health and Long-Term Care South East Local Health Integration Network Health and Long-Term Care South West Local Health Integration Network Health and Long-Term Care Toronto Central Local Health Integration Network Health and Long-Term Care Waterloo Wellington Local Health Integration Network Health and Long-Term Care Metrolinx Transportation Metropolitan Toronto Convention Centre Tourism Northern Ontario Heritage Fund Corporation Northern Development and Mines Ontario Agency for Health Protection and Promotion Health and Long-Term Care Ontario Capital Growth Corporation Research and Innovation Ontario Educational Communications Authority Education Ontario Electricity Financial Corporation Finance Ontario Energy Board Energy and Infrastructure Ontario Financing Authority Finance Ontario French-Language Educational Communications Authority Education Ontario Immigrant Investor Corporation Economic Development and Trade Ontario Infrastructure Projects Corporation (Infrastructure Ontario) Energy and Infrastructure Ontario Mortgage and Housing Corporation Municipal Affairs and Housing Ontario Northland Transportation Commission Northern Development and Mines
1 The most recent audited financial statements of these organizations are included in Volume 2, Public Accounts of Ontario.
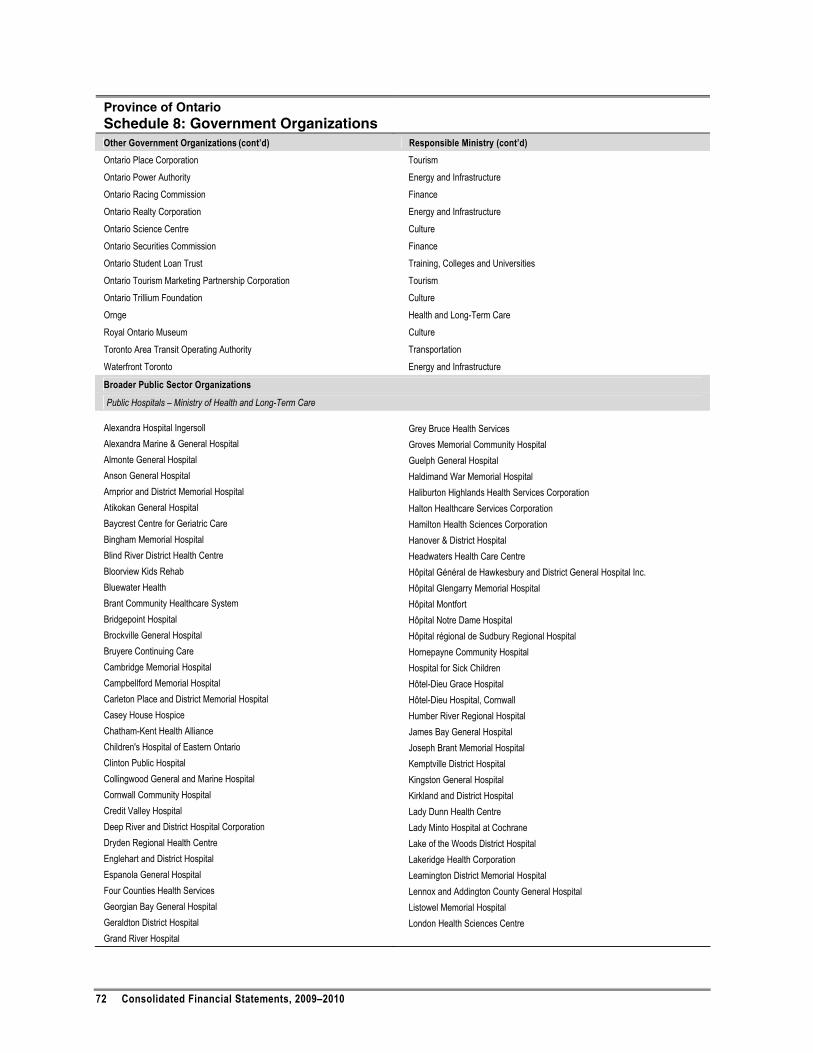
72 Consolidated Financial Statements, 2009–2010
Province of Ontario Schedule 8: Government Organizations
Other Government Organizations (cont’d) Responsible Ministry (cont’d) Ontario Place Corporation Tourism Ontario Power Authority Energy and Infrastructure Ontario Racing Commission Finance Ontario Realty Corporation Energy and Infrastructure Ontario Science Centre Culture Ontario Securities Commission Finance Ontario Student Loan Trust Training, Colleges and Universities Ontario Tourism Marketing Partnership Corporation Tourism Ontario Trillium Foundation Culture Ornge Health and Long-Term Care Royal Ontario Museum Culture Toronto Area Transit Operating Authority Transportation Waterfront Toronto Energy and Infrastructure
Broader Public Sector Organizations
Public Hospitals – Ministry of Health and Long-Term Care
Alexandra Hospital Ingersoll Alexandra Marine & General Hospital Almonte General Hospital Anson General Hospital Arnprior and District Memorial Hospital Atikokan General Hospital Baycrest Centre for Geriatric Care Bingham Memorial Hospital Blind River District Health Centre Bloorview Kids Rehab Bluewater Health Brant Community Healthcare System Bridgepoint Hospital Brockville General Hospital Bruyere Continuing Care Cambridge Memorial Hospital Campbellford Memorial Hospital Carleton Place and District Memorial Hospital Casey House Hospice Chatham-Kent Health Alliance Children's Hospital of Eastern Ontario Clinton Public Hospital Collingwood General and Marine Hospital Cornwall Community Hospital Credit Valley Hospital Deep River and District Hospital Corporation Dryden Regional Health Centre Englehart and District Hospital Espanola General Hospital Four Counties Health Services Georgian Bay General Hospital Geraldton District Hospital Grand River Hospital
Grey Bruce Health Services Groves Memorial Community Hospital Guelph General Hospital Haldimand War Memorial Hospital Haliburton Highlands Health Services Corporation Halton Healthcare Services Corporation Hamilton Health Sciences Corporation Hanover & District Hospital Headwaters Health Care Centre Hôpital Général de Hawkesbury and District General Hospital Inc. Hôpital Glengarry Memorial Hospital Hôpital Montfort Hôpital Notre Dame Hospital Hôpital régional de Sudbury Regional Hospital Hornepayne Community Hospital Hospital for Sick Children Hôtel-Dieu Grace Hospital Hôtel-Dieu Hospital, Cornwall Humber River Regional Hospital James Bay General Hospital Joseph Brant Memorial Hospital Kemptville District Hospital Kingston General Hospital Kirkland and District Hospital Lady Dunn Health Centre Lady Minto Hospital at Cochrane Lake of the Woods District Hospital Lakeridge Health Corporation Leamington District Memorial Hospital Lennox and Addington County General Hospital Listowel Memorial Hospital London Health Sciences Centre
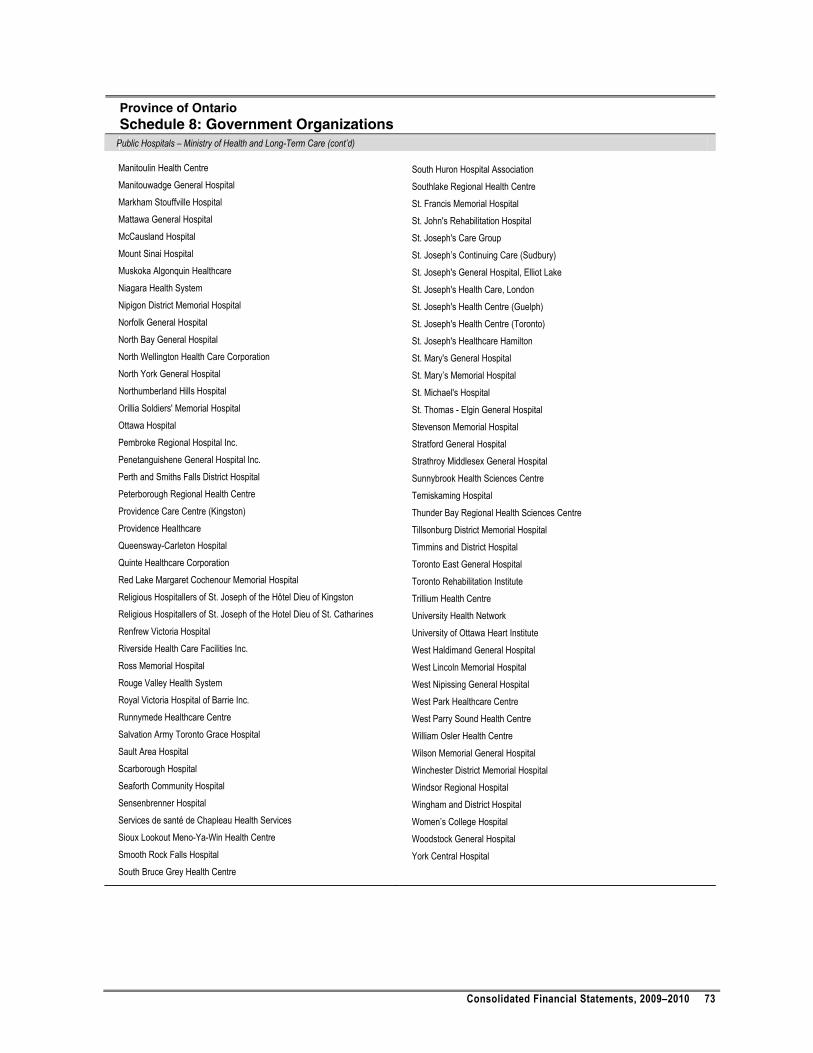
Consolidated Financial Statements, 2009–2010 73
Province of Ontario Schedule 8: Government Organizations
Public Hospitals – Ministry of Health and Long-Term Care (cont’d)
Manitoulin Health Centre Manitouwadge General Hospital Markham Stouffville Hospital Mattawa General Hospital McCausland Hospital Mount Sinai Hospital Muskoka Algonquin Healthcare Niagara Health System Nipigon District Memorial Hospital Norfolk General Hospital North Bay General Hospital North Wellington Health Care Corporation North York General Hospital Northumberland Hills Hospital Orillia Soldiers' Memorial Hospital Ottawa Hospital Pembroke Regional Hospital Inc. Penetanguishene General Hospital Inc. Perth and Smiths Falls District Hospital Peterborough Regional Health Centre Providence Care Centre (Kingston) Providence Healthcare Queensway-Carleton Hospital Quinte Healthcare Corporation Red Lake Margaret Cochenour Memorial Hospital Religious Hospitallers of St. Joseph of the Hôtel Dieu of Kingston Religious Hospitallers of St. Joseph of the Hotel Dieu of St. Catharines Renfrew Victoria Hospital Riverside Health Care Facilities Inc. Ross Memorial Hospital Rouge Valley Health System Royal Victoria Hospital of Barrie Inc. Runnymede Healthcare Centre Salvation Army Toronto Grace Hospital Sault Area Hospital Scarborough Hospital Seaforth Community Hospital Sensenbrenner Hospital Services de santé de Chapleau Health Services Sioux Lookout Meno-Ya-Win Health Centre Smooth Rock Falls Hospital South Bruce Grey Health Centre
South Huron Hospital Association Southlake Regional Health Centre St. Francis Memorial Hospital St. John's Rehabilitation Hospital St. Joseph's Care Group St. Joseph’s Continuing Care (Sudbury) St. Joseph's General Hospital, Elliot Lake St. Joseph's Health Care, London St. Joseph's Health Centre (Guelph) St. Joseph's Health Centre (Toronto) St. Joseph's Healthcare Hamilton St. Mary's General Hospital St. Mary’s Memorial Hospital St. Michael's Hospital St. Thomas - Elgin General Hospital Stevenson Memorial Hospital Stratford General Hospital Strathroy Middlesex General Hospital Sunnybrook Health Sciences Centre Temiskaming Hospital Thunder Bay Regional Health Sciences Centre Tillsonburg District Memorial Hospital Timmins and District Hospital Toronto East General Hospital Toronto Rehabilitation Institute Trillium Health Centre University Health Network University of Ottawa Heart Institute West Haldimand General Hospital West Lincoln Memorial Hospital West Nipissing General Hospital West Park Healthcare Centre West Parry Sound Health Centre William Osler Health Centre Wilson Memorial General Hospital Winchester District Memorial Hospital Windsor Regional Hospital Wingham and District Hospital Women’s College Hospital Woodstock General Hospital York Central Hospital
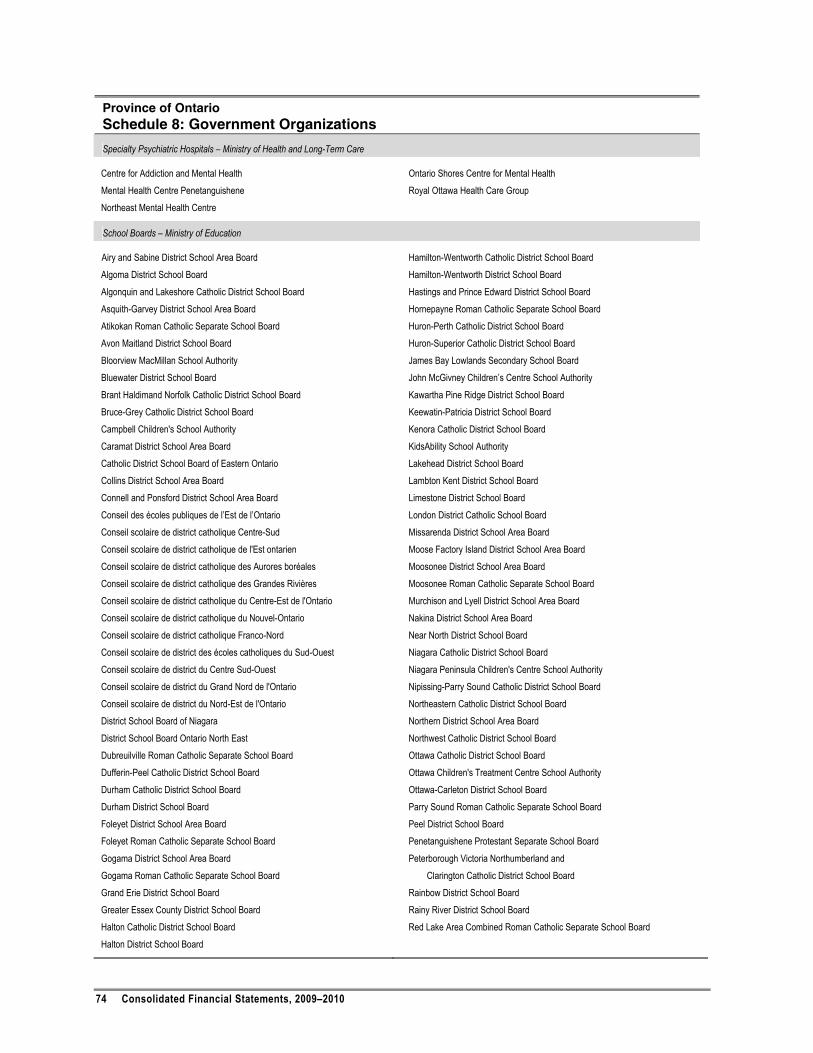
74 Consolidated Financial Statements, 2009–2010
Province of Ontario Schedule 8: Government Organizations
Specialty Psychiatric Hospitals – Ministry of Health and Long-Term Care
Centre for Addiction and Mental Health Mental Health Centre Penetanguishene Northeast Mental Health Centre
Ontario Shores Centre for Mental Health Royal Ottawa Health Care Group
School Boards – Ministry of Education
Airy and Sabine District School Area Board Algoma District School Board Algonquin and Lakeshore Catholic District School Board Asquith-Garvey District School Area Board Atikokan Roman Catholic Separate School Board Avon Maitland District School Board Bloorview MacMillan School Authority Bluewater District School Board Brant Haldimand Norfolk Catholic District School Board Bruce-Grey Catholic District School Board Campbell Children's School Authority Caramat District School Area Board Catholic District School Board of Eastern Ontario Collins District School Area Board Connell and Ponsford District School Area Board Conseil des écoles publiques de l’Est de l’Ontario Conseil scolaire de district catholique Centre-Sud Conseil scolaire de district catholique de l'Est ontarien Conseil scolaire de district catholique des Aurores boréales Conseil scolaire de district catholique des Grandes Rivières Conseil scolaire de district catholique du Centre-Est de l'Ontario Conseil scolaire de district catholique du Nouvel-Ontario Conseil scolaire de district catholique Franco-Nord Conseil scolaire de district des écoles catholiques du Sud-Ouest Conseil scolaire de district du Centre Sud-Ouest Conseil scolaire de district du Grand Nord de l'Ontario Conseil scolaire de district du Nord-Est de l'Ontario District School Board of Niagara District School Board Ontario North East Dubreuilville Roman Catholic Separate School Board Dufferin-Peel Catholic District School Board Durham Catholic District School Board Durham District School Board Foleyet District School Area Board Foleyet Roman Catholic Separate School Board Gogama District School Area Board Gogama Roman Catholic Separate School Board Grand Erie District School Board Greater Essex County District School Board Halton Catholic District School Board Halton District School Board
Hamilton-Wentworth Catholic District School Board Hamilton-Wentworth District School Board Hastings and Prince Edward District School Board Hornepayne Roman Catholic Separate School Board Huron-Perth Catholic District School Board Huron-Superior Catholic District School Board James Bay Lowlands Secondary School Board John McGivney Children’s Centre School Authority Kawartha Pine Ridge District School Board Keewatin-Patricia District School Board Kenora Catholic District School Board KidsAbility School Authority Lakehead District School Board Lambton Kent District School Board Limestone District School Board London District Catholic School Board Missarenda District School Area Board Moose Factory Island District School Area Board Moosonee District School Area Board Moosonee Roman Catholic Separate School Board Murchison and Lyell District School Area Board Nakina District School Area Board Near North District School Board Niagara Catholic District School Board Niagara Peninsula Children's Centre School Authority Nipissing-Parry Sound Catholic District School Board Northeastern Catholic District School Board Northern District School Area Board Northwest Catholic District School Board Ottawa Catholic District School Board Ottawa Children's Treatment Centre School Authority Ottawa-Carleton District School Board Parry Sound Roman Catholic Separate School Board Peel District School Board Penetanguishene Protestant Separate School Board Peterborough Victoria Northumberland and Clarington Catholic District School Board Rainbow District School Board Rainy River District School Board Red Lake Area Combined Roman Catholic Separate School Board
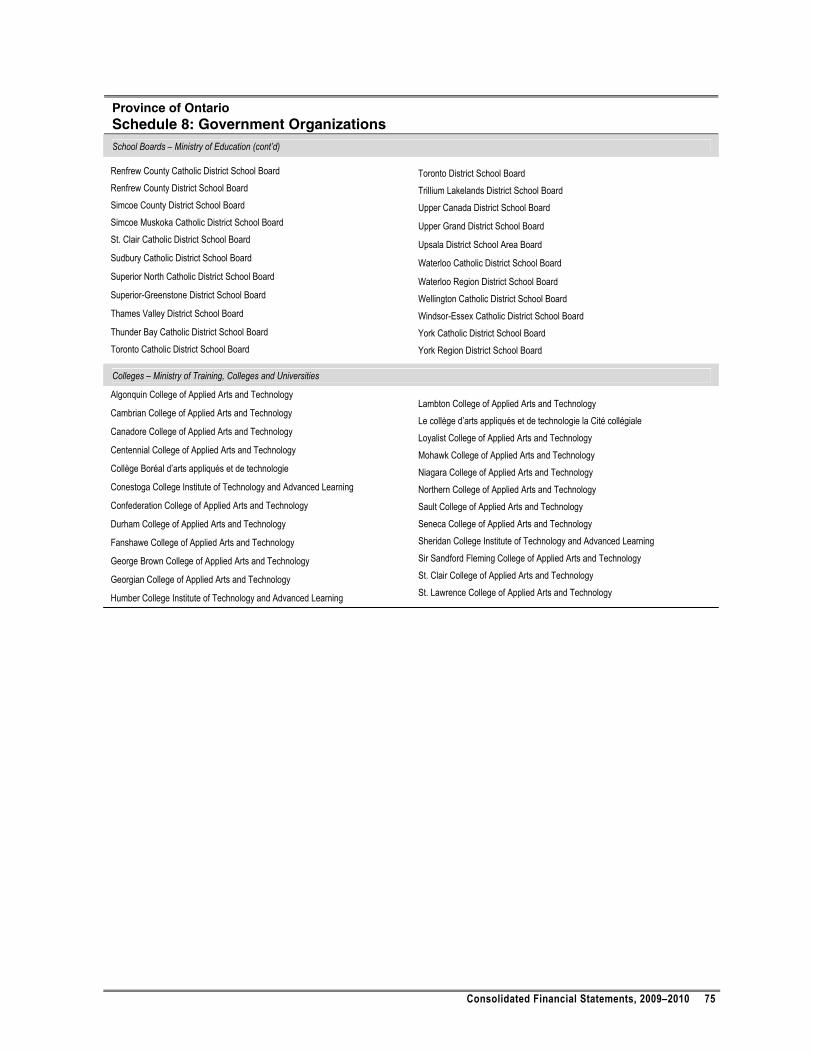
Consolidated Financial Statements, 2009–2010 75
Province of Ontario Schedule 8: Government Organizations
School Boards – Ministry of Education (cont’d)
Renfrew County Catholic District School Board Renfrew County District School Board Simcoe County District School Board Simcoe Muskoka Catholic District School Board St. Clair Catholic District School Board
Sudbury Catholic District School Board
Superior North Catholic District School Board
Superior-Greenstone District School Board
Thames Valley District School Board
Thunder Bay Catholic District School Board Toronto Catholic District School Board
Toronto District School Board Trillium Lakelands District School Board Upper Canada District School Board
Upper Grand District School Board
Upsala District School Area Board
Waterloo Catholic District School Board
Waterloo Region District School Board Wellington Catholic District School Board Windsor-Essex Catholic District School Board York Catholic District School Board York Region District School Board
Colleges – Ministry of Training, Colleges and Universities
Algonquin College of Applied Arts and Technology
Cambrian College of Applied Arts and Technology
Canadore College of Applied Arts and Technology
Centennial College of Applied Arts and Technology
Collège Boréal d’arts appliqués et de technologie
Conestoga College Institute of Technology and Advanced Learning
Confederation College of Applied Arts and Technology
Durham College of Applied Arts and Technology
Fanshawe College of Applied Arts and Technology
George Brown College of Applied Arts and Technology
Georgian College of Applied Arts and Technology
Humber College Institute of Technology and Advanced Learning
Lambton College of Applied Arts and Technology Le collège d’arts appliqués et de technologie la Cité collégiale Loyalist College of Applied Arts and Technology Mohawk College of Applied Arts and Technology Niagara College of Applied Arts and Technology Northern College of Applied Arts and Technology Sault College of Applied Arts and Technology Seneca College of Applied Arts and Technology Sheridan College Institute of Technology and Advanced Learning Sir Sandford Fleming College of Applied Arts and Technology St. Clair College of Applied Arts and Technology St. Lawrence College of Applied Arts and Technology
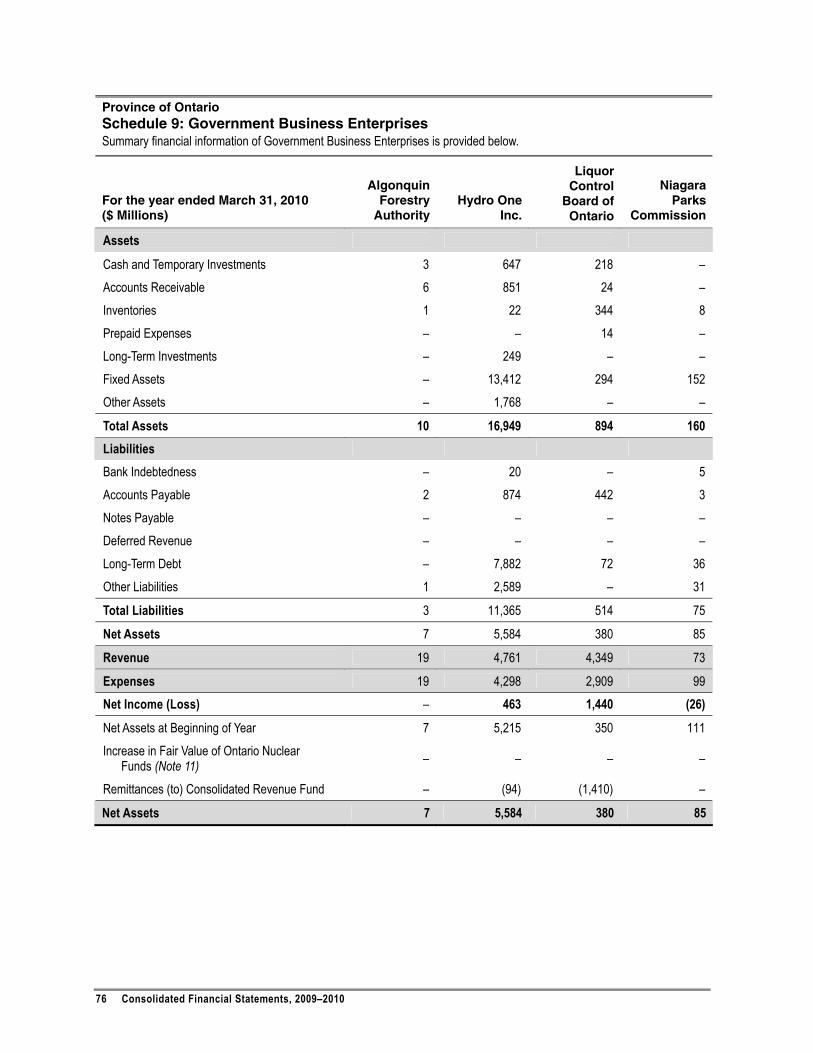
76 Consolidated Financial Statements, 2009–2010
Province of Ontario Schedule 9: Government Business Enterprises Summary financial information of Government Business Enterprises is provided below.
For the year ended March 31, 2010 ($ Millions)
Algonquin Forestry
Authority Hydro One
Inc.
Liquor Control
Board of Ontario
Niagara Parks
Commission
Assets
Cash and Temporary Investments 3 647 218 – Accounts Receivable 6 851 24 – Inventories 1 22 344 8 Prepaid Expenses – – 14 – Long-Term Investments – 249 – – Fixed Assets – 13,412 294 152 Other Assets – 1,768 – –
Total Assets 10 16,949 894 160 Liabilities Bank Indebtedness – 20 – 5 Accounts Payable 2 874 442 3 Notes Payable – – – – Deferred Revenue – – – – Long-Term Debt – 7,882 72 36 Other Liabilities 1 2,589 – 31
Total Liabilities 3 11,365 514 75
Net Assets 7 5,584 380 85
Revenue 19 4,761 4,349 73
Expenses 19 4,298 2,909 99 Net Income (Loss) – 463 1,440 (26)
Net Assets at Beginning of Year 7 5,215 350 111 Increase in Fair Value of Ontario Nuclear
Funds (Note 11) – – – –
Remittances (to) Consolidated Revenue Fund – (94) (1,410) –
Net Assets 7 5,584 380 85
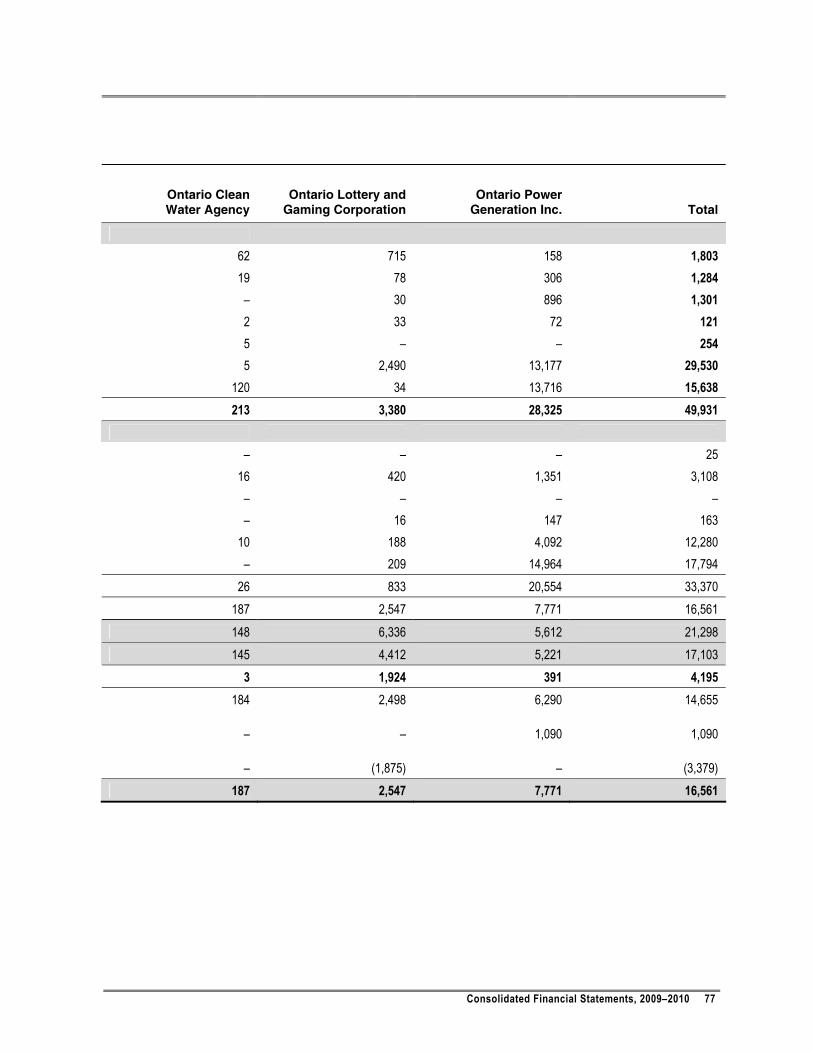
Consolidated Financial Statements, 2009–2010 77
Ontario Clean Water Agency
Ontario Lottery and Gaming Corporation
Ontario Power Generation Inc. Total
62 715 158 1,803 19 78 306 1,284 – 30 896 1,301 2 33 72 121 5 – – 254 5 2,490 13,177 29,530
120 34 13,716 15,638 213 3,380 28,325 49,931
– – – 25
16 420 1,351 3,108 – – – – – 16 147 163
10 188 4,092 12,280 – 209 14,964 17,794
26 833 20,554 33,370 187 2,547 7,771 16,561 148 6,336 5,612 21,298 145 4,412 5,221 17,103
3 1,924 391 4,195 184 2,498 6,290 14,655
– – 1,090 1,090
– (1,875) – (3,379) 187 2,547 7,771 16,561
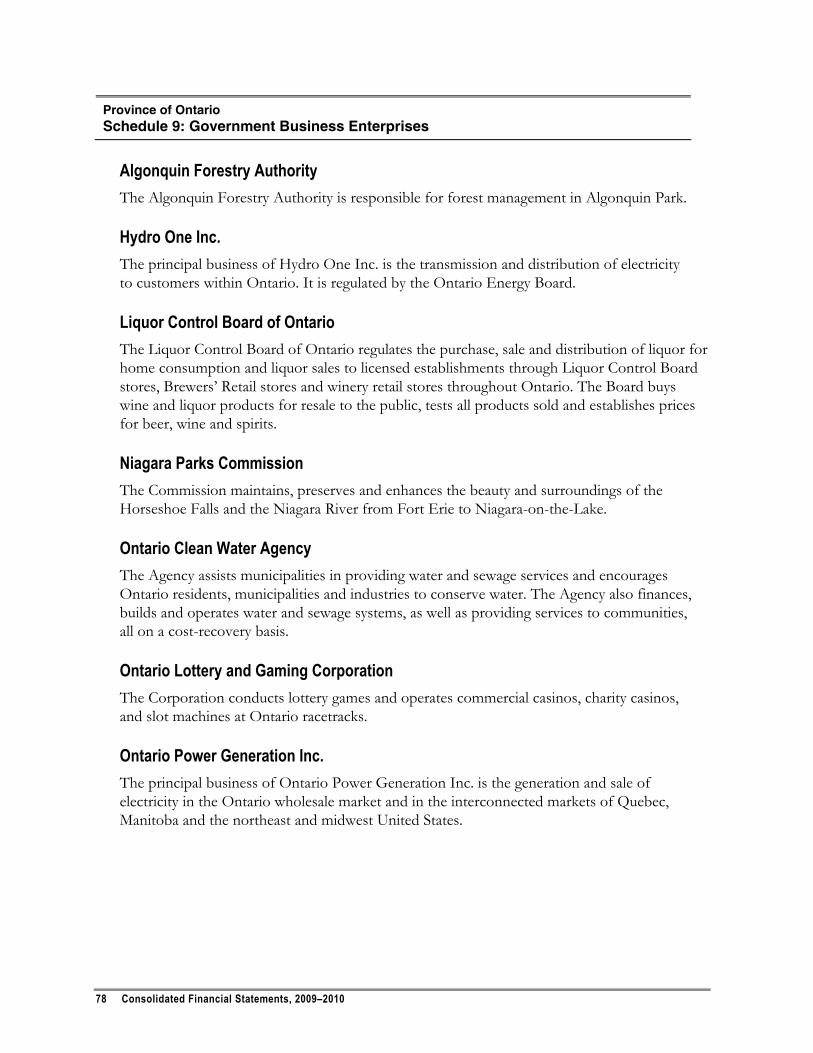
78 Consolidated Financial Statements, 2009–2010
Province of Ontario Schedule 9: Government Business Enterprises
Algonquin Forestry Authority The Algonquin Forestry Authority is responsible for forest management in Algonquin Park.
Hydro One Inc. The principal business of Hydro One Inc. is the transmission and distribution of electricity to customers within Ontario. It is regulated by the Ontario Energy Board.
Liquor Control Board of Ontario The Liquor Control Board of Ontario regulates the purchase, sale and distribution of liquor for home consumption and liquor sales to licensed establishments through Liquor Control Board stores, Brewers’ Retail stores and winery retail stores throughout Ontario. The Board buys wine and liquor products for resale to the public, tests all products sold and establishes prices for beer, wine and spirits.
Niagara Parks Commission The Commission maintains, preserves and enhances the beauty and surroundings of the Horseshoe Falls and the Niagara River from Fort Erie to Niagara-on-the-Lake.
Ontario Clean Water Agency The Agency assists municipalities in providing water and sewage services and encourages Ontario residents, municipalities and industries to conserve water. The Agency also finances, builds and operates water and sewage systems, as well as providing services to communities, all on a cost-recovery basis.
Ontario Lottery and Gaming Corporation The Corporation conducts lottery games and operates commercial casinos, charity casinos, and slot machines at Ontario racetracks.
Ontario Power Generation Inc. The principal business of Ontario Power Generation Inc. is the generation and sale of electricity in the Ontario wholesale market and in the interconnected markets of Quebec, Manitoba and the northeast and midwest United States.
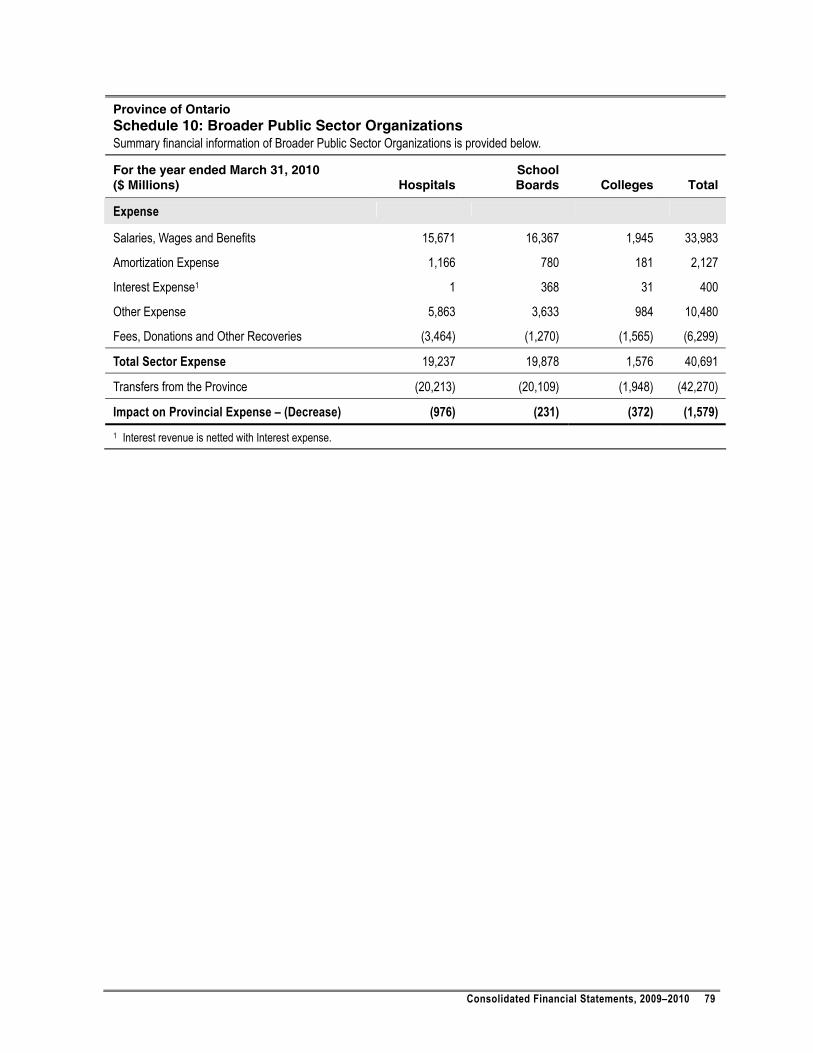
Consolidated Financial Statements, 2009–2010 79
Province of Ontario Schedule 10: Broader Public Sector Organizations Summary financial information of Broader Public Sector Organizations is provided below.
For the year ended March 31, 2010
($ Millions) Hospitals School Boards Colleges Total
Expense
Salaries, Wages and Benefits 15,671 16,367 1,945 33,983
Amortization Expense 1,166 780 181 2,127
Interest Expense1 1 368 31 400
Other Expense 5,863 3,633 984 10,480
Fees, Donations and Other Recoveries (3,464) (1,270) (1,565) (6,299)
Total Sector Expense 19,237 19,878 1,576 40,691
Transfers from the Province (20,213) (20,109) (1,948) (42,270)
Impact on Provincial Expense – (Decrease) (976) (231) (372) (1,579) 1 Interest revenue is netted with Interest expense.
80 Consolidated Financial Statements, 2009–2010
GLOSSARY
Note: The descriptions of the terms in the glossary are provided for the purpose of assisting readers of the 2009–10 Public Accounts. The descriptions do not affect or alter the meaning of any term under law. The glossary does not form part of the audited consolidated financial statements.
Accumulated Amortization: the total amortization that has been recorded over the life of an asset to date. The asset’s total cost less the accumulated amortization gives the asset’s net book value.
Accumulated Deficit: the difference between liabilities and assets. It represents the total of all past annual deficits minus all past annual surpluses, including prior period adjustments.
Amortization: expensing a portion of an asset’s cost in an accounting period by allocating its cost over its estimated useful life. This is applicable to tangible capital assets and items such as expenses relating to a debt issue.
Appropriation: an authority of the Legislative Assembly to pay money out of the Consolidated Revenue Fund or to incur a non-cash expense.
Broader Public Sector (BPS): public hospitals, special psychiatric hospitals, school boards and colleges. For financial statement purposes, universities and other organizations such as municipalities are excluded because they do not meet the criteria of government organizations as recommended by the Public Sector Accounting Board of the Canadian Institute of Chartered Accountants.
Canada Health Transfer (CHT): a federal transfer provided to each province and territory in support of health care.
Canada Social Transfer (CST): a federal transfer provided to each province and territory in support of post-secondary education, social assistance and social services, including early childhood development, early learning and child care.
Capital Gain: the profit arising from the sale or transfer of capital assets or investments. For accounting purposes, it is the proceeds or market value received less the net book value of the capital asset or investment.
Capital Lease: a lease that, from the point of view of the lessee, transfers substantially all the benefits and risks incident to ownership of property to the lessee.
Cash and Cash Equivalents: cash or other short-term liquid low-risk instruments that are readily convertible to cash, typically within three months or less.
Consolidated Revenue Fund (CRF): the aggregate of all public monies on deposit to the credit of the Minister of Finance or in the name of any agency of the Crown approved by the Lieutenant Governor in Council. Payments made from the CRF must be appropriated by a statute. See Appropriation.
Consolidated Financial Statements, 2009–2010 81
Consolidation: the inclusion of the financial results of government-controlled organizations in the Province’s consolidated financial statements.
Consumer Price Index (CPI): a broad measure of the cost of living. Through the monthly CPI, Statistics Canada tracks the retail price of a representative shopping basket of goods and services from an average household’s expenditure: food, housing, transportation, furniture, clothing, and recreation. The percentage of the total basket that any item occupies is termed the “weight” and reflects typical consumer spending patterns. Since people tend to spend more on food than clothing, changes in the price of food have a bigger impact on the index than, for example, changes in the price of clothing and footwear.
Contingency Fund: an amount of expense that is approved by the Legislative Assembly at the beginning of the year to cover higher spending due to unforeseen events. This approved spending limit is allocated during the year to ministries for their programs and activities. The actual costs incurred are charged to the respective programs and activities and not to the contingency fund. Therefore, contingency fund as at the end of the Province’s fiscal year is nil. See Reserve.
Contingent Liabilities: possible obligations that may result in the future sacrifice of economic benefits arising from existing conditions or situations involving uncertainty, that will ultimately be resolved when one or more future events not wholly within the government’s control occur or fail to occur. Resolution of the uncertainty will confirm the incurrence or non-incurrence of a liability.
Contractual Obligations: obligations of a government to others that will become liabilities when the terms of any contract or agreement, which the government had entered into, are met.
Debenture: a debt instrument where the issuer promises to pay interest and repay the principal by the maturity date. It is unsecured, meaning there is no lien on any specific asset.
Debt: an obligation resulting from the borrowing of money.
Deficit: the amount by which government expenses exceed revenues in any given year. On a forecast basis, a reserve may be included.
Derivatives: financial contracts that derive their value from other underlying instruments. The Province uses derivatives including swaps, forward foreign exchange contracts, forward rate agreements, futures and options to hedge and minimize interest costs.
Fair Value: the price that would be agreed upon in an arm’s length transaction and in an open market between knowledgeable, willing parties who are under no compulsion to act. It is not the effect of a forced or liquidation sale.
Financial Assets: assets that could be used to discharge existing liabilities or finance future operations and are not for consumption in the normal course of operations. Financial assets include cash; an asset that is convertible to cash; a contractual right to receive cash or another financial asset from another party; a temporary or portfolio investment; a financial claim on an outside organization or individual; and inventory.
82 Consolidated Financial Statements, 2009–2010
Financial Instrument: liquid asset, equity security in an entity, or a contract that gives rise to a financial asset of one contracting party and a financial liability or equity instrument of the other contracting party.
Fiscal Plan: an outline of the government’s consolidated revenue and expense plan for the upcoming fiscal year and the medium term, including information on the projected surplus/deficit. The plan is formally presented in the Budget, which the government presents in the spring of each year and is updated, as required, during the year. The fiscal plan numbers can be different from the expenditures outlined in the Printed Estimates.
Fiscal Year: the Province of Ontario’s fiscal year runs from April 1 of a year to March 31 of the following year.
Floating Rate Notes (FRNs): debt instruments that bear a variable rate of interest.
Forgivable Loan: advances where the terms and conditions of the loan agreement allow for the non-repayment of the principal or accrued interest when certain conditions are met.
Forward Contract: a contract that obligates one party to buy, and another party to sell, a specified amount of a particular asset at a0 specified price, on a given date in the future.
Forward Rate Agreement: a forward contract in which one party pays a fixed interest rate and receives a floating interest rate.
Fund: fiscal and accounting entity segregated for the purpose of carrying on specific activities, or attaining certain objectives in accordance with special regulations, restrictions or limitations.
Futures: an exchange-traded contract that confers an obligation to buy or sell a physical or financial commodity at a specified price and amount on a future date.
Gross Domestic Product (GDP): the total unduplicated value of the goods and services produced in the economy of a country or region during a given period of time such as a quarter or a year. Gross domestic product can be measured three ways: as total income earned in current production, as total final expenditures, or as total net value added in current production.
Hedging: a strategy to minimize the risk of loss on an asset (or a liability) from market fluctuations such as interest rate or foreign exchange rate changes. This is accomplished by entering into offsetting commitments with the expectation that a future change in the value of the hedging instrument will offset the change in the value of the asset (or the liability).
Indemnity: an agreement whereby one party agrees to compensate another party for any loss suffered by that party. The Province can either seek or provide indemnification.
Infrastructure: the facilities, systems and equipment required to provide public services and support private-sector economic activity including network infrastructure (e.g., roads, bridges, water and wastewater systems, large information technology systems), buildings (e.g., hospitals, schools, courts), and machinery and equipment (e.g., medical equipment, research equipment).
Consolidated Financial Statements, 2009–2010 83
Loan Guarantee: an agreement to pay all or part of the amount due on a debt obligation in the event of default by the borrower.
Net Book Value of Tangible Capital Assets: historical cost of tangible capital assets less both the accumulated amortization and the amount of any write-downs.
Net Debt: the difference between the Province’s total liabilities and financial assets. It represents the Province’s future revenue requirements to pay for past transactions and events.
Nominal: an amount expressed in dollar terms without adjusting for changes in prices due to inflation or deflation. It is not a good basis for comparing values of GDP in different years, for which a “real” value expressed in constant dollars (i.e., adjusted for price changes) is needed. See Real GDP.
Non-Financial Assets: assets that normally do not generate cash capable of being used to repay existing debts. The non-financial assets of the Province are tangible capital assets.
Non-Tax Revenue: revenue received by the government from external sources. This also includes revenues from the sale of goods and services, fines and penalties associated with the enforcement of government regulations and laws; fees and licences; royalties; profits from a self-sustaining Crown agency; and asset sales.
Ontario Disability Support Program (ODSP): a program designed to meet the unique needs of people with disabilities who are in financial need, or who want and are able to work and need support. Ontarians aged 65 years or older who are ineligible for Old Age Security may also qualify for ODSP supports if they are in financial need.
Option: a contract that confers the right, but not the obligation, to buy or sell a specific amount of a commodity, currency or security at a specific price, on a certain future date.
Present Value: the current worth of one or more future cash payments, determined by discounting the payments using a given rate of interest.
Program Expense: total expense excluding interest on debt.
Public Accounts: the Consolidated Financial Statements of the Province along with supporting statements and schedules as required by the Financial Administration Act.
Real GDP: gross domestic product measured to exclude the impact of changing prices.
Recognition: the process of including an item in the financial statements of an entity.
Reserve: an amount included in the fiscal plan to protect the plan against unforeseen adverse changes in the economic outlook, or in the Provincial revenue and expense. Actual costs incurred by the ministry, which pertains to the reserve, are recorded as expenses of that ministry. See Contingency Fund.
84 Consolidated Financial Statements, 2009–2010
Segment: a distinguishable activity or group of activities of a government for which it is appropriate to separately report financial information to help users of the financial statements identify the resources allocated to support the major activities of the government.
Sinking Fund Debenture: a debenture that is secured by periodic payments into a fund established to retire long-term debt.
Straight-Line Basis of Amortization: a method whereby the annual amortization expense is computed by dividing i) the historical cost of the asset by ii) the number of years the asset is expected to be used.
Surplus: the amount by which revenues exceed government expenses in any given year. On a forecast basis, a reserve may be included.
Tangible Capital Assets: physical assets including land, buildings, transportation infrastructure, vehicles, leased assets, machinery, furniture, equipment and information technology infrastructure and systems, and construction in progress.
Temporary Investments: investments that are transitional or current in nature and generally capable of reasonably prompt liquidation.
Total Debt: the Province’s total borrowings outstanding.
Total Expense: sum of program expense and interest on debt expense.
Transfer Payments: grants to individuals, organizations or other levels of government for which the government making the transfer does not
receive any goods or services directly in return, as would occur in a purchase or sale transaction;
expect to be repaid, as would be expected in a loan; or expect a financial return, as would be expected in an investment.
Treasury Bills: short-term debt instrument issued by governments on a discount basis.
Unrealized Gain or Loss: an increase or decrease in the fair value of an asset accruing to the holder. Once the asset is disposed of or written off, the gain or loss is realized.
Consolidated Financial Statements, 2009–2010 85
SOURCES OF ADDITIONAL INFORMATION
The Ontario Budget The Ontario government presents a Budget each year, usually in the early spring. This document outlines expected expense and revenue for the upcoming fiscal year. For an electronic copy of the Ontario Budget, visit the Ministry of Finance website at www.fin.gov.on.ca.
The Estimates of the Province of Ontario The government’s spending Estimates for the fiscal year commencing April 1 are presented to members of the Legislative Assembly following the presentation of the Ontario Budget by the Minister of Finance. The Estimates outline the spending plans of each ministry and are submitted for approval to the Legislative Assembly according to the Supply Act. For electronic access, go to: www.fin.gov.on.ca.
Ontario Finances This is a quarterly report on the performance of the government’s Budget for the fiscal year. It covers developments during a quarter and provides a revised outlook for the remainder of the year. For electronic access, go to: www.fin.gov.on.ca.
Ontario Economic Accounts This quarterly report contains data on Ontario’s economic activity. For electronic access, go to: www.fin.gov.on.ca.

Public Accounts
ofONTARIO
An n u A l Re p o R t A n d
Co n s o l i d A t e d Fi n A n C i A l st A t e m e n t s
2009–2010
mi n i s t R y o F Fi n A n C e
This publication is available in English and French. CD-ROM copies in either language may be obtained from:
ServiceOntario PublicationsTelephone: (416) 326-5300Toll-free: 1-800-668-9938
TTY Toll-free: 1-800-268-7095Website: www.serviceontario.ca/publications
For electronic access, visit the Ministry of Finance website at www.fin.gov.on.ca
Le présent document est publié en français et en anglais.On peut en obtenir une version sur CD-ROM dans l’une ou l’autre langue auprès de :
Publications ServiceOntarioTéléphone : 416 326-5300Sans frais : 1 800 668-9938
Téléimprimeur (ATS) sans frais : 1 800 268-7095Site Web : www.serviceontario.ca/publications
Pour en obtenir une version électronique, il suffit de consulter le site Web du ministère des Finances à www.fin.gov.on.ca
© Queen’s Printer for Ontario, 2010ISSN 0381-2375 (Print)
ISSN 1913-5556 (Online)
Please address your comments on this report to:
The Honourable Dwight DuncanMinister of Finance
7th FloorFrost Building South
7 Queen’s Park CrescentToronto, Ontario
M7A 1Y7
You can also send your comments to the Minister byelectronic mail to: