Embed Size (px)
Citation preview
Accounting Quality: International Accounting Standards and US GAAP
Mary E. Barth* Stanford University
Wayne R. Landsman, Mark Lang and Christopher Williams
University of North Carolina
March 2006 * Corresponding author: Graduate School of Business, Stanford University, 94305-5015, [email protected]. We appreciate funding from the Center for Finance and Accounting Research, Kenan-Flagler Business School.
Accounting Quality: International Accounting Standards and US GAAP
Abstract
We compare measures of accounting quality for firms applying IAS with US firms to investigate whether IAS are associated with less earnings management, more timely loss recognition, and higher value relevance of accounting amounts than US GAAP. We find that IAS firms exhibit lower accounting quality relative to US firms in terms of earnings smoothing, correlation between accruals and cash flows, timely loss recognition, and the association between accounting amounts and share price. Comparisons for IAS firms before and after they adopt IAS suggest that applying IAS moves firms closer to US GAAP. Conclusions are similar when we limit our sample to more recent periods. Comparing IAS firms with US GAAP reconciled from domestic GAAP and reported by non-US firms that cross list on US markets, we find that IAS accounting amounts are of similar quality to reconciled US GAAP amounts. Our results suggest that although IAS accounting amounts may not be of higher quality than those of US GAAP applied comprehensively, they are of comparable quality to reconciled US GAAP amounts reported by cross-listed firms.
1
1. Introduction
An ongoing debate in accounting regulation focuses on the appropriateness of requiring
reconciliation of accounting amounts produced by applying domestic Generally Accepted
Accounting Principles (GAAP) to US GAAP for non-US firms trading on US exchanges.
Historically, the US has required non-US firms listing on US exchanges to provide
reconciliations to US GAAP of earnings and book value of equity. This requirement stems from
the belief that US investors can make better investment decisions regarding non-US firms if the
investors have access to information about these firms that is “similar” and of “similar quality”
to that available for US firms (Jenkins, 1999). Of particular concern to securities regulators is
the belief that non-US domestic GAAP accounting standards provide greater opportunity for
non-US firms to engage in earnings management and smoothing (Breeden, 1994). This belief is
supported by prior research that suggests accounting amounts reported by non-US firms applying
domestic GAAP are generally of lower quality than those reported by US firms applying US
GAAP (Leuz, Nanda and Wysocki, 2003). In particular, such firms engage in more earnings
management, have less timely loss recognition, and have a lower association between accounting
amounts and share price.
International Accounting Standards (IAS) issued by the International Accounting
Standards Committee (IASC) that have evolved into International Financial Reporting Standards
(IFRS) issued by its successor body, the International Accounting Standards Board (IASB), have
emerged as a leading alternative to US GAAP for global reporting.1 Through its participation in
the International Organization of Securities Commissions (IOSCO), the US Securities and
1 IFRS include standards issued by the IASB and those issued by the IASC, some of which have been amended by the IASB. Our sample period pre-dates the effective dates of standards issued by the IASB. Thus, following the convention of Barth, Landsman, and Lang (2006), throughout we refer to our sample firms’ usage of IAS rather than IFRS.
2
Exchange Commission (SEC) has committed to cooperating in the development of IFRS that
would permit cross-listing on US exchanges without requiring firms to reconcile from IFRS to
US GAAP. In 2005, the SEC staff established a “roadmap” to eliminate the need for the
reconciliation requirement for firms using IFRS no later than 2009. SEC Chairman Donaldson
indicated that the SEC plans to base timing on, among other things, “the application and
interpretation of IFRS in financial statements across companies and jurisdictions.”2
Consistent with application of IAS resulting in high quality accounting amounts, Barth,
Landsman, and Lang (2006) finds that firms applying IAS generally report accounting amounts
that are of higher quality than firms applying non-US domestic GAAP. In particular, Barth,
Landsman, and Lang (2006) finds that firms applying IAS evidence less earnings management,
more timely loss recognition, and more value relevance of accounting than do a matched sample
of non-US firms applying domestic GAAP. Further, firms applying IAS generally exhibit higher
accounting quality after adopting IAS.
The question that remains for US policy makers is whether accounting amounts that
result from applying IAS are of sufficient quality relative to those that result from applying US
GAAP to eliminate the need for reconciliation to US GAAP. Pownall and Schipper (1999)
suggests most relevant to the SEC’s deliberations on removing the reconciliation requirement for
firms applying IAS would be research comparing the quality of IAS and US GAAP accounting
amounts. Yet, there is little evidence relating to this comparison. Further, as Pownall and
Schipper (1999) notes, the SEC is likely as interested in the quality of IAS amounts for firms that
do not currently trade on US markets as it is in the quality of IAS amounts for those that do.
This is because part of the SEC’s goal is to attract US listings by removing impediments.
2 “Chairman Donaldson Meets with EU Internal Market Commissioner McCreevy,” Press Release 2005-62, U.S. Securities and Exchange Commission, Washington, D.C., April 21, 2005.
3
Whether IAS result in accounting amounts that are of quality comparable to those
resulting from application of US GAAP is an open empirical question that we address.
Following prior research, we interpret earnings that exhibit less earnings management, more
timely loss recognition, and higher value relevance as being of higher quality. Our metrics of
earnings management are based on the variance of the change in net income, the ratio of the
variance of the change in net income to the variance of the change in cash flows, the correlation
between accruals and cash flows, and the frequency of small positive net income. Our metrics
for timely loss recognition are based on the frequency of large losses and the association between
bad-news returns and earnings, and our measures of value relevance are the explanatory powers
of income and equity book value for prices, and stock return for earnings.
We first conduct a cross-sectional comparison of characteristics of accounting amounts
for firms that apply IAS and a matched sample of US firms. Our results suggest that firms that
apply IAS generally have lower accounting quality than US firms. In particular, IAS firms have
a significantly lower variance of the change in net income, a lower ratio of the variances of the
change in net income and change in cash flows, a significantly more negative correlation
between accruals and cash flows, and a higher frequency of small positive net income. In
addition, they have a significantly lower frequency of large negative net income, and
significantly lower value relevance of earnings and equity book value for share prices.
Next, we repeat the comparison between the firms that apply IAS and the matched
sample of US firms but using sample data from the period before IAS firms adopted IAS, i.e.,
when they applied domestic GAAP, to determine if the difference in accounting quality
diminishes with the application of IAS. Findings generally indicate that application of IAS
reduces the difference in accounting quality between the IAS and US firms.
4
Third, we repeat our analysis comparing quality of accounting amounts for firms
applying IAS and US GAAP but limiting data to the most recent sample years. IAS underwent
several changes during our sample period. Thus, it is possible that IAS improved sufficiently in
recent years that accounting quality for firms applying IAS and US GAAP are similar, but this is
obscured because our primary tests are based on sample data spanning nearly a decade.
Inferences based on this analysis are the same as based on the full sample, suggesting that even
for more recent years, accounting amounts for US firms are of higher quality than those for IAS
firms.
Finally, we compare accounting quality for IAS firms and for cross-listed firms that
reconcile accounting amounts to US GAAP on Form 20-F. From the SEC’s standpoint, this may
be the more relevant comparison because their decision is whether to allow IAS for cross-listing
as a substitute for requiring reconciliations on Form 20-F. Findings in Lang, Raedy, and Wilson
(2005) suggest that reconciled US GAAP accounting amounts provided by cross-listed firms are
of lower quality than for those of US firms. But, it is not clear how the quality of the reconciled
amounts and IAS accounting amounts compares. By comparing firms applying IAS with firms
applying domestic GAAP and reconciling to US GAAP on Form 20-F, we provide evidence on
whether the reconciliation requirement provides investors with higher quality accounting
amounts relative to IAS. Also, this comparison mitigates the potentially confounding effects of
underlying economic factors affecting accounting quality in the US relative to non-US
environments. However, in this comparison we are limited in our ability to match IAS and 20-F
firms because both samples are relatively small. As a result, when conducting our tests we rely
on control variables and fixed effects used in related prior research.
5
Our results suggest that IAS accounting amounts are of similar quality to the reconciled
US GAAP amounts presented on Form 20-F. In particular, consistent with higher quality, IAS
firms have higher variance of the change in net income, a higher ratio of the variances of the
change in net income and change in cash flows, and a higher value relevance of earnings and
equity book value in a price regression and of earnings in a bad news return regression.
However, consistent with lower quality, IAS firms have a significantly more negative correlation
between accruals and cash flows, and a significantly higher frequency of small positive net
income. These results suggest that IAS accounting amounts provide investors with information
comparable in quality to that provided in Form 20-F.
The remainder of our paper is organized as follows. The next section discusses related
literature. Sections three and four develop our hypotheses and explain our research design.
Sections five and six describe our sample and data and present our results. Section seven offers
our summary and concluding remarks.
2. Related Literature
There are few studies comparing properties of accounting amounts prepared using IAS to
those prepared using US GAAP, generally in fairly narrow contexts, and results are generally
mixed. Leuz (2003) compares measures of information asymmetry for firms on Germany’s New
Market and finds little evidence of differences in bid/ask spreads and trading volume for firms
that apply US GAAP relative to those that apply IAS. However, measures of information
asymmetry are noisy and incorporate a wide range of factors beyond accounting quality. In
contrast, Bartov, Goldberg, and Kim (2004) documents that earnings response coefficients are
highest for German firms applying US GAAP, followed by those applying IAS and German
GAAP. However, earnings response coefficients also reflect a range of factors beyond
6
accounting quality. Harris and Muller (1999) provides evidence that US GAAP reconciliations
for firms applying IAS are value relevant incremental to IAS for 31 IAS firms cross listed on US
markets over the period 1992-1996. However, it is difficult to generalize from this study
because the results differ across empirical specifications, the sample size is small, and the period
studied pre-dates substantial changes in IAS after 1996. Also, given that cross-listed firms are
required to reconcile to US GAAP, they may make IAS-consistent choices under domestic
standards to minimize the number of reconciling items (Lang, Raedy, and Wilson, 2005).
Much of the prior literature focuses on comparisons of accounting amounts resulting
from applying domestic GAAP with those resulting from applying IAS, with a goal of
determining whether applying IAS is associated with higher accounting quality. Barth,
Landsman, and Lang (2006) compares attributes of accounting amounts resulting from applying
domestic GAAP to those resulting from applying IAS for 411 firms across 24 countries. The
study provides evidence that accounting amounts for firms applying IAS evidence less earnings
management, more timely recognition of losses, greater value relevance of accounting amounts,
and a lower cost of capital. In addition, firms applying IAS evidence significant changes in these
same attributes following application of IAS relative to prior period when they applied domestic
GAAP, which suggests that applying IAS is associated with improved accounting quality.3
Other studies examine IAS in particular country settings, with generally mixed results.
Bartov, Goldberg, and Kim (2004), Hung and Subramanyam (2004), and Van Tendeloo and
Vanstraelen (2005) compare German firms applying IAS and German GAAP. They provide
mixed evidence on the superior quality of IAS. Hung and Subramanyam (2004) provides
3 Findings in Ashbaugh and Pincus (2001) also suggest that IAS are of higher quality by showing that firms using IAS exhibit smaller analyst forecast errors than those applying domestic GAAP. In particular, the study finds that the greater the difference between domestic GAAP and IAS, the greater are the forecast errors and that forecast errors tend to be smaller after firms apply IAS. However, forecastable earnings are not necessarily of higher quality because, for example, smoothed earnings are typically more forecastable.
7
evidence that reconciling items from IAS to German GAAP are not value relevant and Van
Tendeloo and Vanstraelen (2005) finds no evidence that IAS firms engage in less earnings
smoothing. However, Bartov, Goldberg, and Kim (2004) documents that IAS firms have higher
earnings response coefficients than German GAAP firms, which the authors interpret as evidence
of higher accounting quality. Similarly, Eccher and Healy (2003) finds no evidence that in
China accounting amounts based on IAS are more value relevant than those based on Chinese
GAAP.
Extant research does not provide clear evidence on how IAS in practice compare with US
GAAP. Providing evidence on this issue is particularly timely because, as noted above, the SEC
is actively considering permitting cross listing based on IAS without reconciliation to US GAAP.
3. Hypothesis Development
3.1 IAS AND ACCOUNTING QUALITY
A primary goal of the IASB is to develop a single set of high quality, global accounting
standards that are accepted worldwide for general purpose financial statements. To achieve this
goal, relative to domestic GAAP in most countries, the IASB limits allowable alternative
accounting practices and provides a consistent approach to accounting measurement for the
purpose of having a firm’s recognized amounts faithfully represent its underlying economics.
However, the IASB has adopted an approach in developing standards different from the FASB
that could increase management discretion in recognizing accounting amounts. In particular, the
IASB’s approach relies more on principles, whereas the FASB’s approach relies more on rules.4
Reliance on principles specifies guidelines, but requires judgment in application. Reliance on
4 The distinction here is more relative than absolute. IAS and US GAAP include both general principles and rules, depending on context (Schipper 2003). However, the FASB has generally provided more detailed guidance on application of accounting principles than has the IASB.
8
rules specifies more requirements that leave less room for discretion. Ewert and Wagenhofer
(2005) develops a rational expectations model that shows that accounting standards that limit
opportunistic discretion result in accounting earnings that are more reflective of a firm’s
underlying economics and, therefore, are of higher quality. The inherent flexibility IAS
principles-based standards afford can allow firms to manage earnings, thereby decreasing
accounting quality.
There are additional reasons beyond the accounting standards why accounting amounts
resulting from applying IAS may be of lower quality than those resulting from applying US
GAAP. For example, Cairns (1999), Street and Gray (2001), and Ball, Robin, and Wu (2003)
suggest that lax enforcement can result in limited compliance with IAS, thereby limiting their
effectiveness. Findings in Bradshaw and Miller (2005) and Lang, Raedy, and Wilson (2005)
suggest that both accounting standards and the regulatory and litigation environment are
important to the application of accounting standards. Therefore, the question remains whether
accounting quality is higher applying US GAAP than applying IAS. Given the principles-based
approach of IAS and issues related to its application, we predict that application of US GAAP
results in accounting amounts that are of higher quality than those resulting from application of
IAS. Despite the bases for our prediction, there are reasons our prediction may be refuted. First,
proponents of IAS contend that more principles-based standards can result in higher quality
accounting amounts because managers have more discretion to select accounting amounts that
better reflect a firm’s economic position and performance. Second, even if accounting amounts
resulting from applying IAS were initially of lower quality, IAS have evolved substantially in
9
recent years, which may have reduced any difference in quality between US GAAP and IAS
accounting amounts.5
We have no basis for predicting whether firms applying IAS or those applying US GAAP
only in reconciliations from domestic GAAP have higher quality accounting amounts. Prior
research suggests that IAS accounting amounts may be of higher quality than domestic GAAP
(Bartov, Goldberg, and Kim, 2004; Barth, Landsman, and Lang, 2006). However, studies
comparing US firms applying US GAAP to non-US firms applying domestic GAAP but
reconciling accounting amounts to US GAAP using Form 20-F suggest that reconciled US
GAAP accounting amounts for these non-US firms are of lower quality than US GAAP applied
comprehensively by US firms (Lang, Raedy, and Wilson, 2005). Based on this evidence, it is
difficult to predict how the quality of IAS accounting amounts compare to reconciled US GAAP
amounts reported on Forms 20-F.
3.2 MEASURES OF ACCOUNTING QUALITY
Following prior research, we operationalize accounting quality using earnings
management, timely loss recognition, and value relevance metrics. We predict firms with higher
quality earnings exhibit less earnings management, more timely loss recognition, and higher
value relevance of earnings and equity book value.
We examine two manifestations of earnings management, earnings smoothing and
managing towards positive earnings. As discussed in section 3.1, we expect US GAAP earnings
to be less managed than IAS GAAP earnings because US accounting standards limit
management’s discretion to report earnings less reflective of the firm’s economic performance.
Regarding earnings smoothing, following prior research, we expect that firms that smooth
earnings less will exhibit more earnings variability after controlling for other economic 5 As described below, we address this second point by conducting analyses using sample years beginning in 2001.
10
determinants of earnings volatility (Lang, Raedy, and Yetman, 2003; Leuz, Nanda, and Wysocki,
2003; Lang, Raedy, and Wilson, 2005; Barth, Landsman, and Lang, 2006). We predict that firms
applying US GAAP exhibit more variable earnings than those applying IAS.6 As noted above,
we have no basis for predicting whether the US GAAP amounts for firms applying domestic
GAAP but reconciling accounting amounts to US GAAP on Form 20-F exhibit more earnings
smoothing than those firms applying IAS. As a consequence, we predict both sets of firms have
the same amount of earnings smoothing. To test our predictions, we use two measures of
earnings variability, variability in change in net income and variability of change in net income
relative to variability of change in cash flow.
We also expect that firms with less earnings smoothing exhibit a more negative
correlation between accruals and cash flows (Lang, Raedy, and Yetman, 2003; Leuz, Nanda, and
Wysocki, 2003; Lang, Raedy, and Wilson, 2005; Barth, Landsman, and Lang, 2006). Because
accruals reverse over time, accruals and cash flows tend to be negatively correlated even in the
absence of earnings management. Land and Lang (2002) and Myers and Skinner (2002), among
others, argue that a more negative correlation indicates earnings smoothing because managers
respond to weak (strong) cash flow outcomes by increasing (decreasing) accruals. Thus, we
predict that firms applying US GAAP exhibit a less negative correlation between accruals and
cash flows than those applying IAS, and that firms applying IAS and the US GAAP amounts for
firms applying domestic GAAP and reconciling accounting amounts to US GAAP exhibit the
same negative correlation between accruals and cash flows.
Prior research identifies positive earnings as a common target of earnings management.
Evidence of managing towards positive earnings is a larger frequency of small positive earnings
6 Our prediction is supported by Ewert and Wagenhofer (2005), which shows that applying accounting standards that limit management’s discretion should result in higher variability in accounting earnings. See Barth, Landsman, and Lang (2006) for more discussion.
11
(Burgstahler and Dichev, 1997; Leuz, Nanda, and Wysocki, 2003). The notion underlying this
target is that management prefers to report small positive earnings rather than negative earnings.
If US GAAP reduces managerial discretion relative to IAS, we expect that firms applying US
GAAP report small positive earnings with lower frequency than those applying IAS, and that
firms applying IAS and the US GAAP amounts for firms applying domestic GAAP and
reconciling accounting amounts to US GAAP report small positive earnings with similar
frequency.
Regarding timely loss recognition, we expect firms with higher quality earnings to
exhibit a larger frequency of large losses. This is consistent with Ball, Kothari, and Robin
(2000), Lang, Raedy, and Yetman (2003), Leuz, Nanda, and Wysocki (2003), and Lang, Raedy,
and Wilson (2005) that suggest that one characteristic of higher quality earnings is that large
losses are recognized as they occur rather than deferred to future periods. This characteristic is
closely related to earnings smoothing in that if earnings are smoothed, large losses should be
relatively rare. Thus, we predict that firms applying US GAAP report large losses with higher
frequency than those applying IAS, and that firms applying IAS and the US GAAP amounts for
firms applying domestic GAAP and reconciling accounting amounts to US GAAP report large
losses with similar frequency.
Turning lastly to value relevance, we expect firms with higher quality earnings have a
higher association between stock prices and earnings and equity book value because higher
quality earnings better reflect a firm’s underlying economics (Barth, Beaver, and Landsman,
2001). First, higher quality earnings are the product of applying accounting standards that
require recognition of amounts that are intended to faithfully represent a firm’s underlying
economics. Second, higher quality earnings are less subject to opportunistic managerial
12
discretion. Prior research also suggests that higher quality earnings are more value relevant
(Lang, Raedy, and Yetman, 2003; Lang, Raedy, and Wilson, 2005; Barth, Landsman, and Lang,
2006). Accordingly, we predict that firms applying US GAAP exhibit higher value relevance of
earnings and equity book value than firms applying IAS, and that firms applying IAS and the US
GAAP amounts of firms applying domestic GAAP and reconciling accounting amounts to US
GAAP exhibit similar value relevance.7 In addition, because more timely loss recognition
should increase the value relevance of accounting amounts for bad news firm, i.e., those with
negative stock returns (Ball, Kothari, and Robin, 2000), we expect our predicted difference in
value relevance between IAS and US firms to be most pronounced for bad news firms.
We examine whether firms applying US GAAP, applying IAS, and applying domestic
GAAP and reconciling accounting amounts to US GAAP have predicted differences in earnings
quality (and equity book value in the value relevance tests) by conducting a range of tests
relating to earnings management, timely loss recognition, and value relevance. We infer higher
quality from a consistent pattern of evidence provided by the portfolio of tests.8
4. Research Design
To test our predictions, we first compare firms that apply IAS, “IAS firms,” to a matched
sample of US GAAP firms, “US firms,” in the period after IAS adoption. To compare IAS and
US firms, following Barth, Landsman, and Lang (2006), we identify each IAS firm’s country,
industry (i.e., three-digit SIC code), and adoption year. We then select as the matched US firm a
7 Examining value relevance in this context is subject to at least two caveats. First, it presumes the pricing process is similar across firms and across countries, after we match on and control for firm size and industry. For example, Eccher and Healy (2003) provides evidence that prices reflect investor clienteles that can differ across firms and countries. Second, earnings smoothing can increase the association between earnings and share prices. For example, the presence of large asset impairments is likely to be positively associated with frequency of large negative net income, but could reduce the value relevance of accounting earnings because extreme losses tend to have a low correlation with share prices and returns. See Wysocki (2005) for a discussion of various approaches to assessing accounting quality. 8 See Barth, Landsman, and Lang (2006) for a discussion of the benefits of this portfolio approach.
13
US firm in the same industry as the IAS firm whose size as measured by equity market value is
closest to the IAS firm’s at the end of the year of its adoption. Our analyses include all firm-
years for which the IAS firm and its matched US firm both have data. For example, if the IAS
firm has data from 1994 through 2000, and its matched US firm has data for 1995 through 2002,
then our analysis includes data from 1995 through 2000 for the IAS firm and its matched US
firm.
It is possible that our matching procedure fails to control for differences between IAS and
US firms that are correlated with differences in accounting quality. Therefore, following Barth,
Landsman, and Lang (2006), when conducting our tests we include controls for leverage,
growth, equity and debt issuance, total asset turnover, size, cash flows, and auditor.9
We then examine whether IAS firms exhibit differences in accounting quality in
comparison to US GAAP amounts for firms applying domestic GAAP and reconciling
accounting amounts to US GAAP on Form 20-F, “20-F firms”. Ideally, we would follow a
similar matching procedure for IAS and 20-F firms, matching on industry and size. However,
data limitations preclude us from doing so because the resulting matched sample would be too
small to conduct meaningful tests. Therefore, all tests comparing IAS and 20-F firms include all
available firms with overlapping sample years. When conducting our tests, we include controls
for factors that could be correlated with differences in accounting quality and also require 20-F
firms to be from the same countries as the IAS firms.
4.1 Earnings Management
Our first earnings management measure is based on the variability of the change in net
income scaled by total assets, (Lang, Raedy, and Wilson, 2005; Barth, Landsman, and NIΔ
9 Untabuled findings indicate that inferences are insensitive to inclusion of the controls.
14
Lang, 2006).10 A smaller variance in the change in net income is evidence consistent with
earnings smoothing. However, net income is likely to be sensitive to a variety of factors that
reflect differences in economic environments between the US and IAS countries unrelated to
earnings smoothing. Although our matching procedure mitigates the confounding effects of
these factors, some effects may remain. Therefore, our measure of earnings variability is the
variance of the residuals from the regression of change in net income on control variables
identified in prior research (Ashbaugh, 2001; Pagano et al., 2002; Lang, Raedy, and Yetman,
2003; Lang, Raedy, and Wilson, 2005; Barth, Landsman, and Lang, 2006), ΔNI*:
ititititit
ititititit
AUDCFTURNDISSUELEVEISSUEGROWTHSIZENI
εααααααααα++++
+++++=Δ
8765
43210
(1)
SIZE is the natural logarithm of end of year market value of equity, is percentage
change in sales, is percentage change in common stock, LEV is end of year total
liabilities divided by end of year equity book value, is percentage change in total
liabilities, TURN is sales divided by end of year total assets, CF is annual net cash flow from
operating activities, and AUD is an indicator variable that equals one if the firm’s auditor is PwC,
KPMG, Arthur Andersen, E&Y, or D&T, and zero otherwise. Equation (1) also includes
country and industry fixed-effects, as do equations (2) through (4).
GROWTH
EISSUE
DISSUE
We estimate equation (1) pooling observations that are relevant to the particular
comparison we test. For example, when comparing IAS and US firms in the post-adoption
period, we pool all sample years in the post-adoption period. Similarly, when comparing IAS
and 20-F firms, we pool all sample years in the post-adoption period. For this comparison, the
10 DataStream provides several definitions of operating income. The one we use does not include extraordinary items and other non-operating income. However, because the criterion for extraordinary items differs across countries and excluding extraordinary items could result in differences based on the location on the income statement of one-time items, we replicate the analysis including extraordinary and non-operating items. Results are similar.
15
variability of ΔNI* is the cross-sectional variance of the IAS and US (or 20-F) firms’ respective
residuals from equation (1) in the post-adoption period. When comparing IAS firms in the post-
and pre-adoption periods, we pool all sample years for IAS firms. For this comparison, the
variability of ΔNI* is the respective cross-sectional variance of residuals for the IAS firms in the
post- and pre-adoption periods. We test for differences in these variances using a variance ratio
F-test.
Our second measure of earnings smoothing is based on the ratio of the variability of the
change in net income, , to the variability of the change in operating cash flows, .
Firms with more volatile cash flows typically have more volatile net income, and our second
measure controls for this. If firms use accruals to manage earnings, the variability of the change
in net income should be lower than that of operating cash flows. As with
NIΔ CFΔ
NIΔ , is likely to
be sensitive to a variety of factors related to firms’ incentives to adopt IAS that are unrelated to
earnings smoothing. Therefore, we also estimate an equation similar to equation (1), but with
as the dependent variable:
CFΔ
CFΔ
ititititit
ititititit
AUDCFTURNDISSUELEVEISSUEGROWTHSIZECF
εααααααααα++++
+++++=Δ
8765
43210
(2)
As with equation (1), we pool observations appropriate for the particular comparison. The
variability of ΔCF* is the cross-sectional variance of groups of residuals from equation (2),
where the composition of the groups depends on the particular comparison we test. Our resulting
second measure is the ratio of the variability of ΔNI* to variability of ΔCF*. As in Lang, Raedy,
and Wilson (2005) and Barth, Landsman, and Lang (2006), we do not test the differences
because we are unaware of any statistical test for differences in the ratios of variances.
16
Our third measure of earnings smoothing is based on the Spearman correlation between
accruals and cash flows. As with the two variability measures based on equations (1) and (2),
because our matching procedure may not fully eliminate the sensitivity of the accruals and cash
flows correlation to factors unrelated to earnings smoothing, we compare correlations of
residuals from equations (3) and (4), CF* and ACC*, rather than correlations between CF and
ACC directly. As with the equations (1) and (2), both CF and ACC are regressed on the control
variables, but excluding CF:
itititit
ititititit
AUDTURNDISSUELEVEISSUEGROWTHSIZECF
εαααααααα
++++++++=
765
43210
(3)
itititit
ititititit
AUDTURNDISSUELEVEISSUEGROWTHSIZEACC
εαααααααα
++++++++=
765
43210
(4)
We test for differences in the correlations between CF* and ACC* based on the squared
correlation as derived in Cramer (1987).
Our measure of managing towards positive earnings is the coefficient on small positive
net income, SPOS, in equations (5) and (6).
ititititit
ititititit
AUDCFTURNDISSUELEVEISSUEGROWTHSIZESPOSIAS
εαααααααααα
++++++++++=
98765
43210
)1,0(
(5)
)1,0(IAS is an indicator variable set to one for IAS firms and zero for US firms or 20-F firms,
depending on the comparison we test, and is an indicator variable that equals one if net
income scaled by total assets is between 0 and 0.01 (Lang, Raedy, and Yetman, 2003). A
positive coefficient on suggests that IAS firms manage earnings toward small positive
amounts more frequently than do US or 20-F firms. We use the coefficient on SPOS from
equation (5) rather than directly comparing the percentages of small positive income to assess
SPOS
SPOS
17
whether IAS firms are less likely to manage earnings because the matching procedure may not
fully capture differences in economic factors associated with firms applying IAS.
4.2 Timely Loss Recognition
We measure timely loss recognition as the coefficient on the percentage of large negative
net income, LNEG, in equations (6) (Lang, Raedy, and Yetman, 2003; Lang, Raedy, and Wilson,
2005; Barth, Landsman, and Lang, 2006).
itititititit
itititititAUDCFTURNDISSUELEV
EISSUEGROWTHSIZELNEGIASεααααα
ααααα++++++++++=
98765
43210
)1,0( (6)
LNEG is an indicator variable set to one for observations for which annual net income
scaled by total assets is less than −0.20, and zero otherwise. A positive coefficient on LNEG
suggests that IAS firms recognize large losses more frequently than US or 20-F firms. As with
equation (5), we use the coefficient on LNEG from equation (6) rather than directly comparing
the percentages of large losses to assess whether IAS firms are less likely to manage earnings.11
Equations (5) and (6) include industry fixed effects.
4.3 Value Relevance
The first value relevance measure is based on the explanatory power from a regression of
stock price on earnings and equity book value. To obtain a measure of value relevance that is
unaffected by differences in value relevance across countries and industries, when comparing
IAS and US firms, and IAS and 20-F firms, we first regress stock price, P, on country and
industry fixed effects.12 We regress the residuals from this regression, P*, on equity book value
per share, BVEPS, and net income per share, NIPS, separately for IAS firms and US firms (or 20-
11 In the analyses of small positive and large negative net income, we report results from OLS estimation, rather than from a logit estimation because the model rejects the test for homoskedasticity. Greene (1993) reports that logit models are extremely sensitive to the effects of heteroskedasticity. 12 We cannot match on industry in the IAS/20-F value relevance tests because there are too few firms in each industry for the 20-F sample, although we do include industry fixed effects as controls.
18
F firms) in both the post- and pre-adoption periods, i.e., we estimate four regressions. Following
prior research, to ensure accounting information is in the public domain, we measure P six
months after fiscal year-end (Lang, Raedy, and Yetman, 2003; and Lang, Raedy, and Wilson,
2005; Barth, Landsman, and Lang, 2006). Our first value relevance measure is the adjusted R2
from equation (7).
itititit NIPSBVEPSP εβββ +++= 210* (7)
We test for significance in difference of R2s in all value relevance tests based on the Cramer
(1987) test.
Our second and third value relevance measures are based on the explanatory power from
regressions of net income per share on annual stock return. Ball, Kothari, and Robin (2000)
predicts that accounting quality differences will be most pronounced for “bad news” because
when firms have “good news” they have less incentive to manage earnings. Thus, we estimate
the earnings-returns relation separately for positive and negative return subsamples. Because we
partition firms based on the sign of the return, we estimate two “reverse” regressions with
earnings as the dependent variable, where one is for good news firms and the other is for bad
news firms. As with our first value relevance measure, to obtain good and bad news value
relevance measures that are unaffected by differences in value relevance across countries and
industries, when comparing IAS and US firms, and IAS and 20-F firms, we first regress net
income per share, NI/P, on country and industry fixed effects. We regress the residuals from this
regression, NI/P*, on annual stock return, RETURN, the twelve-month stock return commencing
nine months before fiscal year end and ending three months after fiscal year end (Lang, Raedy,
and Wilson, 2005; Barth, Landsman, and Lang, 2006). Our second and third value relevance
measures are the R2s from equation (8) estimated for good news and bad news firms.
19
ititit RETURNPNI εββ ++= 10*]/[ (8)
As with equation (7), we estimate equation (8) separately for IAS and US firms in both the post-
and pre-adoption periods, as well as for 20-F firms.
5. Data and Sample
Our sample comprises 2,553 firm year observations for 428 firms applying IAS for which
DataStream data are available over the period 1990 through 2004.13 We obtain our sample of
IAS firms from Worldscope, and gather financial and accounting data from DataStream. Data
for US firms are collected from Compustat and CRSP. 20-F firms’ data are also obtained from
Compustat except net income and equity book value, which are obtained from Forms 20-F. We
winsorize all variables used to construct our metrics at the 5% level to mitigate the effects of
outliers on our inferences.
Table 1, panel A, includes descriptive statistics for our sample firms in terms of country
representation. In general, the sample firm-years are from a wide range of countries, with
greatest representation from Switzerland, Germany, and China. Panel B of table 1 reports
representation by industry. The sample also comprises a range of industries, with most firms in
manufacturing, finance, insurance and real estate, or services. However, our matching criteria
are designed to control for industry effects. Panel C of table 1 reports representation by number
of observations and IAS adoption year. The sample observations are from a wide range of years,
as are the IAS adoptions.
Table 2 reports descriptive statistics for IAS and US firms. In terms of the variables of
interest, US firms have fewer incidents of small positive earnings and more incidents of large
13 Our data were obtained from DataStream in October 2004. The way DataStream constructs the database changed shortly thereafter, making it more difficult to ensure that subsequent accounting data are as reported. However, our analyses should be unaffected because our data pre-date the change.
20
negative earnings. Although these statistics do not control for other factors, they suggest that US
firms are less likely to manage earnings towards a target and more likely to recognize losses in a
timely manner than IAS firms. In terms of control variables, IAS and US firms have similar
growth rates (median 7% versus 8%) and are of similar size, reflecting our matching procedure.
Further, IAS firms are more highly levered than US firms (median 1.47 versus 0.99), although
IAS firms issue only somewhat more debt and issue similar amounts of equity compared with
US firms. IAS firms have lower asset turnover than US firms (median 0.76 versus 0.88), have
similar cash flows (median 0.07 versus 0.06), and are less likely to be audited by a large,
international audit firm (77% versus 83%).
6. Results
6.1 Comparison of IAS and US Firms
Table 3 presents our results for earnings management, timely loss recognition, and value
relevance for IAS and US firms.
Earnings Management
Results for earnings management provide consistent evidence of greater earnings
smoothing for IAS firms relative to US firms. In particular, IAS firms exhibit significantly lower
variability in the change in net income, ΔNI*, 0.0065 versus 0.0095. Similarly, the ratio of the
variance of change in net income, ΔNI*, to the variance in the change in cash flow, ΔCF*, is
lower for IAS firms than for US firms. In particular, the ratios are 1.1994 and 1.2836 for IAS
and US firms. Although we are unaware of a test of significance for the difference, the statistics
suggest higher earnings volatility relative to cash flow volatility for US firms relative to IAS
firms. Consistent with the first two measures, the correlation between accruals, ACC*, and cash
21
flow, CF*, for IAS firms, –0.2833, is significantly more negative than for the US firms, –0.1394.
This finding also suggests that IAS firms smooth earnings more than US firms.
Results for managing toward positive earnings are also consistent with IAS firms
managing earnings more than US firms. In particular, the coefficient on SPOS from equation
(1), 0.0623, is positive, although not significantly so, which suggests that IAS firms more
frequently report small positive earnings.
Timely Loss Recognition
In terms of timely loss recognition, the coefficient on LNEG in equation (2) is
significantly negative, suggesting that IAS firms recognize large negative losses less frequently
than do US firms. Coupled with the results for earnings smoothing, this finding is consistent
with IAS firms being more likely to defer and smooth large losses rather than recognizing them
in a timely manner.
Value Relevance
Our final set of findings in table 3 relates to value relevance of accounting amounts.
First, regressions of price on earnings and equity book value for IAS and US firms reveal that the
R2 for IAS firms is significantly smaller than that for US firms, 24.80% versus 38.88%.
Untabulated regression summary statistics indicate that, as expected, the coefficients on earnings
and equity book value are significantly positive for both IAS and US firms, and that both
coefficients are smaller for IAS firms. The findings are consistent with accounting amounts
being more value relevant for US firms than for IAS firms.
In terms of the returns regressions, results are mixed. R2s for US firms are higher for
good news firms (2.27% versus 1.06%) and lower for bad news firms (3.31% versus 3.63%),
22
although neither difference is significant.14 Thus, only price regressions are consistent with
higher value relevance for US firms.
6.1.1 Comparison of IAS Firms Before and After Adoption
The preceding results suggest that accounting quality is lower for IAS firms relative to
the US firms in that IAS evidence more earnings smoothing, more managing toward targets, a
greater tendency to smooth losses, and a lower association between share prices and accounting
amounts. A related question that we address in this section is whether IAS application moves
accounting quality for these firms closer to that associated with US GAAP.
Table 4, panel A, presents a comparison of findings for earnings management, timely loss
recognition, and value relevance for IAS firms and US firms in the period before the IAS firms
adopted IAS, i.e., when they applied domestic GAAP. As expected based on Barth, Landsman,
and Lang (2006), which shows that the quality of accounting amounts for IAS firms improved
after applying IAS, findings in panel A are similar to those in table 3. In particular, IAS firms
exhibit more evidence of earnings smoothing than US firms in terms of the variability of net
income, the variability of net income relative to cash flows, and the correlation of cash flows and
accruals. In addition, IAS firms have a significantly greater tendency than US firms to recognize
small profits in the pre-adoption period. This difference is insignificant in the post-adoption
period. Similarly, as in table 3, IAS firms’ accounting amounts are less value relevant for stock
prices than are those for US firms, and value relevance for returns is insignificantly different.
The more interesting question is whether the difference in accounting quality between
IAS and US firms is smaller when the IAS firms apply IAS than when they reported using
14 An alternative approach to assessing the association between bad news returns and earnings is based on the coefficient estimate on earnings as described in Ball, Kothari and Robin (2000). Using this approach, untabulated findings show that the coefficient estimate on earnings is larger for bad news US firms than bad news IAS firms, which is consistent with US firms recognizing losses in a more timely manner than IAS firms.
23
domestic GAAP. Table 4, panel B, addresses this question by presenting differences in each of
the accounting quality measures between IAS firms and US firms in both reporting periods, and
a change in the difference. We do not conduct a test of significance for the change in the
differences in table 4, panel B, because we are unaware of any test for significance and therefore
only view these statistics as descriptive.
The evidence in the final column indicates that for two of the three earnings management
metrics, correlation between ACC* and CF* and variability of ΔNI* over ΔCF*, the difference
between US and IAS firms is smaller as a result of application of IAS (0.0942 versus 0.0107).
However, the variability ΔNI* changes in the opposite direction (−0.0011). In addition, the SPOS
coefficient is smaller after application of IAS, as indicated by a change of −0.0987, which
suggests that IAS firms are less likely to recognize small losses following adoption of IAS.
Similarly, the timely loss recognition measure, LNEG, decreases in magnitude from −0.2450 to
−0.2182, a change of 0.0268, which consistent with an increase in timely loss recognition for
IAS firms after application of IAS. Turning to the value relevance measures, consistent with
predictions, the difference in R2 between US and IAS firms decreases 9.14% for the price
regressions. As with the previous findings, results for the returns regressions are mixed, with the
R2 for good (bad) news increasing (decreasing) somewhat.15
Collectively, the evidence in tables 3 and 4 generally is consistent with US firms having
higher quality accounting amounts than IAS firms prior to IAS adoption, and with the gap in
quality decreasing with the application of IAS.
6.1.2 Comparison of IAS Over Time
15 As discussed in footnote 14, an alternate approach to assessing the association between bad news returns and earnings is based on the coefficient estimate on earnings. Using on that approach, untabulated findings indicate the coefficient estimate is larger for US firms than IAS firms in both the pre- and post-adoption period, and the difference narrows after adoption of IAS.
24
The IAS reporting environment underwent several changes during our sample period,
including the decision by the European Union to require IAS be applied by publicly listed EU
firms in lieu of domestic GAAP, the issuance by the IASC of a set of core standards, the
replacement of the IASC with the IASB, the increased activity of IOSCO and the International
Auditing Standards Board, and increased cooperation between the IASB and the FASB. Thus, it
is possible that application of IAS has improved sufficiently in recent years that accounting
quality for firms applying IAS and US GAAP is similar, but this is obscured because our tests
are based on sample data spanning nearly a decade. To determine whether this is the case, we
repeat the table 3 analysis comparing quality of accounting amounts for firms applying IAS and
US GAAP, but limiting data to the period 2001-2004. We selected 2001 as a cutoff year because
this is the year the IASB replaced the IASC as the body charged with developing international
accounting standards.
The findings are presented in table 5. The results are similar to those for the entire
sample period with no changes in inferences. Consistent with predictions, IAS firms exhibit
significantly lower variability in the change in net income, ΔNI* (0.0097 versus 0.0147), lower
variability of ΔNI* relative to ΔCF* (1.4609 versus 1.4936), significantly more negative
correlation between accruals, ACC*, and cash flow, CF* (−0.2123 versus −0.0742), significantly
lower frequency of large negative losses (LNEG coefficient = −0.1632), and significantly lower
value relevance for price (27.64% versus 48.49%). IAS firms also exhibit less value relevance
for both good news (0.38% versus 1.76%), and bad news (3.10% versus 6.65%) regressions, but
the differences are not significant. As in table 3, although the coefficient on SPOS has the
predicted sign, it is insignificant. Overall, the fact that the findings for the more recent period are
25
consistent with those for the full sample period suggests that the relative quality of IAS and US
accounting amounts is similar throughout the sample period.
6.2 Comparison of IAS and 20-F Firms
Table 6 presents descriptive statistics paralleling those in table 2 for IAS and US firms. It
reveals that 20-F and IAS firms exhibit similar growth, extent of external financing, and asset
turnover. However, the 20-F firms are larger than the IAS firms. As noted in section 4, we
include control variables to mitigate the effects of these differences.
Table 7 presents our results for earnings management, timely loss recognition, and value
relevance for IAS and 20-F firms. Overall, the results reveal no clear pattern of differences in
accounting quality between IAS and 20-F firms.
Earnings Management
Table 7 reveals mixed evidence relating to earnings management. On the one hand, it
reveals the IAS firms exhibit greater earnings variability. The variability of the change in net
income, ΔNI*, is 0.0044 for IAS firms versus 0.0041 for 20-F firms, but the difference is
insignificant. Similarly, the ratio of the variance of change in net income, ΔNI*, to the variance
in the change in cash flow, ΔCF*, is higher for IAS firms than for 20-F firms (1.1965 versus
1.0305). On the other hand, the correlation between accruals, ACC*, and cash flow, CF*, for
IAS firms, –0.4142, is significantly more negative than for the 20-F firms, –0.3148. And, the
coefficient on SPOS, 0.0449, is significantly positive.
Timely Loss Recognition
Regarding timely loss recognition, table 7 reveals that the coefficient on LNEG, −0.0293,
is negative, but it is insignificantly different from zero. This indicates that IAS firms and 20-F
firms recognize losses with similar frequency.
26
Value Relevance
Table 7 reveals that IAS firms generally exhibit greater value relevance than do 20-F
firms. For IAS firms the R2 of the price regressions is significantly higher than that for 20-F
firms, 24.80% versus 15.61%. Untabulated regression summary statistics indicate that, as
expected, the coefficients on earnings and equity book value are significantly positive for both
IAS and 20-F firms, and that both coefficients are larger for IAS firms. These findings are
consistent with accounting amounts being more value relevant for IAS firms than for 20-F firms.
Regarding the returns regression, the R2 for IAS firms are significantly higher for bad news firms
(3.63% versus 1.16%), but insignificantly lower for good news firms (1.06% versus 1.20%).
7. Summary and Concluding Remarks
This study compares characteristics of accounting amounts for firms that apply IAS and a
matched sample of US firms that apply US GAAP. Our results suggest that firms that apply IAS
generally have lower accounting quality than US firms. In particular, IAS firms have a
significantly lower variance of the change in net income, a lower ratio of the variances of the
change in net income and change in cash flows, a significantly more negative correlation
between accruals and cash flows, and a higher frequency of small positive net income. In
addition, they have a significantly lower frequency of large negative net income, and
significantly lower value relevance of earnings and equity book value for share prices.
Comparisons of accounting amounts for IAS and US firms before and after the IAS firms
adopt IAS suggest that application of IAS reduces, but does not eliminate, differences in
accounting quality between the two the two sets of firms. The comparison of the quality of
accounting amounts for IAS and US firms based on the most recent sample years yields similar
27
inferences. This suggests that the relative quality of IAS and US accounting amounts is similar
throughout the sample period.
We also compare characteristics of accounting amounts for firms that apply IAS to a
sample of non-US firms that cross-list on US exchanges and reconcile accounting amounts from
domestic GAAP to US GAAP. Results from this comparison reveal no clear pattern of
differences in quality between IAS and reconciled US GAAP accounting amounts. In particular,
consistent with higher quality, IAS firms have a higher variance of the change in net income, a
higher ratio of the variances of the change in net income and change in cash flows, and a higher
value relevance of earnings and equity book value in a price regression and of earnings in a bad
news return regression. However, consistent with lower quality, IAS firms have a significantly
more negative correlation between accruals and cash flows, and a significantly higher frequency
of small positive net income.
Our study contributes to the regulatory debate over accounting standards by providing
evidence on the characteristics of accounting amounts resulting from applying IAS relative to
those resulting from applying US GAAP. The SEC has indicated that its decision on whether to
permit non-US firms to file financial statements based on IAS without reconciling to US GAAP
depend on the SEC’s assessment of whether applying IAS results in accounting amounts of
sufficiently high quality. Answering this policy question is beyond the scope of this study.
However, our findings suggest that although US GAAP applied by US firms evidences higher
accounting quality than does IAS applied by non-US firms, US GAAP amounts presented in
non-US firms’ Form 20-F reconciliations do not. Thus, requiring cross-listed firms that apply
IAS to reconcile accounting amounts to US GAAP may be unwarranted.
28
REFERENCES
Ashbaugh, H. 2001. Non-U.S. Firms’ Accounting Standard Choices. Journal of Accounting and
Public Policy 20: 129-153
Ashbaugh, H., and M. Pincus, 2001. Domestic Accounting Standards, International Accounting
Standards, and the Predictability of Earnings, Journal of Accounting Research 39: 417-434,
Ball, R.; S.P. Kothari; and A. Robin. 2000. The Effect of International Institutional Factors on
Properties of Accounting Earnings.” Journal of Accounting and Economics 29: 1–51.
Ball, R.; A. Robin, and J.S. Wu. 2003. Incentives versus Standards: Properties of Accounting
Income in Four East Asian Countries.” Journal of Accounting and Economics 36: 235-270.
Barth, M.E., W.H. Beaver and W.R. Landsman (2001). The Relevance of the Value Relevance
Literature for Accounting Standard Setting: Another View. Journal of Accounting and
Economics 31: 77-104.
Barth, M.E., W.R. Landsman, and M. Lang, 2006. International Accounting Standards and Accounting
Quality. Working paper, University of North Carolina and Stanford University.
Bartov, E., S. Goldberg, and M. Kim. 2004. Comparative Value Relevance among German, U.S.
and International Accounting Standards: A German Stock Market Perspective. Working
paper, New York University.
Bhattacharya, U., H. Daouk, and M. Welker. (2003). “The World Price of Earnings Opacity.”
Working paper, Queen's University.
Bradshaw, M.T., and G.S. Miller. 2005. “Will Harmonizing Accounting Standards Really
Harmonize Accounting? Evidence from Non-U.S. Firms Adopting US GAAP.” Working
paper, Harvard Business School.
29
Breeden, R., 1994. Foreign Companies and U.S. Markets in a Time of Economic
Transformation. Fordham International Law Journal 17.
Burgstahler, D., and I. Dichev. 1997. Earnings Management to Avoid Earnings Decreases and
Losses.” Journal of Accounting and Economics 24: 99–126.
Cairns, D. 1999. Degrees of compliance. Accountancy International (September): 68-69.
Cramer, J. S. 1987. Mean and Variance of R2 in Small and Moderate Samples.” Journal of
Econometrics 35: 253–66.
Eccher, E. and P. Healy, 2003. The Role of International Accounting Standards in Transitional
Economies: A Study of the People's Republic of China. Working paper, Massachusetts
Institute of Technology.
Ewert, R., and A. Wagenhofer. 2005. Economic Effects of Tightening Accounting Standards to
Restrict Earnings Management. The Accounting Review 43.
Greene, W., 1993. Econometric Analysis. MacMillan, New York.
Harris, M., and K. Muller. 1999. The Market Valuation of IAS versus US GAAP Accounting
Measures Using Form 20-F Reconciliations. Journal of Accounting and Economics 26: 285-
312.
Hung, M. and K.R. Subramanyam, 2004, Financial Statement Effects of Adopting International
Accounting Standards: The Case of Germany. Working paper, University of Southern
California.
Jenkins, E., 1999. Financial Reporting in a Global Capital Market World. Financial Accounting
Series, No. 198-A (June 29), 2-6.
Land, J., and M. Lang. 2002. Empirical Evidence on the Evolution of International Earnings. The
Accounting Review 77, 115-134.
30
Lang, M., J. Raedy, and M. Yetman. 2003. How Representative are Firms that are Cross Listed
in the United States? An Analysis of Accounting Quality. Journal of Accounting Research
41, 363-386.
Lang, M., J. Raedy, and W. Wilson. 2005. Earnings Management and Cross Listing: Are
Reconciled Earnings Comparable to US Earnings? Working paper, University of North
Carolina.
Leuz, C. 2003. IAS Versus U.S. GAAP: Information Asymmetry-based Evidence from
Germany’s New Market. Journal of Accounting Research 41: 445-427.
Leuz, C.; D. Nanda; and P. Wysocki. 2003. Earnings Management and Investor Protection: An
International Comparison. Journal of Financial Economics 69: 505-527.
Myers, L.A., and D.J. Skinner. 2002. Earnings Momentum and Earnings Management. Working
paper, University of Michigan.
Nicolaisen, D. 2005. A Securities Regulatory Looks at Convergence. Northwestern Journal of
International Law and Business Vol. 25, No. 3: 661-686.
Pagano, M.; A. Röell; and J. Zehner. 2002. The Geography of Equity Listings: Why do
Companies List Abroad? Journal of Finance 57: 2651-2694.
Pownall, G., and K. Schipper. 1999. Implications of Accounting research for the SEC’s
consideration of International Accounting Standards for U.S. securities. Accounting Horizons
13 (September): 259–280.
Schipper, K. 2003. Principles-Based Accounting Standards. Accounting Horizons, March: 61-72.
Street, D. and S. Gray. 2001. Observance of international accounting standards: Factors
explaining non-compliance. ACCA Research Report No. 74.
31
Tokar, M. 2005. Convergence and the Implementation of a Single Set of Global Standards: The
Real-Life Challenge. Northwestern Journal of International Law and Business Vol. 25, No.
3: 687-710.
Van Tendeloo, B. and A. Vanstraelen. 2005. Earnings Management under German GAAP versus
IFRS. European Accounting Review 14:1, 155-180.
Wysocki, P. 2005. Assessing Earnings and Accruals Quality: US and International Evidence.
Working Paper, Massachusetts Institute of Technology.
32
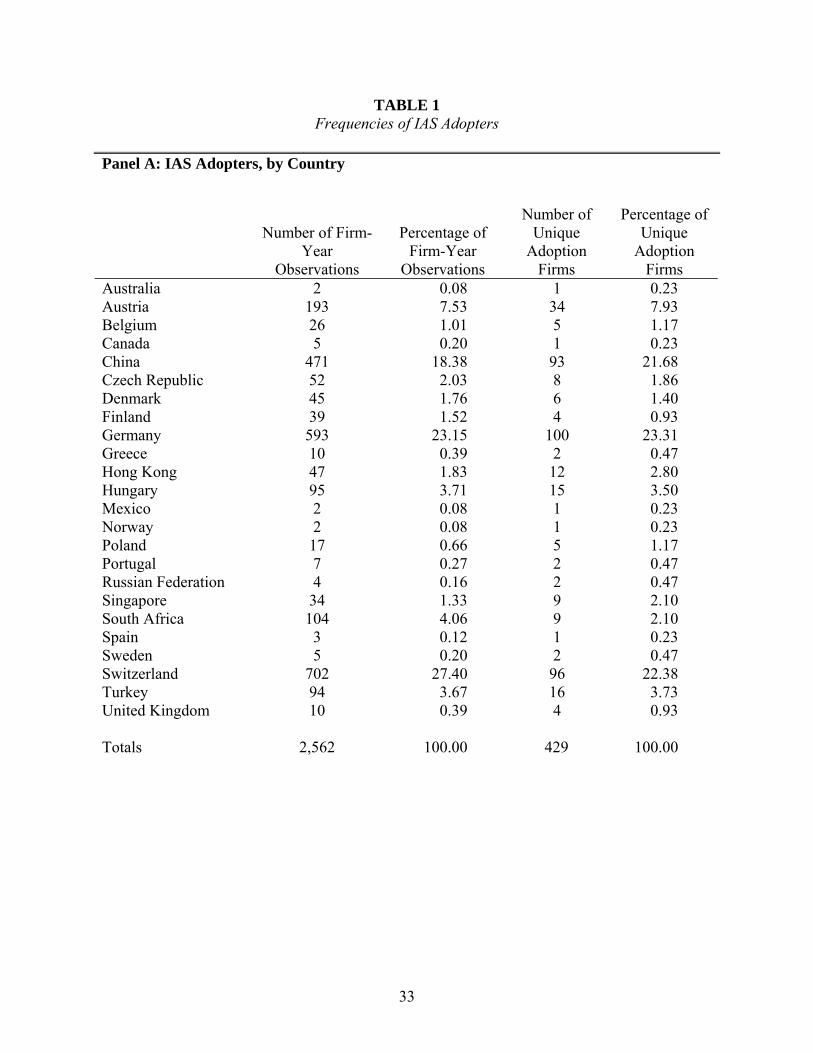
TABLE 1 Frequencies of IAS Adopters
Panel A: IAS Adopters, by Country
Number of Firm-
Year Observations
Percentage of Firm-Year
Observations
Number of Unique
Adoption Firms
Percentage of Unique
Adoption Firms
Australia 2 0.08 1 0.23 Austria 193 7.53 34 7.93 Belgium 26 1.01 5 1.17 Canada 5 0.20 1 0.23 China 471 18.38 93 21.68 Czech Republic 52 2.03 8 1.86 Denmark 45 1.76 6 1.40 Finland 39 1.52 4 0.93 Germany 593 23.15 100 23.31 Greece 10 0.39 2 0.47 Hong Kong 47 1.83 12 2.80 Hungary 95 3.71 15 3.50 Mexico 2 0.08 1 0.23 Norway 2 0.08 1 0.23 Poland 17 0.66 5 1.17 Portugal 7 0.27 2 0.47 Russian Federation 4 0.16 2 0.47 Singapore 34 1.33 9 2.10 South Africa 104 4.06 9 2.10 Spain 3 0.12 1 0.23 Sweden 5 0.20 2 0.47 Switzerland 702 27.40 96 22.38 Turkey 94 3.67 16 3.73 United Kingdom 10 0.39 4 0.93 Totals 2,562 100.00 429 100.00
33
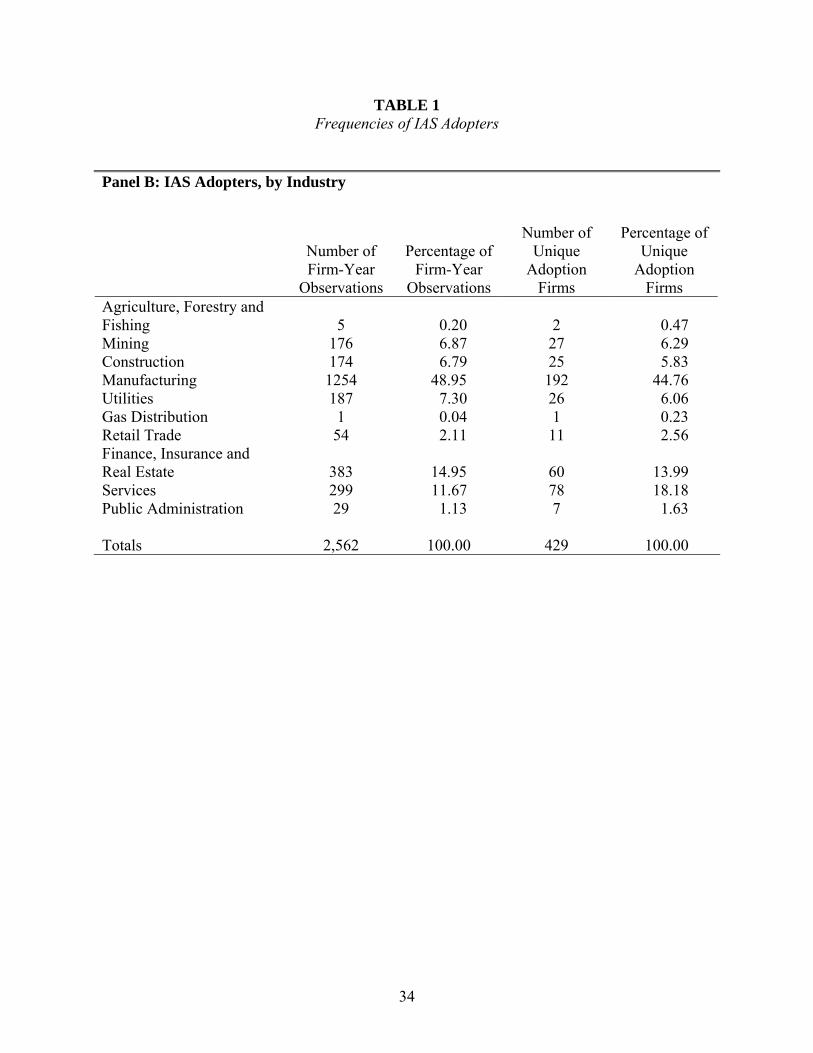
TABLE 1 Frequencies of IAS Adopters
Panel B: IAS Adopters, by Industry
Number of Firm-Year
Observations
Percentage of Firm-Year
Observations
Number of Unique
Adoption Firms
Percentage of Unique
Adoption Firms
Agriculture, Forestry and Fishing 5 0.20 2 0.47 Mining 176 6.87 27 6.29 Construction 174 6.79 25 5.83 Manufacturing 1254 48.95 192 44.76 Utilities 187 7.30 26 6.06 Gas Distribution 1 0.04 1 0.23 Retail Trade 54 2.11 11 2.56 Finance, Insurance and Real Estate 383 14.95 60 13.99 Services 299 11.67 78 18.18 Public Administration 29 1.13 7 1.63 Totals 2,562 100.00 429 100.00
34
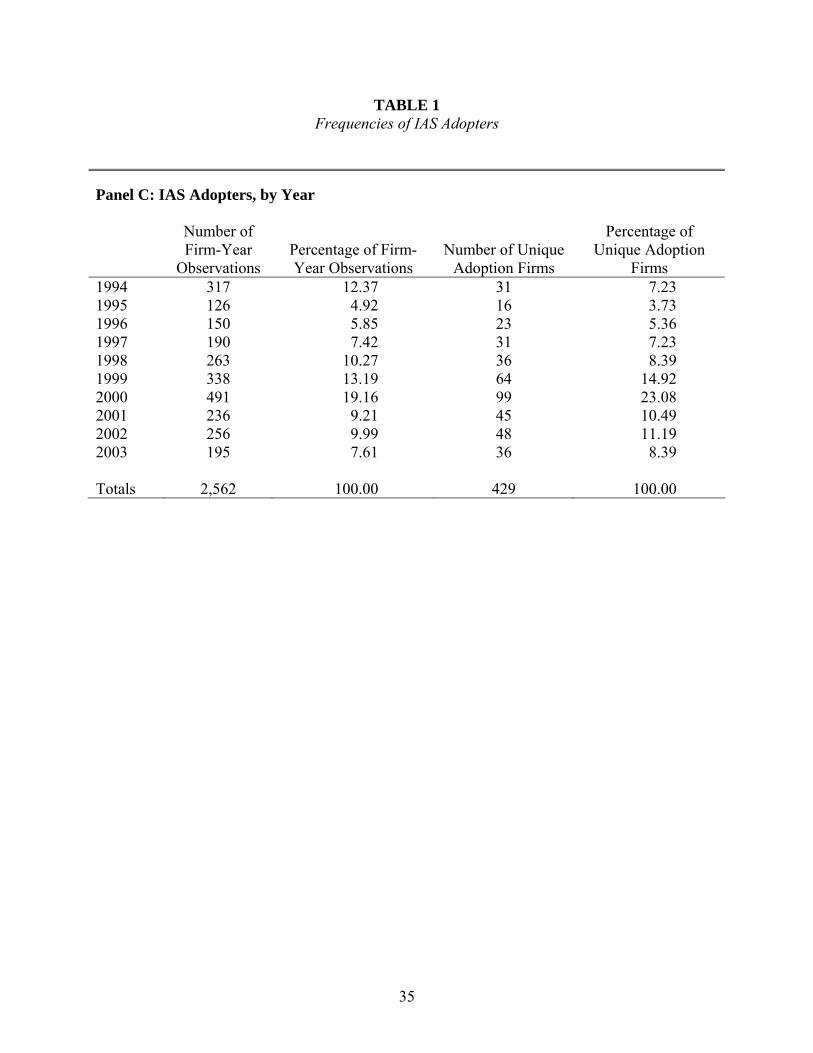
TABLE 1 Frequencies of IAS Adopters
Panel C: IAS Adopters, by Year
Number of Firm-Year
Observations
Percentage of Firm-Year Observations
Number of Unique
Adoption Firms
Percentage of Unique Adoption
Firms 1994 317 12.37 31 7.23 1995 126 4.92 16 3.73 1996 150 5.85 23 5.36 1997 190 7.42 31 7.23 1998 263 10.27 36 8.39 1999 338 13.19 64 14.92 2000 491 19.16 99 23.08 2001 236 9.21 45 10.49 2002 256 9.99 48 11.19 2003 195 7.61 36 8.39 Totals 2,562 100.00 429 100.00
35
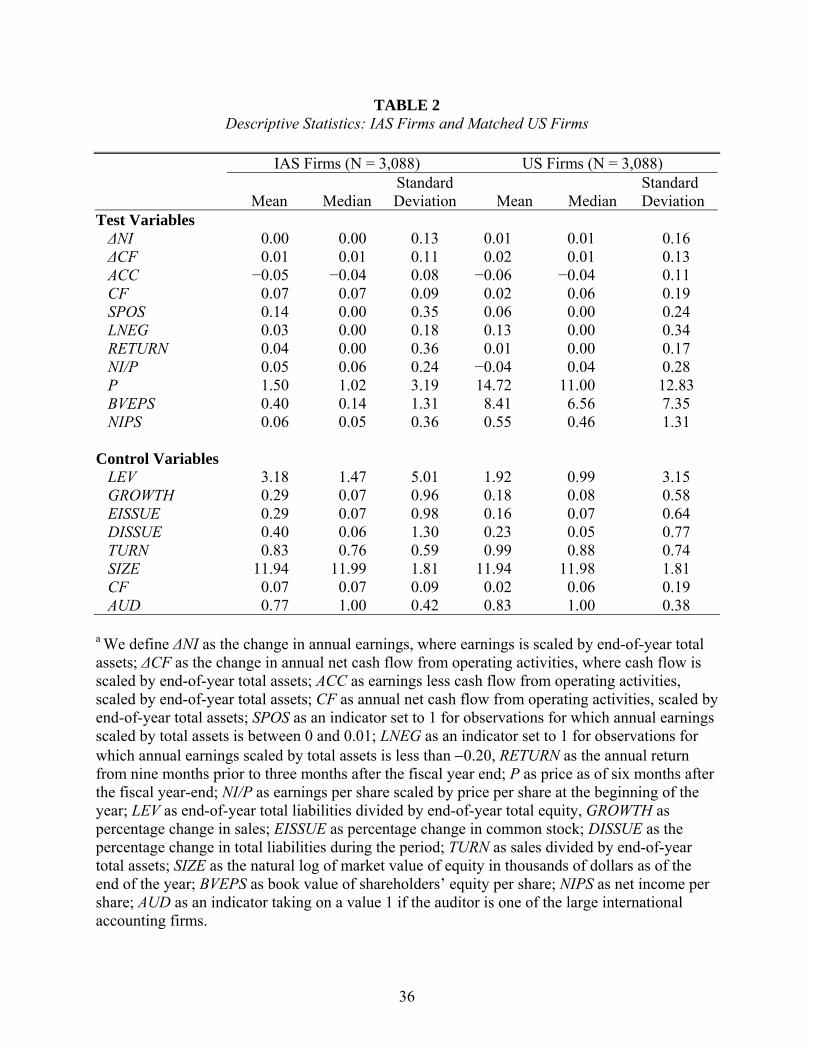
TABLE 2 Descriptive Statistics: IAS Firms and Matched US Firms
IAS Firms (N = 3,088) US Firms (N = 3,088)
Mean Median Standard Deviation Mean Median
Standard Deviation
Test Variables ΔNI 0.00 0.00 0.13 0.01 0.01 0.16 ΔCF 0.01 0.01 0.11 0.02 0.01 0.13 ACC −0.05 −0.04 0.08 −0.06 −0.04 0.11 CF 0.07 0.07 0.09 0.02 0.06 0.19 SPOS 0.14 0.00 0.35 0.06 0.00 0.24 LNEG 0.03 0.00 0.18 0.13 0.00 0.34 RETURN 0.04 0.00 0.36 0.01 0.00 0.17 NI/P 0.05 0.06 0.24 −0.04 0.04 0.28 P 1.50 1.02 3.19 14.72 11.00 12.83 BVEPS 0.40 0.14 1.31 8.41 6.56 7.35 NIPS 0.06 0.05 0.36 0.55 0.46 1.31
Control Variables
LEV 3.18 1.47 5.01 1.92 0.99 3.15 GROWTH 0.29 0.07 0.96 0.18 0.08 0.58 EISSUE 0.29 0.07 0.98 0.16 0.07 0.64 DISSUE 0.40 0.06 1.30 0.23 0.05 0.77 TURN 0.83 0.76 0.59 0.99 0.88 0.74 SIZE 11.94 11.99 1.81 11.94 11.98 1.81 CF 0.07 0.07 0.09 0.02 0.06 0.19 AUD 0.77 1.00 0.42 0.83 1.00 0.38
a We define ΔNI as the change in annual earnings, where earnings is scaled by end-of-year total assets; ΔCF as the change in annual net cash flow from operating activities, where cash flow is scaled by end-of-year total assets; ACC as earnings less cash flow from operating activities, scaled by end-of-year total assets; CF as annual net cash flow from operating activities, scaled by end-of-year total assets; SPOS as an indicator set to 1 for observations for which annual earnings scaled by total assets is between 0 and 0.01; LNEG as an indicator set to 1 for observations for which annual earnings scaled by total assets is less than −0.20, RETURN as the annual return from nine months prior to three months after the fiscal year end; P as price as of six months after the fiscal year-end; NI/P as earnings per share scaled by price per share at the beginning of the year; LEV as end-of-year total liabilities divided by end-of-year total equity, GROWTH as percentage change in sales; EISSUE as percentage change in common stock; DISSUE as the percentage change in total liabilities during the period; TURN as sales divided by end-of-year total assets; SIZE as the natural log of market value of equity in thousands of dollars as of the end of the year; BVEPS as book value of shareholders’ equity per share; NIPS as net income per share; AUD as an indicator taking on a value 1 if the auditor is one of the large international accounting firms.
36
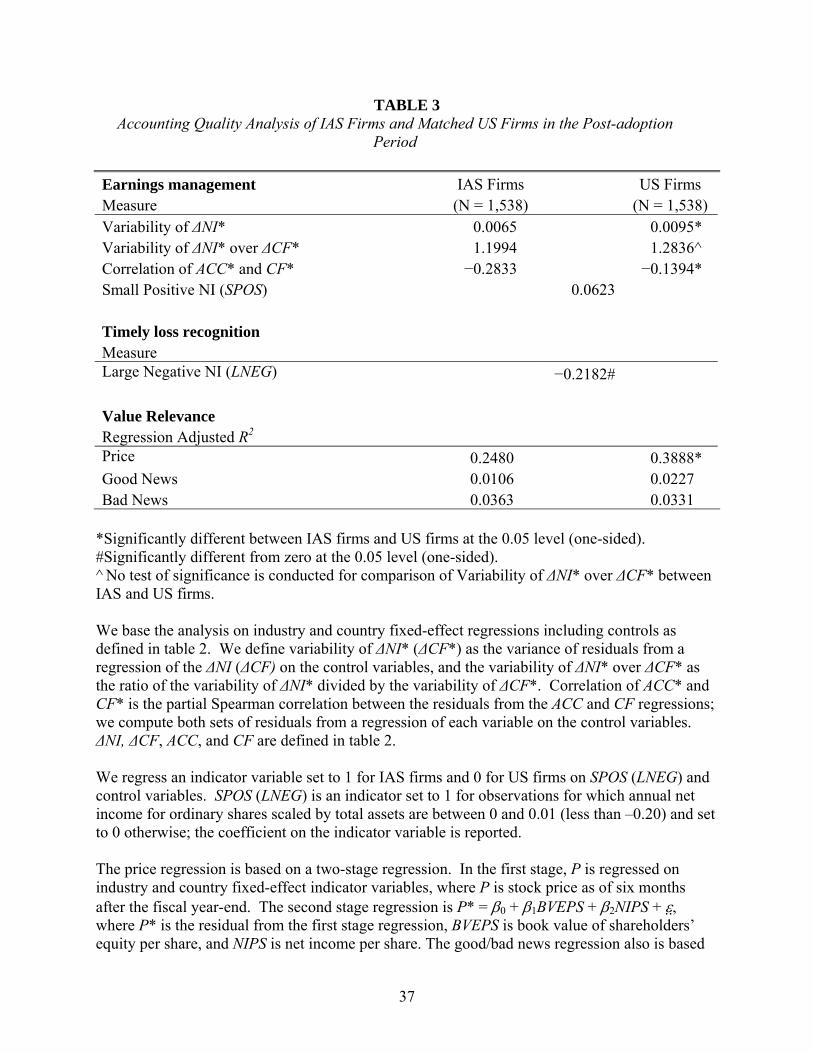
TABLE 3 Accounting Quality Analysis of IAS Firms and Matched US Firms in the Post-adoption
Period Earnings management IAS Firms US Firms Measure (N = 1,538) (N = 1,538) Variability of ΔNI* 0.0065 0.0095* Variability of ΔNI* over ΔCF* 1.1994 1.2836^ Correlation of ACC* and CF* −0.2833 −0.1394* Small Positive NI (SPOS) 0.0623 Timely loss recognition Measure Large Negative NI (LNEG) −0.2182# Value Relevance Regression Adjusted R2 Price 0.2480 0.3888* Good News 0.0106 0.0227 Bad News 0.0363 0.0331
*Significantly different between IAS firms and US firms at the 0.05 level (one-sided). #Significantly different from zero at the 0.05 level (one-sided). ^ No test of significance is conducted for comparison of Variability of ΔNI* over ΔCF* between IAS and US firms. We base the analysis on industry and country fixed-effect regressions including controls as defined in table 2. We define variability of ΔNI* (ΔCF*) as the variance of residuals from a regression of the ΔNI (ΔCF) on the control variables, and the variability of ΔNI* over ΔCF* as the ratio of the variability of ΔNI* divided by the variability of ΔCF*. Correlation of ACC* and CF* is the partial Spearman correlation between the residuals from the ACC and CF regressions; we compute both sets of residuals from a regression of each variable on the control variables. ΔNI, ΔCF, ACC, and CF are defined in table 2. We regress an indicator variable set to 1 for IAS firms and 0 for US firms on SPOS (LNEG) and control variables. SPOS (LNEG) is an indicator set to 1 for observations for which annual net income for ordinary shares scaled by total assets are between 0 and 0.01 (less than –0.20) and set to 0 otherwise; the coefficient on the indicator variable is reported. The price regression is based on a two-stage regression. In the first stage, P is regressed on industry and country fixed-effect indicator variables, where P is stock price as of six months after the fiscal year-end. The second stage regression is P* = β0 + β1BVEPS + β2NIPS + ε , where P* is the residual from the first stage regression, BVEPS is book value of shareholders’ equity per share, and NIPS is net income per share. The good/bad news regression also is based
37
on a two-stage regression. In the first stage, net income divided by beginning of year price is regressed on industry and country fixed-effect indicator variables. The second stage regression is NI/P* = β0 + β1RETURN + ε , where NI/P* is the residual from the first- stage regression, and RETURN is the stock return computed over the twelve months ending three months after year-end. Good news observations are those for which RETURN is nonnegative. Bad news observations are those for which RETURN is negative. Incremental adjusted R2 is determined from the second stage regressions. All variables in each of the regressions used in this table are winsorized at the 5% level to control for the effect of outliers.
38
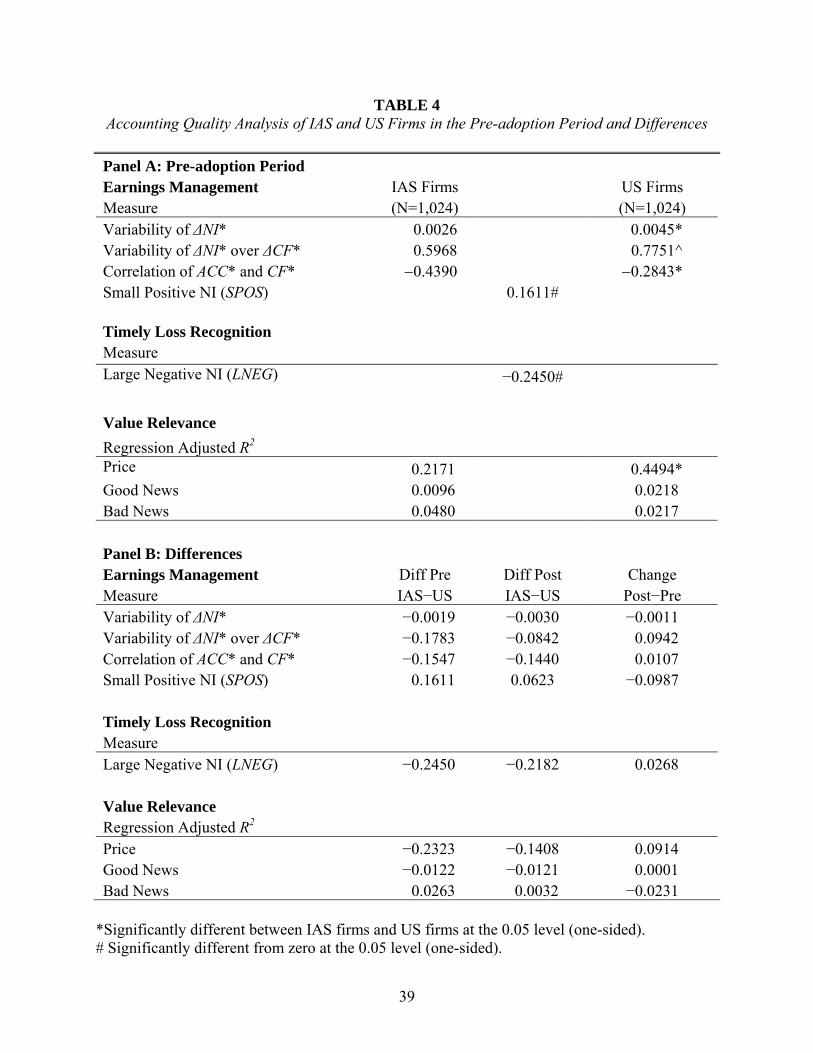
TABLE 4 Accounting Quality Analysis of IAS and US Firms in the Pre-adoption Period and Differences
Panel A: Pre-adoption Period Earnings Management IAS Firms US Firms Measure (N=1,024) (N=1,024) Variability of ΔNI* 0.0026 0.0045* Variability of ΔNI* over ΔCF* 0.5968 0.7751^ Correlation of ACC* and CF* −0.4390 −0.2843* Small Positive NI (SPOS) 0.1611# Timely Loss Recognition Measure Large Negative NI (LNEG) −0.2450# Value Relevance Regression Adjusted R2 Price 0.2171 0.4494* Good News 0.0096 0.0218 Bad News 0.0480 0.0217 Panel B: Differences Earnings Management Diff Pre Diff Post Change Measure IAS−US IAS−US Post−Pre Variability of ΔNI* −0.0019 −0.0030 −0.0011 Variability of ΔNI* over ΔCF* −0.1783 −0.0842 0.0942 Correlation of ACC* and CF* −0.1547 −0.1440 0.0107 Small Positive NI (SPOS) 0.1611 0.0623 −0.0987 Timely Loss Recognition Measure Large Negative NI (LNEG) −0.2450 −0.2182 0.0268 Value Relevance Regression Adjusted R2 Price −0.2323 −0.1408 0.0914 Good News −0.0122 −0.0121 0.0001 Bad News 0.0263 0.0032 −0.0231
*Significantly different between IAS firms and US firms at the 0.05 level (one-sided). # Significantly different from zero at the 0.05 level (one-sided).
39
^ No test of significance is conducted for comparison of Variability of ΔNI* over ΔCF* between IAS and US firms. We base the analysis on industry and country fixed-effect regressions including controls as defined in table 2. We define variability of ΔNI* (ΔCF*) as the variance of residuals from a regression of the ΔNI (ΔCF) on the control variables, and the variability of ΔNI* over ΔCF* as the ratio of the variability of ΔNI* divided by the variability of ΔCF*. Correlation of ACC* and CF* is the partial Spearman correlation between the residuals from the ACC and CF regressions; we compute both sets of residuals from a regression of each variable on the control variables. ΔNI, ΔCF, ACC, and CF are defined in table 2. We regress an indicator variable set to 1 for IAS firms and 0 for US firms on SPOS (LNEG) and control variables. SPOS (LNEG) is an indicator set to 1 for observations for which annual net income for ordinary shares scaled by total assets are between 0 and 0.01 (less than –0.20) and set to 0 otherwise; the coefficient on the indicator variable is reported. The price regression is based on a two-stage regression. In the first stage, P is regressed on industry and country fixed-effect indicator variables, where P is stock price as of six months after the fiscal year-end. The second stage regression is P* = β0 + β1BVEPS + β2NIPS + ε , where P* is the residual from the first stage regression, BVEPS is book value of shareholders’ equity per share, and NIPS is net income per share. The good/bad news regression also is based on a two-stage regression. In the first stage, net income divided by beginning of year price is regressed on industry and country fixed-effect indicator variables. The second stage regression is NI/P* = β0 + β1RETURN + ε , where NI/P* is the residual from the first- stage regression, and RETURN is the stock return computed over the twelve months ending three months after year-end. Good news observations are those for which RETURN is nonnegative. Bad news observations are those for which RETURN is negative. Incremental adjusted R2 is determined from the second stage regressions. All variables in each of the regressions used in this table are winsorized at the 5% level to control for the effect of outliers.
40
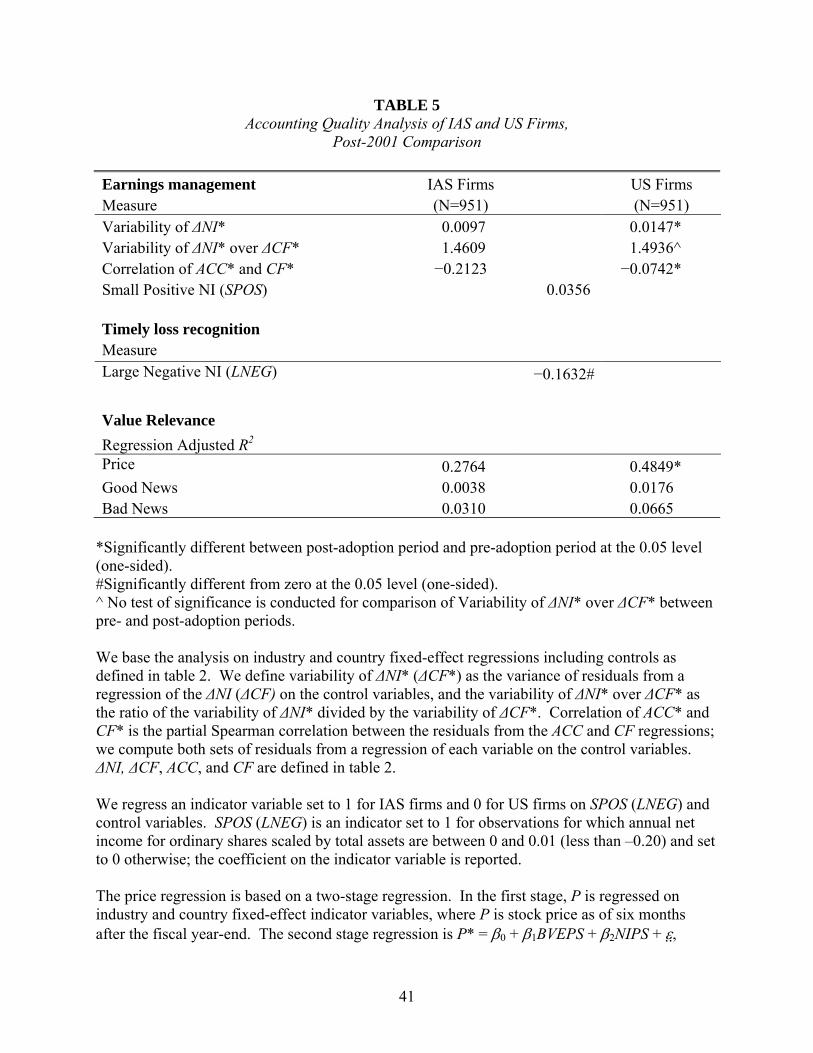
TABLE 5 Accounting Quality Analysis of IAS and US Firms,
Post-2001 Comparison Earnings management IAS Firms US Firms Measure (N=951) (N=951) Variability of ΔNI* 0.0097 0.0147* Variability of ΔNI* over ΔCF* 1.4609 1.4936^ Correlation of ACC* and CF* −0.2123 −0.0742* Small Positive NI (SPOS) 0.0356 Timely loss recognition Measure Large Negative NI (LNEG) −0.1632# Value Relevance Regression Adjusted R2 Price 0.2764 0.4849* Good News 0.0038 0.0176 Bad News 0.0310 0.0665
*Significantly different between post-adoption period and pre-adoption period at the 0.05 level (one-sided). #Significantly different from zero at the 0.05 level (one-sided). ^ No test of significance is conducted for comparison of Variability of ΔNI* over ΔCF* between pre- and post-adoption periods. We base the analysis on industry and country fixed-effect regressions including controls as defined in table 2. We define variability of ΔNI* (ΔCF*) as the variance of residuals from a regression of the ΔNI (ΔCF) on the control variables, and the variability of ΔNI* over ΔCF* as the ratio of the variability of ΔNI* divided by the variability of ΔCF*. Correlation of ACC* and CF* is the partial Spearman correlation between the residuals from the ACC and CF regressions; we compute both sets of residuals from a regression of each variable on the control variables. ΔNI, ΔCF, ACC, and CF are defined in table 2. We regress an indicator variable set to 1 for IAS firms and 0 for US firms on SPOS (LNEG) and control variables. SPOS (LNEG) is an indicator set to 1 for observations for which annual net income for ordinary shares scaled by total assets are between 0 and 0.01 (less than –0.20) and set to 0 otherwise; the coefficient on the indicator variable is reported. The price regression is based on a two-stage regression. In the first stage, P is regressed on industry and country fixed-effect indicator variables, where P is stock price as of six months after the fiscal year-end. The second stage regression is P* = β0 + β1BVEPS + β2NIPS + ε ,
41
where P* is the residual from the first stage regression, BVEPS is book value of shareholders’ equity per share, and NIPS is net income per share. The good/bad news regression also is based on a two-stage regression. In the first stage, net income divided by beginning of year price is regressed on industry and country fixed-effect indicator variables. The second stage regression is NI/P* = β0 + β1RETURN + ε , where NI/P* is the residual from the first- stage regression, and RETURN is the stock return computed over the twelve months ending three months after year-end. Good news observations are those for which RETURN is nonnegative. Bad news observations are those for which RETURN is negative. Incremental adjusted R2 is determined from the second stage regressions. All variables in each of the regressions used in this table are winsorized at the 5% level to control for the effect of outliers.
42
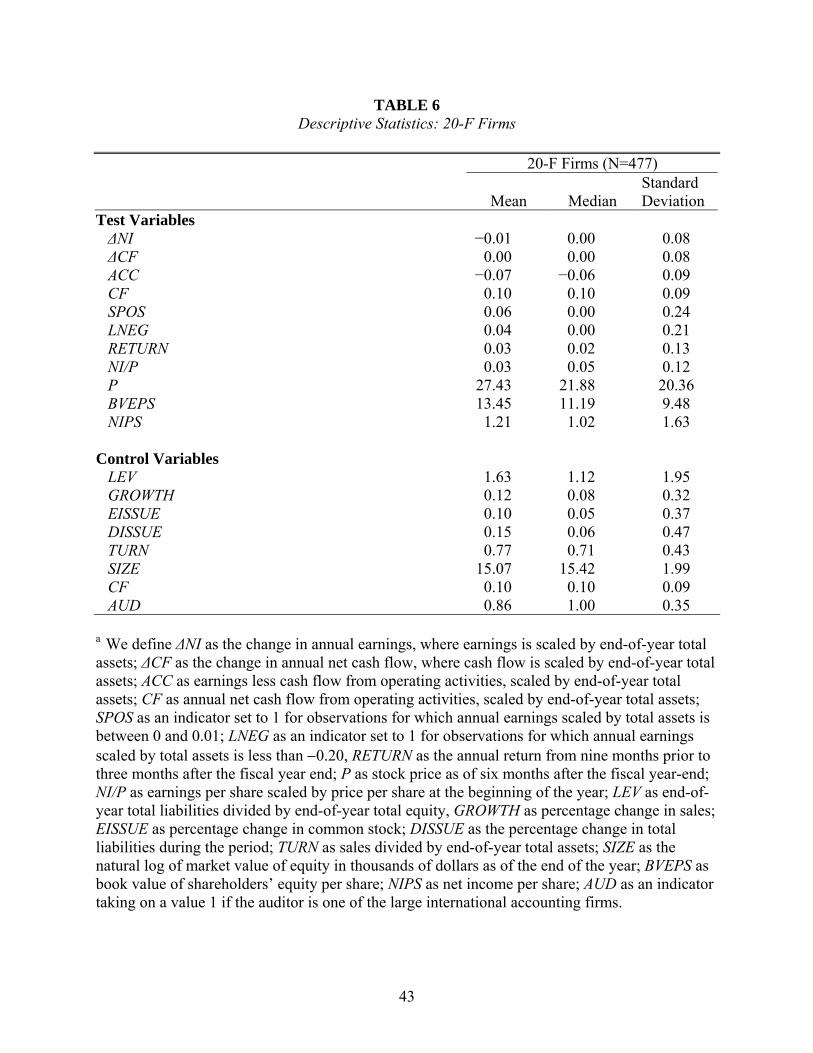
TABLE 6 Descriptive Statistics: 20-F Firms
20-F Firms (N=477)
Mean Median Standard Deviation
Test Variables ΔNI −0.01 0.00 0.08 ΔCF 0.00 0.00 0.08 ACC −0.07 −0.06 0.09 CF 0.10 0.10 0.09 SPOS 0.06 0.00 0.24 LNEG 0.04 0.00 0.21 RETURN 0.03 0.02 0.13 NI/P 0.03 0.05 0.12 P 27.43 21.88 20.36 BVEPS 13.45 11.19 9.48 NIPS 1.21 1.02 1.63
Control Variables
LEV 1.63 1.12 1.95 GROWTH 0.12 0.08 0.32 EISSUE 0.10 0.05 0.37 DISSUE 0.15 0.06 0.47 TURN 0.77 0.71 0.43 SIZE 15.07 15.42 1.99 CF 0.10 0.10 0.09 AUD 0.86 1.00 0.35
a We define ΔNI as the change in annual earnings, where earnings is scaled by end-of-year total assets; ΔCF as the change in annual net cash flow, where cash flow is scaled by end-of-year total assets; ACC as earnings less cash flow from operating activities, scaled by end-of-year total assets; CF as annual net cash flow from operating activities, scaled by end-of-year total assets; SPOS as an indicator set to 1 for observations for which annual earnings scaled by total assets is between 0 and 0.01; LNEG as an indicator set to 1 for observations for which annual earnings scaled by total assets is less than −0.20, RETURN as the annual return from nine months prior to three months after the fiscal year end; P as stock price as of six months after the fiscal year-end; NI/P as earnings per share scaled by price per share at the beginning of the year; LEV as end-of-year total liabilities divided by end-of-year total equity, GROWTH as percentage change in sales; EISSUE as percentage change in common stock; DISSUE as the percentage change in total liabilities during the period; TURN as sales divided by end-of-year total assets; SIZE as the natural log of market value of equity in thousands of dollars as of the end of the year; BVEPS as book value of shareholders’ equity per share; NIPS as net income per share; AUD as an indicator taking on a value 1 if the auditor is one of the large international accounting firms.
43
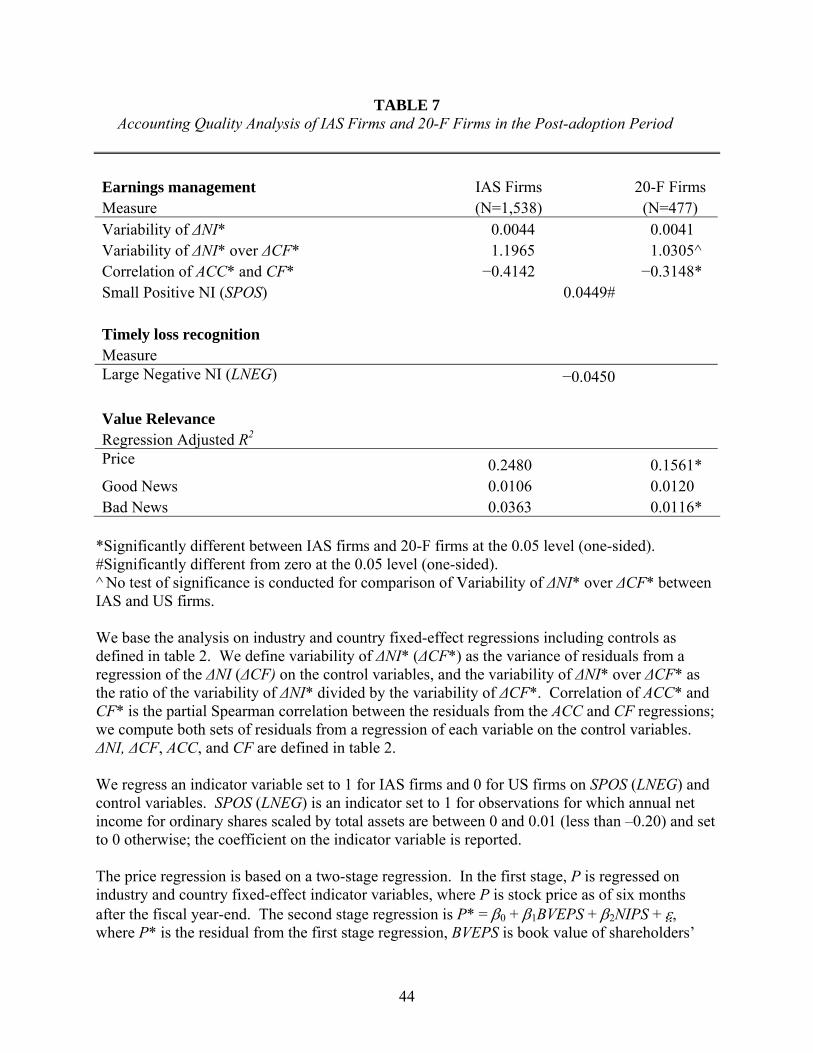
TABLE 7 Accounting Quality Analysis of IAS Firms and 20-F Firms in the Post-adoption Period
Earnings management IAS Firms 20-F Firms Measure (N=1,538) (N=477) Variability of ΔNI* 0.0044 0.0041 Variability of ΔNI* over ΔCF* 1.1965 1.0305^ Correlation of ACC* and CF* −0.4142 −0.3148* Small Positive NI (SPOS) 0.0449# Timely loss recognition Measure Large Negative NI (LNEG) −0.0450 Value Relevance Regression Adjusted R2 Price 0.2480 0.1561* Good News 0.0106 0.0120 Bad News 0.0363 0.0116*
*Significantly different between IAS firms and 20-F firms at the 0.05 level (one-sided). #Significantly different from zero at the 0.05 level (one-sided). ^ No test of significance is conducted for comparison of Variability of ΔNI* over ΔCF* between IAS and US firms. We base the analysis on industry and country fixed-effect regressions including controls as defined in table 2. We define variability of ΔNI* (ΔCF*) as the variance of residuals from a regression of the ΔNI (ΔCF) on the control variables, and the variability of ΔNI* over ΔCF* as the ratio of the variability of ΔNI* divided by the variability of ΔCF*. Correlation of ACC* and CF* is the partial Spearman correlation between the residuals from the ACC and CF regressions; we compute both sets of residuals from a regression of each variable on the control variables. ΔNI, ΔCF, ACC, and CF are defined in table 2. We regress an indicator variable set to 1 for IAS firms and 0 for US firms on SPOS (LNEG) and control variables. SPOS (LNEG) is an indicator set to 1 for observations for which annual net income for ordinary shares scaled by total assets are between 0 and 0.01 (less than –0.20) and set to 0 otherwise; the coefficient on the indicator variable is reported. The price regression is based on a two-stage regression. In the first stage, P is regressed on industry and country fixed-effect indicator variables, where P is stock price as of six months after the fiscal year-end. The second stage regression is P* = β0 + β1BVEPS + β2NIPS + ε , where P* is the residual from the first stage regression, BVEPS is book value of shareholders’
44
equity per share, and NIPS is net income per share. The good/bad news regression also is based on a two-stage regression. In the first stage, net income divided by beginning of year price is regressed on industry and country fixed-effect indicator variables. The second stage regression is NI/P* = β0 + β1RETURN + ε , where NI/P* is the residual from the first- stage regression, and RETURN is the stock return computed over the twelve months ending three months after year-end. Good news observations are those for which RETURN is nonnegative. Bad news observations are those for which RETURN is negative. Incremental adjusted R2 is determined from the second stage regressions. All variables in each of the regressions used in this table are winsorized at the 5% level to control for the effect of outliers.
45