Embed Size (px)
Citation preview

1
Accounting
Methodology
Document
31 July 2015

2
Contents
1. INTRODUCTION ....................................................................................................................................... 4
1.1 REGULATORY REPORTING REQUIREMENTS ......................................................................................................... 4 1.2 INTRODUCTION TO THE AMD .......................................................................................................................... 4 1.3 STRUCTURE AND PURPOSE OF THE AMD ........................................................................................................... 4
2. BUSINESS OVERVIEW ............................................................................................................................. 7
2.1 BT GROUP AND REGULATORY REPORTING ......................................................................................................... 7 2.2 AS SYSTEMS AND THE REPORTING HIERARCHY .................................................................................................... 7
3. OPENREACH REPORTING ...................................................................................................................... 10
3.1 INTRODUCTION .......................................................................................................................................... 10 3.2 OPENREACH PRODUCT GROUPS ..................................................................................................................... 10 3.4 FORMAT OF THE OPENREACH INFORMATION STATEMENTS ................................................................................... 11 3.5 DISAGGREGATING SMP DEFINED INFORMATION INTO OPENREACH REGULATORY STATEMENTS .................................... 11 3.6 RECONCILIATION OF OPENREACH INCOME STATEMENT........................................................................................ 11
4. ACCOUNTING POLICIES ......................................................................................................................... 13
4.1 BASIS OF PREPARATION OF THE RFS .............................................................................................................. 13 4.2 PRINCIPLES OF VALUATION OF NON-CURRENT ASSETS. ..................................................................................... 14 4.3 PROPERTY, PLANT AND EQUIPMENT AND SOFTWARE INTANGIBLE ASSETS ............................................................. 14
5. SYSTEM ................................................................................................................................................ 16
5.1 SYSTEM OVERVIEW .................................................................................................................................... 16 5.2 SYSTEM PROCESS AND PROCESSING LEVELS ..................................................................................................... 17 5.3 CONTROLS ................................................................................................................................................ 20 5.4 TRANSFER CHARGES AS A BASIS FOR COST ATTRIBUTION ...................................................................................... 20
6. VALUATION METHODOLOGIES ............................................................................................................. 22
6.1 INTRODUCTION .......................................................................................................................................... 22 6.2 DETAILED VALUATION METHODOLOGY ........................................................................................................... 26
7. ATTRIBUTION METHODS ....................................................................................................................... 33
7.1 INTRODUCTION .......................................................................................................................................... 33 7.2 CONCEPTS OF ATTRIBUTION .......................................................................................................................... 33 7.3 GROSS ADJUSTED COSTS ............................................................................................................................. 34 7.4 CONCEPTUAL MODEL .................................................................................................................................. 35
8. LINE OF BUSINESS ORGANISATIONAL UNIT CODES ............................................................................... 37
8.1 LINE OF BUSINESS ORGANISATIONAL UNIT CODES ............................................................................................ 37
9. USE OF SYSTEM GENERATED BASES ..................................................................................................... 39
9.1 INTRODUCTION TO SYSTEM GENERATED BASES .................................................................................................. 39 9.2 BASES APPORTIONED TO SPECIFIC COST POOLS ON THE BASIS OF PREVIOUSLY APPORTIONED COSTS PAN-DIVISIONALLY .... 39 9.3 BASES APPORTIONED ON THE BASIS OF PAY COSTS ............................................................................................. 40
10. BASE METHODOLOGIES – OUC DRIVEN BASES ................................................................................... 42
10.1 INTRODUCTION TO OUC DRIVEN BASES ........................................................................................................... 42 10.2 BASE METHODOLOGY DICTIONARY – OUC DRIVEN BASES ................................................................................... 43
11. BASE METHODOLOGIES – OTHER BASES ............................................................................................ 62
11.1 INTRODUCTION TO OTHER BASES ................................................................................................................... 62

3
11.2 BASE METHODOLOGY DICTIONARY – OTHER BASES .......................................................................................... 63
12. ACTIVITY GROUPS ........................................................................................................................... 124
12.1 INTRODUCTION TO ACTIVITY GROUPS ............................................................................................................ 124 12.2 ACTIVITY GROUP DICTIONARY ..................................................................................................................... 125
13. PLANT GROUPS ............................................................................................................................... 138
13.1 INTRODUCTION TO PLANT GROUPS ............................................................................................................... 138 13.2 PLANT GROUP DICTIONARY ........................................................................................................................ 139
14. COMPONENTS .................................................................................................................................. 224
14.1 INTRODUCTION TO COMPONENTS ................................................................................................................. 224 14.2 COMPONENT TO SERVICE ATTRIBUTION ......................................................................................................... 224 14.3 COMPONENT TO SUPER COMPONENT MAPPING AND USAGE FACTOR CALCULATIONS ............................................... 226 14.4 COMPONENT TO SERVICE MAPPINGS INCLUDING USAGE FACTORS EMPLOYED IN THE ATTRIBUTION PROCESS ................ 268
15. TRANSFER CHARGES ....................................................................................................................... 269
15.1 INTRODUCTION TO TRANSFER CHARGING ........................................................................................................ 269 15.2 TRANSFER CHARGES – CHARGES WHICH DO NOT NET TO NIL ............................................................................... 271
16. EQUIVALENCE OF INPUT SERVICES .................................................................................................. 273
17. DATA SOURCES ................................................................................................................................ 285
17.1 INTRODUCTION ........................................................................................................................................ 285 17.2 21CN VOLUMES AND CAPITAL .................................................................................................................... 285 17.3 HIGH LEVEL SUMMARY OF SYSTEMS ............................................................................................................. 287 17.3 DETAILED SUMMARY OF SYSTEMS ................................................................................................................ 288
18. GLOSSARY ....................................................................................................................................... 310
ANNEX 1. SECTORS ................................................................................................................................. 326
A.1.1 SECTORS INTRODUCTION ............................................................................................................................ 326 A.1.2 OPERATING COST SECTORS ......................................................................................................................... 326 A.1.3 BALANCE SHEET SECTORS .......................................................................................................................... 331 A.1.4 SECTOR TO F8 MAPPING TABLE ................................................................................................................... 340
ANNEX 2. ELECTRICITY PRICE REPORTING .............................................................................................. 341
A.2.1 DIRECTION .............................................................................................................................................. 341 A.2.2 BT ELECTRICITY CHARGE CALCULATION .......................................................................................................... 341 A.2.3 CONTRACT INFORMATION AND BREAKDOWN .................................................................................................. 341 A.2.4 COST ATTRIBUTION PROCESS FOR LLU RELATED ELECTRICITY COSTS .................................................................... 342
ANNEX 3. DETAILED VALUATION METHODOLOGY BIBLIOGRAPHY ........................................................ 343
ANNEX 4. STUDIES AND DATA SOURCES IN CURRENT COST ACCOUNTING VALUATIONS ......................... 344
ANNEX 5. INDICES AND TRENDS USED IN CURRENT COST ACCOUNTING .................................................. 345
ANNEX 6. ASSET MOVEMENT STATEMENT PROCESS FOR THE DERIVATION OF NET REPLACEMENT COST
INCLUDING UNDERLYING CURRENT COST ACCOUNTING MOVEMENTS ......................................................... 347
ANNEX 7. LINKAGE OF DVM ASSET CATEGORIES TO ACTIVITY AND PLANT GROUPS............................... 351
ANNEX 8. KEY DESTINATIONS ................................................................................................................ 352
Introduction
4
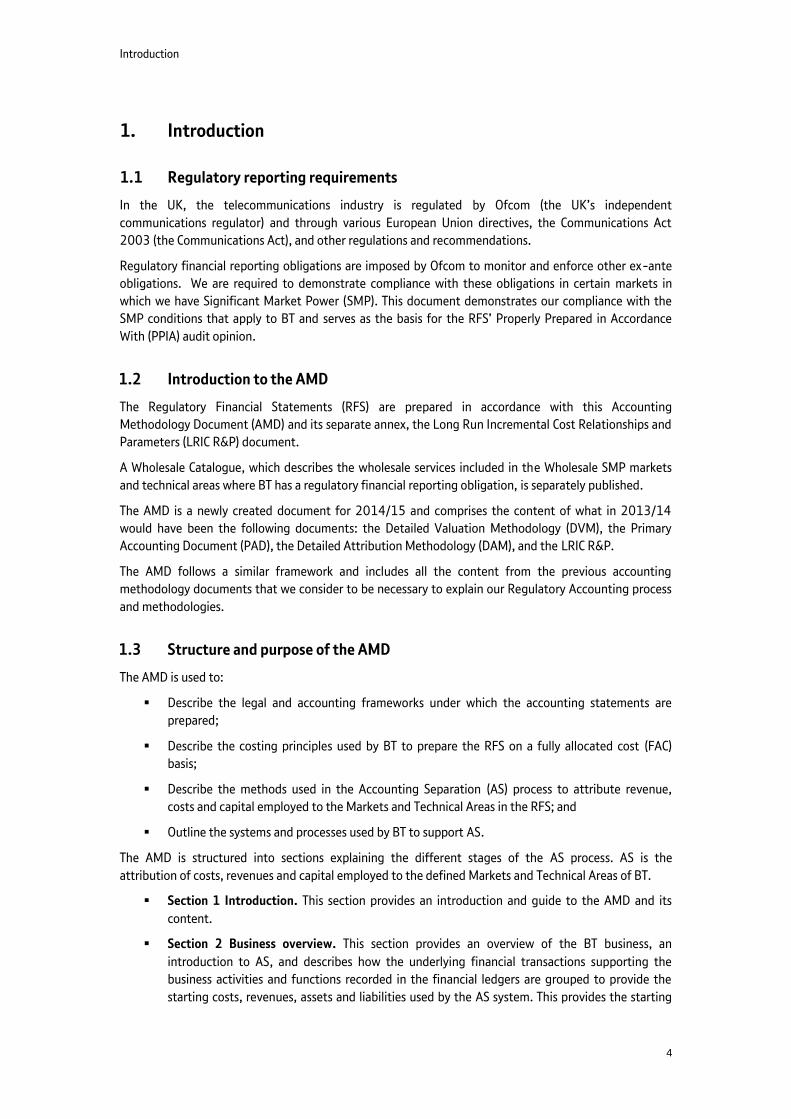
1. Introduction
1.1 Regulatory reporting requirements
In the UK, the telecommunications industry is regulated by Ofcom (the UK’s independent
communications regulator) and through various European Union directives, the Communications Act
2003 (the Communications Act), and other regulations and recommendations.
Regulatory financial reporting obligations are imposed by Ofcom to monitor and enforce other ex-ante
obligations. We are required to demonstrate compliance with these obligations in certain markets in
which we have Significant Market Power (SMP). This document demonstrates our compliance with the
SMP conditions that apply to BT and serves as the basis for the RFS’ Properly Prepared in Accordance
With (PPIA) audit opinion.
1.2 Introduction to the AMD
The Regulatory Financial Statements (RFS) are prepared in accordance with this Accounting
Methodology Document (AMD) and its separate annex, the Long Run Incremental Cost Relationships and
Parameters (LRIC R&P) document.
A Wholesale Catalogue, which describes the wholesale services included in the Wholesale SMP markets
and technical areas where BT has a regulatory financial reporting obligation, is separately published.
The AMD is a newly created document for 2014/15 and comprises the content of what in 2013/14
would have been the following documents: the Detailed Valuation Methodology (DVM), the Primary
Accounting Document (PAD), the Detailed Attribution Methodology (DAM), and the LRIC R&P.
The AMD follows a similar framework and includes all the content from the previous accounting
methodology documents that we consider to be necessary to explain our Regulatory Accounting process
and methodologies.
1.3 Structure and purpose of the AMD
The AMD is used to:
Describe the legal and accounting frameworks under which the accounting statements are
prepared;
Describe the costing principles used by BT to prepare the RFS on a fully allocated cost (FAC)
basis;
Describe the methods used in the Accounting Separation (AS) process to attribute revenue,
costs and capital employed to the Markets and Technical Areas in the RFS; and
Outline the systems and processes used by BT to support AS.
The AMD is structured into sections explaining the different stages of the AS process. AS is the
attribution of costs, revenues and capital employed to the defined Markets and Technical Areas of BT.
Section 1 Introduction. This section provides an introduction and guide to the AMD and its
content.
Section 2 Business overview. This section provides an overview of the BT business, an
introduction to AS, and describes how the underlying financial transactions supporting the
business activities and functions recorded in the financial ledgers are grouped to provide the
starting costs, revenues, assets and liabilities used by the AS system. This provides the starting

Introduction
5
asset, liability and cost pools (‘F8 items’), grouped and presented by similar functional
categories (sectors). The term cost pool is used as a generic term referring potentially to a pool
of cost, revenues, assets or liabilities. The AS system attributes the costs, revenues, assets and
liabilities to defined Products and Components that form the Services which aggregate into the
Markets and Technical Areas to create a view of BT’s financial position and results against SMP
Markets.
Section 3 Openreach reporting. This section provides an overview of our Openreach obligations
which are required by the Undertakings.
Section 4 Accounting policies. This section provides an introduction to the basis of the
presentation of the RFS and highlights any differences between current cost (as used in the RFS)
and historic cost policy (as set out in BT’s Annual Report). It describes the specific accounting
policies employed in the valuation of our non-current assets when preparing the RFS.
Section 5 System. This section provides an overview of the AS solution, and the REFINE system
we use to implement it, in terms of the underlying costing principles and the conceptual flow of
costs and revenues from source financial systems to the separated Markets and Technical Areas
to create a view of BT. It sets out the main types of cost pool used by the solution, in terms of F8
items, activity groups, plant groups, components and products, and explains the flow of costs
and revenues across the different types of cost pool.
Section 6 Valuation methodologies. This section describes in detail the specific valuation
methodologies used to value our non-current assets when preparing the RFS.
Section 7 Attribution methods. This section introduces the concept of cost attribution and how
the process flows from high level ledger costs through to Products (which are not presented in
the markets in which we have SMP and AS requirements) and Services.
Section 8 Line of Business Organisational Unit Codes. This section provides an overview of the
Lines of Business (LoBs) that exist within BT Group, the Organisational Unit Codes (OUCs) which
we use to represent these LoBs and the general basis of attribution which applies to each LoB.
Section 9 Use of system generated bases. This section introduces the concept, and provides a
dictionary, of system generated basis and the principles of attribution which we use to attribute
costs using such bases.
Section 10 Base methodologies – OUC driven bases. This section introduces the concept of
OUC driven bases (for example Except bases) and how and why these are used in the attribution
process. It includes a methodology dictionary which gives a complete description of the material
attribution methodologies used at this stage in the attribution process (bases to Activity Groups,
Plant Groups or Products). This attribution stage is undertaken in conjunction with Other Bases,
below.
Section 11 Base methodologies – Other bases. This section introduces the concept of Other
Bases and how and why these are used in the attribution process. It includes a methodology
dictionary which gives a complete description of the material attribution methodologies used at
this stage in the attribution process (bases to Activity Groups, Plant Groups or Products). This
attribution stage is undertaken in conjunction with Except Bases, above.
Section 12 Activity Groups. This section introduces the concept of Activity Groups and how and
why these are used in the attribution process. It provides an overview of all material activity
groups, and includes a high level summary of the methodology that is applied to attribute the
costs to the next cost pool (Activity Groups to Plant Groups or Products). The Activity Group
Dictionary provides a complete description of the attribution methodologies applicable to the
Activity Groups based on the current year profit and loss accounts and closing balance sheet.

Introduction
6
Section 13 Plant Groups. This section introduces the concept of Plant Groups and how these
are used in the attribution process. It provides an overview of all material Plant Groups, and
includes high level summary of the base methodology used for each Plant Group to attribute the
costs to the next cost pool (Plant Groups to Components, Products).
Section 14 Components. This section introduces the concept of Components and their usage
factors and how these are used in the attribution process. It provides an overview of all material
components and the usage factors, and the basis for these usage factors, applied to
components in order to attribute the costs on to services and part services.
Section 15 Transfer charges. This section expands upon the concepts of transfer charging and
how internal trades are treated within the cost attribution process. It provides a list, with
descriptions, of transfer charges which do not exactly contra-eliminate each other within the
attribution process, and final destination of these attributed costs.
Section 16 Equivalence of input charges. This section introduces the concept of Equivalence of
Input (EoI) charging and the services which we use for this process. It provides a dictionary of
certain Openreach charges which impact the Wholesale Broadband Access (WBA) markets.
Section 17 Data source. This section provides a dictionary of data sources.
Section 18 Glossary. A glossary of commonly used terms.
Annex 1 Sectors. A complete list and description of key REFINE sectors involved in the cost
allocation process.
Annex 2 Electricity price reporting. A description and explanation of our methodology for
setting the electricity charges that are used in the cost attribution process.
Annex 3 Detailed valuation methodology bibliography. A bibliography of documents used as
part of preparing our non-current asset valuation methodologies.
Annex 4 Studies and data sources in current cost accounting valuations. A list of studies and
data sources used as part of our Current Cost Accounting (CCA) valuations.
Annex 5 Indices and trends used in current cost accounting. A list of indices and trends used in
CCA.
Annex 6 Asset movement statement process for the derivation of net replacement cost
including underlying current cost accounting movements. A description of the Asset
Movement Statement (AMS) process used to derive Net Replacement Cost (NRC) including
underlying CCA movements.
Annex 7 Linkage of DVM asset categories to Activity and Plant Groups. A mapping of DVM
asset categories to Plant Groups and Sectors.
Annex 8 Key destinations. The key destinations table identifies the key destinations of all the
bases described in the RFS. This is based on the current year Profit and Loss account and closing
Balance Sheet.

Business Overview
7
2. Business overview
This section provides:
A brief overview of our business and our regulatory financial reporting obligations.
A description of how the underlying financial transactions supporting the business activities
recorded in BT Group’s financial ledgers are grouped into cost pools (‘F8 groups’) to provide the
input costs, revenues, assets and the liabilities used by the AS system.
2.1 BT Group and regulatory reporting
We are subject to regulatory financial reporting obligations for Markets and Technical Areas where we are
deemed to have SMP.
We prepare the RFS which show our costs, revenues, assets and liabilities against regulatory Markets and
Services as defined by Ofcom in their market reviews. The statements are prepared via the AS process and
comprise a financial performance summary, review of financial performance by groupings of markets and
by individual markets, other information including the network activity statement and the calculation of
FAC based on component costs and usage factors statement and reconciliation statements. For
regulatory reporting purposes, revenue is derived from and recorded against a range of services which BT
provides. Costs associated with operational and support activities undertaken to support the provision of
these services are recorded against sectors such as planning and development, provision and installation,
maintenance and plant support. A list and description of all of our reporting sectors is available in Annex
1.
2.2 AS Systems and the reporting hierarchy
Our financial and reporting system, REFINE, uses a hierarchical pyramid coding structure to support the
data capture and information summation at the LoB and activities level. This is explained below.
GL Codes
F 8 Codes
SFR Lines
AS Sectors
Wholesale
SMP Sectors
Retail Residual
GFR Lines
Accounting Transactions Layer
Base & Apportionment Layer
Financial & Management Accounting Layer
Group Financial Accounting Layer
Regulatory Reporting Layer
REFINE Reporting Layer
Used in Feeder Systems
Used in Financial Management Reporting Systems
Used in Financial & Management Reporting Systems
Diagram : BT’s SMP Reporting and Coding Structure
Business Overview
8
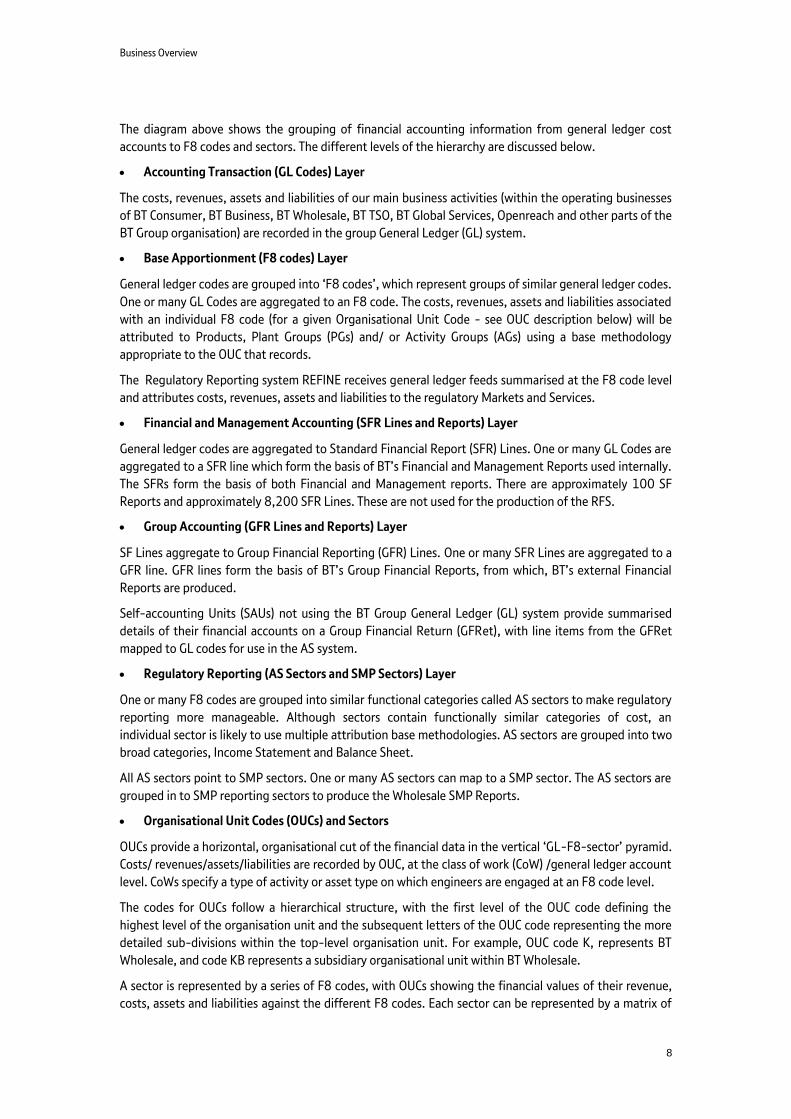
The diagram above shows the grouping of financial accounting information from general ledger cost
accounts to F8 codes and sectors. The different levels of the hierarchy are discussed below.
Accounting Transaction (GL Codes) Layer
The costs, revenues, assets and liabilities of our main business activities (within the operating businesses
of BT Consumer, BT Business, BT Wholesale, BT TSO, BT Global Services, Openreach and other parts of the
BT Group organisation) are recorded in the group General Ledger (GL) system.
Base Apportionment (F8 codes) Layer
General ledger codes are grouped into ‘F8 codes’, which represent groups of similar general ledger codes.
One or many GL Codes are aggregated to an F8 code. The costs, revenues, assets and liabilities associated
with an individual F8 code (for a given Organisational Unit Code - see OUC description below) will be
attributed to Products, Plant Groups (PGs) and/ or Activity Groups (AGs) using a base methodology
appropriate to the OUC that records.
The Regulatory Reporting system REFINE receives general ledger feeds summarised at the F8 code level
and attributes costs, revenues, assets and liabilities to the regulatory Markets and Services.
Financial and Management Accounting (SFR Lines and Reports) Layer
General ledger codes are aggregated to Standard Financial Report (SFR) Lines. One or many GL Codes are
aggregated to a SFR line which form the basis of BT’s Financial and Management Reports used internally.
The SFRs form the basis of both Financial and Management reports. There are approximately 100 SF
Reports and approximately 8,200 SFR Lines. These are not used for the production of the RFS.
Group Accounting (GFR Lines and Reports) Layer
SF Lines aggregate to Group Financial Reporting (GFR) Lines. One or many SFR Lines are aggregated to a
GFR line. GFR lines form the basis of BT’s Group Financial Reports, from which, BT’s external Financial
Reports are produced.
Self-accounting Units (SAUs) not using the BT Group General Ledger (GL) system provide summarised
details of their financial accounts on a Group Financial Return (GFRet), with line items from the GFRet
mapped to GL codes for use in the AS system.
Regulatory Reporting (AS Sectors and SMP Sectors) Layer
One or many F8 codes are grouped into similar functional categories called AS sectors to make regulatory
reporting more manageable. Although sectors contain functionally similar categories of cost, an
individual sector is likely to use multiple attribution base methodologies. AS sectors are grouped into two
broad categories, Income Statement and Balance Sheet.
All AS sectors point to SMP sectors. One or many AS sectors can map to a SMP sector. The AS sectors are
grouped in to SMP reporting sectors to produce the Wholesale SMP Reports.
Organisational Unit Codes (OUCs) and Sectors
OUCs provide a horizontal, organisational cut of the financial data in the vertical ‘GL-F8-sector’ pyramid.
Costs/ revenues/assets/liabilities are recorded by OUC, at the class of work (CoW) /general ledger account
level. CoWs specify a type of activity or asset type on which engineers are engaged at an F8 code level.
The codes for OUCs follow a hierarchical structure, with the first level of the OUC code defining the
highest level of the organisation unit and the subsequent letters of the OUC code representing the more
detailed sub-divisions within the top-level organisation unit. For example, OUC code K, represents BT
Wholesale, and code KB represents a subsidiary organisational unit within BT Wholesale.
A sector is represented by a series of F8 codes, with OUCs showing the financial values of their revenue,
costs, assets and liabilities against the different F8 codes. Each sector can be represented by a matrix of
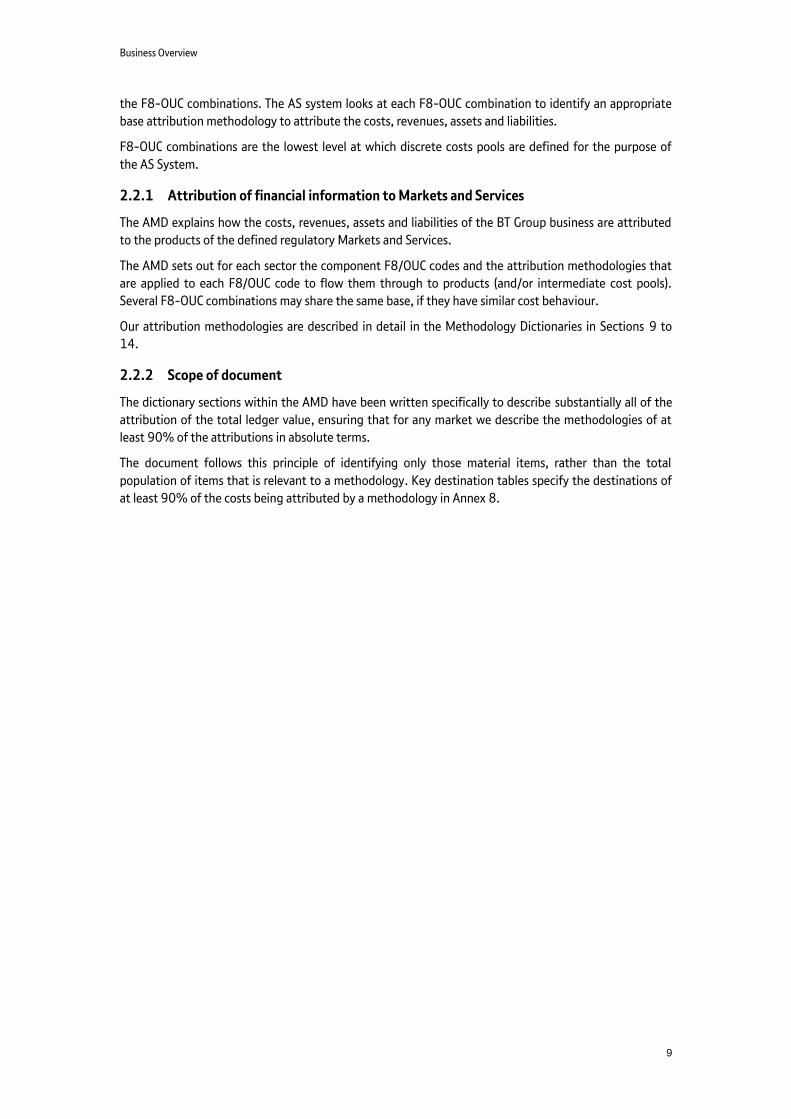
Business Overview
9
the F8-OUC combinations. The AS system looks at each F8-OUC combination to identify an appropriate
base attribution methodology to attribute the costs, revenues, assets and liabilities.
F8-OUC combinations are the lowest level at which discrete costs pools are defined for the purpose of
the AS System.
2.2.1 Attribution of financial information to Markets and Services
The AMD explains how the costs, revenues, assets and liabilities of the BT Group business are attributed
to the products of the defined regulatory Markets and Services.
The AMD sets out for each sector the component F8/OUC codes and the attribution methodologies that
are applied to each F8/OUC code to flow them through to products (and/or intermediate cost pools).
Several F8-OUC combinations may share the same base, if they have similar cost behaviour.
Our attribution methodologies are described in detail in the Methodology Dictionaries in Sections 9 to
14.
2.2.2 Scope of document
The dictionary sections within the AMD have been written specifically to describe substantially all of the
attribution of the total ledger value, ensuring that for any market we describe the methodologies of at
least 90% of the attributions in absolute terms.
The document follows this principle of identifying only those material items, rather than the total
population of items that is relevant to a methodology. Key destination tables specify the destinations of
at least 90% of the costs being attributed by a methodology in Annex 8.

Openreach
10
3. Openreach reporting
3.1 Introduction
On 22 September 2005, we entered into legally binding undertakings with Ofcom in lieu of a reference under the
Enterprise Act 2002 (“the Undertakings”). In accordance with section 5.311 of the Undertakings, the RFS
separately present the financial results of Openreach2 and include a reconciliation of Openreach’s revenue,
operating profit (and other items agreed between us and Ofcom) with the financial information about Openreach
as shown in BT Group plc’s Annual Report. This financial information is subject to an independent audit.
This section outlines the methodologies used to present the financial results of Openreach (‘Openreach
Information’) within the RFS and the reconciliation of that statement to the Openreach segmental financial
information as shown in BT’s Annual Report.
As required in the Undertakings, the form, content and basis of preparation of the Openreach Information follows
that used in the preparation of the RFS.
3.2 Openreach product groups
In accordance with section 5.31 of the Undertakings we have broken down the Openreach Information into the
broad product groups that Openreach provides. The product groups that we use are the same as the relevant
markets we have used in the main RFS except for “Other Openreach Markets & Activities (with no SMP reporting
obligation)”.
The following is a list of our product groups. The mapping of services into these product groups can be found in
the Wholesale Catalogue, with the exception of “Other Openreach Markets & Activities (with no SMP reporting
obligation)”:
Wholesale analogue exchange line services
Wholesale ISDN2 exchange line services
Wholesale ISDN30 exchange line services
Wholesale local access
Low bandwidth AISBO Non-WECLA
Low bandwidth AISBO WECLA
MISBO Non-WECLA
Other Openreach Markets & Activities (with no SMP reporting obligation). These activities include MISBO
WECLA and some services only sold internally such as element-Partial Private Circuits (ePPCs).
All of these services, with the exception of ePPCs, are described on Openreach’s website: www.openreach.co.uk.
ePPCs are an internally supplied service that provides the access network and backhaul network elements
necessary for the rest of BT to provide Partial Private Circuits (PPCs). ePPC costs, assets and liabilities are included,
(together with additional rest of BT costs, assets and liabilities) in the RFS in the following reported markets:
Traditional interface symmetric broadband origination (up to and including 8Mbit/s).
Traditional interface symmetric broadband origination (above 8Mbit/s up to and including 45Mbit/s) not
including the WECLA.
1 Refer to Ofcom statement: “Final statements on the Strategic Review of Telecommunications, and undertakings in lieu of a reference under
the Enterprise Act 2002” – Annex A, Part 2: Statement on undertakings in lieu of a reference under Part 4 of the Enterprise Act 2002
2 Referred to in the Undertakings as “AS”, meaning Access Services division.

Openreach
11
Traditional interface symmetric broadband origination (above 45Mbit/s up to and including 155Mbit/s) not
including the WECLA.
3.4 Format of the Openreach information statements
The format of the Openreach regulatory Income and Mean Capital Employed statements are consistent with the
sector analysis in the RFS.
3.5 Disaggregating SMP defined information into Openreach regulatory statements
The basis of disaggregating the SMP defined revenue, associated costs and capital employed into information used
to prepare the Openreach regulatory statements is described below.
3.5.1 Openreach revenue
Revenue is based upon published prices multiplied by Openreach volumes, consistent with our RFS. We have used
volumes associated with Openreach products. Against the identified volumes we apply the published price, where
products are sold externally or internally, to arrive at the reported revenue for Openreach.
For services which are only sold internally and where there is no applicable published price, revenue is calculated
on the prices that have been agreed internally between Openreach and the other BT divisions eg for the supply of
ePPCs.
3.5.2 Northern Ireland
Volumes, revenues, costs and capital employed relating to Northern Ireland are included in the Openreach
element of the service at this stage, and are shown in the production of the reconciliation statements (see below).
3.6 Reconciliation of Openreach income statement
The reconciling differences between the Openreach Information and the Openreach segmental financial
information reported in BT’s Annual Report fall into the following main categories:
i. Basis of preparation under Current Cost Accounting (CCA): BT’s Annual Report has been prepared under the
historical cost accounting (HCA) basis, modified for the revaluation of certain financial assets and liabilities
at fair value. BT’s RFS have been prepared on a CCA basis.
ii. Results relating to Northern Ireland operations: The RFS have been prepared in accordance with the Final
Statements and Notifications imposed on us where Ofcom has defined certain markets in which we are
deemed to have Significant Market Power (SMP) in the UK. This definition includes our Northern Ireland
operations. The Openreach segmental financial information reported in BT’s Annual Report has been
prepared based on the definition from the Undertakings. This excludes our operations in Northern Ireland.
Accordingly, the results of the access network element of BT’s Northern Ireland operations form part of the
reconciliation. The revenues relating to Northern Ireland have been identified from the product revenues
ledgered separately for the Northern Ireland line of business, and the underlying volumes derived by
dividing these ledgered revenues by their published prices. The associated costs relating only to the access
element of BT’s Northern Ireland operations have been identified as the total costs from the BT
organisational unit code (OUC) “HM” within the Openreach results within BT’s regulatory accounting
system.
iii. Cost of capital adjustment for internal trading: Within the Openreach segmental financial information
reported in BT’s Annual Report, there is a charge for an appropriate return on capital where assets are
owned by the BT TSO division (eg for line cards, electronics and network features) but are used by
Openreach. The Openreach regulatory statements do not include this charge, as the basis for allocation of
costs and assets to products in the regulatory accounts is actual costs and assets.
iv. Other reconciling items and trading differences: This adjustment relates to other trading differences that
may occur from period to period in attributing costs for the RFS. Internal transfers raised between
businesses are ignored within the RFS for both the OUC raising the charge and the OUC receiving the
charge so as to reflect the true regulatory end-to-end costs of each unit. The total regulatory cost of each

Openreach
12
category is compared to the equivalent traded costs within the management accounts to calculate
individual reconciliation differences and the sum of the differences incorporated as the total reconciliation
difference for trading differences.
v. Non-traded costs: Costs shown separately from the Openreach segmented results in BT’s Annual Report
are included as a separate line to enable reconciliation between the accounts.
We do not publish Openreach segmental balance sheet information in our Annual Report and consequently are
unable to publish the Reconciliation of Openreach MCE Statement in the RFS.

Accounting policies
13
4. Accounting policies This section explains the basis of the presentation of the RFS and highlights any differences between current cost
and historic cost policy as set out in BT’s Annual Report.
4.1 Basis of preparation of the RFS
The RFS are prepared under the financial capital maintenance convention in accordance with the principles set out
in the handbook “Accounting for the effects of changing prices”, published in 1986 by the Accounting Standards
Committee, except where directed by Ofcom to apply alternative valuation methodologies. Under this convention,
current cost profit is normally arrived at by adjusting the historic cost profit to take account of changes in asset
values and of the erosion in the purchasing power of shareholders’ equity during the year due to general inflation.
Asset values are adjusted to their value to the business, usually equivalent to their net current replacement cost.
Changes in asset values are referred to as unrealised holding gains or losses and are not split between price
variance and other as we do for the RFS.
The Accounting Methodology Documents are made up of the following (listed in order of priority):
i. The Regulatory Accounting Principles (published separately to this document by Ofcom in Annex 1 of
their Directions for Regulatory Financial Reporting (30 March 2015))
ii. The Attribution Methods (covered in Sections 8 to 14 of this document)
iii. The Transfer Charge System Methodology (Section 15 of this document)
iv. The Accounting Policies (this section)
v. The Long Run Incremental Costs Methodology (published as a separate annex to this document)
The RFS are required to give primacy to Regulatory Decisions, which are explained in the Attribution Methods.
The RFS are reconciled to BT’s Annual Report, which consolidates, on a historic cost basis, the financial statements
of the company and all of its subsidiary undertakings. Where the financial statements of subsidiary undertakings,
associates and joint ventures do not conform to the Group’s accounting policies, appropriate adjustments are
made on consolidation in order to present the financial statements on a consistent basis. The principal subsidiary
undertakings’ financial years are all in alignment to those of the company.
The preparation of financial statements in conformity with IFRS requires the use of accounting estimates. It also
requires management to exercise its judgement in the process of applying the Group’s accounting policies. We
continually evaluate our estimates, assumptions and judgements based on available information and experience.
As the use of estimates is inherent in financial reporting, actual results could differ from these estimates. The areas
involving a higher degree of judgement or complexity include accounting for long term customer contracts,
pension obligations, useful lives for property, plant and equipment and software, provisions and contingent
liabilities, current and deferred income tax, goodwill and provision for doubtful debts.
The Group’s accounting policies are detailed on pages 150 to 154 of BT’s Annual Report for the year ended 31
March 2015 which is available from our website: www.BTplc.com, or from our registered office:
BT Group plc
BT Centre
81 Newgate Street
London EC1A 7AJ
United Kingdom
Tel: 020 7356 5000
From outside the UK
Tel: +44 1793 596 931

Accounting policies
14
4.2 Principles of Valuation of Non-Current Assets.
Assets are stated in the balance sheet at their value to the business, usually equivalent to their Net Current
Replacement Cost (NRC). This is generally derived from the asset’s Gross Replacement Cost (GRC) and is the current
purchase price of an identical new asset or the cost of a modern equivalent asset (MEA) with the same service
potential.
We employed different valuation methods in the RFS for different technology types. These are ‘existing
technology’, ‘modern equivalent asset’ and ‘low value/short life’ valuations. The valuation types along with the
different ways in which we employ them are explained in Section 6 Valuation methodologies.
4.3 Property, Plant and Equipment and Software Intangible Assets
Property, plant and equipment are stated at current cost less depreciation (also at current cost).
In BT’s Annual Report, property, plant and equipment and software intangible assets are included at historical
cost, net of accumulated depreciation, government grants and any impairment charges. On disposal, any
difference between the sale proceeds and the net book value at the date of disposal is recognised in other
operating income in the income statement.
Included within the cost for network infrastructure, equipment and internally developed software are direct and
indirect labour costs, materials and directly attributable overheads. Depreciation is provided on property, plant
and equipment on a straight line basis from the time the asset is available for use, to write off the asset’s cost over
the estimated useful life taking into account any expected residual value. Freehold land is not depreciated.
4.3.1 Current Cost of Property, Plant and Equipment and Software Intangible Assets
The current replacement cost of categories of assets where major programmes of modernisation are under way is
based on the concept of the modern equivalent asset, ie the cost of replacing existing equipment with modern
assets of similar service potential. The gross current replacement cost of the major categories of property, plant
and equipment and software intangible assets has been assessed on the following basis:
(a) Land and buildings
Property assets (general purpose buildings, specialised buildings, general purpose land and specialised land), are
valued at historic cost. Specialised accommodation assets are valued using the indexed historic methodology.
(b) Access – Copper
Copper cable and dropwires are valued using the indexed historic methodology and the Office of National
Statistics (ONS) published Retail Price Index (RPI).
(c) Access – Fibre
Access fibre cables are valued using the absolute valuation methodology.
(d) Duct
Duct is either valued using the indexed historic methodology and the ONS published RPI or, for duct used by
access cables, a prescribed RAV methodology which Ofcom have directed us to use.
(e) Switch
System X local exchanges are valued using an extrapolation of the absolute valuation as at 31 March 2009.
AXE10 local exchanges, UXD5 remote concentrators and main distribution frames are valued at historic cost.
(f) Transmission
Synchronous Digital Hierarchy (SDH) transmission equipment is valued using the indexed historic methodology.
Backhaul and core fibre cables and equipment deployed as part of 21st Century network are valued using the
absolute valuation. All other Transmission assets are valued at historic cost.

Accounting policies
15
(g) Other Non-current Assets
Telecom power equipment is valued using the indexed historic methodology. All other assets, including
computers, vehicles, internally developed and externally purchased software and other intangible assets are
valued at historic cost.
4.3.2 Depreciation
HCA depreciation is provided on property, plant and equipment on a straight line basis from the time the asset is
available for use, to write off the asset’s cost over the estimated useful life taking into account any expected
residual value. Freehold land is not depreciated.
The asset lives assigned to principal categories of assets are shown in our accounting policies, described in our
statutory accounts Annual Report.
We note that there is one difference between the asset lives used in our RFS and the asset lives as described in BT’s
Annual Report. Ofcom have directed that the life of Testing Access Matrix (TAM) assets used for Local Loop
Unbundling (LLU) should be 7 years/84 months. In the statutory accounts these assets have a 5 year/60 month
life.

System
16
5. System
5.1 System Overview
We use a system called REFINE to perform the fully allocated cost attribution for the Regulatory Financial
Statements. REFINE takes financial information from our general ledgers and using a series of predetermined rules
and bases it attributes the costs, assets and revenues to regulated and non-regulated markets via a series or cost
pools.
The diagram below illustrates the types of transaction data entering the REFINE system and processed to form the
regulatory financial statements:
Financial Information from our Core General Ledger
We upload financial information relating to costs, revenues, assets and liabilities for the business units that use the
general ledger in our central accounting system. This information is uploaded in the form of general ledger codes
and organisational unit codes.
Non-core GL feed
We upload financial information relating to cost, revenues, asset and liabilities for the self-accounting business
units from the Group Consolidation System. These business units are typically BT-owned subsidiaries and they are
included in REFINE in order to reconcile the financial information to that published in our statutory accounts but
are allocated to the Retail Residual market.
We also upload central journals that relate to accounting adjustments that have been reflected in the statutory
accounts but not processed within the Core Journal
We also upload information relating to our Current Cost Accounting revaluations includes asset values and indices.
This information is uploaded from a REFINE CCA module with the underlying data being sourced from our fixed
asset register and variety of our sources including indices published on the HMSO website.
We also enter some other journals into REFINE in order to take account of specific regulatory adjustments such as
the accounting for Excess Construction Charges and for implementing RAV for duct.
Volumes and Prices for our Network Business
We upload service volumes and prices for our Network Business. In the case of Openreach markets the volumes are
sourced directly from Openreach but they are pre-processed in order to input them at the required level of

System
17
granularity for regulatory reporting. In the case of the other Wholesale markets we source the external volumes
from BT Wholesale and the internal volumes are derived from the volume of the downstream retail products using
a number of different sources.
The prices for all reported services are sourced directly or indirectly from the Openreach and BT Wholesale price
lists but in some cases these are aggregations of more than one price.
General Ledger Hierarchy
General Ledger (GL) accounts are the lowest level at which financial information is brought into REFINE. A General
Ledger Hierarchy file is also fed into REFINE, which sets out a mapping of GL accounts to F8 codes and assigns a
series of markers to provide additional information about the F8 code eg sectors, transaction types etc. This is
enables the enable the system to track and report results against a number of views.
F8 code / OUC Hierarchy
This file designates an attribution rule to each F8 code and OUC combination.
Attribution Rules
Some of the attribution rules are processed or calculated by REFINE but other rules need uploaded into the
system. These rules are uploaded in the format of % allocations eg Specialised Accommodation costs are
apportioned according the floor space occupied and the rule table that is uploaded shows the percentage of floor
space occupied by each plant group.
5.2 System process and processing levels
The REFINE system defines different categories of costs, which are treated in a similar manner in the system. At
each level of the system processing, a particular category of costs will be attributed to other cost pools resulting in
a sequential flow of costs across different categories at each stage of the system. The process of cost pools
emptying as the costs are attributed forwards is referred to as ‘exhaustion’.
The diagram below illustrates the main processing stages of the REFINE system for the RFS.
Diagram: Overview of REFINE’s main attribution stages

System
18
These levels cascade costs downwards (the attribution process) in a specific order (as shown in the above diagram),
to the final level of products (note that costs are allocated to products but the main focus for regulatory reporting
is at the Component and Service level as these are what we publish in the RFS for SMP markets). The order of
attribution is important because some attributions are made on the basis of previously attributed costs. For
example, some costs are attributed on the basis of pay costs.
5.2.1 Processing Level 101
The source cost pools at level 101 attributes the F8/OUC combinations of cost, revenues, assets and liabilities
including current cost adjustments.
F8/OUC combinations are attributed to products, activity groups and plant groups using set of rules determined in
the F8 code / OUC Hierarchy. These rules are organised into a number of “Rule Types” which are sequenced in a
specific order, this order is important since many costs are attributed on the basis of costs already attributed in a
previous step.
Rule Types and Sequencing
Order Rule or Table Allocation Basis
1 Rule Type 1 Direct allocation of costs to Plant Groups, Activity Groups and
Retail Residual
2 Rule Type 3 % attribution – based on cost allocation models
3 Exceptions % attribution of costs for certain OUCs
4 Rule Type 4 System Generated – Based on costs, including pay (LoB) (incl.
Exceptions)
5 Rule Type 6 System Generated – Based on costs, including pay (LoB) (excl.
Exceptions)
6 Transfer Charges (RT28) Reallocation of costs between Core OUCs
7 Rule Type 12 System Generated – Based on costs or revenues (Group)
Rule Type 1 Allocations
Allocate specific F8/OUC combinations to a specific cost pool eg Openreach (OUC: B) engineering pay costs for the
activity of repairing PABXs (Class of Work AMBSB, F8 code: 102911) are allocated to PG981R (Time Related
Charges) but pay costs for B T TSO engineers on the same activity are attributed to Retail Residual.
Rule Type 3 Apportionments
Apportions F8/OUC combinations to more than one cost pool using a specific attribution rule eg The depreciation
on BT TSO’s AXE10 switch assets F8 code: 455164 / OUC: T) are apportioned to several plant groups using the
rule PDTLYX (see Section 11 for more information on PDTLYX).
Exceptions
These attributions are applied to specific OUCs eg the costs in the business unit BT Wholesale Product
Management (OUC: KD) are apportioned to plant group based on an activity survey.
Rule Type 4
Rule Type 4 is an attribution rule that is a system generated attribution that apportions costs in proportion to
costs that have already been attributed using Rule Type 1, Rule Type 3 and Exception rules. An example of a rule
type 4 attribution is FTQ which apportions costs in proportion to previously attributed pay costs. Rule Type 4
attributions only apportion costs in proportion to costs within the same LoB or if the particular OUC is designated
as a ‘stand-alone business unit’ then the costs are only attributed in proportion to that business unit.
Example 1: The pay costs of the Openreach Finance team (OUC: BF) are apportioned using Rule Type 4 FTQ. OUC
BF is not a stand-alone business unit so the system apportions these costs to activity groups and plant groups in
proportion to previously allocated pay in the Openreach LoB. The previously allocated pay would include: all the

System
19
engineers pay costs attributed using Rule type 1 allocations and Rule type 3 apportionments and the pay of the
Openreach Service Management Centres (OUC BW) attributed using an Exception rule.
Example 2: The costs of Openreach Network Investment (OUC: BL) ‘work manger controls’ are also apportioned
using Rule Type 4 FTQ. Network investment has been designated as stand-alone business unit so the system
attributes the ‘work manager controls’ costs in proportion to previously allocated pay costs of the engineers in
Network Investment team only it would ignore the previously allocated pay costs in other engineering units like
Openreach Business and Corporate Delivery (OUC: BD) .
Rule Type 6
Rule Type 6 works in the same way as Rule Type 4 except that it does not include costs that have been previously
attributed using Exception rules.
Transfer charges (Rule Type 28)
Transfer charges relate to the attribution of costs between different business units. Each transaction has receipt
for one LoB and a payment for another LoB. Rule Type 28 is a system generated base that attributes the transfer
charges receipts in proportion to how the transfer charge payments have been apportioned, in this way the two
net each other off. Transfer chare are explained more fully in Section 15 Transfer charges.
Rule Type 12
Rule Type 12 is another system generated attribution and it works in the same way as Rule Type 4 and Rule Type 6
except that is attributes costs and assets in proportion to previously attributed costs for the whole of BT Group
rather than just the LoB or business unit that incurred the cost. Examples of the type of items processed under rule
type 12 include trade creditors, billed debtors and prepayments.
5.2.2 Processing Level 701
The source cost pools at level 701 attribute the combinations of costs and assets which relate to activities such as
training, development, facilities management and general corporate costs.
We have summarised this level to show how Activity Groups attribute to Plant Groups. In practice there are sub-
stages to this attribution where Activity Groups are attributed in a specific order to accommodate the fact that
some of their attributions are to other Activity Groups.
The order of this attribution is as follows (note that more information on Activity Groups is available in Section 12
Activity Groups):
1. AG101 to AG106 and AG401 – AG415; then
2. AG112 and AG113; then
3. AG135, AG148, AG149 and AG161 to AG164.
Activity Groups are attributed to plant groups and retail residual using either defined system rules or
methodologies which are appropriate to the types of costs they attribute. Ultimately Activity Groups are
attributed to either Retail residual products or Plant Groups; however some of the attributions at this processing
level are first from one Activity Group to another.
5.2.3 Processing Level 801
The source cost pools at level 701 attribute the combinations of costs and assets which relate to plant (network)
overheads, such as accommodation costs for network buildings and costs of providing power to exchanges and
transmission assets.
Plant Groups are attributed to components and retail residual using methodologies which are appropriate to the
types of costs they attribute. Plant Groups can be attributed to Components on a one-to-one, one-to-many basis,
or many-to-many bases. Consequently a Plant Group may contribute costs to many different Components and a
Component may receive costs from many Plant Groups.

System
20
5.2.4 Processing Level 870
The source cost pools at level 801 attribute the combinations of all costs and assets which make use of BT’s
Network (ie those which are not already attributed to Retail residual markets).
Components are attributed to services. Services represent a bundle of Component elements. These services get
charged to those who use the network. Network users can be internal (BT Retail) or external (Other
Communication Providers). The allocation of Components to Services uses volumes and usage factor data. Details
of how this works can be found in Section 14 Components.
5.3 Controls
There are a number of controls in the AS system to ensure the accuracy and completeness of the results. The key
controls include:
AS data vetting
All data entry to the REFINE system, except the direct interfaces from the GL, takes place through the DRM
(Oracle Data Relationship Manager) scripting process or separate modules in REFINE (eg for CCA). The Operations
finance team manages version control data integrity. Data is entered or loaded into REFINE via a bespoke DRM
interface and can be managed and reworked in a variety of ways. Once a DRM table has been updated, it cannot
then be edited unless a superseding script is loaded to overwrite by an authorised user to help ensure data
integrity. Once data has submitted to a REFINE run it cannot be altered until a new run is initiated.
Specification of data sets for runs
Each run of the system is given a unique reference, which dictates the combination of data sets and reference data
to be used in the run. These are determined from electronic control sheets to effectively ‘commission’ the run.
Completeness of processing
REFINE produces a series of ‘probity reports’ to show the completeness of processing at each level of the system.
5.4 Transfer charges as a basis for cost attribution
A number of the individual methodology/base descriptions set out in Section 11 Other bases refer to the use of an
‘internal transfer charge destination’ as the basis for attribution of the actual cost underlying the transfer charge,
within the AS process. This section explains the rationale for using this basis.
The purpose of transfer charging is to:
Enable customer-facing divisions, which are responsible for their own profitability, to receive a correct
allocation of income and expenditure.
Enable support functions to charge for their services to other group units.
Enable control to be exercised over use of key resources.
Maintain proper control in accounting units of certain balance sheet items.
There is a well-established process for the recording of transfer charges between organisational units, and for the
monitoring and control by each unit to ensure that the amount of the charge is properly stated in accordance with
the transfer charge agreement, and that the amounts are recorded in the correct organisational unit.
Within the AS process, the transfer charge amounts recorded by each unit are replaced with the actual cost
underlying the charge, and for which the charge is made. The actual cost is then attributed consistent with the
treatment of the transfer charge. This occurs principally in respect of the following types of cost and is attributed
on a cost-causal basis:
Motor transport – charged on the basis of the number and types of vehicles used by each OUC.
Computing – charged on a monthly fixed charged, taking account of variations in volumes eg a reduction in
volumes will result in lower charges.

System
21
Accommodation – charged on the basis of floor space occupied by each organisational unit, taking account of
the variations in underlying cost (eg a central London office space being charged at a higher rate than an
office space in a rural location).
We explain transfer charges further in Section 15 Transfer charges.

Valuation methodologies
22
6. Valuation methodologies
6.1 Introduction
In this section we describe the specific valuation methodologies used to value our Non-current Assets in the
preparation of the RFS.
BT’s fixed asset register categorises our assets into a range of sub-accounts known as classes of work (CoW). These
CoW describe the type of asset in detail and are an appropriate level of granularity for us to make our valuation
decisions. In the presentation of the RFS we group them into a smaller number of asset categories. Details of the CoW
included under each asset category are provided in Annex 7.
Our fixed asset register also provides some additional detail which allows us to go down to an additional level of detail
(known as policy codes) and our financial systems allow us to disaggregate capital expenditure into pay, materials and
contracted work. This additional detail is used in the valuation methods where appropriate.
Basis of Preparation of the Regulatory Financial Statements
The RFS are prepared under the financial capital maintenance (FCM) convention using the principles set out in the
Report to H. M. Treasury (1986) “Accounting for Economic Costs and Changing Prices” and the handbook
“Accounting for the effects of changing prices”, published in 1986 by the Accounting Standards Committee, except
where we are directed by Ofcom to apply a different valuation methodology.
Under the FCM convention we include changes in asset values in our income statement as unrealised holding gains or
losses. Normally a general inflation adjustment for the erosion in the purchasing power of shareholders’ equity would
also be applied, but this adjustment is not included in regulatory reporting.
Principles of Valuation of Non-current Assets
Assets are stated in the balance sheet at their value to the business, usually equivalent to their Net Replacement Cost
(NRC). This is generally derived from the asset’s Gross Replacement Cost (GRC) which is the current purchase price of
an identical new asset or the cost of a modern equivalent asset (MEA) with the same service potential, except where
we are directed by Ofcom to apply a different valuation methodology.
In line with the FCM concept, the effect of the asset revaluation on the income statement is to increase the historical
cost profit by any unrealised holding gains (UHG) arising in the year and to decrease it by unrealised losses. Over the
life of the asset, CCA and HCA charge the same to the P&L (including supplementary depreciation as a result of CCA
changes). Asset life is also the same. We allocate Current Cost Accounting (CCA) adjustments to the income statement
and balance sheet to Markets using the same principles and processes as we use for allocating the historic costs for the
same assets.
The methods employed for valuing our assets are shown in the table below:
Valuation assumption Valuation method Example (CoW)
Existing technology Absolute valuation
Indexation
Extrapolated Absolute
Regulatory Asset Valuation (RAV)
Optical fibre spine cable (LFSC)
Copper Dropwires (NWB & NWR)
System X exchange switches (LDX)
Duct (LDD)
Modern Equivalent
Asset (MEA) – see
section 1.4(ii)
Absolute valuation 21CN Combi-cards (MSANF and MSANH)
Low value, short
residual life and/or
minimal impact on
regulated areas of BT
Historical cost Vehicles (NVAC)

Valuation methodologies
23
6.1.1 Choice of Valuation Method
The valuation methods used for the various asset categories are reviewed annually to ensure that they are still
appropriate and produce robust valuations in the light of changes in technology and levels of investment. For
example, when new technology is being introduced, the purchase price will represent its current cost but in later
periods’ indexation or an absolute valuation will be introduced as prices change and/or the technology of the assets
purchased is no longer the modern technology.
If the technology of the asset in place is still the current technology (subject to section (ii) following), the asset is
valued on a like-for-like basis but at current prices rather than the prices when purchased.
(i) Existing technology
Where an asset is being revalued on a direct replacement basis, its replacement cost is usually assessed either by
indexation, by absolute valuation or by extrapolated absolute valuation. The choice of method involves a judgement as
to which method, given the data available, is likely to give a more accurate and robust valuation. Factors considered
include the following:
Indexation This is an appropriate method when there has been little technological change in the asset category and all
the direct costs associated with bringing the asset into service would be incurred if it were to be replaced today. It also
requires the production of an appropriate index. Net replacement cost is derived using indexation of the historical net
book values – see section 1.8.
The table below shows those assets presently valued on an indexed historic basis as detailed in Annex 5.
Absolute valuation: In using the indexation method there may be difficulties in establishing appropriate indices and
hence it may be more accurate and reliable to use physical volumes and unit prices to derive a full absolute valuation.
This method in turn may present difficulties, for example in establishing meaningful current unit prices, so the choice
of method for a particular asset depends on individual circumstances.
The table below shows those assets presently valued on an absolute valuation basis.
Asset Description CoW 2013/14 CCA Depreciation
Method
Section ref. for detailed
methodology
Access Fibre Cable
Backhaul/ Core Fibre Cable
21st Century Network:
Core Nodes
Metro Nodes
Metro Nodes
Metro Nodes
Ethernet
WDM
WDM
MSAN
MSAN
LFSC
CJF
CORLU
METCI
METSI
METAL
ETHER
WDMH
WDM21
MSANF
MMSANH
Roll Forward
Roll Forward
NBV/GBV
NBV/GBV
NBV/GBV
NBV/GBV
NBV/GBV
NBV/GBV
NBV/GBV
NBV/GBV
NBV/GBV
6.2.4
6.2.7
6.2.7
6.2.7
6.2.7
6.2.7
6.2.7
6.2.7
6.2.7
6.2.7
6.2.7
Asset Description CoW
Copper Dropwires
Synchronous Digital Hierarchy Equipment
Backhaul and Core Duct
Access Copper Cable
Telecom Power Equipment
Specialised Accommodation Assets
NWB & NWR
SDH
LDD
LDC
TPC
ACPN

Valuation methodologies
24
Extrapolated absolute valuation: where there have been no significant developments in technology or underlying
asset base then a full absolute valuation exercise may not be justified. In these cases we may choose to continue with
previous year’s valuation and then extrapolate by adding capital expenditure at cost and applying an index that
reflects known price movements.
The table below shows those assets presently valued using an extrapolated absolute valuation method.
Asset Description CoW
Date asset last
valued as Absolute
Valuation
Section ref. for
detailed
methodology
System X Exchange Switches LDX 2008/09 6.2.6
Regulatory Asset Valuation (RAV): In some situations Ofcom have directed us to follow an alternative methodology
to make the valuation consistent with that used in charge controls.
The table below shows those assets presently valued Ofcom determined Regulatory Asset Valuations.
Asset Description CoW Section ref. for detailed
methodology
Duct used by copper cables LDD 6.2.5
(ii) Modern Equivalent Asset (MEA)
In situations where there is technological change, existing assets may not be replaced in an identical form. In such
cases the replacement cost is based on the cost of a MEA ie the cost of a modern asset with similar service potential. In
some cases the rate at which modern assets can be introduced is limited by practical constraints such as
manufacturing and installation capacity, or lead times. The mix of technology used as the modern equivalent for
valuation is generally taken as that forecast to be in place in three years’ time. The problems of assessing capacity and
unit costs are the same as for any absolute valuation, as described above.
Currently the only asset valued as an MEA is that of MSAN combi cards which are valued by using the price of
broadband cards. Combi cards were installed to cater for both voice and broadband but the intention is now to only
use these combi cards as broadband cards.
(iii) Low value, short residual life or minimal impact on regulated parts of BT
Where assets:
have a relatively low value,
have a short asset life and only modest price movements have been observed,
are virtually fully depreciated,
have been recently acquired (so the current and historic costs are similar), or where
attribution to regulated markets is immaterial,
there will be little impact on the regulatory financial statements as a result of the differences between their historic
and current replacement cost. Therefore, these assets will be valued at their historic cost.
Asset Description CoW Section ref. for detailed
methodology
Office computers COMPE 6.2.8

Valuation methodologies
25
6.1.1 Cost Adjustments
(i) Operating Cost Adjustments
If there are material differences in operating costs between the MEA and the existing asset, the MEA valuation is
adjusted to reflect these. The differences may arise, for example, due to differing maintenance costs over the whole
lives of the assets.
At present, for assets valued using an MEA approach, there are no cases where the differences have been identified as
significant and hence no adjustments are required.
(ii) Functionality Abatements
Where existing assets are valued using a MEA, the unit price of the modern asset may reflect a higher level of
functionality than that of the existing asset. In such cases the MEA valuations of the existing assets are adjusted
downwards to reflect the estimated cost of upgrading these assets to the functionality of the version used in the
valuation.
(iii) Surplus Capacity
An asset is considered to have surplus capacity only if there is capacity within the asset that is not in use and not
expected to be put into use over BT’s planning horizon. Thus assets that have capacity planned to be brought into use,
or which are needed to meet known planning margins or network resilience requirements are considered to be part of
the operating capacity.
Where there is modularity in the provisioning of capacity, provided that a part of the modular asset is utilised or will be
utilised over the planning horizon, these assets are included within the operating capacity in their entirety.
BT has not identified any material groups of assets that fall within the above definition of surplus capacity that require
revaluation.
6.1.3 New Technology and its use as MEA
Emerging replacement technologies are treated as separate asset categories until it is clear that their costs are lower
than those of an older technology and that they have become the modern equivalent. For example, fibre cable is being
deployed in parts of the access network but its cost is not yet low enough for it to be considered as the MEA for copper
cable.
In considering the use of new technology as the MEA it is assumed that there are no changes to BT’s network
topology, ie the number of nodes and the links between them are valued in their existing configuration, not as a
theoretical optimised network.
6.1.4 Unit Costs
Unit costs applied to capacity for absolute valuations are based on outturn prices where these are considered
representative of the costs that would be relevant if the assets were being replaced at a normal rate in the normal
course of business. It is possible that the prices currently being paid are unrepresentative, for example when ordering
levels are particularly high or low, or at the end of a technology’s life. In such cases an estimate is made of an
appropriate current cost with reference to internal and external data.
6.1.5 Choice and application of indices for Indexation Method
We have prepared price indices for each of the CoWs valued under the indexation method. These indices are usually
composite indices constructed from Office for National Statistics (ONS) indices such as average earnings and weighted
by analysis of elements of BT expenditure eg BT labour, contract, or stores. Annex 5 lists the indices (including their
sources).
The year-end valuation for each asset is built up from historical asset data, sourced from the Group’s Fixed Asset
Registers plus late registered assets from a late registration journal and WIP from the BT Group annual report. Indices
at 31 March (current year) are used in the year-end valuations in conjunction with the indices at 30 September in the
year of registration for the asset being valued, as illustrated below. Use of the mid-year indices reflects the fact that

Valuation methodologies
26
the assets are purchased throughout the year; thus the current year historic cost accounting (HCA) additions have six
months’ indexation applied to them to derive their CCA value.
Example for an asset being valued at 31 March 2015:
6.1.6 Depreciation
Depreciation is provided on non-current assets on a straight-line (for HCA) basis from the time they are available for
use, so as to write off their costs over their estimated useful lives, taking into account any expected residual values. No
depreciation is provided on freehold land. The lives assigned are the same under both the current cost and historical
cost conventions.
CCA depreciation for those assets valued on an indexed historic basis is calculated using the Indexed NBV/GBV
methodology – see Annex 6.
For those assets valued on an absolute valuation basis, the CCA depreciation is derived using either NBV/GBV method
or the Roll Forward method – See Annex 6 for more detail. The specific method used for each Class of Work is shown in
Section 2.
6.1.7 Disposals, write-outs and write-offs
These are derived from HCA figures and revalued using the most appropriate method for the asset being valued within
the overall approach described in Annex 6.
6.2 Detailed Valuation Methodology
6.2.1 Introduction
This section provides details of the methodologies adopted for deriving the gross valuation and CCA depreciation.
The studies and data sources utilised in the preparation of the CCA Valuations referred to in this section are described
in Annex 4.
A description of the Asset Movement Statement process for derivation of NRC including the underlying CCA
movements is provided in Annex 6.
6.2.2 Land & Buildings
Property
The majority of property assets (general-purpose buildings, specialised buildings, general purpose land, specialised
land and the majority of accommodation plant) are valued at historic cost. This is because only a small number of
buildings are owned by BT and the CCA adjustments would be spread across a large number of services, resulting in
immaterial adjustments to the individual services.
Year of Registration: GBV additions in the year GRC additions in the year
1990/91
1991/92
2013/15
TOTAL @ 31/3/15
A
B
Z
________
GBV = Sum of above
A x Index @ 31/3/15 / Index @ 30/9/90
B x Index @ 31/3/15 / Index @ 30/9/91
Z x Index @ 31/3/15 /Index @30/9/12
_________
GRC = Sum of above

Valuation methodologies
27
Specialised Accommodation Assets
These assets are all associated with creating a suitable environment for housing network equipment (CoW ACPN). The
largest element is for air ventilation and air chilling equipment but also included are fire, flood and gas detection
equipment, electric light and power, kitchen equipment, and intruder detection.
We value these assets using the indexed historic principles but in order to better reflect the different types of assets
within this CoW we have used different indices for each type. These indices are shown in Annex 5.
6.2.3 Access – Copper
Access Copper Cable
This asset includes the overhead and underground copper cables that connect BT’s exchanges to the distribution
point.
The valuation is calculated using an indexed historic method. To calculate an absolute valuation for an asset of the size
and complexity of the copper network requires a number of significant assumptions and estimates, which would lead
to volatility in the RFS.
RPI has been selected as the most the appropriate index for this asset.
Dropwire
This asset includes the copper wire from BT’s distribution point up to and including the main socket on an end-user’s
property. The assets are valued using an Indexed Historic method. RPI has been selected for this asset consistent with
the valuation of Access Copper Cable.
Other Assets
ISDN2 network terminating equipment (CoW HHB, HHR & NTIS) and broadband ADSL technology (CoW ADSL) are
valued at historic cost as these assets are of relatively low value.
6.2.4 Access – Fibre
Access – Fibre Cable
This asset includes the fibre cable from BT exchange to the end user’s premises. The assets are valued using the
absolute valuation methodology (see below).
Details of Absolute Valuation Methodology used for Access Fibre – including key assumptions and any
models used
Step 1: Input Volumes. We download volumes of cable lengths by fibre size from INS (Integrated Networks
Systems). Since the cables lengths refer to each cable segment we can estimate the number of cable nodes or
joints for each cable size.
Step 2: Input Standard Task Times. We use the same work activity units as used by BT’s fibre planners and
adjust them by applying a ratio of total time / total planned time.
Step 3: Input Unit Prices. We use BT’s standard labour rate for engineers’ pay and the latest fibre purchase
prices from BT Procurement.
Step 4: Calculation of Labour Costs. We calculate the total time required to lay the fibre cables and join them
together from the adjusted volumes, adjusted standard task times and a list of detailed activities required for
each cable size. We then cost the total time using the input standard labour rate.
Many of the cable sizes present in the network are no longer available commercially so we use the task times
required of the closest available cable size.
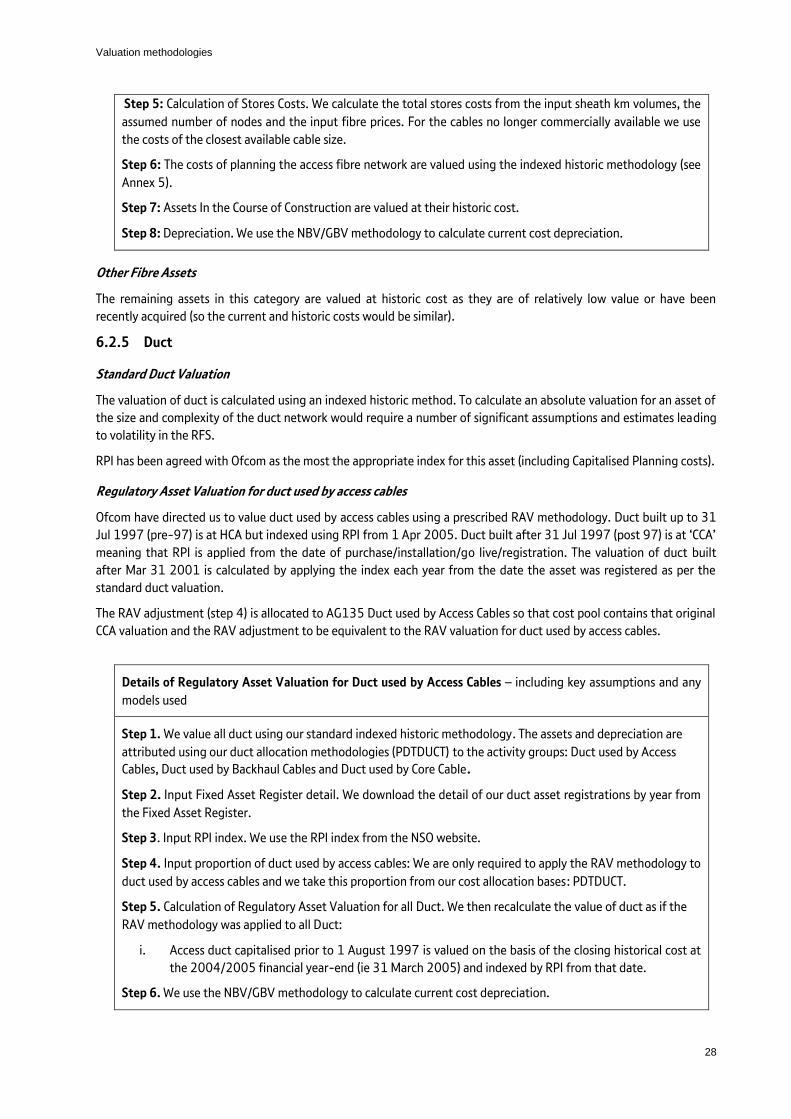
Valuation methodologies
28
Step 5: Calculation of Stores Costs. We calculate the total stores costs from the input sheath km volumes, the
assumed number of nodes and the input fibre prices. For the cables no longer commercially available we use
the costs of the closest available cable size.
Step 6: The costs of planning the access fibre network are valued using the indexed historic methodology (see
Annex 5).
Step 7: Assets In the Course of Construction are valued at their historic cost.
Step 8: Depreciation. We use the NBV/GBV methodology to calculate current cost depreciation.
Other Fibre Assets
The remaining assets in this category are valued at historic cost as they are of relatively low value or have been
recently acquired (so the current and historic costs would be similar).
6.2.5 Duct
Standard Duct Valuation
The valuation of duct is calculated using an indexed historic method. To calculate an absolute valuation for an asset of
the size and complexity of the duct network would require a number of significant assumptions and estimates leading
to volatility in the RFS.
RPI has been agreed with Ofcom as the most the appropriate index for this asset (including Capitalised Planning costs).
Regulatory Asset Valuation for duct used by access cables
Ofcom have directed us to value duct used by access cables using a prescribed RAV methodology. Duct built up to 31
Jul 1997 (pre-97) is at HCA but indexed using RPI from 1 Apr 2005. Duct built after 31 Jul 1997 (post 97) is at ‘CCA’
meaning that RPI is applied from the date of purchase/installation/go live/registration. The valuation of duct built
after Mar 31 2001 is calculated by applying the index each year from the date the asset was registered as per the
standard duct valuation.
The RAV adjustment (step 4) is allocated to AG135 Duct used by Access Cables so that cost pool contains that original
CCA valuation and the RAV adjustment to be equivalent to the RAV valuation for duct used by access cables.
Details of Regulatory Asset Valuation for Duct used by Access Cables – including key assumptions and any
models used
Step 1. We value all duct using our standard indexed historic methodology. The assets and depreciation are
attributed using our duct allocation methodologies (PDTDUCT) to the activity groups: Duct used by Access
Cables, Duct used by Backhaul Cables and Duct used by Core Cable.
Step 2. Input Fixed Asset Register detail. We download the detail of our duct asset registrations by year from
the Fixed Asset Register.
Step 3. Input RPI index. We use the RPI index from the NSO website.
Step 4. Input proportion of duct used by access cables: We are only required to apply the RAV methodology to
duct used by access cables and we take this proportion from our cost allocation bases: PDTDUCT.
Step 5. Calculation of Regulatory Asset Valuation for all Duct. We then recalculate the value of duct as if the
RAV methodology was applied to all Duct:
i. Access duct capitalised prior to 1 August 1997 is valued on the basis of the closing historical cost at
the 2004/2005 financial year-end (ie 31 March 2005) and indexed by RPI from that date.
Step 6. We use the NBV/GBV methodology to calculate current cost depreciation.

Valuation methodologies
29
Step 7. Calculation of Regulatory Asset Valuation adjustment. We then apply the % of duct costs allocated to
the cost pool AG135 Duct used by Access Cables (step 4) to the difference of Duct valued using the RAV
methodology (step 5) and Duct valued using our Standard Duct Valuation (Step 1). The resulting value is
known as the RAV adjustment.
Step 8. The RAV adjustment is allocated to AG135 Duct used by Access Cables such that the original CCA
valuation plus the RAV adjustment is equal to the RAV valuation.
6.2.6 Switch
These assets are mostly old technology with low investment and nearing the end of their asset lives. They have
declining net book values and consequently the value of any CCA adjustment on regulated markets would be low.
Therefore with the exception of System X exchanges all these assets have been valued at historic cost.
System X Local Switches
The System X Switches (CoW LDX) are valued using the extrapolated absolute valuation methodology.
Details of process used CoW LDX only – including key assumptions and any models used
We last updated the absolute valuation using 2008/09 information. Since then we have extrapolated the
valuation using an indexed historic approach (see Annex 5).
The original Absolute Valuation
Step 1: Input Volumes: We sourced the number of lines and number of processors from EXPRES (Exchange
Planning and Review System). The details of how the processors needed to be configured (eg the numbers of
ports and signalling links) was sources from NRS (Network Records System).
Step 2: Input Unit Prices & Initial Calculation: We used the LEMP2 (Local Exchange Modernisation
Programme) contract to calculate the replacement costs of the concentrator, line card and processor. The
LEMP2 model was a planning tool that contained the latest contracts and was able to take the input volumes
and calculate and cost the optimal processor and concentrator configurations.
Step 3: Calculations – contract adjustment. We transferred the initial calculation in to a BT CCA valuation
model, that we call the VALP model. By 2008/09 the contract prices in the LEMP2 contract were out of date
but the succeeding NP2K contract did not represent the “normal course of business” as it was agreed to cater
for only repair and small volumes of new provisions. Therefore, we applied the LDX index (see Annex 5).
Step 4: Calculations – provisioning costs. A previous study had identified the amount of provisioning costs
required for the switch platform including a stock of spares, data build costs and contract supervision. These
costs were updated each year in the VALP model to account for labour-rate increases.
Step5: Calculations – non-capacity related investment. We added costs to the valuation to include investment
in projects such as the modular controller and various software upgrades but only where the project could be
demonstrated to provide additional functionality that added to the revenue earning capacity. This investment
was initially added at historic costs. The value was indexed each year using the LDX index.
Step 6: We have applied the LDX index to the 2008/09 absolute valuation (see annex 5).
Step 7: The costs of planning the System X local exchanges are valued using the indexed historic methodology
(see Annex 5).
Step 8: Assets In the Course of Construction are valued at their historic cost.
Step 9: Depreciation. We use the roll forward methodology to calculate current cost depreciation.

Valuation methodologies
30
Other Local Switches
Other Local Switching Assets such as the AXE10s (CoW LYX) and Remote Concentrator Units (CoW
UXD5) are all declining in value with a low level of current investment so any CCA adjustments would not be material
and are therefore valued at historic cost.
Main Distribution Frames
BT continues to invest in adding capacity to main distribution frames (CoW LMDF) but they have a relatively low value
so are valued at historic cost.
Operator Service Systems
These assets are declining in value with low level of current investment so therefore valued at historic cost.
Main Exchanges
This category includes the Main Exchange Switches (CoW MDX) and the Next Generation Switches (CoW NGN). These
assets are declining in value with a low level of current investment and are therefore valued at historic cost.
Intelligent Network
This category includes the core Intelligent Network platforms (CoW INC) and the Interconnect platform (CoW SIGNI)
which are used to support various Number Translation Services and network features. These assets are declining in
value and are therefore valued at historic cost.
6.2.7 Transmission
Plesiochronous Digital Hierarchy (PDH) equipment
PDH equipment including Repeaters (CoW CRA, CRD, CRF, CRHQ) and Line Systems (LTME) and are all declining in
value with a low level of current investment so any CCA adjustments would not be material and are therefore valued at
historic cost.
Synchronous Digital Hierarchy (SDH) equipment
These assets are valued on an indexed historical cost basis using asset-specific cost trends based on index data– see
Annex 5.
Backhaul and Core Cable (UK Transmission)
Core Copper cables (CJC CoW), Subsea Cables (BHQ CoW) and Main Core Cables (CoW MUC) are all declining in value
with a low level of current investment so any CCA adjustments would not be material and are therefore valued at
historic cost.
The majority of investment in core and backhaul fibre cables is now booked against Backhaul Fibre (CoW CJF) and we
use an Absolute Valuation methodology.
Details of Absolute Valuation Methodology used for Backhaul /Core Fibre – including key assumptions and
any models used
Step 1: Input Volumes. We download Sheath km and Fibre km of CJF assets from INS. We make assumptions
to derive the number of cable nodes or joints for each cable size.
Step 2: Input Standard Task Times. We use the same work activity units as used by BT’s fibre planners and
adjust them by applying a ratio of total time / total planned time.
Step 3: Input Unit Prices. We use BT’s standard labour rate for engineers’ pay and the latest fibre purchase
prices from BT Procurement.
Step 4: Calculation of Labour Costs. We calculate the total time required to lay the fibre cables and join them

Valuation methodologies
31
together from the adjusted volumes, adjusted standard task times and a list of detailed activities required for
each cable size. We then cost the total time using the input standard labour rate.
Many of the cable sizes present in the network are no longer available commercially so we use the times
required of the closest available cable size except for activities such as jointing, where we continue to use the
number of fibres in the specified cable.
Step 5: Calculation of Stores Costs. We calculate the total stores costs from the input sheath km volumes and
the assumed number of nodes and the input fibre prices. For the cables no longer commercially available we
use the costs of the closest available cable size.
Step 6: The costs of planning the backhaul and core fibre network are valued using the indexed historic
methodology (see Annex 5).
Step 7: Assets In the Course of Construction are valued at their historic cost.
Step 8: Depreciation: we use the roll forward methodology to calculate current cost depreciation.
21st Century Network
The material 21CN CoW are valued using the absolute valuation method. These assets include Metro / Core Nodes
(CoWs CORLU, METAL, METCI and METSI), Ethernet equipment (CoW ETHER), Wave Division Multiplexing Equipment
(CoWs WDMH and WDM21) and Multi-Service Access Nodes (CoWs MSANF and MSANH).
Details of process used (21CN CoW)
– including key assumptions and any models used
This process is complete separately for each of the 21CN CoW.
Step 1: Input Volumes. 21CN equipment volumes for year-end sourced from our Planning Assignment
and Configuration System (PACS)
Step 2: Input Prices. Latest contract prices are sourced from the latest 21CN contracts.
Step 3: Calculation of equipment valuation. The volumes are costed up using the contract prices using
detailed planning models prepared by BT’s network planners.
Step 4: Calculation of labour valuation. From analysis of the fixed asset register we are a able to identify
additional direct labour costs that have not been included in the initial equipment valuation. These asset
are added to the valuation at historic costs and then indexed using the average earnings with productivity
index.
Step 5: Calculation of spare stock valuation. A list of 21CN spares is obtained from the ASC/EFR database
and latest contract prices are applied.
Step 6: Test equipment, located at our research and innovation centre located at Adastral Park in
Martlesham Heath, is included by searching the asset register on location but removing anything also
included in step 3.
Step 7: The costs of planning the 21CN network equipment are valued using the indexed historic
methodology (see Annex 2).
Step 8: Assets In the Course of Construction are valued at historic cost.
Step 9: Depreciation is calculated using the NBV/GBV methodology.
The remaining 21CN assets are valued at historic cost due to the low value or immaterial CCA adjustment. (CoW
NTE21, METCN and CCI).

Valuation methodologies
32
Access Equipment for Leased Lines
Equipment is sited at the end-users’ premises and at BT exchanges for the purpose of providing Leased Line access
lines (CoW: DTTM, DTTK, DTTS, DTSW and DTTSW). These assets have a short asset life and are either heavily
depreciated or only modest price movements have been observed so any CCA adjustments would not be material. The
assets are therefore valued at historic cost.
Other Transmission Equipment
Core and Backhaul Radio Equipment (CoW TPWC) and Asynchronous Transfer Mode (ATM) equipment are declining in
value with a low level of current investment so any CCA adjustments would not be material and are therefore valued at
historic cost.
6.2.8 Other
Telecom Power Equipment
Telecom Power Equipment (CoW TPC) includes standby generators, switchboards, rectifiers and power racks. We value
these assets using the Indexed Historic methodology but in order to better reflect the different types of assets within
this CoW we have used different indices for each type of equipment (see Annex 5).
Capitalised Systems Development and external purchased Software
These assets (CoW COMPS and COMPG) have a relatively short asset life and only modest price movements have been
observed so they are therefore valued at historic cost.
Other non-current assets
Our remaining non-current assets have all been valued at historic cost because they:
have a relatively low value,
have a short asset life and only modest price movements have been observed,
are virtually fully depreciated,
have been recently acquired (so the current and historic costs are similar), or their
attribution to regulated markets is immaterial,
There will be little impact on the regulatory financial statements as a result of the differences between their historic
and current replacement cost. These Assets include: Vehicles, Computers, Line Testing Equipment, Payphones and
Engineering Stores.

Attribution methods
33
7. Attribution methods
7.1 Introduction
We are required to publish the RFS on a current cost basis for the Markets and Technical Areas in which we are
deemed to have SMP and for which regulatory financial reporting obligations have been imposed.
Each item of revenue, cost, assets and liabilities recorded in BT Group plc accounts is attributed to the products
and services which make up the separate markets in which we operate.
We regularly review the attribution methodologies, and enhancements are introduced to reflect relevant changes,
for example new technologies or changes in business structure. The practical application of these methods to
actual values is managed through apportionment bases that are updated at least annually. We have established a
process to validate all attribution methods to achieve objective bases.
7.2 Concepts of Attribution
Revenue, costs, assets and liabilities are attributed to the relevant cost pools and, where relevant, from cost centre
to network components and then services.
The general concepts of attribution are set out below:
Revenue: Revenue is recorded in the accounting records in such a way that it is usually possible to allocate it
directly to wholesale services or retail products. Where it is not possible to allocate directly, revenue is
attributed to the relevant service or product using information from our billing systems.
Costing principles: In order to translate the financial information of the accounting ledgers from a functional
and organisational view to the separate Markets and Technical Areas defined for regulatory purposes, it is
necessary to attribute each financial cost (or revenue, etc.) item to the relevant Market and Technical Areas.
The AS system achieves this by defining each Market and Technical Area in terms of its relevant Wholesale Services
and attributes the source costs, revenues, assets and liabilities to these Services. The attribution is underpinned by
a strict set of costing principles as published by Ofcom in their Directions for Regulatory Financial Reporting (30
March 2015).
Cost drivers or ‘bases’: These are the underlying bases on which costs are incurred, eg accommodation costs
are incurred on the basis of floor space requirements. The cost driver or ‘base method’ is therefore floor-
space.
Costs: Costs are taken from the accounting records. The processes applied to the costs, which vary according
to the nature of the costs and the way in which they are recorded, are set out below.
o Attribution: This is a general term encompassing both allocation and apportionment.
o Allocation: Certain costs can be directly associated with particular activities or type of equipment
and do not require apportionment. Our engineers book their time and the materials they have used
to Classes of Work (CoW). Many of these CoWs can be mapped directly to specific plant groups or
support functions.
o Apportionment: Other costs cannot be directly associated with specific activities and plant groups,
and require apportionment. For network costs this process makes extensive use of engineering data
reflecting not only each plant group type (eg local lines, transmission equipment) but also the type of
technology (eg metal and fibre local lines, PDH and SDH transmission equipment).
Certain other costs can be identified within the accounting records as relating to a discrete function
such as repair centre costs, computing or billing. A review of this function, often by the means of
work/application analyses or a survey of staff activity, establishes the cost driver and is used to
apportion its costs between activities and, if applicable, plant groups.

Attribution methods
34
Capital employed: We define capital employed as: mean total assets less current liabilities, excluding
corporate taxes, dividends payable, and retirement benefits obligations but including provisions. The mean is
arithmetic average of the start and end values for the period. The apportionment of capital employed follows
a similar approach to that for operating costs. For some items, such as trade receivables, relevant revenue is
the appropriate driver, rather than costs.
Non-current Assets can be divided into:
o Assets that can be directly allocated to plant groups, eg dropwires.
o Assets relating to plant groups which are apportioned on the basis of cost drivers, eg SDH
transmission equipment is apportioned to plant groups based on a count of equipment and their
replacement cost.
o Assets of a general nature which are apportioned to retail products, plant groups and support
functions using an appropriate cost driver eg capitalised systems development costs are
apportioned using an analysis of specific projects recorded on our fixed asset register.
On 26 June 2014, Ofcom published its findings on BT’s weighted average cost of capital (WACC) in annex 26
of its Fixed Access Market Review, available from Ofcom’s website: www.ofcom.org.uk.
The review set and the disaggregated WACC for BT as: Openreach at 8.6% and the Rest of BT as 10.8%.
The WACC is applied to the MCE of a given service to represent an acceptable rate of return generated on
providing that service.
Net current assets / (liabilities) are directly allocated to retail products where appropriate. The remaining
assets and liabilities are apportioned using appropriate apportionment bases for each element. For example,
within payables, separate apportionment bases are calculated for each type of payable, eg trade payables, tax
liabilities, and accrued expenses.
Provisions are either allocated specifically to activities and components or are apportioned using a base
appropriate to the particular charge. For example, provisions relating to the cost of vacating leased buildings
are apportioned using the accommodation cost base.
Non-financial data: Wherever costs cannot be directly allocated to activities and plant groups, or when plant
groups do not map exactly on to components, an apportionment is required. Depending on the cost involved,
the appropriate basis of apportionment may be of a non-financial nature. In these instances the relevant data
may be extracted from non-financial data sources, such as operational systems giving circuit numbers, or may
be collected through activity analyses.
For example, the apportionment to activities and plant groups of the pay costs that relate to a discrete
function is dependent upon a survey of the tasks of the staff whose pay is being apportioned. Such surveys
will typically involve analyses of the tasks staff undertake and the percentage of time spent on those tasks.
These tasks will then be linked to activities and plant groups, either directly or through further analysis.
Surveys are frequently specially commissioned for the purpose of cost attribution and are carried out at a level
appropriate to the activities and plant groups in question and updated at least annually.
7.3 Gross Adjusted Costs
Costs are presented on a ‘gross adjusted basis’, ie this reflects all external costs together with all transfer charges
between divisions. There are two main types of transfer charges:
Cost transfer charges between divisions/organisational units, which go through the GLs. Such charges are
eliminated in the consolidated results, and usually in the AS framework, where they are replaced by the
underlying cost.
Transfer charges between Markets eg from the Wholesale Significant Market Power (SMP) Markets to the BT
Retail Residual. Such charges are calculated and presented only within the AS framework (rather than
through the GLs).

Attribution methods
35
Transfer charges are discussed in further detail in Section 15 (Transfer charges).
7.4 Conceptual model
The AS solution provides a logical structure for the attribution of costs, revenues, assets and liabilities of BT to,
ultimately, the Markets, Technical Areas and Services of BT.
The basic flow through the conceptual model is as follows:
Cost/revenue/assets Attribution methodologies Components
Wholesale Services
Retail products
Costs, revenues and
assets which arise from
or are used in the
everyday activities of BT
Group.
Base, Activity Group and Plant
Group methodologies
Components are
specific cost
pools which
attribute costs
to Services.
Groups of Services
sold by BT that form
the SMP markets,
which we report on in
the RFS.
These are
products which
BT sells*.
*There are instances where costs, revenues and assets are attributed to Retail Products. These are products which
BT sells but which do not make use of our SMP regulated network and therefore are not required to be reported in
our SMP markets
7.4.1 Attribution of GL/F8/OUCs (directly or via base/OUC methodologies)
Costs, revenues, assets and liabilities form the starting cost pools of the attribution process. These are defined in
terms of F8/Organisational Unit Code (OUC) combinations.
An F8 code is a group of one or more similar GL codes within the core GL system. In an OUC each F8 code can be
attributed using an appropriate cost driver of ‘base methodology’. F8/OUC cost pools are attributed to Products,
Activity Groups or Plant Groups either directly (ie where the F8/OUC combination directly relates to a single
product, activity group or plant group cost category) or via OUC or other base methodologies (ie where there are
multiple steps in the attribution process).
7.4.2 Attribution of Activity Groups
Activity Groups (AGs) are intermediate cost pools used to collect costs and asset and liability values relating to
activities such as fleet, facilities management and general corporate costs. The category includes the
apportionment of specific activity costs for units that perform a service to other organisation units and recover
their costs through a transfer charge. The external costs of the unit supplying the services are apportioned on the
basis of an analysis of the transfer charges to the receiving units. The costs of the AGs may be attributed to
Products and support PGs.
7.4.3 Attribution of Plant Groups
PGs are intermediate cost pools used to collect costs (eg maintenance expenses) and asset values (eg depreciation
and net book values) relating to activities, equipment and infrastructure for the purposes of running and selling
network services (eg Provision and maintenance activities, MSAN equipment, Copper infrastructure). PGs are
attributed to Network Components on a one to one or one to many basis. A PG could contribute costs to many
Components, and a Component could receive costs from many PGs.

Attribution methods
36
7.4.5 Attribution of Network Components
Components are used to attribute onwards the costs, asset and liability values representing discrete parts of BT’s
Network (eg MDF Equipment, Access Fibre Spine and ISDN30 Connections). Costs within these network
components are attributed to various Services.
7.4.6 Retail Products and Markets
By the end of the final stage of attribution from Components, all the non-network costs and the network charges
are attributed to Retail Products or Wholesale Services. Wholesale Services can be grouped together to represent
the distinct Markets and Technical Areas defined for regulatory purposes.

LoB OUCs
37
8. Line of Business Organisational Unit Codes
8.1 Line of Business Organisational Unit Codes
Each Line of Business (LoB) in BT has its own OUC to which its revenues, costs, assets and liabilities are
booked on BT’s general ledger. The top level codes for each LoB are detailed below.
For some LoBs there is a consistent and straight forward attribution treatment of the OUC at either a first
or a lower level. Where this is the case the attribution process has been detailed below.
In instances where most of an OUC’s cost/income (at a high level ie 1 or 2 digits) are attributed in a
certain way the treatment will be detailed below and it will be indicated that for lower level OUCs the
relevant base dictionary will contain the methodology for the attribution of the exceptional
costs/income. For example OUC C attributes costs/income to the Activity Group AG112 ‘Corporate Costs’,
however an exception to this is that OUC CW (a sub-OUC of C) attributes costs onwards to various Plant
Groups and Residual products – the methodology for which can be found in the OUC driven base
methodology dictionary in Section 10 OUC driven bases.
Top level
OUC Description Attribution process
B OPENREACH Attributed initially via bases to various AGs and PGs.
Significant attribution to regulated markets.
C BT GROUP
HEADQUARTERS
Primarily attributed to AG112 ‘Corporate Costs’.
Second largest attribution is across various Residual
markets.
E CORPORATE
ADJUSTMENTS
Attributed via an OUC driven base to AG112.
F BT FACILITIES
MANAGEMENT
Attributed via an OUC driven base to AG106.
G GROUP
CONSOLIDATION UNITS
Attributed initially via bases or direct allocation from F8
code to various AGs, PGs and Residual markets. Majority of
attribution is directly from base or F8 code to Residual
markets.
H BT BUSINESS Attributed initially via bases to various AGs, PGs and
Residual markets. Majority of attribution is directly from
bases to Residual markets.
J BT GLOBAL Solely attributed to Residual markets.
K BT WHOLESALE Attributed initially via bases to various AGs and PGs.
Significant attribution to regulated markets.

LoB OUCs
38
S BT CONSUMER Solely attributed to Residual markets.
T BT TECHNOLOGY,
SERVICE &
OPERATIONS
Attributed initially via bases. Significant attribution to
regulated markets driven by other OUC use of BT TSO
services.
V GROUP ENGINEERING /
SECURITY
Majority attributed via OUC driven bases to Residual
markets.
W BT GROUP PROPERTY Attributed initially via bases or direct allocation from F8
code to various AGs, PGs and Residual markets. Majority of
attribution is directly from base or F8 code to Residual
markets.
Y BT BUSINESS SERVICES Majority attributed via OUC driven bases to AGs and
Residual markets. Significant attribution to Residual
markets.

System generated bases
39
9. Use of system generated bases
9.1 Introduction to system generated bases
In some instances, the regulatory accounting process uses previously attributed costs as the basis for further cost
attribution. These bases are system generated and maintained using a set of data tables that contain a list of the
F8 codes that should be used for the calculation of each base. The REFINE system uses information of how costs
have been attributed to Plant Groups in order to identify the proportion of previously attributed costs attributed
to all Plant Groups (eg Plant Group 1 x% of total costs and Plant Group 2 y% of total costs etc.). The costs to be
attributed via the system generated base are then attributed to the same Plant Groups in these same proportions
(eg Plant Group 1 would receive x% of costs and Plant Group 2 would receive y% of costs etc.).
A further example which we use in practice is a common system base called FTQ. The FTQ base contains a list of F8
codes that are pay related. When this base is being applied the system will take the total money on these F8 codes
and then calculate what percentage of the total was allocated to each product, plant group and activity by the rule
type 1s, 3s and exceptions. These percentages allocations form the new base that will be applied to any F8 + OUC
combinations that have a rule type 4 or 6 with FTQ as the data table. Note that for a rule type 6 the money
allocated by the Exception bases is not included in the calculation of the system base. More information on rule
types is available in Section 5 System.
9.2 Bases apportioned to specific cost pools on the basis of previously apportioned costs
pan-divisionally
These bases (known as Rule Type 12s in the REFINE system) apportion group costs, revenues and capital employed
across multiple business units. These bases are assigned two data designators:
The Primary Data Designator 1 (DD1) identifies the income/cost transactions the system should draw
upon to calculate the appropriate base.
Primary
Designator
Transactions drawn upon Cost type to be driven
CAPEXP All non-pay capital additions (purchases
of non-current assets)
Capital expenditure payables
DTTCP All Trade Receivables ledgered by BT
during the year
Balance Sheet bad debts
NCOFADA Transmission Depreciation and non-
current assets
Depreciation Core Transmission: Cable & Other
NCOFADM Apparatus Depreciation and non-
current assets
Depreciation Apparatus
NCOFAEA Amortisation and non-current assets Depreciation Software
OPEACN Accommodation costs Sundry receivables and payables arising from
accommodation costs
OPECST External operating costs excluding pay,
depreciation and capital additions
VAT related payables

System generated bases
40
Primary
Designator
Transactions drawn upon Cost type to be driven
OPEOTH Total operating costs, excluding
depreciation and pay costs
Prepayments
OPEPST External operating costs, excluding
depreciation, pay and POAS
Miscellaneous trade payables
OPEXPS All operating costs, excluding
depreciation incurred by BT during the
year
Prepayments receivables
REDUND All redundancy and new start pay costs Redundancy accruals
TOTPAY Total capital and current pay costs Payroll related receivables and payables
The Secondary Data Designator 2 (DD2) identifies the AS cost pools to which the divisional balances
should be apportioned.
Secondary
Designator
Destinations of previously attributed relevant costs (eg accommodation costs, payroll
costs) to be taken into account in deriving the base
ALA Majority of all Products, AGs and PGs excluding Openreach PGs
ALL All AS cost pools excluding Openreach PGs
ALLA All AS cost pools
COR Substantially all core Products and PGs excluding Openreach PGs
CORA Substantially all core Products and PGs
ORP All Openreach cost pools
PENA All units in the BT Pension scheme ie all UK specific Products, eg core Products and PGs
SYBA All units in the BT Sharesave scheme ie all UK specific Products, eg core Products and PGs
9.3 Bases apportioned on the basis of pay costs
System generated pay bases can draw on previously apportioned pay costs in a variety of ways. For example the
TOTPAY pan divisional base described in section 9.1 draws on all pay costs on a pan divisional basis BT wide.
Another type of base (known as a Rule Type 6 in REFINE) draws on previously apportioned pay costs specific to a
Line of business. Using this base it is also possible to restrict the calculation to specific parts of a Line of Business
drawing on previously apportioned costs within a defined organisational range (exceptional OUCs are cost pools
whose costs are attributed using different bases compared to the “standard” methodology used by other OUCs for
any give cost type – these are covered in Section 10 OUC driven bases.
The table below lists all the major Rule Type 6 bases.

System generated bases
41
Designator Procedure
FTD This base is compiled from previously allocated Maintenance pay F8 codes, (excluding
exceptional OUC pay)
FTK This base is compiled from previously allocated Provision and Installation and Maintenance pay
F8 codes (excluding non-core pay and exceptional OUC pay)
FTQ This base is compiled from the previously allocated Capital and Current pay F8 codes (excluding
non-core pay and exceptional OUC pay)
A further type of pay base is known as a Rule Type 4 (RT4) in the REFINE system. This base is similar to the RT6
base eg it uses costs - usually pay - as a basis for calculation. However a RT4 draws upon apportioned pay within
specific OUCs including exceptional OUCs. This RT4 pay base has one data designator called PCT.
For RT4s the relevant F8/OUC combination has to be explicitly defined in the rule table with REFINE or REFINE will
default to applying RT6 and excluding exceptional OUCs.
The PCT designator offers the ability of specifying a range of Wholesale, Openreach, Retail and Global Services cost
pools to which the cost should be apportioned. For example this type of base is used where the engineering Travel
and Subsistence of certain OUCs has to be apportioned over a limited range of PGs and using a pay base specific to
the PGs supported by those units.

OUC driven bases
42
10. Base methodologies – OUC driven bases
10.1 Introduction to OUC driven bases
We have a defined a set of ‘Base Reference’ methodologies to attribute F8/OUC costs to Activity Groups, Plant
Groups, and Retail Residual cost categories. These base reference methodologies (sub-divided by OUC) in some
instances allocate 100% of the F8/OUC costs to a particular cost category and in other instances apportion the
cost across multiple cost categories.
OUC driven base methodologies are those which attribute costs onwards based upon the specific activities of an
OUC. There are several kinds of OUC driven base, but the most commonly used is the Except base. An Except base
is used to attribute the costs of a particular OUC in a certain way that is often different from the remainder of the
OUC’s activities.
Specifically an Except base will call all costs related to a particular 2 or more digit OUC (eg BL or BLH) and attribute
them in a certain way, whereas any costs not associated with the Except base would continue to be attributed in
the same way as the 1 digit OUC (eg B) using the associated base methodology for the combination of F8/OUCs.
Where there are multiple Except bases for an OUC (eg Except BL and Except BT), all of the costs associated with
the Except bases will be attributed via Except bases and removed from the total of the 1 digit OUC to be attributed
via other base methodologies.
The following is a dictionary of OUC driven bases which are used to produce the RFS and their associated
attribution methodologies. Section 8 Line of Business Organisational Unit Codes contains a table of all 1 digit
OUCs that exist within BT and which part of the business they represent. Some of the OUCs in Section 8 Line of
Business Organisational Unit Codes may not be present in this section as the description of where they attribute
costs (ie typically Residual markets) from Section 8 Line of Business Organisational Unit Codes is adequate.

OUC driven bases
43
10.2 Base Methodology Dictionary – OUC driven bases
OUC Descriptions (For all descriptions below, see Appendix A for Key Destinations)
BD Openreach Business and Corporate Delivery
Description
This team carries out the network build, provisioning and repair activities relating to Openreach’s
Ethernet services. The engineers book their time and materials to classes of work which all have
specific treatment. This base allocates the non-engineering costs including management pay and
non-pay items like travel and subsistence.
Methodology
The non-engineering costs in this team are apportioned to plant group in proportion to direct
engineering pay (both capitalised pay and expensed pay) using the system driven allocation base FTQ.
This team has been set-up as a self-contained business unit so that the costs are allocated in
proportion to the pay of this business unit and not the pay of other Openreach teams.
BE Openreach Chief Information Office
Description
This team is the link between Openreach and the systems development teams in BT TSO. They define,
design and deploy Openreach’s systems, processes and networks.
Methodology
This base apportions the costs of this team by using analysis of the Openreach development projects
undertaken by BT TSO (see more information in the Except base TA).
This base apportions costs to AG408 (Openreach Fixed Asset Driver) and various PGs, primarily
PG772A (Openreach Systems and Development (Product Specific)) and PG197A (FTTC Service
Delivery & Development).
Data source/s
See except base TA.
BH Openreach Human Resources
Description
The Openreach HR team are dedicated to making sure that everyone in Openreach has the right
environment, skills and tools to enable them to perform successfully every day.
Methodology
The costs for this base are allocated to AG401 (Openreach Pay Driver).
BK BDUK
Description
This base allocates the operating costs associated with the BDUK team within Openreach.
Methodology
The costs for this base are allocated to PG999A (BDUK Funding).
BL Openreach Network Investment
Description

OUC driven bases
44
OUC Descriptions (For all descriptions below, see Appendix A for Key Destinations)
The Network Investment business unit plans and builds Openreach’s network infrastructure. The
engineers book their time and materials to classes of work which all have specific treatment. This base
allocates the non-engineering costs including management pay and non-pay items like travel and
subsistence.
Methodology
The non-engineering costs in this team are apportioned to plant group in proportion to direct
engineering pay (both capitalised pay and expensed pay) using the system generate base FTQ.
This team has been set-up as a self-contained business unit so that the costs are allocated in
proportion to the pay of this business unit and not the pay of other Openreach teams.
BLH Openreach Copper Recovery Team
Description
This team recover and dispose of unused copper cables from the network. These cables are sold for
scrap.
Methodology
The costs for this base are allocated to PG986R (Openreach Other Activities).
BP Strategy, Commercial, Portfolio and Policy
Description
This team’s responsibilities include the management of Openreach’s product portfolio and the
management of Openreach’s regulatory affairs.
Methodology
The pay and non-pay costs of this team are allocated to PG502B (SG&A Openreach Sales Product
Management).
BT Openreach Current Liabilities
Description
This is not a team of people but an organisational unit used for accounting purposes. It is used for the
accounting of invoices and the balances represent invoices that were unpaid at the time of the
accounts being closed.
Methodology
These ‘payables’ are allocated to plant groups in proportion to Openreach pay using the system
generated pay base FTQ.
This unit has not been set-up as a self-contained business unit so that the costs are allocated in
proportion to the pay costs of all Openreach teams and not just this unit.
BW,
BWA,
BWA3,
BWE,
BWF6,
BWG,
BDP7,
BLE,
BVR2,
BVR3,
Openreach Customer Service
Description
This business unit includes Customer Contact Centres, Customer Complaint Management and Network
Incident Management. This base apportions the costs associated with the provisioning and repairs
involved with Openreach services. As the various teams support different services, their costs cannot
be allocated directly using pay or revenue.
Methodology
We create except bases for each of these teams by using an activity analysis that is used by the

OUC driven bases
45
OUC Descriptions (For all descriptions below, see Appendix A for Key Destinations)
BVL5,
BVL6,
BWC
Customer Service resource planning team. This analysis shows how many people in each team are
working on various high level activities and we then map each activity to a plant group.
These bases apportion costs to the OR Service Centre PGs PG570B to PG579B, and PG140A (Routing
and Records).
Data Source/s
High level activity analysis used by the Openreach Customer Service planning team.
BY Openreach Centre Costs
Description
This organisational unit includes the costs of running the Openreach CEO’s office and some costs
relating to the Openreach Line of Business. The costs include staff leaver payments, recognition event
costs and advertising costs.
Methodology
The costs for this base are allocated to AG401 (Openreach Pay Driver).
BZ Openreach Adjustments
Description
This base allocates costs relating to adjustments made as part of running the Openreach CEO’s office.
This includes movements such as stock adjustments and stocktaking, provisions for insurable
incidents, and other business costs.
Methodology
The costs for this base are allocated to AG401 (Openreach Pay Driver).
C, CA,
CC, CD,
CF, CG,
CH, CJ,
CK,
CM,
CN, CO,
CP,CR,
CT, CV,
CY, CZ
Corporate Costs
Description
Corporate costs are made up of a number of central BT Group functions that provide various services
for BT as a whole.
C – Corporate Headquarters
CA – CEO Office
CC – Learning Academy - HR
CF – Group Finance
CG – Group Legal
CH – Group Human Resources
CJ – Centre
CK – Group Functions Centre
CM – BT Flex Contact Centre
CN - BT Cables Core Ltd
CO – Strategy, Policy and Portfolio
CP – Corporate Special Projects
CR – Corporate Communications

OUC driven bases
46
OUC Descriptions (For all descriptions below, see Appendix A for Key Destinations)
CT – BT Group
CV – Vendor Management
CD, CY, CZ – Analysis Code
Methodology
The costs for all C OUCs that are not separately covered in other OUC driven base entries are allocated
to AG112 (Corporate Costs).
CFH Group Financial Control
Description
This base apportions the cost of BT’s Group Financial Control team. These units are responsible for
BT’s technical accounting, internal financial control, external reporting and pensions risk
management.
An element of these activities is driven and consumed by overseas subsidiaries.
Methodology
This base apportions costs to P646 (Subsidiaries & Consolidation units) and AG112 (Corporate Costs)
in proportion to the total average overseas employees to average total employees.
CFW Group Tax
Description
This base apportions the cost of BT’s Treasury, Tax and Insurance & Risk Financing. These units are
responsible for BT’s tax accounting and reporting, cash management, financial risk management and
claims handling.
An element of these activities is driven and consumed by overseas subsidiaries.
Methodology
The costs for this base are apportioned to P646 (Subsidiaries & Consolidation units) and AG112
(Corporate Costs) in proportion to the total average overseas employees to average total employees.
CHO Flexible Resource Unit
Description
This base apportions the cost of BT’s Flexible Resource Unit. This unit provides BT with a pool of
resource from which to procure skilled internal people to work on short to medium-term projects.
Methodology
The Flexible Resource Unit Finance team prepare details of their costs split by Line of Business,
cumulative to Period 12. Costs are apportioned using the relevant pay driver activity groups or, in the
case of BT Business, BT Consumer and BT Global Services, direct to Retail Residual products.
CO Strategy & Planning
Description
This base apportions the cost of BT’s Strategy & Planning team. These units are responsible for setting
BT’s strategy and managing long and short term business plans.
An element of these activities is driven and consumed by overseas subsidiaries.
Methodology

OUC driven bases
47
OUC Descriptions (For all descriptions below, see Appendix A for Key Destinations)
The costs for this base are apportioned to P646 (Subsidiaries & Consolidation units) and AG112
(Corporate Costs) in proportion to the total average overseas employees to average total employees.
CS,
CSA1,
CSA3,
CSA6
Central Business Services
Description
This base apportions the cost of BT Group Central Business Services. This unit, largely based in India,
process outsourcing. This includes HR and Finance shared services, procurement, customer
management & contact centres, GS contract accounting & service delivery and contract delivery share
services. The CBS mainly supports BT Global Services.
Methodology
Costs for the Finance Shared Service Centre and Procurement are allocated to AG112 (Corporate
Costs), all other CBS costs are allocated to P429 (Global Services Residual).
CW BT Group Billing and Collections
Description
This business unit is responsible for raising bills to our customers on behalf of all our lines of business.
Methodology
The pay and non-pay costs of this team are attributed using a two-step process.
1) We split the costs of the team between the support of our retail lines of business, our BT
Wholesale line of business and our Openreach line of business based on a management
analysis of the amount of activity incurred in supporting each.
2) The second step is to use analysis of revenue to allocate these costs to products and plant
groups:
The costs relating to our BT Wholesale line of business are apportioned to PG506N
(SG&A PPC (Wholesale)), PG512A (SG&A Calls), PG583N (SG&A Wholesale Residual),
PG585N (SG&A Interconnect), and PG609N (SG&A Broadband) in proportion to BT
Wholesale external revenue.
The costs relating to our Openreach line of business are apportioned to the OR Service
Centre plant groups: PG570B to PG573B in proportion to Openreach external revenue.
The costs relating to our retail lines of business are allocated to P008 Retail – Other (for
BT Consumer and BT Business) and P429 Global Services Residual (for Global Services).
For example:
If our management assessment of the amount of activity incurred in supporting BT Wholesale during
the year was 10% and that 20% of all BTW external revenue in the year was 20% then the allocation
to PG506N SG&A PPC would be 10% (step 1) x 20% (step 2) = 2%.
Data Source/s
BT Group Billing and Collections assessment of the amount of activity used in supporting lines of
business.
Wholesale and Openreach external revenue as used in the RFS.
E Miscellaneous Corporate Spend
Description
This base allocates costs relating to personnel and administration, computing, planning and
development, general support and general management type costs. These costs are identified as

OUC driven bases
48
OUC Descriptions (For all descriptions below, see Appendix A for Key Destinations)
‘Corporate Costs’, which support BT in general (both the people in BT and the management of its
assets).
Methodology
The costs for this base are allocated to AG112 (Corporate Costs).
F BT Facilities Services
Description
This base apportions costs and balance sheet items relating to BT Facilities Services (BTFS). BTFS
provides facilities management services to BT. These costs are part of BT’s property costs.
Methodology
The costs for this base are allocated to AG106 (Group Property and Facilities Management).
H, HA,
HB,
HD,
HG, HI,
HK,
HM,
HQ
BT Business
Description
There are various sub-divisions of BT Business. BT Business provides small and medium businesses
with a range of ICT and communications solutions.
H – BT Business
HA – UK Corporate
HB – UK Small and Medium Enterprises
HD – Commercial
HG – IT Services
HI – BT Fleet
HK – Customer Service
HM – Business Northern Ireland
HQ – Ireland
Methodology
The costs for all H codes that are not separately covered in other OUC driven bases are allocated to
P008 (Retail Other).
H3/HI
BT Fleet
Description
BT Fleet provides motor vehicles and associated services to employees within BT and to external
customers.
Methodology
BT Fleet Ltd provides its services to BT units and also to customers external to BT. It uses transfer
codes to charge, at commercial rates, for the services it provides to the relevant BT units. It records
the revenue it receives from external parties in ‘other income’ codes.
This base apportions all the income statement costs and relevant balance sheet items relating to this
subsidiary. The apportionment is determined by BT Fleet cost analysis which considers costs drivers
for different elements of the BT Fleet cost base and accordingly provides the appropriate
apportionment. The cost analysis gives a breakdown of the total internal BT costs and external costs;

OUC driven bases
49
OUC Descriptions (For all descriptions below, see Appendix A for Key Destinations)
this split drives the apportionments of the costs and assets to:
Internal BT - AG101 (Motor Transport).
External – Retail Residual.
Data Source/s
Management accounting general ledger data from Hyperion. The split of internal/external costs is
driven by transactional customer data and WILLOW (vehicle operational maintenance system).
K BT Wholesale
Description
This applies to all K OUCs that are not separately covered in other OUC driven base entries.
Methodology
This is a system generated base which allocates costs in proportion to pay costs for the separately
defined K OUC except bases.
KB Mobile Field Services and Managed Network Services
Description
This base attributes costs relating to BT Mobile Services Delivery, which provides a dedicated end to
end service fulfilment function for major Mobile Customers. The unit’s management and support
team support the engineering activities.
BT Managed Services Ltd supports BT’s managed services capability and 3rd party contracts with
mobile network operators and service providers.
Methodology
The costs of this unit are allocated to PG583N (Customer Support – Wholesale Residual).
KF Residential Customer Contact Centres (CCC) Exception Base
Description
This base apportions the pay and non-pay costs associated with the Customer Contact Centres (CCC)
staff involved in Inland and International Directory Enquiries and Operator Assistance Services,
Customer Complaints, Provision Service, Fault Reporting and Repairs and general enquiry activities.
Methodology
This model uses a breakdown of the Total Labour Costs associated with the BT Consumer Customer
Contact Centres.
The Labour Costs associated with Operator Services are apportioned to PG911A (Operator Services
OA Inland).
The remaining costs are allocated to P008 (Retail - Other).
Data Source/s
Total Cost Survey supplied by BT Consumer Finance in P9 and P12.
KD,
KK, KU
BT Wholesale Functional Units
Description
The three listed OUCs are the main functional units within the Wholesale Line of Business (LoBs),
covering all aspects of the relationship with Communication Providers (CPs).

OUC driven bases
50
OUC Descriptions (For all descriptions below, see Appendix A for Key Destinations)
KD – Product Management
KK – Customer Services
KU – Markets
The type of costs covered by these OUC exception bases will be people and pay related. These costs
are SG&A activities.
Methodology
We prepare an annual activity survey for each of these teams, where we estimate the number of
people working on BT Wholesale’s different product groups which are then mapped to the plant
groups shown below. The costs for each team are then attributed in proportion to the number of
people working on each product group.
PG506N (Customer Support – PPCS)
PG512A (Customer Support – Narrowband)
PG583N (Customer Support – Wholesale Residual)
PG584N (Customer Support – Wholesale Other)
PG585A (Customer Support – Retail Residual)
PG586N (Customer Support – Interconnect)
PG609N (Customer Support – Broadband)
Managed Network Services (MNS)
A number of people working in the KU Markets unit spend their time supporting MNS contracts.
These contracts are essentially an alternative sales outlet for BT Wholesale catalogue services, so it is
appropriate to apportion some of the costs for this activity to regulated products. This is achieved by
following a three-step process:
Step 1 – We analyse the MNS revenue by contract.
Step 2 – Based on expert knowledge of the products and services being offered in the contracts, we
are able to map each contract to one or more product groups, which are then mapped to plant
groups.
Step 3 – We apportion the costs of people engaged on MNS contracts to plant group based on the
analysis of revenue in Steps 1 and 2.
More than half of the MNS apportionment attributes to PG583N (Customer Support – Wholesale
Residual) and the other significant plant groups are PG584N (Customer Support – Wholesale Other),
PG506N (PG Customer Support – PPCs) and PG609N (Customer Support - Broadband).
Data Source/s
Annual BT Wholesale Customer activity surveys.
Analysis of revenue in MNS contracts and expert opinion as to which products are sold under each
contract.
KY BT Wholesale – White Label Managed Services (ISP Co)
Description
This unit sells white label enterprise products to communication providers, who resell them to
enterprises. The products include Centrex and hosted contact centres.
Methodology

OUC driven bases
51
OUC Descriptions (For all descriptions below, see Appendix A for Key Destinations)
The costs of this unit are allocated to PG585A (Customer Support – Retail Residual).
T BT TSO Billing System and internal trades summary
BT TSO is our internal service unit responsible for delivering and operating our networks, platforms
and IT systems. BT TSO works closely with each of our customer-facing lines of business to create new
products, and makes sure that our existing services evolve to meet the changing needs of their
customers.
BT TSO is made up of several smaller business units and each one performs a different function, but all
recover their costs from the customer-facing lines of business through a series of internal trades. The
BT TSO Billing System records the amount of cost recovered by each business unit from each trade
and it also records the amount billed to each line of business against each trade. We use this
information to allocate BT TSO costs to activity groups, plant groups and Retail Residual in the
following way.
Step 1. We use BT TSO billing information to understand which trades are used by each BT TSO
business unit.
In this example business unit TA recovers A% of its costs using Trade 1, B% of its cost using Trade 2
etc.
For the purpose of cost attribution we create a separate cost attribution base for each business unit.
The nature of these business units and the main cost recovery trades are explained in the following
sections.
Step 2. We use BT TSO billing information to understand how much each LOB is billed under each
trade
In this example BT TSO bills Openreach for D% of Trade 1 and it bills BT Wholesale for E% of the same
trade.
For the purposes of attributing costs we have a different rule for each trade and each line of business
since for example: Computing Support costs for Openreach need to be treated differently to
TA TB TCArchitecture &
Global IT
platforms
Service, Strategy
& Operations
Group Customer
Experienceetc…
Trade 1 A% X% X%
Trade 2 B% X% X%
Trade 3 C% X% X%
etc
100% 100% 100%
Trade 1 Trade 2 Trade 3 etc…
Openreach D% X% X%
BT Wholesale E% X% X%
Global Services F% X% X%
BT Consumer G% X% X%
BT Business H% X% X%
Group Functions I% X% X%
100% 100% 100%

OUC driven bases
52
OUC Descriptions (For all descriptions below, see Appendix A for Key Destinations)
Computing Support costs for Global Services.
Step 3. We create an “except” base for each business unit
The except base is calculated by combining Steps 1 and Step 2 eg we would attribute business unit
TA’s costs:
A% x D% using the rules for Trade 1 billed to Openreach,
A% x E% using the rules for Trade 1 billed to BT Wholesale,
and so on such that 100% of the costs are attributed.
BT TSO Billing Information – Categories of trade between BT TSO and other LoBs
Development /ICT
These costs relate to software developers and the management of development projects, and include
the costs for BT TSO developers and contracted developers, both UK and off-shore. These people
book their time directly to projects and the BT TSO billing system includes details of all projects
including “volume driven” projects where the line of business orders a specific project and “non-
volume” driven costs where BT TSO incur general costs in support system development for that line of
business but are not specific to any one project.
The apportionment rules for these trades are based on the detailed analysis of in the information
recorded in the BT TSO billing data:
Openreach: we analyse the specific projects and group them together into categories which are
treated as follows:
Customer, Commercial & Propositions: allocated to PG772 (Openreach Product Specific
Developments).
Customer Service: apportioned to plant groups using the BW except base.
Infrastructure – NGA: apportioned between PG197A (FTTC Development) and PG198A (FTTP
Development depending on the nature of the specific projects.
General and less specific projects are allocated to AG408 (Costs driven by Openreach Fixed Asset
values). These projects include the following sub-categories: Infrastructure – other, Chief
Information Office, Service Delivery, Legal and Finance.
BT Wholesale: we similarly analyse the specific BT Wholesale development projects and group them
together into categories which are treated as follows:
Managed Network Services: apportioned to plant groups using the MNS methodology (described
under the KU except base).
Broadband: attributed to PG609N (Customer Support- Broadband).
Non-regulated products: attributed to PG583N (Customer Support – Wholesale Residual) and
PG585A (Customer Service – downstream residual) according to the nature of the specific non
regulated product.
Non Product Specific; allocated to AG406 (Costs allocated using BTW pay).
BT Global Services, BT Business and BT Consumer: costs are attributed directly to Retail Products.
BT Group: costs are attributed to AG112 (Corporate Costs).
Other Contract Specific
These costs cover BT TSO’s specific support for contracts with external customers and are attributed
according to the nature of the contract:
MNS Contracts are attributed using our MNS methodology (See KU exception base for more

OUC driven bases
53
OUC Descriptions (For all descriptions below, see Appendix A for Key Destinations)
information).
Other contracts are attributed to either Wholesale Residual or Retail Residual.
Exchange Infrastructure Plan & Build
These costs relate to planning and building the exchange infrastructure such as Transmission,
Ethernet and LLU platforms. We source the specific BT TSO activities undertaken in the year from the
BT TSO Exchange Engineering Services (EES) data and we map them to the relevant plant groups with
the remaining non-specified activities being attributed to AG102 (BT TSO Operational Costs). In some
cases the BT TSO platforms do not map to a single plant group and in these cases we call upon our
other methodologies to apportion costs to plant groups eg the Transmission platform is apportioned
using our CTCS cost allocation. More than half of the costs are attributed to AG102 and of the others,
the most material are AG163 (Back-up Power Equipment – Maintenance) and PG127A (PSTN
Linecards).
Contract & In-Life Product Support
This trade is for the specialised IT support for BT products and services including external contracts
with our customers for the provision of IT services,
For Global Services, BT Consumer and BT Business: the trade is attributed to Retail Residual. Around
two thirds of this trade is billed to these LOBs.
For Openreach: the costs are attributed to AG401 (Costs apportioned using Openreach pay).
For BT Wholesale: the costs are attributed to AG406 (Costs attributed using BT Wholesale pay).
EUT and Desktop Security
This trade relates to BT laptops and desktop security.
For Global Services, BT Consumer and BT Business: the trade is attributed to Retail Residual. Around
58% of this trade is billed to these LOBs.
For Openreach: the costs are attributed to AG401 (Costs apportioned using Openreach pay).
For BT Wholesale: the costs are attributed to AG406 (Costs attributed using BT Wholesale pay).
Power, Radio, and Other Infrastructure Support
The costs in this unit relate to the engineers working on Power, Radio & common/generic network
infrastructure support activities.
We use the same methodology to attribute these costs as for the Exchange Infrastructure Plan & Build
trade (explained above) since these engineers are also covered under the BT TSO Exchange
Engineering Services (EES) data.
GVF Provide, Cease & Alter
These costs cover the system and process support activities for the downstream LoBs, primarily for
Ethernet and Private Circuit products and services, but also cover other products that use the BT
network and platforms.
For Global Services, BT Consumer and BT Business: the trade is attributed to Retail Residual. Around
two thirds of this trade is billed to these LoBs.
For Openreach: the costs are attributed to AG401 (Costs apportioned using Openreach pay).
For BT Wholesale: the costs are attributed to AG406 (Costs attributed using BT Wholesale pay).
Media & Broadcast
These costs relate to the dedicated teams supporting the Media & Broadcast (including BT Sport), TV
and Content portfolio. These costs are all attributed to Retail Residual.

OUC driven bases
54
OUC Descriptions (For all descriptions below, see Appendix A for Key Destinations)
GS Recharge
These costs cover the support for non ICT / Development activities such as quality assurance and
system transformation and are attributed to Retail Residual.
Application Support and Management – Design / In-Life
AS&M – Design and In life covers the BT TSO activities of supporting BT designed software
applications across BT LoBs.
For Global Services, BT Consumer and BT Business: the trade is attributed to Retail Residual. Around
two thirds of this trade is billed to these LOBs.
For Openreach: the costs are attributed to AG401 (Costs apportioned using Openreach pay).
For BT Wholesale: the costs are attributed to AG406 (Costs attributed using BT Wholesale pay).
For Group Functions: the costs are attributed to AG112 (Corporate Costs).
IT Support (Cat 1/Cat 2)
BT IT Systems Support teams are responsible for keeping BT’s Networks, IT equipment, operating
systems and data centres up and running. The teams support Servers and Storage, Main Frame
Computers support, Personal Computers, IT Helpdesk, as well as specific LoB Computing Support
teams.
For Global Services, BT Consumer and BT Business: the trade is attributed to Retail Residual. Around
two thirds of this trade is billed to these LOBs.
For Openreach: the costs are attributed to AG401 (Costs apportioned using Openreach pay).
For BT Wholesale: the costs are attributed to AG406 (Costs attributed using BT Wholesale pay).
For Group Functions: the costs are attributed AG112 (Corporate Costs).
GS Security Projects
This trade relates to BT TSO IT support costs to BT Security (part of Global Services) in relation to
cyber-attacks. This cost is allocated to Retail Residual.
CSNO (Customer Service Network Operations)
These costs cover the desktop based Operations Centre managing the network traffic etc. It also
covers support costs for BT GS Global & UK networks, including architects and design who manage the
network as well as any costs for radio spectrum licences
These costs are attributed to Retail Residual.
BT TSO Functions
Certain costs in BT TSO cannot be directly allocated to services provided to other LoBs. The costs in
this support function relate to:
1) Supporting and maintaining BT TSO network - This is apportioned via AG102 (BT TSO
Operational Costs) which uses the net book value of the assets managed by BT TSO;
2) Activities supporting BT TSO overall either as Project Management, Business Strategy, or
other general support and management type costs. These costs support BT TSO’s people and
the assets that BT TSO manages and are attributed to AG103 (BT TSO Support Functions);
and
3) We consider some costs to be corporate in nature for example group wide software licences
and our Research and Innovate function. The costs are attributed to (AG112 Corporate
Costs).

OUC driven bases
55
OUC Descriptions (For all descriptions below, see Appendix A for Key Destinations)
Data Sources
BT TSO Billing information: used to calculate the amount of costs in each trade that are recovered
from each business unit, the amount of costs billed to each LoB for each trade and the detail of
development projects billed to each LoB.
BT TSO Exchange Engineering Services (EES) data: used to calculate the amount of BT TSO
engineering activity which is spent on plan, build and operate activities
Miscellaneous Cost Allocation bases: used to apportion certain BT TSO engineering activities to plant
groups.
TA BT TSO : Architecture & Global IT platforms
This Operations team provides the development for all of BT’s IT platforms, networks and
infrastructure. This includes major software updates and thousands of smaller weekly maintenance
upgrades.
Methodology
The costs for this unit are apportioned using information from the BT TSO Billing System as described
above. The main trades used by this unit are as follows:
Development / ICT
Media & Broadcast
Other Contract Specific
Application Support and Management – Design/In Life
IT Support (Cat 1/Cat 2)
EUT and Desktop Security
Contract & In-Life Product Support
BT TSO Functions
GS Security Projects
TB BT TSO : Service, Strategy & Operations
This BT TSO unit provides the operational support to maintain BT platforms, together with the 2nd and
3rd line technical support to the LoBs. They also lead on Strategic Business Planning for BT TSO.
Methodology
The costs for this unit are apportioned using information from the BT TSO Billing System as described
above. The main trades used by this unit are as follows:
Development / ICT
Other Contract Specific
Exchange Infrastructure Plan & Build
Contract & In-Life Product Support
Power, Radio, and Other Infrastructure Support
Application Support and Management – Design/In Life
BT TSO Functions
TC BT TSO : Group Customer Experience

OUC driven bases
56
OUC Descriptions (For all descriptions below, see Appendix A for Key Destinations)
This BT TSO unit is responsible for the measurement, analysis, reporting and improvement initiatives
focused on customer experience across BT. It also hosts the Centre of Excellence in business
processes.
Methodology
The costs for this unit are apportioned using information from the BT TSO Billing System as described
above. The main trades used by this unit are as follows:
Development / ICT
BT TSO Functions
Other Contract Specific
TG BT TSO : Chief Information Officer’s – Global Services
The CIO units design, build and deploy services for the Global Services LoB and the systems, networks
and processes that support these services.
Methodology
The costs for this unit are apportioned using information from the BT TSO Billing System as described
above. The main trades used by this unit are as follows:
Development / ICT
Other Contract Specific
GS Recharge
BT TSO Functions
GS Security Projects
TK BT TSO: Chief Information Officer’s – BT Consumer
The CIO units design, build and deploy services for the BT Consumer LoB and the systems, networks
and processes that support these services.
Methodology
The costs for this unit are apportioned using information from the BT TSO Billing System as described
above. The main trades used by this unit are as follows:
Development / ICT
Other Contract Specific
TM BT TSO : Chief Information Officer’s – Group
The CIO units design, build and deploy services for the BT Group functions and the systems, networks
and processes that support these services.
Methodology
The costs for this unit are apportioned using information from the BT TSO Billing System as described
above. The main trades used by this unit are as follows:
Development / ICT
Application Support and Management – Design/In Life
Contract & In-Life Product Support
Other Contract Specific
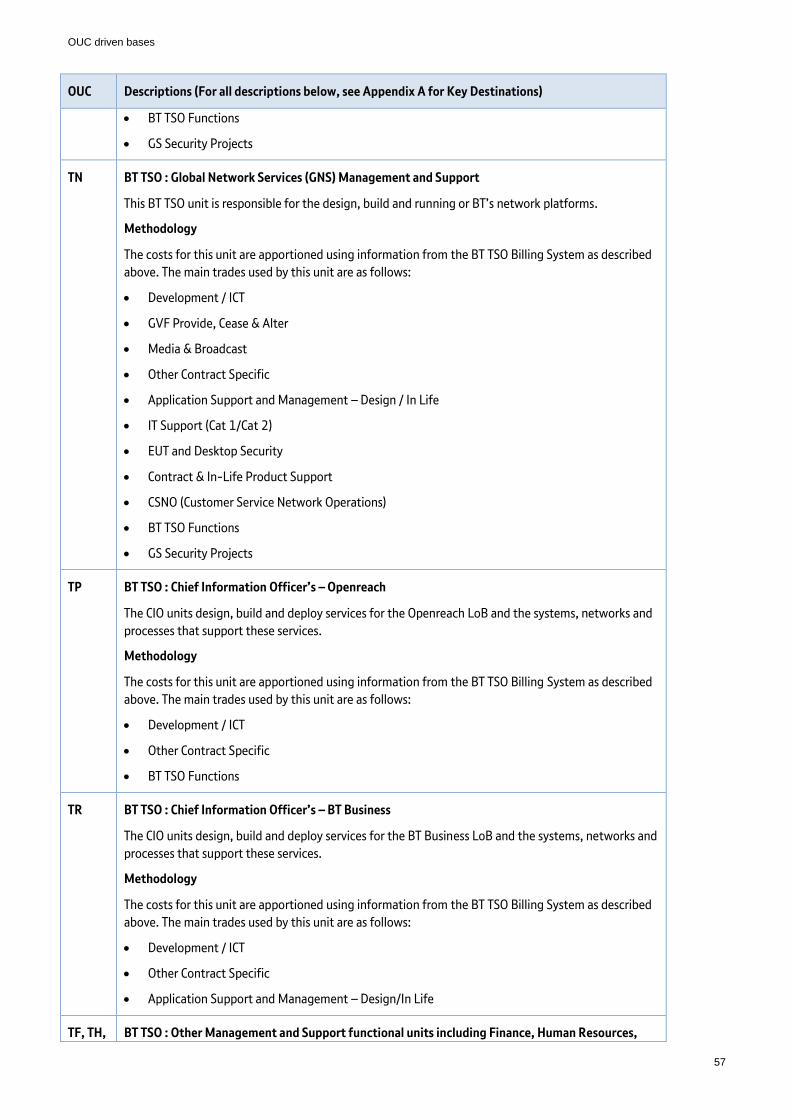
OUC driven bases
57
OUC Descriptions (For all descriptions below, see Appendix A for Key Destinations)
BT TSO Functions
GS Security Projects
TN BT TSO : Global Network Services (GNS) Management and Support
This BT TSO unit is responsible for the design, build and running or BT’s network platforms.
Methodology
The costs for this unit are apportioned using information from the BT TSO Billing System as described
above. The main trades used by this unit are as follows:
Development / ICT
GVF Provide, Cease & Alter
Media & Broadcast
Other Contract Specific
Application Support and Management – Design / In Life
IT Support (Cat 1/Cat 2)
EUT and Desktop Security
Contract & In-Life Product Support
CSNO (Customer Service Network Operations)
BT TSO Functions
GS Security Projects
TP BT TSO : Chief Information Officer’s – Openreach
The CIO units design, build and deploy services for the Openreach LoB and the systems, networks and
processes that support these services.
Methodology
The costs for this unit are apportioned using information from the BT TSO Billing System as described
above. The main trades used by this unit are as follows:
Development / ICT
Other Contract Specific
BT TSO Functions
TR BT TSO : Chief Information Officer’s – BT Business
The CIO units design, build and deploy services for the BT Business LoB and the systems, networks and
processes that support these services.
Methodology
The costs for this unit are apportioned using information from the BT TSO Billing System as described
above. The main trades used by this unit are as follows:
Development / ICT
Other Contract Specific
Application Support and Management – Design/In Life
TF, TH, BT TSO : Other Management and Support functional units including Finance, Human Resources,
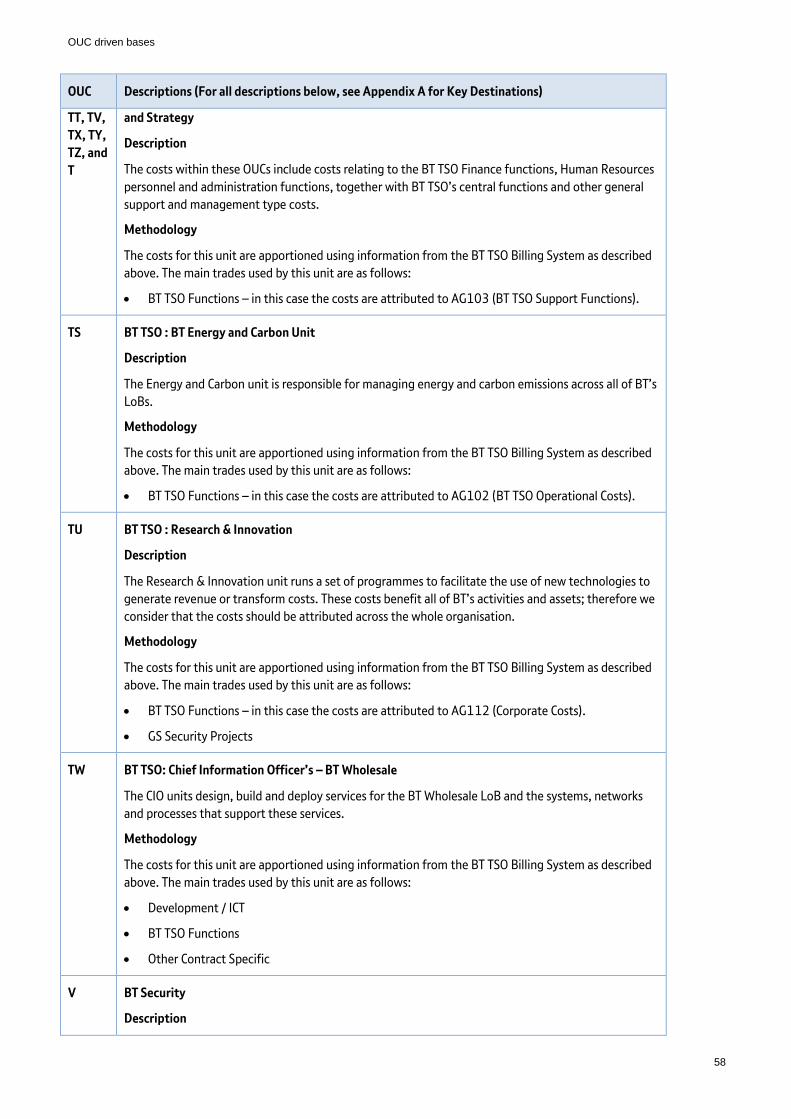
OUC driven bases
58
OUC Descriptions (For all descriptions below, see Appendix A for Key Destinations)
TT, TV,
TX, TY,
TZ, and
T
and Strategy
Description
The costs within these OUCs include costs relating to the BT TSO Finance functions, Human Resources
personnel and administration functions, together with BT TSO’s central functions and other general
support and management type costs.
Methodology
The costs for this unit are apportioned using information from the BT TSO Billing System as described
above. The main trades used by this unit are as follows:
BT TSO Functions – in this case the costs are attributed to AG103 (BT TSO Support Functions).
TS BT TSO : BT Energy and Carbon Unit
Description
The Energy and Carbon unit is responsible for managing energy and carbon emissions across all of BT’s
LoBs.
Methodology
The costs for this unit are apportioned using information from the BT TSO Billing System as described
above. The main trades used by this unit are as follows:
BT TSO Functions – in this case the costs are attributed to AG102 (BT TSO Operational Costs).
TU BT TSO : Research & Innovation
Description
The Research & Innovation unit runs a set of programmes to facilitate the use of new technologies to
generate revenue or transform costs. These costs benefit all of BT’s activities and assets; therefore we
consider that the costs should be attributed across the whole organisation.
Methodology
The costs for this unit are apportioned using information from the BT TSO Billing System as described
above. The main trades used by this unit are as follows:
BT TSO Functions – in this case the costs are attributed to AG112 (Corporate Costs).
GS Security Projects
TW BT TSO: Chief Information Officer’s – BT Wholesale
The CIO units design, build and deploy services for the BT Wholesale LoB and the systems, networks
and processes that support these services.
Methodology
The costs for this unit are apportioned using information from the BT TSO Billing System as described
above. The main trades used by this unit are as follows:
Development / ICT
BT TSO Functions
Other Contract Specific
V BT Security
Description
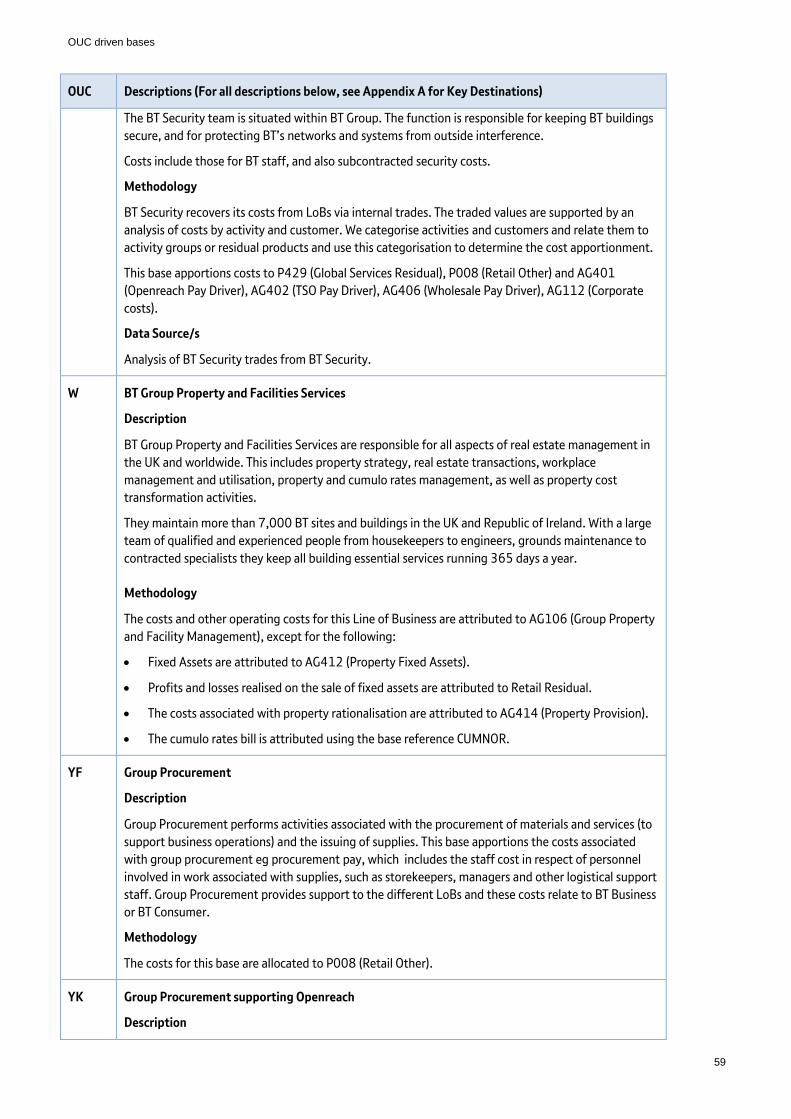
OUC driven bases
59
OUC Descriptions (For all descriptions below, see Appendix A for Key Destinations)
The BT Security team is situated within BT Group. The function is responsible for keeping BT buildings
secure, and for protecting BT’s networks and systems from outside interference.
Costs include those for BT staff, and also subcontracted security costs.
Methodology
BT Security recovers its costs from LoBs via internal trades. The traded values are supported by an
analysis of costs by activity and customer. We categorise activities and customers and relate them to
activity groups or residual products and use this categorisation to determine the cost apportionment.
This base apportions costs to P429 (Global Services Residual), P008 (Retail Other) and AG401
(Openreach Pay Driver), AG402 (TSO Pay Driver), AG406 (Wholesale Pay Driver), AG112 (Corporate
costs).
Data Source/s
Analysis of BT Security trades from BT Security.
W BT Group Property and Facilities Services
Description
BT Group Property and Facilities Services are responsible for all aspects of real estate management in
the UK and worldwide. This includes property strategy, real estate transactions, workplace
management and utilisation, property and cumulo rates management, as well as property cost
transformation activities.
They maintain more than 7,000 BT sites and buildings in the UK and Republic of Ireland. With a large
team of qualified and experienced people from housekeepers to engineers, grounds maintenance to
contracted specialists they keep all building essential services running 365 days a year.
Methodology
The costs and other operating costs for this Line of Business are attributed to AG106 (Group Property
and Facility Management), except for the following:
Fixed Assets are attributed to AG412 (Property Fixed Assets).
Profits and losses realised on the sale of fixed assets are attributed to Retail Residual.
The costs associated with property rationalisation are attributed to AG414 (Property Provision).
The cumulo rates bill is attributed using the base reference CUMNOR.
YF Group Procurement
Description
Group Procurement performs activities associated with the procurement of materials and services (to
support business operations) and the issuing of supplies. This base apportions the costs associated
with group procurement eg procurement pay, which includes the staff cost in respect of personnel
involved in work associated with supplies, such as storekeepers, managers and other logistical support
staff. Group Procurement provides support to the different LoBs and these costs relate to BT Business
or BT Consumer.
Methodology
The costs for this base are allocated to P008 (Retail Other).
YK Group Procurement supporting Openreach
Description
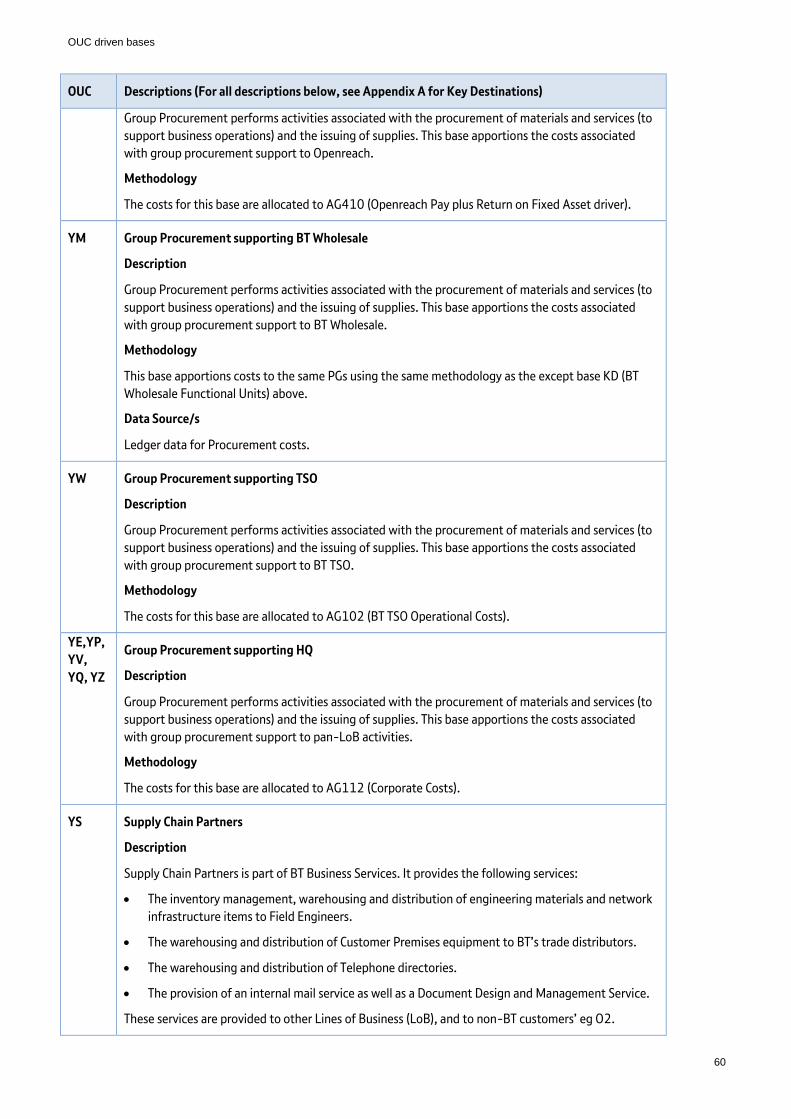
OUC driven bases
60
OUC Descriptions (For all descriptions below, see Appendix A for Key Destinations)
Group Procurement performs activities associated with the procurement of materials and services (to
support business operations) and the issuing of supplies. This base apportions the costs associated
with group procurement support to Openreach.
Methodology
The costs for this base are allocated to AG410 (Openreach Pay plus Return on Fixed Asset driver).
YM Group Procurement supporting BT Wholesale
Description
Group Procurement performs activities associated with the procurement of materials and services (to
support business operations) and the issuing of supplies. This base apportions the costs associated
with group procurement support to BT Wholesale.
Methodology
This base apportions costs to the same PGs using the same methodology as the except base KD (BT
Wholesale Functional Units) above.
Data Source/s
Ledger data for Procurement costs.
YW Group Procurement supporting TSO
Description
Group Procurement performs activities associated with the procurement of materials and services (to
support business operations) and the issuing of supplies. This base apportions the costs associated
with group procurement support to BT TSO.
Methodology
The costs for this base are allocated to AG102 (BT TSO Operational Costs).
YE,YP,
YV,
YQ, YZ
Group Procurement supporting HQ
Description
Group Procurement performs activities associated with the procurement of materials and services (to
support business operations) and the issuing of supplies. This base apportions the costs associated
with group procurement support to pan-LoB activities.
Methodology
The costs for this base are allocated to AG112 (Corporate Costs).
YS Supply Chain Partners
Description
Supply Chain Partners is part of BT Business Services. It provides the following services:
The inventory management, warehousing and distribution of engineering materials and network
infrastructure items to Field Engineers.
The warehousing and distribution of Customer Premises equipment to BT’s trade distributors.
The warehousing and distribution of Telephone directories.
The provision of an internal mail service as well as a Document Design and Management Service.
These services are provided to other Lines of Business (LoB), and to non-BT customers’ eg O2.

OUC driven bases
61
OUC Descriptions (For all descriptions below, see Appendix A for Key Destinations)
The major costs of Supply Chain Partners relates to:
Internal labour and agency costs for the unit.
Freight, postage and delivery charges associated with materials procurement.
Methodology
The Supply Chain Finance team prepares details of their costs by Activity and LoB.
We attribute the costs based on the proportion of work done for each LoB.
For Openreach: We allocate to AG403.
For BT TSO: We allocate to AG404.
For BT Fleet: We allocate to AG101.
For BT Group: We allocate to AG112.
For BT Business, BT Consumer or BT Global Services: We allocate to Retail Residual
A weighted base is then prepared by combining the Supply Chain costs analysis.
AG405 (Retail Store Driver), AG101 (Motor Transport), AG112 (Corporate Costs) and various retail
products.
Data Source/s
Supply Chain Finance management accounts data.

Other bases
62
11. Base methodologies – Other bases
11.1 Introduction to Other bases We have a defined a set of ‘Base Reference’ methodologies to attribute F8/OUC costs to Activity Groups, Plant Groups, and
Retail Residual cost categories. These base reference methodologies (sub-divided by OUC) in some instances allocate 100%
of the F8/OUC costs to a particular cost category and in other instances apportion the cost across multiple cost categories.
Other base methodologies are those which attribute costs onwards based upon the functions of CoWs and how they support
regulated services. This can involve combinations of OUCs and therefore a methodology is applied to cover this more general
cost base than is associated with an OUC driven base.
The following is a dictionary of Other bases which are used to produce the RFS and their associated attribution
methodologies.

Other bases
63
11.2 Base Methodology Dictionary – Other Bases
Base Ref OUC Descriptions (For all descriptions below, see Appendix A for Key Destinations)
CAPEXP ALL Capital Creditors
Description
Capital creditors are the value of authorised invoices for capital expenditure due to suppliers, but that
are unpaid at the accounting period end.
Methodology
The attribution is a system generated allocation that is used as a Rule Type 4, Rule Type 6 and Rule
Type 12. The attribution apportions Capital creditors in proportion to previously allocated F8 codes of
the cost type Non-pay Capital Expenditure.
Diagram: a worked example of how the system generates this attribution
In this example there are three non-pay capital expenditure F8 codes and they have already been
attributed to activity groups, plant groups and retail residual as shown in the table.
The system sums up the apportionment of these relevant F8 codes and apportions capital creditors in
proportion to the total previously allocated non-pay capital expenditure.
This attribution rule can be used as a:
Rule Type 4 - calculated using only F8 codes in the same LoB,
Rule Type 6 - also calculated using only F8 codes in the same LoB but ignoring cost attributed using
an Exception rule or
Rule Type 12 - using relevant F8 codes in all of BT.
CCAFIB BV,B
Y,
HM
Access Fibre CCA Adjustment
Description
This base apportions CCA adjustments relating to access fibre.
Methodology
This is a rule Type 3 attribution.
Existing cost bases for access fibre are weighted to take into account their relative share of total CCA
valuation of access fibre for the year. The split between access spine and access distribution can be
identified by the fact that there are distinct bases for attributing spine and distribution costs.
CCA adjustments are apportioned to PG111C (Access Spine Fibre) and PG959C (Access Distribution
Fibre)
Data Source/s
Costing bases PDTLFDC and PDTLFSC, and Life of Plant (LoP) list.
F8 code: C ode 1 C ode 2 C ode 3
C os t Type:Non Pa y C a pita l
E xpenditure
Non Pa y C a pita l
E xpenditure
Non Pa y C a pita l
E xpenditure Attribution
Attribuion R ule: R ule Type1 R ule Type 3 E xception Total
D es tinations
Ac tivity G roup 1 £100 £100 £100 £300 30%
P lant G roup 1 £200 £200 20%
P lant G roup 2 £100 £100 10%
R etail R es idual £200 £200 £400 40%
T otal £100 £600 £300 £1,000 100%

Other bases
64
Base Ref OUC Descriptions (For all descriptions below, see Appendix A for Key Destinations)
COMCOS B Openreach Common Costs
Description
Openreach common costs ie those which cannot be assigned directly to any particular product or
service which Openreach provides.
Methodology
This is a Rule Type 4 system generated base (calculated using only F8 codes in the same LoB). The costs
in this base are apportioned based on the current salary costs and cost of capital of assets within
Openreach. The REFINE system takes the following relevant costs to generate apportionment
percentages:
Salary expenses for the whole of Openreach (current and capital account).
Net book value of fixed assets revalued for current cost accounting (CCA) for the whole of
Openreach.
REFINE attributes all common costs to the same destinations (ie PGs) which have Openreach pay + cost
of capital already attributed to them, and in the relative proportion of these already attributed costs.
We do this because it most closely aligns with the expected use of common assets and resources in
Openreach.
Example:
Openreach PGs to
which costs have
already been
attributed
Openreach
pay costs in
each PG
Openreach
asset costs in
each PG
Cost of
capital @
10%
Cost +
cost of
capital
Attribution % of
OR common costs
to OR PGs
PG1 100 1000 100 200 200/1600 =
12.5%
PG2 200 2000 200 400 400/1600 = 25%
PG3 500 5000 500 1000 1000/1600 =
62.5%
Total 800 8000 800 1600 100%
In this example 12.5% of all common costs would be attributed to PG1, 25% to PG2 and 62.5% to
PG3.
The cost of capital we actually use is determined by Ofcom, it is currently 10.80%. The above
percentage is for demonstrative purposes only.
We exclude from the final base apportionment subsidiaries and associates, as these are overseas
activities and the COMCOS costs are being attributed solely to UK activities.
The base is apportioned to various AGs and PGs, primarily AG135 (Duct used by Access Cables) and
PG118C (D-Side Copper Cable).
CUMNOR
M
W BT’s Cumulo Rates liabilities
Description
BT’s Cumulo rates liability covers what we pay in non-domestic rates on our rateable network assets in
the UK. Non domestic rates are effectively a form of property tax.

Other bases
65
Base Ref OUC Descriptions (For all descriptions below, see Appendix A for Key Destinations)
The rateable assets within BT’s Cumulo assessment include exchange buildings, telegraph poles, duct,
manholes, cabinets, payphones, copper and fibre. Under rating principles these are assessed together,
hence the term “Cumulo”. Other parts of BT’s property estate - eg offices and workshops - are assessed
separately and do not form part of BT’s Cumulo assessment.
The CUMNORM base apportions the costs relating to BT Cumulo liabilities.
Methodology
This is a Rule Type 3 attribution.
We have agreed a separate NGA (our fibre New Generation Access network) Cumulo liability with the
Valuation Office Authority (VOA). We apportion the costs to the following plant groups based on
information from the VOA on the Cumulo bill:
PG941A (Cumulo Rates NGA); and
PG942A (Cumulo Rates Non NGA).
Data Source/s
Cumulo rate invoices.
CUMNRB
TE
W BT’s Cumulo Rates rebate
Description
BT’s Cumulo rates liability covers what we pay in non-domestic rates on our rateable network assets in
the UK. Non domestic rates are effectively a form of property tax as described under the base
CUMNORM.
In recent years BT has received rebates on its Cumulo rates as a result of increased levels of unbundling.
Unbundling disconnects the local loop from the BT core network and therefore reduces the returns that
can be made from this part of the network, as we lose revenue from downstream products such as calls
and broadband. The Valuations Office Authority (VOA) has granted BT rebates to account for this.
Cumulo rebates are attributed in exactly the same way as Cumulo rates liabilities.
The CUMRBTE base apportions the costs relating to the BT Cumulo rebates.
Methodology
This is a Rule Type 3 attribution.
We have agreed a separate NGA (our fibre New Generation Access network) Cumulo liability with the
VOA, and therefore any rebates we receive will relate to either the Non NGA liability or the NGA
liability. We apportion the costs associated with the rebate to the relevant plant group based on
information from the VOA:
PG941A (Cumulo Rates NGA); or
PG942A (Cumulo Rates Non NGA).
Note: We require a separate base for the rebate as applying the CUMNORM base would result in a
portion of the Non NGA rebate being allocated to the NGA plant group, and vice versa. We do not
currently receive rebates for our NGA liability, and so in practice the rebates are all attributed to Non-
NGA.
Data Source/s
Cumulo rate invoices.
DTNASB
T
B BT owned property charges.
Description

Other bases
66
Base Ref OUC Descriptions (For all descriptions below, see Appendix A for Key Destinations)
This base apportions the Openreach transfer charge from Group Property for the use of space by
Openreach in BT owned operational buildings to Activity Groups, Plant Groups and Retail Residual.
This base forms an element of the system generated attribution for AG106 (Group Property and
Facilities Management), we explain this concept further under AG106 in section 12.2 (Activity Group
Dictionary)
The transfer charges paid by Openreach are matched by the transfer charges received by Group
Property (reported as a credit to costs). This means that the two transfer charges net to nil in all plant
groups. The real relevance of this attribution is its contribution to the AG106 methodology. This
concept is explained in Section 15 Transfer charges.
Methodology
This is a Rule Type 3 attribution.
The apportionment is based on analysis of the transfer charges by Group Property which provides
granularity on how the space is being used. These elements are attributed as follows:
Space used by MDFs – is attributed to PG217E (Main Distribution Frames Equipment)
Space used by Cable Chambers – is attributed to plant group in proportion to the Gross
Replacement Costs of the cables that use them. The primary destinations are PG117C (E-Side
Copper Cable), PG111C (Access Spine Fibre) PG170B Backhaul Fibre), PG950C (Access Spine
Fibre - GEA) and PG350N (Core Fibre).
Space used by LLU equipment – is attributed to PG132B (LLU Co-mingling Recurring Costs
(OR)).
Other space used by Openreach is attributed to AG407 (Costs allocated in proportion to
Openreach pay)
Vacant Space in Operational Buildings – is attributed by firstly increasing the attribution to
LLU com-mingling to take account of future requirements for space and the remaining space
is prorated to Cable Chambers and MDFs.
Data Source/s
Horizon – a Group Property database that shows how he floor space is being used for each building is
used by Group Property to raise their charges to LoBs.
Cable GRCs – taken from our CCA valuations.
Forecast future use of Comingling Space – based on an analysis of a 5 year forecast provided by
communication providers, last updated in 2012/13
DTNASB
T
T
BT owned property charges
Description
This base apportions the BT TSO transfer charge from Group Property for the use of space by BT TSO in
BT owned operational buildings to Activity Groups, Plant Groups and Retail Residual.
This base forms an element of the system generated attribution for AG106 (Group Property and
Facilities Management), we explain this concept further under AG106 in section 12.2 (Activity Group
Dictionary)
The transfer charges paid by BT TSO are matched by the transfer charges received by Group Property
(reported as a credit to costs). This means that the two transfer charges net to nil in all plant groups.
The real relevance of this attribution is its contribution to the AG106 methodology. This concept is
explained in Section 15 Transfer charges.
Methodology
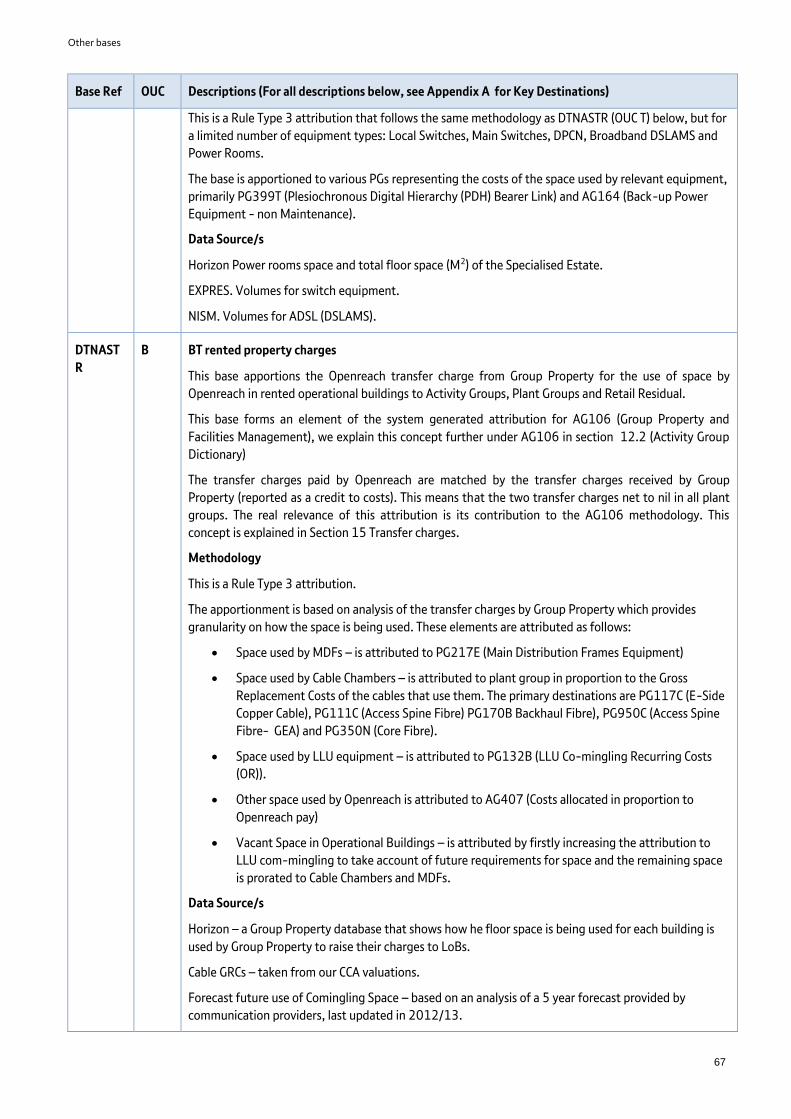
Other bases
67
Base Ref OUC Descriptions (For all descriptions below, see Appendix A for Key Destinations)
This is a Rule Type 3 attribution that follows the same methodology as DTNASTR (OUC T) below, but for
a limited number of equipment types: Local Switches, Main Switches, DPCN, Broadband DSLAMS and
Power Rooms.
The base is apportioned to various PGs representing the costs of the space used by relevant equipment,
primarily PG399T (Plesiochronous Digital Hierarchy (PDH) Bearer Link) and AG164 (Back-up Power
Equipment - non Maintenance).
Data Source/s
Horizon Power rooms space and total floor space (M2) of the Specialised Estate.
EXPRES. Volumes for switch equipment.
NISM. Volumes for ADSL (DSLAMS).
DTNAST
R
B BT rented property charges
This base apportions the Openreach transfer charge from Group Property for the use of space by
Openreach in rented operational buildings to Activity Groups, Plant Groups and Retail Residual.
This base forms an element of the system generated attribution for AG106 (Group Property and
Facilities Management), we explain this concept further under AG106 in section 12.2 (Activity Group
Dictionary)
The transfer charges paid by Openreach are matched by the transfer charges received by Group
Property (reported as a credit to costs). This means that the two transfer charges net to nil in all plant
groups. The real relevance of this attribution is its contribution to the AG106 methodology. This
concept is explained in Section 15 Transfer charges.
Methodology
This is a Rule Type 3 attribution.
The apportionment is based on analysis of the transfer charges by Group Property which provides
granularity on how the space is being used. These elements are attributed as follows:
Space used by MDFs – is attributed to PG217E (Main Distribution Frames Equipment)
Space used by Cable Chambers – is attributed to plant group in proportion to the Gross
Replacement Costs of the cables that use them. The primary destinations are PG117C (E-Side
Copper Cable), PG111C (Access Spine Fibre) PG170B Backhaul Fibre), PG950C (Access Spine
Fibre- GEA) and PG350N (Core Fibre).
Space used by LLU equipment – is attributed to PG132B (LLU Co-mingling Recurring Costs
(OR)).
Other space used by Openreach is attributed to AG407 (Costs allocated in proportion to
Openreach pay)
Vacant Space in Operational Buildings – is attributed by firstly increasing the attribution to
LLU com-mingling to take account of future requirements for space and the remaining space
is prorated to Cable Chambers and MDFs.
Data Source/s
Horizon – a Group Property database that shows how he floor space is being used for each building is
used by Group Property to raise their charges to LoBs.
Cable GRCs – taken from our CCA valuations.
Forecast future use of Comingling Space – based on an analysis of a 5 year forecast provided by
communication providers, last updated in 2012/13.

Other bases
68
Base Ref OUC Descriptions (For all descriptions below, see Appendix A for Key Destinations)
DTNAST
R
T BT rented property charges
Description
This base apportions the BT TSO transfer charge from Group Property for the use of space by BT TSO in
rented operational buildings to Activity Groups, Plant Groups and Retail Residual.
This base forms an element of the system generated attribution for AG106 (Group Property and
Facilities Management), we explain this concept further under AG106 in section 12.2 (Activity Group
Dictionary)
The transfer charges paid by BT TSO are matched by the transfer charges received by Group Property
(reported as a credit to costs). This means that the two transfer charges net to nil in all plant groups.
The real relevance of this attribution is its contribution to the AG106 methodology. This concept is
explained in Section 15 Transfer charges.
Methodology
This is a Rule Type 3 attribution.
The base is apportioned to AGs, PGs and products in proportion to floor space utilisation to service. The
most significant attributions are to AG164 (Back-up Power Equipment - non Maintenance), PG127A
(Analogue Linecards) and PG399T (Plesiochronous Digital Hierarchy (PDH) Bearer Link). This allocation
reflects the main category of Network equipment that occupies the floor space in Specialised Buildings.
There are several equipment types that account for the majority of the floor space, or have a material
impact at market level. These are Switches, Transmission Equipment (SDH, PDH), the Power Rooms,
EDM-ENA, Broadband D-Slams , TDM Access equipment and 21CN equipment
Volumes for equipment are supplied from various source data systems. The total floor space occupied
(m2) is derived by using a historic dimension for each equipment type so the total footprint in the
Specialised buildings is the total volumes multiplied by the unit rack dimension (m2). In addition, a
walkaround factor of 3.85 is applied. This factor takes into account the gangways required between
the telecommunications equipment and also the cooling space required and was devised after a
detailed exercise in 2001. The unit area for the various equipment types is historic and has been used
in the BT TSO Specialised accommodation year on year. This approach is used for Switch, EDM-ENA,
Broadband DSLAMS DSLAMS), CWSS / DWSS and 21CN iNodes.
For transmission equipment (SDH & PDH) a variation of this approach is used because of the difficulty
in measuring the occupied floor space for this equipment. A historic and detailed exercise was
undertaken where the total floor space of the equipment was derived using several data sources. This
value has since been adjusted year on year in proportion with the current volume count for PDH and
SDH.
For Power rooms the total floor space (m2) is taken from a report from Horizon and no further
calculation is necessary.
Data Source/s
Horizon. Power rooms space and total floor space (M2 )of the Specialised Estate.
EXPRES. Volumes for switch equipment.
INS / NDS. Volumes for transmission (PDH) equipment and CWSS – DWSS.
PACS. Volumes for transmission (SDH) equipment.
Oracle Business Intelligence (OBI) Reports. Volumes from EDM –ENA.
NISM. Volumes for DSLAMS

Other bases
69
Base Ref OUC Descriptions (For all descriptions below, see Appendix A for Key Destinations)
DTNCAP
2
BD,
BE,
BF,
BL,
BV,
BW
Capitalisation of field provision costs
Description
Some Field provision work relates to the current account, but the costs are validly booked to capital
class of works (CoWs). The current account costs are for tools and small stores, travel & subsistence,
fuel, clothing and materials handling charges. Capitalisation could happen with a debit against the
capital CoW and a credit against the current account CoW, but the method applied here is to put the
credit against the Postal Services F8 code (209340) (GL code: 33420475) and use a specific base
DTNCAP2, which takes account of how much has been capitalised against each CoW.
The base is applied where the OUCs undertake customer related activities that are collectively described
as ‘field provision’.
Methodology
This is a Rule Type 3 attribution.
We use details of how much has been capitalised against the relevant capital CoW. Each capital CoW is
assigned to a relevant Plant Group (PG) according to its treatment in REFINE.
Costs are apportioned to PGs in proportion to the amounts capitalised to each capital CoW.
Data Source/s
CID Internal Project Ledger; latest available LoP List.
DTNCNS
PO
J4 POLO
Description
This base attributes the costs relating to out payments to overseas operators.
Methodology
This is a Rule Type 3 attribution which attributes cost to Retail Residual and Wholesale Residual
according to the nature of payments.
DTNELSP B Electricity Transfer Charge
Description
This base apportions the Openreach transfer charge from Group Property for the use of electricity by
Openreach in operational buildings to Activity Groups, Plant Groups and Retail Residual.
This base forms an element of the system generated attribution for AG106 (Group Property and
Facilities Management), we explain this concept further under AG106 in section 12.2 (Activity Group
Dictionary)
The transfer charges paid by Openreach are matched by the transfer charges received by Group
Property (reported as a credit to costs). This means that the two transfer charges net to nil in all plant
groups. The real relevance of this attribution is its contribution to the AG106 methodology. This
concept is explained in Section 15 Transfer charges.
Methodology
This is a Rule Type 3 attribution.
The apportionment is based on analysis of the transfer charges by Group Property which provides
granularity on how the space is being used. These elements are attributed as follows:
Space used by MDFs – is attributed to PG217E (Main Distribution Frames Equipment)
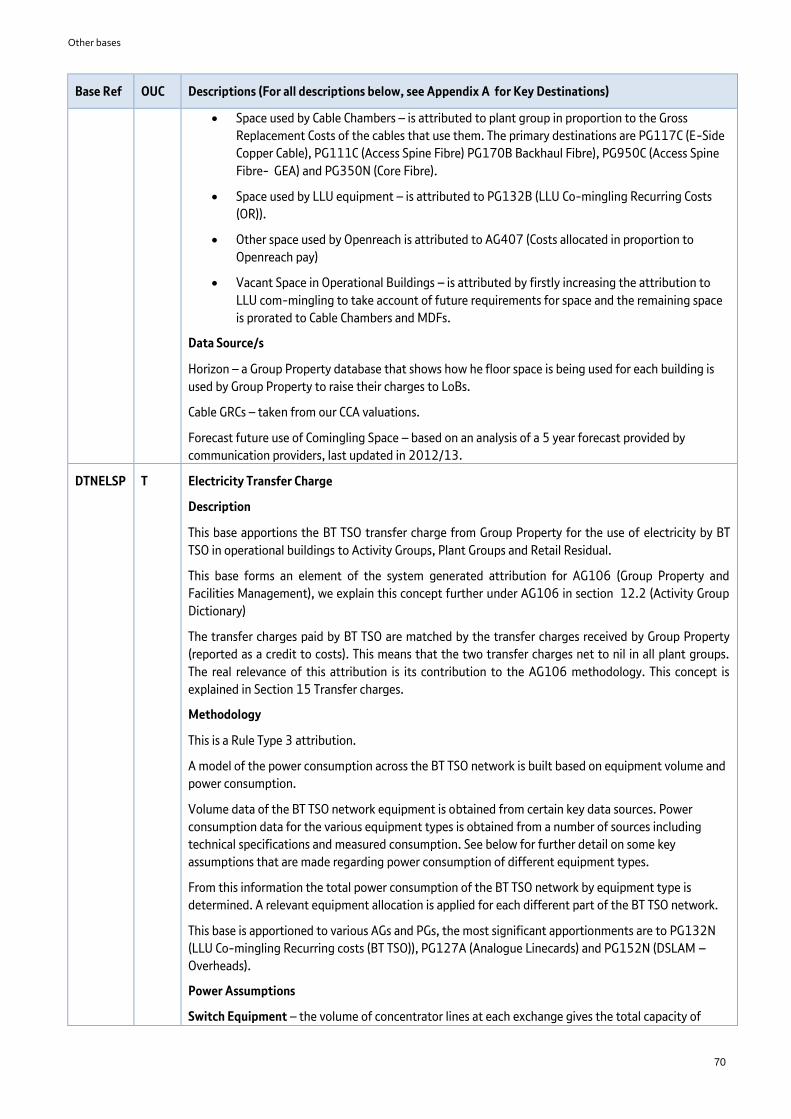
Other bases
70
Base Ref OUC Descriptions (For all descriptions below, see Appendix A for Key Destinations)
Space used by Cable Chambers – is attributed to plant group in proportion to the Gross
Replacement Costs of the cables that use them. The primary destinations are PG117C (E-Side
Copper Cable), PG111C (Access Spine Fibre) PG170B Backhaul Fibre), PG950C (Access Spine
Fibre- GEA) and PG350N (Core Fibre).
Space used by LLU equipment – is attributed to PG132B (LLU Co-mingling Recurring Costs
(OR)).
Other space used by Openreach is attributed to AG407 (Costs allocated in proportion to
Openreach pay)
Vacant Space in Operational Buildings – is attributed by firstly increasing the attribution to
LLU com-mingling to take account of future requirements for space and the remaining space
is prorated to Cable Chambers and MDFs.
Data Source/s
Horizon – a Group Property database that shows how he floor space is being used for each building is
used by Group Property to raise their charges to LoBs.
Cable GRCs – taken from our CCA valuations.
Forecast future use of Comingling Space – based on an analysis of a 5 year forecast provided by
communication providers, last updated in 2012/13.
DTNELSP T Electricity Transfer Charge
Description
This base apportions the BT TSO transfer charge from Group Property for the use of electricity by BT
TSO in operational buildings to Activity Groups, Plant Groups and Retail Residual.
This base forms an element of the system generated attribution for AG106 (Group Property and
Facilities Management), we explain this concept further under AG106 in section 12.2 (Activity Group
Dictionary)
The transfer charges paid by BT TSO are matched by the transfer charges received by Group Property
(reported as a credit to costs). This means that the two transfer charges net to nil in all plant groups.
The real relevance of this attribution is its contribution to the AG106 methodology. This concept is
explained in Section 15 Transfer charges.
Methodology
This is a Rule Type 3 attribution.
A model of the power consumption across the BT TSO network is built based on equipment volume and
power consumption.
Volume data of the BT TSO network equipment is obtained from certain key data sources. Power
consumption data for the various equipment types is obtained from a number of sources including
technical specifications and measured consumption. See below for further detail on some key
assumptions that are made regarding power consumption of different equipment types.
From this information the total power consumption of the BT TSO network by equipment type is
determined. A relevant equipment allocation is applied for each different part of the BT TSO network.
This base is apportioned to various AGs and PGs, the most significant apportionments are to PG132N
(LLU Co-mingling Recurring costs (BT TSO)), PG127A (Analogue Linecards) and PG152N (DSLAM –
Overheads).
Power Assumptions
Switch Equipment – the volume of concentrator lines at each exchange gives the total capacity of

Other bases
71
Base Ref OUC Descriptions (For all descriptions below, see Appendix A for Key Destinations)
System X and AXE10 equipment. To calculate the power consumption the following lookup tables are
used. These power assumptions are historic.
Transmission (PDH & SDH) Equipment – the methodology assumes that the power consumption is
relative to the year on year movement in equipment volumes (ie the prior year consumption is flexed
based on volume increases/decreases).
21CN Equipment - the table below shows the power assumptions that are used in the model for 21CN
equipment. These power ratings are based on manufacturer specifications.
System X power consumption AXE 10 power consumption
Capacity Total Power (KW) Capacity Total Power (KW)
0 2 0 1.3
768 4 512 1.8
2048 6 1024 2.8
4096 12 2048 4.8
8192 18 4096 6.8
12288 24 6144 8.6
16384 30 8192 10.9
20480 36 10240 13
24576 42 12288 15
28672 48 14336 17
32768 54 16384 19.1
36864 60 18432 21.1
40960 66 20480 23.1
45056 72 22528 25.2
49152 78 24576 27.2
53248 84 26624 29.3
57344 90 28672 31.3
61440 96 30720 33.3
32768 35.4
34816 37.4
36864 39.5
38912 41.5
40960 43.5
43008 45.6
45056 47.6
47104 49.7
49152 51.7
51200 53.7
53248 55.8
55296 57.8
57344 59.9
59392 61.9
61440 63.9
63488 66

Other bases
72
Base Ref OUC Descriptions (For all descriptions below, see Appendix A for Key Destinations)
DPCN – the table below shows the power assumptions that are used in the model for each type of
DPCN equipment.
ADSL Equipment – it is assumed that each type of DSLAM rack consumes 1600W. This is a historic
figure based on measured averages.
LLU Power – The model uses actual metered power consumption.
Access Radio – the table below shows the power assumptions that are used in the model for each type
of Radio link.
Equipment Type Equipment Detail Power Consumption (W)
CMSAN CMSAN 1741
AMSAN 1741
FMSAN FMSAN 1000
Ciena 4200 1400
Huawei 6100 MSAN PDO 2000
Huawei 6100 MSAN VDO 2000
Huawei 6100 METRO 1300
Ciena - Core Stream Racks 2100
Huawei 1600G Rack 1800
Ciena - 4200 Rack 1400
Edge Ethernet 7750 200G Boxes 3280
Edge Ethernet 7750 500G Boxes 3280
MSC 3774
MSC Route Reflectors 3774
Infrastructure Ethernet 7750 Boxes: 200G 3280
Infrastructure Ethernet 7750 Boxes: 500G 3774
M320 Voice PE Routers 3150
Ethernet 7750 3280
HN4000 (EFM) 820
EVOTAMS EVOTAMS 100
INODE INODE 1035
ASR9K 100
CRS-16/S 9500
CRS-8/S 4750
MX960 100
MX960 / Juniper MX960 100
MX480 / Juniper MX480 100
EX4200 / Juniper EX4200 100
m320 / Juniper m320 3150
m120 / Juniper m120 100
m10i / Juniper m10i 100
m7i / Juniper m7i 100
J6350 / Juniper J6350 100
TBC / BT Sport equipment 100
Backhaul
METRO/CORE
IP Peering
Media & Broadcast
Ethernet
DPCN Equipment Power (KW)
EDMs 0.16
ENA/ET shelves 0.11
128 ACE 2
512 ACE 4
128 EACE 1.5
512 EACE 3
ECEFs 4
MD202 0.6

Other bases
73
Base Ref OUC Descriptions (For all descriptions below, see Appendix A for Key Destinations)
CWSS/DWSS - – the table below shows the power assumptions that are used in the model for
CWSS/DWSS cards and shelves.
ATM Equipment – the table below shows the power assumptions that are used in the model for the
ATM switch types.
Data Source/s
Uses Period 12 equipment volumes (or most recent volumes available). The key systems used to
provide the volumes for calculation of this base are listed below:
EXPRES - Volumes for switch equipment.
INS - Volumes for PDH transmission equipment
PACS - Volumes for SDH transmission equipment and 21CN equipment
Oracle Business Intelligence (OBI) Reports - Volumes for DPCN equipment (EDM and ENA)
NISM - Volumes for ADSL (DSLAMS)
Radio Type Power per link (w)
Core Radio - STM1 160
<2M 60
4x2/8M 60
16x2/8M 75
140/155M 75
Ethernet 60
CWSS DWSS
Type Power (Kw) Type Power (Kw)
LTE Cards 0.0093 FTEL LTE Cards 0.006
Shelves 0.0068 ATEL LTE Cards 0.0049
FTEL Shelves 0.011
ATEL Shelves 0.0019
Switch Type : 7670 ESE Watts Switch Type : 7670 RSP Watts Switch Type : 7470 MSP Watts
7670_ESE_CTL 43 7670_ICON_EXP_IO 129 CTL 27
Quad STM1CR EL 43 7670_ICON_IO 129 Dual FIC 21
Quad STM1CR IR 43 7670_ICON_LINE 129 DUAL_HUB 60
Quad STM1CR LR 43 7670_PIC_IO 20 DUAL_RX 11
7670_ESE_Shelf 160 7670_PS_CTL 28 DUAL_SC 35
7670_ESE_Fan Unit 125 7670_QFIC_IO 61 E1ATM 120 29
7670 RSP CTL 110 E1ATM 75 29
7670_RSP_GE_IO_CARD LX 22 E1CE 75 29
7670_RSP_GE_IO_CARD SX 22 E1CFR 2 32
7670_RSP_GE_LINE_CARD 86 E1UFR 2 32
7670 RSP SW 69 E3UFR 20
7670_SAC 28 HDE1FR 60
7670_SCH 33 Multi-port ENET EN100T 22
7670_SMX 47 STM1EL 20
7670_SS_CTL 37 STM1IR 20
CIC_IO 22 STM1LR 20
FAC_IO 7 STM1MM 18
HIGHBW_LINE 64 STM4IR 23
HS_MULTIRATE_LINE 107 TC 38
HS_STM1_IO EL 46 Triple DS3 25
HS_STM1_IO IR 29 Triple E3 23
HS_STM1_IO LR 29 Peripheral Shelf 120
HS_STM4_IO IR 23 HS Peripheral Shelf 26
STM16_IO IR 11 Switch Shelf 58
7670_RSP_Fan Unit 116

Other bases
74
Base Ref OUC Descriptions (For all descriptions below, see Appendix A for Key Destinations)
DTNIK HM Northern Ireland, Customer Service Centres
Description
This base apportions the pay and non-pay costs (in OUC HM and F8 codes 153025/ 207521 only)
associated with the Customer Contact Centres (CCC) staff involved in Billing, Inland and International
Directory Enquiries and Operator Assistance Services, Customer Complaints, Provision Service, Fault
Reporting and Repairs and general enquiry activities.
Methodology
This is a Rule Type 3 attribution.
Data is used from the Call Centre Internal Trading Model developed by Customer Service Finance.
The QBC (Queue Based Costing) Model matches volumes to Customer Service (CS) costs by call queue
levels. Data sources are from the Merlin and Nexus systems, which are Performance and Management
Information Reporting systems.
Each call queue either has a Product identifier so it can be pointed directly to Products or, if not, it is
treated as follows:
Where the Product identifier is ‘All Products’, then it is broken down further by sub-product
identifiers into activities including Consumer and Business Repair, Billing, Provision Service (PSU)
and various others.
The repair element is apportioned to Products by using an analysis of fault clear codes
from Galileo.
The Billing element is apportioned by spreading across Residential Revenue.
The remaining other All Products activities are apportioned across either Residential,
Business, Major Business or Northern Ireland Revenue.
Where the Product identifier is ‘Calls and Lines’, that element is pointed to an agreed range of Calls
and Rentals Products.
Where the Product identifier is described as ‘Not TLC’ (Total Labour Cost), that element is
recognised and treated as an overhead of the whole base.
Data Source/s
Galileo, Merlin and Nexus systems.
DTTCE ALL
Core
OUCs
Trading Stocks – Network Equipment
Description
This base apportions trading stocks arising as a result of BT’s trade in network equipment, such as
private circuits, optical fibre network etc. These fixed assets relate to the engineering stores entitled
‘Materials Awaiting Installation’.
Methodology
This is a Rule Type 3 attribution.
The ‘Material Awaiting Installation’ balance is apportioned using the closing stock balances from stock
reports that are maintained and provided by the Stock Accounting Unit.
Each item of BT’s stock is assigned a Quarterly Rolling Forecast (QRF) code (groups of item codes with
similar functional categories) and the base is derived from a download of closing stock balance by QRF
code specifically for network stock. A separately maintained spreadsheet provides the stock COWs and
these are mapped to specific cost centres based on where the costs are allocated.

Other bases
75
Base Ref OUC Descriptions (For all descriptions below, see Appendix A for Key Destinations)
The base is apportioned to various AGs and PGs, primarily AG112 (Corporate Costs) and PG118C (D-
Side Copper Cable).
Data Source/s
The data is sourced through the Automated Supply Chain (ASC) system which is a stores ordering,
issuing and reporting system. The data is then fed through Management Information Database (MIRAS)
before being forwarded by the Data supplier.
Stock report that gives closing balances by QRF. Spreadsheet that maps QRF codes to AS cost centres.
Management have used a cumulative period which they believe to be reflective of the full year.
DTTCY ALL
Core
OUCs
Output VAT
Description
This base apportions the Output VAT creditor, which arises from the VAT collected by BT from UK
customers for forwarding on to HMRC. These VAT creditor balances are attributed pro-rata using BT's
core revenue.
Methodology
This is a Rule Type 3 attribution.
This base is prepared using revenue generated by BT UK sourced from apparatus sales, connection
charges, other single payments, rentals, enhanced maintenance, calls gross, calls discounts and receipts
from Other Communication Providers (OCPs). These different classifications of revenue equate to
specific sectors (groups of General Ledger codes with similar functional categories) within the REFINE
system.
The apportionment for this base is derived from a download of BT’s UK revenue from the REFINE
system for each of these sectors by cost centres and is solely apportioned to Products.
Data Source/s
The data is system generated from REFINE.
FTQ ALL Core Capital and Current Pay
Description
FTQ apportions costs and assets in proportion to core capitalised pay and current pay. This method is
used to attribute costs that are relevant to all of a unit eg coaching and training costs within a unit and
where it would be appropriate for them to be apportioned in line with the previously apportioned pay
costs of that unit. This base is also used to apportion balance sheet balances – including Fixed Assets
and Work in Progress.
Methodology
The attribution is a system generated allocation that is used as a Rule Type 4 and Rule Type 6. The
attribution apportions costs and assets in proportion to previously allocated F8 codes of the cost types:
Current Pay and Capitalised Pay.
Diagram: a worked example of how the system generates this attribution

Other bases
76
Base Ref OUC Descriptions (For all descriptions below, see Appendix A for Key Destinations)
In this example there are three relevant F8 codes and they have already been attributed to activity
groups, plant groups and Retail Residual as shown in the table.
The system sums up the apportionment of these relevant F8 codes and apportions costs and assets in
proportion to the total previously allocated pay costs.
This attribution rule can be used as a:
Rule Type 4 - calculated using only F8 codes in the same LoB, or
Rule Type 6 - also calculated using only F8 codes in the same LoB but ignoring cost attributed using an
Exception rule.
NCOFAD
A
Non-
Core
OUC -
G
Transmission Depreciation and Fixed Assets
Description
This base is used to apportion corporate provisions relating to Transmission depreciation costs and
fixed assets.
Methodology
This is a Rule Type 12 system generated attribution that apportions the provisions in proportion to
previously attributed Transmission depreciation costs (using relevant F8 codes in all of BT).
Diagram: a worked example of how the system generates this attribution
In this example there are three relevant F8 codes and they have already been attributed to activity
groups, plant groups and Retail Residual as shown in the table.
The system sums up the apportionment of these relevant F8 codes and apportions costs and assets in
proportion to the total previously allocated transmission depreciation costs.
NCOFAE
A
Non-
Core
OUC -
G
Software Amortisation and Fixed Assets
Description
This base is used to apportion corporate provisions relating to amortisation depreciation costs and fixed
assets.
Methodology
F8 code: C ode 1 C ode 2 C ode 3
C os t Type: C a pitla lis ed Pa y C urrent Pa y C urrent Pa y Attribution
Attribuion R ule: R ule Type1 R ule Type 3 E xception Total
D es tinations
Ac tivity G roup 1 £100 £100 £100 £300 30%
P lant G roup 1 £200 £200 20%
P lant G roup 2 £100 £100 10%
R etail R es idual £200 £200 £400 40%
T otal £100 £600 £300 £1,000 100%
F8 code: C ode 1 C ode 2 C ode 3
C os t Type:Tra ns m is s ion
D epnTra ns m is s ion D epn
Tra ns m is s ion
D epn AttributionAttribuion R ule: R ule Type1 R ule Type 3 R ule Type 3 Total
D es tinations
Ac tivity G roup 1 £100 £100 £100 £300 30%
P lant G roup 1 £200 £200 20%
P lant G roup 2 £100 £100 10%
R etail R es idual £200 £200 £400 40%
T otal £100 £600 £300 £1,000 100%

Other bases
77
Base Ref OUC Descriptions (For all descriptions below, see Appendix A for Key Destinations)
This is Rule Type 12 system generated attribution that apportions provisions in proportion to
previously attributed software depreciation using relevant F8 codes in all of BT.
Diagram: a worked example of how the system generates this attribution
In this example there are three relevant F8 codes and they have already been attributed to activity
groups, plant groups and Retail Residual as shown in the table.
The system sums up the apportionment of these relevant F8 codes and apportions costs and assets in
proportion to the total previously allocated software depreciation costs.
NCOLF ALL
Non-
Core
OUCs
Liquid Fund Transactions
Description
This base apportions all liquid fund transactions which are defined as Net Short Term Interest Payable,
including Interest Receivable, Profit and Loss (P&L) Cash, Short Term Investments (both internal and
third party), and Short Term Borrowings on the Balance Sheet.
Methodology
This is a Rule Type 3 attribution.
All liquid funds (eg cash, short-term borrowings and short-term investments) are attributable to the
Access, Wholesale and Retail Markets. To allow visibility of such transactions in these Markets, the
monies are collected against AG113 (Total Liquid Funds and Interest). There are four specific Group
Financial Reporting (GFR) lines which determine whether an activity is Liquid Funds:
GFR 160 Net Interest Payable.
GFR 231 Short-Term Investments.
GFR 232 Cash.
GFR 250 Short-Term Borrowings.
These sectors are 100% apportioned to AG113 (Total Liquid Funds and Interest).
NCOTH B111
6
Non-Core
Usually non-core entities, such as B1116, attribute all of their revenues, costs and capital employed
directly to Retail Residual. However for Openreach an exception has been made. As all of this LoB's
costs are attributed to Services/Markets, the costs on B1116 flow into the Wholesale Residual Market.
Methodology
This is a Rule Type 3 attribution.
This PG allocates to PG252B (Openreach Residual Elimination).
NCOVAT G106 BT Group – Output VAT Related Creditors
F8 code: C ode 1 C ode 2 C ode 3
C os t Type: S oftwa re D epn S oftwa re D epn S oftwa re D epnAttribution
Attribuion R ule: R ule Type1 R ule Type 3 R ule Type 3 Total
D es tinations
Ac tivity G roup 1 £100 £100 £100 £300 30%
P lant G roup 1 £200 £200 20%
P lant G roup 2 £100 £100 10%
R etail R es idual £200 £200 £400 40%
T otal £100 £600 £300 £1,000 100%

Other bases
78
Base Ref OUC Descriptions (For all descriptions below, see Appendix A for Key Destinations)
D Description
This base apportions the Output VAT related creditors arising from the VAT collected by BT’s corporate
unit forwarding on to HMRC.
Methodology
This is a Rule Type 3 attribution.
This base is prepared using revenue generated by BT UK sourced from:
Apparatus sales.
Connection charges.
Other single payments.
Rentals.
Enhanced maintenance.
Calls gross.
Calls discount.
Revenue from Other Communication Providers (OCPs).
These different classifications of revenue equate to specific sectors (groups of General Ledger codes
with similar functional categories) within the REFINE system.
The base is apportioned primarily to various products and also to PG599A (Interconnect Outpayments
Inland).
Data Source/s
This base apportions using the analysis produced for the core VAT Creditors base - DTTCY. All core
revenues are taken but Revenue from Other Communication Providers is excluded from the final
allocation.
OPEACN ALL
Core
OUCs
Accommodation Charges – Creditors and/or Receivables
Description
This base apportions creditors/receivables arising from accommodation charges, such as balances on
accommodation costs (external rent receivables, prepaid accommodation expenditure and provisions
for dilapidations and major repairs).
Methodology
This is a system generated Rule Type 12 attribution that apportions the costs and current assets and
liabilities in proportion to previously attributed accommodation costs using relevant F8 codes in all of
BT.
Diagram: a worked example of how the system generates this attribution
F8 code: C ode 1 C ode 2 C ode 3
C os t Type:Accom m oda tion
C os ts
Accom m oda tion
C os ts
Accom m oda tion
C os ts AttributionAttribuion R ule: R ule Type1 R ule Type 3 R ule Type 3 Total
D es tinations
Ac tivity G roup 1 £100 £100 £100 £300 30%
P lant G roup 1 £200 £200 20%
P lant G roup 2 £100 £100 10%
R etail R es idual £200 £200 £400 40%
T otal £100 £600 £300 £1,000 100%

Other bases
79
Base Ref OUC Descriptions (For all descriptions below, see Appendix A for Key Destinations)
In this example there are three relevant F8 codes and they have already been attributed to activity
groups, plant groups and Retail Residual as shown in the table.
The system sums up the apportionment of these relevant F8 codes and apportions costs and assets in
proportion to the total previously allocated accommodation costs.
OPECST ALL
Core
OUCs
Miscellaneous Creditors
Description
This base apportions the input VAT related creditors based on the assumption that the amount to be
claimed from HMRC arises from BT purchases.
Methodology
This is a system generated Rule Type 12 attribution that apportions the creditors in proportion to
previously attributed operating costs, excluding pay, depreciation and capital additions using relevant
F8 codes in all of BT.
Diagram: a worked example of how the system generates this attribution
In this example there are three relevant F8 codes and they have already been attributed to activity
groups, plant groups and Retail Residual as shown in the table.
The system sums up the apportionment of these relevant F8 codes and apportions costs and assets in
proportion to the total previously allocated operating costs.
OPEOTH All Wayleaves Buy Outs Receivables and Accrued Creditors
Description
This base is used to apportion BT Group Wayleaves Buy Outs Receivables and accrued creditors.
Wayleaves refers to the arrangement in place when another company utilises BT land or
plant/equipment (eg telegraph poles) to provide service to a third party.
Methodology
The attribution is a system generated allocation that is used as a Rule Type 4 and Rule Type 12. This
attribution apportions the receivables and creditors in proportion to previously attributed total
operating costs, excluding depreciation and pay.
Diagram: a worked example of how the system generates this attribution
F8 code: C ode 1 C ode 2 C ode 3
C os t Type: O pera ting C os ts O pera ting C os ts O pera ting C os tsAttribution
Attribuion R ule: R ule Type1 R ule Type 3 R ule Type 3 Total
D es tinations
Ac tivity G roup 1 £100 £100 £100 £300 30%
P lant G roup 1 £200 £200 20%
P lant G roup 2 £100 £100 10%
R etail R es idual £200 £200 £400 40%
T otal £100 £600 £300 £1,000 100%

Other bases
80
Base Ref OUC Descriptions (For all descriptions below, see Appendix A for Key Destinations)
In this example there are three relevant F8 codes and they have already been attributed to activity
groups, plant groups and Retail Residual as shown in the table.
The system sums up the apportionment of these relevant F8 codes and apportions costs and assets in
proportion to the total previously allocated operating costs.
This attribution rule can be used as a:
Rule Type 4 - calculated using only F8 codes in the same LoB, or
Rule Type 12 - using relevant F8 codes in all of BT.
OPEPST All
OUCs
Miscellaneous Creditors
Description
This base apportions the input VAT related creditors based on the assumption that the amount to be
claimed from HMRC arises from BT purchases.
Methodology
The attribution is a system generated allocation that is used as a Rule Type 4, Rule Type 6 and Rule
Type 12. The attribution apportions creditors in proportion to previously allocated F8 codes of the cost
types: all operating costs excluding payments to overseas administrations and other communication
providers.
Diagram: a worked example of how the system generates this attribution
In this example there are three relevant F8 codes and they have already been attributed to activity
groups, plant groups and Retail Residual as shown in the table.
The system sums up the apportionment of these relevant F8 codes and apportions costs and assets in
proportion to the total previously allocated operating costs.
This attribution rule can be used as a:
Rule Type 4 - calculated using only F8 codes in the same LoB,
Rule Type 6 - also calculated using only F8 codes in the same LoB but ignoring cost attributed
using an Exception rule; or
F8 code: C ode 1 C ode 2 C ode 3
C os t Type: O pera ting C os ts O pera ting C os ts O pera ting C os tsAttribution
Attribuion R ule: R ule Type1 R ule Type 3 R ule Type 3 Total
D es tinations
Ac tivity G roup 1 £100 £100 £100 £300 30%
P lant G roup 1 £200 £200 20%
P lant G roup 2 £100 £100 10%
R etail R es idual £200 £200 £400 40%
T otal £100 £600 £300 £1,000 100%

Other bases
81
Base Ref OUC Descriptions (For all descriptions below, see Appendix A for Key Destinations)
Rule Type 12 - using relevant F8 codes in all of BT.
OPEXPS ALL
Core
OUCs
Account Payable Activities – Prepayments
Description
This base apportions the prepayments arising from Accounts Payable activities.
Methodology
The attribution is a system generated allocation that is used as a Rule Type 4, Rule Type 6 and Rule
Type 12. The attribution apportions the prepayments in proportion to previously allocated F8 codes of
the cost types: all operating costs excluding depreciation.
Diagram: a worked example of how the system generates this attribution
In this example there are three relevant F8 codes and they have already been attributed to activity
groups, plant groups and Retail Residual as shown in the table.
The system sums up the apportionment of these relevant F8 codes and apportions costs and assets in
proportion to the total previously allocated operating costs.
This attribution rule can be used as a:
Rule Type 4 - calculated using only F8 codes in the same LoB,
Rule Type 6 - also calculated using only F8 codes in the same LoB but ignoring cost attributed
using an Exception rule; or
Rule Type 12 - using relevant F8 codes in all of BT.
OPGENA
CC
TS,
TX
Description
This base apportions the BT TSO transfer charge from Group Property for the use of space and
electricity by BT TSO offices and BT TSO Data Centres to Activity Groups, Plant Groups and Retail
Residual.
This base forms an element of the system generated attribution for AG106 (Group Property and
Facilities Management), we explain this concept further under AG106 in section 12.2 (Activity Group
Dictionary)
The transfer charges paid by BT TSO are matched by the transfer charges received by Group Property
(reported as a credit to costs). This means that the two transfer charges net to nil in all plant groups.
The real relevance of this attribution is its contribution to the AG106 methodology. This concept is
explained in Section 15 Transfer charges.
Methodology
This is a Rule Type 3 attribution.
F8 code: C ode 1 C ode 2 C ode 3
C os t Type: O pera ting C os ts O pera ting C os ts O pera ting C os tsAttribution
Attribuion R ule: R ule Type1 R ule Type 3 R ule Type 3 Total
D es tinations
Ac tivity G roup 1 £100 £100 £100 £300 30%
P lant G roup 1 £200 £200 20%
P lant G roup 2 £100 £100 10%
R etail R es idual £200 £200 £400 40%
T otal £100 £600 £300 £1,000 100%

Other bases
82
Base Ref OUC Descriptions (For all descriptions below, see Appendix A for Key Destinations)
The Group Property bill does not contain the required granularity for the attribution of BT TSO Office
and General Accommodation charges so we use instead some detailed information compiled by BT TSO
for their budget setting exercise; this information is referred to below as the BT TSO Data Centre
Budget.
The BT TSO Data Centre Budget information is a detailed assessment of the space and power required
for each rack and of which systems are hosted on the racks. From this information BT TSO are able to
calculate the costs of the racks used by each LoB.
The first step of our attribution method is to take the total bill from Group Property and deduct the
totals costs of the Data Centres as calculated in the BT TSO Data Centre budget. The remaining costs
are classified as BT TSO office space and are attributed to AG102 (BT TSO Operational costs).
The second step in our attribution process is to use the BT TSO Data Centre budget to split the data
centre costs between LoBs. For each LoB we then apply a different allocation methodology to attribute
the data centre costs.
The specific attributions for each of these elements are shown below:
Data Centres used by BT TSO – attributed to AG402 (Costs attributed using BT TSO pay).
Data Centres used by Openreach – we use the BT TSO Data Centre budget to provide a detailed
analysis of the systems hosted and we then map these systems to plant groups. Around three
quarters of this element is attributed to AG401 (Costs attributed on the basis of Openreach Pay).
Data Centres used by BT Wholesale - we use the BT TSO Data Centre budget to provide a detailed
analysis of the systems hosted and we then map these systems to plant groups. The most
significant plant groups are AG406 (Costs attributed on the basis of BTW Pay), PG584N (Customer
Service – Retail Residual) and PG609N (Customer Service – Broadband).
Data Centres used by Group Functions – attributed to AG112 (Corporate Costs).
Data Centres used by Global Service, BT Consumer and BT Business – attributed to Retail Residual.
Data Source(s)
BT TSO Data Centres Budget - for the total power and accommodation of data centres and for the
detailed analysis of how the data centres are used.
ORCOPO
OI
ALL B
OUCs
Description – Sale of Scrap
This base apportions Other Operating Income received by Openreach from the sale of scrap copper.
Methodology
This is a Rule Type 3 attribution.
Actual cable recovery data provided by Openreach is used to allocate income to PG986R (Openreach
Other Activities).
The remainder is allocated between PG118C (D-Side Copper Cable) and PG980R (Repayment Works)
based on the amount of capital expenditure on D-side copper cable that is proper to Repayment Works.
Data Sources
Cable recovery data from Openreach, Capex data from the Internal Projects Ledger and the Life of Plant
List.
PDTACP
A
B,
BF,
BI,
Accommodation Plant Network (Wholesale): Capital
Description
The base apportions capital work in BT TSO (CoW ACPA) relating to racks, power and ventilation.
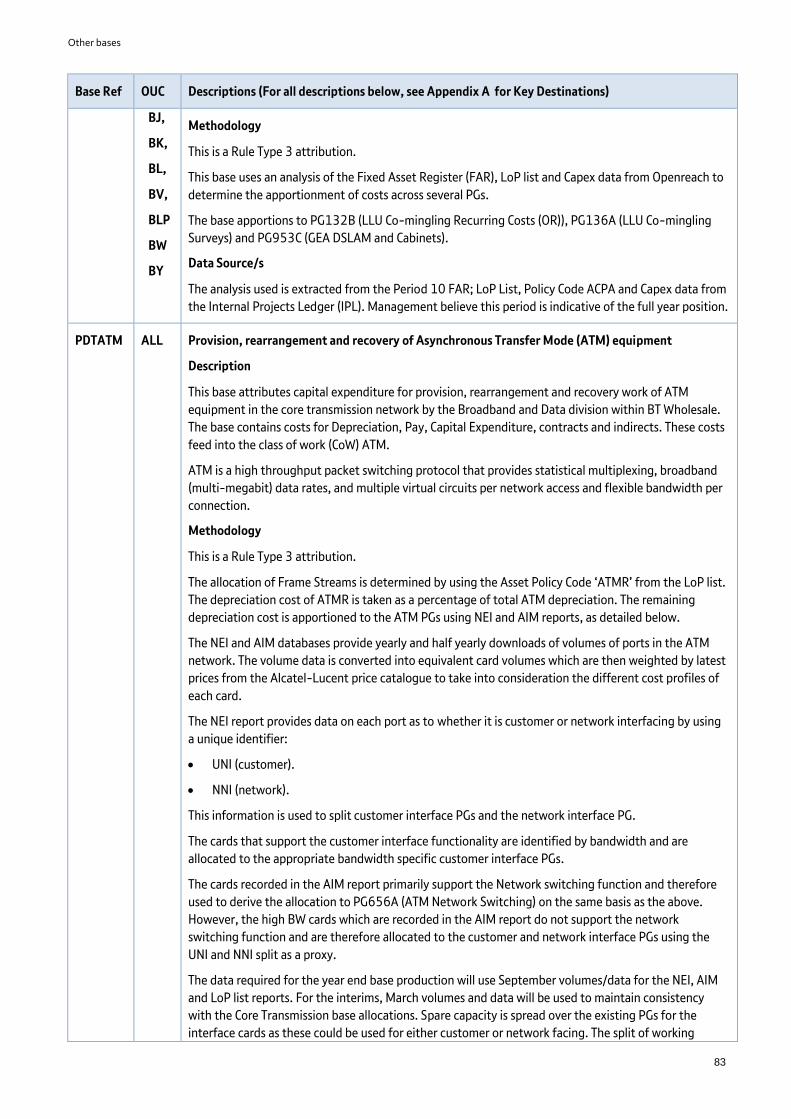
Other bases
83
Base Ref OUC Descriptions (For all descriptions below, see Appendix A for Key Destinations)
BJ,
BK,
BL,
BV,
BLP
BW
BY
Methodology
This is a Rule Type 3 attribution.
This base uses an analysis of the Fixed Asset Register (FAR), LoP list and Capex data from Openreach to
determine the apportionment of costs across several PGs.
The base apportions to PG132B (LLU Co-mingling Recurring Costs (OR)), PG136A (LLU Co-mingling
Surveys) and PG953C (GEA DSLAM and Cabinets).
Data Source/s
The analysis used is extracted from the Period 10 FAR; LoP List, Policy Code ACPA and Capex data from
the Internal Projects Ledger (IPL). Management believe this period is indicative of the full year position.
PDTATM ALL Provision, rearrangement and recovery of Asynchronous Transfer Mode (ATM) equipment
Description
This base attributes capital expenditure for provision, rearrangement and recovery work of ATM
equipment in the core transmission network by the Broadband and Data division within BT Wholesale.
The base contains costs for Depreciation, Pay, Capital Expenditure, contracts and indirects. These costs
feed into the class of work (CoW) ATM.
ATM is a high throughput packet switching protocol that provides statistical multiplexing, broadband
(multi-megabit) data rates, and multiple virtual circuits per network access and flexible bandwidth per
connection.
Methodology
This is a Rule Type 3 attribution.
The allocation of Frame Streams is determined by using the Asset Policy Code ‘ATMR’ from the LoP list.
The depreciation cost of ATMR is taken as a percentage of total ATM depreciation. The remaining
depreciation cost is apportioned to the ATM PGs using NEI and AIM reports, as detailed below.
The NEI and AIM databases provide yearly and half yearly downloads of volumes of ports in the ATM
network. The volume data is converted into equivalent card volumes which are then weighted by latest
prices from the Alcatel-Lucent price catalogue to take into consideration the different cost profiles of
each card.
The NEI report provides data on each port as to whether it is customer or network interfacing by using
a unique identifier:
UNI (customer).
NNI (network).
This information is used to split customer interface PGs and the network interface PG.
The cards that support the customer interface functionality are identified by bandwidth and are
allocated to the appropriate bandwidth specific customer interface PGs.
The cards recorded in the AIM report primarily support the Network switching function and therefore
used to derive the allocation to PG656A (ATM Network Switching) on the same basis as the above.
However, the high BW cards which are recorded in the AIM report do not support the network
switching function and are therefore allocated to the customer and network interface PGs using the
UNI and NNI split as a proxy.
The data required for the year end base production will use September volumes/data for the NEI, AIM
and LoP list reports. For the interims, March volumes and data will be used to maintain consistency
with the Core Transmission base allocations. Spare capacity is spread over the existing PGs for the
interface cards as these could be used for either customer or network facing. The split of working

Other bases
84
Base Ref OUC Descriptions (For all descriptions below, see Appendix A for Key Destinations)
customer and network facing cards is used as a proxy to allocate the spare costs to the relevant PGs.
Data Source/s
Volumes of cards/ports come from the NEI (Network Element Inventory) and AIM (Analysis and
Inventory Module) supplied from the Element Manager database via the capacity delivery manager in
BT TSO (Interims – March, Year end – September).
Card prices are supplied by BT Wholesale.
LoP List.
PDTCCI ALL Common Capabilities
Description
The base apportions costs and balance sheet identified with Common Capability assets such as
Intelligent Service Layer (CISL) and Call Messaging assets.
CISL is a system which replaces BT's legacy Network Intelligence Platform which provides many of BT's
0800, 0845, 0870 and premium rate number translation services. Call messaging assets support Call
Minder 1571. Other CCI assets support a variety of applications.
Methodology
This is a Rule Type 3 attribution based on an analysis of depreciation at policy code level as taken from
our fixed asset register.
Depreciation for Call Minder and CISL are attributed to PG276A (Common Intelligence Service
Layer (CISL))
Depreciation for APC CIMS is attributed to Retail Residual
All remaining depreciation is attributed to AG102 (BT TSO Operational Costs)
Data Source/s
LoP List, a report derived from our fixed asset register is used to analyse depreciation costs
PDTCJF B, T,
Q
Backhaul and Core Fibre Cables.
Description
This base attributes the depreciation and asset values of our core and backhaul fibre cables. For
historical reasons we have a number of different CoWs for these assets. However, in the RFS we treat
them all the same. CJF is the class of work currently used for investment in Backhaul and Core fibre, but
we also have some assets registered against CJC, MUC and BHQ – all such assets are treated the same.
CJF – Construction Junction Cable - Optical Fibre
CJC – Construction Junction Metallic Pair Cable
MUC – Construction Main Underground Cable
BHQ – Construction Submarine Cable Inland
Methodology
This is a Rule Type 3 attribution.
We attribute backhaul and fibre costs onwards to plant groups using the relevant LoB OUC as an
identifier. We do this because (excluding OUC Q which we cover below) all backhaul fibre costs fall
solely under the remit of Openreach (OUC B) and all core fibre costs fall under the remit of BT TSO (OUC
T).

Other bases
85
Base Ref OUC Descriptions (For all descriptions below, see Appendix A for Key Destinations)
OUC B costs are allocated to PG170B (Backhaul Fibre).
OUC T costs are allocated to PG350N (Core Fibre).
For Northern Ireland (represented here by OUC Q) we apportion costs to PG170B (Backhaul Fibre) and
PG350N (Core Fibre) based on the volume of fibre kilometres used by each part of the network
(Backhaul or Core).
Data Source/s
CTCS provides us with the total amount of core and backhaul fibre kms.
PDTCOB
US
All
OUC’s
Business Drop Maintenance
Description
This base apportions repair costs for Business drop wires.
Methodology
This is a Rule Type 3 attribution.
The allocation is based on the share of kilo man hours (KMH) spent on Special Fault Investigation (SFI).
The cost for this activity is derived by multiplying the man-hour rate x KMH for SFI. The total cost for
the CoW is obtained from CID and the proportion of cost allocated to SFI is based on the implied cost
from the man hour rate x KMH.
The apportionment split is derived from the relative proportion of business connections between PSTN
and ISDN. This connection information is obtained from Openreach Management Accounts.
The base apportions costs to PG121M (Business PSTN Maintenance), PG123M (ISDN Highway
Maintenance), PG989A (Special Fault Investigation) and PG981R (Openreach Time Related Charges).
Data Source/s
Workmanager data, CID, Openreach Man-hour Rate, Openreach Management Accounts.
PDTCOR
ES
BV Residential Drop Maintenance
Description
This base apportions repair costs for Residential drop wires.
Methodology
This is a Rule Type 3 attribution.
The allocation is based on the share of kilo man hours (KMH) spent on Time Related Charges (TRCs) and
Special Fault Investigation (SFI). The cost for these activities is derived by multiplying the man-hour
rate x KMH for the above activities. The total cost for this CoW is obtained from CID and the proportion
of cost allocated to SFI and TRC is based on the implied cost from the man-hour rate x KMH.
The base apportions costs to PG122M (Residential PSTN Maintenance), PG981R (Openreach Time
Related Charges) and PG989A (Special Fault Investigation).
Data Source/s
Workmanager data, CID, Openreach Man-hour Rate.
PDTCOR
21
ALL Metro and Core Nodes – All Suppliers
Description
This base apportions the historical cost and balance sheet for metro and core node equipment to Plant
Groups (PGs) that were previously apportioned by PDTCORLU, PDTMETCI, PDTMETAL, PDTMETCN and

Other bases
86
Base Ref OUC Descriptions (For all descriptions below, see Appendix A for Key Destinations)
PDTMETSI.
Core nodes are the high capacity, large scale routers providing cost efficient connections between
Metro Nodes. Metro nodes provide the routing and signalling functions for the unified 21CN network
for voice, data and video.
The recipients are:
PG855A Border Gateway & Signalling Firewall
PG878A Metro BB LNS
PG880A (BEA) Broadband Edge Aggregator
PG881A (BRAS) Broadband Remote Access Server & MSE
PG882A (FER) Front End Router
PG887A Ethernet Edge Aggregator Bandwidth
PG888A Ethernet Edge Aggregator Port
PG889A Infrastructure Ethernet
PG893A (MSPE) Multi Service Provider Edge Routers
PG895A P-Router Large (Core)
PG896A P-Router Metro
PG898A Core Directors
PG903A MAR
PG904A WCC Caches
Methodology
This is a Rule Type 3 attribution.
The Core-Nodes and Metro-Nodes contain functionality for the transport of connectivity, voice and
broadband services, via routers.
The latest 21CN business case model is analysed into the categories for 21Cn assets for which we have
assigned PGs. The business case provides estimates of capital spend on a year by year basis, from which
the annual depreciation for each network element is calculated and reconciled back to the LoP list at
P12. The depreciation charge is calculated over the asset life of the network element. Each network
element is mapped to a PG with the total depreciation charge relating to that PG driving the
apportionment within the base.
Data Source/s
CAPEX analysis from BT Technology, Service & Operations (BT TSO), LOPLIST (Asset Life).
PDTCPD
MI
ALL Wholesale Line of Business of work on ISDN30 connections
Description
This apportionment base is used to re-map ISDN30 connection (classes of work (CoW) CPDI),
Megastream connections ((CoW) CPDM) and Analogue connections ((CoW) PSAA). The costs include
Non-ETG Pay and stores.
Methodology
This is a Rule Type 3 attribution.
Based on a Period 9 analysis of the volumes and relative price of each of the products, the costs for all

Other bases
87
Base Ref OUC Descriptions (For all descriptions below, see Appendix A for Key Destinations)
three CoWs are apportioned to PG114L (ISDN30 Connections), PG413P (Private Circuit Megastream
Connections) and PG421S (Private Circuit Analogue Installation).
Data Source
ISDN 30 Fill Factor from Model 25, IX Vols / Prices from BTWR6_1314_BTW-Interconnect Revenue
and IX Vols / Prices OR Revenue P12 Control File.
Applies
to bases
below
Appli
es to
OUCs
belo
w
PDH Equipment summary
Description
PDH assets relate to the older transmission network assets which have largely been supplemented by
the more modern and fault tolerant Synchronous Digital Hierarchy (SDH) assets.
Combinations of assets in the transmission network (ie two bits of electronics joined by fibre and duct)
make up what is known as a “bearer”. The bearers within the network carry circuits that relate to
different products and bandwidths.
The cost of a bearer includes an apportionment of the costs of these electronic assets.
Methodology
This is a Rule Type 3 attribution.
Most PDH electronics are specific to bearer types, and are dependent upon the capacity of the bearer-
2Mbit/s, 8Mbit/s, 34Mbit/s, 140Mbit/s and 565Mbit/s. Individual PGs capture the cost of each bearer
type separately.
CTCS provides the volumes of each type of bearer. These volumes are weighted by depreciation in order
to get the allocation to PG.
Direct depreciation costs for PDH electronics, sourced from the Life of Plant (LoP) list, are driven
directly to the relevant bearers’ types.
The LoP list breaks down each CoW into subcategories called asset policy codes, which provide further
granularity of the equipment types within the CoW. The description of the asset policy codes allows
costs to be mapped to bearer types.
Traffic grooming equipment, in the form of multiplexers, are captured across a number of asset policy
codes depending on the capacity of the equipment - 2/8mux, 2/34mux, 8/34mux, 34/140mux,
140/565mux. All multiplexer depreciation is allocated to PG399T (traffic grooming).
Indirect costs (software, planning and test equipment asset codes) are treated as overheads and are
apportioned to PGs on the basis of the direct allocations.
Data source/s
LoP list for Period 6, CTCS. Management believes this period to be reflective of the full year.
PDTCRD
A
ALL PDH Digital Repeater Equipment
Description
This base allocates the depreciation costs and asset values of class of work CRD to Plant Groups
representing bearers in the core network. A description of the assets is in the PDH equipment summary
above.
Methodology
This is a Rule Type 3 attribution.
This base follows the same general methodology described in the PDH equipment summary above. This
base apportions costs to the Plesiochronous Digital Hierarchy (PDH) Bearer Link PGs: PG361T and

Other bases
88
Base Ref OUC Descriptions (For all descriptions below, see Appendix A for Key Destinations)
PG399T.
Data Source/s
This base uses the data sources described in the PDH equipment summary above.
PDTCRF
A
ALL PDH Optical Fibre Repeater Equipment
Description
This base allocates the depreciation costs and asset values of class of work CRF to Plant Groups
representing bearers in the core network. A description of the assets is in the PDH equipment summary
above.
Methodology
This is a Rule Type 3 attribution.
This base follows the same general methodology described in the PDH equipment summary above.
This base primarily apportions costs to the Plesiochronous Digital Hierarchy (PDH) Bearer Link PGs:
PG377T, PG375T, PG379T, PG371T and PG373T.
Data Source/s
This base uses the data sources described in the PDH equipment summary above.
PDTCRH
QC
ALL PDH Repeaters (by Contractors)
Description
This base allocates the depreciation costs and asset values of class of work CRHQ to Plant Groups
representing bearers in the core network. A description of the assets is in the PDH equipment summary
above.
Methodology
This is a Rule Type 3 attribution.
This base follows the same general methodology described in the PDG equipment summary above.
Costs from this base are allocated to PG399T (Plesiochronous Digital Hierarchy (PDH) Bearer Link)
Data Source/s
This base uses the data sources described in the PDH equipment summary above.
PDTDMC HBD
HM5
Operator Call Handling Centres (OCHC) – Directory Enquiry Activities
Description
This base apportions Profit and Loss (P&L) Capital spend and Balance Sheet costs relating to Operator
Call Handling Centres (OCHC) engaged primarily in Directory Enquiry (DQ) activities. Costs relate to the
provision and recovery of operating access (eg queuing equipment) and test equipment rented to new
operator systems (eg Operator Service System (OSS), Digital Access Signalling System (DASS))
including:
Supply and installation of Remote Integrated Services Line Units and Interface Cabinets to connect
Directory Assistance Centres (DAC) to the switch, bureau Primary Multiplexer (PMUX).
Provision and upgrade of Automatic Voice Response, DAC and Operator Keyboard Display Terminal
equipment controlled by Operator Services beyond the interface cabinet and PMUXs in the
Enterprise Information System (EIS) and DAC.
Extension and modification of Derived Services Network (DSN) switches to facilitate:

Other bases
89
Base Ref OUC Descriptions (For all descriptions below, see Appendix A for Key Destinations)
Automatic Call Distribution for DAC.
Directory assistance console.
From the F8 Code level, costs flow into the classes of work (CoW) DMC.
Methodology
This is a Rule Type 3 attribution.
The value of costs to be apportioned is calculated using volume data (call minutes) and capital cost
information obtained from the Fixed Asset Register (updated monthly).
Capital costs are attributed by asset (ie equipment) as listed by Asset Policy Codes in the Fixed Asset
Register. Each asset element is assigned to one of the Plant Group (PG) or Product destinations
according to the type/function of the asset and costs are apportioned based on the relative weighting
of the capital costs associated with each element.
This base apportions costs to PG216C (Operator Assistance Systems Equipment), PG405A (DMS100
Call Centre Switches), PG924A (Directory Enquiries Non Chargeable) and P008 (Retail – Other).
Data Source/s
Inland and International Directory Assistance.
Central Data Store (CDS), Call Statistics Centralisation System (CSCS) and Featurenet (part of the
Powerhouse system).
PDTDTT
K
ALL Kilostream Assets and Depreciation
Description
This base apportions the gross book value of Kilostream equipment assets, and the associated
depreciation and accumulated depreciation charges to Plant Groups (PGs).
Kilostream is the brand name for BT’s portfolio of low speed digital private circuits. The circuits operate
at bandwidths of 2.4kbit/s up to 64kbit/s and are provided using BT’s Digital Private Circuit Network
(DPCN).
Methodology
This is a Rule Type 3 attribution.
An apportionment base for these costs is derived by reviewing the Life of Plant (LoP) list.
From the LoP list, information is obtained on the DTTK (Kilostream) classes of work (CoW). This lists the
depreciation charges by asset policy code for each different type of asset/equipment type in this class
of work.
By reviewing the asset policy codes, a distinction between the different equipment types can be
identified and the equipment types split into two groups, one for ACE/ENA equipment and one for
Private Circuits. An apportionment base can then be created by dividing the depreciation charge
allocated to each group by the total depreciation for the CoW.
The asset policy code mapping is shown below:

Other bases
90
Base Ref OUC Descriptions (For all descriptions below, see Appendix A for Key Destinations)
Note that items that are common eg Indirects receive no specific treatment and are therefore spread
on the existing split.
This base apportions costs to PG400T (ACE (Automated Cross-connection Equipment)/ENA (Equipment
Network Access) core equipment) and PG412C (Private Circuits Kilostream Rental Capital) which relates
to the Local End to the customer.
Data Source/s
LoP List for Period 12.
PDTDTT
M
ALL Megastream
Description
Megastream is a 2Mbit/s (2,048Kbit/s) high speed, permanently connected, point to point private
circuit.
Megastream is a Product offered at different bandwidths (ie 1Mbit/s to 622Mbit/s). Apportionment is
made to various Megastream bandwidths, Kilostream and ISDN30 Plant Groups (PGs) due to the fact
that these Products can be carried over higher bandwidth bearers (eg 2Mbit/s, 34Mbit/s, etc.).
Methodology
This is a Rule Type 3 attribution.
This base apportions the gross book value of Megastream equipment assets and the associated
depreciation and accumulated depreciation charges to PGs. These Megastream assets are the electronic
elements of the bearer. The allocation is based on the numbers of bearers on the different bearer sizes
weighted by the cost of each type of bearer.
Volumes for the different bearer sizes come from the Core Transmission Costing System (CTCS) and the
London Local Fibre Network (LLFN). This is multiplied by the cost for the equipment. Different bearer
sizes are represented by different Plant Groups. We identify the numbers of circuits on these bearers
that are used by Kilostream (expressed in 2Mbit/s). We separate the cost of Kilostream and point it to
its own Plant Group.
For bearers of 2Mbit/s size there are two Plant Groups, one for 2Mbit/s supplied over Copper and one
for Fibre, so a split is derived from the fixed asset register using the depreciation from asset policy
codes that relate to 2Mbit/s fibre and 2Mbit/s copper.
This base primarily allocates costs to the plant groups: PG442C (Local End 2Mbit/s (Copper)
Equipment), PG444C (Local End Equipment 34Mbit/s Equipment), PG440C (Local End Equipment
4x2Mbit/s Equipment), and PG443C (Local End Equipment 2Mbit/s (Fibre) Equipment).
Data Source/s
DTTK KILOSTREAM EQUIPMENT DESCRIPTION Plant Group
DKMI Miscellaneous Eqpt PG412C
DTKA Kilostream Modem PG412C
DTKB Kilostream Mux/Muldex PG400T
DTKC X connection site PG412C
DTKD Network Term Equip PG412C
DTKE Test EDM6003B - ACE Site PG400T
DTKF DARTS Equipment PG412C
DTKG Indirects
DTKH RENACE Hardware PG400T
DTKL Local Control Equipment PG412C
DTKM Miscellaneous
DTKN ENA1A Shelf & Cards PG412C
DTKP ET1A Shelf & Cards PG412C
DTKS RENACE Software PG400T
DTKT Test equipment
DTKU Main ACE PG400T

Other bases
91
Base Ref OUC Descriptions (For all descriptions below, see Appendix A for Key Destinations)
London Local Fibre Network (LLFN), Core Transmission Costing System (CTCS), LoP List at Period 12.
PDTDUC
T
T Duct
Description
This base allocates the costs relating to the duct asset. It covers all duct (core access and shared) within
the BT network.
Methodology
This is a Rule Type 3 attribution.
Costs from this base are allocated to AG149 (Duct used by core cables).
PDTDUC
T
B, Q,
HM
Duct
Description
This base apportions the costs relating to the duct asset. It covers all duct (core access and shared)
within the BT network.
Methodology
This is a Rule Type 3 attribution.
Apportionment to Core and Access AGs is done based upon data from the 1996 Absolute Duct Study
(ADS). The ADS was a point in time study of the duct within the network using a sample of 384 of the
5,586 exchange areas. From this survey, the proportion of duct that is solely used/shared between
access and core transmission was determined.
This proportion is used to apportion the 1996/97 index uplifted Gross Replacement Cost (GRC), and to
this the indexed capital spend, from 1996/97 to the current year, is added for access and
Backhaul/Inner Core Duct.
The apportionment is then determined based upon the ratio of (1996/7 Access Gross Replacement
Cost (GRC) plus Access duct capital spend) and (1996/7 Core Gross Replacement Cost (GRC) plus Core
capital Duct spend).
OUC B and HM costs are apportioned to AG148 (Backhaul Duct) and AG135 (Access Duct).
OUC Q* costs are allocated to AG149.
*OUC Q represents all other OUCs.
Data Source/s
1996 Absolute Duct Study (ADS), Internal Project Ledger (IPL).
PDTETHE
R
ALL Ethernet Switches
Description
This base apportions the costs and balance sheet charges for Ethernet switches to Plant Groups (PGs).
The Ethernet Switch is part of the 21CN network and contains functionality for the access and onward
switching of Ethernet customers as well as Broadband including NGA (Next Generation Access).The
recipients are:
• PG901A Ethernet Switches
• PG902A Ethernet Switch Customer Access Cards
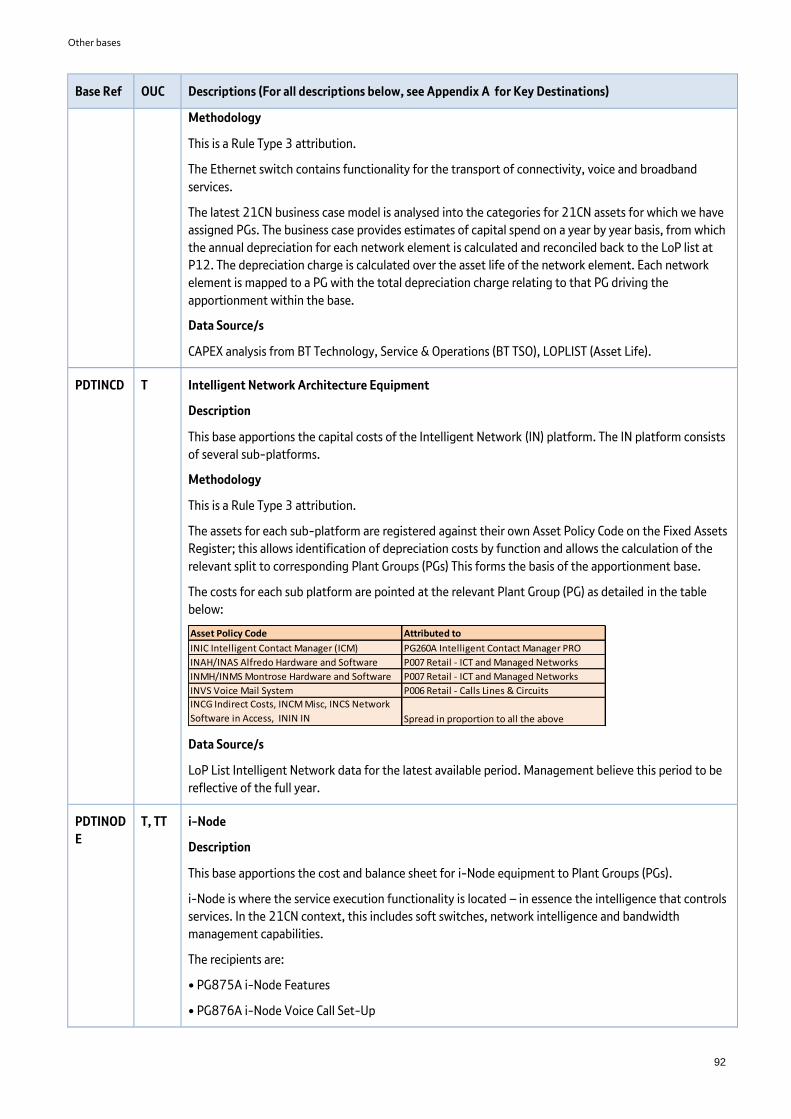
Other bases
92
Base Ref OUC Descriptions (For all descriptions below, see Appendix A for Key Destinations)
Methodology
This is a Rule Type 3 attribution.
The Ethernet switch contains functionality for the transport of connectivity, voice and broadband
services.
The latest 21CN business case model is analysed into the categories for 21CN assets for which we have
assigned PGs. The business case provides estimates of capital spend on a year by year basis, from which
the annual depreciation for each network element is calculated and reconciled back to the LoP list at
P12. The depreciation charge is calculated over the asset life of the network element. Each network
element is mapped to a PG with the total depreciation charge relating to that PG driving the
apportionment within the base.
Data Source/s
CAPEX analysis from BT Technology, Service & Operations (BT TSO), LOPLIST (Asset Life).
PDTINCD T Intelligent Network Architecture Equipment
Description
This base apportions the capital costs of the Intelligent Network (IN) platform. The IN platform consists
of several sub-platforms.
Methodology
This is a Rule Type 3 attribution.
The assets for each sub-platform are registered against their own Asset Policy Code on the Fixed Assets
Register; this allows identification of depreciation costs by function and allows the calculation of the
relevant split to corresponding Plant Groups (PGs) This forms the basis of the apportionment base.
The costs for each sub platform are pointed at the relevant Plant Group (PG) as detailed in the table
below:
Data Source/s
LoP List Intelligent Network data for the latest available period. Management believe this period to be
reflective of the full year.
PDTINOD
E
T, TT i-Node
Description
This base apportions the cost and balance sheet for i-Node equipment to Plant Groups (PGs).
i-Node is where the service execution functionality is located – in essence the intelligence that controls
services. In the 21CN context, this includes soft switches, network intelligence and bandwidth
management capabilities.
The recipients are:
• PG875A i-Node Features
• PG876A i-Node Voice Call Set-Up
Asset Policy Code Attributed to
INIC Intelligent Contact Manager (ICM) PG260A Intelligent Contact Manager PRO
INAH/INAS Alfredo Hardware and Software P007 Retail - ICT and Managed Networks
INMH/INMS Montrose Hardware and Software P007 Retail - ICT and Managed Networks
INVS Voice Mail System P006 Retail - Calls Lines & Circuits
INCG Indirect Costs, INCM Misc, INCS Network
Software in Access, ININ IN Spread in proportion to all the above
Other bases
93
Base Ref OUC Descriptions (For all descriptions below, see Appendix A for Key Destinations)
Methodology
This is a Rule Type 3 attribution.
The i-Node contains functionality for both the setting up of Voice Calls and the provision of Calling
Features eg Ring Back When Free. The split of cost used is the historic ratio of costs for these activities
in the System X and AXE10 Digital Local Exchange PGs as these assets have similar functionality.
Data Source/s
Billing records.
PDTIPNC
O
ALL IP (Internet Protocol) Networks
Description
This base apportions costs of equipment supporting IP networks. Costs booked to classes of work (CoW)
IPNC (Internet Protocol Network Capital) include provision, extension, rearrangement and recovery of
IP networks by the Broadband and Data division in BT Wholesale.
IPNC is the set of communication tools which enables computers to 'talk' to each other over the
Internet. Each computer (known as a host) has at least one address that uniquely identifies it from all
other computers on the Internet. Each piece or 'packet' of information sent over the Internet contains
both the sender's Internet address and the receiver's address. This allows the packets to reach their
intended destination, or, if necessary, to be returned to the sender.
Methodology
This is a Rule Type 3 attribution.
According to the type or function of the asset (ie equipment), each IP piece of equipment is assigned to
one of the Plant Group (PG) destinations related to IP.
IP data and Broadband capital spend is downloaded from the Internal Project Ledger (IPL) for the
previous three years. We use the sub programme for each item of capital spend to associate it with a
relevant PG. IPNC has a life of three years, the capital spend for the last three years (from Internal
Project Ledger) is then used to derive the deprecation.
This base apportions to various PGs, primarily PG668A (IP Network Management), PG672A (IP
Network Broadband) and PG674A (IP Core/Colossus).
Data Source/s
The Internal Project Ledger (IPL) lists depreciation costs by CoW, and produces a list of asset
registrations by year, which can be found in Central Information Data warehouse (CID) Financial
Reporting system. Period 8 data is used as activity after this period does not materially affect the base.
PDTKDE
N
B Kilostream Maintenance
Description
This base apportions the costs of maintaining Kilostream equipment assets. Kilostream is the brand
name for BT’s portfolio of low speed digital private circuits. The circuits operate at bandwidths of
2.4kbit/s up to 64kbit/s and are provided using BT’s Digital Private Circuit Network (DPCN).
Methodology
This is a Rule Type 3 attribution.
This base follows the same methodology and apportionment as PDTDTTK above.
Data Source/s
LoP List for Period 12.

Other bases
94
Base Ref OUC Descriptions (For all descriptions below, see Appendix A for Key Destinations)
PDTLFC
M
B Local Fibre Network Maintenance
This base apportions the costs of maintaining the Access Fibre network equipment assets.
Methodology
This is a Rule Type 3 attribution.
This base apportions costs to the Spine Maintenance, NGA (Next Generation Access) Spine and NGA
Distribution Plant Groups based on their proportion of the Total GRC for Access Fibre. This information
comes from the allocation model for Fibre CoWs.
This base apportions costs to PG111M (Access Fibre Maintenance), PG951M (GEA Distribution Fibre
Maintenance) and PG950M (GEA Access Fibre Spine Maintenance).
Data Source/s
GRC of Access Fibre.
PDTLFDC All Local Fibre Distribution Cable
This base apportions the costs and balance sheet associated with local fibre distribution cable.
Methodology
This is a Rule Type 3 attribution.
The local fibre distribution cable balance sheet and profit and loss values are apportioned to the
following PGs based on their relative GRC: PG959C (Access Distribution Fibre) and PG951C (GEA
Distribution Fibre).
Data Source/s
GRC of Access Fibre.
PDTLFSC All Local Fibre Spine Cable
This base apportions costs and balance sheets associated with local fibre spine cable.
Methodology
This is a Rule Type 3 attribution.
The local fibre distribution cable balance sheet and profit and loss values are apportioned to the
following PGs based on their relative GRC: PG111C (Access Spine Fibre) and PG950C (GEA Spine Fibre).
Data Source/s
GRC of Access Fibre.
PDTLMC ALL Exchange Side Cables
Description
This base apportions the depreciation and asset values for our exchange side copper cable assets (CoW
LMC). This class of work includes:
Our exchange copper cables – which connect our exchange buildings to our copper cabinets.
NGA tie cables – copper cables that are used to connect our copper cabinet to our GEA cabinets.
Internal Tie Cables – used to connect Openreach’s distribution frame to equipment provided by
other communication providers.
A small amount of cost relating to our EvoTAMS assets.

Other bases
95
Base Ref OUC Descriptions (For all descriptions below, see Appendix A for Key Destinations)
Methodology
This is a Rule Type 3 attribution.
This CoW includes a number of different assets. Therefore we apportion the costs to PGs based on a
detailed analysis of depreciation taken from our finance systems. The depreciation of each asset
category is identified as follows:
The policy code CLLU was originally set up to identify internal tie cables, but it also includes some
capitalised assets relating to EvoTAMS. In 2012, we undertook a survey of the actual jobs booked
to policy code CLLU and from this survey we estimated that £37m of these assets related to
EvoTAMS and not tie cables. Divided by the 18 year asset life this equates to £2m of depreciation.
This element is apportioned to PG151B (Broadband Line Testing). This treatment is consistent
with Ofcom’s modelling in the FAMR in 2012.
The remaining depreciation on the policy code CLLU does relate to the internal tie cable assets and
so we apportion this element to PG130A (Local Loop Unbundling Tie Cables).
NGA tie cables are not identified under a separate policy code so we calculate the depreciation
based on the cumulative capital expenditure identified on our Internal Project Ledger (IPL) and
divide this expenditure by the 18 year asset life. This element is apportioned to PG19A (NGA E-
side Copper Capital).
The remaining depreciation for this class of work relates to E-side copper cables and this element is
apportioned to PG117C (E-side Copper Cable).
Data Source/s
LoP List, a report derived from our fixed asset register to identify total amount of depreciation on
policy code CLLU and to confirm the asset live for all assets on this class of work.
Internal Project Ledger (IPL) to identify the cumulative capital expenditure for tie cables connecting
our copper cabinets and GEA cabinets.
2012 detailed survey of jobs booked to policy code CLLU to determine the amount of assets relating to
EvoTAMs.
PDTLMD ALL Local Main (Exchange Side) Duct
This base apportions costs and balance sheet associated with Local exchange side Duct for Copper.
Methodology
This is a Rule Type 3 attribution.
Apportionment to Core and Access AGs is done based upon data from the 1996 Absolute Duct Study
(ADS). The ADS was a point in time study of the duct within the network using a sample of 384 of the
5,586 exchange areas.
From this survey, the value of duct that is solely used by access and core transmission was determined.
This is then used to apportion the 1996/97 index uplifted Gross Replacement Cost (GRC), and to this
the indexed capital spend, from 1996/97 to the current year.
The apportionment is then determined based upon the ratio of (1996/7 Access Gross Replacement
Cost (GRC) plus Access duct capital spend) and (1996/7 Core Gross Replacement Cost (GRC) plus Core
capital Duct spend).
As Core is split between Inner Core (AG149) and Backhaul Core (AG148) and Inner core costs are from
TSO, a CTCS count of circuits expressed as a percentage is used to split the Core allocation between
these two activity groups. Access Duct and Backhaul Core Duct costs come from Openreach and
Northern Ireland whereas Inner core is source from TSO.
A proportion is also allocated to NGA (Next Generation Access) based on depreciation estimated from

Other bases
96
Base Ref OUC Descriptions (For all descriptions below, see Appendix A for Key Destinations)
detailed capital expenditure on NGA projects on the Internal Project Ledger, divided by the
depreciation on Class of work LMD (Local exchange side Duct for Copper) as a whole. This reduces the
allocation to Access duct and Backhaul Core Duct in proportion to each other.
The base apportions costs to:
AG148 (Duct used by Backhaul Core Cables) from Openreach and Northern Ireland OUCs
AG149 (Duct used by Inner Core Cables) from non-Openreach OUCs
AG135 (Access Duct) from Openreach and Northern Ireland OUCs
PG192 (NGA E-Side Copper Capital) from Openreach and Northern Ireland OUCs
Data Source/s
1996 Absolute Duct Study (ADS), Internal Project Ledger (IPL), CTCS.
PDTLMD
F
ALL Main Distribution Frames in Local Exchanges
Description
This base apportions the costs and balance sheet associated with main distribution frames in local
exchanges.
Main distribution frames are the interface between the exchange side cables and the exchange
switching equipment. Exchange side cable is the cable that links the exchange to the primary cross
connection point.
This is illustrated in the diagram in PDTLMC above.
Methodology
This is a Rule Type 3 attribution.
Main distribution frames support the activities of the E-side copper cable. The apportionment of these
costs can therefore be based on the relative sizes of the year to date depreciation of MDF assets at
Period 12 for both E-side copper cable and local loop unbundling frame usage. These figures are taken
from the LoP list.
The costs and balance sheet items are apportioned to:
PG217E (Local Exchange General Frames Capital).
PG130A (Local Loop Unbundling Tie Cables).
Data Source/s
LoP List at Period 12.
PDTLXT
M
ALL Local Exchange Testing
Description
This base apportions the costs of the Local Exchange Test and Measure (LXTM) classes of work (CoW).
This covers common or centralised testing, monitoring or access equipment for Local Exchanges that is
not directly associated with a particular exchange system type.
Methodology
This is a Rule Type 3 attribution.
The depreciation charges from the LoP List for the CoW are analysed by asset policy code and broken
down into:
Exchange equipment used to test local exchanges - this is Test Access Matrix (TAMS) equipment.

Other bases
97
Base Ref OUC Descriptions (For all descriptions below, see Appendix A for Key Destinations)
For Openreach costs are apportioned to PG151B (Broadband Line Testing Equipment (Openreach))
and for TSO costs are apportioned to PG151N (Broadband Line Testing Equipment (BT TSO)).
Other costs. This is line test equipment and costs are apportioned to PG240A (Analogue Line
Testing Equipment).
Data Source/s
Latest available LoP list.
PDTLYX ALL AXE10 Exchanges
Description
This base apportions the costs and balance sheet charges for AXE10 local exchange equipment.
AXE10 equipment is equipment in BT’s network manufactured by Ericsson.
Methodology
This is a Rule Type 3 attribution.
This base apportions the F8 codes mapped to it in exactly the same way as base reference PDTSYSXD,
except that the weighting between concentrators and processors is based on modern equivalent asset
depreciation values rather than historical cost depreciation values.
There are two fundamental building blocks of AXE10 exchanges:
Concentrators.
Processors.
These building blocks are significantly different, and are each made up of a large number of specific
equipment elements. Each of these elements will relate to a specific PG. Therefore to create an
apportionment base, we need to ‘dimension’ each of these specific equipment elements.
Concentrators
Step 1 – We determine the modern equivalent asset value of all the equipment elements of
concentrators in the network.
We obtain, from the Exchange Planning and Review System (EXPRES) system, data that details the line
types and the total number of lines fitted to each concentrator in the BT network. This data is entered
into an engineering model which dimensions the number of equipment elements required to make up
that number of lines. The quantities of each equipment element are then multiplied by an appropriate
element cost to arrive at the total cost for each equipment element.
The appropriate element cost that the engineering model utilises is the modern equivalent asset
amounts for each type of equipment element. These are obtained from the Price Element Scheduled
(PES) as part of the LEMP (Local Exchange Modernisation Program). The figures that are used from this
are the March 1995 figures. These figures are frozen as this equipment is no longer available for
purchase.
Step 2 – We determine an estimate of the modern equivalent asset depreciation value for the
equipment building blocks.
The current year’s asset life determinations are applied to the total modern equivalent asset values of
the equipment identified in step 1 to create a modern equivalent asset depreciation charge for the
year. Asset lives are calculated and determined by Wholesale Regulatory Finance each year. This is
completed via a review process undertaken by experts in this field. Where an individual building block
does not have an individual asset life set in this process, the equated life of the Class of Work (CoW) is
applied.

Other bases
98
Base Ref OUC Descriptions (For all descriptions below, see Appendix A for Key Destinations)
Step 3 – We allocate the depreciation charge into call set-up, access and call duration categories.
Using detailed information obtained from the switch manufacturer, which analyses how the different
equipment types within the switch are used to provide service, the total modern equivalent asset
depreciation value for each type of equipment element is allocated to the following categories:
Call set-up.
Call duration.
Access.
Total modern equivalent asset depreciation charges under each of the three categories can then be
calculated.
This step illustrates the reason for using modern equivalent asset values to create the apportionment
base for the historical cost AXE10 values. The manufacturer’s matrix is crucial in providing the link
between the F8 codes and the PGs that they are apportioned to. The equipment elements in the
manufacturer’s matrix cannot be reconciled to asset policy codes that are based on historical cost
values. However the PES equipment elements compiled as part of the LEMP do reconcile to the
manufacturers matrix and these items are listed at modern asset equivalent values.
Step 4 – We apportion the Access category into more detailed access categories (which will be linked to
PGs at a later stage).
The total modern equivalent asset depreciation value allocated to the category ‘access’ must be further
split into the following categories:
Public Switched Telephone Network (PSTN).
Integrated Services Digital Network (ISDN2).
ISDN30.
Payphones.
This apportionment is calculated based on the relative proportion of cost already identified in the
engineering model.
Step 5 – We create the concentrator weighted base.
Using the modern equivalent asset depreciation amounts calculated for the above-listed categories,
create a weighted base for concentrator kit.
The above steps are represented in the flowchart attached below:
Diagram: Overview of Historical Cost Balance Sheet – Concentrators.
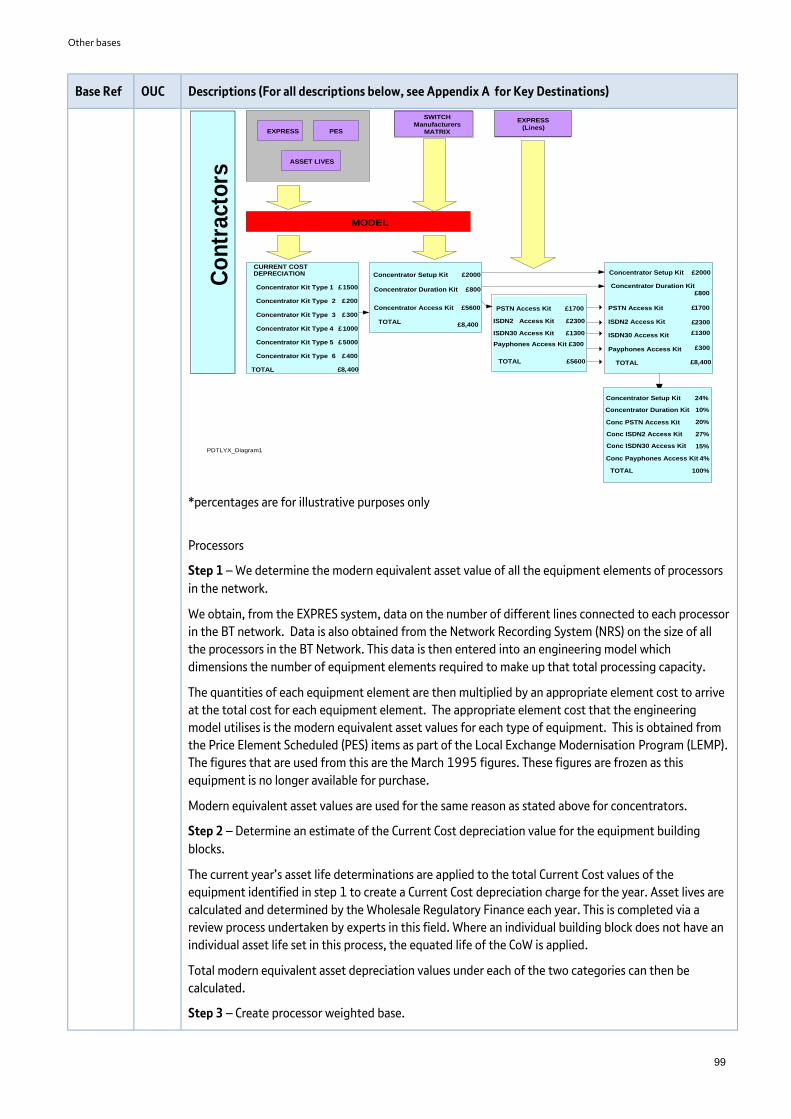
Other bases
99
Base Ref OUC Descriptions (For all descriptions below, see Appendix A for Key Destinations)
*percentages are for illustrative purposes only
Processors
Step 1 – We determine the modern equivalent asset value of all the equipment elements of processors
in the network.
We obtain, from the EXPRES system, data on the number of different lines connected to each processor
in the BT network. Data is also obtained from the Network Recording System (NRS) on the size of all
the processors in the BT Network. This data is then entered into an engineering model which
dimensions the number of equipment elements required to make up that total processing capacity.
The quantities of each equipment element are then multiplied by an appropriate element cost to arrive
at the total cost for each equipment element. The appropriate element cost that the engineering
model utilises is the modern equivalent asset values for each type of equipment. This is obtained from
the Price Element Scheduled (PES) items as part of the Local Exchange Modernisation Program (LEMP).
The figures that are used from this are the March 1995 figures. These figures are frozen as this
equipment is no longer available for purchase.
Modern equivalent asset values are used for the same reason as stated above for concentrators.
Step 2 – Determine an estimate of the Current Cost depreciation value for the equipment building
blocks.
The current year’s asset life determinations are applied to the total Current Cost values of the
equipment identified in step 1 to create a Current Cost depreciation charge for the year. Asset lives are
calculated and determined by the Wholesale Regulatory Finance each year. This is completed via a
review process undertaken by experts in this field. Where an individual building block does not have an
individual asset life set in this process, the equated life of the CoW is applied.
Total modern equivalent asset depreciation values under each of the two categories can then be
calculated.
Step 3 – Create processor weighted base.
Co
ntr
acto
rs
EXPRESS PES
MODEL
ASSET LIVES
CURRENT COSTDEPRECIATION
Concentrator Kit Type 1 £1500
Concentrator Kit Type 2 £200
Concentrator Kit Type 3 £300
Concentrator Kit Type 4 £1000
Concentrator Kit Type 5 £5000
Concentrator Kit Type 6 £400
TOTAL £8,400
SWITCH
Manufacturers
MATRIX
Concentrator Setup Kit £2000
Concentrator Duration Kit £800
Concentrator Access Kit £5600
TOTAL £8,400
EXPRESS
(Lines)
PSTN Access Kit £1700
Payphones Access Kit £300
TOTAL £5600
Concentrator Setup Kit £2000
Concentrator Duration Kit£800
PSTN Access Kit £1700
ISDN2 Access Kit £2300
ISDN30 Access Kit £1300
Payphones Access Kit £300
TOTAL £8,400
Concentrator Setup Kit 24%
Concentrator Duration Kit 10%
Conc PSTN Access Kit
Conc ISDN2 Access Kit
Conc ISDN30 Access Kit
Conc Payphones Access Kit
TOTAL
ISDN30 Access Kit £1300
ISDN2 Access Kit £2300
20%
27%
15%
4%
100%
PDTLYX_Diagram1

Other bases
100
Base Ref OUC Descriptions (For all descriptions below, see Appendix A for Key Destinations)
Using the modern equivalent asset depreciation amounts calculated for the above-listed categories,
create a weighted base for processor kit.
The above steps are represented in the flowchart attached below:
Diagram: Overview of Historical Balance Sheet – Processors.
* Percentages are for illustrative purposes only.
Apportionment to Plant Groups (PGs)
We now have two sets of apportionment data with both the concentrator and the processor
apportionments adding up to 100%. The next step in the process is to weight the concentrator and
processor apportionments. This base uses modern equivalent asset depreciation values to create the
weighting from within the model.
Step 1 – We calculate the total modern equivalent asset depreciation charges for AXE10 equipment
From the calculations above, the total of the modern equivalent asset depreciation charges for
processor equipment is calculated. The total of the modern equivalent asset depreciation values for
concentrator equipment is also calculated.
Step 2 – We create a weighted base for apportionment percentages
Using the relative proportions between processors and concentrators derived from the previous step,
the apportionment’s calculated for processors and concentrators can be weighted.
The above steps can be represented in the flowchart attached below:
Diagram: Historical Balance Sheet – Apportionment to PGs
P
R
O
C
E
S
S
O
R
S
EXPRES PES
NRS ASSET LIVES
MODEL
SWITCH
MANUFACTURER
MATRIX
Current Cost
Depreciation
Processor Kit Type 1 £900
Digital Line Termination
Total
Digital Line Termination
Total 100%£x,y,z
Switch Block
Processor Kit Type 2 £300
Processor Kit Type 3 £500
Processor Kit Type 4 £300
Processor Kit Type 5 £1200
Total £3200
PDTLYX_Diagram2
Switch Block
Processor end signalling
£ x
£ y
£ z Switch Block
% x
% y
% z

Other bases
101
Base Ref OUC Descriptions (For all descriptions below, see Appendix A for Key Destinations)
* Percentages are for illustrative purposes only.
Step 3 – We apportion costs to PGs
The apportionments are applied to the following Plant Groups (PGs) based on an analysis of the most
appropriate fit for the building blocks. These are then applied to the historical cost Balance Sheet (ie
gross book value (GBV) and accumulated depreciation) and historical cost Profit and Loss (ie
depreciation etc.) charges for AXE10 local exchange equipment.
The PGs that the apportionment’s point to are as follows:
Category Plant Group
AXE10 Local Exchange Processor
and Signalling
PG280C (Local Exchange Processor (AXE10) Equipment)
AXE10 Local Exchange Digital Line
Termination
PG281C (Local Exchange Line Transmission (AXE10)
Equipment)
AXE10 Local Exchange Switch
Block
PG282A (Local Exchange Switch Block (AXE10))
AXE10 Concentrator Set-Up PG283A (Local Exchange Conc (AXE10) Call set-up)
AXE10 Concentrator Duration PG284A (Local Exchange Conc (AXE10) Call Duration)
PSTN Linecards PG127A (Analogue Linecards)
ISDN2 Linecards PG128A (ISDN2 Linecards)
ISDN30 Capital /Maintenance PG124A (ISDN30 Equipment)
MODEL
B
a
s
e
R
e
f
e
r
e
n
c
e
%’s
Processor Dep’n
Concentrator Dep’n
£3,200
£8,400
Processor Dep’n
Concentrator Dep’n
28%
72%
24%
10%
20%
27%
15%
4%
100%
Concentrator Set up Kit
Concentrator Duration
Kit
Concentrator PSTN
Access Kit
Concentrator ISDN2
Access Kit
Concentrator ISDN30
Access Kit
Concentrator
Payphones Access Kit
Total
Concentrator Set up Kit
Concentrator Duration
Kit
Concentrator PSTN
Access Kit
Concentrator ISDN2
Access Kit
Concentrator ISDN30
Access Kit
Concentrator
Payphones Access Kit
Total
17%
7%
14%
19%
11%
3%
72%
Digital Line Termination
Processor & Signalling
Total
20%
40%
100%
Digital Line Termination
Switch Block
Total
5.6%
PDTLYX_Diagram3
Switch Block
40% Processor & Signalling
11.0%
11.0%
28%

Other bases
102
Base Ref OUC Descriptions (For all descriptions below, see Appendix A for Key Destinations)
This can be represented in the flowchart below:
Diagram: Historical Balance Sheet and Profit and Loss (P&L) Apportionment to PGs
Data Source/s
EXPRES and NRS Systems. Management uses a period that is reflective of the full year.
PDTMDE
N
ALL Private Circuits Megastream Maintenance
Description
This base apportions the costs of maintaining Megastream equipment assets. Megastream is a 2Mbit/s
(2,048kbit/s) high speed, permanently connected, point to point private circuit.
Methodology
This is a Rule Type 3 attribution.
This base apportions the costs of maintaining Megastream equipment assets to Plant Groups (PGs) and
follows the same apportionment percentages as determined in the PDTDTTM base.
PDTDTTM apportions costs using a combination of Current Costs values of bearers, volumes of circuit
types and depreciation.
Data Source/s
Current Cost values of bearers, volumes of circuit types and depreciation for the most recent period of
the year. London Local Fibre Network (LLFN), Core Transmission Costing System (CTCS) and LoP list at
Period 11. Management believe this period to be reflective of the full year.
PDTMDF ALL Main Distribution Frames (Current)
Description
This base apportions current account costs for main distribution frames.
Methodology
This is a Rule Type 3 attribution.
The allocation is based on the share of kilo man hours (KMH) spent on Time Related Charges (TRCs) and
Special Fault Investigation (SFI). The cost for these activities is derived by multiplying the manhour rate
x KMH for the above activities. The total cost for the CoW is obtained from CID and the proportion of
cost allocated to SFI and TRC is based on the implied cost from the manhour rate x KMH. The residual
AXE10 Balance
Sheet and Profit
and Loss F8
Codes (Historical
Costs)
A
p
p
o
r
t
i
o
n
m
e
n
T
LE Processor and Signalling
Processor DLT
Process Switch Block
Concentrator Set up Kit
Concentrator Duration
Kit
Conc Kit PSTN Access
Conc. ISDN2 Access
Kit
Conc. ISDN30 Access
Kit
Conc. Payphones
Access Kit
Total
25%
3%
3%
17%
7%
14%
19%
11%
3%
100%
LE Proc & Sign
PG280A
LE DLT PG281C
LE Switch Block
PG282A PG287C
Conc SetupPG283A
Conc Duration
PG284a PG289A
PG120A
PG124A
PG128A
PG128A
PDTLYX_Diagram4

Other bases
103
Base Ref OUC Descriptions (For all descriptions below, see Appendix A for Key Destinations)
proportion of the cost after subtracting the above is apportioned to Local Exchange Frames.
This base apportions costs to PG217F (Local Exchange Frames (Current)), PG981R (Openreach Time
Related Charges), and PG989A (Special Fault Investigation).
Data Source
Workmanager data, CID, Openreach Manhour Rate, Openreach Management Accounts.
PDTMDS
L
BL,
BV,
HM
Main Distribution Frames (Current)
Description
This base apportions current account costs for maintenance of digital subscriber line equipment.
Methodology
This is a Rule Type 3 attribution.
The allocation is based on the share of kilo man hours (KMH) spent on Special Fault Investigation (SFI).
The cost for this activity is derived by multiplying the manhour rate x KMH for SFI. The total cost for the
CoW is obtained from CID and the proportion of cost allocated to SFI is based on the implied cost from
the manhour rate x KMH.
The residual proportion of the cost after subtracting the above is apportioned to Digital Subscriber
Line.
This base apportions costs to PG152B (Digital Subscriber Line Openreach) and PG989A (Special Fault
Investigation)
Data Source
Workmanager data, CID, Openreach Manhour Rate, Openreach Management Accounts.
PDTMSA
N
ALL Fujitsu and Huawei MSANs
Description
This base apportions the cost and balance sheet for Fujitsu and Huawei manufactured MSANs (Multi
Service Access Nodes) equipment to Plant Groups (PGs).
The recipients are:
PG857A CMSAN Combi Cards BB element.
PG859A CMSAN Control Access.
PG860A CMSAN Control Transport.
PG861A CMSAN ISDN30 Cards.
PG862A CMSAN Low Band SDSL cards =<2Mbit/s.
PG869A FMSAN Control Access.
Methodology
This is a Rule Type 3 attribution.
The latest 21CN business case model is analysed into the categories, for which we have assigned PGs,
for 21CN assets. The business case provides estimates of capital spend on a year by year basis, from
which the annual depreciation for each network element is calculated and reconciled back to the LoP
list at P12. The depreciation charge is calculated over the asset life of the network element. Each
network element is mapped to a PG with the total depreciation charge relating to that PG driving the
apportionment within the base.

Other bases
104
Base Ref OUC Descriptions (For all descriptions below, see Appendix A for Key Destinations)
Data Source/s
CAPEX analysis from BT Technology, Service & Operations (BT TSO), LOPLIST (Asset Life).
PDTMTL
UR
BV
HM
Repair of Consumer’s Wiring
Description
This attributes the costs relating to the maintenance of end-user customers’ internal wiring and
network termination equipment (NTE) as covered by our CoW: MTLUR. These costs arise when
additional engineering time is requested by Other Operators for fixed line services not included in
Openreach’s standard services.
Methodology
This is a Rule Type 3 attribution.
The attribution is based on the share of kilo man hours (KMH) spent on Special Fault Investigation (SFI).
The cost for this activity is derived by multiplying the manhour rate x KMH for SFI. The total cost for the
CoW is obtained from CID and the proportion of cost allocated to SFI is based on the implied cost from
the manhour rate x KMH.
The residual proportion of the cost after subtracting the above is apportioned to Residential PSTN
Maintenance.
This base apportions costs to PG122M (Residential PSTN Maintenance) and PG989A (Special Fault
Investigation)
Data Source
Workmanager data, CID, Openreach Manhour Rate, Openreach Management Accounts.
PDTMXD
ALL Main Exchange Capital
Description
This base apportions the depreciation and capital costs of Main/Trunk Switches. The costs are recorded
in two Classes of Work (CoW).
MDX for System X switches.
NGS for Next Generation Switches.
The base also apportions the maintenance costs for Main/Trunk switches. These costs are recorded in
two classes of work.
DMS for System X Switches
NGSM for Next Generation Switches
Methodology
This is a Rule Type 3 attribution.
This methodology produces a combined base used for both MDX and NGS since the MDX assets are a
legacy technology that has been super-ceeded by the Modern Equivalent Asset of NGS.
Firstly, a fixed asset download is taken of both the MDX and NGS CoWs. The proportion of depreciation
relevant to Intelligent Access and Messaging is attributed to its own Plant Group PG254A (Main Digital
Exchange – Intelligent Access and Messaging) by identifying assets by policy code or asset descriptions.
These costs are apportioned using a bottom-up build engineering model that uses inputs of the NGS
capacities from the Switch Deployment Plan sourced from the Planning team. The model dimensions
each exchange in the most efficient way. The total cost is obtained for all the exchange units and the

Other bases
105
Base Ref OUC Descriptions (For all descriptions below, see Appendix A for Key Destinations)
model costs are assigned as to whether they relate to the three overall building blocks:
Digital Line Termination (DLT).
Processor.
Switch Block.
The relative proportions of these are used to determine the apportionment to the plant groups:
PG249C (Main Exchange DLT (Digital Line Termination))
PG255B (Main Exchange Switch Block)
PG257C (Main Exchange Processor)
Data Source/s
Bottom-up build engineering model that uses:
EXPRES (Exchange Planning and Review System) – Supplies the number of System X and Next
Generation Switches (NGS) units in service.
Network Recording System (NRS) – Supplies the fitted and working capacities of System X and
Next Generation Switches (NGS) units.
Switch Deployment Plan – Also contains evidence on the fitted capacity of working NGS units
together with dates of migration from System X to NGS.
Fixed Asset Register.
PDTNTE
21
ALL 21C Network Terminating Equipment
Description
This base apportions the historical cost Balance Sheet (ie gross book value and accumulated
depreciation) and historical cost Profit and Loss (P&L) (ie depreciation etc.) charges for 21c Network
Terminating Equipment.
This allocates 100% to PG867A 21C Ethernet NTE.
Methodology
This is a Rule Type 3 attribution.
This base apportions the cost and balance sheet for 21C Network Terminating Equipment.
PDTORS
FI
BL,
BV
Dropwire repair Overhead Cable
Description
This base apportions repair costs for drop wires.
Methodology
This is a Rule Type 3 attribution.
The allocation is based on the share of kilo man hours (KMH) spent on Time Related Charges (TRCs) and
Special Fault Investigation (SFI). The cost for these activities is derived by multiplying the manhour rate
x KMH for the above activities. The total cost for the CoW is obtained from CID and the proportion of
cost allocated to SFI and TRC is based on the implied cost from the manhour rate x KMH.
The residual proportion of the cost after subtracting the above will go to Residential PSTN
Maintenance.
This base apportions costs to:

Other bases
106
Base Ref OUC Descriptions (For all descriptions below, see Appendix A for Key Destinations)
PG122M (Residential PSTN Maintenance)
PG989A (Special Fault Investigation)
PG981R (Openreach Time Related Charges)
Data Source
Workmanager data, CID, Openreach Manhour Rate.
PDTRAR B Routing and Records Base - Openreach
Description
This base allocates the costs relating to the routing and records activity. This activity is the physical
verification of routings within the network, and records the time associated with the initial recording of
routing details on BT systems.
It also apportions Capital Planning Pay and Non Pay costs which are not directly related to the routing
and records activity.
Methodology
This is a Rule Type 3 attribution.
Bookings to the Class of Work (CoW) RAR (Routing and Records) consist of two elements.
The first element is the time booked that is directly related to the Routing and Routing activity, as
defined in the CoW description.
The second element, Capital Planning, is the time spent on activities that are outside of the CoW
description and allocated to Capital Programmes. This consists of bookings made by non-field units,
maintenance of records and planning indirects.
A survey/estimate is provided by the field operations manager for Routing and Records is used to split
the costs into the two elements. The proportion of cost proper to Routing and Records is allocated to
PG140A (Routing and Records).
The portion that relates to capital programme will be apportioned using the PDTDUCT base (to AG135
(Duct used by Access Cables) and AG148 (Duct used by Backhaul Cables)). This base is used because it
exhausts costs to Fibre capital plant groups which make use of the planning system that Routing &
Records activity uses.
Data Source/s
Survey/Estimate provided by Operations manager responsible for Routing & Records.
PDTSBSB
B
BV Broadband Boost
Description
This base apportions repair costs for Broadband Boost.
Methodology
This is a Rule Type 3 attribution.
This base allocates 100% to PG580B.
PDTSCN
M
TN Network Platform Support Contract Costs
Description
This base apportions the Profit and Loss (Other Payments) costs of technology vendor provided support
usually under fixed term support contracts.
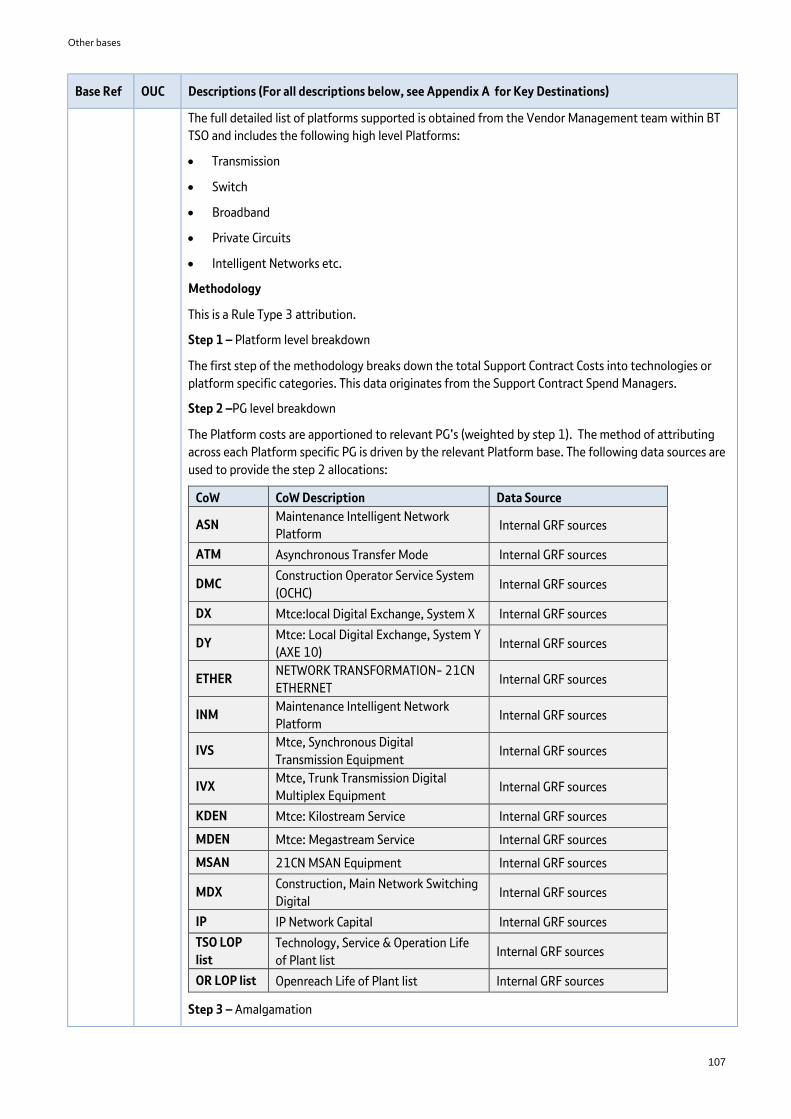
Other bases
107
Base Ref OUC Descriptions (For all descriptions below, see Appendix A for Key Destinations)
The full detailed list of platforms supported is obtained from the Vendor Management team within BT
TSO and includes the following high level Platforms:
Transmission
Switch
Broadband
Private Circuits
Intelligent Networks etc.
Methodology
This is a Rule Type 3 attribution.
Step 1 – Platform level breakdown
The first step of the methodology breaks down the total Support Contract Costs into technologies or
platform specific categories. This data originates from the Support Contract Spend Managers.
Step 2 –PG level breakdown
The Platform costs are apportioned to relevant PG’s (weighted by step 1). The method of attributing
across each Platform specific PG is driven by the relevant Platform base. The following data sources are
used to provide the step 2 allocations:
CoW CoW Description Data Source
ASN Maintenance Intelligent Network
Platform Internal GRF sources
ATM Asynchronous Transfer Mode Internal GRF sources
DMC Construction Operator Service System
(OCHC) Internal GRF sources
DX Mtce:local Digital Exchange, System X Internal GRF sources
DY Mtce: Local Digital Exchange, System Y
(AXE 10) Internal GRF sources
ETHER NETWORK TRANSFORMATION- 21CN
ETHERNET Internal GRF sources
INM Maintenance Intelligent Network
Platform Internal GRF sources
IVS Mtce, Synchronous Digital
Transmission Equipment Internal GRF sources
IVX Mtce, Trunk Transmission Digital
Multiplex Equipment Internal GRF sources
KDEN Mtce: Kilostream Service Internal GRF sources
MDEN Mtce: Megastream Service Internal GRF sources
MSAN 21CN MSAN Equipment Internal GRF sources
MDX Construction, Main Network Switching
Digital Internal GRF sources
IP IP Network Capital Internal GRF sources
TSO LOP
list
Technology, Service & Operation Life
of Plant list Internal GRF sources
OR LOP list Openreach Life of Plant list Internal GRF sources
Step 3 – Amalgamation

Other bases
108
Base Ref OUC Descriptions (For all descriptions below, see Appendix A for Key Destinations)
The PG level bases calculated in step2 are amalgamated back into a SCNM level base by utilising the
outputs from steps 1 and 2.
Data Source/s
Full year Platform level Contract Support costs (Provided by BT TSO), Platform specific bases, BT TSO &
OR Life of Plant list asynchronous.
PDTSDH ALL SDH (Synchronous Digital Hierarchy) Electronic Assets
Description
This base apportions the balance sheet and cost values for CoW SDH and maintenance costs on CoW IVS
(Maintenance, Synchronous Digital Transmission Equipment).
SDH represents newer electronic assets in the Transmission network. They complement the
transmission equipment capacity provided by the Plesiochronous Digital Hierarchy (PDH) assets – see
PDTCRD and PDTCRF.
IVS capture the corresponding maintenance costs incurred on SDH equipment.
SDH is subdivided into a number of asset policy codes, representing the different asset types within it.
The driver and destination for these policy codes does vary. SDH costs are mapped to bearer links,
which can either be STM1, STM4, STM16 or STM64, represented by a number of PGs.
Asset types
Asset types within SDH can be classified into a number of key categories:
Add Drop Muxes (ADMs) - Exchange and customer sited).
Cross Connects - (Routing equipment - Two main types-4/1 and 4/4).
Line systems.
International Backhaul equipment.
Other (Software, computer equipment, etc.).
Methodology
This is a Rule Type 3 attribution.
CTCS (Core Transmission Circuit costing System) generates a file listing all SDH equipment and the
number of factored hits by bearer type. Each bearer type is represented by a PG. The cost of equipment
is allocated to a number of bearer types based on usage and utilisation. Hits represent the number of
times a bearer interfaces with a piece of equipment. A factor is applied in order to ensure utilisation is
taken into account, for example an STM 4 (565Mbit/s) bearer would utilise an ADM, four times as
much as a STM 1(155Mbit/s) bearer.
The CTCS file details all SDH assets by bandwidth, eg ADMs are broken down by type - SMA1, SMA4
and SMA 16. BT’s initial calculations are at an asset policy level. Asset policy codes group assets into
broad categories which we can map to the asset types held in CTCS.
The value (Count of equipment * Price) of each equipment type, within a policy code, is used to weight
the factored hits. The hits are then grouped together, at an overall asset policy level. These hits are
then weighted by Period 6 depreciation from the Period 6 LoP list. This is derived from the fixed asset
register.
The costs are then apportioned to PGs representing the relevant bearer types.
Indirect costs are treated as overheads and are apportioned to PGs in proportion to the value of the
equipment already apportioned.

Other bases
109
Base Ref OUC Descriptions (For all descriptions below, see Appendix A for Key Destinations)
Diagram: SDH Electronic Assets PDTSDH Process
Data Source/s
Period 6 circuit data is used in CTCS to allocate year end costs, as this reflects an average position of
network utilisation over the year.
Period 6 LoP list.
SDH prices-Procurement/SDH cost model.
PDTSIGN
I
T, TT Signalling Equipment Capital Costs
Description
This base apportions the capital costs of Signalling equipment registered in the SIGNI classes of work
(CoW)
SIGNI equipment is associated with PSTN (Public Switched Telephone Network) Interconnect (Other
Licensed Operator) circuits and PSTN to Intelligent Network (IN) circuits.
The main assets are:
STP (Signalling Transfer Point) switches and Edge Link Monitors for Interconnect Circuits.
SPRs (Signalling Point Relay switches) and Core Link Monitors for PSTN to IN Circuits.
Methodology
This is a Rule Type 3 attribution.
The Fixed Asset Register records assets against distinct Asset Policy Codes (APCs) which reflect asset
function. This allows easy identification of depreciation costs by function and allows the calculation of
the relevant split to corresponding PGs. A summary of data from the Fixed Asset Register for the latest
available period is used for the base.
SIGN Signalling Transfer Point switches and SIGE Edge-link monitors costs are directly attributed
to PG228A (Signalling Transfer Point (STP) and Edge-link monitors).
SIGC Core-link monitors and SIGS Signalling Point Relay switches costs are directly attributed to
PG229A (Signalling Point Relay (SPR)and Core-link monitors).
Diagram: Signalling Equipment PDTSIGNI Apportionment Process.
PDTSDH_Diagram1

Other bases
110
Base Ref OUC Descriptions (For all descriptions below, see Appendix A for Key Destinations)
Data Source/s
LoP List data at the latest available period. Management believe this period to be reflective of the full
year.
PDTSYSX
D
ALL System X
Description
This base apportions cost and balance sheet for System X local exchange equipment.
Methodology
This is a Rule Type 3 attribution.
There are two fundamental building blocks of System X:
Concentrators.
Processors.
Each of these elements will relate to a specific PG. Therefore to create an apportionment base, we need
to separately identify and isolate each of these specific equipment elements.
Concentrators
Step 1 – Determine the Current Cost value of all the equipment elements of concentrators in the
network.
Obtain from the EXPRES (Exchange Planning and Review System) system data that details the line
types and the total number of lines fitted to each concentrator in the BT Network. This data is entered
into an engineering model which “dimensions” the number of equipment elements required to make
up that number of lines. The quantities of each equipment element are then multiplied by an
appropriate element cost to arrive at the total cost for each equipment element. The appropriate
element cost that the engineering model utilises is the Current Cost amounts for each type of
equipment element. These are obtained from the Price Element Scheduled (PES) items as part of the
LEMP (Local Exchange Modernisation Program). The figures that are used from this are the March
1995 figures. These figures are frozen as this equipment is no longer available for purchase.
Step 2 – Determine an estimate of the Current Cost depreciation value for the equipment building
blocks.
The current year’s asset life determinations are applied to the total Current Cost values of the
equipment identified in Step 1 to create a Current Cost depreciation charge for the year. Asset lives are

Other bases
111
Base Ref OUC Descriptions (For all descriptions below, see Appendix A for Key Destinations)
calculated and determined by the Wholesale Regulatory Finance each year. This is completed via a
review process undertaken by experts in this field. Where an individual building block does not have an
individual asset life set in this process, the equated life of the Class of Work (CoW) is applied.
Step 3 - Allocate the depreciation charge into call set-up, access and call duration categories using cost
drivers.
Using detailed information obtained from the switch manufacturer, which analyses how the different
equipment types within the switch are used to provide service, the total Current Cost depreciation
value for each type of equipment element is allocated to the following categories:
Call set-up.
Call duration.
Access.
Total Current Cost depreciation values under each of the three categories can then be calculated.
This step illustrates the reason for using Current Cost values to create the apportionment base for the
historical cost System X values. The manufacturer’s matrix is crucial in providing the link between the
F8 codes and the PGs that they are apportioned to. However the equipment elements in the
manufacturer’s matrix cannot be reconciled to asset policy codes that are based on historical cost
values. However the PES equipment elements compiled as part of the LEMP do reconcile to the
manufacturers matrix and these items are listed at modern asset equivalent values.
Step 4 – Apportion the Access category into more detailed access categories, which will be linked to
PGs in later stages.
The total Current Cost depreciation allocated to the category ‘access’ must be further split into the
following categories:
Public Switched Telephone Network (PSTN).
Integrated Services Digital Network (ISDN2).
ISDN30.
Payphones.
This apportionment is calculated based on the relative proportion of cost already identified in the
engineering model.
Step 5 – Create concentrator weighted base.
Using the Current Cost depreciation amounts calculated for the above-listed categories, create a
weighted base for concentrator kit.
The above steps are represented in the flowchart below:
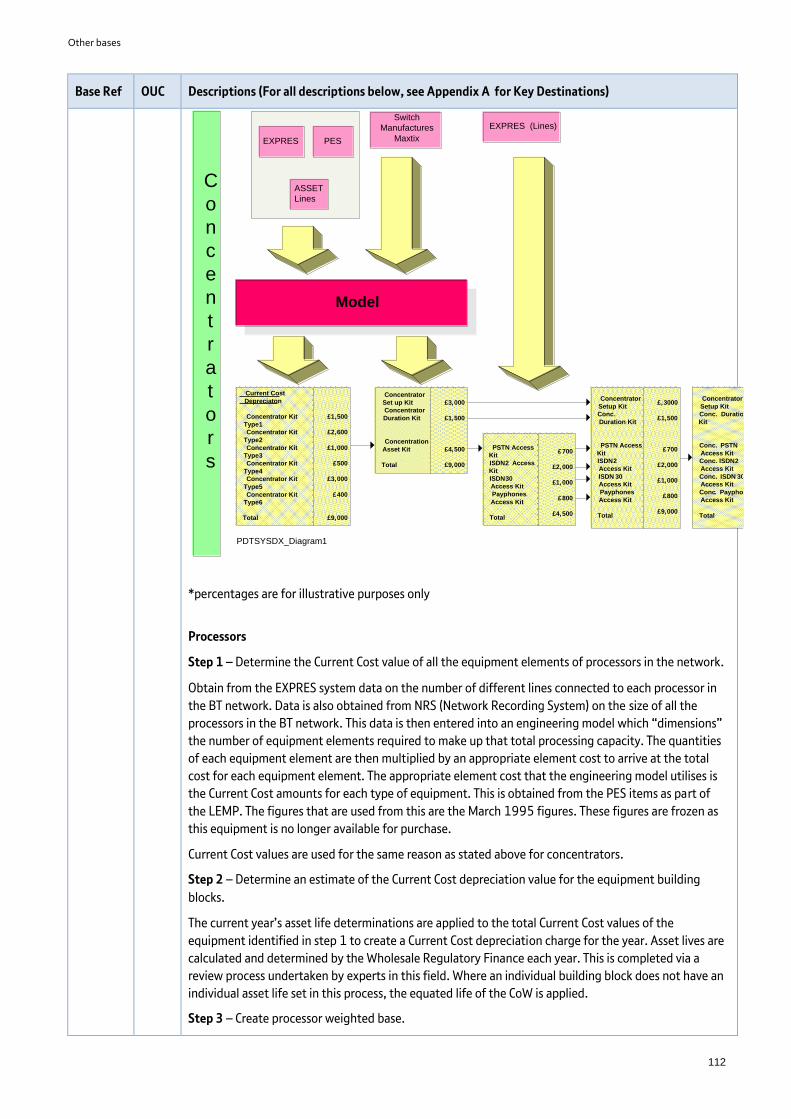
Other bases
112
Base Ref OUC Descriptions (For all descriptions below, see Appendix A for Key Destinations)
*percentages are for illustrative purposes only
Processors
Step 1 – Determine the Current Cost value of all the equipment elements of processors in the network.
Obtain from the EXPRES system data on the number of different lines connected to each processor in
the BT network. Data is also obtained from NRS (Network Recording System) on the size of all the
processors in the BT network. This data is then entered into an engineering model which “dimensions”
the number of equipment elements required to make up that total processing capacity. The quantities
of each equipment element are then multiplied by an appropriate element cost to arrive at the total
cost for each equipment element. The appropriate element cost that the engineering model utilises is
the Current Cost amounts for each type of equipment. This is obtained from the PES items as part of
the LEMP. The figures that are used from this are the March 1995 figures. These figures are frozen as
this equipment is no longer available for purchase.
Current Cost values are used for the same reason as stated above for concentrators.
Step 2 – Determine an estimate of the Current Cost depreciation value for the equipment building
blocks.
The current year’s asset life determinations are applied to the total Current Cost values of the
equipment identified in step 1 to create a Current Cost depreciation charge for the year. Asset lives are
calculated and determined by the Wholesale Regulatory Finance each year. This is completed via a
review process undertaken by experts in this field. Where an individual building block does not have an
individual asset life set in this process, the equated life of the CoW is applied.
Step 3 – Create processor weighted base.
C
o
n
c
e
n
t
r
a
t
o
r
s
EXPRES PES
ASSET
Lines
Model
Switch
Manufactures
Maxtix
EXPRES (Lines)
Current Cost
Depreciaton
Concentrator Kit
Type1
Concentrator Kit
Type2
Concentrator Kit
Type3
Concentrator Kit
Type4
Concentrator Kit
Type5
Concentrator Kit
Type6
Total
£1,500
£2,600
£1,000
£500
£3,000
£400
£9,000
Concentrator
Set up Kit
Concentrator
Duration Kit
Concentration
Asset Kit
Total
£3,000
£1,500
£4,500
£9,000
PSTN Access
Kit
ISDN2 Access
Kit
ISDN30
Access Kit
Payphones
Access Kit
Total
£700
£2,000
£1,000
£800
£4,500
Concentrator
Setup Kit
Conc.
Duration Kit
PSTN Access
Kit
ISDN2
Access Kit
ISDN 30
Access Kit
Payphones
Access Kit
Total
£,3000
£1,500
£700
£2,000
£1,000
£800
£9,000
Concentrator
Setup Kit
Conc. Duration
Kit
Conc. PSTN
Access Kit
Conc. ISDN2
Access Kit
Conc. ISDN 30
Access Kit
Conc. Payphones
Access Kit
Total
33%
17%
8%
22%
11%
9%
100%
PDTSYSDX_Diagram1

Other bases
113
Base Ref OUC Descriptions (For all descriptions below, see Appendix A for Key Destinations)
Using the Current Cost depreciation values calculated for the above-listed categories, create a
weighted base for processor kit.
The above steps are represented in the flowchart below:
* percentages are for illustrative purposes only
Apportionment to PGs
We now have two sets of apportionment data with the concentrator apportionments add up to 100%
and the processor apportionments also add up to 100%. The next step in the process is to weight the
concentrator and processor apportionments This base uses modern equivalent asset depreciation
values to create the weighting from within the model.
Step 1 – Total the modern equivalent asset depreciation charges for System X equipment.
From the calculations above, the total of the modern equivalent asset depreciation charges for
processor equipment is calculated. The total of the modern equivalent asset depreciation values for
concentrator equipment is also calculated.
Step 2 – Create weighted base for apportionment percentages.
Using the relative proportions between processors and concentrators derived from the previous step,
the apportionments calculated for processors and concentrators can be weighted.
The above steps can be represented in the flowchart below:
EXPRES PES
ASSET
Lines
Model
Switch
Manufactures
Maxtrix
Current Cost
Depreciaton
Processor Kit Type 1
Processor Kit Type 2
Processor Kit Type 3
Processor Kit Type 4
Processor Kit Type 5
Total
£500
£300
£600
£100
£1,000
£2,500
Digial Line
Termination
Switch Block
Processor end
signalling
Total
£xDigital Line
Termination
Switch Block
Processor and
SignallingTotal 100%
P
r
o
c
e
s
s
o
r
s
SIT
PDTSYSDX_Diagram2
£y
£z
£x,y,z
X%
Y%
Z%

Other bases
114
Base Ref OUC Descriptions (For all descriptions below, see Appendix A for Key Destinations)
*percentages are for illustrative purposes only
Step 3 – Apportion amounts to PGs.
These apportionments are applied to the following PGs based on an analysis of the most appropriate fit
for the building blocks. These are then applied to the historical cost Balance Sheet (ie GBV and
accumulated depreciation) and historical cost Profit and Loss (ie depreciation etc.) charges for System X
local exchange equipment. The PGs that the apportionments point to are as follows:
This is represented in the flowchart below:
LOP
B
a
s
e
R
e
f
e
r
e
n
c
e
%
s
c %
d %
e %
f %
g %
h%
100%
Concentrator Set up Kit
Concentrator Duration Kit
Concentrator PSTN
Access Kit
Concentrator ISDN2
Access Kit
Concentrator ISDN30
Access Kit
Concentrator PayphonesAccess Kit
Total
Concentrator Set up Kit
Concentrator Duration Kit
Concentrator PSTN
Access Kit
Concentrator ISDN2
Access Kit
Concentrator ISDN30
Access Kit
Concentrator Payphones
Access Kit
Total
c1%
d1%
e1%
f1%
g1%
h1%
80%
Digital Line Termination
Processor & Signalling
Total
20%
40%
Digital Line Termination
Processor & Signalling
Total
5.6 %
11%
20%
Processor Dep’n
Concentrator
Dep’n
£2,000
£10,000
Processor Dep’nConcentrator
Dep’n
x %
y %
PDTSYSDX_Diagram3
Switch Block 40%
100%
Switch Block 11%
Category
PDTSYSXD_Diagram5
Plant Group
System X Concentrator Call set-up PG288A
System X Concentrator Call duration PG289A
PSTN Linecards PG127A
ISDN2 Linecards PG128A
ISDN30 Capital PG124A
Payphones Linecards PG120A
System X DLE Processor and Signalling Capital PG285C
System X DLE Processor Capital PG286C
System X DLE Switch Block PG287A

Other bases
115
Base Ref OUC Descriptions (For all descriptions below, see Appendix A for Key Destinations)
Data Source/s
EXPRES (Exchange Planning and Review System).
LEMP (Local Exchange Modernisation Program) Contract - The figures that are used from this are the
March 1995 figures. These figures are frozen as this equipment is no longer available for purchase.
PDTIVX ALL
Costs - Transmission Repair and Control on Trunk and Junction Transmission equipment
Description
This base apportions management pay costs of maintenance and repair works carried out on Trunk and
Junction transmission equipment. This refers to the supervision of maintenance work carried out on the
link sections of optical fibre cables which form part of the Core Network (also known as Core networks)
and Private Circuits using the Plesiochronous Digital Hierarchy (PDH) technology (see Plant Group (PG)
Overview on descriptions of Core Transmission Bearers).
These costs flow into the classes of work (CoW) TCR (Transmission Control and Repair) which relate to
PGs representing bearers in the core network.
Methodology
This is a Rule Type 3 attribution.
Costs are attributed to PDH PGs based on the number of PDH Line Systems and PDH Multiplexors
supporting the different PDH bandwidths.
Data Source/s
Period 6 circuit data is used in Core Transmission Circuit costing System.
PDTTPW
C
ALL Costs – Core Microwave Radio Transmission Equipment
Description
This base apportions balance sheet items and costs related to core microwave radio transmission
equipment, classes of work (CoW) TPWC. Unlike cable transmission, radio only utilises link related
equipment. Examples of this equipment are antennas, masts and radio electronics.
Methodology

Other bases
116
Base Ref OUC Descriptions (For all descriptions below, see Appendix A for Key Destinations)
This is a Rule Type 3 attribution.
Costs are apportioned over the different bandwidth bearers based on an analysis of radio bearers in the
core transmission network which is derived from the CTCS database. CTCS shows the relationship
between equipment types and the bearers they support. The depreciation costs of radio equipment can
be apportioned to radio bearers based on the bearers' usage of this equipment. Usage is measured as
the number of times a certain type of bearer “hits” the equipment in the network.
A usage factor is applied to these hits to get ‘factored hits’. The usage factor is used as for bearers on
fibre cable, eg a 140 Mbit/s radio bearer can support 64 x 2 Mbit/s circuits, and so the usage factor is
1/64.
Data Source/s
Period 6 CTCS data on factored bearer hits on each radio system type. Management believes this to be
reflective of the full year.
PDTUDL BV Distribution Side Copper Repair
Description
This base apportions repair costs for drop wires.
Methodology
This is a Rule Type 3 attribution.
The allocation is based on the share of kilo man hours (KMH) spent on Time Related Charges (TRCs) and
Special Fault Investigation (SFI). The cost for these activities is derived by multiplying the manhour rate
x KMH for the above activities.
The total cost for the CoW is obtained from CID and the proportion of cost allocated to SFI and TRC is
based on the implied cost from the manhour rate x KMH.
The residual proportion of the cost after subtracting the above will go to D-Side Copper Current.
This base allocates costs to PG118M (D-Side Copper Current), PG981R (Openreach Time Related
Charges) and PG989A (Special Fault Investigation).
Data Source
Workmanager data, CID, Openreach Manhour Rate.
PDTUEL BV Exchange Side Copper Repair
Description
This base apportions repair costs for drop wires.
Methodology
This is a Rule Type 3 attribution.
PDTTPWC_Diagram1

Other bases
117
Base Ref OUC Descriptions (For all descriptions below, see Appendix A for Key Destinations)
The allocation is based on the share of kilo man hours (KMH) spent on Special Fault Investigation (SFI).
The cost for this activity is derived by multiplying the manhour rate x KMH for SFI.
The total cost for the CoW is obtained from CID and the proportion of cost allocated to SFI is based on
the implied cost from the manhour rate x KMH.
The residual proportion of the cost after subtracting the above will go to E-Side Copper Current.
This base apportions costs to: PG118M (E-Side Copper Current) and PG989A (Special Fault
Investigation).
Data Source
Workmanager data, CID, Openreach Manhour Rate.
PDTURS
FI
BV Dropwire repair Underground Cable
Description
This base apportions repair costs for drop wires.
Methodology
This is a Rule Type 3 attribution.
The allocation is based on the share of kilo man hours (KMH) spent on Special Fault Investigation (SFI).
The cost for this activity is derived by multiplying the manhour rate x KMH for SFI.
The total cost for the CoW is obtained from CID and the proportion of cost allocated to SFI is based on
the implied cost from the manhour rate x KMH.
The residual proportion of the cost after subtracting the above will go to Residential PSTN
Maintenance.
This base apportions costs to: PG122M (Residential PSTN Maintenance) and PG989A (Special Fault
Investigation).
Data Source
Workmanager data, CID, Openreach Manhour Rate.
PDTWD
M21
ALL Wavelength Division Multiplexor transmission equipment used in 21CN (Ciena)
Description
This base apportions cost and balance sheet for the transmission equipment of the WDMSAN chains,
the METRO – CORE and CORE – CORE transmission electronic equipment, to Plant Groups (PGs).
BT’s strategic equipment suppliers for 21CN have been chosen across each of five (access, metro, core,
i-nodes and transmissions) strategic domains. Ciena is one of these suppliers.
The recipients are:
PG866A Core-Core Link
PG865A Core-Core Length
PG868A Core-Core WBMC Dedicated
PG886A Metro-Core Link
PG885A Metro-Core Length
PG899A WDM-Metro Link
PG900A WDM-Metro Length

Other bases
118
Base Ref OUC Descriptions (For all descriptions below, see Appendix A for Key Destinations)
Methodology
This is a Rule Type 3 attribution.
The WDM equipment contains functionality for the transport of connectivity, voice and broadband
services over the WDM chains and the METRO/CORE layer nodes.
The latest 21CN business case model is analysed into the categories, for which we have assigned PGs,
for 21CN assets. The business case provides estimates of capital spend on a year by year basis, from
which the annual depreciation for each network element is calculated and reconciled back to the LoP
list at P12. The depreciation charge is calculated over the asset life of the network element. Each
network element is mapped to a PG with the total depreciation charge relating to that PG driving the
apportionment within the base.
Data Source/s
CAPEX analysis from BT Technology, Service & Operations (BT TSO), LOPLIST (Asset Life).
PENOFF E Share Benefit Cost Offset
Description
This base apportions the Profit and Loss (P&L) costs (current ETG Pay etc.) associated with the Share
Option Schemes and represents the “discount” offered as part of the scheme.
Methodology
This is a Rule Type 3 attribution.
This cost is charged to Lines of Business (LoB), with the corresponding credit going to OUC E. The Pan
Divisional balance is therefore zero. The PENOFF base is designed to ensure that the Products, Plant
Groups (PGs) and Level 1 Activity Groups (AGs) also total zero.
The base is created by using a download from the relevant GL code ie 19299000 (Share Benefit Costs)
and apportioning the credit in OUC E to match the cost in the other divisions. The result is that the
credit and the cost have a net impact of nil on regulated markets.
Example:
This base apportions costs to P008 (Retail – Other) and PG252B (Openreach Residual Elimination)
Data Source/s
Download from REFINE on F8 code 109152.
REDUND ALL Balance Sheet – Redundancy Creditor Accruals
Prod/ PG etc
Value
109152 A P123 10
109152 A PG345a 10
109152 B P123 20
109152 B PG345a 10
Total 70
109152 E PG345a -20
Total -70
F8 Code OUC Product/Plant Group etc
109152 B AG678 20
109152 E P123 -30
109152 E AG678 -20
Product
PerspectiveTotal 0
PENOFF_Diagram1

Other bases
119
Base Ref OUC Descriptions (For all descriptions below, see Appendix A for Key Destinations)
Description
This base is used to apportion redundancy creditor accruals in the Balance Sheet.
Methodology
The attribution is a system generated allocation that is used as a Rule Type 4 and Rule Type 12. This
attribution apportions the accruals in proportion to previously attributed redundancy and NewStart
pay costs.
Diagram: a worked example of how the system generates this attribution
In this example there are three relevant F8 codes and they have already been attributed to activity
groups, plant groups and Retail Residual as shown in the table.
The system sums up the apportionment of these relevant F8 codes and apportions costs and assets in
proportion to the total previously allocated redundancy and NewStart pay costs.
This attribution rule can be used as a:
Rule Type 4 - calculated using only F8 codes in the same LoB, or
Rule Type 12 - using relevant F8 codes in all of BT.
SLGETH BL Service Level Guarantee scheme (SLG) – Ethernet
Description
This base apportions revenue and costs associated with Service Level Guarantee compensation
payments for provision and repair failures associated with Ethernet Products.
The Service Level Guarantee scheme (SLG) pays compensation to customers if Openreach fails to meet
agreed timescales for Provision or Repair activities.
Methodology
This is a Rule Type 3 attribution.
Costs for SLGs are held in the F8 Codes:
Internal Costs - F8 293753.
External Costs - F8 209280.
A percentage split between provision and repair activities is calculated using volume data from Orbit
and the costs are then mapped in accordance with this split to the PGs:
PG573B (OR Service Centre - Provision Ethernet)
PG578B (OR Service Centre - Assurance Ethernet)
Data Source/s
Data is produced from our tactical production files and from service flow” The majority of these are fed
F8 code: C ode 1 C ode 2 C ode 3
C os t Type:R edunda ncy
a nd Pa y
R edunda ncy
a nd Pa y
R edunda ncy
a nd Pa y AttributionAttribuion R ule: R ule Type1 R ule Type 3 R ule Type 3 Total
D es tinations
Ac tivity G roup 1 £100 £100 £100 £300 30%
P lant G roup 1 £200 £200 20%
P lant G roup 2 £100 £100 10%
R etail R es idual £200 £200 £400 40%
T otal £100 £600 £300 £1,000 100%

Other bases
120
Base Ref OUC Descriptions (For all descriptions below, see Appendix A for Key Destinations)
from Orbit.
SLGWLR BV Service Level Guarantee scheme (SLG) – WLR
Description
This base apportions revenue and costs associated with Service Level Guarantee compensation
payments for provision and repair failures associated with WLR Products.
The Service Level Guarantee scheme (SLG) pays compensation to customers if Openreach fails to meet
agreed timescales for Provision or Repair activities.
Methodology
This is a Rule Type 3 attribution.
Costs for SLGs are held in the F8 Codes:
Internal Costs F8 293752.
External Costs F8 209260.
A percentage split between provision and repair activities is calculated using volume data from Orbit
and the costs are then allocated in accordance with this split to the PGs:
PG570B (OR Service Centre - Provision WLR).
PG575B (OR Service Centre - Assurance WLR).
Data Source/s
Data is produced from our tactical production files and from service flow” The majority of these are fed
from Orbit.
SOFTCAP All B
OUCs
Software Capitalisation Entries
Description
The SOFTCAP base apportions software capitalisation entries on the Profit and Loss and Balance Sheet
relating to Openreach OUCs.
Methodology
This is a Rule Type 3 attribution.
SOFTCAP for Openreach uses the same methodology as the Openreach Development base. Data from
Openreach shows how the development costs should be allocated by product which is translated into
the relevant Plant Group.
For the SOFTCAP base Openreach tells us out of each of the projects what percentage will be
capitalised. This will be very similar to the development base but with subtle differences. This data
enables us to map costs to key areas, for example NGA, Management Centres etc. For costs identified
as non-specific, an Openreach pay / fixed asset weighted base is derived from REFINE and applied. For
the Fixed Asset base these figures will be weighted by the Cost of Capital and then used in conjunction
with the Pay base.
This base apportions costs primarily to AG408 (Openreach Fixed Asset Driver) and also to various PGs.
Data Source/s
LoB (Line of Business) development base.
Openreach development project data.
Capital Expenditure details (cumulative total) - supplied by LoB finance analysts.

Other bases
121
Base Ref OUC Descriptions (For all descriptions below, see Appendix A for Key Destinations)
REFINE P12 Organisational Unit Code (OUC) pay & fixed asset downloads.
SOFTCAP All H
OUCs
Software Capitalisation Entries
Description
The SOFTCAP base apportions software capitalisation entries on the Profit and Loss and Balance Sheet
relating to Retail OUCs.
Methodology
This is a Rule Type 3 attribution.
SOFTCAP uses the current year software capitalisation costs. These costs are provided by Consumer
Finance with appropriate treatments (eg Billing base, Customer Service base, Overhead, etc.) and by
Product for Broadband, and those are used to produce the final base.
This base apportions costs primarily to P006 (Retail – Calls Lines & Circuits) and also to various PGs.
Data Source/s
Capital Expenditure details (cumulative total) - supplied by LoB finance analysts.
REFINE P9 Organisational Unit Code (OUC) revenue downloads.
SOFTCAP C Software Capitalisation Entries
Description
The SOFTCAP base apportions software capitalisation entries on the Profit and Loss and Balance Sheet
relating to Group Organisational Unit Codes (OUCs).
Methodology
This is a Rule Type 3 attribution.
SOFTCAP uses the current year software capitalisation costs.
The capitalisation costs for OUC C are allocated 100% to AG112 (Corporate costs).
SOFTCAP K Software Capitalisation Entries
Description
The SOFTCAP base apportions software capitalisation entries on the Profit and Loss and Balance Sheet
relating to Wholesale Organisational Unit Codes (OUCs).
Methodology
This is a Rule Type 3 attribution.
SOFTCAP for BT Wholesale uses the same analysis as the except T development bases. The BT
Wholesale element analyses the BT TSO development billing data specific to BT Wholesale. For the
SOFTCAP element all the BT Wholesale billing data is used with the exception of Applications Support &
Maintenance and Overheads as both of these costs do not get capitalised by BT Wholesale.
The analysis of the billing data identifies the business case entries and maps these to the relevant SG&A
Plant Group. Where there is no specific information for any Business case line, then this allocation will
follow an OUC K Fixed Asset / Pay weighted base derived from REFINE. For the Fixed Asset base these
figures will be weighted by the Cost of Capital and then used in conjunction with the Pay base.
This base apportions costs to AG406 (Wholesale Pay Driver) and to various PGs.
Data Source/s

Other bases
122
Base Ref OUC Descriptions (For all descriptions below, see Appendix A for Key Destinations)
LoB (Line of Business) development base.
BT TSO Development billing data P12.
REFINE P12 Organisational Unit Code (OUC) pay and fixed asset downloads.
SOFTDEP All B
OUCs
Software Depreciation
Description
The SOFTDEP base apportions software depreciation costs. Profit and Loss and Balance Sheet (Fixed
Asset Accumulated Depreciation) relating to Openreach Organisational Unit Codes (OUCs).
Methodology
This is a Rule Type 3 attribution.
SOFTDEP uses the current year’s depreciation figures extracted from the fixed asset register for
Openreach and for Classes of Work COMPG (Externally purchased software) and COMPS (Internally
developed software).
Each line contains entries that can, for the majority, be mapped to a product range using Current Year
depreciation to provide the allocation. Where necessary a further allocation to Plant Groups is required
for example Duct or Service Management Centre entries from the FAR etc then the LoB Development
sub base is used. Where non- specific entries are identified from the FAR then an REFINE Fixed
Asset/Pay weighted base is built for Openreach and used to allocate to PG’s. For the Fixed Asset base
these figures will be weighted by the Cost of Capital and then used in conjunction with the Pay base.
This base apportions costs to various AGs and PGs, primarily PG772A (Openreach Systems and
Development (Product Specific)), AG410 (Openreach Pay plus Return on Fixed Asset driver) and
PG197A (FTTC Service Delivery & Development).
Data Source/s
LoB (Line of Business) development base.
Fixed Asset Register software data for Period 12. Management believe this period to be reflective of
the full year.
REFINE P12 Organisational Unit Code (OUC) pay & fixed asset downloads.
SOFTDEP All K
OUCs
Software Depreciation
Description
The SOFTDEP base apportions software depreciation costs. Profit and Loss and Balance Sheet (Fixed
Asset Accumulated Depreciation) relating to BT Wholesale Organisational Unit Codes (OUCs).
Methodology
This is a Rule Type 3 attribution.
SOFTDEP uses the current year’s depreciation figures extracted from the fixed asset register for BT
Wholesale and for Classes of Work COMPG (Externally purchased software) and COMPS (Internally
developed software).
Each line contains entries that can, for the majority be mapped to a product range. Using Current Year
depreciation to provide the allocation. Where necessary a further allocation to Plant Groups is required
for example 21CN entries from the FAR etc then the LoB Development sub base is used. Where non-
specific entries are identified from the FAR then an REFINE Fixed Asset/Pay weighted base is built for
BT Wholesale and used to allocate to PG’s. For the Fixed Asset base these figures will be weighted by
the Cost of Capital and then used in conjunction with the Pay base.

Other bases
123
Base Ref OUC Descriptions (For all descriptions below, see Appendix A for Key Destinations)
This base apportions costs to AG409 (Wholesale Pay plus Return on Fixed Asset driver) and various PGs.
Data Source/s
LoB (Line of Business) development base.
Fixed Asset Register software data for Period 12. Management believe this period to be reflective of
the full year.
REFINE P12 Organisational Unit Code (OUC) pay & fixed asset downloads.
SOFTDEP C Software Depreciation
Description
The SOFTDEP base apportions software depreciation costs. Profit and Loss and Balance Sheet (Fixed
Asset Accumulated Depreciation) Group Organisational Unit Code C (OUCs).
Methodology
This is a Rule Type 3 attribution.
SOFTDEP uses the current year’s depreciation figures.
This base apportions costs 100% to AG112 (Corporate costs).
TOTPAY ALL
Core
OUCs
Employee-related Receivables and Creditors, Pay Related Group Adjustments and Other Provisions
Description
This base is used to apportion employee-related Receivables and creditors, pay related group
adjustments and other provisions.
Methodology
The attribution is a system generated allocation that is used as a Rule Type 12. The attribution
apportions costs and assets in proportion to previously allocated F8 codes of the cost types: Current
Pay and Capitalised Pay (using relevant F8 codes in all of BT).
Diagram: a worked example of how the system generates this attribution
In this example there are three relevant F8 codes and they have already been attributed to activity
groups, plant groups and Retail Residual as shown in the table.
The system sums up the apportionment of these relevant F8 codes and apportions costs and assets in
proportion to the total previously allocated pay costs.
F8 code: C ode 1 C ode 2 C ode 3
C os t Type: C a pitla lis ed Pa y C urrent Pa y C urrent Pa y Attribution
Attribuion R ule: R ule Type1 R ule Type 3 E xception Total
D es tinations
Ac tivity G roup 1 £100 £100 £100 £300 30%
P lant G roup 1 £200 £200 20%
P lant G roup 2 £100 £100 10%
R etail R es idual £200 £200 £400 40%
T otal £100 £600 £300 £1,000 100%
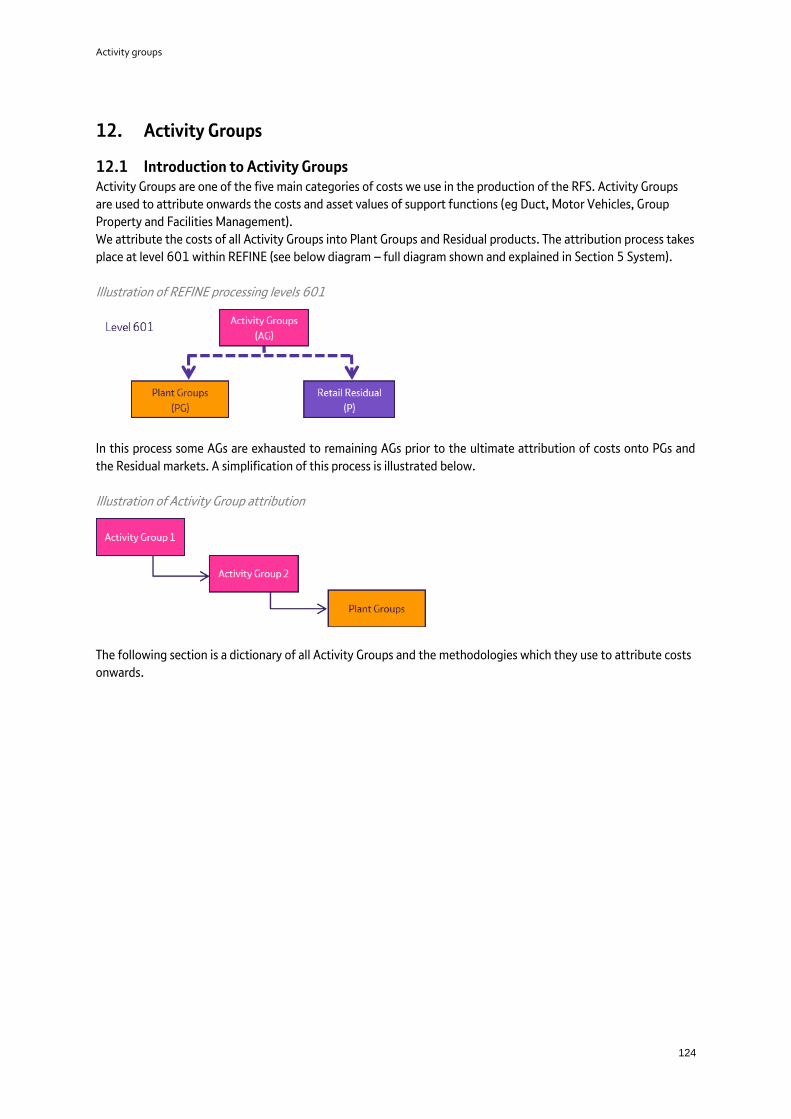
Activity groups
124
12. Activity Groups
12.1 Introduction to Activity Groups Activity Groups are one of the five main categories of costs we use in the production of the RFS. Activity Groups
are used to attribute onwards the costs and asset values of support functions (eg Duct, Motor Vehicles, Group
Property and Facilities Management).
We attribute the costs of all Activity Groups into Plant Groups and Residual products. The attribution process takes
place at level 601 within REFINE (see below diagram – full diagram shown and explained in Section 5 System).
Illustration of REFINE processing levels 601
In this process some AGs are exhausted to remaining AGs prior to the ultimate attribution of costs onto PGs and
the Residual markets. A simplification of this process is illustrated below.
Illustration of Activity Group attribution
The following section is a dictionary of all Activity Groups and the methodologies which they use to attribute costs
onwards.

Activity groups
125
12.2 Activity Group dictionary
Base Ref Detailed Description (For all descriptions below, see Appendix A for Key Destinations)
AG101 Motor Transport
Description
BT Fleet Management (within BT Group) provides motor vehicles, and associated products and services, to
employees within BT. The group recovers its cost by charging other BT units for its activities at commercial rates. It
does this by maintaining records of the units 'owning' the expenditure and can recover the costs using internal
transactions.
Methodology
This is a system generated AG.
Since the activity of this AG relates to the provision of motor vehicles and associated services to the whole of BT,
F8 codes which directly relate to this activity should be apportioned directly to this AG. This base performs this
process by creating a direct allocation to AG101 for these F8 codes.
The apportionment of Motor Transport costs is made using an analysis of the activity of units receiving the transfer
charge from BT Fleet Management. The internal billing systems used by the Fleet Management Unit hold details of
every vehicle, the cost and the ‘owner’ (Organisational Unit Code - OUC) of the vehicle. This system, therefore,
enables internal charges to be generated to the other BT units. The internal charges are all at commercial rates.
It follows that the activities of the units being charged, weighted by the amounts each are being charged by Fleet
Management, provide an appropriate base to apply to the costs that have been allocated to AG101.
This result is produced automatically by the Regulatory Accounting system using the apportionment of the
‘transfer out’ (F8 code 28xxxx) charges in Motor Transport and apportioning on the same basis. This is appropriate
as the underlying recharges are based on the activities of the units receiving the charges.
The ‘DTNHQ’ base allocates the corresponding ‘transfer in’ (F8 code 24xxxx) charge. The net impact of transfer
charges on the regulated markets is nil as the transfer charge in and out net to zero.
AG102 BT TSO Operational Costs
Description
AG102 is used to apportion BT TSO’s common network management costs and balance sheet values, which cannot
be allocated directly to individual Lines of Business (LoBs). F8 codes which directly relate to these activities are
allocated to this AG.
Apportionment
This is a system generated AG.
The REFINE system uses the following values to generate an apportionment allocation:
Net book value of Core fixed assets, excluding the following fixed asset classes: Copper; Duct, Fibre; Land and
Buildings; Vehicles; Office Machines; and Materials Awaiting Installation. These asset classes are excluded
because a separate attribution methodology exists for them.
REFINE identifies the destinations (eg PGs or retail products) which the core fixed asset costs relate to and
attributes the costs in this AG to the same destinations, in proportion to the already attributed core fixed asset
costs. This apportionment best represents the use of the common network management costs and assets across
the business.
The apportionment base is then applied to the amounts contained within AG102.

Activity groups
126
Base Ref Detailed Description (For all descriptions below, see Appendix A for Key Destinations)
AG103 BT TSO Support Functions
Description
AG103 is used to apportion BT TSO’s overall support functions costs and balance sheets values, such as the BT TSO
Finance team, Human Resources function and BT TSO Strategy function. F8 codes which directly relate to these
activities are allocated to this AG.
Apportionment
This is a system generated AG which generates its apportionment based on direct pay and return on assets which
BT TSO directly manages.
The costs allocated to AG103 relate to BT TSO’s overall support function expenses, eg The Finance function,
Human Resources function and the TSO Strategy team. The purpose of these TSO support function activities is
generally seen as being two-fold:
Management of the employees within BT TSO.
Management of those assets managed by BT TSO to create a return.
The REFINE system uses the following costs to generate an apportionment allocation:
Salary expenses for BT TSO (current and capital account)
Net book value of Core fixed assets, excluding the following fixed asset classes: Copper; Fibre; Land and
Buildings; Vehicles; Office Machines; and Materials Awaiting Installation.
The AG103 base draws on the result of the previously attributed pay costs within the REFINE system following the
base reference stage.
The ‘return on assets’ percentage is then applied to the net book value of each of the fixed asset class identified by
the Regulatory Accounting system. Certain fixed asset classes are specifically excluded (as described above). The
return on assets percentage is determined by Ofcom. This is applied to ensure that the driver reflects the BT TSO
support function activities of “managing those assets BT TSO manages”.
By weighting the previously attributed pay costs together with the fixed asset values (taking into account the fact
that the asset amounts have already had the return on assets and investment percentages applied to them) an
apportionment base for AG103 is derived.
AG106 Group Property and Facilities Management
Description
This activity group includes the costs of the Group Property and Facilities management as described under OUC W
and F in Section 10 OUC Driven Bases.
Group Property recovers its costs from the Lines of Business (LoBs) for the occupancy of space (including facilities
management) and use of electricity on a building by building basis. It does so by maintaining records of the costs of
running each building and the use by LOBs of floor space in each building.
Empty space in operational buildings is charged to Openreach. This is because the high costs and the disruption to
services that would be incurred in moving cable chambers and main distribution frames prevents us from reducing
the size of the operational building portfolio. Empty space in office buildings is not recharged to the LoBs but the
costs are included in AG106.
Methodology
This activity group is a system generated base that attributes the costs in proportion to the way that the Group
Property transfers have been apportioned. The process for achieving this is as follows:

Activity groups
127
Base Ref Detailed Description (For all descriptions below, see Appendix A for Key Destinations)
1. The amount paid by each LoB for each of Group Property’s services (known as the Transfer In) is
apportioned to activity groups, plant groups and retail product based on a number of different rules that
reflect how that LoB uses the specific service provided by Group Property.
2. The amount received by Group Property (reported as a credit to costs and known as the Transfer Out) is
attributed using a Rule Type 28 which attributes the costs in proportion to the Transfers In, for the same
trade, such that the two net to nil in each activity group, plant group and in Retail Residual. Rule Type 28
and our transfer charge methodology are explained further in Section 15 Transfer Charges.
3. The system then apportions all costs and assets in AG106 in proportion to how the transfer outs have
been apportioned.
In using this process Transfer Ins and Transfers Out net off to nil but we are able to use the information on how
each LoB uses the each of these services in attributing the underlying costs and assets in AG106.
The methods for attribution for each of the main LOBs are shown below.
BT TSO (OUC T)
The Trade In for use of operational space in our exchanges is attributed using detailed analysis of the floor space
requirements of their equipment, described further under bases DTNASBT and DTNASTR
The Trade In for use of operational electricity and power costs are attributed using detailed analysis of the power
requirements for their equipment, described further under base DTNELSP.
The Trade In for use of office space and electricity costs are attributed to AG102 (BT TSO Operation Costs), this is
explained further under base OPGENACC.
The Trade In for use of Data Centre space and electricity costs are attributed in proportion to the pay costs of the
LoB that uses the data centres, explained further under base OPGENACC.
Openreach (OUC B)
The Trade In for use of operational space in our exchanges is attributed based on a detailed analysis of the Group
Property bill which show the floor space for which Openreach are responsible (described further under bases
DTNASBT and DTNASTR)
The Trade In for use of operational electricity and power costs are attributed based on a detailed analysis of the BT
Group Property bill which shows the areas for which Openreach are responsible (described further under base
DTNELSP)
The Trade In for use of office space is attributed to AG401 (Costs attributed in proportion to Openreach pay)
BT Business (OUC H) – The Trade In for use of office space is apportioned primarily to downstream Retail Residual
products.
BT Consumer (OUC S) - The Trade In for use of office space is apportioned primarily to downstream Retail Residual
products.
BT Global Services (OUC J) - The Trade In for use of office space is apportioned primarily to downstream Retail
Residual products.
BT Wholesale (OUC K) - The Trade In for use of office Space is apportioned to Plant Groups based on the previously
apportioned BT Wholesale pay.
BT Group (OUC C) - The Trade In for use of office space is allocated to AG112 (Corporate Costs).
BT Fleet (OUC Y3) – The Trade In for use of garages, workshops and office space are attributed to AG101 (Motor
Transport)

Activity groups
128
Base Ref Detailed Description (For all descriptions below, see Appendix A for Key Destinations)
AG112 Corporate Costs
Description
AG112 is used to apportion head office type costs and balance sheet values such as the Chairman’s office and the
Group secretariat. F8 codes which directly relate to these activities are allocated to this AG.
Methodology
This is a system generated AG, its apportionment is based on factorised current salary and capital salary costs plus a
return on assets.
The costs allocated to AG112 relate to head office type expenses eg the Chairman’s office and the Group
secretariat. The purpose of these head office activities is generally seen as being two-fold:
Management of the employees within the company.
Management of the assets of the company to create a return.
The base to apportion these costs must reflect these activities if it is to reflect cost causality.
The REFINE system is given instruction to take the following costs to generate an apportionment allocation:
Factorised salary expenses for the whole of BT (current and capital account).
Net book value of fixed assets revalued for current cost accounting (CCA) for the whole of BT.
The AG112 base draws on the result of the previously attributed pay costs within the REFINE system following the
base reference stage.
The ‘return on assets’ percentage is then applied to the CCA net book value of each fixed asset class identified by
the Regulatory Accounting system. This percentage is determined by Ofcom. This is applied to ensure that the
driver reflects the corporate activities of ‘managing the assets of the company to create a return’.
By weighting the previously attributed pay costs together with the CCA fixed asset values (taking into account the
fact that the asset amounts have already had the return on assets and investments percentages applied to them)
an apportionment base for AG112 is derived.
The final base apportionment excludes subsidiaries and associates as these are overseas activities and the AG112
costs are being attributed solely to UK activities.
This is illustrated in the following diagram:

Activity groups
129
Base Ref Detailed Description (For all descriptions below, see Appendix A for Key Destinations)
This apportionment base can then be applied to the amounts contained within AG112:
AG113 Liquid Funds and Interest
Description
The AG113 Activity Group apportions all liquid fund transactions, defined as Net Short-term Interest Payable
(Profit and Loss) and Short-term Cash, Short-term Investments (both internal and third party), and Short-term
Borrowings.
Methodology
This is a system generated AG.
The apportionment is driven by cash costs, which are defined for these purposes as total current account costs and
capital account expenditure.
We attribute costs from AG113 to other activity groups, plant groups and retail products in proportion to
previously allocated costs and capital expenditure.
How the salary&
Asset Categories
have been
previously
apportioned by the
Regulatory
Accounting System
P001
£1,000
P002
£3,000
PG003
£5,000
P001
£3,000
PG004
£1,000
P001
£1,000
P002
£1,000
PG004
£3,000
Total Apportioned
Amount = £18,000
Apportionment Base:
P 001= ((1,000+3,000+1,000)/18,000)*100=
P 002= ((3,000+1,000)/18,000)*100=
PG 003= (5,000/18,000)* 100=
PG 004= ((3,000+1,000)/18,000)-100=
Asset
Category 1
£20,000
Asset
Category 2
£40,000
%
Return
on
Assets
(set by
Ofcom)
Asset
Category 2
£4,000
Asset
Category 2
£8,000
Salary
Category 2
£2,000
SalaryCategory 1
£4,000
Asset Categories
Salary Categories
Diagram1_AG112_v1
Apportionment Base
P001 27.8%
P002 22.2%
P003 27.8%
P004 22.2%
P001
£27,800
P002
£22,200
P003
£27,800
P004
£22,200
AG112
£100,000
Diagram2_AG112

Activity groups
130
Base Ref Detailed Description (For all descriptions below, see Appendix A for Key Destinations)
AG135 Duct used by Access Cables
Description
This activity group includes a proportion of the depreciation and assets values of our duct network which relates to
duct carrying access copper cables and access fibre cables. It also includes a share of indirect costs associated with
duct including the systems development costs for NEJ – an inventory system that includes the geographic location
of our duct.
Methodology
Duct used by Access Cables is apportioned to specific plant groups set-up for the different types of access cables:
Access Fibre Plant Groups
PG111C Access Spine Fibre
PG959C Access Distribution Fibre
PG950C GEA Access Spine Fibre
PG951C GEA Access Distribution Fibre
Access Copper Plant Groups
PF117C E-Side Copper Cable
PG118C D-Side Copper Cable
PG130A Local Loop Unbundling Tie Cables
Step 1: Split of Access Duct costs between copper cable and fibre cable
The Absolute Duct Study (ADS) determined the split of GRC for access duct used for fibre cables and access duct
used for copper cables when the survey was carried out in 1997. We update these GRCs on an annual basis by
adding to the annual spend on duct build for access copper cables and duct built for by access fibre cables and by
applying an RPI index.
Step 2: Split of duct used by access fibres into duct used for spine cables and distribution cables.
We have separate plant groups for Access Spine Fibre and Access Distribution Fibre and we therefore need to
apportion duct to both. This information was not collected in the original ADS nor is it recorded in our fixed asset
register so instead we split the costs in proportion to relative depreciation of the access fibre classes of work. This
split is soured from LOPLIST, a report derived from our fixed asset register.
Step 3: Split of duct used by access fibre between Generic Ethernet Access (GEA) and non-GEA
This split is made using the GRC valuation for access fibre. As explained in the detailed valuation methodologies, we
calculate the GRC of access fibre by taking a count of cable sections from our engineering inventory the Integrated
Network System (INS) and applying the latest stores costs, labour times and labour rates. INS includes a marker
that shows whether the cable is for GEA or not. Note: The same GEA/Non GEA split is applied to both Spine and
Distribution Fibre.

Activity groups
131
Base Ref Detailed Description (For all descriptions below, see Appendix A for Key Destinations)
Step 4: Split of Copper costs between E-Side, D-Side and LLU cable and attribution to PGs
We split the duct used by access copper cables in to these plant groups in proportion to the depreciation arising
from capital spend for duct built for E-side (CoW LMD), D-Side (CoW LDD) and LLU tie cables (a policy code under
CoW LMD). The depreciation figures are taken from LOPLIST, a report derived from our fixed asset register.
Data Source/s
Absolute Duct Study (carried out in 1997), Life of Plant (LoP) list (a report derived from our fixed asset register),
Integrated Network Systems (INS).
AG148 Duct used by Backhaul Cables
Description
This AG contains the costs and balance sheet items for Backhaul Duct.
Backhaul Duct is the national network of underground bores and ducting between exchange nodes that are
considered part of the Openreach division’s assets and is used to house optical fibre and metallic communications
transmission cables.
Methodology
The costs in this AG are allocated to PG170B (Openreach Backhaul Fibre).
AG149 Duct used by Core Cables
Description
This AG contains the costs and balance sheet items for Inner Core Duct.
Inner Core Duct is the national network of underground bores and ducting between exchange nodes (excluding
Openreach assets) and is used to house optical fibre and metallic communications transmission cables.
Methodology
The costs in this AG are allocated to PG350N (Wholesale Inner Core Fibre)
See below
equipmen
t entries
Equipment AGs (AG161 – AG164)
Description
These are the methodology and data sources which are used by AG161 - 164.
Methodology
The costs for the AG are apportioned to plant groups and products using the electricity consumption of network
equipment associated with a relevant class of work (detailed in each individual AG below). Follows the base for
DTNELSP/T – refer to description of this base for more detail.
The allocations of the Equipment AGs differ to the DTNELSP base in that they do to allocate to PG192A. This is
because NGA cabinets are located at street level and therefore do not consume exchange power overheads.
Data Source/s
P12 version of the specialised electricity base DTNELSP/T
Uses Period 12 equipment volumes (or most recent volumes available).The key systems used to provide the
volumes for calculation of this base are listed below:

Activity groups
132
Base Ref Detailed Description (For all descriptions below, see Appendix A for Key Destinations)
EXPRES - Volumes for switch equipment.
INS - Volumes for PDH transmission equipment and CWSS/DWSS equipment
PACS - Volumes for SDH transmission equipment and 21CN equipment
Oracle Business Intelligence (OBI) Reports - Volumes for DPCN equipment (EDM and ENA)
NISM - Volumes for ADSL (DSLAMS)
AIM – Volumes for ATM/MSIP equipment
Peacemaker – Volumes for Access Radio equipment
LLUMS – actual power readings for LLU meters
AG161 Specialised Accommodation Equipment- Maintenance
Description
AG161 acts as the collection pot for the current account related overhead costs of maintaining systems providing
heating, ventilation, air conditioning and general environmental control in BT’s Network Operational Buildings (ie
non-office buildings such as property occupied by local exchanges). The F8 codes directly relating to this activity
are allocated to this AG.
Methodology
This base apportions costs to Products and Plant Groups using the Equipment AGs summary methodology (above)
applied to CoW F2AN.
Data Source/s
This base uses the data sources identified in the Equipment AGs summary above.
AG162 Specialised Accommodation Equipment - non Maintenance
Description
AG162 acts as the collection pot for the current account related overhead costs of maintaining systems providing
heating, ventilation, air conditioning and general environmental control in BT’s Network Operational Buildings (ie
non-office buildings such as property occupied by local exchanges). The F8 codes directly relating to this activity
are allocated to this AG.
Methodology
This base apportions costs to Products and Plant Groups using the Equipment AGs summary methodology (above)
applied to CoW ACPN.
Data Source/s
This base uses the data sources identified in the Equipment AGs summary above.
AG163 Back-up Power Equipment – Maintenance
Description
AG163 acts as the collection pot for the maintenance costs on equipment providing power to BT’s Network
Operational Buildings (ie non-office buildings such as property occupied by local exchanges). F8 codes directly
relating to this activity are allocated to this AG.
Methodology
This base apportions costs to Products and Plant Groups using the Equipment AGs summary methodology (above)

Activity groups
133
Base Ref Detailed Description (For all descriptions below, see Appendix A for Key Destinations)
applied to CoW P.
Data Source/s
This base uses the data sources identified in the Equipment AGs summary above.
AG164 Back-up Power Equipment - non Maintenance
Description
AG164 acts as the collection pot for the balance sheet amounts and associated depreciation charges of equipment
providing power to BT’s Network Operational Buildings (ie non-office buildings such as property occupied by local
exchanges). F8 codes directly relating to this activity are allocated to this AG.
Methodology
This base apportions costs to Products and Plant Groups using the Equipment AGs summary methodology (above)
applied to CoW TPC.
Data Source/s
This base uses the data sources identified in the Equipment AGs summary above.
AG401 –
AG410
For AG401 to 410 we apply a similar methodology to calculate the onwards attribution of costs.
The costs and assets in each AG are indirect costs that we require to be attributed to plants group is proportion to
the pay, asset values and or cost of capital of a specific LoB or other organisational unit.
We have set up a series of AGs which we use to attribute indirect costs onwards to what we believe is the most
appropriate destination. Each of the AGs uses the attribution destinations and associated attribution percentages
of a particular set of direct costs as the basis for attributing the indirect costs. We identify which indirect costs we
believe should follow a particular path of attribution and use the relevant AG4xx to implement this.
These AGs are all system generated and they are all mechanically the same. The process of attribution for each AG
is as follows:
We identify indirect costs and map these to the AG4xx which we believe to be the best basis for
apportionment of the indirect cost eg we would map Openreach support pay costs to AG401 to be attributed
in the same way as the direct pay costs.
The REFINE system identifies the destinations to which the direct costs have been apportioned and the
relative percentages of apportionment to these destinations.
The REFINE system attributes the total cost held within the AG4xx to the same destinations and using the
same percentage of apportionment that has been used for the directly attributed costs.
Example: BT TSO indirect costs
BT TSO provides services which are consumed by other LoBs such as Openreach and Wholesale. In doing so we
attribute direct costs relating to BT TSO activities to the appropriate LoB using Except base methodologies.
In order to attribute the indirect costs we use AG4’s. When attributing pay support costs of BT TSO we assume that
Openreach, Wholesale and other LoBs receive the benefit of the support costs which TSO incur as part of their
operations. As these are pay costs we attribute them following the same destinations and using the same
weightings as TSO direct pay costs attributed via our direct attribution methodologies. This is demonstrated in the
table below.
PGs to which direct costs Costs in Attribution % of

Activity groups
134
Base Ref Detailed Description (For all descriptions below, see Appendix A for Key Destinations)
have already been
attributed
each PG TSO support costs
to PGs
PG: Openreach 100 100/800 =
12.5%
PG: Wholesale 200 200/800 = 25%
PG: Other LoBs 500 500/800 =
62.5%
Total 800 800/800 = 100%
In this example 12.5% of all TSO pay support costs would be attributed to Openreach PGs, 25% to Wholesale PGs
and 62.5% to other LoB PGs.
AG401 Costs apportioned using Openreach pay costs
Description
AG401 captures costs such as Openreach Human Resources, Openreach HQ costs and miscellaneous costs
supporting Openreach Line of Business.
Methodology
AG401 is a system generated base. The REFINE system is given instructions to take Openreach current and capital
pay attributions to generate the apportionment destinations and percentages for the costs in this AG.
These costs follow the attribution process explained in the AG401-AG410 summary section above.
AG402 Costs apportion using TSO pay costs
Description
AG402 captures costs such as miscellaneous expenditure used to support BT TSO such as Human Resource
functions, HQ costs and support staff.
Methodology
AG402 is a system generated base. The REFINE system is given instructions to take BT TSO current and capital pay
attributions to generate the apportionment destinations and percentages for the costs in this AG.
These costs follow the attribution process explained in the AG401-AG410 summary section above.
AG403 Costs apportioned using Openreach Stores costs
Description
AG403 captures costs such as elements of supplies management costs which support Openreach.
Methodology
AG403 is a system generated base. The REFINE system is given instructions to take Openreach current and capital
stores costs attributions to generate the apportionment destinations and percentages for the costs in this AG.
These costs follow the attribution process explained in the AG401-AG410 summary section above.
AG404 Costs apportioned using TSO Stores costs

Activity groups
135
Base Ref Detailed Description (For all descriptions below, see Appendix A for Key Destinations)
Description
AG404 captures costs such as elements of supplies management costs which support BT TSO.
Methodology
AG404 is a system generated base. The REFINE system is given instructions to take BT TSO current and capital
stores costs attributions to generate the apportionment destinations and percentages for the costs in this AG.
These costs follow the attribution process explained in the AG401-AG410 summary section above.
AG405 Costs apportioned using BT Business Stores costs
Description
AG405 captures costs such as elements of supplies management costs supporting BT Business activities.
Methodology
AG405 is a system generated base. The REFINE system is given instructions to take BT Business current and capital
stores costs attributions to generate the apportionment destinations and percentages for the costs in this AG.
These costs follow the attribution process explained in the AG401-AG410 summary section above.
AG406 Costs apportioned using Wholesale pay costs
Description
AG406 captures costs such as miscellaneous costs supporting BT Wholesale.
Methodology
AG406 is a system generated base. The REFINE system is given instructions to take BT Wholesale current and
capital pay attributions to generate the apportionment destinations and percentages for the costs in this AG.
These costs follow the attribution process explained in the AG401-AG410 summary section above.
AG407 Costs apportioned using Openreach Operations pay costs
Description
AG407 captures costs such as miscellaneous expenditure supporting Openreach Operations Units.
Methodology
AG407 is a system generated base. The REFINE system is given instructions to take Openreach Operations –
organisational units BV, BL and BD current and capital pay attributions to generate the apportionment
destinations and percentages for the costs in this AG.
These costs follow the attribution process explained in the AG401-AG410 summary section above.
AG408 Costs apportioned using Openreach Fixed Asset costs
Description
AG408 captures costs such as non – specific Openreach development costs.
Methodology
AG408 is a system generated base. The REFINE system is given instructions to take Openreach non-current asset
NBVs attributions to generate the apportionment destinations and percentages for the costs in this AG.
These costs follow the attribution process explained in the AG401-AG410 summary section above.

Activity groups
136
Base Ref Detailed Description (For all descriptions below, see Appendix A for Key Destinations)
AG409 Costs apportioned using Wholesale Pay plus Return on Fixed Asset costs
Description
AG409 captures costs such as non – specific software depreciation costs for BT Wholesale
Methodology
AG409 is a system generated base. The REFINE system is given instruction to take the attributions for pay
expenses for the BT Wholesale Line of Business (current and capital account) and the net book value of fixed assets
revalued for current cost accounting (CCA) for the Wholesale LoB to generate the apportionment destinations and
percentages for the costs in this AG.
These costs follow the attribution process explained in the AG401-AG410 summary section above.
AG410 Costs apportioned using Openreach Pay plus Return on Fixed Assets costs
AG410 captures costs such as non – specific software depreciation costs for Openreach
Methodology
AG410 is a system generated base. The REFINE system is given instruction to take the attributions for salary
expenses for the Openreach Line of Business (current and capital account) and the net book value of fixed assets
revalued for current cost accounting (CCA) for the Openreach LoB to generate the apportionment destinations and
percentages for the costs in this AG.
These costs follow the attribution process explained in the AG401-AG410 summary section above.
AG412 BT Property Fixed Assets
Description
AG412 includes the depreciation and asset values for Group Property’s land and building assets which are allocated
directly to this activity group using a rule type 1 allocation.
Methodology
This attribution of AG412 to plant groups and activity groups works in a similar way to AG106 except that it is only
attributed in proportion on the Group Property’s trades relating to BT owned buildings.
In practice the key attributions are:
BT TSO (OUC T) – the “transfer in” for BT owned specialised buildings is attributed using detailed analysis of the
floor space requirements of their equipment (described further under bases DTNASBT).
BT TSO (OUC T) – the “transfer in” for BT owned general purpose buildings is attributed to AG102 for Office
space and using an analysis of BT TSO Data Centre budget for data centres (described under base OPGENACC).
Openreach (OUC B) – the “transfer in” for BT owned specialised buildings is attributed based on a detailed
analysis of the Group Property bill which shows the floor space for which Openreach are responsible (described
further under bases DTNASBT).
BT Fleet (OUC Y3) – the “transfer in” for BT owned specialised buildings is attributed to AG101 (Motor
Transport).
Note for more information on transfer charges see Section 15 Transfer charges.
AG414 Property Provision
Description

Activity groups
137
Base Ref Detailed Description (For all descriptions below, see Appendix A for Key Destinations)
BT Property is currently implementing a property rationalisation strategy by consolidating the office space within
the estate, and this is enabling the mothballing and subletting of buildings.
The cost associated with this rationalisation is treated as a provision, as it is not part of business as usual activity.
Methodology
This attribution of AG414 to plant groups and activity groups works in a similar way to AG106 except that it is only
attributed in proportion on the Group Property’s trades relating to office space and general purpose buildings.
In practice the key attributions are:
BT TSO (OUC T) the “transfer in” for general purpose buildings and office space - is attributed to AG102 for
Office space and using an analysis of BT TSO Data Centre budget for data centres (described under base
OPGENACC).
Openreach (OUC B) the “transfer in” for office space - is attributed to AG401 (Costs attributed in proportion to
Openreach pay).
BT Business (OUC H) the “transfer in” for office space - is attributed to downstream Retail Residual products.
BT Consumer (OUC S) the “transfer in” for office space is attributed to downstream Retail Residual products.
BT Global Services (OUC J) the “transfer in” for office space is attributed to downstream Retail Residual products.
BT Wholesale (OUC K) the “transfer in” for office space is attributed to Plant Groups based on the previously
apportioned BT Wholesale pay.
BT Group (OUC C) the “transfer in” for office space is attributed to AG112 (Corporate Costs).
BT Fleet (OUC Y3) the “transfer in” for office space is attributed to AG101 (Motor Transport).
Note for more information on transfer charges see Section 15 Transfer charges.
AG415 Fleet Fuel
Description
This base apportions BT External Payment for Vehicle Fuel.
Methodology
AG415 is a system generated base. The cost of Motor Transport (MT) vehicle fuel is recovered from the Lines of
Business (LoB) via the transfer charges to the Organisational Unit Codes (OUCs)/Organisational Units based on the
utilisation of the services provided to the OUC.
The transfer charges are used to provide an analysis of the fuel in the different parts of BT. The analysis of the
transfer charge amounts are used to calculate an overall base that is then applied to the underlying actual costs,
which are attributed pro-rata to the transfer charge.

Plant groups
138
13. Plant Groups
13.1 Introduction to Plant Groups
Plant Groups are one of the five main categories of costs we use in the production of the RFS. Plant Groups are
used to attribute onwards the costs and asset values of activities, equipment and infrastructure for the purposes
of running and selling network services (eg Provision and maintenance activities, MSAN equipment, Copper
infrastructure).
We attribute the costs of all Plant Groups to Network Components and Residual products. The attribution process
takes place at level 701 in our REFINE system (see diagram below - full diagram shown and explained in Section 5
System).
Illustration of REFINE processing level 701
Plant Group attributions are determined using apportionment percentages which are calculated externally and
input to REFINE in tables. We use the outputs of various internal systems to determine the weights of
apportionment to different Components. Approximately one third of Plant Groups have a direct allocation to
Components and the remaining two-thirds use a methodology to apportion costs across multiple Network
Components.
For example, the apportionment of costs from Access Fibre Spine (PG111C) is largely based on bearer volume data
extracted from the CTCS system. Using this information, BT attributes the cost of PG111C to 14 different
components (eg ISDN30 access, PC Rentals, Backhaul Extension Services, etc.)
The following section is a dictionary of Plant Groups and the methodologies which they use to attribute costs
onwards.

Plant groups
139
13.2 Plant Group dictionary
Plant
Group
Detailed Description and Methodology (For all descriptions below, see Appendix A for Key Destinations)
PG001X POH Equipment Depreciation Adj Debit
Description
This PG provides a debit adjustment, by bandwidth, for Equipment Depreciation. The Credit is allocated across many
plant groups by the SDH base.
Methodology
Depreciation costs are derived from the revenues from Third Party Equipment related services (where costs are
assumed to equal revenue) and spread across components according to bandwidth.
The equipment count, which is sourced from COSMOSS, is multiplied by the price per circuit to give total equipment
revenue. This revenue is then split across bandwidths (low, medium and high). This is then divided by the asset life of
four years to give the depreciation charge by bandwidth. The accumulated depreciation is calculated by adding this
year’s depreciation charge to the prior three years charges and then added into REFINE.
This PG apportions costs to TISBO 3rd party depreciation components, CD100, CD101 & CD102.
Data Source/s
REFINE, COSMOSS.
PG002X TISBO Excess Construction Adjustment Debit
Description
Excess construction charges (ECCs) are levied when the capital investment required to provide a new connection
exceed a certain amount. In these cases the costs are recovered upfront in an excess construction charge. However
the construction costs incurred in providing these new connections are capitalised in the same way for normal network
construction ie under class of works for fibre and duct. This means that our duct and fibre costs include costs that have
already been recovered from the customer as an ECC.
In order to ensure that these assets are not allocated to other regulated products we raise a journal to move the
depreciation and asset values associated with work which has incurred ECCs to this specific PG for ECCs.
We calculate ECC adjustments for the AISBO Markets and Low TISBO Market.
This PG allocates costs and MCE to a specific ECC component.
This PG works in tandem with PG002Y (below) which removes costs from a number of TISBO services where ECC
depreciation has been incurred.
Methodology
This PG allocates costs to CE103 (TISBO Excess Construction).
PG002Y TISBO Excess Construction Adjustment Credit
Description
ECCs are described in PG002X above. This PG represents the reverse side of the journal referred to in PG002X.
Methodology
This PG allocates costs to CO439 (PC rentals 2Mbit/s local end fibre) By allocating this credit to CO439 we effectively
reverse out the capital expenditure associated with work which has incurred ECCs.

Plant groups
140
Plant
Group
Detailed Description and Methodology (For all descriptions below, see Appendix A for Key Destinations)
PG003X AISBO Excess Construction Adjustment Debit
Description
ECCs are described in PG002X above.
In order to ensure that capital expenditure associated with work which has incurred ECCs is not allocated to other
regulated products we raise a journal to move the depreciation and asset values out of the access fibre and duct
components.
This PG contains the assets and depreciation relating to ECCs incurred on Ethernet services and works in tandem with
PG003Y (below).
Methodology
Costs from this PG are allocated to CE104 (AISBO Excess Construction component).
PG003Y AISBO Excess Construction Adjustment Credit
Description
ECCs are described in PG002X above. This PG represents the reverse side of the journal referred to in PG003X.
Methodology
This PG is apportioned to the AISBO fibre and duct components: CW609 (Ethernet Access Direct Fibre), CO450
(Wholesale & LAN extension services fibre), CN616 (Ethernet Backhaul Direct) and CO447 (Backhaul extension
services fibre). The apportionment is based on the volume of reported services used by each component.
Data Source/s
Volumes of reported services.
PG004X POH Depreciation Local End Adjustment Debit
Description
The revenues for POH equipment are within the technical areas POH market; however the costs for these specific
items are within the local end services within the TISBO market. This adjustment is made to align the costs with the
revenues.
This Plant Group (PG) holds the debit adjustment for PoH Equipment Depreciation (PG004Y holds the credit entry).
The PG contains bandwidth specific depreciation that is onward allocated to specific POH equipment services.
Methodology
Costs from this PG are allocated to CPE105 (POH LE adjust CSH debit).
PG004Y POH Depreciation Local End Adjustment Credit
Description
The treatment of Point of Handover (PoH) depreciation is described in PG004X above.
This Plant Group (PG) holds the credit adjustment for PoH Equipment Depreciation.
Methodology
The number of PoH provisions is multiplied by the price per circuit to give total PoH revenue This revenue is then split
across bandwidths. This is then divided by the asset life of five years to give the depreciation charge by bandwidth
(cost = revenue). The accumulated depreciation is calculated by adding this year’s depreciation charge to the prior

Plant groups
141
Plant
Group
Detailed Description and Methodology (For all descriptions below, see Appendix A for Key Destinations)
four years charges and then added into REFINE.
This PG apportions costs to four components: CPE432 (POH adjust credit PPC 64Kbit/s LE), CPE434 (POH adjust
credit PPC 34Mbit/s LE), CPE438 (POH adjust credit PPC 2Mbit/s Copper LE) and CPE 439 (POH adjust credit PPC
2Mbit/s Fibre LE).
Data Source/s
REFINE, LoP List, COSMOSS.
PG111C Access Fibre Spine
Description
This plant group includes costs associated with:
Assets and depreciation relating to fibre spine cables;
Duct used by these cables;
Indirect costs related to the capital expenditure eg the van costs incurred by the engineers installing the fibre;
and
This plant group excludes the access spine fibres used by our Generic Ethernet Access (GEA) products.
Methodology
We apportion this plant group according the number of fibres used by each component. The number of fibres used by
each component is derived from the following calculations:
Ethernet Services
Our Ethernet services our delivered using an end-to-end fibre pair or single fibre so we count the amount local ends
for each component (from our published services) and multiply them by 1 for single fibre working circuits like EAD and
by 2 for older services like WES.
These services use more than two thirds of our non-GEA access fibre and the main components are: CW609 Ethernet
Access Direct (EAD) Fibre and CO450 Wholesale & LAN Extension Services (WES) fibre etc.
Traditional Interface Services
Our older traditional services are delivered by first providing bearers and then connecting circuits across them eg 4 x
2Mbit/s ASDH bearer is provided by connecting equipment with a fibre pair and this bearer can then carry up to four
2Mbit/s circuits thus with this technology more than one circuit can ran over the same fibre.
For these products we firstly count the number of different types of bearers and the number of fibres used by each
type of bearer. This information is taken from CTCS and the most common bearer types are: single 2Mbit/s,
.4x2Mbit/s ASDH, and 34 Mbit/s.
Illustrative example of CTCS bearer information
Total 34Mbits/s Bearers 900
Total access fibres 1,620
Distribution C able
NodeSpine Cable
CustomerExchange

Plant groups
142
Plant
Group
Detailed Description and Methodology (For all descriptions below, see Appendix A for Key Destinations)
Average Fibres per bearer 1.8
Secondly, we use more CTCS data to count the volume of circuit (components) which use each type of bearer which we
then convert into the number of bearer equivalents used by each type of circuit. We then multiply the number of
bearer equivalents by the average number of fibres per bearer to calculate the total number of fibres used by each
circuit.
Illustrative example of calculating the average number of fibre used by each circuit type
Maximum Circuits / Bearer are engineering assumptions
No. of Circuits is from CTCS
Utilised Bearers = No, of Circuits / Maximum Circuits per bearer
Share of spare capacity = Spare Capacity (total bearers – utilised bearers) share across the low bandwidth circuits since
34Mbits circuits would not be able to use this capacity.
Bearer equivalents = Utilised Bearers + Share of spare capacity
Average Fibres per bearer – from CTCS
Number of fibres used by circuit type (component) = Bearer equivalents x Utilised Bearers
Traditional services use less than one third of our non GEA access fibre and the main components are: CO439 PC
rentals 2Mbit/s local ends
Data Source/s
Ethernet Services – published service volumes.
Traditional Interface Services -bearer volumes, access fibre volumes and circuit volumes mapped to bearers are taken
from CTCS.
PG111M Access Fibre Maintenance
Description
This PG captures the maintenance costs associated with the local line fibre cable in the access network. The costs
included are:
The engineering pay costs and stores incurred in repairing access fibres
The indirect costs incurred in supporting the engineers eg the van costs of the engineer’s.
Methodology
We use the same allocation to components as for PG111C Access Spine Fibre.
PG112C Network Residual Miscellaneous
Circuit Types
Maximum
Circuits /
Bearer
No of
Circuits
Utilised
Bearers
Share of
Spare
Capacity
Bearer
Equivalents
Average
Fibre per
bearer
Number of
Fibres used by
circuit
8 Mbit/s 4 600 150 95 245 1.8 442
2 Mbit/s 16 2,000 400 255 655 1.8 1,178
Sub-total lower bandwidth circuits 2,600 2,600 350 2,600 900
34 Mbit/s 1 200 200 - 200 1.8 360
Total for bearer type 2,800 550 350 900 1,260

Plant groups
143
Plant
Group
Detailed Description and Methodology (For all descriptions below, see Appendix A for Key Destinations)
This PG captures the costs of miscellaneous activities involved in the cost of running the network, but which do not
form any part of regulated services, for example the BT engineer Deafness Provision.
Methodology
Costs from this plant group are allocated to CL112 (Network Residual Miscellaneous).
PG114L ISDN30 Connections
Description
This PG captures the cost associated with the provision, cessation and rearrangement activities of ISDN30 circuits.
The activities carried out include testing, line up of circuits, updating records, labelling equipment for onward
connection and connecting transmission equipment at the specified bit rate.
This PG includes:
Direct pay and stores costs associated with these activities and identified directly from classes of work (CoW).
Indirect costs associated with these activities eg . van costs associated with engineers working on these activities.
Methodology
Costs from this PG are allocated to CL163 (ISDN30 Connection component).
PG114M Local Lines Service Access Switches Current
This PG captures the costs for the maintenance of Service Access Switches (SAS) for the Local Access Optical Fibre
Network.
Methodology
Costs from this plant group are allocated to CK982 (Openreach Managed Services for Wholesale).
PG115C Access Radio Equipment
Description
This PG captures the costs associated with the construction, rearrangement and renewal of access radio systems.
These systems are used to deliver Megastream and other non-voice services from the local exchange to customers’
premises.
This includes costs associated with:
Assets and depreciation relating to access radio equipment,
Indirect costs related to the capital expenditure eg the van costs incurred by the engineers installing the
equipment; and
Indirect costs related to the assets themselves eg The electricity costs required to run the equipment.
Methodology
This PG apportions costs to circuit components based on the number of times each circuit uses access radio (converted
into 2 Mbit/s equivalents) This information is sourced from our CTCS system which identifies maps circuits
(components) across our the different parts of our network (plant groups).
Key apportionments are to CO439 (PC rentals 2Mbit/s local end fibre), CL189 (ISDN30 access) and CF383 (OR PC
rentals 2Mbit/s link).
Data Source/s

Plant groups
144
Plant
Group
Detailed Description and Methodology (For all descriptions below, see Appendix A for Key Destinations)
CTCS at period 6, which we believe to be reflective of the full year.
PG115M Access Radio Maintenance
Description
This PG captures the maintenance costs of access radio equipment.
Types of cost include the direct pay costs and stores costs for engineers working on this activity and the indirect costs
associated with engineers eg the engineers van costs.
Methodology
We use the same methodology as we do for apportioning the equipment costs (see PG115C Local Lines Access Radio
Capital above).
Data Source/s
CTCS at period 6, which we believe to be reflective of the full year.
PG117C E-Side Copper Cable
Description
This PG captures the capital costs associated with E-Side Copper. The Access Network for Regulatory Accounting
purposes is split between exchange (E-side) and distribution side (D-Side) copper cable. Types of cost include
depreciation, stores and pay costs.
E-Side cable is the cable that links the local exchange to the primary cross connection point. D-Side cable is the cable
that links the primary cross connection point to the Distribution Point (see diagram below).
Methodology
Costs from this PG are allocated to the CL171 (E-Side Copper Capital).
PG117M E-Side Copper Cable Maintenance
Description
This PG captures the current costs associated with E-Side Copper. The Access Network for Regulatory Accounting
purposes is split between exchange-side (E side) and distribution side (D-Side) copper cable. E-Side cable is the cable
that links the local exchange to the primary cross connection point. D-Side cable is the cable that links the primary
cross connection point to the Distribution Point (see diagram in PG117C above).
Types of cost include non-ETG pay and stores.
Methodology
Costs from this PG are allocated to the CL172 (E-Side Copper Current).
PG118C D-Side Copper Cable
Description
PCP Overhead DPPCP Overhead DP
Underground DP
Exchange
NTTP
E Side
D Side

Plant groups
145
Plant
Group
Detailed Description and Methodology (For all descriptions below, see Appendix A for Key Destinations)
This PG captures the capital costs associated with D-Side Copper. Types of cost include depreciation, stores and pay
costs.
The Access Network for Regulatory Accounting purposes is split between exchange-side (E side) and distribution side
(D-Side) copper cable. E-Side cable links the local exchange to the primary cross connection point. D-Side cable links
the primary cross connection point to the Distribution Point (DP).
Methodology
Costs from this PG are allocated to CL173 (D-Side Copper Capital).
PG118M D-Side Copper Cable Maintenance
Description
This PG captures the current costs associated with D-Side Copper. Types of cost include non-ETG pay and stores.
The Access Network is described in PG118C above.
Methodology
Costs from this PG are allocated to CL174 (D-Side Copper Current).
PG119A Telephony Over Passive Optical Network (TPON)
Description
This PG captures costs associated with TPON.
TPON is a technology which uses fibre from the exchange to the street cabinet and copper from the cabinet to the
customer. It is now in the process of being removed as it does not support broadband.
Types of cost include pay (from maintenance of exchange electronics and customer sited electronics), planning and
depreciation costs from the provision, rearrangement, replacement and renewal of both exchange service modules
and customer sited modules.
Methodology
Costs from this PG are allocated to CL173 (D-Side Copper).
PG120A Payphone Line Cards
Description
This captures the costs associated with the maintenance of the Payphone line cards.
Types of cost include depreciation, stores and pay costs.
Methodology
Costs from this PG are allocated to CL191 (Public Payphones Line Cards).
PG120B LLU Electricity Usage – OR
PCP Overhead DPPCP Overhead DP
Underground DP
Exchange
NTTP
E Side
D Side

Plant groups
146
Plant
Group
Detailed Description and Methodology (For all descriptions below, see Appendix A for Key Destinations)
Description
This Plant Group (PG) captures the Openreach electricity costs related to Local Loop Unbundling.
Methodology
Costs from this plant group are allocated to CL120 (LLU Electricity Usage component).
PG121M Dropwire Maintenance Business
Description
This PG captures the costs associated with the maintenance of Business PSTN, from the distribution point to the
customer's premises.
Types of cost include stores and pay costs.
Methodology
Costs from this PG are allocated to CL180 (Analogue line drop maintenance).
PG122M Dropwire Maintenance Residential
Description
This PG captures costs associated with the maintenance of Residential PSTN, from the distribution point to the
customer’s premises. Types of cost include stores and pay costs.
The distribution point is the point near to a customer’s premises where the main cable from a Primary Cross
connection point (PCP) is split in order to provide service at one or more localised premises. It could be at the top of
telegraph pole, under a walkway or on the E-Side of a building etc. PCP boxes are the green metal cabinets located by
the E-Side of the road.
Methodology
Costs from this PG are allocated to CL180 (Analogue line drop maintenance).
PG123M ISDN2 Maintenance
Description
This PG captures the store and pay costs associated with the maintenance of ISDN2, from the distribution point to the
customer's premises.
Methodology
Costs from this plant group are allocated to CL181 (ISDN2 drop maintenance).
PG124A ISDN30 Equipment
Description
This PG captures the Capital costs of ISDN30.
Types of cost include depreciation, stores and pay costs.
Methodology
Costs from this PG are allocated to CL190 (ISDN30 Line Cards).
PG127A Analogue Linecards
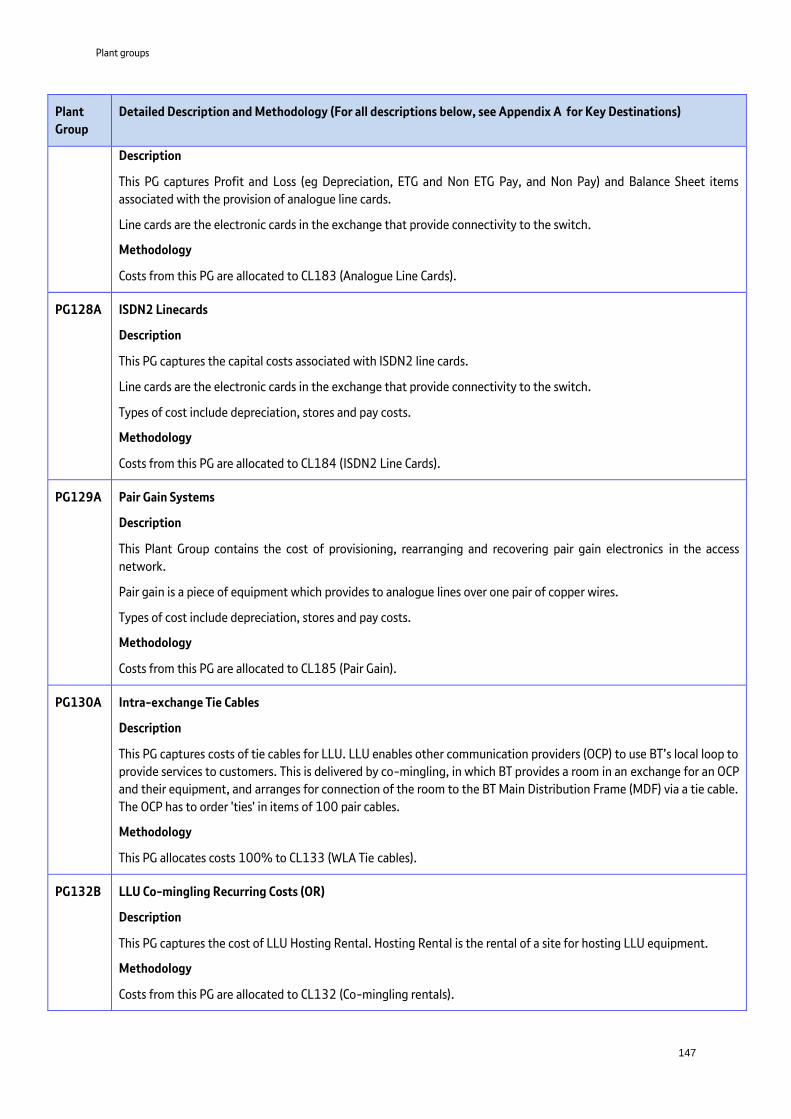
Plant groups
147
Plant
Group
Detailed Description and Methodology (For all descriptions below, see Appendix A for Key Destinations)
Description
This PG captures Profit and Loss (eg Depreciation, ETG and Non ETG Pay, and Non Pay) and Balance Sheet items
associated with the provision of analogue line cards.
Line cards are the electronic cards in the exchange that provide connectivity to the switch.
Methodology
Costs from this PG are allocated to CL183 (Analogue Line Cards).
PG128A ISDN2 Linecards
Description
This PG captures the capital costs associated with ISDN2 line cards.
Line cards are the electronic cards in the exchange that provide connectivity to the switch.
Types of cost include depreciation, stores and pay costs.
Methodology
Costs from this PG are allocated to CL184 (ISDN2 Line Cards).
PG129A Pair Gain Systems
Description
This Plant Group contains the cost of provisioning, rearranging and recovering pair gain electronics in the access
network.
Pair gain is a piece of equipment which provides to analogue lines over one pair of copper wires.
Types of cost include depreciation, stores and pay costs.
Methodology
Costs from this PG are allocated to CL185 (Pair Gain).
PG130A Intra-exchange Tie Cables
Description
This PG captures costs of tie cables for LLU. LLU enables other communication providers (OCP) to use BT’s local loop to
provide services to customers. This is delivered by co-mingling, in which BT provides a room in an exchange for an OCP
and their equipment, and arranges for connection of the room to the BT Main Distribution Frame (MDF) via a tie cable.
The OCP has to order 'ties' in items of 100 pair cables.
Methodology
This PG allocates costs 100% to CL133 (WLA Tie cables).
PG132B LLU Co-mingling Recurring Costs (OR)
Description
This PG captures the cost of LLU Hosting Rental. Hosting Rental is the rental of a site for hosting LLU equipment.
Methodology
Costs from this PG are allocated to CL132 (Co-mingling rentals).

Plant groups
148
Plant
Group
Detailed Description and Methodology (For all descriptions below, see Appendix A for Key Destinations)
PG132N LLU Co-mingling Recurring costs (BT TSO)
Description
This PG captures the cost of LLU Hosting Rental. Hosting Rental is the rental of a site for hosting LLU equipment.
Methodology
Costs from this PG are allocated to CT134 (Co-mingling power & vent).
PG136A LLU Co-mingling Surveys
Description
This PG captures the costs of carrying out surveys on BT buildings to enable infrastructure such as Cabling, Vent and
Chill equipment, access etc for LLU hostels.
Methodology
Costs from this PG are allocated to CL131 (Co-mingling set up).
PG136N LLU Co-mingling Provision
Description
This PG captures the cost of building the LLU Hostels within BT Exchanges.
Methodology
Costs from this PG are allocated to CL131 (Co-mingling set up).
PG140A Routing and Records
Description
The Plant Group (PG) captures the costs and balance sheet (Depreciation, ETG and Non-ETG Pay and Non Pay) of
Routing and Records work for provision of analogue / ISDN lines, Local Loop Unbundling (LLU) and Fibre based
circuits.
Methodology
This Plant Group allocates 100% to CL160 (Routing & Records).
PG142A Main Distribution Frame (MDF) Hardware Jumpering
Description
This PG captures the costs and balance sheet associated with jumpering activities on the Main Distribution Frame
(MDF) connecting the Exchange switch equipment to the Exchange-Side (E-Side) cable.
An MDF jumper is a copper connection that provides a flexible connection between two terminal ends, commonly
used to connect the line side to the exchange side of the MDF.
Methodology
Costs from this PG are allocated to CL161 (MDF Hardware Jumpering).
PG145N WBA End User NTEs
Description
This PG captures the costs associated with the Provision and Installation costs for Asymmetric Digital Subscriber Line

Plant groups
149
Plant
Group
Detailed Description and Methodology (For all descriptions below, see Appendix A for Key Destinations)
(ADSL).
The classes of work (CoW) associated with this Plant Group are Internally Developed Software (COMPS) and NOP
(Network Operations Platform) Circuit Provision - ADSL. These CoW’s cover all provision and software activities in
serving exchanges and customer site, including end-to-end testing.
Methodology
Costs from this PG are allocated to CR118 (ADSL Connections).
PG149A Analogue Line Final Drop
Description
Drop wires are wires connecting the Distribution Point to the customer’s premises.
This PG captures the Drop wire costs associated with specific analogue line based Products.
Methodology
Costs from this PG are allocated to CL178 (Dropwire Capital Analogue NTE).
PG150A ISDN2 Access Equipment
Description
This PG captures the Network Terminal Equipment (NTE) costs for ISDN2 rentals. It includes Network Terminal
Equipment (NTE) and line cards but excludes drop wire.
Methodology
Costs from this PG are allocated to CL186 (ISDN2 NTE).
PG151B Broadband Line Testing Equipment (Openreach)
Description
This PG contains the Test Access Management Systems (TAMS) and EvoTAMs costs.
These are used to provide remote access facilities on Metallic Path Facility (MPF), Shared Metallic Path Facility (SMPF),
Wholesale Line Rental (WLR) and IPstream circuits for testing towards the customer and into the network. They are
installed between the Main Distribution Frame (MDF) and the Digital Subscriber Line Access Multiplexer (DSLAM).
Note: the regulatory asset life for assets which are booked to the asset policy code "XLLU - TAMs for LLU" is 7 years as
opposed to 5 years.
Methodology
The costs in this PG are apportioned using the latest LOP list depreciation figures for CoWs LXTM and LMC. We use the
Asset Policy Codes of the equipment, which tell us what type of equipment it is, to determine the depreciation which
needs to be apportioned to each component. Assets will relate to MPF or EvoTAM testing systems.
Costs relating to MPF equipment are apportioned to CF187 (LLU line testing systems).
Costs relating to EvoTAM equipment are apportioned to CF189 (EvoTAM testing systems).
Additional depreciation is apportioned to CF189 to account for installation of EvoTAMS, this depreciation is based on
a survey from Openreach which identifies the number of EvoTAM installations in a period.
Data Source/s
Latest available Life of Plant (LoP) list, OR EvoTAM survey.

Plant groups
150
Plant
Group
Detailed Description and Methodology (For all descriptions below, see Appendix A for Key Destinations)
PG151N Broadband Line Testing Equipment (BT TSO)
Description
Testing Access Matrices (TAMs) equipment is used in order to carry out accurate diagnostics fault diagnostics on
broadband lines. TAMs can connect to the Digital Subscriber Line Access Multiplexers (DSLAMs) to emulate a modem
from a customer and identify if a fault is at the customer end or in the exchange.
This PG captures the Test Access Matrix (TAMS) costs incurred by BT TSO.
Methodology
This PG apportions costs based on depreciation within classes of work (CoW) WTMDF (Wholesale Test Equipment Main
Distribution Frames). The CoW depreciation information is obtained from the P12 LoP list.
The WTMDF CoW contains a number of policy codes which identify different classes of asset depreciation. This
depreciation forms the basis of the attribution calculation. The apportionment is applied to both P&L & Balance Sheet
values
Depreciation on policy code WMDF (Wholesale MDF Work) is apportioned to CT134 (Co-mingling power and vent) as
this asset solely relates to Broadband Line testing Systems.
The remaining costs in the CoW are apportioned to CR187 (Broadband line testing systems).
Data Source/s
Latest available Life of Plant (LOP) list.
PG152B Other Openreach Repairs
Description
This PG contains the values relating to the equipment that supports the DSL product rentals. DSL is a family of
technologies that provide digital data transmission over the wires of a local telephone network. These lines that
provide faster Internet access to the customer and also allows telephone calls to be made at the same time as Internet
usage.
This PG contains all the balance sheet values relating to the equipment that supports the DSL product rentals
including Digital Subscriber Line Access Multiplexer (DSLAM) equipment. This PG also contains the depreciation and
maintenance costs on this equipment as well as overhead type costs such as the accommodation to house equipment
etc..
Methodology
Costs from this PG are allocated to CO989 (SFI (Special Fault Investigations)).
PG152N DSLAM – Overheads
Description
This PG contains all the balance sheet values relating to the equipment that supports the DSL Product rentals except
Digital Subscriber Line Access Multiplexer (DSLAM) equipment itself. This PG also contains the maintenance costs for
this equipment as well as overhead type costs such as the accommodation to house equipment etc.
Methodology
Costs from this PG are allocated to CR188 (DSLAM support).
PG153N DSLAM – Equipment

Plant groups
151
Plant
Group
Detailed Description and Methodology (For all descriptions below, see Appendix A for Key Destinations)
Description
This PG contains the balance sheet values relating to the Digital Subscriber Line Access Multiplexer (DSLAM)
equipment. This PG also contains the depreciation cost relating to the DSL equipment. It does not include the
maintenance costs on this equipment or overhead type costs such as the accommodation to house equipment etc.
(This is included in PG152N).
Methodology
Costs from this PG are allocated to CR189 (DSLAM equipment).
PG170B Backhaul Fibre
Description
This PG captures the depreciation costs and asset values of the backhaul length elements of the bearers in BT’s Core
Transmission network.
Combinations of assets in the transmission network (ie two bits of electronics joined by fibre and duct) make up what
is known as a “bearer”. The bearers within the network carry circuits that relate to different products and bandwidths.
More detail can be found CTCS (Core Transmission Costing System) in the Data Sources section.
Methodology
The costs and asset values on these PGs are allocated to network components (circuits) based on how the circuits use
the different bearers. The relationship between circuits and bearers is held in CTCS. Extracts from CTCS give us the
total length of fibre used by the circuits over each bearer. Fibre lengths for Ethernet main links are not captured in
CTCS but need to pick up some of the costs of backhaul fibre. The fibre km volumes are taken from Openreach volumes
and then included in the CTCS output. Ethernet circuits have one circuit per fibre therefore allowing the fibre km to be
used as the bearer length.
This PG apportions costs to various 21CN and 20CN components, primarily CO484 (Ethernet main links), CO681
(broadband backhaul circuits) and CF371 (OR PC rentals 2Mbit/s link per km distribution).
Data Source/s
CTCS and Openreach volumes for Ethernet main links data for Period 6. Management believes this Period is reflective
of the full year.
PG192A FTTC Copper Tie Cables
Description
This Plant Group captures the balance sheet values and depreciation associated with Next Generation Access
Exchange-Sidecables.
Methodology
Costs from this PG are allocated to CL192 (NGA E-Side Copper Capital).
PG197A FTTC Service Delivery & Development
Description
This PG captures the costs associated with the Openreach (OR) Next Generation Access (NGA) Fibre to the Cabinet
(FTTC) product.
Methodology

Plant groups
152
Plant
Group
Detailed Description and Methodology (For all descriptions below, see Appendix A for Key Destinations)
Costs from this PG are allocated to CL197 (FTTC development).
PG198A FTTP Development
Description
This PG captures the costs associated with the Openreach (OR) Next Generation Access (NGA) Fibre to the Premises
(FTTP) product currently under development.
These costs are identified via a transfer charge made from BT TSO to OR.
Methodology
Costs from this PG are allocated to CL198 (FTTP development).
PG213C Local Exchanges UXD
Description
This PG captures the cost of constructing, extending and rearranging local UXD5 Exchanges. Types of cost include pay,
depreciation and overheads.
UXD5 exchanges are deployed in rural areas and cater for about 460 Public Switched Telephone Network (PSTN)
customers each. They are in effect mini Local Exchanges (LE).
Methodology
The methodology uses a modern equivalent asset. This is calculated using the volumes of UXD5 from Express
multiplied by the cost of the building blocks for equivalent System X and AXE10 exchanges. Matrices supplied by the
manufacturer, which map the different elements of the building blocks into Call set, duration, Access and Common are
then applied to this. The base produced by this methodology was frozen in 2010-11 as UXD5 is no longer produced.
Costs are apportioned to three components: CL183 (Analogue line cards), CO214 (Local exchange concentrator set
up) and CO215 (Local exchange concentrator duration).
Data Source/s
System X and AXE10 volumes in the network from the EXPRES system.
PG216C Operator Assistance Systems Equipment
Description
This PG captures the depreciation costs of switching equipment used to support Operator Assistance (OA) calls.
Methodology
Onwards attribution is achieved through a Period 12 Operfile, this is a spreadsheet used to derive apportionment
information for Operator and Directory Assistance costs. The file is a summary of information from a variety of other
data sources (see data sources below) and is updated monthly on a cumulative basis.
Attribution is carried out as follows:
1. Call duration information from the central data store (CDS) and Call Statistics Centralisation System (CSCS) is
summarised on the basis of call types.
2. A link is then made between the nature of the call and the type of equipment required to carry it.
3. As this is a capital base, the initial summary is then allocated to components on the basis of depreciation charges
per switch type. This depreciation is extracted from the Fixed Asset Register.

Plant groups
153
Plant
Group
Detailed Description and Methodology (For all descriptions below, see Appendix A for Key Destinations)
The Operator Assistance costs are attributed to the following components pro-rata to the call minute volumes:
CO911 (National operator assistance)
CO 912 (International operator assistance)
CO919 (Emergency Operator Aassistance (999))
CO941 (National OA non-chargeable)
CO942 (Emergency OA (999) non-chargeable)
CO943 (Payphones operator assistance non chargeable)
Data Source/s
Inland and International Directory Assistance (DA).
CDS.
CSCS and Featurenet (from the Powerhouse system).
Inland and International Operator Assistance (OA).
Call Centre Management Information System (CCMIS).
CSCS (for Retail chargeable).
6A Report (for Wholesale Chargeable).
Fixed Asset download by Accounting Policy Code (APC).
Lucent Switch billing system – (this is incorporated into the CDS file that is produced monthly and used to
populate the Operfile).
PG216M Operator Assistance Systems Maintenance
Description
This PG captures the maintenance costs of the switching equipment used to support Operator Assistance (OA) calls.
Methodology
We use a spreadsheet (the P12 Operfile) to derive cost information for Operator and Directory Assistance costs. The
file is summarises information from a variety of other data sources and is updated monthly on a cumulative basis.
The costs are attributed on the same basis as the depreciation costs of this equipment (See PG216C above), on the
basis that maintenance activity is carried out to support the performance of the switching equipment and can
therefore be regarded as an overhead of the capital/depreciation expenditure incurred. It should therefore be
attributed on a consistent basis with the capital costs.
This PG apportions costs to the same components as PG216C above.
Data Source/s
This PG uses the same data sources as PG216C above. In addition to this the P12 Operfile is used to supply cost data.
PG217E Main Distribution Frames Equipment
Description
This PG captures the cost of provision, extension, upgrade, replacement, re-arrangement and recovery of Main
Distribution Frames (MDFs).

Plant groups
154
Plant
Group
Detailed Description and Methodology (For all descriptions below, see Appendix A for Key Destinations)
MDFs are those distribution frames providing direct interface with external circuits terminations (customer or other
exchanges).
Methodology
Costs from this PG are allocated to CL175 (Local exchanges general frames capital).
PG217F Main Distribution Frames Maintenance
Description
This PG captures the maintenance cost of Main Distribution Frames (MDFs).
Methodology
This PG allocates to CL176 (Local exchanges general frames current).
PG217R Main Distribution Frames Maintenance (BT TSO)
Description
This PG captures the maintenance cost of Main Distribution Frames (MDFs) .
Methodology
Costs from this PG are allocated to CL176 (Local exchanges general frames current).
PG227A Advanced Switching Units
Description
This PG captures the cost of construction, installation, re-arrangement, recovery and renewal and maintenance of
Advance Service Units (ASUs) equipment and Call Centre DMS100s to provide the platform to support the provision of
the Virtual Private Network Service (VPNS). The VPNS Services being Virtual Private Network (VPN) and Virtual Private
Services (VPS). This PG also captures the maintenance costs of the above types of equipment.
Methodology
Costs from this PG are allocated to CO227 (Advanced Switching Units).
PG228A Signalling Transfer Point (STP) and Edge Link Monitors
Description
This PG captures the costs of BT’s signalling network, signalling network management system and interconnect
equipment. For example STP and Signalling Point Relay (SPR) switches, Signalling Traffic Management (STMS)
equipment, link monitors and associated equipment (core and edge), on site spares, initial databuild associated with
switches, testing apparatus and initial provision of spares held for changing purposes.
Methodology
Costs from this PG are allocated to CO270 (Signalling transfer point).
PG229A Signalling Point Relay (SPR) and Core Link Monitors
Description
This PG captures costs of the following signalling equipment: SPR switches and core link monitors, both with
associated on site spares. It also captures the costs of the initial databuild associated with the switches.
The core link monitors and Signalling Point Relay (SPR) switches are both items of signalling equipment used to

Plant groups
155
Plant
Group
Detailed Description and Methodology (For all descriptions below, see Appendix A for Key Destinations)
interface Public Switched Telephone Network (PSTN) switches with the Intelligent Network (IN)/Common Intelligent
Service layer (CISL). The former provides a signalling assurance function whilst the latter concentrates signalling from
the PSTN switches onto the Intelligent Network/CISL.
Methodology
Costs are allocated to the IN components CISL and Intelligent Contact Manager (ICM) based on the latest available CISL
and PSTN internal and external call volumes.
The CISL volumes provide the split between select services and the IN/CISL Services whilst the PSTN call volumes are
used to provide the split between the two select services components.
This PG apportions costs to three components: CO261 (Intelligent contact manager), CO266 (common intelligence
service layer (CISL)) and CO293 (Network Features).
Data Source/s
Cumulative CISL platform volumes and PSTN internal and external call volumes.
PG240A Analogue Line Testing Equipment
Description
This PG captures the costs associated with the equipment that supports line testing of Public Switched Telephone
Network (PSTN) and ISDN circuits.
Methodology
Costs from this PG are allocated to CL177 (Analogue line test equipment).
PG241A Repair Handling Duty
Description
This PG captures the costs associated with time spent by Repair Handling Duty staff on Network Operations Items
(NOUs), Remote Operations Items (ROU) and exchange line testing, report raising and records work.
Methodology
This PG uses circuit volumes from Openreach management accounts to apportion costs between a PSTN and an ISDN
component.
This PG apportions costs to CL180 (Analogue drop maintenance) and CL181 (ISDN2 drop maintenance).
Data Source/s
Openreach Management Accounts.
PG249C Main Exchange DLT
Description
This PG captures the capital and depreciation costs of the Main Digital Exchange DLT equipment.
The DLT is part of the Main Exchange System X Processor unit and NGS (Next Generation Switch) that also comprises a
switch block and processor and signalling functional groups, and is used for call setup and call duration.
Main exchanges come in two types, the older System X unit and a newer NGS. System X units are not available and are
being replaced by NGS units.
Methodology
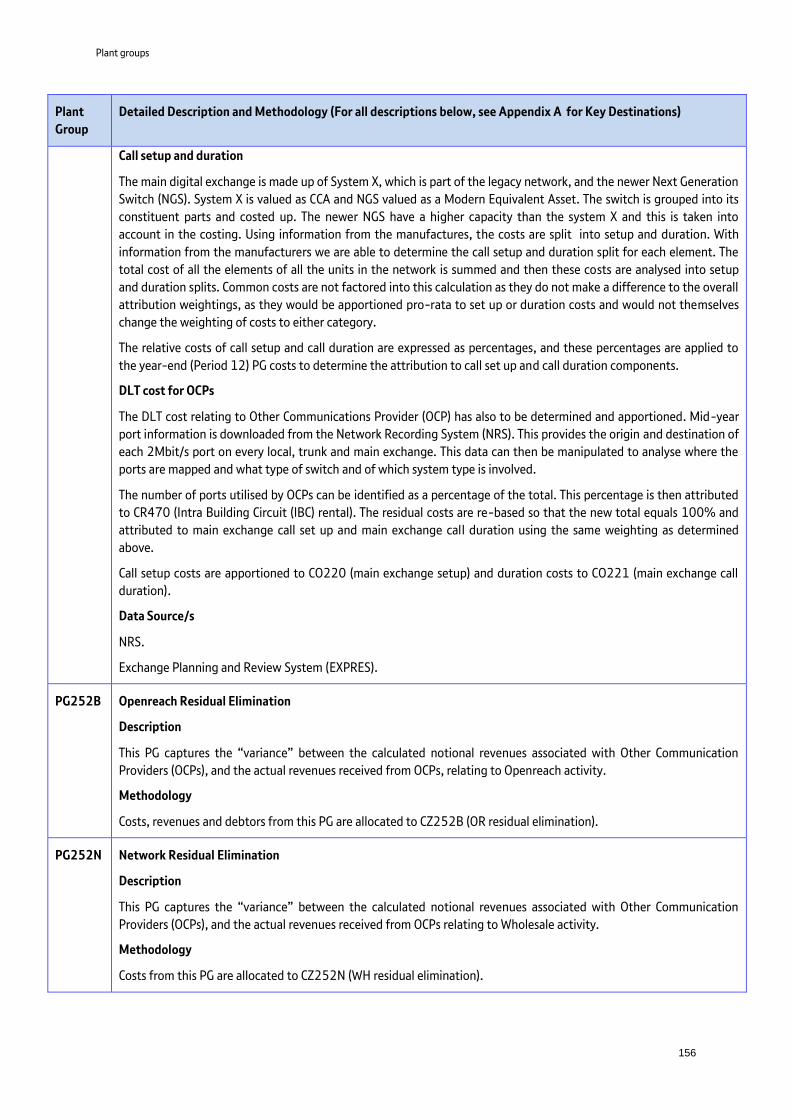
Plant groups
156
Plant
Group
Detailed Description and Methodology (For all descriptions below, see Appendix A for Key Destinations)
Call setup and duration
The main digital exchange is made up of System X, which is part of the legacy network, and the newer Next Generation
Switch (NGS). System X is valued as CCA and NGS valued as a Modern Equivalent Asset. The switch is grouped into its
constituent parts and costed up. The newer NGS have a higher capacity than the system X and this is taken into
account in the costing. Using information from the manufactures, the costs are split into setup and duration. With
information from the manufacturers we are able to determine the call setup and duration split for each element. The
total cost of all the elements of all the units in the network is summed and then these costs are analysed into setup
and duration splits. Common costs are not factored into this calculation as they do not make a difference to the overall
attribution weightings, as they would be apportioned pro-rata to set up or duration costs and would not themselves
change the weighting of costs to either category.
The relative costs of call setup and call duration are expressed as percentages, and these percentages are applied to
the year-end (Period 12) PG costs to determine the attribution to call set up and call duration components.
DLT cost for OCPs
The DLT cost relating to Other Communications Provider (OCP) has also to be determined and apportioned. Mid-year
port information is downloaded from the Network Recording System (NRS). This provides the origin and destination of
each 2Mbit/s port on every local, trunk and main exchange. This data can then be manipulated to analyse where the
ports are mapped and what type of switch and of which system type is involved.
The number of ports utilised by OCPs can be identified as a percentage of the total. This percentage is then attributed
to CR470 (Intra Building Circuit (IBC) rental). The residual costs are re-based so that the new total equals 100% and
attributed to main exchange call set up and main exchange call duration using the same weighting as determined
above.
Call setup costs are apportioned to CO220 (main exchange setup) and duration costs to CO221 (main exchange call
duration).
Data Source/s
NRS.
Exchange Planning and Review System (EXPRES).
PG252B Openreach Residual Elimination
Description
This PG captures the “variance” between the calculated notional revenues associated with Other Communication
Providers (OCPs), and the actual revenues received from OCPs, relating to Openreach activity.
Methodology
Costs, revenues and debtors from this PG are allocated to CZ252B (OR residual elimination).
PG252N Network Residual Elimination
Description
This PG captures the “variance” between the calculated notional revenues associated with Other Communication
Providers (OCPs), and the actual revenues received from OCPs relating to Wholesale activity.
Methodology
Costs from this PG are allocated to CZ252N (WH residual elimination).

Plant groups
157
Plant
Group
Detailed Description and Methodology (For all descriptions below, see Appendix A for Key Destinations)
PG254A Main Digital Exchange - Intelligent Access and Messaging
Description
This PG captures the depreciation costs of Main Digital exchange intelligent access and messaging equipment to calls
components only.
Methodology
Apportionment to the Call Set-Up components for Local and Main Exchanges is based on the relative number of Local
Exchanges and Main Exchanges in the network sourced from the EXPRES system. Data amendments are more
numerous and more time consuming for Main Exchanges than for Local Exchanges, so each Main Exchange is
weighted by a factor determined by a survey of time spent on Data Amendments. This factor is determined on the
basis of the experience and expertise of the data amendment team, (a management estimate). This gives an estimate
of the time and hence relative cost for data amendments on Local relative to Main Exchanges.
Costs for this PG are apportioned on the basis of minutes for CNA (Change Number Announcement) relative to minutes
for the Televote service and other messaging applications.
This PG apportions costs to CO260 (Cambridge Voice Intelligent Peripherals), CO210 (Local exchange processor
duration) and CO220 (Main exchange setup).
Data Source/s
Exchange Planning and Review System (EXPRES).
Data Amendments survey.
Minutes Data from Recorded Information Distribution Equipment (RIDE) - Statistics Data Warehouse (SDW).
PG255B Main Digital Switchblock
Description
This PG captures the capital depreciation and maintenance costs of the Main Digital Exchange Switch Block
equipment.
Main exchanges come in two types, the older System X unit and a newer Next Generation Switch (NGS). System X units
are not available and are being replaced by NGS units.
The Switch Block is part of the Main Exchange System X Processor and NGS (Next Generation Switch) unit that also
comprises of a Processor and Digital Line Termination (DLT) functional groups, and is used for call setup and call
duration.
Methodology
This PG follows the methodology in PG249C above.
Data Source/s
This PG uses the same data sources as PG249C above.
PG257C Main Exchange Processor
Description
This PG captures the capital and depreciation costs of the Main Digital Exchange Processor and Signalling equipment.
Main exchanges come in two types, an older System X unit and a newer Next Generation Switch (NGS). System X units
are not available and are being replaced by NGS units.

Plant groups
158
Plant
Group
Detailed Description and Methodology (For all descriptions below, see Appendix A for Key Destinations)
The processor is part of the Main Exchange System X Processor unit that also comprises a Switch Block and Digital Line
Termination (DLT) functional groups, and is used for call setup and call duration.
Methodology
This PG follows the methodology in PG249C above.
Data Source/s
This PG uses the same data sources as PG249C above.
PG260A Intelligent Network Platform
Description
This PG captures the costs of all equipment and associated costs incurred as part of provision, extension, re-
arrangement and recovery of Intelligent Contact Manager equipment excluding Alfredo equipment. It also includes
Intelligent Peripherals (IP) Service Control Point (SCP) equipment, on site spares, initial databuild associated with
switches, Testing Apparatus and initial provision of spares held for changing purposes.
Methodology
Costs from this PG are allocated to CO261 (Intelligent Contact Manager).
PG276A Common Capability Intelligence Service Layer (CISL)
Description
This PG captures the cost of the CISL platform that supports basic and advanced number translation services (for
example 0800, 0845 etc.) into a geographic number (for example 020 7 234 5678) so that the call can then be
routed by the Public Switched Telephony Network (PSTN) switches. Services on this platform are migrating from the
Cambridge and CoreIN platforms (PG263/266).
Costs associated with the PG are:
Supervising contractors on installation.
On site spares.
Testing apparatus and initial provision of spares held for changing purposes.
Methodology
Costs from this PG are apportioned using call volumes from the CISL platform and Powerhouse volumes.
This PG apportions costs between CO266 (Cambridge / CISL infrastructure) CO261 (Intelligent Contact Manager),
CO291 (OR Network Features (internal)) and CO290 (OR Network Features – external).
Data Source/s
Cumulative CISL platform volumes and the split of PSTN internal and external call volumes.
PG280C AXE10 Local Exchange Processor
Description
This PG captures the costs relating to the AXE10 Digital Local Exchange Processor and Signalling switch. The switch
comprises both concentrator and processor functionality, and is used for call set up and call duration.
Methodology
LEMP2 was the Local Exchange Modernisation Programme (LEMP). The LEMP contract is indicative of normal course

Plant groups
159
Plant
Group
Detailed Description and Methodology (For all descriptions below, see Appendix A for Key Destinations)
of business. It sets out the contract prices for the various switch elements and is negotiated with suppliers by BT’s
procurement function.
The aggregate cost within the network of each of the elements of the switch is determined on the basis of Local
Exchange Modernisation Programme2 (LEMP2) contract prices, by multiplying the volume by the unit cost of each
element.
The elements of the processor are assigned into three main blocks:
Digital Line Termination (DLT).
Switch Block.
Processor and Signalling.
We are concerned with Processor and Signalling only for this PG.
Based on advice from switching suppliers, the function of each switch element is analysed between call set up and call
duration. This advice shows an analysis between set-up and duration which will not change on a year by year basis as
the building elements of the asset remain a constant. Certain elements support both functions.
All of the above is based historic data until such time as the base is unfrozen. The procedures below are updated each
year and any changes mean that historic data is re-based to accommodate these.
The processor usage of Network Features (previously called Select Service) calls has also to be determined. An extract
of billing call record information is gathered from a sample of ten System X and ten AXE 10 Local Exchanges and
analysed into whether the record type is Select Service driven or not.
Below is a table of billing record types:
Record Types 34 were ignored in this calculation on the assumption that the Network Features to ordinary calls
without Select Services is in the same ratio for ISDN as for analogue calls.
Billing records were extracted for one whole week during the year at 20 Digital Local Exchange (DLE) sites in the
country. The number of processor instructions was derived for call usage types to derive a weighted processor
average.
The final weighted processor usage percentage for Network Features is then applied to the PG cost. This cost is
apportioned to CO293 (Network Features).
Caller Display is a subset of Network Features. The Type 29 billing record activations which are Network Features
driven also contain Calling Line Identity and these can be separately identified as a subset. The proportion of Network
Features activations relating to CLI (Calling Line Identity) is derived and this fraction is used to map costs to a separate
Caller Display Component. The quantity of processor cost relating to DLE call set up and call duration is then re-based
so that the new total equals 100%.
Costs from this PG are apportioned to CO210 (Local exchange processor duration), CO212 (Local exchange processor
set up), CO292 (Caller Display), CO293 (Network Features) and CR470 (Intra Building Circuit IBC rental).
Data Source/s
RT29 ( Select Service Driven)
RT34
RT22 ( Select Service Driven)
RT21
Record Type Description
Normal subs billing records
Diverted calls and A, D and C ring backs
Activation/Deactivation of Select Services
Integrated Services Digital Network (ISDN) call records
Diagram2_PG280C

Plant groups
160
Plant
Group
Detailed Description and Methodology (For all descriptions below, see Appendix A for Key Destinations)
NRS.
EXPRES.
Billing records from the Meridian switch and the latest available data derived from the CRAFT Route Factors data
ORBIT.
PG281C AXE10 Local Exchange Digital Line Termination
Description
This PG captures the costs and balance sheet of AXE10 Digital Line Termination (DLT)
The DLT switch comprises both call set-up and call duration functionality.
Methodology
The aggregate cost within the network of each of these switch elements is determined on the basis of LEMP2
contract prices ie the volume of each element is multiplied by the unit cost of each element. LEMP2 was the Local
Exchange Modernisation Programme. It set out the contract prices for the various switch elements and is negotiated
with suppliers by BT’s procurement function. The LEMP2 contract is indicative of normal course of business and covers
both Local and System X main Exchanges based on advice from switching suppliers. The function of each switch
element is analysed between call set-up and call duration. This advice showing an analysis between set-up and
duration will not change on a year by year basis as the building elements of the asset remain a constant.
These percentages are then weighted for the relative proportion of the PG total cost represented by processor costs as
opposed to concentrator costs and are used to apportion costs to CO212 (Local Exchange Processor Set-Up) and
CO210 (Local Exchange Processor Duration). All of the above is based historic data until such time as the base is
unfrozen. The procedures below are updated each year and any changes mean that historic data is re-based to
accommodate these.
The DLT cost relating to Other Communications Providers (OCPs) also needs to be determined. For this mid-year port
information is downloaded from the NRS. This provides the origin and destination of each 2Mbit/s port on every local,
trunk and main exchange. This data can then be manipulated to analyse where the ports are pointed, what type of
switch, of which system type and the system type involved.
The fraction of ports that relate to OCPs can be expressed as a fraction of the total and is apportioned to CR470 (Intra
Building Circuit (IBC) rental).
The residual amount is then re-based so that the new total equals 100% and apportioned to CO212 (Local Exchange
Processor Set-Up) and CO210 (Local Exchange Processor Duration).
Data Source/s
Network Records System (NRS).
Exchange Planning and Review System (EXPRES).
Billing records.
PG282A Local Exchange Switch Block (AXE10)
Description
This PG captures cost and balance sheet costs of AXE10 Digital LE Switch Blocks.
The switch comprises both concentrator and processor functionality, and is used for call set up and call duration.
Methodology

Plant groups
161
Plant
Group
Detailed Description and Methodology (For all descriptions below, see Appendix A for Key Destinations)
This PG follows the same methodology as PG281C above.
Data Source/s
This PG uses the same data sources as PG281C above.
PG283A Local Exchange Conc (AXE10) Call set-up
Description
This PG captures the costs and balance sheet relating to AXE10 DLE Digital Concentrator Call Set-Up.
These assets comprise both call set-up and call duration functionality. The PG contains both Capital and Maintenance
costs.
Methodology
The amount of concentrator usage for Select Service calls has to be determined. An extract of the Billing Call Record
information is gathered from a sample of ten System X Local Exchanges and analysed into whether the record type is
Select Service driven or not.
Only RT22 makes use of the Concentrator Duration element of the switch assets and the fraction of these compared
to the total (RT21+RT22+RT29) are used to determine the relative use of the Concentrator for Select Services.
RT34 is ignored in this calculation on the assumption that the Select Services to ordinary calls without Select Services
is in the same ratio for ISDN as for Analogue calls.
Billing Records are generated only for outgoing calls and do not represent all of the concentrator call set-up capacity.
The total amount of Select Service related concentrator usage is further refined relative to the quantity of Originating
Calls and Own Exchange Calls in relation to the total.
The final weighted concentrator usage percentage for Select Services is then applied to the PG cost. This cost is
apportioned to CO293 (Network Features).
The residual quantity of concentrator cost relating to Call Set-Up is apportioned to CO214 (Local Exchange
Concentrator Set-Up).
Data Source/s
Billing Records obtained from a sample of ten AXE10 and ten System X Local Exchange.
Billing records from the Meridian switch and the latest available data derived from the CRAFT Route Factors data.
ORBIT.
PG284A Local Exchange Conc (AXE10) Call Duration
Description
This PG captures the costs and balance sheet relating to AXE10 DLE Digital Concentrator Call Duration. The switch
comprises both concentrator and processor functionality, and is used for call set-up and call duration.
Methodology
RT29 ( Select Service Driven)
RT34
RT22 ( Select Service Driven)
RT21
Record Type Description
Normal subs billing records
Diverted calls and A, D and C ring backs
Activation/Deactivation of Select Services
Integrated Services Digital Network (ISDN) call records
Diagram1_PG283A

Plant groups
162
Plant
Group
Detailed Description and Methodology (For all descriptions below, see Appendix A for Key Destinations)
The amount of concentrator usage for Select Service calls has to be determined.
A sample extract of Billing Call Record information is gathered from a sample of ten System X local and ten AXE10
Local Exchanges and analysed into whether the record type is Select Service driven or not.
Only RT22 makes use of the Concentrator Duration element of the switch assets and the fraction of these compared
to the total (RT21+RT22+RT29) are used to determine the relative use of the Concentrator for Select Services.
RT34 record types are ignored in this calculation on the assumption that the Select Services to ordinary calls without
Select Services is in the same ratio for ISDN as for Analogue calls.
Billing records are generated only for outgoing calls and therefore do not represent all of the concentrator call set-up
capacity. The total amount of Select Service related concentrator usage is further refined relative to the quantity of
Originating Calls and Own Exchange Calls in relation to the total which also includes Call Terminating and DLE Transit.
The final weighted concentrator usage percentage for Select Services is then applied to the PG cost. This cost is
apportioned to CO293 (Network Features).
The residual quantity of concentrator cost relating to Call Set-Up is apportioned to CO215 (LE Concentrator Duration).
Data Source/s
Billing records from the Meridian switch and the latest available data derived from the CRAFT Route Factors data.
ORBIT.
PG285C System X Processor
Description
This PG captures the costs and balance sheet relating to System X Digital DLE Processor and Signalling which flow
through from classes of work (CoW) LDX via base PDTSYSXD.
The costs are identified by the CoW to PG exhaustion process. This enables the relative proportions of concentrator
and processor costs to be identified.
Methodology
The attribution of processor costs follows a number of steps.
The LE processor is analysed into its constituent elements:
Flexible Voice Platforms.
Alarm Utility Subsystems.
Network Interface Subsystems.
Analogue Junction Line Shelf.
This analysis is carried out on the basis of various capacity measures (such as the number of processing clusters, the
number of 2Mbit/s switch ports and the number of signalling channels) actually present in the BT Network, as shown
in Exchange Planning and Review System (EXPRES) and Processor Utilisation and Loading of Switch Equipment
RT29 ( Select Service Driven)
RT34
RT22 ( Select Service Driven)
RT21
Record Type Description
Normal subs billing records
Diverted calls and A, D and C ring backs
Activation/Deactivation of Select Services
Integrated Services Digital Network (ISDN) call records
Diagram1_PG284A

Plant groups
163
Plant
Group
Detailed Description and Methodology (For all descriptions below, see Appendix A for Key Destinations)
(PULSE).
The next step is to determine the number of switches and switching elements within each switch that would be
required to provide such capacity if the switching functionality were optimally dimensioned. This gives the number of
switch elements of each type for the purposes of this analysis.
It is necessary to carry out this step in the process because switching assets are not always purchased and recorded on
a switch element-by-element basis, and it would not otherwise be possible to determine the relative split between set
up and duration costs.
The aggregate cost within the network of each of these switch elements is determined on the basis of Local Exchange
Modernisation Programme2 (LEMP2) contract prices. The volume of each element is multiplied by the unit cost of
each element.
The elements of the processor are assigned into three main blocks:
Digital Line Termination (DLT).
Switch Block.
Processor and Signalling.
We are concerned with the Processor and Signalling only for this PG.
Based on advice from switching suppliers, the function of each switch element is analysed between call set up and call
duration. This advice showing an analysis between set-up and duration will not change on a year by year basis as the
building elements of the asset remain a constant.
Certain elements support both functions.
This overall process is illustrated below:
The cost of those switch elements that are common to both call set up and call duration functions is loaded to the cost
of those functions pro-rata to their unloaded costs:
These percentages are then weighted for the relative proportion of the PG’s total cost represented by processor costs
as opposed to concentrator costs and are used to attribute costs to processor set up CO212 and processor duration
CO210).
All of the above is based historic data until such time as the base is unfrozen. The procedures below are updated each
year and any changes mean that historic data is re-based to accommodate these.
However, the Processor usage of Select Service calls has also to be determined. An extract of billing call record
information is gathered from a sample of ten System X Local Exchanges (Data Source/s: Billing Records) and ten
AXE10 Local Exchanges then analysed into whether the record type is Select Service driven or not.
Volume (from NRS and EXPRES)
Switch Element £/% 1
A
Unit cost (from LEMP2)
Total Cost
£
Cost of call setup functionality
Cost of call duration functionality
Cost of elements supporting bothfunctions
£
£
£
£
B
AxB=C
Z
CxX
CxY
CxZ
2 3 etc Total 1+2+3 etc
P
Q
R
Diagram1_PG285C_v1
Utilisation
Setup
Duration
Both
% X
Y

Plant groups
164
Plant
Group
Detailed Description and Methodology (For all descriptions below, see Appendix A for Key Destinations)
RT34s are ignored in this calculation on the assumption that the Select Services to ordinary calls without Select
Services is in the same ratio for Integrated Services Digital Network (ISDN) as for analogue calls.
Billing records were extracted for one whole week during the year at twenty Digital LE sites in the country.
The number of processor instructions was derived for call usage types to derive a weighted processor average.
Billing records are generated only for outgoing calls and therefore do not represent all of the processing capacity. The
total amount of Network Features related processor usage is further refined relative to the quantity of Originating
Calls and Own Exchange Calls relative to the total which also includes Call Terminating any Tandem traffic.
The final weighted processor usage percentage for Network Features is then applied to the PG cost. The quantity of
processor cost relating to LE call set up and call duration is then re-based so that the new total equals 100%. This cost
is apportioned to CO293 (Network Features)
Caller Display is a subset of Network Features. The Type 29 billing record activations which are Network Features
driven also contain Calling Line Identity and these can be separately identified as a subset. The proportion of Network
Features activations relating to CLI (Calling Line Identity) is derived and this fraction is used to point costs to a
separate Caller Display Component.
The signalling usage and cost relating to other operators has yet to be determined. Information from Network
Recording System (NRS) is downloaded showing destinations including those relevant to Other Operators and
compared to the total. Signalling costs form part of the PG total costs but the separate signalling cost is clearly
identifiable so on this basis an apportionment is made from this PG to CR470 (Intra Building Circuits (IBC) Rentals).
Data Source/s
EXPRES.
Billing records from the Meridian switch and the latest available data derived from the CRAFT Route Factors data NRS.
ORBIT.
PG286C System X Local Exchange Digital Line Termination
Description
This PG captures the costs and balance sheet relating to the System X Digital DLE DLT.
The switch comprises both concentrator and processor functionality and is used for call set-up and call duration.
Methodology
The attribution of processor costs follows a number of steps.
The local exchange processor is analysed into its constituent elements:
Host Core.
C7 Signalling Links.
2Mbit/s Systems.
RT29 ( Select Service Driven)
RT34
RT22 ( Select Service Driven)
RT21
Record Type Description
Normal subs billing records
Diverted calls and A, D and C ring backs
Activation/Deactivation of Select Services
Integrated Services Digital Network (ISDN) call records
Diagram2_PG285C

Plant groups
165
Plant
Group
Detailed Description and Methodology (For all descriptions below, see Appendix A for Key Destinations)
Miscellaneous.
This analysis is carried out on the basis of various capacity measures (such as the number of processing clusters, the
number of 2Mbit/s switch ports and the number of signalling channels) actually present in the BT Network, as shown
in Network Records System (NRS) and Processor Utilisation and Loading of Switch Equipment (PULSE).
The next step is to determine the number of switches and switching elements within each switch that would be
required to provide such capacity if the switching functionality were optimally dimensioned. This gives the number of
switch elements of each type for the purposes of this analysis. It is necessary to carry out this step in the process as
switching assets is not always purchased and recorded on a switch element-by-element basis. Otherwise it would not
be possible to determine the relative split between set-up and duration costs.
The aggregate cost within the network of each of element within the switch is determined on the basis of LEMP2
contract prices ie the volume of each element is multiplied by the unit cost of each element. LEMP2 was the Local
Exchange Modernisation Programme. It set out the contract prices for the various switch elements and was
negotiated with suppliers by BT’s procurement function. The LEMP2 contract is indicative of normal course of
business and covers both local and System X main Exchanges.
Based on advice from switching suppliers, the function of each switch element is analysed as between call set-up and
call duration. This advice showing an analysis between set-up and duration will not change on a year by year basis as
the building elements of the asset remain a constant.
Certain elements support both functions.
This overall process is illustrated below:
These percentages are then weighted for the relative proportion of the PG total cost represented by processor costs as
opposed to concentrator costs and are used to attribute costs to Local Exchange Processor Set-Up CO212 and Local
Exchange Processor Duration CO210. However, the DLT cost relating to Other Communications Providers (OCPs) also
needs to be determined.
All of the above is based historic data until such time as the base is unfrozen. The procedures below are updated each
year and any changes mean that historic data is re-based to accommodate these.
Mid-year port information is downloaded from NRS. This provides the origin and destination of each 2Mbit/s port on
every Local, Trunk and Main Exchange. This data can then be manipulated to analyse where the ports are pointed,
what type of switch, of which system type and the system type involved.
The fraction of ports that point to OCPs can be identified as a fraction of the total. This percentage is then pointed at
the Interconnect Rentals component CO470. The residual amount is then re-based so that the new total equals
100% and is pointed to Local Exchange Call Set-Up and LE Call Duration.
Volume (from NRS and EXPRES)
Switch Element £/% 1
A
Unit cost (from LEMP2)
Total Cost
£
Cost of call setup functionality
Cost of call duration functionality
Cost of elements supporting bothfunctions
£
£
£
£
B
AxB=C
Z
CxX
CxY
CxZ
2 3 etc Total 1+2+3 etc
P
Q
R
Diagram1_PG286C_v1
Utilisation
Setup
Duration
Both
% X
Y

Plant groups
166
Plant
Group
Detailed Description and Methodology (For all descriptions below, see Appendix A for Key Destinations)
Data Source/s
NRS.
Exchange Planning and Review System (EXPRES).
PG287A Local Exchange Switch Block (AXE10)
Description
This PG captures the costs and balance sheet relating to the System X Digital Local Exchange Switch Block.
The switch comprises both concentrator and processor functionality, and is used for call set-up and call duration.
Methodology
The attribution of processor costs follows a number of steps.
The local exchange processor is analysed into its constituent elements:
Flexible Voice Platforms.
Alarm Utility Subsystems.
Network Interface Subsystems.
Analogue Junction Line Shelf.
This analysis is carried out on the basis of various capacity measures (such as the number of processing clusters, the
number of 2Mbit/s switch ports and the number of signalling channels) actually present in the BT Network, as shown
in Exchange Planning and Review System (EXPRES) and NRS (Network Recording System).
The next step is to determine the number of switches and switching elements within each switch that would be
required to provide such capacity. It is necessary to carry out this step in the process as switching assets are not
always purchased and recorded on a switch element-by-element basis. Otherwise it would not be possible to
determine the relative split between set-up and duration costs.
The aggregate cost within the network of each of these switch elements is determined on the basis of Local Exchange
Modernisation Programme2 (LEMP2) contract prices ie the volume of each element is multiplied by the unit cost of
each element. LEMP2 was the Local Exchange Modernisation Programme. It set out the contract prices for the various
switch elements and is negotiated with suppliers by BT’s procurement function. The LEMP2 contract is indicative of
normal course of business and covers both Local and System X Main Exchanges.
The elements of the processor are assigned into four main blocks. Digital Line Termination (DLT), Switch Block,
Processor and Signalling. For this PG we are only concerned with the switch block.
Based on advice from switching suppliers, the function of each switch element is analysed as between call set up and
call duration. Certain elements support both functions. This overall process is illustrated below:

Plant groups
167
Plant
Group
Detailed Description and Methodology (For all descriptions below, see Appendix A for Key Destinations)
These percentages are then weighted for the relative proportion of the PG total cost represented by processor costs as
opposed to concentrator costs and are used to apportion costs to CO212 (Local Exchange processor set up) and
CO210 (Local Exchange Processor Duration).
The base is currently frozen.
Data Source/s
NRS.
EXPRES.
PG288A Local Exchange Concentrator (Sys X) Call Set-Up
Description
This PG captures the costs and balance sheet relating to the System X Digital Concentrator Call Set-Up which flows
from classes of work (CoW) LDX via PDTSYSXD. The switch comprises both concentrator and processor functionality,
and is used for call set-up and call duration.
Methodology
The processor call related costs (DLT, Switch Block and Processor and Signalling) are attributed to CO210 Local
Exchange processor duration and CO212 LE Processor set-up. Additional apportionment is made from the Local
Exchange DLT PG to Interconnect Connections and from Local Exchange Processor to Chargeable Services (Select
Services). The costs are identified by the CoW to PG exhaustion process. This enables the relative proportions of
concentrator and processor costs to be identified.
The attribution of Concentrator Call Set-Up costs follows a number of steps and the procedures below are updated
each year.
The amount of concentrator usage for Select Service calls has to be determined. An extract of billing call record
information is gathered from a sample of ten System X Local Exchanges and ten AXE10 Local Exchanges analysed into
whether the record type is Select Service driven or not.
Only RT22s make use of the Concentrator Set-Up element of the switch assets and the fraction of these compared to
Volume (from NRS and EXPRES)
Switch Element £/% 1
A
Unit cost (from LEMP2)
Total Cost
£
Cost of call setup functionality
Cost of call duration functionality
Cost of elements supporting bothfunctions
£
£
£
£
B
AxB=C
Z
CxX
CxY
CxZ
2 3 etc Total 1+2+3 etc
P
Q
R
Diagram1_PG2867A_v1
Utilisation
Setup
Duration
Both
% X
Y
RT29 ( Select Service Driven)
RT34
RT22 ( Select Service Driven)
RT21
Record Type Description
Normal subs billing records
Diverted calls and A, D and C ring backs
Activation/Deactivation of Select Services
Integrated Services Digital Network (ISDN) call records
Diagram2_PG288A

Plant groups
168
Plant
Group
Detailed Description and Methodology (For all descriptions below, see Appendix A for Key Destinations)
the total (Calls and Own Exchange Calls in relation to the total which also includes Call Terminating and DLE Transit.
The final weighted concentrator usage percentage for Select Services is then applied to the PG. This cost is
apportioned to CO293 (Network Features).
The residual quantity of concentrator cost relating to Call Set-Up is pointed to CO214 Local Exchange Concentrator
Set-Up.
RT21+RT22+RT29 are used to determine the relative use of the Concentrator for Select Services.
RT34 record types were ignored in this calculation on the assumption that the Select Services to ordinary calls without
Select Services is in the same ratio for ISDN as for Analogue calls.
Billing records are generated only for outgoing calls and therefore do not represent all of the concentrator call set-up
capacity.
The total amount of Select Service related concentrator usage is further refined relative to the quantity of Originating
Calls and Own Exchange Calls in relation to the total which also includes Call Terminating and DLE Transit.
The final weighted concentrator usage percentage for Select Services is then applied to the PG. This is further split into
Select Services relating to Wholesale and Retail by using volumes from ORBIT The retail fraction is pointed at CO290
OR Network Features - external and the Wholesale fraction at CO291 OR Network Features - internal.
The residual quantity of concentrator cost relating to Call Set-Up is pointed to CO214 Local Exchange Concentrator
Set-Up.
The PG contains both Capital and Maintenance costs.
Data Source/s
Billing records from the Meridian switch and the latest available data derived from the CRAFT Route Factors data.
ORBIT.
PG289A Local Exchange Concentrator (Sys X) Call Duration
Description
This PG captures costs and balance sheet relating to System X DLE Digital Concentrator Call Duration which flows from
classes of work (CoW) LDX via PDTSYSXD.
The System X switch comprises both concentrator and processor functionality, and is used for call set-up and call
duration.
Methodology
The processor call related costs (Digital Line Termination (DLT), Switch Block and Processor and Signalling) are
attributed to CO210 Local Exchange processor duration and CO212 LE Processor Set-Up. Additional apportionments
are made from the LE DLT PG to Interconnect Connections and from LE Processor to Chargeable Services (Select
Services). The costs are identified by the CoW to PG exhaustion process.
This enables the relative proportions of concentrator and processor costs to be identified. The attribution of
Concentrator Duration costs follows a number of steps.
The procedures below are updated each year.
The amount of concentrator usage for Select Service calls has to be determined. An extract of billing call record
information is gathered from a sample of ten System X Local Exchanges and ten AXE10 Local Exchanges analysed into

Plant groups
169
Plant
Group
Detailed Description and Methodology (For all descriptions below, see Appendix A for Key Destinations)
whether the record type is Select Service driven or not.
Only RT22s make use of the Concentrator Duration element of the switch assets and the fraction of these compared
to the total (RT21+RT22+RT29) are used to determine the relative use of the Concentrator for Select Services. RT34s
are ignored in this calculation on the assumption that the Select Services to ordinary calls without Select Services is in
the same ratio for ISDN as for Analogue calls. Billing records are generated only for outgoing calls and therefore do
not represent all of the concentrator call set-up capacity.
The total amount of Select Service related concentrator usage is further refined relative to the quantity of Originating
Calls and Own Exchange Calls in relation to the total which also includes Call Terminating and Call Originating.
The final weighted concentrator usage percentage for Select Services is then applied to the PG cost. This is further
split into Select Services relating to Wholesale and Retail by using volumes from ORBIT. This cost is apportioned to
CO293 Network Features.
The residual quantity of concentrator cost relating to Call Set-Up is pointed to CO215 LE Concentrator Duration. The
PG contains both Capital and Maintenance costs.
Data Source/s
Billing records from the Meridian switch and the latest available data derived from the CRAFT Route Factors data.
ORBIT.
PG300T PPC Point of Handover
Description
This PG captures costs and balance sheet associated with providing customer sited point of handover equipment.
Methodology
Costs from this PG are allocated to CO379 (Point of Handover Electronics).
PG301T SDH Tier 0 Equipment
Description
This PG captures depreciation costs and asset values of the link element of Global Backhaul bearers. Bearers provide
the transmission capability for the circuits that support BT’s Products.
Global Backhaul bearers are at Tier 0 (zero) in the core transmission network. This tier is associated with international
circuits between Digital International Switching Centres (DISCs) and Satellite earth stations as well as international
private circuits.
Methodology
Costs from this PG are allocated to CB367 (ISC to Frontier Link).
PG311T,
PG313T,
SDH Tier Equipment
RT29 ( Select Service Driven)
RT34
RT22 ( Select Service Driven)
RT21
Record Type Description
Normal subs billing records
Diverted calls and A, D and C ring backs
Activation/Deactivation of Select Services
Integrated Services Digital Network (ISDN) call records
Diagram1_PG289A

Plant groups
170
Plant
Group
Detailed Description and Methodology (For all descriptions below, see Appendix A for Key Destinations)
PG315T,
PG321T,
PG323T,
PG325T,
PG331T,
PG333T,
PG335T,
PG341T,
PG343T,
PG345T,
PG351T,
PG353T,
PG355T,
PG359T,
PG381T,
PG383T,
PG385T
Description
These Plant Groups (PGs) capture the depreciation, maintenance and other overhead (eg accommodation) costs and
asset values associated with the link elements of SDH and MSH (Marconi Synchronous Hierarchy) bearers.
SDH and MSH are types of technology that form part of BT’s Core Transmission network. Combinations of these assets
(ie two bits of electronics joined by fibre and duct) make up what is known as a “bearer”. The bearers within the
network carry circuits that relate to different products and bandwidths. More detail can be found in Section 9 Data
Sources under CTCS (Core Transmission Costing System).
Different PGs exist to differentiate the different tiers of bearers in the network and their transmission rate.
Tier 0 is the highest level in the network, intended to handle international traffic.
Tier 1 is the long haul intricate or backbone network. It consists of 4/1 and 4/4 cross connect switches. A cell or
Supercell is an additional ring between Tiers 1 and 2.
Tier 2 is the Regional network linking important cities and local towns. Every Tier 2 ring is dual parented on two
separate Tier 1 nodes.
Tier 3 is the level used for Booster schemes.
Tier 4 is the access network for SDH Customers.
MSH is the high capacity platform to cater for traffic at 140Mbit/s and above.
SDH bearers have various transmission rates as indicated by the Synchronous Transport Module (STM).
STM1 – 155Mbit/s. [MSH STM1 Equipment]
STM4 – 622Mbit/s.
STM16 – 2.48Gbit/s. [MSH STM16 Equipment]
STM64 – 10Gbit/s. [MSH STM64 Equipment]
Methodology
The costs and asset values on these PGs are apportioned to network components (representing circuits) based on how
the circuits use the bandwidth of a bearer. The relationship between circuits and bearers is held in CTCS. Extracts from
CTCS give us the data required to derive an allocation, specifically:
The bearer equipment that a circuit ‘Hits’ along its route.
The factored volumes (reflecting relative usage of capacity) of the circuit segments carried by a bearer together
with the length of these segments.
In general a bearer can support many circuits. The cost of an individual bearer is therefore apportioned across all the
segments of circuits carried by the bearer.
The apportionment of cost is based on a factored volume which is calculated by factoring the raw volume (circuit-
bearer equipment hits) figure by a usage factor:
The usage factor is the proportion of the total bandwidth of a bearer used by a circuit. For example a 155Mbit/s SDH
bearer can support 63 2Mbit/s circuits, 3 34Mbit/s circuits or a single 155Mbit/s circuit so a 2Mbit/s circuit would
have a usage factor of one 63rd of a 155Mbit/s bearer whereas a 34Mbit/s circuit would have a usage factor of a
third.
PG341T, PG343T and PG345T relate to the Tier 4 bearers and need to be split between both Core and Access
components. However in CTCS we only see the data for Core components. To calculate the split between the Core and
Access elements we the use the output of the base PDTSDH (SDH electronic assets). To derive an appropriate
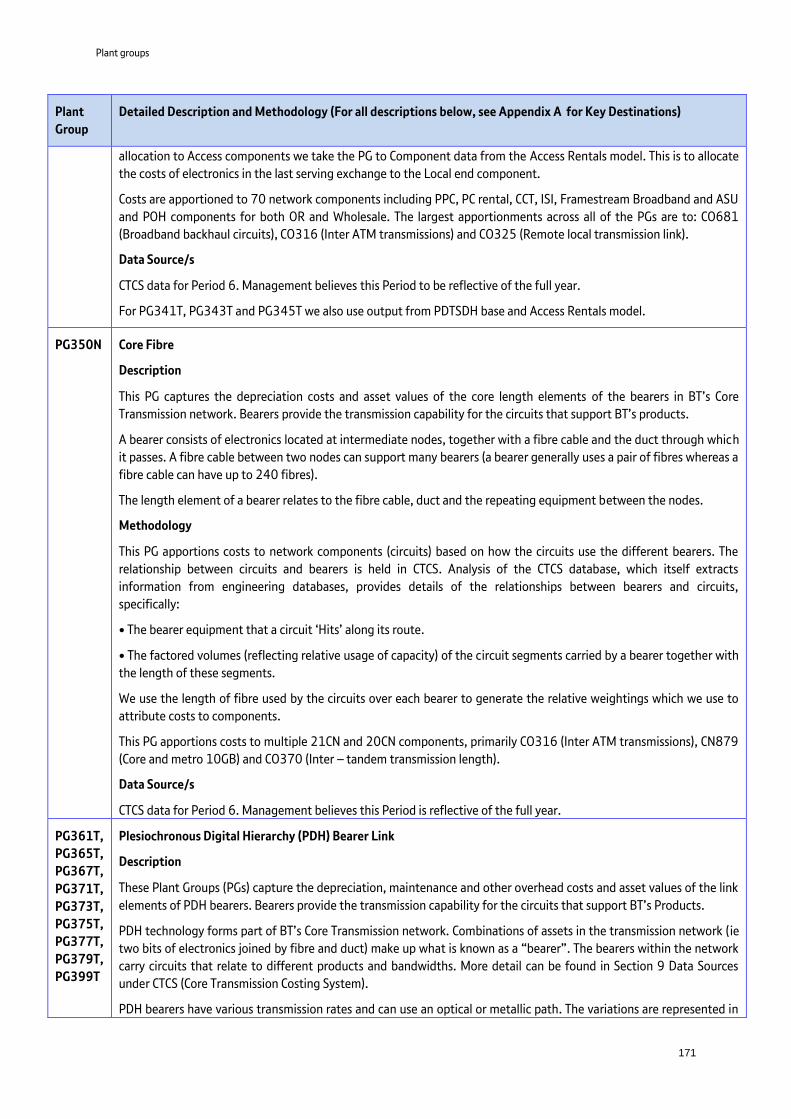
Plant groups
171
Plant
Group
Detailed Description and Methodology (For all descriptions below, see Appendix A for Key Destinations)
allocation to Access components we take the PG to Component data from the Access Rentals model. This is to allocate
the costs of electronics in the last serving exchange to the Local end component.
Costs are apportioned to 70 network components including PPC, PC rental, CCT, ISI, Framestream Broadband and ASU
and POH components for both OR and Wholesale. The largest apportionments across all of the PGs are to: CO681
(Broadband backhaul circuits), CO316 (Inter ATM transmissions) and CO325 (Remote local transmission link).
Data Source/s
CTCS data for Period 6. Management believes this Period to be reflective of the full year.
For PG341T, PG343T and PG345T we also use output from PDTSDH base and Access Rentals model.
PG350N Core Fibre
Description
This PG captures the depreciation costs and asset values of the core length elements of the bearers in BT’s Core
Transmission network. Bearers provide the transmission capability for the circuits that support BT’s products.
A bearer consists of electronics located at intermediate nodes, together with a fibre cable and the duct through which
it passes. A fibre cable between two nodes can support many bearers (a bearer generally uses a pair of fibres whereas a
fibre cable can have up to 240 fibres).
The length element of a bearer relates to the fibre cable, duct and the repeating equipment between the nodes.
Methodology
This PG apportions costs to network components (circuits) based on how the circuits use the different bearers. The
relationship between circuits and bearers is held in CTCS. Analysis of the CTCS database, which itself extracts
information from engineering databases, provides details of the relationships between bearers and circuits,
specifically:
• The bearer equipment that a circuit ‘Hits’ along its route.
• The factored volumes (reflecting relative usage of capacity) of the circuit segments carried by a bearer together with
the length of these segments.
We use the length of fibre used by the circuits over each bearer to generate the relative weightings which we use to
attribute costs to components.
This PG apportions costs to multiple 21CN and 20CN components, primarily CO316 (Inter ATM transmissions), CN879
(Core and metro 10GB) and CO370 (Inter – tandem transmission length).
Data Source/s
CTCS data for Period 6. Management believes this Period is reflective of the full year.
PG361T,
PG365T,
PG367T,
PG371T,
PG373T,
PG375T,
PG377T,
PG379T,
PG399T
Plesiochronous Digital Hierarchy (PDH) Bearer Link
Description
These Plant Groups (PGs) capture the depreciation, maintenance and other overhead costs and asset values of the link
elements of PDH bearers. Bearers provide the transmission capability for the circuits that support BT’s Products.
PDH technology forms part of BT’s Core Transmission network. Combinations of assets in the transmission network (ie
two bits of electronics joined by fibre and duct) make up what is known as a “bearer”. The bearers within the network
carry circuits that relate to different products and bandwidths. More detail can be found in Section 9 Data Sources
under CTCS (Core Transmission Costing System).
PDH bearers have various transmission rates and can use an optical or metallic path. The variations are represented in

Plant groups
172
Plant
Group
Detailed Description and Methodology (For all descriptions below, see Appendix A for Key Destinations)
by the different PGs.
2Mbit/s. [PDH Metal and PDH Optical]
8Mbit/s. [PDH Optical]
34Mbit/s. [PDH Metal and PDH Optical]
140Mbit/s. [PDH Metal and PDH Optical]
565Mbit/s. [PDH Optical]
Methodology
The costs and asset values on these PGs are apportioned to network components (representing circuits) based on how
the circuits use the bandwidth of a bearer. The relationship between circuits and bearers is held in CTCS. Extracts from
CTCS give us the data required to derive an allocation, specifically:
The bearer equipment that a circuit ‘Hits’ along its route.
The factored volumes (reflecting relative usage of capacity) of the circuit segments carried by a bearer together
with the length of these segments.
In general a bearer can support many circuits. The cost of an individual bearer is therefore apportioned across all the
segments of circuits carried by the bearer.
The apportionment of cost is based on a factored volume which is calculated by factoring the raw volume (circuit-
bearer equipment hits) figure by a usage factor:
The usage factor is the proportion of the total bandwidth of a bearer used by a circuit. For example a 155Mbit/s SDH
bearer can support 63 2Mbit/s circuits, 3 34Mbit/s circuits or a single 155Mbit/s circuit so a 2Mbit/s circuit would
have a usage factor of one 63rd of a 155Mbit/s bearer whereas a 34Mbit/s circuit would have a usage factor of a
third.
These PGs apportion costs to more than 40 network components.
The most significant cost apportionments are to CO325 (Remote local transmission link), CO360 (Inter -tandem
transmission link), and CF371 (OR PC Rental 2Mbit/s link per km distribution).
Data Source/s
CTCS Database for Period 6 Management believes this Period to be reflective of the full year.
PG391T,
PG393T,
PG395T
Plesiochronous Digital Hierarchy (PDH) Radio Bearer Link
Description
These Plant Groups (PGs) capture the depreciation costs and asset values of the link elements of PDH Radio bearers.
Radio Bearers provide the core microwave radio transmission capability for the circuits that support BT’s Products.
Radio bearers are predominantly used for high capacity, city to city routes (eg London to Birmingham) and in
inaccessible areas (such as remote parts of Scotland).
PDH Radio bearers have various transmission rates which are represented by the different PGs:
8Mbit/s.
34Mbit/s.
140Mbit/s.

Plant groups
173
Plant
Group
Detailed Description and Methodology (For all descriptions below, see Appendix A for Key Destinations)
Methodology
The costs and asset values on these PGs are allocated to network components (circuits) based on how the circuits use
the bandwidth of a bearer. The relationship between circuits and bearers is held in CTCS. Extracts from CTCS give us
the data required to derive an allocation, specifically:
The bearer equipment that a circuit ‘Hits’ along its route.
The factored volumes (reflecting relative usage of capacity) of the circuit segments carried by a bearer together
with the length of these segments.
In general a bearer can support many circuits. The cost of an individual bearer is therefore apportioned across all the
segments of circuits carried by the bearer.
The apportionment of cost is based on a factored volume which is calculated by factoring the raw volume (circuit-
bearer equipment hits) figure by a usage factor:
The usage factor is the proportion of the total bandwidth of a bearer used by a circuit. For example a 155Mbit/s SDH
bearer can support 63 2Mbit/s circuits, 3 34Mbit/s circuits or a single 155Mbit/s circuit so a 2Mbit/s circuit would
have a usage factor of one 63rd of a 155Mbit/s bearer whereas a 34Mbit/s circuit would have a usage factor of a
third.
These PGs apportion costs to eleven network components.
The most significant cost apportionments are to CF371 (OR PC Rental 2Mbi/s link per km distribution), CO325
(Remote local transmission link), and CL189 (ISDN30 access).
Data Source/s
CTCS data for Period 6. Management believes this Period to be reflective of the full year.
PG400T ACE (Access Control Equipment) / ENA (Equipment Network Access) Core Equipment
Description
This PG captures the network transmission costs associated with ACE/ENA core equipment. This equipment is used to
supply Kilostream.
Types of cost include depreciation, stores and pay costs.
Methodology
Costs from this PG are allocated to CF381 (Openreach PC Rental 64Kbit/s link).
PG401A Netstream Equipment
Description
This PG captures the costs associated with Netstream. Netstream is a Retail Product offering that enables mobile
network operators (MNOs) to backhaul their traffic from their cell sites (satellite sites) to their core networks (at major
customer sites).
Methodology
Costs from this PG are allocated to CO401 (Netstream equipment).
PG405A DMS100 Call Centre Switches
Description
This PG captures the equipment costs associated with DMS100 Call Centre Switches. The DMS100 (Digital Multiplexer

Plant groups
174
Plant
Group
Detailed Description and Methodology (For all descriptions below, see Appendix A for Key Destinations)
System) is a digital facility that processes OA (Operator Assistance) telephone calls.
Methodology
Costs from this PG are allocated to CO405 (DMS 100 call centre).
PG408A Carrier Pre Selection Customer Set-Up
Description
This PG captures the cost of CPS Customer Set Up. CPS allows customers to select to have certain call types carried by
another network operator.
Methodology
Costs from this PG are allocated to CO408 (Carrier pre selection customer setup).
PG411C Analogue Private Circuit Equipment
Description
This PG captures the capital cost of dedicated plant associated with Private Analogue Circuits and allied specialised
applications.
Methodology
Costs from this PG are allocated to CK982 (Openreach Managed Services for Wholesale).
PG411P Analogue Private Circuit Connections
Description
This PG captures the connection costs of providing analogue circuits for National Business Customers. The work takes
place primarily within the transmission network.
Methodology
Costs from this PG are allocated to CO411 (Analogue PC link Connection circuit provision).
PG412C Local End Equipment 64kbit/s
This PG captures the depreciation costs associated with 64Kbit/s (Kilostream) private circuits.
Methodology
Costs from this plant group are allocated to CO432 (PC rental 64Kbit link local end).
PG412M Local End Equipment 64kit/s Repair
Description
This PG captures the maintenance costs associated with 64Kbit/s (Kilostream) private circuits.
Methodology
Costs from this PG are allocated to CO432 (PC rentals 64Kbit/s link local end).
PG412P 64Kbit/s Private Circuit Connections
Description
This PG captures the connection costs of providing Kilostream circuits. The work takes place primarily within the
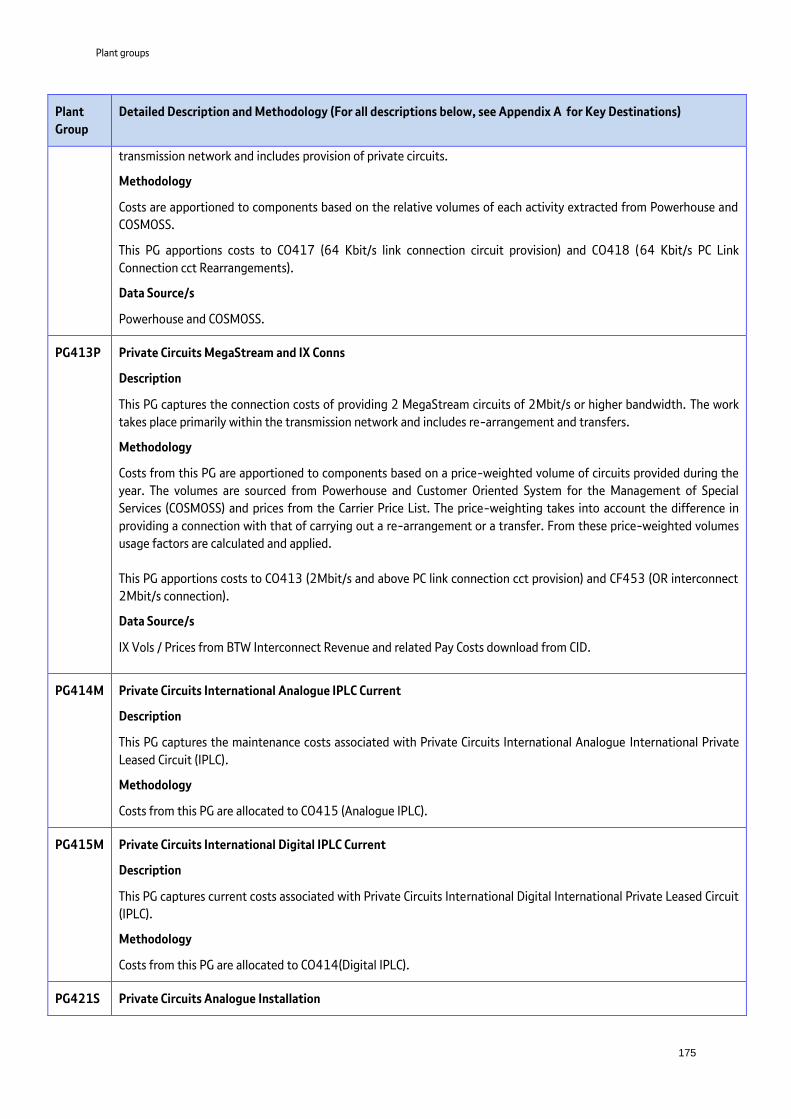
Plant groups
175
Plant
Group
Detailed Description and Methodology (For all descriptions below, see Appendix A for Key Destinations)
transmission network and includes provision of private circuits.
Methodology
Costs are apportioned to components based on the relative volumes of each activity extracted from Powerhouse and
COSMOSS.
This PG apportions costs to CO417 (64 Kbit/s link connection circuit provision) and CO418 (64 Kbit/s PC Link
Connection cct Rearrangements).
Data Source/s
Powerhouse and COSMOSS.
PG413P Private Circuits MegaStream and IX Conns
Description
This PG captures the connection costs of providing 2 MegaStream circuits of 2Mbit/s or higher bandwidth. The work
takes place primarily within the transmission network and includes re-arrangement and transfers.
Methodology
Costs from this PG are apportioned to components based on a price-weighted volume of circuits provided during the
year. The volumes are sourced from Powerhouse and Customer Oriented System for the Management of Special
Services (COSMOSS) and prices from the Carrier Price List. The price-weighting takes into account the difference in
providing a connection with that of carrying out a re-arrangement or a transfer. From these price-weighted volumes
usage factors are calculated and applied.
This PG apportions costs to CO413 (2Mbit/s and above PC link connection cct provision) and CF453 (OR interconnect
2Mbit/s connection).
Data Source/s
IX Vols / Prices from BTW Interconnect Revenue and related Pay Costs download from CID.
PG414M Private Circuits International Analogue IPLC Current
Description
This PG captures the maintenance costs associated with Private Circuits International Analogue International Private
Leased Circuit (IPLC).
Methodology
Costs from this PG are allocated to CO415 (Analogue IPLC).
PG415M Private Circuits International Digital IPLC Current
Description
This PG captures current costs associated with Private Circuits International Digital International Private Leased Circuit
(IPLC).
Methodology
Costs from this PG are allocated to CO414(Digital IPLC).
PG421S Private Circuits Analogue Installation

Plant groups
176
Plant
Group
Detailed Description and Methodology (For all descriptions below, see Appendix A for Key Destinations)
Description
This PG captures the connection costs in providing and rearranging analogue circuits..
Methodology
Costs from this PG are allocated to CO421 (OR Analogue PC installation).
PG422S Private Circuits Analogue Installation
Description
This PG captures the connection costs in providing and rearranging KiloStream circuits.
Methodology
Costs are apportioned to components based on the relative volumes of each activity from Powerhouse and COSMOSS.
This PG apportions costs to CO417 (64Kbit/s link connection circuit provision) and CO418 (64 Kbit/s PC Link
Connection cct Rearrangements)
Data Source/s
Powerhouse and COSMOSS.
PG440C Local End Equipment ASDH 4x2Mbit/s Equipment
Description
This PG captures the depreciation costs for ASDH 4x2 Bearer/Line systems, that is, electronics equipment for a
Bearer/Line System capacity of 4x2Mbit/s.
Methodology
The attribution of the PG costs to components is based on the number of circuits of different types that are carried
over bearers that use these Bearer/Line Systems.
These 4x2 bearers are used in the provision of 2Mbit/s private circuits, interconnection circuits, PPCs (Partial Private
Clients) and SMDS (Switched Multimegabit Data Services). Each of these circuit types has its own component and the
PG costs are attributed to them based on the relative circuit count of each component sourced from CTCS.
This PG apportions costs to various components, primarily CL189 (ISDN30 access) and CO439 (PC rentals 2Mbit/s
local end fibre)
Data Source/s
The data source for the number of circuits is the CTCS for Period 6. Management believes this period to be reflective of
the full year.
PG440M Local End Equipment ASDH 4x2Mbit/s Maintenance
Description
This PG captures the costs associated with maintenance of ASDH 4x2 Line systems, ie electronics equipment that can
carry up to 4x2Mbit/s bearers.
Methodology
The attribution of the PG costs to components is based on the number of circuits of different types that are carried
over bearers that use these line systems and follows the attribution of the Capital costs (PG440C).
This assumes that a line system with only (for example) private circuits connected to it has the same maintenance

Plant groups
177
Plant
Group
Detailed Description and Methodology (For all descriptions below, see Appendix A for Key Destinations)
profile as the same line systems with only (for example) interconnect circuits. This assumption is consistent with BT’s
experience of maintenance in this area.
PG441C Local End Equipment ASDH 16x2Mbit/s Equipment
Description
This PG captures the depreciation costs for ASDH 16x2 Bearer/Line systems, electronics equipment for a Bearer/Line
System capacity of 16x2Mbit/s. Types of cost include depreciation, stores and pay costs.
Methodology
The attribution of the PG costs to components is based on the number of circuits of different types that are carried
over bearers that use these Bearer/Line Systems.
These line systems are used in the provision of 2Mbit/s private circuits, interconnection circuits, PPCs (Partial Private
Clients) and SMDS (Switched Multimegabit Data Services) and the PG costs are therefore attributed to the
components that are used in the provision of these services.
This PG apportions costs to multiple components, primarily CL189 (ISDN30 access) and CO439 (PC rentals 2Mbit/s
local end fibre).
Data Source/s
The data source for the number of circuits is CTCS for Period 6 Management believes this period to be reflective of the
full year.
PG441M Local End Equipment ASDH 16x2Mbit/s Maintenance
Description
This PG captures the costs associated with maintenance of ASDH 16x2 Line systems, ie electronics equipment that can
carry up to 16x2Mbit/s bearers.
Methodology
The attribution of the PG costs to components is based on the number of circuits of different types that are carried
over bearers using these line systems and follows the attribution of the Capital costs (PG441C).
Data Source/s
Core Transmission Circuit costing System (CTCS) for Period 6. Management believes this period to be reflective of the
full year.
PG442C Local End Equipment 2Mbit/s (Copper) Equipment
Description
This PG captures the depreciation costs for 2Mbit/s copper Bearer/Line systems, ie electronics equipment that
supports 2Mbit/s circuits carried over copper pairs. The circuits are almost wholly 2Mbit/s private circuits, but there is
a small number of interconnect circuits carried over copper.
Methodology
The attribution of the PG costs to components is based on the number of circuits of different types (obtained from
CTCS) that are carried over bearers that use these line systems. As PG443C covers both 2Mbit/s and 4x2Mbit/s
circuits, the volume of each type of circuit is weighted by the cost of the relevant electronics.
These line systems are used in the provision of 2Mbit/s private circuits, interconnection circuits, PPCs (Partial Private
Circuits) and SMDS (Switched Multimegabit Data Services) and the PG costs are therefore apportioned to the

Plant groups
178
Plant
Group
Detailed Description and Methodology (For all descriptions below, see Appendix A for Key Destinations)
components that are used in the provision of these services.
The PG costs are apportioned to multiple components pro-rata to these volumes, primarily CL189 (ISDN30 access)
and CO438 (PC rentals 2Mbit/s local end (Copper).
Data Source/s
The data source for the number of circuits is CTCS. Circuit numbers are based on Period 6 and are believed by
management to be representative of the full year.
PG442M Local End Equipment 2Mbit/s (Copper) Maintenance
Description
This PG captures the maintenance costs for 2Mbit/s copper Bearer/Line systems, ie electronics equipment that
supports 2Mbit/s circuits carried over copper pairs. The circuits are almost wholly 2Mbit/s Private Circuits, but a small
number of interconnect circuits are carried over copper.
Methodology
The attribution of the PG costs to components is based on the number of circuits of different types (obtained from
CTCS) that are carried over bearers that use these line systems. These line systems are used in the provision of 2Mbit/s
private circuits, interconnection circuits, PPCs (Partial Private Clients) and SMDS (Switched Multimegabit Data
Services) and the PG costs are therefore attributed to the components that are used in the provision of these services.
This base follows the attribution of the Capital costs (see PG442C). This assumes that a line system with only (for
example) private circuits connected to it has the same maintenance profile as the same line systems with only
interconnect circuits (for example). This assumption is consistent with BT’s experience of maintenance in this area.
Data Source/s
Powerhouse volumes and Core Transmission Circuit costing System (CTCS) data for Period 6. Management believes this
period to be reflective of the full year.
PG443C Local End Equipment 2Mbit/s (Fibre) Equipment
Description
This PG captures the depreciation costs for 2Mbit/s Bearer/Line systems ie electronics equipment that supports
2Mbit/s circuits carried over fibre.
Methodology
The attribution of the PG costs to components is based on the number of circuits of different types (obtained from
CTCS) that are carried over bearers that use these line systems. As PG443C covers both 2Mbit/s and 4x2Mbit/s
circuits, the volume of each type of circuit is weighted by the cost of the relevant electronics.
These line systems are used in the provision of 2Mbit/s private circuits, interconnection circuits, PPCs (Partial Private
Circuits) and SMDS (Switched Multimegabit Data Services) and the PG costs are therefore apportioned to the
components that are used in the provision of these services.
The PG costs are apportioned to multiple components pro-rata to these volumes, primarily CL189 (ISDN30 access)
and CO439 (PC rentals 2Mbit/s local end fibre).
Data Source/s
The data source for the number of circuits is CTCS. Circuit numbers are based on Period 6 and are believed by
management to be representative of the full year.

Plant groups
179
Plant
Group
Detailed Description and Methodology (For all descriptions below, see Appendix A for Key Destinations)
PG443M Local End Equipment 2Mbit/s (Fibre) Maintenance
Description
This PG Captures the maintenance costs for 2Mbit/s Bearer/Line systems ie electronics equipment that supports
2Mbit/s circuits carried over fibre.
Methodology
The attribution of the PG costs to components is based on the number of circuits of different types (obtained from
CTCS) that are carried over bearers that use these line systems. These line systems are used in the provision of 2Mbit/s
private circuits, interconnection circuits, PPCs (Partial Private Clients) and SMDS (Switched Multimegabit Data
Services) and the PG costs are therefore attributed to the components that are used in the provision of these services.
This base follows the attribution of the Capital costs (see PG443C). This assumes that a line system with only (for
example) private circuits connected to it has the same maintenance profile as the same line systems with only
interconnect circuits (for example). This assumption is consistent with BT’s experience of maintenance in this area.
Data Source/s
The data source for the number of circuits is CTCS. Circuit numbers are based on Period 6 and are believed by
management to be representative of the full year.
PG444C Local End Equipment 34Mbit/s Equipment
Description
This PG Captures the depreciation costs for 34Mbit/s Bearer/Line systems ie electronics equipment on which circuits
with a bandwidth of up to and including 34Mbit/s can travel over.
Methodology
The attribution of the PG costs to components is based on the number of bandwidth specific circuits that are carried
over 34Mbit/s bearers/Line Systems. These line systems are used to provide a medium for the circuits to travel over.
CTCS holds a record of the total number of circuit types that use 34Mbit/s line systems. Circuits for 34Mbit/s and
above are taken from CTCS circuit volumes, whereas the 2Mbit/s volumes are derived from the balance of total bearer
volumes less the volume of 34Mbit/s and above circuits.
It is necessary to take into account the different capacity utilisation of each circuit. A 34Mbit/s line system can
support 1x34Mbit/s circuit or 16x2Mbit/s circuits. So for example the number of 2Mbit/s circuits is therefore
weighted by a factor of 16, to reflect the capacity utilisation, and express the number of 2Mbit/s circuits in terms of
their 34Mbit/s equivalent.
This PG apportions costs to the components that are used in the provision of line system services, primarily CL189
(ISDN30 access), CO439 (PC rentals 2Mbit/s local end fibre) and CO432 (PC rentals 64Kbit/s link local end).
Data Source/s
CTCS. The circuit numbers are based on Period 6 and are believed by management to be representative of the full year.
PG444M Local End Equipment 34Mbit/s Maintenance
Description
This PG captures the maintenance costs for 34Mbit/s Bearer/Line systems ie electronics equipment that supports
34Mbit/s circuits carried over fibre.
Methodology

Plant groups
180
Plant
Group
Detailed Description and Methodology (For all descriptions below, see Appendix A for Key Destinations)
The attribution of the PG costs to components is based on the number of circuits of different types that are carried
over bearers that use these line systems and follows the attribution of the capital costs (see PG444C).
This assumes that a line system with only (for example) 2Mbit/s private circuits connected to it has the same
maintenance profile as the same line system with only (for example) 34Mbit/s circuits. This assumption is consistent
with BT’s actual experience of maintenance in this area.
Data Source/s
CTCS. The circuit numbers are based on Period 6 and are believed by management to be representative of the full year.
PG445C Local End Equipment 140Mbit/s Equipment
Description
This PG captures the depreciation costs for 140Mbit/s Bearer/Line systems ie electronics equipment on which circuits
with a bandwidth of up to and including 140Mbit/s can travel over.
Methodology
The attribution of the PG costs to components is based on the number of bandwidth specific circuits that are carried
over 140Mbit/s bearers/Line Systems.
These line systems are used to provide a medium for the circuits to travel over.
CTCS holds a record of the total number of circuit types that use 140Mbit/s line systems. Circuits for 34Mbit/s and
above are taken from CTCS circuit volumes, whereas the 2Mbit/s volumes are derived from the balance of total bearer
volumes less the volume of 34Mbit/s and above circuits.
It is necessary to take into account the different capacity utilisation of each circuit. A 140Mbit/s line system can
support one 140Mbit/s circuit or four 34Mbit/s circuits, or 63 2Mbit/s circuits, or some Combination of 34 and
2Mbit/s circuits. The number of 2Mbit/s interconnect circuits is therefore weighted by a factor of 63, to reflect the
capacity utilisation, and express the number of 34Mbit/s circuits in terms of their 140Mbit/s equivalent. Similarly, the
number of 34Mbit/s circuits is weighted by a factor of four.
This PG apportions costs to the components that are used in the provision of line system services, primarily Co452
(Interconnect local end rental 2Mbit/s) and CO439 (PC rentals 2Mbit/s local end fibre).
Data Source/s
CTCS. The circuit numbers are based on Period 6 and are believed by management to be representative of the full year.
PG445M Local End Equipment 140Mbit/s Maintenance
Description
This PG captures the maintenance costs for 140Mbit/s Bearer/Line systems ie electronics equipment that supports
140Mbit/s circuits carried over fibre.
Methodology
The attribution of the PG costs to components is based on the number of circuits of different types that are carried
over bearers that use these line systems and follows the attribution of the Capital costs (see PG445C).
This assumes that a line system with only 2Mbit/s private circuits connected to it has the same maintenance profile as
the same line system with only 34Mbit/s circuits. This assumption is consistent with BT’s experience of maintenance in
this area.
Data Source/s

Plant groups
181
Plant
Group
Detailed Description and Methodology (For all descriptions below, see Appendix A for Key Destinations)
The data source for the number of circuits is CTCS.
The circuit numbers are based on Period 6 and are believed by management to be representative of the full year.
PG446C Local End Equipment 622Mbit/s Equipment
Description
This PG captures the costs for 622Mbit/s Bearer/Line systems ie electronics equipment on which circuits with a
bandwidth of up to and including 622Mbit/s can travel over.
Methodology
The attribution of the PG costs to components is based on the number of bandwidth specific circuits that are carried
over 622Mbit/s bearers/Line Systems.
These line systems are used to provide a medium for the circuits to travel over and the PG costs are therefore
attributed to the components that are used in the provision of these services.
CTCS holds a record of the total number of circuit types that use 622Mbit/s line systems. Circuits for 34Mbit/s and
above are taken from CTCS circuit volumes, whereas the 2Mbit/s volumes are derived from the balance of total bearer
volumes less the volume of 34Mbit/s and above circuits.
It is necessary to take into account the different capacity utilisation of each circuit. A 622Mbit/s line system can
support one 622Mbit/s circuit, four 140Mbit/s circuits, 16 34Mbit/s circuits, or 252 2Mbit/s circuits, or some
Combination of 140, 34 and 2Mbit/s circuits. The number of 2Mbit/s interconnect circuits is therefore weighted by a
factor of 252, to reflect the capacity utilisation, and express the number of these circuits in terms of their 622Mbit/s
equivalent. Similarly, the number of 140Mbit/s circuits is weighted by a factor of four and the number of 34Mbit/s
circuits is weighted by a factor of 16.
This PG apportions costs to CO452 (Interconnect local end rental 2Mbit/s) and CO439 (PC rentals 2Mbit/s local end
fibre).
Data Source/s
The data source for the number of circuits is CTCS.
The circuit numbers are based on Period 6 and are believed by management to be representative of the full year.
PG446M Local End Equipment 622Mbit/s Maintenance
Description
This PG captures the maintenance costs for 622Mbit/s Bearer/Line systems, electronics equipment that supports
622Mbit/s circuits carried over fibre.
Methodology
The attribution of the PG costs to components is based on the number of circuits of different types that are carried
over bearers that use these line systems and follows the attribution of the capital costs (see PG446C).
This assumes that a line system with only (for example) 2Mbit/s private circuits connected to it has the same
maintenance profile as the same line system with only (say) 34Mbit/s circuits. This assumption is consistent with BT’s
actual experience of maintenance in this area.
CTCS holds a record of the total number of circuit types that use 622Mbit/s line systems. Circuits for 34Mbit/s and
above are taken from CTCS circuit volumes, whereas the 2Mbit/s volumes are derived from the balance of total bearer
volumes less the volume of 34Mbit/s and above circuits.
It is necessary to take into account the different capacity utilisation of each circuit. A 622Mbit/s line system can

Plant groups
182
Plant
Group
Detailed Description and Methodology (For all descriptions below, see Appendix A for Key Destinations)
support 1 622Mbit/s circuit, 4 140Mbit/s circuits, 16 34Mbit/s circuits, or 252 2Mbit/s circuits, or some
Combination of 140, 34 and 2Mbit/s circuits. The number of 2Mbit/s interconnect circuits is therefore weighted by a
factor of 252, to reflect the capacity utilisation, and express the number of these circuits in terms of their 622Mbit/s
equivalent. Similarly, the number of 140Mbit/s circuits is weighted by a factor of 4 and the number of 34Mbit/s
circuits is weighted by a factor of 16.
Data Source/s
CTCS. The circuit numbers are based on Period 6 and are believed by management to be representative of the full year.
PG447A Ethernet Access Equipment
Description
This PG captures costs associated with the dedicated plant connected with the SHDS Products and is wholly assigned
to the SHDS components. Where customers are using Local Area Networks (LAN) to access and exchange data at one
site, SHDS Products enables them to extend the LAN to other sites.
Methodology
Costs from this PG are allocated toCO485 (Ethernet electronics).
PG448A CCTV Rental
Description
This PG captures costs associated with the rental of CCTV circuits.
Methodology
Costs from this PG are allocated to CW617 (Other Ethernet rentals - internal).
PG448L CCTV Connection
Description
This PG captures costs associated with the connection of CCTV circuits.
Methodology
Costs from this PG are allocated to CW619 (Other Ethernet Connection - Internal).
PG461A Private Circuits Test and Maintenance System
Description
This PG captures the costs associated with Private Circuit maintenance and testing work carried out in the Work
Manager Control Centres. It includes jeopardy management of jobs, Work Manager Helpdesk and administration costs.
Methodology
Costs from this PG are allocated to CO461 (Private Circuit test system).
PG462A Private Circuits Customer Premises
Description
This PG captures the cost of dealing with Private Circuit maintenance and faulting work in customer premises on
analogue private circuits and access lines.
Methodology

Plant groups
183
Plant
Group
Detailed Description and Methodology (For all descriptions below, see Appendix A for Key Destinations)
Costs from this PG are allocated to CK982 (Openreach Managed Services for Wholesale).
PG463A Private Circuits Testing
Description
This PG captures the cost of dealing with Private Circuit maintenance and testing carried out in the Work Manager
Control Centres. It includes jeopardy management of jobs, Work Manager Helpdesk and administration costs. It also
captures the cost of time spent by exchange maintenance people in co-operation with field people for line test in
order to localise a fault.
Methodology
Costs from this PG are allocated to CK982 (Openreach Managed Services for Wholesale).
PG483A Flexible Bandwidth Services (FBS)
Description
This PG captures the costs associated with the FBS product. The FBS product offers a flexible private virtual network
providing the customer with both re-routing, on demand, to pre-determined destinations and band width flexibility
within agreed limits.
Methodology
Costs from this PG are allocated to CO483 (Flexible Bandwidth Services).
PG502B SG&A Openreach Sales Product Management
Description
This PG captures the Profit and Loss (Current non-ETG Pay) and Balance Sheet (Fixed Asset, Gross Book Value (GBV)
costs associated with Organisational Unit Code (OUC) BP. BP is the Sales and Product Management division of
Openreach. As the various sub-teams support specific services, their costs cannot be spread on a Direct pay or revenue
basis.
Methodology
Costs from this PG are allocated to CP502 (Openreach Sales Product Management).
PG504B Number Portability Operational Management
Description
This PG captures the cost and balance sheet associated with Organisational Unit Code (OUC) BM. BM is the Service
division of Openreach. The teams within BM are primarily call centre based, with staff supporting the provisioning and
repair of Openreach services. This facility enables a telephone customer to retain their phone number if they switch to
another CP.
Methodology
Costs from this PG are allocated to CO732 (Number Portability Set-up costs).
PG506N Customer Support Partial Private Circuits
Description
This PG captures the cost and balance sheet of the SG&A activity in BT Wholesale supporting PPCs.
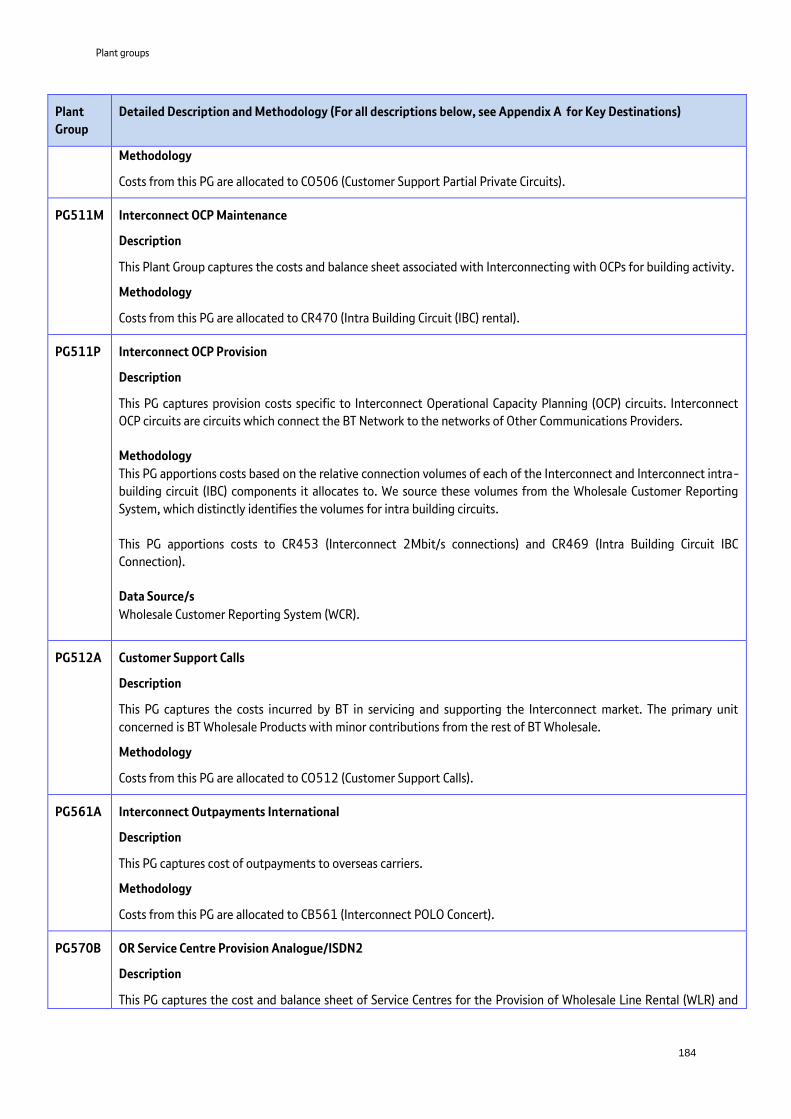
Plant groups
184
Plant
Group
Detailed Description and Methodology (For all descriptions below, see Appendix A for Key Destinations)
Methodology
Costs from this PG are allocated to CO506 (Customer Support Partial Private Circuits).
PG511M Interconnect OCP Maintenance
Description
This Plant Group captures the costs and balance sheet associated with Interconnecting with OCPs for building activity.
Methodology
Costs from this PG are allocated to CR470 (Intra Building Circuit (IBC) rental).
PG511P Interconnect OCP Provision
Description
This PG captures provision costs specific to Interconnect Operational Capacity Planning (OCP) circuits. Interconnect
OCP circuits are circuits which connect the BT Network to the networks of Other Communications Providers.
Methodology
This PG apportions costs based on the relative connection volumes of each of the Interconnect and Interconnect intra-
building circuit (IBC) components it allocates to. We source these volumes from the Wholesale Customer Reporting
System, which distinctly identifies the volumes for intra building circuits.
This PG apportions costs to CR453 (Interconnect 2Mbit/s connections) and CR469 (Intra Building Circuit IBC
Connection).
Data Source/s
Wholesale Customer Reporting System (WCR).
PG512A Customer Support Calls
Description
This PG captures the costs incurred by BT in servicing and supporting the Interconnect market. The primary unit
concerned is BT Wholesale Products with minor contributions from the rest of BT Wholesale.
Methodology
Costs from this PG are allocated to CO512 (Customer Support Calls).
PG561A Interconnect Outpayments International
Description
This PG captures cost of outpayments to overseas carriers.
Methodology
Costs from this PG are allocated to CB561 (Interconnect POLO Concert).
PG570B OR Service Centre Provision Analogue/ISDN2
Description
This PG captures the cost and balance sheet of Service Centres for the Provision of Wholesale Line Rental (WLR) and

Plant groups
185
Plant
Group
Detailed Description and Methodology (For all descriptions below, see Appendix A for Key Destinations)
ISDN2.
Methodology
Costs from this PG are allocated to CL570 (OR Service Centre - Provision WLR/PSTN/ISDN2).
PG571B OR Service Centre Provision ISDN30
Description
This PG captures the cost and balance sheet Service Centre for the Provision of Wholesale Line Rental ISDN30.
Methodology
Costs from this PG are allocated to CL571 (OR Service Centre - Provision WLR ISDN30).
PG572B OR Service Centre Provision LLU
Description
This PG captures the cost and balance sheet Service Centre for the Provision of Wholesale Line Rental (WLR) Local
Loop Unbundling.
Methodology
Costs from this PG are allocated to CL572 (OR Service Centre - Provision LLU).
PG573B OR Service Centre Provision Ethernet
Description
This PG captures the cost and balance sheet Service Centre for the Provision of Wholesale Line Rental Ethernet.
Methodology
Costs from this PG are allocated to CL573 (OR Service Centre - Provision Ethernet).
PG574B OR Service Centre Provision NGA
Description
This PG captures the cost and balance sheet Service Centre for the Provision of Next Generation Access (NGA).
Methodology
Costs from this PG are allocated to CL574 (OR Service Centre - Provision NGA).
PG575B OR Service Centre Assurance WLR PSTN/ISDN2
Description
This PG captures the cost and balance sheet Service Centre for the Assurance Wholesale Line Rental (WLR)
PSTN/ISDN2.
Methodology
Costs from this PG are allocated to CL575 (OR Service Centre - Assurance WLR/PSTN/ISDN2).
PG576B OR Service Centre Assurance WLR ISDN30
Description

Plant groups
186
Plant
Group
Detailed Description and Methodology (For all descriptions below, see Appendix A for Key Destinations)
This PG captures the cost and balance sheet Service Centre for the Assurance Wholesale Line Rental ISDN30.
Methodology
Costs from this PG are allocated to CL576 (OR Service Centre - Assurance WLR ISDN30).
PG577B OR Service Centre Assurance LLU
Description
This PG captures the cost and balance sheet of assurance LLU costs associated with Organisational Unit Code (OUC)
BV. BV is the Service division of Openreach. The teams within BV are primarily call centre based, with staff supporting
the provisioning and repair of Openreach services. As the various teams support specific services, their costs cannot be
spread on a direct pay or revenue basis.
Methodology
Costs from this PG are allocated to CL577 (OR Service Centre - Assurance LLU).
PG578B OR Service Centre Assurance Ethernet
Description
This PG captures the cost and balance sheet of assurance Ethernet.
Methodology
Costs from this PG are allocated to CL578 (OR Service Centre - Assurance Ethernet).
PG579B OR Service Centre Assurance NGA
Description
This PG captures the cost and balance sheet of Assurance Next Generation Access (NGA).
Methodology
Costs from this PG are allocated to CL579 (OR Service Centre - Assurance NGA).
PG580B Broadband Boost
Description
This PG captures the Openreach engineering costs associated with Broadband Boost jobs. Broadband Boost is a
solution to improving speed, quality and reliability of customer’s Broadband service.
Methodology
Costs from this PG are allocated to CO580 (Broadband Boost).
PG583N SG&A Wholesale Residual
Description
This PG costs and balance sheet of the SG&A activity by BT Wholesale supporting unregulated products which will
include Wholesale calls.
Methodology
Costs from this PG are allocated to CO583 (SG&A Wholesale Residual).

Plant groups
187
Plant
Group
Detailed Description and Methodology (For all descriptions below, see Appendix A for Key Destinations)
PG584N SG&A Wholesale Other
Description
This PG captures the costs and balance sheet of the SG&A activity by BT Wholesale supporting unregulated products
which will include Managed Wholesale Ethernet.
Methodology
Costs from this PG are allocated to CO584 (SG&A Wholesale other).
PG585A SG&A Downstream Residual
Description
This PG costs and balance sheet of the SG&A activity by BT Wholesale supporting unregulated downstream products.
Products included in this category will include Agile Media and Media and Broadcast.
Methodology
Costs from this PG are allocated to CO585 (SG&A downstream residual).
PG586N SG&A Interconnect
Description
This PG costs and balance sheet of the SG&A activity by BT Wholesale supporting the Interconnect market.
Methodology
Costs from this PG are allocated to CO586 (SG&A Interconnect).
PG590B LLU Service Level Guarantees External
Description
This PG captures costs associated with External LLU SLG costs..
Methodology
Costs from this PG are allocated to CL590 (External Local Loop Unbundling SLGs).
PG591B LLU Service Level Guarantees Internal
Description
This PG captures costs associated with Internal LLU SLG costs.
Methodology
Costs from this PG are allocated to CL590 (External Local Loop Unbundling SLGs).
PG599A Interconnect Outpayments Inland
Description
This PG captures the cost of Interconnect payments made to Other Communication Providers (OCPs).
Methodology
Costs from this PG are allocated to CB599 (Interconnect Payments to OLOs).

Plant groups
188
Plant
Group
Detailed Description and Methodology (For all descriptions below, see Appendix A for Key Destinations)
PG609N SG&A Broadband
Description
This PG captures the costs and balance sheet of the SG&A activity by BT Wholesale supporting the Wholesale
Broadband Access markets.
Methodology
Costs from this PG are allocated to CO609 (Customer Support Broadband).
PG622A Public Payphones Operations
Description
These Plant Groups (PG) captures the costs and balance sheet associated with the Openreach’s maintenance of BT
Retail Public Payphone kiosks.
Methodology
This PG allocates Openreach (OUC B) costs to CF446 (Public Payphones Lines) and all other OUCs’ costs to CR446
(Public Payphones Operations).
PG622B Public Payphones Operations (Openreach)
Description
These Plant Groups (PG) captures the Profit and Loss (P&L) and Balance Sheet costs associated with the Openreach’s
maintenance of BT Retail Public Payphone kiosks.
Methodology
This PG follows the same methodology as PG622A above.
PG653A ATM Customer Interface 2Mbit/s Cards
Description
This PG captures the cost of capital expenditure incurred from the deployment of 2Mbit/s Customer Interface Cards,
namely, the cost of equipment provision, rearrangement or recovery. These costs fall within the ATM classes of work
(CoW). This equipment is located in the ATM PoP (Point of Presence) at the edge of the ATM Network and links the
customer's premises via a private circuit, to the ATM network.
Methodology
Costs from this PG are allocated to CO310 (ATM customer interface 2Mbit/s).
PG654A ATM Customer Interface 34Mbit/s Cards
Description
This PG captures the cost of capital expenditure incurred from the deployment of 34Mbit/s Customer Interface Cards,
namely, the cost of equipment provision, rearrangement or recovery. These costs fall within the classes of work (CoW).
The types of cost include pay and stores costs. This equipment is located in the ATM PoP (Point of Presence) at the
edge of the ATM Network and links the customer's premises via a private circuit, to the ATM network.
Methodology
Costs from this PG are allocated to CO311 (ATM customer interface 34Mbit/s).

Plant groups
189
Plant
Group
Detailed Description and Methodology (For all descriptions below, see Appendix A for Key Destinations)
PG656A ATM Network Switching
Description
This PG captures the cost of network switching ports deployed in the ATM platform. ATM is a high throughput packet
switching protocol that provides statistical multiplexing, broadband (multimegabit) data rates, multiple virtual circuits
per network access, and flexible bandwidth per connection.
Methodology
Costs from this PG are allocated to CO314 (ATM Network Switching).
PG657A FrameStream Switch
Description
This PG captures the cost of Frame relay equipment booked to the Asynchronous Transfer Mode (ATM) classes of work
(CoW). This CoW falls within the ATMR asset policy code. The ATMR asset policy code captures the costs for all frame
relay equipment. Frame relay equipment is a small network which works alongside the ATM.
FrameStream/Frame Relay is a simple, cost effective, frame relay-based Virtual Private Network (VPN) solution that
supports high-speed data and Internet Protocol (IP) connectivity in the UK and abroad.
Methodology
Costs from this PG are allocated to CO657 (FrameStream Switch).
PG658A ATM Customer Interface >155Mbit/s Cards
Description
This PG captures the cost of capital expenditure incurred from the deployment of 155Mbit/s and higher bandwidth
Customer Interface Cards, namely, the cost of equipment provision, rearrangement or recovery. These costs fall within
the ATM classes of work (CoW).
ATM is a high throughput packet switching protocol that provides statistical multiplexing, broadband (multimegabit)
data rates, multiple virtual circuits per network access, and flexible bandwidth per connection.
Methodology
Costs from this PG are allocated to CO312 (ATM customer interface > 155Mbit/s).
PG659A ATM Network Interface Cards
Description
This PG captures the cost of capital expenditure incurred from the deployment of Network Interface Cards, namely,
the cost of equipment provision, rearrangement or recovery. These costs fall within the ATM classes of work (CoW).
Types of cost include pay and stores pay.
ATM is a high throughput packet switching protocol that provides statistical multiplexing, broadband (multimegabit)
data rates, multiple virtual circuits per network access, and flexible bandwidth per connection.
Methodology
Costs from this PG are allocated to CO313 (ATM Network Interface).
PG667A IP International Peering
Description

Plant groups
190
Plant
Group
Detailed Description and Methodology (For all descriptions below, see Appendix A for Key Destinations)
This PG captures the cost of:
Gigabit Routers, connecting International transmission and peering links to USA, Europe. Gigabit Routers is a high
bandwidth switch, used for switching Internet traffic.
Links for World Wide Web (www) Products - anything that uses the Internet such as BTnet and WebPort. BTnet
Dial IP service provides remote dial-in access to corporate networks so they can extend their Intranet and
Extranet and offers Internet Service Providers (ISPs) with dial ports via BT’s fully managed high speed dial
network.
Methodology
Costs from this PG are allocated to CO667 (IP International Peering).
PG668A IP Network Management
Description
This PG captures the costs of IP Network Management including all the costs associated with Operational Support
Systems (OSS) – these are activities used to run the network and business. Typical activities that are part of OSS are
taking a customer’s order, configuring network components, logging and managing faults. The types of cost include
pay and stores costs.
Methodology
Costs from this PG are allocated to CO668 (IP Network Management).
PG669A IP Network Dial IP
Description
This PG captures the cost of the following types of equipment:
IP Dial Ports. Dial Ports connect Public Switched Telephone Network (PSTN) to IP Network.
Dial Access Routers. Dial Access Routers connect Dial Ports into IP Network.
Home Gateway Routers. Home Gateway Routers are customer specific eg ISP (Internet Service Provider).
Methodology
Costs from this PG are allocated to CO669 (IP Network Dial IP).
PG670A IP Network Fixed Access
Description
This PG captures the cost of the following types of equipment:
BTnet Direct and Flex NTE (Network Terminal Equipment) Routers, which connect the customer to the BT
Network.
BTnet Access Routers, which connect the MSIP (Multi Services Intranet Platform) and Synchronous Digital
Hierarchy (SDH) access to the IP Network at Colossus PoPs (Point of Presences).
Methodology
Costs from this PG are allocated to CO670 (IP Network Fixed Access).
PG671A IP Network VPN

Plant groups
191
Plant
Group
Detailed Description and Methodology (For all descriptions below, see Appendix A for Key Destinations)
Description
This PG captures the cost of the platform that delivers the following VPN products: Metro, Equip, and Internet
Protocol (IP) Clear and Ethernet delivery services (eg Fusion and IP Clear).
There are three main types of equipment in this platform:
Provider Edge Routers, used to terminate customer ports.
Provider Router, used to route traffic through network.
Catalyst Switch, used to aggregates traffic into a Provider router.
Methodology
Costs from this PG are allocated to CO671 (IP Network VPN).
PG672A IP Network Broadband
Description
This PG captures the cost of the following types of equipment:
Remote Authentication Servers (RAS) (which connect Asymmetric Digital Subscriber Line (ADSL) users into IP
cloud, for direct connection to the Internet Service Provider Home Gateways.
Broadband Access Routers, which connect RAS into IP cloud.
Broadband Service Provider Home Gateways.
Methodology
Costs from this PG are allocated to CO672 (IP Network Broadband).
PG673A IP Network BT Intranet
Description
This PG captures the cost of the Command Control Router Network (CCRN) or Information Network (iNet). Command
Control Router Network (CCRN) is a BT internal structure for the transport of management traffic.
Methodology
Costs from this PG are allocated to CO673 (IP Network BT Intranet).
PG674A IP Core/Colossus
Description
This PG captures the cost of:
Gigabit Core Routers.
Catalyst LAN (Local Area Network).
Switches that aggregate and link router ports from the IP back bone core.
Methodology
Costs from this PG are allocated to CO674 (IP Core Node Equipment).
PG675A IP VOIP Infrastructure

Plant groups
192
Plant
Group
Detailed Description and Methodology (For all descriptions below, see Appendix A for Key Destinations)
Description
VoIP is a method of transporting speech over the internet.
This PG captures the cost of the following types of equipment:
Gigabit Routers - Gigabit Routers are high bandwidth switches, used for switching Internet traffic.
Gateways and Access Routers are for transmitting voice over the IP Network.
Costs include provision, extension, rearrangement and recovery of IP Networks by the Broadband and Data division in
BT Wholesale.
Methodology
Costs from this PG are allocated to CO675 (IP VoIP Platform).
PG676A IP (Internet Protocol) Applications
Description
This PG captures the cost of DNS (Domain Name Servers). DNS convert IP addresses into world wide web (www)
format and vice versa. It also contains Radius Dial, Radius Broadband Servers, Mail and News servers.
Methodology
Costs from this PG are allocated to CO674 (IP Core Node Equipment).
PG678A SIP Servers
Description
This PG captures the cost of the SIP server equipment. SIP is a signalling protocol used for establishing sessions in an IP
network.
Methodology
Costs from this PG are allocated to CO678 (SIP Servers).
PG721A Circuit Provision Digital Higher Order
Description
This PG attributes the Profit and Loss (Engineering/non-Engineering Pay, Stores issues, Other payments) costs
associated with the provision, cessation and re-arrangement of Higher Order circuits. Higher Order Circuits are 2M or
above circuits used for Public Switched Telephony Network (PSTN) or private circuits.
Methodology
Costs are apportioned based on the number of Higher Order circuits provided, ceased and rearranged over the
reporting period. For full year reporting this is based on the number of aforementioned circuit changes between
September (Period 6) prior year and September current year. This information is sourced from the Core Transmission
Costing System (CTCS).
Costs are apportioned to multiple components, primarily CO330(Local tandem transmission link), CO360 (Inter
tandem transmission link) and CO468 (In Span Interconnect circuits ISI transmission).
PG722A Circuit Provision (CP) Digital Public Network
Description
This PG captures the Profit and Loss (Engineering/non-Engineering Pay, Stores issues, Other payments) costs

Plant groups
193
Plant
Group
Detailed Description and Methodology (For all descriptions below, see Appendix A for Key Destinations)
associated with the provision of transmission circuits for the digital Public Switched Telephony Network (PSTN). This
transmission network consists of Remote Concentrator to Local Exchange, Local Exchange to Trunk/Tandem Exchange
and Inter-Tandem/Trunk circuits.
Methodology
Costs are apportioned based on the number of PSTN transmission circuits provided, ceased and rearranged over the
reporting period. This information is sourced from the Core Transmission Costing System (CTCS).
This PG apportions costs to CO325 (Remote – local transmission link), CO330 (Local – tandem transmission link) and
CO360 (inter – tandem transmission link).
Data Source/s
CTCS provides a count of the number of PSTN transmission circuits provided, ceased and rearranged over the reporting
period. For full year reporting this is based on the number of aforementioned circuit changes between September
(Period 6) prior year and September current year.
PG723A Circuit Provision Analogue Public Nwk
This PG attributes the Profit and Loss (Engineering/non-Engineering Pay, Stores issues, Other payments) costs
associated with the provision, cessation and re-arrangement of circuits for the analogue public network.
Methodology
Costs are apportioned based on the number of circuits provided, ceased and rearranged over the reporting period. This
information is sourced from the Core Transmission Costing System (CTCS).
Costs are apportioned to CO325 (Remote local transmission link) and CO330 (Local tandem transmission link).
PG732A Generic Data Amendments Network Costs
This PG attributes the cost of making data amendments at the switch to allow the switch to recognise new and
amended routing details, such as new numbers, new lines and new CPS (Carrier Pre-Select) customers.
Methodology
The attribution is made on the basis of the number of local and main exchanges in the network. Data amendments are
more numerous and more time consuming for Main Exchanges than for Local Exchanges, so each Main Exchange is
weighted by a factor of three. This factor is determined on the basis of the experience and expertise of the data
amendment team, being a management estimate. This gives an estimate of the time and hence relative cost for data
amendments on Local relative to Main Exchanges.
Costs are apportioned to CO212 (Local exchange processor set up) and CO220 (Main exchange set up).
PG761A Special Applications SMDS (Switched Multimegabit Data Service)
This PG captures the Profit and Loss (Pay, Depreciation) and Balance Sheet (Asset value) cost of specific switching
equipment associated with the provision of the SMDS.
Methodology
Costs from this plant group are allocated to CR781 (WH SMDS).
PG771A Special Applications Other Development
Description
This PG captures provision of Microconnect equipment.

Plant groups
194
Plant
Group
Detailed Description and Methodology (For all descriptions below, see Appendix A for Key Destinations)
Methodology
Costs from this PG are allocated to CB782 (Development).
PG772A Openreach Systems and Development (Product Specific)
Description
This PG captures the cost of Research and Development (R&D) projects undertaken by Technology Service &
Operations on behalf of Openreach, that are specific to Products eg Local Loop Unbundling (LLU), Wholesale Line
Rental (WLR) and Ethernet. This PG is therefore for Openreach development projects that specifically relate to
Products. Development projects can range from high-level strategy down to operational and logistical development.
Development project costs are apportioned according to the nature of the individual projects.
Methodology
We analyse the FAR for CoWs COMPS and COMPG for Openreach LoB. We use the “Asset Description” and “Subgroup
Description” fields to ascertain which specific products (of which there are three relevant to OR: Local Loop
Unbundling (LLU), Wholesale Line Rental (WLR) or Ethernet) the asset entry in the FAR relates to.
We apportion costs to the components that relate to the specific products identified in this exercise. We use the
proportion of current year depreciation for each asset that relates to a particular product class over total depreciation
of all relevant assets to apportion costs to the components.
This PG apportions costs to CL139 (Local Loop Unbundling systems development), CL144 (Wholesale Access specific)
and CO772 (Openreach Systems Development Ethernet Specific).
Data Source/s
Fixed Asset Register (FAR) for Class of Work COMPS & COMPG for Openreach.
PG823P BT Own Use Private Circuits
Description
This PG captures those provision costs of BT own use private circuits, which can be identified directly from the ledger
systems, along with associated overheads. The cost is allocated to component based on management’s knowledge of
the relationship between service and components.
Methodology
Costs from this PG are allocated to CO823 (BT Own Use PC Provision).
PG855A Border Gateway and Signalling Firewall
Description
This Plant Group (PG) captures the Capital costs of the Border Gateway and Signalling Firewall costs contained within
Metro Nodes. The Border Gateway provides a connectivity point or POSI (Point of Service interconnect) for Other
Communication Providers (OCPs) into the 21CN network.
Methodology
The cost is allocated to component based on management’s knowledge of the relationship between service and
components.
Allocates 100% to the Border Gateway and Signalling Firewall component CN867.

Plant groups
195
Plant
Group
Detailed Description and Methodology (For all descriptions below, see Appendix A for Key Destinations)
PG857A Copper MSAN Combi Cards Broadband element
Description
This Plant Group (PG) captures the capital costs of the Broadband element of Combi Cards contained within Multi
Service Access Nodes (MSANs). Line cards are the electronic cards in the exchange that provide connectivity to the
switch.
Methodology
The cost is allocated to component based on management’s knowledge of the relationship between service and
components.
Allocates 100% to CN854 (Combi Card Broadband).
PG859A Copper MSAN Control Access
Description
This Plant Group (PG) captures the capital costs of the control and common elements of a Copper Multi Service Access
Node (MSAN) that are relevant to line cards. Line cards are the electronic cards in the exchange that provide
connectivity to the switch.
Methodology
The depreciation cost of the network element is apportioned across the services which it supports based on the
volumes applicable to each service using the network element. The cost now allocated to each service is split between
the components based on management’s knowledge of the relationship between service and components.
Costs are apportioned to the line card components:
• CN853 Combi Card and CMSAN Access Voice
• CN890 EES & MSAN Access Broadband
Data Source/s
CAPEX analysis from BT Technology, Service & Operations (BT TSO), LoP list (Asset Life).
Volumes are from: GVF for calls, GVF and WELF for WBA.
PG860A Copper MSAN Control Transport
Description
This Plant Group (PG) captures the capital costs of the control and common elements of a MSAN that are relevant to
the transport of calls or traffic through the switch.
Methodology
The control/common element of the Copper MSAN is exhausted to the traffic component that utilises the Copper
MSAN.
The cost is allocated to component based on management’s knowledge of the relationship between service and
components.
Allocates 100% to CN890 (EES and MSAN Access - Broadband).
PG861A Copper MSAN ISDN30 cards
Description

Plant groups
196
Plant
Group
Detailed Description and Methodology (For all descriptions below, see Appendix A for Key Destinations)
This Plant Group (PG) captures the capital costs of ISDN30 contained within MSANs. Line cards are the electronic cards
in the exchange that provide connectivity to the switch.
Methodology
The cost is allocated to component based on management’s knowledge of the relationship between service and
components.
Allocates 100% to the 21CN ISDN30 component CN851.
PG862A Copper MSAN SDSL cards =<2Mbit/s
Description
This Plant Group (PG) captures the capital costs of SDSL contained within MSANs. Line cards are the electronic cards in
the exchange that provide connectivity to the switch. Types of cost include depreciation, stores and pay costs.
Methodology
The cost is allocated to component based on management’s knowledge of the relationship between service and
components.
Costs are allocated to CN851 (21CN ISDN30).
PG863A Copper-Fibre MSAN Length
Description
This PG captures the Capital costs associated with transmission length related elements (Fibre and Duct) between a
CMSAN and a FMSAN.
Methodology
Costs from this PG are allocated to CN859 (EAD).
PG864A Copper-Fibre MSAN Link
Description
This PG captures the Capital costs associated with transmission electronics between a CMSAN and a FMSAN. Types of
cost include Non-ETG Pay and Fixed Assets.
Methodology
Costs from this PG are allocated to CN859 (EAD).
PG865A Core-Core Length
Description
This Plant Group (PG) captures the Capital costs associated with transmission Length related elements (Duct and Fibre)
between a Core Node and another Core Node.
Methodology
The depreciation cost of the network element is apportioned across the services which it supports based on the
volumes applicable to each service using the network element. The cost now allocated to each service is split between
the components based on management’s knowledge of the relationship between service and components.
Because volume data used in the 21CN apportionment model contains a mixture of actual bandwidth used (such as for
WBMC service volumes) and headline bandwidth sold (such as for downstream Ethernet service volumes), the Ethernet

Plant groups
197
Plant
Group
Detailed Description and Methodology (For all descriptions below, see Appendix A for Key Destinations)
services have a factor applied to their volumes so that they also reflect actual utilisation. This utilisation factor is
calculated separately for Harmonised Ethernet and MEAs services, and is based on detailed samples at selected
exchanges. TSO regularly verify the volumes derived from these sample based assumptions by comparing against the
total traffic over the 21C network.
This Plant Group uses the utilisation factors for the allocations to both Harmonised Ethernet and MEAs services.
The volumes of WCC used for this Plant Group’s allocation have been multiplied down by a factor of 10% in order to
reflect that the majority of WCC traffic does not traverse the core network.
This Plant Group allocates to EBDs by assuming that c2% of EBDs use metro-core and core-core links to provide
resilience back to a single Metro for EBD, calculated based on historic estimates of the number of external resilient
EBDs using metro/core transmission compared to the total number of EBDs. The need for the EBD allocation is due to
each ‘EBD site’ being linked via a WDM chain to two metro nodes. In a small number of cases where resilience is
required to Metro node ‘A’ the resilient link uses EBD to Metro node ‘B’ and then metro-core and core-core links back
to Metro node ‘A’.
To split EBD costs between resilience and extended reach, a weighting of costs is created by comparing the number of
resilient lines for any EBDs that are not extended reach to the volume of extended reach resilient circuits.
For TVC, because the bandwidth volume loaded onto the residual TVC service is the total multicast bandwidth volume
across the 21CN, the total volume will not be relevant to each individual part of the network. It is assumed that 11%
of the total TVC volume is relevant to core transmission and is used in apportioning costs for this plant group. This is
calculated based on the number of routes between each section of the network where TVC is multicast.
For Harmonised Ethernet and MEAs we include a product network turn-around factor, to reflect how all Ethernet
traffic will not traverse the full core network. It is assumed that 100% of the traffic flows into the tier 1 Edge
Ethernet Switches, but that a diminishing amount of Ethernet driven bandwidth flows over the Metro nodes, outer
core nodes, and inner core nodes. This is calculated by comparing all Etherflow bandwidths’ A end and B ends by
location, with the % that does not flow from or to a metro node being used to reduce the factor applied for metro
node plant groups, and the % of etherflows that do not reach outer and then inner core nodes being used to reduce
the factor for core plant group apportionments.
The traffic components that are recipients are:
• CN906 Core-Core Broadband Transmission
• CN866 POSI - POSI Length Voice.
• CN879 Core and Metro 10GB.
• CN902 Core Metro HE/MEAS.
• CN617 Ethernet Backhaul Direct extended reach.
• CN618 Ethernet Backhaul Direct Resilience.
Data Source/s
CAPEX analysis from BT Technology, Service & Operations (BT TSO), LOPLIST (Asset Life)
Volumes are from: GVF for Calls; GVF and WELF for WBA; Skytide for WCC; GVF for TVC; for HE/MEAs circuits are
sourced from GVF, the number of bandwidth and circuit ends are sourced from PACs, and then CUG ID data (customer
ID code from MIS system) and status data of circuit orders from Enterprise Information Oracle Platform (EIP) are used
to provide the etherways and the class of service for the PWE3 etherflows in order to show bandwidth per end user;
EBD volumes are sourced from GVF; Core to Core 10Gbit/s Links are sourced from Discoverer.
PG866A Core-Core Link

Plant groups
198
Plant
Group
Detailed Description and Methodology (For all descriptions below, see Appendix A for Key Destinations)
Description
This Plant Group (PG) captures the Capital costs associated with transmission electronics between a Core Node and
another Core Node.
Methodology
The depreciation cost of the network element is apportioned across the services which it supports based on the
volumes applicable to each service using the network element. The cost now allocated to each service is split between
the components based on management’s knowledge of the relationship between service and components.
Because volume data used in the 21CN apportionment model contains a mixture of actual bandwidth used (such as for
WBMC service volumes) and headline bandwidth sold (such as for downstream Ethernet service volumes), the Ethernet
services have a factor applied to their volumes so that they also reflect actual utilisation. This utilisation factor is
calculated separately for Harmonised Ethernet and MEAs services, and is based on detailed samples at selected
exchanges. TSO regularly verify the volumes derived from these sample based assumptions by comparing against the
total traffic over the 21C network.
This Plant Group uses the utilisation factors for the allocations to both Harmonised Ethernet and MEAs services.
The volumes of WCC used for this Plant Group’s allocation have been multiplied down by a factor of 10% in order to
reflect that the majority of WCC traffic does not traverse the core network.
This Plant Group allocates to EBDs by assuming that c2% of EBDs use metro-core and core-core links to provide
resilience back to a single Metro for EBD, calculated based on historic estimates of the number of external resilient
EBDs using metro/core transmission compared to the total number of EBDs. The need for the EBD allocation is due to
each ‘EBD site’ being linked via a WDM chain to two metro nodes. In a small number of cases where resilience is
required to Metro node ‘A’ the resilient link uses EBD to Metro node ‘B’ and then metro-core and core-core links back
to Metro node ‘A’.
To split EBD costs between resilience and extended reach, a weighting of costs is created by comparing the number of
resilient lines for any EBDs that are not extended reach to the volume of extended reach resilient circuits.
For TVC, because the bandwidth volume loaded onto the residual TVC service is the total multicast bandwidth volume
across the 21CN, the total volume will not be relevant to each individual part of the network. It is assumed that 11%
of the total TVC volume is relevant to core transmission and is used in apportioning costs for this plant group. This is
calculated based on the number of routes between each section of the network where TVC is multicast.
For Harmonised Ethernet and MEAs we include a product network turn-around factor, to reflect how all Ethernet
traffic will not traverse the full core network. It is assumed that 100% of the traffic flows into the tier 1 Edge
Ethernet Switches, but that a diminishing amount of Ethernet driven bandwidth flows over the Metro nodes, outer
core nodes, and inner core nodes. This is calculated by comparing all Etherflow bandwidths’ A end and B ends by
location, with the % that does not flow from or to a metro node being used to reduce the factor applied for metro
node plant groups, and the % of etherflows that do not reach outer and then inner core nodes being used to reduce
the factor for core plant group apportionments
The traffic components that are recipients are:
• CN906 Core-Core Broadband Transmission.
• CN879 Core and Metro 10GB.
• CN865 POSI - POSI Link Voice.
• CN902 Core Metro HE/MEAS.
• CN617 Ethernet Backhaul Direct extended reach.

Plant groups
199
Plant
Group
Detailed Description and Methodology (For all descriptions below, see Appendix A for Key Destinations)
• CN618 Ethernet Backhaul Direct Resilience.
Data Source/s
CAPEX analysis from BT Technology, Service & Operations (BT TSO), LOPLIST (Asset Life)
Volumes are from: GVF for Calls; GVF and WELF for copper and fibre shared WBMC; Skytide for WCC; GVF for TVC; for
HE/MEAs circuits are sourced from GVF, the number of bandwidth and circuit ends are sourced from PACs, and then
CUG ID data (customer ID code from MIS system) and status data of circuit orders from Enterprise Information Oracle
Platform (EIP) are used to provide the etherways and the class of service for the PWE3 etherflows in order to show
bandwidth per end user; EBD volumes are sourced from GVF; Core to Core 10Gbit/s Links are sourced from Discoverer.
PG867A Ethernet NTE
Description
This Plant Group (PG) captures the cost of capital expenditure incurred for the deployment of the customer sited
Ethernet NTE. This is where the BT line from the exchange terminates and allows the customers’ equipment to be
connected. Ethernet is the most widely-installed Local Area Network (LAN) technology.
Methodology
The cost is allocated to component based on management’s knowledge of the relationship between service and
components.
Allocates 100% to CN902 (Metro Core HE/MEAS).
PG868A Core - Core WBMC Dedicated
Description
This Plant Group (PG) captures the Capital costs associated with transmission electronics and length related elements
between a Core Node and another Core Node for dedicated core link and length traffic, which are only relevant to
WBMC dedicated services and do not share their transmission with other services such as WBMC shared.
Methodology
The cost is allocated to component based on management’s knowledge of the relationship between service and
components.
Allocates 100% to CN897 (WBMC Dedicated Link).
PG869A Fibre MSAN Control Access
Description
This Plant Group (PG) captures the Capital costs of the Control and common elements of a FMSAN that are relevant to
the transport of calls or traffic through the switch.
Methodology
The control/common element of the FMSAN is exhausted to the traffic and calls components that utilise the Copper
MSAN. The depreciation cost of the network element is apportioned across the services which it supports based on the
volumes applicable to each service using the network element. The cost now allocated to each service is split between
the components based on management’s knowledge of the relationship between service and components.
For BB WCC Copper an assumption is made regarding WCC’s usage of the network per end user, because there is
limited source data showing how many end users benefit from WCC but it is acknowledged that not all end users
access it. The bandwidth per end user of WCC as a proportion of the bandwidth per end user of copper WBMC is used

Plant groups
200
Plant
Group
Detailed Description and Methodology (For all descriptions below, see Appendix A for Key Destinations)
as a weighting to reduce the assumed WCC utilisation of the end user driven copper assets.
The traffic components that are recipients are:
• CN890 EES & MSAN Access Broadband.
• CN895 MSAN WCC Access.
• CN861 MSAN - POSI Link Voice.
Data Source/s
CAPEX analysis from BT Technology, Service & Operations (BT TSO), LOPLIST (Asset Life)
Volumes are from: GVF for Calls; GVF and WELF for WBA; Skytide for WCC.
PG875A iNode Network Features
Description
This Plant Group (PG) captures the Capital costs of Network Features functionality contained within iNode. The iNode
represents the part of the network that contains intelligence associated with routing, verifying and controlling end to
end service. Line cards are the electronic cards in the exchange that provide connectivity to the switch.
Methodology
The cost is allocated to component based on management’s knowledge of the relationship between service and
components.
Allocates 100% to CN855 (iNode Features).
PG876A iNode Voice Call Set-Up
Description
This Plant Group (PG) captures the Capital costs of Voice Call Set-Up functionality contained within iNode. The iNode
represents the part of the network that contains intelligence associated with routing, verifying and controlling end to
end service. Line cards are the electronic cards in the exchange that provide connectivity to the switch.
Methodology
The cost is allocated to component based on management’s knowledge of the relationship between service and
components.
Allocates 100% to CN868 (iNode Voice Call Set-Up).
PG878A Metro Broadband LNS
Description
This Plant Group (PG) captures the cost of capital expenditure incurred for the deployment of the BB LNS. The L2TP
(Tunnelling Protocol) Network Server is the Layer 2 Network Server.
Methodology
The cost is allocated to component based on management’s knowledge of the relationship between service and
components.
Allocates 100% to CN904 (21C BB Service provider Link).
PG879A Metro BBL3

Plant groups
201
Plant
Group
Detailed Description and Methodology (For all descriptions below, see Appendix A for Key Destinations)
Description
This PG captures the cost of capital expenditure incurred for the deployment of the BBL3
BBL3 is a device used to interface 21C Broadband to the internet. Traffic is either switched directly to the internet, or
looped via CP cages where additional packet processing may be carried out before onward transmission. The cost is
allocated to component based on management’s knowledge of the relationship between service and components.
Methodology
Costs from this PG are allocated to CN860 (Core Metro broadband).
PG880A Metro Broadband Edge Aggregator
Description
This Plant Group (PG) captures the cost of capital expenditure incurred for the deployment of the BEA.
BEAs are deployed across 21CN Core Point of Presence (PoP).
A BEA is essentially the device which a Communication Provider (CP) will interface to, in order to aggregate its traffic
from the Broadband Remote Access Server (BRAS) located within a PoP. Initially a BEA will aggregate a single Logical
PoP or 8 BRAS’.
Methodology
The cost is allocated to component based on management’s knowledge of the relationship between service and
components.
Allocates 100% to CN860 (Core Metro broadband).
PG881A Metro Broadband Remote Access Server and MSE
Description
This Plant Group (PG) captures the cost of capital expenditure incurred for the deployment of the BRAS. BRAS routes
traffic to and from the digital subscriber line access multiplexers (DSLAM) on an Internet service provider's (ISP)
network. The BRAS sits at the core of an ISP's network, and aggregates user sessions from the access network.
Methodology
The cost is allocated to component based on management’s knowledge of the relationship between service and
components.
Allocates 100% to CN889 (Metro BRAS and MSE).
PG882A Metro Front End Router (FER)
Description
This Plant Group (PG) captures the cost of capital expenditure incurred for the deployment of the FER.
The FERs are used to connect to Communications Providers (CPs) for the Aggregated Wholesale Broadband Managed
Connect (WBMC) service. They provide load-balancing and shaping/policing functions.
Traffic from the Core to the L2 MPLS (Multi-Protocol Label Switching) network via the FERs will be over L2TP
(Tunnelling Protocol) tunnels (for L2TP Pass through).
Methodology
The cost is allocated to component based on management’s knowledge of the relationship between service and

Plant groups
202
Plant
Group
Detailed Description and Methodology (For all descriptions below, see Appendix A for Key Destinations)
components.
Allocates 100% to CN904 (21CN broadband service provider link).
PG885A Metro-Core Length
Description
This Plant Group (PG) captures the Capital costs associated with transmission length related elements (Duct and Fibre)
between a Metro Node and a Core Node.
Methodology
The depreciation cost of the network element is apportioned across the services which it supports based on the
volumes applicable to each service using the network element. The cost now allocated to each service is split between
the components based on management’s knowledge of the relationship between service and components.
Because volume data used in the 21CN apportionment model contains a mixture of actual bandwidth used (such as for
WBMC service volumes) and headline bandwidth sold (such as for downstream Ethernet service volumes), the Ethernet
services have a factor applied to their volumes so that they also reflect actual utilisation. This utilisation factor is
calculated separately for Harmonised Ethernet and MEAs services, and is based on detailed samples at selected
exchanges. TSO regularly verify the volumes derived from these sample based assumptions by comparing against the
total traffic over the 21C network.
This Plant Group uses the utilisation factors for the allocations to both Harmonised Ethernet and MEAs services.
The volumes of WCC used for this Plant Group’s allocation have been multiplied down by a factor of 10% in order to
reflect that the majority of WCC traffic does not traverse the core network.
This Plant Group allocates to EBDs by assuming that c2% of EBDs use metro-core and core-core links to provide
resilience back to a single Metro for EBD, calculated based on historic estimates of the number of external resilient
EBDs using metro/core transmission compared to the total number of EBDs. The need for the EBD allocation is due to
each ‘EBD site’ being linked via a WDM chain to two metro nodes. In a small number of cases where resilience is
required to Metro node ‘A’ the resilient link uses EBD to Metro node ‘B’ and then metro-core and core-core links back
to Metro node ‘A’.
To split EBD costs between resilience and extended reach, a weighting of costs is created by comparing the number of
resilient lines for any EBDs that are not extended reach to the volume of extended reach resilient circuits.
For TVC, because the bandwidth volume loaded onto the residual TVC service is the total multicast bandwidth volume
across the 21CN, the total volume will not be relevant to each individual part of the network. It is assumed that 14%
of the total TVC volume is relevant to metro transmission and is used in apportioning costs for this plant group. This is
calculated based on the number of routes between each section of the network where TVC is multicast.
For Harmonised Ethernet and MEAs we include a product network turn-around factor, to reflect how all Ethernet
traffic will not traverse the full core network. It is assumed that 100% of the traffic flows into the tier 1 Edge
Ethernet Switches, but that a diminishing amount of Ethernet driven bandwidth flows over the Metro nodes, outer
core nodes, and inner core nodes. This is calculated by comparing all Etherflow bandwidths’ A end and B ends by
location, with the % that does not flow from or to a metro node being used to reduce the factor applied for metro
node plant groups, and the % of etherflows that do not reach outer and then inner core nodes being used to reduce
the factor for core plant group apportionments.
The traffic components that are recipients are:
• CN617 EBD Extended Reach.
• CN618 Ethernet Backhaul Direct Resilience.
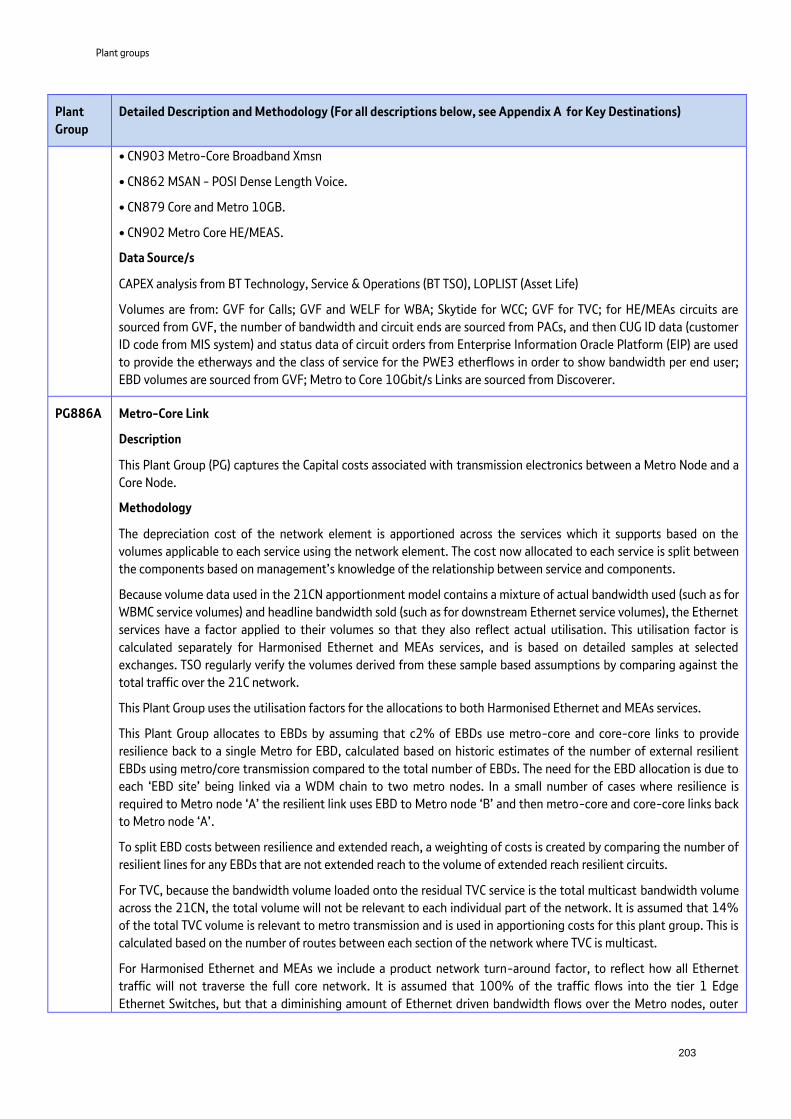
Plant groups
203
Plant
Group
Detailed Description and Methodology (For all descriptions below, see Appendix A for Key Destinations)
• CN903 Metro-Core Broadband Xmsn
• CN862 MSAN - POSI Dense Length Voice.
• CN879 Core and Metro 10GB.
• CN902 Metro Core HE/MEAS.
Data Source/s
CAPEX analysis from BT Technology, Service & Operations (BT TSO), LOPLIST (Asset Life)
Volumes are from: GVF for Calls; GVF and WELF for WBA; Skytide for WCC; GVF for TVC; for HE/MEAs circuits are
sourced from GVF, the number of bandwidth and circuit ends are sourced from PACs, and then CUG ID data (customer
ID code from MIS system) and status data of circuit orders from Enterprise Information Oracle Platform (EIP) are used
to provide the etherways and the class of service for the PWE3 etherflows in order to show bandwidth per end user;
EBD volumes are sourced from GVF; Metro to Core 10Gbit/s Links are sourced from Discoverer.
PG886A Metro-Core Link
Description
This Plant Group (PG) captures the Capital costs associated with transmission electronics between a Metro Node and a
Core Node.
Methodology
The depreciation cost of the network element is apportioned across the services which it supports based on the
volumes applicable to each service using the network element. The cost now allocated to each service is split between
the components based on management’s knowledge of the relationship between service and components.
Because volume data used in the 21CN apportionment model contains a mixture of actual bandwidth used (such as for
WBMC service volumes) and headline bandwidth sold (such as for downstream Ethernet service volumes), the Ethernet
services have a factor applied to their volumes so that they also reflect actual utilisation. This utilisation factor is
calculated separately for Harmonised Ethernet and MEAs services, and is based on detailed samples at selected
exchanges. TSO regularly verify the volumes derived from these sample based assumptions by comparing against the
total traffic over the 21C network.
This Plant Group uses the utilisation factors for the allocations to both Harmonised Ethernet and MEAs services.
This Plant Group allocates to EBDs by assuming that c2% of EBDs use metro-core and core-core links to provide
resilience back to a single Metro for EBD, calculated based on historic estimates of the number of external resilient
EBDs using metro/core transmission compared to the total number of EBDs. The need for the EBD allocation is due to
each ‘EBD site’ being linked via a WDM chain to two metro nodes. In a small number of cases where resilience is
required to Metro node ‘A’ the resilient link uses EBD to Metro node ‘B’ and then metro-core and core-core links back
to Metro node ‘A’.
To split EBD costs between resilience and extended reach, a weighting of costs is created by comparing the number of
resilient lines for any EBDs that are not extended reach to the volume of extended reach resilient circuits.
For TVC, because the bandwidth volume loaded onto the residual TVC service is the total multicast bandwidth volume
across the 21CN, the total volume will not be relevant to each individual part of the network. It is assumed that 14%
of the total TVC volume is relevant to metro transmission and is used in apportioning costs for this plant group. This is
calculated based on the number of routes between each section of the network where TVC is multicast.
For Harmonised Ethernet and MEAs we include a product network turn-around factor, to reflect how all Ethernet
traffic will not traverse the full core network. It is assumed that 100% of the traffic flows into the tier 1 Edge
Ethernet Switches, but that a diminishing amount of Ethernet driven bandwidth flows over the Metro nodes, outer

Plant groups
204
Plant
Group
Detailed Description and Methodology (For all descriptions below, see Appendix A for Key Destinations)
core nodes, and inner core nodes. This is calculated by comparing all Etherflow bandwidths’ A end and B ends by
location, with the % that does not flow from or to a metro node being used to reduce the factor applied for metro
node plant groups, and the % of etherflows that do not reach outer and then inner core nodes being used to reduce
the factor for core plant group apportionments.
The traffic components that are recipients are:
• CN617 (EBD Extended Reach).
• CN618 (Ethernet Backhaul Direct Resilience).
• CN903 (Metro-Core Broadband Xmsn).
• CN861 (MSAN - POSI Link Voice).
• CN879 (Core and Metro 10GB).
• CN902 (Metro Core HE/MEAS).
Data Source/s
CAPEX analysis from BT Technology, Service & Operations (BT TSO), LOPLIST (Asset Life)
Volumes are from: GVF for Calls; GVF and WELF for WBA; Skytide for WCC; GVF for TVC; for HE/MEAs circuits are
sourced from GVF, the number of bandwidth and circuit ends are sourced from PACs, and then CUG ID data (customer
ID code from MIS system) and status data of circuit orders from Enterprise Information Oracle Platform (EIP) are used
to provide the etherways and the class of service for the PWE3 etherflows in order to show bandwidth per end user;
EBD volumes are sourced from GVF; Metro to Core 10Gbit/s Links are sourced from Discoverer.
PG887A METRO-Edge Ethernet Bandwidth
Description
This Plant Group (PG) captures the cost of capital expenditure incurred for the deployment of the Edge Ethernet
Bandwidth.
The Edge Ethernet Bandwidth is used to groom Virtual Local Area Networks (VLANs) from the Multi-Service Access
Nodes (MSANs) to the relevant Metro device such as the Voice PE using Pseudo-Wire Emulation (PWE) tunnels (across
the core if necessary). It is also used to provide point to point connectivity for Broadband traffic via Pseudo-Wire
Emulation Edge to Edge (PWE3) tunnels.
Methodology
The depreciation cost of the network element is apportioned across the services which it supports based on the
volumes applicable to each service using the network element. The cost now allocated to each service is split between
the components based on management’s knowledge of the relationship between service and components.
Because volume data used in the 21CN apportionment model contains a mixture of actual bandwidth used (such as for
WBMC service volumes) and headline bandwidth sold (such as for downstream Ethernet service volumes), the Ethernet
services have a factor applied to their volumes so that they also reflect actual utilisation. This utilisation factor is
calculated separately for Harmonised Ethernet and MEAs services, and is based on detailed samples at selected
exchanges. TSO regularly verify the volumes derived from these sample based assumptions by comparing against the
total traffic over the 21C network.
This Plant Group uses the utilisation factors for the allocations to both Harmonised Ethernet and MEAs services.
The apportionment from this Plant Group to MSIL 1Gbit/s and MSIL 10Gbit/s include an assumption that half of the
links are resilient and that not all links are fully utilised (assumes 70% utilisation).
For TVC, because the bandwidth volume loaded onto the residual TVC service is the total multicast bandwidth volume

Plant groups
205
Plant
Group
Detailed Description and Methodology (For all descriptions below, see Appendix A for Key Destinations)
across the 21CN, the total volume will not be relevant to each individual part of the network. It is assumed that 75%
of the total TVC volume is relevant to EBD transmission and is used in apportioning costs for this plant group. This is
calculated based on the number of routes between each section of the network where TVC is multicast.
For Harmonised Ethernet and MEAs we include a product network turn-around factor, to reflect how all Ethernet
traffic will not traverse the full core network. It is assumed that 100% of the traffic flows into the tier 1 Edge
Ethernet Switches, but that a diminishing amount of Ethernet driven bandwidth flows over the Metro nodes, outer
core nodes, and inner core nodes. This is calculated by comparing all Etherflow bandwidths’ A end and B ends by
location, with the % that does not flow from or to a metro node being used to reduce the factor applied for metro
node plant groups, and the % of etherflows that do not reach outer and then inner core nodes being used to reduce
the factor for core plant group apportionments.
The components that are recipients are:
• CN860 - Core/Metro (broadband).
• CN869 - Core/Metro (voice).
• CN902 – Metro Core HE/MEAS.
• CN905 – Multi Service Interconnect Link.
Data Source/s
CAPEX analysis from BT Technology, Service & Operations (BT TSO), LOPLIST (Asset Life)
Volumes are from: GVF for Calls; GVF and WELF for WBA; Skytide for WCC; GVF for TVC; for HE/MEAs circuits are
sourced from GVF, the number of bandwidth and circuit ends are sourced from PACs, and then CUG ID data (customer
ID code from MIS system) and status data of circuit orders from Enterprise Information Oracle Platform (EIP) are used
to provide the etherways and the class of service for the PWE3 etherflows in order to show bandwidth per end user;
MSIL from OneSiebel and WCR.
PG888A METRO-Edge Ethernet Port
Description
This Plant Group (PG) captures the cost of capital expenditure incurred for the deployment of the Edge Ethernet Port.
The Edge Ethernet Port terminates:
• VLAN - Virtual Local Area Networks.
• MSIL - Multi Service Interconnect Link.
• Ethernet services.
Methodology
The depreciation cost of the network element is apportioned across the services which it supports based on the
volumes applicable to each service using the network element. The cost now allocated to each service is split between
the components based on management’s knowledge of the relationship between service and components.
For TVC, because the bandwidth volume loaded onto the residual TVC service is the total multicast bandwidth volume
across the 21CN, the total volume will not be relevant to each individual part of the network. It is assumed that 75%
of the total TVC volume is relevant to EBD transmission and is used in apportioning costs for this plant group. This is
calculated based on the number of routes between each section of the network where TVC is multicast.
The components that are recipients are:
• CN883 - Edge Ethernet ports voice.

Plant groups
206
Plant
Group
Detailed Description and Methodology (For all descriptions below, see Appendix A for Key Destinations)
• CN884 - Edge Ethernet ports broadband.
• CN885 - Edge Ethernet ports TVC.
• CN902 – Metro Core HE/MEAS.
• CN905 - Multi Service Interconnect Link.
Data Source/s
CAPEX analysis from BT Technology, Service & Operations (BT TSO), LOPLIST (Asset Life)
Volumes are from: GVF for Calls; GVF and WELF for WBA; Skytide for WCC; GVF for TVC; for HE/MEAs circuits are
sourced from GVF, the number of bandwidth and circuit ends are sourced from PACs, and then CUG ID data (customer
ID code from MIS system) and status data of circuit orders from Enterprise Information Oracle Platform (EIP) are used
to provide the etherways and the class of service for the PWE3 etherflows in order to show bandwidth per end user;
MSIL from OneSiebel and WCR.
PG889A Metro-Infrastructure Ethernet
Description
This Plant Group (PG) captures the cost of capital expenditure incurred for the deployment of the Infrastructure
Ethernet.
The infrastructure switches are used to provide basic fast, Gigabit and 10 Gigabit Ethernet connectivity within a metro
node and Intelligent Node (iNode) function.
They are used to give efficient port utilisation on the expensive PE (Provider Edge) router Ethernet interfaces and
because they provide higher port densities for low-speed interfaces than are typically available on PE routers. The
switches are not customer-facing and therefore do not require complex edge features or Virtual Private LAN Services
(VPLS) capabilities.
Methodology
The depreciation cost of the network element is apportioned across the services which it supports based on the
volumes applicable to each service using the network element. The cost now allocated to each service is split between
the components based on management’s knowledge of the relationship between service and components.
The components that are recipients are:
• CN869 Core/Metro (Voice).
• CN860 Core/Metro (Broadband).
Data Source/s
CAPEX analysis from BT Technology, Service & Operations (BT TSO), LOPLIST (Asset Life)
Volumes are from: GVF for Calls; GVF and WELF for WBA; Skytide for WCC; GVF for TVC
PG890A Metro-Media Gateway
Description
This Plant Group (PG) captures the cost of capital expenditure incurred for the deployment of the Media Gateways.
The Media GateWay (MGW) components provide inter-working between the packet switched Internet Protocol (IP)
domain and the legacy TDM domain.
Methodology

Plant groups
207
Plant
Group
Detailed Description and Methodology (For all descriptions below, see Appendix A for Key Destinations)
The cost is allocated to component based on management’s knowledge of the relationship between service and
components.
Allocates 100% to CN869 (Core/Metro Voice).
PG892A Metro-Sync Racks
Description
This Plant Group (PG) captures the cost of capital expenditure incurred for the deployment of the Sync racks.
Each Core/Metro Point of Presence (PoP) is equipped with sync equipment to ensure that accurate timing is
maintained across the BT network. The sync equipment provides reference clock to equipment within the PoP (eg
Media Gateway) down to the Multi-Service Access Nodes (MSANs).
Methodology
The cost is allocated to component based on management’s knowledge of the relationship between service and
components.
Allocates 100% to the Core/Metro Voice component CN869.
PG893A Multi Service Provider Edge Routers
Description
This Plant Group (PG) captures the cost of capital expenditure incurred for the deployment of the Voice Router.
The PE (Provider Edge) routers provide the customer interfaces to the Internet Protocol (IP) / Multi-Protocol Label
Switching (MPLS) network, receiving customer traffic and encapsulating it as MPLS frames for transmission across the
core of the network.
Methodology
The depreciation cost of the network element is apportioned across the services which it supports based on the
volumes applicable to each service using the network element. The cost now allocated to each service is split between
the components based on management’s knowledge of the relationship between service and components.
Because volume data used in the 21CN apportionment model contains a mixture of actual bandwidth used (such as for
WBMC service volumes) and headline bandwidth sold (such as for downstream Ethernet service volumes), the Ethernet
services have a factor applied to their volumes so that they also reflect actual utilisation. This utilisation factor is
calculated separately for Harmonised Ethernet and MEAs services, and is based on detailed samples at selected
exchanges. TSO regularly verify the volumes derived from these sample based assumptions by comparing against the
total traffic over the 21C network.
This Plant Group uses the utilisation factors for the allocations to both Harmonised Ethernet and MEAs services.
PE Routers are located in all Metro nodes, but have dual purposes. In smaller Metro nodes they act as the
management router to all services, whereas in the large metro nodes they are used more specifically for the WBMC
shared services. We therefore double the WBMC services’ usage factor in order to reflect this dual purpose.
The components that are recipients are:
• CN869 Core/Metro Voice.
• CN860 Core/Metro BB.
• CN902 Metro Core HE/MEAS.
Data Source/s

Plant groups
208
Plant
Group
Detailed Description and Methodology (For all descriptions below, see Appendix A for Key Destinations)
CAPEX analysis from BT Technology, Service & Operations (BT TSO), LOPLIST (Asset Life)
Volumes are from: GVF for Calls; GVF and WELF for WBA; Skytide for WCC; GVF for TV; for HE/MEAs circuits are
sourced from GVF, the number of bandwidth and circuit ends are sourced from PACs, and then CUG ID data (customer
ID code from MIS system) and status data of circuit orders from Enterprise Information Oracle Platform (EIP) are used
to provide the etherways and the class of service for the PWE3 etherflows in order to show bandwidth per end user.
PG895A Network Router (large) Core
Description
This Plant Group (PG) captures the cost of capital expenditure incurred for the deployment of the P Router.
The P Routers in the Core nodes (Provider routers) form the core of the network, aggregating traffic from a number of
Provider Edge (PE) routers and connecting to P routers in other Point of Presence (PoP) across wide-area transmission
links.
Methodology
The depreciation cost of the network element is apportioned across the services which it supports based on the
volumes applicable to each service using the network element. The cost now allocated to each service is split between
the components based on management’s knowledge of the relationship between service and components.
Because volume data used in the 21CN apportionment model contains a mixture of actual bandwidth used (such as for
WBMC service volumes) and headline bandwidth sold (such as for downstream Ethernet service volumes), the Ethernet
services have a factor applied to their volumes so that they also reflect actual utilisation. This utilisation factor is
calculated separately for Harmonised Ethernet and MEAs services, and is based on detailed samples at selected
exchanges. TSO regularly verify the volumes derived from these sample based assumptions by comparing against the
total traffic over the 21C network.
This Plant Group uses the utilisation factors for the allocations to both Harmonised Ethernet and MEAs services.
The volumes of WCC used for this Plant Group’s allocation have been multiplied down by a factor of 10% in order to
reflect that the majority of WCC traffic does not traverse the core network.
Network element ‘METRO/CORE-P Router: Intra Node’ is split between PG895A and PG896A based on the number of
core to core links compared to the number of metro to core links in the 21C network.
For WBC/WBMC traffic that uses a VPN pathway rather than WBMC shared in Market B, a factor is applied to reduce
the bandwidth volume used in the Plant Group to Component apportionment to represent how not all bandwidth uses
core transmission. This is because a VPN solution can bypass elements of the core network for Market B traffic, eg it
can be directed to core nodes before metro nodes. A factor representing the core nodes as a % of total nodes is
applied to the VPN based bandwidth in order to reflect its lower usage of core transmission.
For TVC, because the bandwidth volume loaded onto the residual TVC service is the total multicast bandwidth volume
across the 21CN, the total volume will not be relevant to each individual part of the network. It is assumed that 75%
of the total TVC volume is relevant to EBD transmission and 11% is relevant to core transmission. This is calculated
based on the number of routes between each section of the network where TVC is multicast.
For Harmonised Ethernet and MEAs we include a product network turn-around factor, to reflect how all Ethernet
traffic will not traverse the full core network. It is assumed that 100% of the traffic flows into the tier 1 Edge
Ethernet Switches, but that a diminishing amount of Ethernet driven bandwidth flows over the Metro nodes, outer
core nodes, and inner core nodes. This is calculated by comparing all Etherflow bandwidths’ A end and B ends by
location, with the % that does not flow from or to a metro node being used to reduce the factor applied for metro
node plant groups, and the % of etherflows that do not reach outer and then inner core nodes being used to reduce
the factor for core plant group apportionments.

Plant groups
209
Plant
Group
Detailed Description and Methodology (For all descriptions below, see Appendix A for Key Destinations)
The components that are recipients are:
• CN894 - Core/Metro (broadband Shared).
• CN869 - Core/Metro (voice).
• CN902 - Metro Core HE/MEAS.
Data Source/s
CAPEX analysis from BT Technology, Service & Operations (BT TSO), LOPLIST (Asset Life)
Volumes are from: GVF for Calls; GVF and WELF for WBA; Skytide for WCC; GVF for TV; for HE/MEAs circuits are
sourced from GVF, the number of bandwidth and circuit ends are sourced from PACs, and then CUG ID data (customer
ID code from MIS system) and status data of circuit orders from Enterprise Information Oracle Platform (EIP) are used
to provide the etherways and the class of service for the PWE3 etherflows in order to show bandwidth per end user.
PG896A Network Router Metro
Description
This Plant Group (PG) captures the cost of capital expenditure incurred for the deployment of the P Router.
The P Routers in the METRO nodes (Provider Routers) form the core of the network, aggregating traffic from a
number of Provider Edge (PE) Routers and connecting to P Routers in other Point of Presence (PoP) across wide-area
transmission links.
Methodology
The depreciation cost of the network element is apportioned across the services which it supports based on the
volumes applicable to each service using the network element. The cost now allocated to each service is split between
the components based on management’s knowledge of the relationship between service and components.
Because volume data used in the 21CN apportionment model contains a mixture of actual bandwidth used (such as for
WBMC service volumes) and headline bandwidth sold (such as for downstream Ethernet service volumes), the Ethernet
services have a factor applied to their volumes so that they also reflect actual utilisation. This utilisation factor is
calculated separately for Harmonised Ethernet and MEAs services, and is based on detailed samples at selected
exchanges. TSO regularly verify the volumes derived from these sample based assumptions by comparing against the
total traffic over the 21C network.
This Plant Group uses the utilisation factors for the allocations to both Harmonised Ethernet and MEAs services.
Network element ‘METRO/CORE-P Router: Intra Node’ is split between PG895A and PG896A based on the number of
core to core links compared to the number of metro to core links in the 21C network.
For TVC, because the bandwidth volume loaded onto the residual TVC service is the total multicast bandwidth volume
across the 21CN, the total volume will not be relevant to each individual part of the network. It is assumed that 75%
of the total TVC volume is relevant to EBD transmission and is used in apportioning costs for this plant group. This is
calculated based on the number of routes between each section of the network where TVC is multicast.
The components that are recipients are:
• CN860 – Core/Metro (broadband).
• CN869 – Core/Metro (voice).
• CN902 – Metro Core HE/MEAS.
Data Source/s

Plant groups
210
Plant
Group
Detailed Description and Methodology (For all descriptions below, see Appendix A for Key Destinations)
CAPEX analysis from BT Technology, Service & Operations (BT TSO), LOPLIST (Asset Life)
Volumes are from: GVF for Calls; GVF and WELF for WBA; Skytide for WCC; GVF for TV; for HE/MEAs circuits are
sourced from GVF, the number of bandwidth and circuit ends are sourced from PACs, and then CUG ID data (customer
ID code from MIS system) and status data of circuit orders from Enterprise Information Oracle Platform (EIP) are used
to provide the etherways and the class of service for the PWE3 etherflows in order to show bandwidth per end user.
PG898A Core Directors
Description
This Plant Group (PG) captures the cost of capital expenditure incurred for the deployment of the 21C Core Directors
which are used to carry former MSIP data traffic as the MSIP Platform is closed.
The components that are recipients are:
• CN878 – Core Directors broadband.
• CN869 - Core/Metro (voice).
Methodology
The depreciation cost of the network element is apportioned across the services which it supports based on the
volumes applicable to each service using the network element. The cost now allocated to each service is split between
the components based on management’s knowledge of the relationship between service and components.
Data Source/s
CAPEX analysis from BT Technology, Service & Operations (BT TSO), LOPLIST (Asset Life)
Volumes are from: GVF for Calls; WCR for IPstream.
PG899A WDM-Metro Link
Description
This Plant Group captures the Capital costs associated with transmission electronics between WDM Multi Service
Access Node (MSAN) and a Metro Node.
Methodology
The cost is allocated to component based on management’s knowledge of the relationship between service and
components.
Allocates 100% to the Ethernet Backhaul Direct component CN616.
PG900A WDM-Metro Length
Description
This Plant Group (PG) captures the Capital costs associated with transmission length related elements (Duct and Fibre)
between WDM Multi Service Access Node (MSAN) and a Metro Node.
Methodology
The cost is allocated to component based on management’s knowledge of the relationship between service and
components.
Allocates 100% to CN616 (Ethernet Backhaul Direct).
PG901A Ethernet Switches

Plant groups
211
Plant
Group
Detailed Description and Methodology (For all descriptions below, see Appendix A for Key Destinations)
Description
This Plant Group (PG) captures the Capital costs associated with Ethernet Switches.
Methodology
The depreciation cost of the network element is apportioned across the services which it supports based on the
volumes applicable to each service using the network element. The cost now allocated to each service is split between
the components based on management’s knowledge of the relationship between service and components.
Because volume data used in the 21CN apportionment model contains a mixture of actual bandwidth used (such as for
WBMC service volumes) and headline bandwidth sold (such as for downstream Ethernet service volumes), the Ethernet
services have a factor applied to their volumes so that they also reflect actual utilisation. This utilisation factor is
calculated separately for Harmonised Ethernet and MEAs services, and is based on detailed samples at selected
exchanges. TSO regularly verify the volumes derived from these sample based assumptions by comparing against the
total traffic over the 21C network.
This Plant Group uses the utilisation factors for the allocations to both Harmonised Ethernet and MEAs services.
For TVC, because the bandwidth volume loaded onto the residual TVC service is the total multicast bandwidth volume
across the 21CN, the total volume will not be relevant to each individual part of the network. It is assumed that 75%
of the total TVC volume is relevant to EBD transmission and is used in apportioning costs for this plant group. This is
calculated based on the number of routes between each section of the network where TVC is multicast.
The components that are recipients are:
• CN861 MSAN - POSI Link Voice.
• CN882 Ethernet Switch Access HE/MEAS.
• CN891 Ethernet Switch BB.
Data Source/s
CAPEX analysis from BT Technology, Service & Operations (BT TSO), LOPLIST (Asset Life)
Volumes are from: GVF for Calls; GVF and WELF for WBA; Skytide for WCC; GVF for TV; for HE/MEAs circuits are
sourced from GVF, the number of bandwidth and circuit ends are sourced from PACs, and then CUG ID data (customer
ID code from MIS system) and status data of circuit orders from Enterprise Information Oracle Platform (EIP) are used
to provide the etherways and the class of service for the PWE3 etherflows in order to show bandwidth per end user.
PG902A Ethernet Switch Access Cards
Description
This Plant Group (PG) captures the Capital costs of Ethernet Switch Customer Access Cards contained within Ethernet
Switch.
Line cards are the electronic cards in the exchange that provide connectivity to the switch.
The components that are recipients are:
• CN882 Ethernet Switch Access HE/MEAS.
• CN896 MSAN Access SFBB
• CN890 EES & MSAN Access Broadband.
Methodology
The depreciation cost of the network element is apportioned across the services which it supports based on the

Plant groups
212
Plant
Group
Detailed Description and Methodology (For all descriptions below, see Appendix A for Key Destinations)
volumes applicable to each service using the network element. The cost now allocated to each service is split between
the components based on management’s knowledge of the relationship between service and components.
Data Source/s
CAPEX analysis from BT Technology, Service & Operations (BT TSO), LOPLIST (Asset Life)
Volumes are from: GVF and WELF for WBA, for HE/MEAs circuits are sourced from GVF, the number of bandwidth and
circuit ends are sourced from PACs, and then CUG ID data (customer ID code from MIS system) and status data of
circuit orders from Enterprise Information Oracle Platform (EIP) are used to provide the etherways and the class of
service for the PWE3 etherflows in order to show bandwidth per end user.
PG903A Metro MAR
Description
This Plant Group holds the costs for the Multicast Access Router (MAR) which includes all of the TV Connect (TVC) head
end equipment sited at central core node exchanges.
Methodology
The cost is allocated to component based on management’s knowledge of the relationship between service and
components.
Allocates 100% to CN886 (Metro MAR).
PG904A Metro WCC Caches
Description
This PG includes all of the Wholesale Content Connect (WCC) capital costs relating to the caches located at the BRAS.
This cache equipment caches video content closer to end users and thus reduces the need for core transmission.
Methodology
The cost is allocated to component based on management’s knowledge of the relationship between service and
components.
Allocates 100% to CN888 (Metro WCC Caches)
PG911A Operator Services Inland
Description
This PG captures the pay and non-pay costs of operators working on Inland Operator Assistance (OA) 100 and 999
calls. Customers dial 100 (OA) and speak to an Operator if they require help making a call.
Methodology
This PG apportions costs by creating a weighting for each cost type based on average total operator handling time
and volume of calls for both services (100 and 999 calls) which we source from various data sources (see below)
This PG apportions costs to the Operator Assistance components:
CO911 (National Operator Assistance).
CO919 (Emergency operator assistance (999)).
CO941 (National OA non chargeable).
CO942 (Emergency OA - 999 non chargeable).

Plant groups
213
Plant
Group
Detailed Description and Methodology (For all descriptions below, see Appendix A for Key Destinations)
CO943 (Payphones operator assistance non chargeable).
Data Source/s
Inland and International Directory Assistance (DA).
Central Data Store (CDS).
Call Statistics Centralisation System (CSCS) and Featurenet (from the Powerhouse system).
Inland and International Operator Assistance (OA).
Call Centre Management Information Systems (CCMIS).
CSCS (for Retail chargeable).
6A Report (for Wholesale Chargeable).
PG912A Operator Services International
Description
This PG captures the pay and non-pay costs of operators working on International Operator Assistance (IOA) 155 calls.
Customers dial 155 and speak to an International Operator if they require help making an overseas call.
Methodology
This PG apportions costs by creating a weighting for each cost type based on average operator handling times and
volumes of calls generated by each type of call.
This PG apportions costs to the Operator Assistance components:
CO912 (International OA).
CO942 (Emergency OA (999) non-chargeable).
Data Source/s
Inland and International Directory Assistance (DA).
Central Data Store (CDS).
Call Statistics Centralisation System (CSCS) and Featurenet (from the Powerhouse system).
Inland and International Operator Assistance (OA).
Call Centre Management Information Systems (CCMIS).
CSCS, (for Retail chargeable) and 6A Report (for Wholesale Chargeable).
PG924A Directory Enquiries Non Chargeable
Description
This PG captures the pay and non-pay costs of operators working on Directory Enquires (DQ) non chargeable calls.
These type of calls include:
• Blind and Disabled calls. An Operator service available for Blind, Disabled, Hearing or Speech impaired customers on
195.
• Internal service line calls to Directory Enquiries (DQ).
• Calls from foreign operators requesting an inland number.

Plant groups
214
Plant
Group
Detailed Description and Methodology (For all descriptions below, see Appendix A for Key Destinations)
• Calls requesting a credit for a previous call where incorrect information had been given.
• Calls from text phones.
Methodology
Costs from this PG are allocated to CO927 (Directory enquiries non chargeable).
PG941A Cumulo Rates NGA
Description
This Plant Group (PG) includes the Cumulo charge payable for the NGA (Next Generation Access) assets.
Methodology
The Cumulo charge is apportioned to the NGA components only on the basis of Profit Weighted Net Replacement
Costs (PWNRC). A base is derived for apportionment of the Cumulo charge to components in accordance with the
following formula:
Cumalli=NGACC × ( ∑ nrcij
mj=1 land%jwacci
∑ ∑ nrcijland%jwaccimj=1
ni=1
⁄ )
Where
Cumalli = the allocation of the NGA related Cumulo costs to component
i
NGACC = NGA related Cumulo costs
nrcij
= the Net Replacement Costs of the Cumulo Rateable Asset j that has been attributed to component
i
land%j = the percentage of the Cumulo Rateable Asset
j that is regarded as being a landlord asset within
the most recent rating model used by the Valuation Office Agency in England and Wales to value BT’s
Cumulo assessment
wacci = the weighted average cost of capital that is applicable for component
i
m = the number of the Cumulo Rateable Asset categories
n = the number of the NGA Network Components
Specialised Buildings are not part of BT’s fixed assets following their sale to what is now Telereal Trillium in 2001.
However BT is the rateable occupier of these assets so they need to be included. The NRCs of exchange buildings have
been valued by Telereal Trillium at £1.89bn for 2009/10 and this has not been updated by Telereal since then.
The Specialised Building NRC value is apportioned to the NGA components in accordance with Group Property’s
charges for the Occupation of Specialised Buildings. A report from REFINE is produced which shows the Group
Property charges apportioned by component and this is then used as the basis for apportioning the Specialised
Buildings NRC to NGA components.
Costs are apportioned to various NGA Components, primarily CL953 (GEA DSLAM Cabinets), CL192 (NGA E side
Copper Capital), CL951 (GEA Distribution Fibre).

Plant groups
215
Plant
Group
Detailed Description and Methodology (For all descriptions below, see Appendix A for Key Destinations)
The table below is a list of the Classes of Work that contain the Rateable Assets;

Plant groups
216
Plant
Group
Detailed Description and Methodology (For all descriptions below, see Appendix A for Key Destinations)
PG942A Cumulo Rates Non-NGA
Description
This Plant Group (PG) includes the Cumulo charge payable for the non-NGA (Next Generation Access) assets.
Methodology
The Cumulo charge is apportioned to the non-NGA components only on the basis of Profit Weighted Net Replacement
Costs (PWNRC). A base is derived for apportionment of the Cumulo charge to components in accordance with the
following formula;
Cumalli=NNGACC × ( ∑ nrcij
mj=1 land%jwacci
∑ ∑ nrcijland%jwaccimj=1
ni=1
⁄ )
Where
Cumalli = the allocation of the Non-NGA related Cumulo costs to component
i
NNGACC = Non-NGA related Cumulo costs
nrcij
= the Net Replacement Costs of the Cumulo Rateable Asset j that has been attributed to component
i
land%j = the percentage of the Cumulo Rateable Asset
j that is regarded as being a landlord asset within
the most recent rating model used by the Valuation Office Agency in England and Wales to value BT’s
Cumulo assessment
wacci = the weighted average cost of capital that is applicable for component
i
m = the number of the Cumulo Rateable Asset categories
n = the number of the Non-NGA Network Components
Specialised Buildings are not part of BT’s fixed assets following their sale to what is now Telereal Trillium in 2001.
However BT is the rateable occupier of these assets so they need to be included. The NRCs of exchange buildings have
been valued by Telereal Trillium at £1.89bn for 2009/10 and this has not been updated by Telereal since then.
The Specialised Building NRC value is apportioned to the NGA components in accordance with Group Property’s
charges for the Occupation of Specialised Buildings. A report from REFINE is produced which shows the Group
Property charges apportioned by component and this is then used as the basis for apportioning the Specialised
Buildings NRC to non-NGA components.
Costs are apportioned to over 200 non-NGA components – the largest attributions are to CL173 (D side copper
capital), CL171 (E side copper capital), CO484 (Ethernet main links) and CW609 (Ethernet Access Direct Fibre).
The table below is a list of the Classes of Work that contain the Rateable Assets;

Plant groups
217
Plant
Group
Detailed Description and Methodology (For all descriptions below, see Appendix A for Key Destinations)

Plant groups
218
Plant
Group
Detailed Description and Methodology (For all descriptions below, see Appendix A for Key Destinations)
PG950C GEA Access Fibre Spine
Description
This PG captures the costs associated with the provision, installation and recovery of NGA fibre cable in the access
network ie the network between the local exchange and a BT Intermediate node (Cabinet). This includes costs
associated with clearing existing duct (to allow cable to be installed), jointing and spine cable (splicing). Specifically
this PG captures costs from the following areas/functions:
Pay costs associated with the installation of NGA access fibre.
Indirect costs of optical fibre replacement from the Local optical Fibre Cable Renewal (LFCR) classes of work
(CoW).
Contract costs associated with renewal of optical fibre.
Planning costs, adding fibre to the access network.
Costs associated with installing optical spine cable between the local exchange and last connection point before
local distribution fibre or street optical Multiplexors (MUX).
Depreciation costs from the following CoW – Local Fibre Spine Cable (LFSC).
Methodology
Costs from this PG are allocated to CL950 (GEA access fibre spine).
PG950M GEA Access Fibre Spine Maintenance
Description
This PG captures the maintenance costs associated with the provision, installation and recovery of NGA fibre cable in
the access network ie the network between the local exchange and a BT Intermediate node (Cabinet). This includes
costs associated with clearing existing duct (to allow cable to be installed), jointing and spine cable (splicing).
Specifically this PG captures costs from the following areas/functions:
Pay costs associated with the installation of NGA access fibre.
Indirect costs of optical fibre replacement from the Local optical Fibre Cable Renewal (LFCR) classes of work
(CoW).
Contract costs associated with renewal of optical fibre.
Planning costs, adding fibre to the access network.
Costs associated with installing optical spine cable between the local exchange and last connection point before
local distribution fibre or street optical Multiplexors (MUX).
Depreciation costs from the following CoW – and Local Fibre Spine Cable (LFSC).
Methodology
Costs from this PG are allocated to CL950 (GEA access fibre spine).
PG951C GEA Distribution Fibre
Description
This PG captures the costs associated with the provision, installation and recovery of NGA fibre cable in the access
network (ie the network between the Intermediate node (cabinet) and the customer premises). This includes costs

Plant groups
219
Plant
Group
Detailed Description and Methodology (For all descriptions below, see Appendix A for Key Destinations)
associated with clearing existing duct (to allow cable to be installed), jointing distribution (splicing). Specifically this PG
captures costs from the following areas/functions:
Pay costs associated with the installation of NGA access fibre.
Indirect costs of optical fibre replacement from the Local optical Fibre Cable Renewal (LFCR) classes of work
(CoW).
Contract costs associated with renewal of optical fibre.
Planning costs, adding fibre to the access network.
Costs associated with installing optical spine cable between the Intermediate node and the customer premises.
Depreciation costs from the following CoW – and Local Fibre Spine Cable (LFDC).
Methodology
Costs from this PG are allocated to CL951 (GEA distribution fibre).
PG951M GEA Distribution Fibre Maintenance
Description
This PG captures the maintenance costs associated with the provision, installation and recovery of NGA fibre cable in
the access network. It includes the same costs as PG951C above.
Methodology
Costs from this PG are allocated to CL951 (GEA distribution fibre).
PG952C GEA Electronics
Description
This PG captures the NGA costs associated with the provision, rearrangement, recovery, replacement and renewal of
NGA Local Access Network equipment at the exchange end of Local Access Optical Fibre Cables.
Pay costs associated with the installation of NGA access electronics
Contract costs associated with renewal of NGA Electronics.
Planning costs.
Depreciation costs from the following CoW’s – Construction of local line exchange service module (LFXE), Circuit
Provision, Megastream Services (CPDM), Circuit Provision- Asymmetric Digital Subscriber line(ADSL) (CPDSL).
Methodology
Costs from this PG are allocated to CL952 (GEA electronics).
PG953C GEA DSLAM and Cabinets
Description
This PG includes the NGA costs associated with the DSLAM cabinets, cabinet shells, and cabinet tie cables relevant for
installation /provision.
Pay costs associated with the installation of NGA DSLAM and Cabinets.
Contract costs associated with renewal DSLAM and Cabinets.
Planning costs.

Plant groups
220
Plant
Group
Detailed Description and Methodology (For all descriptions below, see Appendix A for Key Destinations)
Depreciation costs from the following CoW – Construction, Local Network Service Module Equipment (LFME).
Methodology
Costs from this PG are allocated to CL953 (GEA DSLAM and cabinet).
PG954C GEA Customer Site Installations
Description
This PG captures the costs associated with the provision, installation and recovery of NGA Customer sited equipment.
Specifically this PG captures costs from the following areas/functions.
Pay costs associated with the installation of NGA Customer sited Installs.
Indirect costs of Customer sited Installs.
Contract costs.
Planning costs.
Depreciation costs from the following CoW – Customer Premises Provision (FTTX).
Methodology
Costs from this PG are allocated to CL954 (GEA customer site installation).
PG955M GEA FTTC Maintenance
Description
This PG includes the NGA FTTC costs associated with the repair/ maintenance of the head end electronics, and DSLAM
cabinets and specific NGA customer equipment.
• Pay costs associated with the repair / maintenance of NGA equipment.
• Indirect costs of any repair / maintenance of NGA specific equipment.
Methodology
Costs from this PG are allocated to CL955 (GEA FTTC Repairs).
PG956M GEA FTTP Maintenance
Description
This PG includes the NGA FTTP costs associated with the repair / maintenance of the head end electronics, and DSLAM
cabinets and specific NGA customer equipment.
• Pay costs associated with the repair / maintenance of NGA equipment.
• Indirect costs of any repair / maintenance of NGA specific equipment.
Methodology
Costs from this PG are allocated to CL956 (GEA FTTP Repairs).
PG957P GEA FTTP Provision
Description
This PG includes the NGA FTTP costs associated with the Provision of the head end electronics, and DSLAM cabinets
and specific NGA customer equipment.

Plant groups
221
Plant
Group
Detailed Description and Methodology (For all descriptions below, see Appendix A for Key Destinations)
• Pay costs associated with the repair / maintenance of NGA equipment.
• Indirect costs of any repair / maintenance of NGA specific equipment.
Methodology
Costs from this PG are allocated to CL957 (GEA FTTP provision).
PG958P GEA FTTC Provision
Description
This PG includes the NGA FTTC costs associated with the Provision of the head end electronics, and DSLAM cabinets
and specific NGA customer equipment.
• Pay costs associated with the repair / maintenance of NGA equipment.
• Indirect costs of any repair / maintenance of NGA specific equipment.
Methodology
Costs from this PG are allocated to CL958 (GEA FTTC provision).
PG959C Access Distribution Fibre
This PG captures the costs associated with the provision, installation and recovery of fibre cable in the access network
ie the network between the Node and customer’s premises (see diagram) or fibre installed up to street multiplexers.
This plant group includes costs associated with:
Assets and depreciation relating to fibre distribution cables;
Duct used by these cables;
Indirect costs related to the capital expenditure eg the van costs incurred by the engineers installing the fibre;
and
Indirect costs related to the assets themselves eg certain overhead types which are apportioned on the basis of
asset value and pay.
This plant group excludes the access distribution fibres used by our Generic Ethernet Access (GEA) products.
Methodology
We use the same methodology to allocate these costs to components as we do for PG111C Access Spine Fibre except
that for EAD circuits we calculate the number of fibres used per circuit as 2 instead of 1. This because as circuits move
legacy WES services to single fibre working EAD services we do not believe that the freed-up fibre will be reused in the
distribution network.
See PG111C for more details.
Data Source/s
See PG111C.
Distribution C able
NodeSpine Cable
CustomerExchange

Plant groups
222
Plant
Group
Detailed Description and Methodology (For all descriptions below, see Appendix A for Key Destinations)
PG980R Repayment Works
Description
This PG captures the costs and balance sheet of Openreach repayment works.
The main role of the Repayment Works unit is to ensure the integrity and protection of BT’s network, where the
highway infrastructure is required to be altered due to promoting authority works under an act of parliament and
protecting the network from damage as a result of third party works.
The main direct classes of works (CoW) are, HK, HM, HO, HE, HPL, HDM, HUR, HSW, HL HNE.
Methodology
Costs from this PG are allocated to CK980 (Openreach Repayment Works).
PG981R Time Related Charges
Description
This PG captures the costs and balance sheet of with time scale charges. Time scales charges refer to time spend on
planned/ Unplanned jobs when a timescale charge is appropriate.
Key costs are allocated to this PG from the following classes of work (CoW):
CNS – Customer Network Services.
MG – Maintenance Control.
SUNR – Repair Customer Wiring (Residential).
Various CoWs starting with AP/AM eg AMCBB, AMBSB
Methodology
Costs from this PG are allocated to CK981 (Openreach Time Related charges).
PG982R Openreach Managed Services for BT Wholesale
Description
This PG captures the costs of any work done by Openreach that specifically supports BT Wholesale Products and
services or activities.
Methodology
Costs from this PG are allocated to CK982 (Openreach Managed Services for Wholesale).
PG984R Openreach Managed Services for BT Global Services
Description
This PG captures the costs of any work done by Openreach that specifically supports BT Global Services or activities.
Methodology
Costs from this PG are allocated to CK984 (Openreach Managed Services for Global).
PG985R Openreach Managed Services for BT Retail
Description
This PG captures the costs of any work done by Openreach that specifically supports BT Retail Products and services or

Plant groups
223
Plant
Group
Detailed Description and Methodology (For all descriptions below, see Appendix A for Key Destinations)
activities.
Methodology
Costs from this PG are allocated to CK985 (Openreach Managed Services for Retail).
PG986R Openreach Other Activities
Description
This PG captures the income for Openreach other activities on F8 Code 209942 Miscellaneous other operating income
& F8 Code 209019 Openreach Other Operating Income.
Methodology
Costs from this PG are allocated to CK986 (Openreach Other Activities).
PG989A Special Fault Investigation (SFI)
Description
This PG captures the costs and balance sheet of SFI.
A Local Loop Unbundling (LLU) SFI can be initiated by an LLU Communications Provider (CP) when a Metallic Path
Facility (MPF) or Shared Metallic Path Facility (SMPF) tests OK on the Openreach line test system, but where there
might be a problem with the CP’s Asymmetric Digital Subscriber Line (ADSL) or Symmetric Digital Subscriber Line
(SDSL) service. The LLU SFI is a chargeable investigation product which attempts to identify and resolve DSL service
affecting problems.
Methodology
Costs from this PG are allocated to CO989 (Special Fault Investigations).
PG998A Fibre Rollout Funding
PG998A captures the funding of the BDUK Development Programme
Methodology
Costs from this plant group are allocated to CL998 (Fibre Rollout Funding)
PG999A BDUK Funding
PG999A captures the spend of fibre rollout across BDUK areas.
Methodology
Costs from this plant group are allocated to CL999 (BDUK Funding)
PGT11M Openreach Contribution to Light User Scheme
Description
This PG captures the costs of the BT Basic (formerly known as the BT Light User Scheme) internal trade.
Methodology
Costs from this PG are allocated to CKT11 (Low User Scheme).

Components
224
14. Components
14.1 Introduction to Components
Components (sometimes called Network Components) are one of the five main categories of costs we use in the
production of the RFS. Components are used to attribute onwards the costs and asset values representing discrete
parts of BT’s Network (eg MDF Equipment, Access Fibre Spine and ISDN30 Connections). Costs within these
network components are attributed to various Services.
Network components represent the collection of various different cost types. One of the distinguishing features of
a component is that it would usually have a single cost driver. Eg Call switching is consumed in the provision of
minutes of conversation time, and so conversation time is used as the cost driver for switching costs. In the case of
switching, component costs or charges flow to downstream retail products via services pro-rata to the volume of
call minutes generated by each product or service.
Component attribution is the final stage of the cost attribution process relevant to our regulatory reporting
obligations. We attribute the costs of all Network Components to Standard Services. The attribution process takes
place at level 8 in our REFINE system (see diagram below - full diagram shown and explained in Section 5 System).
At the end of this stage all relevant network and non-network costs have been attributed to wholesale services
(Openreach and BT Wholesale). These services are then grouped to represent different markets for regulatory
purposes.
Illustration of REFINE processing level 801
14.2 Component to Service attribution
The cost of each network component can either be directly allocated to an individual product/service or an
attribution methodology can be used to apportion the cost to multiple products/services. These attribution
methodologies are often directly linked to service volumes and hence drive the attribution of costs. For example, if
Component A is used by two services, each with equal volume usage, then the attribution of costs of Component A
to the two services will reflect an equal split.
14.2.1 Introduction to factors and factored volumes
The total costs of the Wholesale Markets can be obtained by aggregating the costs of all Network Components.
However, it is necessary to attribute that total cost to individual wholesale services. In cases where Network
Components are used by multiple Services it is necessary to factorise the component volume per Service to
determine the cost attribution.
For Services provided on a cost basis, the cost to Wholesale Markets of providing such service is the cost of each
component used in providing the Service. For some Wholesale Services, the calculation of the cost of service
provision is more complicated, as each service represents the utilisation of one or more network components, and
its cost is therefore determined by an attribution of component costs. This attribution can involve the calculation
and application of route factors, usage factors or other appropriate basis of apportioning components costs.

Components
225
Usage factors are one of the most common ways of determining a Service’s usage of a particular Network
Component.
14.2.2 Derivation of Usage Factors
Usage factors reflect the usage of a particular component by a service compared to the other services which also
use that component. It is therefore specific to each Component-Service combination. The determination of
relevant usage factors varies dependant on the type of service.
This variation arises because individual markets use different components which are representative of costs
incurred and measurable in very distinct ways. Eg call routes and route sampling are relevant in determining call
related component to service usage factors, whereas in the Business Connectivity Markets the usage factors for
services depend on the geography of the different segments in the network used to provide the service (ie
whether they are located in WECLA vs. Non-WECLA regions).
The diagram below shows how component costs are attributed to services.
1. Component factored volume is calculated by multiplying the Service volume by the Component-Service usage
factor (ie how many Components are used by that Service). The costs are those that have been attributed
through to the component level in the REFINE system.
2. These volumes are then used to calculate the cost of the Service. Note that in most cases the Product/Service
volume weighting is 1, and in this instance we can use raw volumes to derive the cost of the Service. In the
above example without using factors the cost would be split between A and B in the ratio £600:£400, this
demonstrates that because Service A uses Component X comparatively more than Service B does, it should
take a higher proportion of its cost.
The calculation of usage factors for the most significant components used to populate the RFS is described in the
following dictionary section. Following this is a table which shows the services to which components attribute
costs alongside the usage factors.

Components
226
14.3 Component to Super Component mapping and Usage Factor calculations
Component
Code Component Description Super Component
CB561 Interconnect POLO CoNcert
Description
This component (along with CB599) attributes payments to Other
Communications Providers (ie NTL, Energis, C&W) – previously known as
OLOs (other licensed operators), for the cost applicable to terminating a call
on the OCPs network.
This component mostly relates to International POLOs.
Basis for Usage Factor Calculation
The usage factor for this component is 1.
CB561
Interconnect POLO
CoNcert
CB599 Interconnect Payments to OLOs
Description
The costs within CB599 are Payments to Other Communications Providers
(ie NTL, Energis, C&W) – previously known as OLOs (other licensed
operators), for the cost applicable to terminating a call on the OCPs
network.
Basis for Usage Factor Calculation
The usage factor for this component is 1.
CB599
Interconnect
Payments to OLOs
CD100 Low TISBO 3rd Party Equipment Depreciation
Description
CD100 contains the estimated depreciation costs for the low TISBO 3rd
party customer sited equipment which connects to the local end access
circuit of the Private Circuit.
The costs are estimated based on the connection revenue. These are
depreciated over four years in line with SDH CoW SDHC asset policy code
where the 3rd party equipment is registered. Whilst the equipment can be
partially identified within this asset policy code based on the description of
the individual items booked to this asset policy code, such imprecise
identification cannot be used to quantify the costs within this CoW, which is
why the costs are estimated based on the connection revenues.
The estimated cost is then stripped out from all components that draw its
cost from the SDH CoW.
Basis for Usage Factor Calculation
The usage factor for this component is 1.
CD100
Low TISBO 3rd
Party Equipment
Depn

Components
227
Component
Code Component Description Super Component
CD101 Medium TISBO 3rd Party Equipment Depreciation
Description
CD101 contains the estimated depreciation costs for the Mid TISBO 3rd
party customer sited equipment which connects to the local end access
circuit of the Private Circuit.
The costs are estimated based on the connection revenue. These are
depreciated over four years in line with SDH CoW SDHC asset policy code
where the 3rd party equipment is registered. Whilst the equipment can be
partially identified within this asset policy code based on the description of
the individual items booked to this asset policy code, such imprecise
identification cannot be used to quantify the costs within this CoW, which is
why the costs are estimated based on the connection revenues.
The estimated cost is then stripped out from all components that draw its
cost from the SDH CoW.
Basis for Usage Factor Calculation
The usage factor for this component is 1.
CD101
Medium TISBO 3rd
Party Equipment
Depn
CE103 TISBO Excess Construction
Description
Excess Construction costs are based on excess construction revenue plus an
estimated margin that BT makes. This component attributes the debit
adjustment from a number of TISBO services where Excess Construction
depreciation that has been recovered under rental services has been
extracted.
Basis for Usage Factor Calculation
The usage factor for this component is 1.
CE103
TISBO Excess
Construction
CE104 AISBO Excess Construction
Description
Excess Construction costs are based on excess construction revenue plus an
estimated margin that BT makes. This component attributes the debit
adjustment from a number of AISBO services where Excess Construction
depreciation that has been recovered under rental services has been
extracted.
Basis for Usage Factor Calculation
This component relates to the AISBO WECLA and Non-WECLA markets. The
volumes for the relevant services are nominal values only (0.001) for every
service and the attribution is performed entirely using the usage factors.
To derive the usage factors we use the relative values of the revenues of
each service.
CE104
AISBO Excess
Construction

Components
228
Component
Code Component Description Super Component
CF187 LLU Line Testing Systems
Description
This component attributes Test Access Management Systems (TAMS) costs.
These are used to provide remote access facilities on broadband circuits for
testing towards the customer and into the network. TAMS are installed
between the Main Distribution Frame (MDF) and the Digital Subscriber Line
Access Multiplexer (DSLAM).
Basis for Usage Factor Calculation
The usage factors for this component are 1.
CF187
LLU Line Testing
Systems
CF189 EVOTAM Testing Systems
Description
This component attributes EvoTAMs systems costs. EvoTAMs are installed
on SMPF lines to test SMPF lines that are supplied internally to provide
Wholesale Broadband Connect services.
Basis for Usage Factor Calculation
The usage factors for this component are 1
CF189
EVOTAM Testing
Systems
CF371 OR PC Rental 2Mbit link per km distribution
Description
Private Circuits provide a dedicated point-to-point connection for exclusive
voice and data communications between two sites. They utilise bearers and
line systems which consist of electronics and interconnecting cable. The
distribution components encompass the costs the electronics across the
backhaul network and the associated bearers.
This component attributes the costs for the 2Mbit bandwidth services.
Basis for Usage Factor Calculation
The usage factors for this component are 1.
CO371
PC Rental 2Mbit
link per km
distribution
CF373 OR PC Rental 34Mbit link per km distribution
Description
Private Circuits provide a dedicated point-to-point connection for exclusive
voice and data communications between two sites. They utilise bearers and
line systems which consist of electronics and interconnecting cable. The
distribution components encompass the costs the electronics across the
backhaul network and the associated bearers.
This component attributes the costs for the 34Mbit bandwidth services.
Basis for Usage Factor Calculation
The usage factors for this component are 1.
CO373
PC Rental 34Mbit
link per km
distribution

Components
229
Component
Code Component Description Super Component
CF375 OR PC Rental 140Mbit link per km distribution
Description
Private Circuits provide a dedicated point-to-point connection for exclusive
voice and data communications between two sites. They utilise bearers and
line systems which consist of electronics and interconnecting cable. The
distribution components encompass the costs the electronics across the
backhaul network and the associated bearers.
This component attributes the costs for the 140Mbit bandwidth services.
Basis for Usage Factor Calculation
The usage factors for this component are 1.
CO375
PC Rental 140Mbit
link per km
distribution
CF381 OR PC Rental 64Kbit/s link
Description
Private Circuits provide a dedicated point-to-point connection for exclusive
voice and data communications between two sites. They utilise bearers and
line systems which consist of electronics and interconnecting cable. This
link component captures the costs of the electronics (but not the cables)
that connect the BT terminating ends into the core network. This
component captures the costs of 64Kbit/s bandwidth Openreach circuits.
Basis for Usage Factor Calculation
The usage factors for this component are 1.
CO381
PC rental 64kbit/s
link
CF383 OR PC Rental 2Mb link
Description
Private Circuits provide a dedicated point-to-point connection for exclusive
voice and data communications between two sites. They utilise bearers and
line systems which consist of electronics and interconnecting cable. This
link component captures the costs of the electronics (but not the cables)
that connect the BT terminating ends into the core network. This
component captures the costs of 2Mbit/s bandwidth Openreach circuits.
Basis for Usage Factor Calculation
The usage factors for this component are 1.
CO383
PC rental 2Mbit/s
link

Components
230
Component
Code Component Description Super Component
CF388 OR PC rental 140Mb link
Description
Private Circuits provide a dedicated point-to-point connection for exclusive
voice and data communications between two sites. They utilise bearers and
line systems which consist of electronics and interconnecting cable.
This component attributes the costs of the electronics (not the cables) that
connect the BT terminating ends into the core network. This component is
specific to Openreach 140Mbit circuits.
Basis for Usage Factor Calculation
The usage factors for this component are 1.
CO388
PC rental 140Mb
link
CF391 OR PC rental 64Kbit link per km transmission
Description
This component captures the costs of the Digital Private Circuits Network
(DPCN) Transmission Links. The major products using this component are
Kilostream N (KxN), sub-2Mb PPCs and IP Clear. Volumes are measured in
number of 64kb (Kx) equivalent circuits.
Basis for Usage Factor Calculation
The usage factors for this component are 1.
CO391
PC rental 64Kbit
link per km
transmission

Components
231
Component
Code Component Description Super Component
CF453 OR Interconnect 2Mbit connection
Description
Interconnect circuits provide the physical infrastructure to connect the
exchanges (switches) of two CPs in order to allow traffic to pass between
them.
The cost of interconnect circuits is borne by BT and is used to connect BT's
network to another operator. The circuit may be used by both BT and the
operator and charges are apportioned according to ownership of traffic
between the parties. The circuit is charged as an upfront connection and
ongoing rental.
The connection and ongoing rental of the circuit is shared by three parties
as follows:
The terminating network operator for use of the circuit to transit and
terminate its calls;
BT for own use of the circuit; and
The originating transit network operator.
This component attributes the costs of providing and associated overheads
the connection of an Interconnect 2Mbit circuit as applied to Customer
Sited Interconnect (CSI) and Interconnect Extension Circuits (IEC)
connections and re-arrangements.
Basis for Usage Factor Calculation
Usage factors for this component are derived from the price weighted
volume of circuits provided during the year. The price-weighting takes into
account the difference in providing a connection with that of carrying out a
re-arrangement or a transfer. From these price-weighted volumes usage
factors are calculated and applied.
CO453
Interconnect 2Mbit
connection
CG101 PC rental 2Mbit/s regional trunk
Description
Private Circuits provide a dedicated point-to-point connection for exclusive
voice and data communications between two sites (BT or customer). They
utilise bearers and line systems which consist of electronics and
interconnecting cable.
This component attributes the cost of connecting between the Parent
Nodes (preferred Tier 1 site) of the serving exchanges for 2Mbit/s
bandwidth services.
Basis for Usage Factor Calculation
The usage factors for this component are 1.
CG101
PC rental 2Mbit/s
regional trunk

Components
232
Component
Code Component Description Super Component
CG102 PC rental 34Mbit/s regional trunk
Description
Private Circuits provide a dedicated point-to-point connection for exclusive
voice and data communications between two sites (BT or customer). They
utilise bearers and line systems which consist of electronics and
interconnecting cable.
This component attributes the cost of connecting between the Parent
Nodes (preferred Tier 1 site) of the serving exchanges for 34Mbit/s
bandwidth services.
Basis for Usage Factor Calculation
The usage factors for this component are 1.
CG102
PC rental 34Mbit/s
regional trunk
CG103 PC rental 140Mbit/s regional trunk
Description
Private Circuits provide a dedicated point-to-point connection for exclusive
voice and data communications between two sites (BT or customer). They
utilise bearers and line systems which consist of electronics and
interconnecting cable.
This component attributes the cost of connecting between the Parent
Nodes (preferred Tier 1 site) of the serving exchanges for 140Mbit/s
bandwidth services for regional trunk.
Basis for Usage Factor Calculation
The usage factors for this component are 1.
CG103
PC rental
140Mbit/s regional
trunk
CG201 PC rental 2Mbit/s link per km national trunk
Description
Private Circuits provide a dedicated point-to-point connection for exclusive
voice and data communications between two sites (BT or customer). They
utilise bearers and line systems which consist of electronics and
interconnecting cable. This component captures the cost of connecting
between the Parent Nodes (preferred Tier 1 site) of the serving exchanges.
Basis for Usage Factor Calculation
The usage factors for this component are 1.
CG201
PC rental 2Mbit/s
link per km national
trunk

Components
233
Component
Code Component Description Super Component
CG203 PC rental 140Mbit link per km national trunk
Description
Private Circuits provide a dedicated point-to-point connection for exclusive
voice and data communications between two sites (BT or customer). They
utilise bearers and line systems which consist of electronics and
interconnecting cable.
This component attributes the cost of connecting between the Parent
Nodes (preferred Tier 1 site) of the serving exchanges for 140Mbit
bandwidths for national trunk.
Basis for Usage Factor Calculation
CTCS volumes are used to attribute costs to Services. We use the network
inventory, routing and network topology information to derive these
factors.
CG203
PC rental 140Mbit
link per km national
trunk
CK980 Openreach repayment works
Description
This component captures the costs and balance sheet of Openreach
repayment works.
The main role of the Repayment Works unit is to ensure the integrity and
protection of BT’s network, where the highway infrastructure is required to
be altered due to promoting authority works under an act of parliament
and protecting the network from damage as a result of third party works.
The main direct classes of works (CoW) are, HK, HM, HO, HE, HPL, HDM,
HUR, HSW, HL HNE.
Basis for Usage Factor Calculation
The usage factors for this component are 1.
CK980
Openreach
Repayment works
CK981 Openreach time related charges
Description
TRCs refer to repair and provisioning jobs carried out by Openreach
engineers. The activity could be on Openreach’s network or outside of this
network, eg wiring in the customer’s home.
Basis for Usage Factor Calculation
The usage factors for this component are 1.
CK981
Openreach time
related charges

Components
234
Component
Code Component Description Super Component
CKT11 Low user scheme
Description
This component captures the costs of BT Basic (formerly known as the BT
Low User Scheme) internal trade.
Basis for Usage Factor Calculation
The usage factors for this component are 1.
CKT11
Low user scheme
CL120 LLU Electricity Usage - OR
Description
This component attributes the costs of all LLU related electricity charges.
Basis for Usage Factor Calculation
The usage factors for this component are 1.
CL120
LLU Electricity
Usage - OR
CL131 Co-mingling set up
Description
Hostels are the location of an operator’s equipment in a site; they are rooms
that are built to a standard design to house a number of operators. This
component attributes the cost of building Local Loop Unbundling (LLU)
Hostels within BT Exchanges.
Basis for Usage Factor Calculation
The usage factors for this component are 1.
CL131
Co-mingling set up
CL132 Co-mingling rentals
Description
This component attributes the direct costs and associated overheads
relating to the accommodation of Communication Providers’ (CP) Local loop
Unbundling (LLU) equipment.
Basis for Usage Factor Calculation
The usage factors for this component are 1.
CL132
Co-mingling rentals
CL133 WLA tie cables
Description
This Component attributes the depreciation and overheads associated with
external and Internal LLU Tie Cables that provide access to BT Exchange and
access copper network to enable operators, other than BT, to use the BT’s
local loop to provide services to customers. It facilitates the opening up of
BT's copper network to Other Communication Providers (OCPs).
Basis for Usage Factor Calculation
The usage factors for this component are 1.
CL133
WLA tie cables

Components
235
Component
Code Component Description Super Component
CL139 Local Loop Unbundling systems development
Description
This component captures the costs of development specific to Local Loop
Unbundling.
Basis for Usage Factor Calculation
The usage factors for this component are 1.
CL139
Local Loop
Unbundling
systems
development
CL144 Wholesale Access specific
Description
CL144 relates to Openreach Development for WLR, ISDN 2 and ISDN 30
services.
Basis for Usage Factor Calculation
The usage factors for these components show how many copper lines
(copper pairs) are used by each service.
ISDN services are reported in the RFS as the number of channels: ISDN2 has
two channels per line and ISDN30 has 15 channels per line on average
(maximum 30). Therefore, usage factors are 0.5 for ISDN2 (1/2) and 0.06
for ISDN30 (1/15).
Services such as WLR and MPF rentals are reported by lines, and we use a
usage factor of 1.
2Mbit/s copper local ends often use more than one copper line depending
on the type of 2 Mbit/s electronics used and the average number is 1.64.
CL144
Wholesale Access
specific
CL160 Routing & Records
Description
The Component captures the costs and balance sheet (Depreciation, ETG
and Non-ETG Pay and Non Pay) of Routing and Records work for provision
of analogue / ISDN lines, Local Loop Unbundling (LLU) and Fibre based
circuits.
Basis for Usage Factor Calculation
The usage factors for this component are 1.
CL160
Routing & Records

Components
236
Component
Code Component Description Super Component
CL161 MDF Hardware jumpering
Description
This component attributes the cost of exchange jumpering activities on the
Main Distribution Frame (MDF) connecting the exchange switch equipment
to the exchange side (E-Side) cable.
Basis for Usage Factor Calculation
The usage factor of this component is calculated based on a survey of the
amount of time to provide services for this activity. The usage factor is the
time relative to the time taken in the provision of WLR: therefore if a
service takes 150% of time taken for WLR the usage factor is 1.5.
CL161
MDF Hardware
jumpering
CL171 E side copper capital
Description
Access Copper cables connect BT’s exchanges to distribution points in the
access network and are used to provide voice and broadband services.
These cables are categorised as Exchange (E-side) and Distribution side (D-
side) copper. E-side cables connect an exchange to street cabinets and D-
side cables connect street cabinets to distribution points.
This component attributes the capital costs associated with the provision
and use of E-side copper cables.
Basis for Usage Factor Calculation
This component is apportioned to services that use copper lines using a
usage factor which is the product of:
Number of Channels used per copper line (eg ISDN2 rentals are
measured in lines and there are two channels per line);
the relative fault rates (eg broadband enabled lines develop faults
more often than voice only lines); and
The service level (eg typically we expect that Openreach aims to repair
MPF lines sooner than basic WLR Lines, and consequently we estimate
Care Level 2 for WLR premium services is 20% greater than Care Level
1 for basic WLR services).
CL171
E side copper
capital

Components
237
Component
Code Component Description Super Component
CL172 E side copper current
Description
Access Copper cables connect BT’s exchanges to distribution points in the
access network and are used to provide voice and broadband services.
These cables are categorised as Exchange (E-side) and Distribution side (D-
side) copper. E-side cables connect an exchange to street cabinets and D-
side cables connect street cabinets to distribution points.
This component attributes the operational and maintenance costs
associated with the provision and use of E-side copper cables.
Basis for Usage Factor Calculation
This component is apportioned to services that use copper lines using a
usage factor which is the product of:
Number of Channels used per copper line (eg ISDN2 rentals are
measured in lines and there are two channels per line);
the relative fault rates (eg broadband enabled lines develop faults
more often than voice only lines); and
The service level (eg typically we expect that Openreach aims to repair
MPF lines sooner than basic WLR Lines, and consequently we estimate
Care Level 2 for WLR premium services is 20% greater than Care Level
1 for basic WLR services).
CL172
E side copper
current

Components
238
Component
Code Component Description Super Component
CL173 D side copper capital
Description
Access copper cables connect BT’s exchanges to distribution points in the
access network and are used to provide voice and broadband services to
customers.
These cables are categorised as Exchange side (E-side) and Distribution side
(D-side) copper. E-side cables connect an exchange to street cabinets and
D-side cables connect street cabinets to distribution points.
This component attributes the capital costs related to the provision and use
of D-side copper cables.
Basis for Usage Factor Calculation
This component is apportioned to services that use copper lines using a
usage factor which is the product of:
Number of Channels used per copper line (eg ISDN2 rentals are
measured in lines and there are two channels per line);
the relative fault rates (eg broadband enabled lines develop faults
more often than voice only lines); and
The service level (eg typically we expect that Openreach aims to repair
MPF lines sooner than basic WLR Lines, and consequently we estimate
Care Level 2 for WLR premium services is 20% greater than Care Level
1 for basic WLR services).
CL173
D side copper
capital

Components
239
Component
Code Component Description Super Component
CL174 D side copper current
Description
Access copper cables connect BT’s exchanges to distribution points in the
access network and are used to provide voice and broadband services to
customers.
These cables are categorised as Exchange side (E-side) and Distribution side
(D-side) copper. E-side cables connect an exchange to street cabinets and
D-side cables connect street cabinets to distribution points.
This component attributes the operational and maintenance costs
associated with the provision and use of D-side copper cables.
Basis for Usage Factor Calculation
This component is apportioned to services that use copper lines using a
usage factor which is the product of:
Number of Channels used per copper line (eg ISDN2 rentals are
measured in lines and there are two channels per line);
the relative fault rates (eg broadband enabled lines develop faults
more often than voice only lines); and
The service level (eg typically we expect that Openreach aims to repair
MPF lines sooner than basic WLR Lines, and consequently we estimate
Care Level 2 for WLR premium services is 20% greater than Care Level
1 for basic WLR services).
CL174
D side copper
current
CL175 Local exchanges general frames capital
Description
Basis for Usage Factor Calculation
The usage factor of this component represents the number of jumpers,
which is one per copper line for WLR and ISDN services. For ISDN services, it
is divided by the number of channels (ie 2 for ISDN2 and 14.4 for ISDN30).
In the case of MPF, however, it requires two per line, hence the factor is
2.0.
CL175
Local exchanges
general frames
capital

Components
240
Component
Code Component Description Super Component
CL176 Local exchanges general frames current
Description
This component captures the costs of maintenance of frames at Local
Exchanges.
Basis for Usage Factor Calculation
These costs relate to the maintenance of frames. The usage factors of this
component are the product of four variables:
Number of copper lines used, eg ISDN2 is reported in channels, but
there are 2 channels per line, we therefore use a usage factor of 0.5;
Number of jumpers used per line, eg a WLR line uses one pair of
jumpers per line, but MPF uses two;
Care (service) level, eg we estimate Care Level 2 for WLR premium
services is 20% greater than Care Level 1 for basic WLR services; and
Relative fault rate, eg MPF has higher fault rates than WLR.
CL176
Local exchanges
general frames
current
CL178 Dropwire capital & analogue NTE
Description
This component attributes the capital costs of dropwire from the
Distribution Point up to and including the customer Network Terminating
Equipment (NTE).
Basis for Usage Factor Calculation
The factors are based on the usage of dropwire by the services taking into
account the volume measure of the service.
ISDN2 has a usage factor of 0.5 and this takes account of the fact that
there are 2 channels per line. The usage factor is calculated as 1 / 2 = 0.5.
CL178
Dropwire capital &
analogue NTE
CL180 Analogue line drop maintenance
Description
This component attributes the maintenance costs of residential dropwire
from the Distribution Point up to and including the customer Network
Terminating Equipment.
Basis for Usage Factor Calculation
We use a usage factor that takes account of:
The number of copper lines used (eg ISDN2 rentals are measured in
lines and there are two channels per line);
The relative fault rates (eg broadband enabled lines develop faults
more often than voice only lines); and
The service level (eg Openreach aims to repair MPF lines sooner than
basic WLR Lines).
CL180
Analogue line drop
maintenance

Components
241
Component
Code Component Description Super Component
CL183 Analogue line cards
Description
Line cards are the electronic cards in the exchange that provide
connectivity to the switch. This component attributes the costs of the line
cards that provide customer access into the BT network. They sit within the
Concentrator Asset of Local exchanges and support Residential and
Business Line rental products.
Basis for Usage Factor Calculation
The usage factors for this component are 1.
CL183
Analogue line cards
CL184 ISDN2 line cards
Description
Line cards are the electronic cards in the exchange that provide
connectivity to the switch. This Component attributes the costs associated
with the Integrated Services Digital Network 2 (ISDN2) line cards.
Basis for Usage Factor Calculation
The usage factors for this component are 1.
CL184
ISDN2 line cards
CL189 ISDN30 access
Description
This component captures the ‘Access’ or ‘Local End’ costs associated with
ISDN30 circuits. These costs consist of access copper, access fibre, backhaul
fibre and network equipment costs including overheads.
Basis for Usage Factor Calculation
The usage factors for this component are 1.
CL189
ISDN30 access
CL190 ISDN30 line cards
Description
Line cards are the electronic cards in the exchange that provide
connectivity to the switch. This component attributes the costs associated
with the Integrated Services Digital Network 30 (ISDN30) line cards.
Basis for Usage Factor Calculation
The usage factors for this component are 1.
CL190
ISDN30 line cards
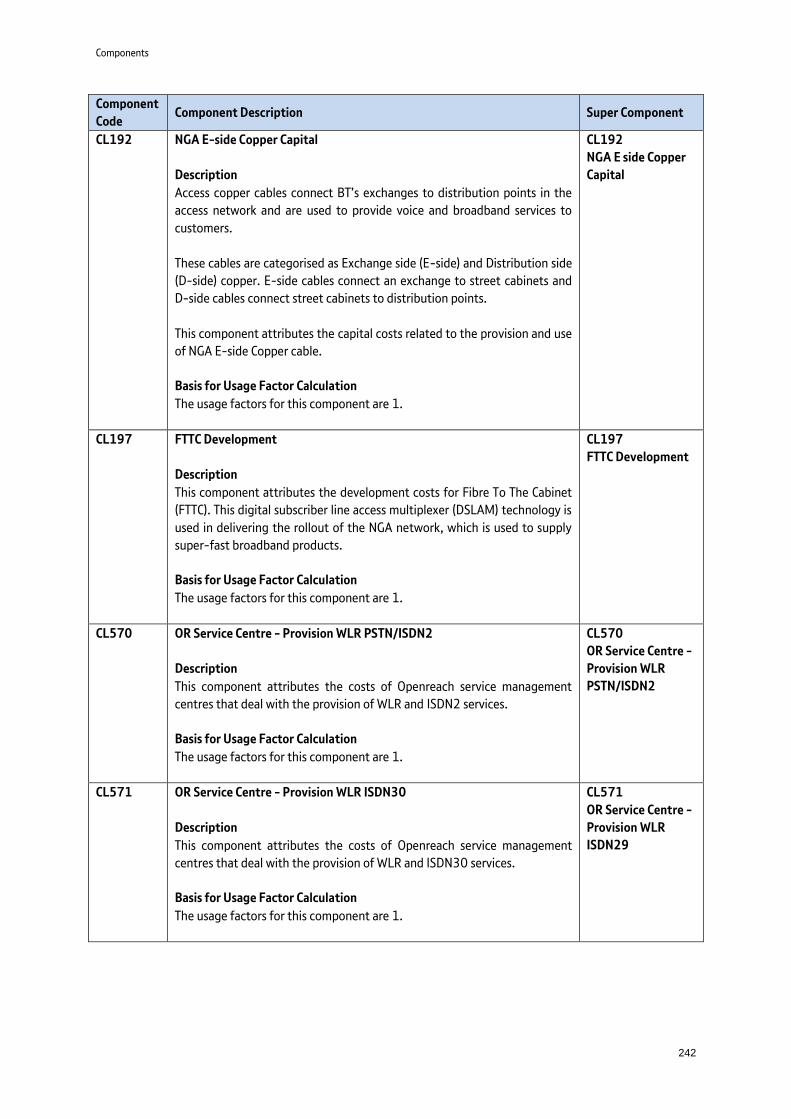
Components
242
Component
Code Component Description Super Component
CL192 NGA E-side Copper Capital
Description
Access copper cables connect BT’s exchanges to distribution points in the
access network and are used to provide voice and broadband services to
customers.
These cables are categorised as Exchange side (E-side) and Distribution side
(D-side) copper. E-side cables connect an exchange to street cabinets and
D-side cables connect street cabinets to distribution points.
This component attributes the capital costs related to the provision and use
of NGA E-side Copper cable.
Basis for Usage Factor Calculation
The usage factors for this component are 1.
CL192
NGA E side Copper
Capital
CL197 FTTC Development
Description
This component attributes the development costs for Fibre To The Cabinet
(FTTC). This digital subscriber line access multiplexer (DSLAM) technology is
used in delivering the rollout of the NGA network, which is used to supply
super-fast broadband products.
Basis for Usage Factor Calculation
The usage factors for this component are 1.
CL197
FTTC Development
CL570 OR Service Centre - Provision WLR PSTN/ISDN2
Description
This component attributes the costs of Openreach service management
centres that deal with the provision of WLR and ISDN2 services.
Basis for Usage Factor Calculation
The usage factors for this component are 1.
CL570
OR Service Centre -
Provision WLR
PSTN/ISDN2
CL571 OR Service Centre - Provision WLR ISDN30
Description
This component attributes the costs of Openreach service management
centres that deal with the provision of WLR and ISDN30 services.
Basis for Usage Factor Calculation
The usage factors for this component are 1.
CL571
OR Service Centre -
Provision WLR
ISDN29

Components
243
Component
Code Component Description Super Component
CL572 OR Service Centre - Provision LLU
Description
This component attributes the costs of Openreach service management
centres that deal with the provision of LLU.
Basis for Usage Factor Calculation
These components are allocated at Level 850 (Openreach services and part
services) in proportion to volumes so we use a usage factor of 1.
For the internal services there is a further attribution step that allocates the
costs from Openreach part-service to a final service in a downstream
market. An additional factor is introduced at this stage which represents
the difference between upstream and downstream volumes. This factor will
not affect the attribution of costs between internal and external services.
CL572
OR Service Centre -
Provision LLU
CL573 OR Service Centre - Provision Ethernet
Description
This component captures the costs of Openreach service management
centres that deal with the provision of Ethernet services.
Basis for Usage Factor Calculation
WES and BES volumes are expressed in Local Ends so circuit volume is x0.5.
MPF is based on fault rates: 12/0.22 (MPF\SMPF Fault Rate) – these rates
are determined by Ofcom.
All other usage factors for this component are 1.
CL573
OR Service Centre -
Provision Ethernet
CL574 OR Service Centre - Provision NGA
Description
This component captures the cost and balance sheet - Service Centre for
the Provision of Next Generation Access (NGA
Basis for Usage Factor Calculation
The usage factors for this component are 1.
CL574
Service Centre
Provision WLR NGA
CL575 OR Service Centre Assurance WLR PSTN ISDN2
Description
This component captures the costs of Openreach service management
centres that deal with the repair of ISDN2 and PSTN services (ie traditional
telephone lines).
Basis for Usage Factor Calculation
The usage factors for this component are 1.
CL575
OR Service Centre -
Assurance
Analogue/ISDN2

Components
244
Component
Code Component Description Super Component
CL577 OR Service Centre Assurance WLA
Description
This component captures the costs of Openreach service management
centres that deal with the repair of WLA services eg Local Loop Unbundling
(LLU).
Basis for Usage Factor Calculation
The usage factor apportions cost equally by volume ie all factors are 1.00
except in the case of MPF services where the ratio of the fault rate for MPF
to SMPF is used.
CL577
OR Service Centre -
Assurance WLA
CL578 OR Service Centre Assurance Ethernet
Description
This component captures the costs of Openreach service management
centres that deal with the repair of Ethernet services.
Basis for Usage Factor Calculation
The usage factor is based on the unit of volume of the Ethernet service.
Some services are measured in Local Ends whilst others are measured in
circuits. The factor derived takes account of the different unit measure to
apportion costs equally by volume. WES and BES volumes are expressed in
Local Ends therefore circuit volumes for these have a Usage Factor of 0.5.
In all other instances (eg EBD) Usage Factors for this component are 1.
CL578
OR Service Centre -
Assurance Ethernet
CL579 OR Service Centre - Assurance NGA
Description
This component captures the costs of Openreach service management
centres that deal with the repair of NGA (Next Generation Access) services.
Basis for Usage Factor Calculation
The usage factors for this component are 1.
CL579
Service Centre
Assurance NGA
CL590 Ext LLU SLG
Description
This component captures the costs of Openreach Service Level Agreements
for LLU both Internal and External.
Basis for Usage Factor Calculation
This component contains service level guarantee payments/refunds to
customers of LLU services. The usage factors are a combination of three
elements:
The relative total amounts paid in compensation for repairs (ie in
respect of rentals) and provision delays (ie in respect of connections);
The relative price of the individual services; and
The relative fault rate between SMPF and MPF services.
CL590
Ext LLU SLG

Components
245
Component
Code Component Description Super Component
CL951 GEA Distribution Fibre
Description
This component contains costs for the provision; installation; recovery; and
depreciation of NGA distribution fibre cable ie the fibre cables between the
Cabinet and the T-node in the fibre network.
Basis for Usage Factor Calculation
The usage factors for this component are 1.
CL951
GEA Distribution
Fibre
CL952 GEA Electronics
Description
This component captures the costs of the exchange based electronics
required for the delivery of GEA (Generic Ethernet Access). It connects the
high-speed digital communications channels from the customer to the
backhaul network.
Basis for Usage Factor Calculation
The usage factors for this component are 1.
CL952
GEA Electronics
CL953 GEA DSLAM & Cabinets
Description
This component captures the costs of the DSLAM (digital subscriber line
access multiplexer) network device required for the delivery of GEA (Generic
Ethernet Access). It connects multiple customer digital subscriber line (DSL)
interfaces to a high-speed digital communications channel using
multiplexing techniques.
Basis for Usage Factor Calculation
The usage factors for this component are 1.
CL953
GEA DSLAM
Cabinets
CL954 GEA Customer Site Installation
Description
This component attributes the costs for customer site Super-Fast Fibre
Broadband provision and installation activity.
It covers costs for the part of the network that is beyond the end of the
Access Network and up to the DSL Modem in the customer premises.
Basis for Usage Factor Calculation
The usage factors for this component are 1.
CL954
GEA Customer Site
Installation

Components
246
Component
Code Component Description Super Component
CL958 GEA FTTC Provisions
Description
This component contains provision costs for the Fibre to the Cabinet
connection services.
Basis for Usage Factor Calculation
The usage factors for this component are 1.
CL958
GEA FTTC
Provisions
CL998 Fibre Rollout Funding
Description
This component attributes the funding received in relation to BT’s fibre
rollout.
Basis for Usage Factor Calculation
The usage factors for this component are 1.
CL998
Fibre Rollout
Funding
CL999 Funded Fibre Rollout Spend
Description
This component attributes the funded region fibre rollout spend.
Basis for Usage Factor Calculation
The usage factors for this component are 1.
CL999
Funded Fibre
Rollout Spend
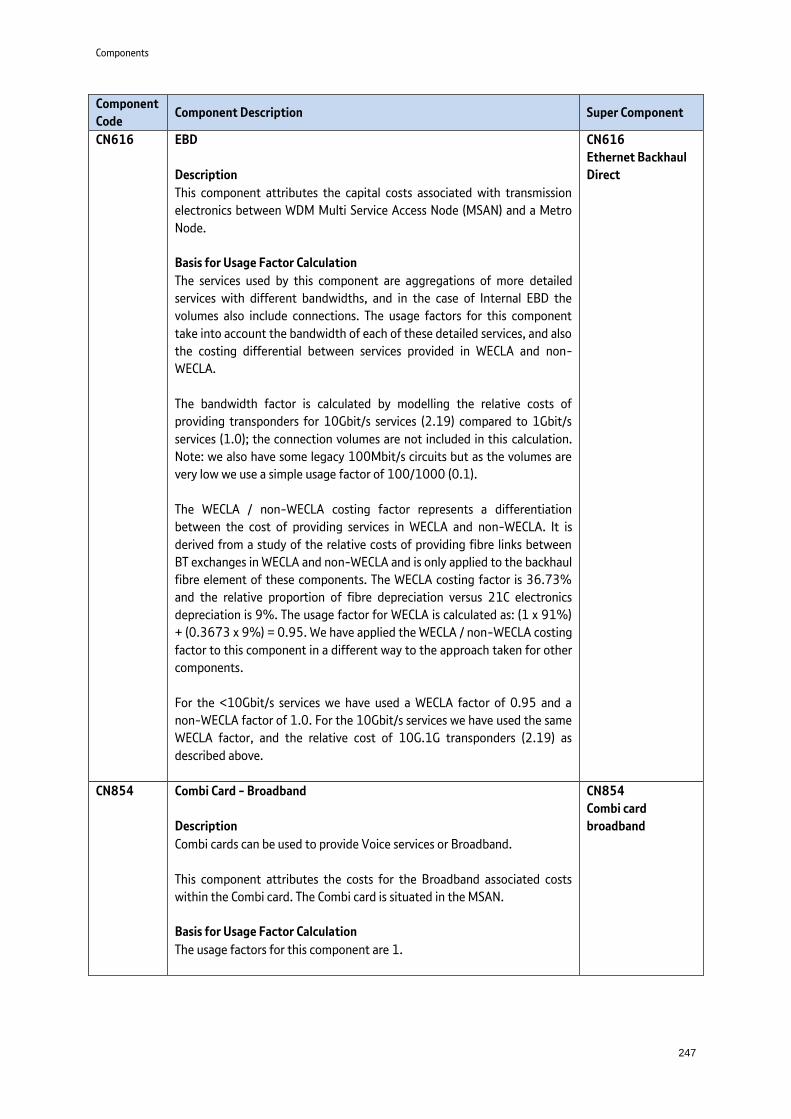
Components
247
Component
Code Component Description Super Component
CN616 EBD
Description
This component attributes the capital costs associated with transmission
electronics between WDM Multi Service Access Node (MSAN) and a Metro
Node.
Basis for Usage Factor Calculation
The services used by this component are aggregations of more detailed
services with different bandwidths, and in the case of Internal EBD the
volumes also include connections. The usage factors for this component
take into account the bandwidth of each of these detailed services, and also
the costing differential between services provided in WECLA and non-
WECLA.
The bandwidth factor is calculated by modelling the relative costs of
providing transponders for 10Gbit/s services (2.19) compared to 1Gbit/s
services (1.0); the connection volumes are not included in this calculation.
Note: we also have some legacy 100Mbit/s circuits but as the volumes are
very low we use a simple usage factor of 100/1000 (0.1).
The WECLA / non-WECLA costing factor represents a differentiation
between the cost of providing services in WECLA and non-WECLA. It is
derived from a study of the relative costs of providing fibre links between
BT exchanges in WECLA and non-WECLA and is only applied to the backhaul
fibre element of these components. The WECLA costing factor is 36.73%
and the relative proportion of fibre depreciation versus 21C electronics
depreciation is 9%. The usage factor for WECLA is calculated as: (1 x 91%)
+ (0.3673 x 9%) = 0.95. We have applied the WECLA / non-WECLA costing
factor to this component in a different way to the approach taken for other
components.
For the <10Gbit/s services we have used a WECLA factor of 0.95 and a
non-WECLA factor of 1.0. For the 10Gbit/s services we have used the same
WECLA factor, and the relative cost of 10G.1G transponders (2.19) as
described above.
CN616
Ethernet Backhaul
Direct
CN854 Combi Card - Broadband
Description
Combi cards can be used to provide Voice services or Broadband.
This component attributes the costs for the Broadband associated costs
within the Combi card. The Combi card is situated in the MSAN.
Basis for Usage Factor Calculation
The usage factors for this component are 1.
CN854
Combi card
broadband

Components
248
Component
Code Component Description Super Component
CN860 Core/Metro (broadband)
Description
This component contains costs for the Broadband associated costs within
the Metro and Core nodes. Core and Metro nodes are not used exclusively
for Broadband however this component captures the cost within these
assets that are consumed by Broadband products.
Basis for Usage Factor Calculation
The usage factors for this component are 1.
CN860
Core/Metro
(broadband)
CN868 iNode voice call set-up
Description
The iNode represents the part of the network that contains intelligence
associated with routing, verifying and controlling end to end service.
This Component attributes the capital costs of Voice Call Set-Up
functionality contained within iNode.
Basis for Usage Factor Calculation
The routing factors for 21CN voice components have been derived from the
20CN call routing information and adjusted to show how calls would be
routed across the 21CN network. The volume of calls crossing the 21CN
network is very small, limited to the Pathfinder trial in Cardiff.
CN868
iNode voice call set-
up
CN879 Core and Metro 10GB
Description
This component is allocated costs relevant to the dedicated core to core and
metro to core 10Gbit/s links that are not used to carry wholesale
broadband, voice or Ethernet services.
Basis for Usage Factor Calculation
The usage factors for this component are 1.
CN879
Core and Metro
10GB
CN882 Ethernet Switch Access HE/MEAS
Description
This component captures all Ethernet Switch costs for downstream
Ethernet and MEAS (both Residual) services.
Basis for Usage Factor Calculation
The usage factors for this component are 1.
CN882
Ethernet Switch
Access HE/MEAS

Components
249
Component
Code Component Description Super Component
CN889 Metro BRAS and MSE
Description
This component attributes the cost of capital expenditure incurred for the
deployment of the BRAS. BRAS routes traffic to and from the digital
subscriber line access multiplexers (DSLAM) on an Internet service
provider's (ISP) network. The BRAS sits at the core of an ISP's network, and
aggregates user sessions from the access network.
Basis for Usage Factor Calculation
The usage factors for this component are 1.
CN889
Metro BRAS and
MSE
CN890 EES and MSAN Access - Broadband
Description
This component captures the maintenance (Profit and Loss, Pay, Non-Pay,
Materials etc.) costs of the electronics in the backhaul transmission
between the MSAN and up to and including the access port on the Ethernet
Switch that are relevant to Broadband products. The backhaul is a shared
element of the network.
Basis for Usage Factor Calculation
The usage factors for this component are 1.
CN890
EES and MSAN
Access - Broadband
CN891 Ethernet Switch BB
Description
This component captures the maintenance (Pay, Non-Pay, Materials etc.)
costs of the electronics in the backhaul transmission contained in the
Ethernet Switch that is the element of the Ethernet Switch which is not
used for access. This is a shared element of the network.
Basis for Usage Factor Calculation
The original end user volume factored by bandwidth.
The bandwidth used is for the WBC product by market and by internal or
external variant. The source for the bandwidth volumes is the Wholesale
Customer Reporting system (WCR) end users multiplied by service prices.
TVC volumes are factored so to prevent an allocation of the elements within
CN891 not used by that service, ie the MSE.
CN891
Ethernet Switch BB

Components
250
Component
Code Component Description Super Component
CN902 Metro Core HE/MEAS
Description
This component captures the Metro to Core transmission costs for
downstream Ethernet and MEAs (both Residual) services.
Basis for Usage Factor Calculation
The usage factors for this component are 1.
CN902
Metro Core
HE/MEAS
CN903 Metro-Core Broadband transmission
Description
Basis for Usage Factor Calculation
The usage factors for this component are 1 except for TV Connect (TVC) for
which we calculate the total channel bandwidth required by TVC and the
number of Metro-Core Transmission routes it uses, and factor by this
percentage of the total channel bandwidth (currently 0.14).
CN903
Metro-core
broadband
transmission
CO210 Local exchange processor duration
Description
Digital Local Exchanges (DLE) form two distinct assets Concentrators and
Host Processor or DLE. Only the Host costs get allocated to this component
as Concentrator switching has its own components.
The costs attributed via this component relate to activities required to
activities associated with holding a speech path open for the period the link
is made across the network. It includes the costs associated with providing
tones, recorded announcements, and the conversations between the called
and calling lines within Local Exchanges.
Basis for Usage Factor Calculation
We apportion this component based on time of day and routing factor.
This component is apportioned to the two relevant call origination and call
origination services in proportion to factored call minutes.
The routing factors for these services are 1.00. In addition a small amount
is also apportioned to conveyance and transit due to the routing of a small
percentage of calls.
CO210
Local exchange
processor duration
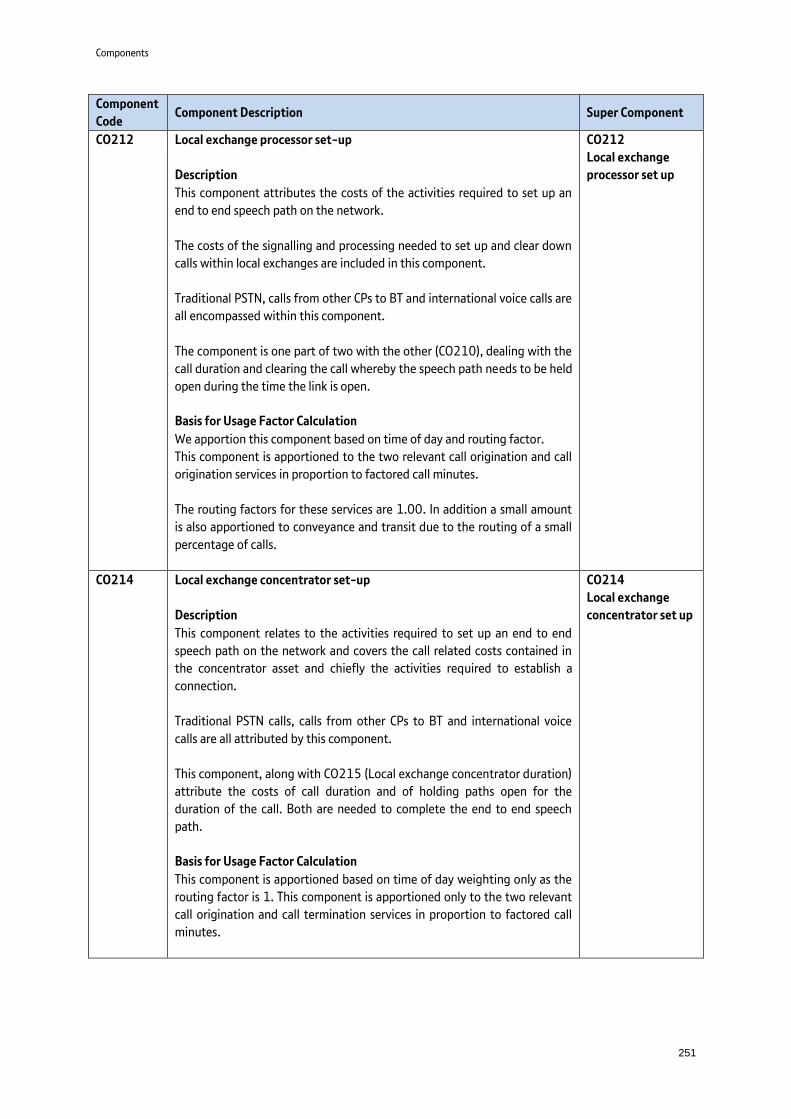
Components
251
Component
Code Component Description Super Component
CO212 Local exchange processor set-up
Description
This component attributes the costs of the activities required to set up an
end to end speech path on the network.
The costs of the signalling and processing needed to set up and clear down
calls within local exchanges are included in this component.
Traditional PSTN, calls from other CPs to BT and international voice calls are
all encompassed within this component.
The component is one part of two with the other (CO210), dealing with the
call duration and clearing the call whereby the speech path needs to be held
open during the time the link is open.
Basis for Usage Factor Calculation
We apportion this component based on time of day and routing factor.
This component is apportioned to the two relevant call origination and call
origination services in proportion to factored call minutes.
The routing factors for these services are 1.00. In addition a small amount
is also apportioned to conveyance and transit due to the routing of a small
percentage of calls.
CO212
Local exchange
processor set up
CO214 Local exchange concentrator set-up
Description
This component relates to the activities required to set up an end to end
speech path on the network and covers the call related costs contained in
the concentrator asset and chiefly the activities required to establish a
connection.
Traditional PSTN calls, calls from other CPs to BT and international voice
calls are all attributed by this component.
This component, along with CO215 (Local exchange concentrator duration)
attribute the costs of call duration and of holding paths open for the
duration of the call. Both are needed to complete the end to end speech
path.
Basis for Usage Factor Calculation
This component is apportioned based on time of day weighting only as the
routing factor is 1. This component is apportioned only to the two relevant
call origination and call termination services in proportion to factored call
minutes.
CO214
Local exchange
concentrator set up

Components
252
Component
Code Component Description Super Component
CO215 Local exchange concentrator duration
Description
This component relates to the activities required to set up an end to end
speech path on the network and covers the call related costs contained in
the concentrator asset and chiefly the activities required for holding a
speech path open for the duration of the call.
Traditional PSTN calls, calls from other CPs to BT and international voice
calls are all attributed by this component.
This component, along with CO214 (Local exchange concentrator set-up)
attribute the costs of call duration and of holding paths open for the
duration of the call. Both are needed to complete the end to end speech
path.
Basis for Usage Factor Calculation
This component is apportioned based on time of day weighting only as the
routing factor is one. This component is apportioned only to the two
relevant call origination and call termination services in proportion to
factored call minutes.
CO215
Local exchange
concentrator
duration
CO227 ASU switches
Description
This component attributes the costs of the Advanced Services Units (ASU).
ASU assets consist of DMS100 switches and equipment required to
interface to equipment sited at customer premises - eg PBX's (Private
Branch Exchanges), Telephones, Faxes, and Modems etc.
It supports products such as Featurenet which enables customers to have
facilities which are normally available only on their PBX.
Basis for Usage Factor Calculation
The usage factors for this component are 1.
CO227
ASU switches
CO292 Caller Display
Description
This component contains costs associated with Caller display, and
apportions to those WLR customers which “opt in” to the caller display
service.
Basis for Usage Factor Calculation
The usage factors for this component are 1.
CO292
Caller Display
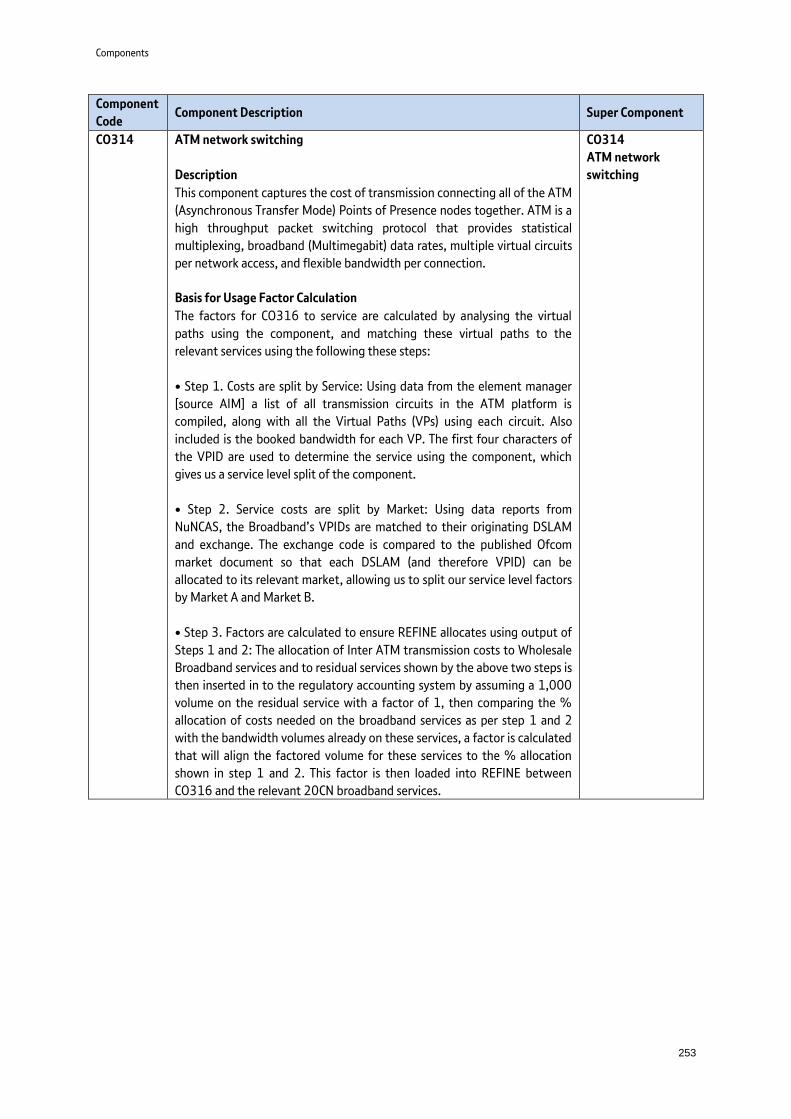
Components
253
Component
Code Component Description Super Component
CO314 ATM network switching
Description
This component captures the cost of transmission connecting all of the ATM
(Asynchronous Transfer Mode) Points of Presence nodes together. ATM is a
high throughput packet switching protocol that provides statistical
multiplexing, broadband (Multimegabit) data rates, multiple virtual circuits
per network access, and flexible bandwidth per connection.
Basis for Usage Factor Calculation
The factors for CO316 to service are calculated by analysing the virtual
paths using the component, and matching these virtual paths to the
relevant services using the following these steps:
• Step 1. Costs are split by Service: Using data from the element manager
[source AIM] a list of all transmission circuits in the ATM platform is
compiled, along with all the Virtual Paths (VPs) using each circuit. Also
included is the booked bandwidth for each VP. The first four characters of
the VPID are used to determine the service using the component, which
gives us a service level split of the component.
• Step 2. Service costs are split by Market: Using data reports from
NuNCAS, the Broadband’s VPIDs are matched to their originating DSLAM
and exchange. The exchange code is compared to the published Ofcom
market document so that each DSLAM (and therefore VPID) can be
allocated to its relevant market, allowing us to split our service level factors
by Market A and Market B.
• Step 3. Factors are calculated to ensure REFINE allocates using output of
Steps 1 and 2: The allocation of Inter ATM transmission costs to Wholesale
Broadband services and to residual services shown by the above two steps is
then inserted in to the regulatory accounting system by assuming a 1,000
volume on the residual service with a factor of 1, then comparing the %
allocation of costs needed on the broadband services as per step 1 and 2
with the bandwidth volumes already on these services, a factor is calculated
that will align the factored volume for these services to the % allocation
shown in step 1 and 2. This factor is then loaded into REFINE between
CO316 and the relevant 20CN broadband services.
CO314
ATM network
switching

Components
254
Component
Code Component Description Super Component
CO316 Inter ATM transmissions
Description
ATM is a high throughput packet switching protocol that provides
statistical multiplexing, broadband (Multimegabit) data rates, multiple
virtual circuits per network access, and flexible bandwidth per connection.
This component attributes the costs of transmission connecting all of the
Asynchronous Transfer Mode (ATM) Points of Presence nodes together.
Basis for Usage Factor Calculation
The factors for CO316 to service are calculated by analysing the virtual
paths using the component, and matching these virtual paths to the
relevant services using the following these steps:
Step 1. Costs are split by Service: Using data from the element
manager [source AIM] a list of all transmission circuits in the ATM
platform is compiled, along with all the Virtual Paths (VPs) using each
circuit. Also included is the booked bandwidth for each VP. The first
four characters of the VPID are used to determine the service using the
component, which gives us a service level split of the component.
Step 2. Service costs are split by Market: Using data reports from
NuNCAS, the Broadband’s VPIDs are matched to their originating
DSLAM and exchange. The exchange code is compared to the
published Ofcom market document so that each DSLAM (and therefore
VPID) can be allocated to its relevant market, allowing us to split our
service level factors by Market A and Market B.
Step 3. Factors are calculated to ensure REFINE allocates using output
of Steps 1 and 2: The allocation of Inter ATM transmission costs to
Wholesale Broadband services and to residual services shown by the
above two steps is then inserted in to the regulatory accounting
system by assuming a 1,000 volume on the residual service with a
factor of 1, then comparing the % allocation of costs needed on the
broadband services as per step 1 and 2 with the bandwidth volumes
already on these services, a factor is calculated that will align the
factored volume for these services to the % allocation shown in step 1
and 2. This factor is then loaded into REFINE between CO316 and the
relevant 20CN broadband services.
CO316
Inter ATM
transmissions

Components
255
Component
Code Component Description Super Component
CO325 Remote - local transmission link
Description
This component forms part of the PSTN (Public Switched Telephony
Network) Call Origination/Termination Standard Services and attributes the
costs of the transmission electronics associated with the link between the
Remote concentrator and the Local exchange.
Basis for Usage Factor Calculation
The usage factors represent the percentage of calls routed across these
components weighted by time of day.
Part services are used where the rest of BT purchase EPPCs from Openreach
in order to provide backhaul between local exchanges and main exchanges.
The routing factors for all destination services are 0.802.
CO325
Remote local
transmission link
CO326 Remote - local transmission length
Description
This component forms part of the PSTN (Public Switched Telephony
Network) Call Origination/Termination Standard Services and attributes the
costs of the transmission electronics associated with the length between
the Remote concentrator and the Local exchange.
Basis for Usage Factor Calculation
The usage factors represent the percentage of calls routed across these
components weighted by time of day.
Part services are used where the rest of BT purchase EPPCs from Openreach
in order to provide backhaul between local exchanges and main exchanges.
The routing factors for all destination services are 1.49.
CO326
Remote local
transmission length

Components
256
Component
Code Component Description Super Component
CO379 Point of Handover electronics
Description
A POH is a high capacity link, which connects an Other Communication
Provider's network with that of BT's, and comprises the physical
infrastructure (duct and fibre) as well as electronics at both or one end of
the link. It is one element of a Partial Private Circuit (PPC).
A PPC provides connectivity between OCPs (other than BT) and an end user,
across BTs network. The POH provides a single high speed connection
between BT and an OCP for an aggregated group of PPCs.
This component attributes the costs of the electronics associated with
providing a POH.
Basis for Usage Factor Calculation
These are costing usage factors based on analysis of the ratio of
depreciation costs to maintenance costs in this component.
The usage factors are calculated such that when applied to rental and
connection volumes the costs relating to depreciation are allocated to
connections and those relating to maintenance are allocated to rentals.
CO379
Point of Handover
electronics
CO401 Netstream Equipment
Description
This component contains the costs associated with NetStream.
NetStream is a Retail Product offering that enables mobile network
operators (MNOs) to backhaul their traffic from their cell sites (satellite
sites) to their core networks (at major customer sites).
Basis for Usage Factor Calculation
The usage factor represents the different costs of network equipment for
services at different bandwidths.
CO401
Netstream
equipment
CO413 2Mbit and above PC link connection CCT provision
Description
This component attributes the costs associated with the provision and
testing of 2Mb and above links for inland private circuits.
Basis for Usage Factor Calculation
The usage factors for this component are 1.
CO413
2Mbit s and above
PC link connection
CCT provision

Components
257
Component
Code Component Description Super Component
CO432 PC rental 64Kbit link local end
Description
This component attributes the capital and maintenance costs associated
with 64Kbit (Kilostream) private circuits.
Basis for Usage Factor Calculation
The usage factor for this component is used to transfer the costs associated
with PoH, which are captured in local end components, into third party PoH
services.
This factor is set at 0.17 following Ofcom’s review of PoH pricing in 2011.
The usage factor for the main local end services is 1 as each service uses one
component.
CO432
PC rental 64kbit s
link local end
CO434 PC rental 34Mbit link local end
Description
This component attributes the capital and maintenance costs associated
with 34Mbit (Kilostream) private circuits.
Basis for Usage Factor Calculation
The usage factor for this component is used to transfer the costs associated
with PoH, which are captured in local end components, into third party PoH
services.
This factor is set at 0.17 following Ofcom’s review of PoH pricing in 2011.
The usage factor for the main local end services is 1 as each service uses one
component.
CO434
PC rental 34Mbit s
link local end
CO436 PC rental 140Mbit link local end
Description
Basis for Usage Factor Calculation
The usage factor for this component is used to transfer the costs associated
with PoH, which are captured in local end components, into third party PoH
services.
This factor is set at 0.17 following Ofcom’s review of PoH pricing in 2011.
The usage factor for the main local end services is 1 as each service uses one
component.
CO436
PC rental 140Mbit s
link local end

Components
258
Component
Code Component Description Super Component
CO438 PC rental 2Mbit local end copper
Description
This component attributes the depreciation and overheads associated with
the copper and electronics providing access from the BT exchange to the
customer premises for 2Mbit Private Circuit components.
This component also attributes the cost of duct where the copper resides.
Basis for Usage Factor Calculation
The usage factor for this component is used to transfer the costs associated
with PoH, which are captured in local end components, into third party PoH
services.
This factor is set at 0.17 following Ofcom’s review of PoH pricing in 2011.
The usage factor for the main local end services is 1 as each service uses one
component.
CO438
PC rental 2Mbit/s
local end copper
CO439 PC rental 2Mbit local end fibre
Description
This component attributes the depreciation and overheads associated with
the fibre and electronics providing access from the BT exchange to the
customer premises for 2Mbit Private Circuit components.
These components also include the cost of duct where the fibre resides.
Basis for Usage Factor Calculation
The usage factor for this component is used to transfer the costs associated
with PoH, which are captured in local end components, into third party PoH
services.
This factor is set at 0.17 following Ofcom’s review of PoH pricing in 2011.
The usage factor for the main local end services is 1 as each service uses one
component.
CO439
PC rental 2Mbit/s
local end fibre
CO447 Backhaul extension services fibre
Description
This component captures the costs associated with BES (Backhaul extension
services).
Basis for Usage Factor Calculation
The usage factor is derived from a combination of the usage of fibre for
each service that uses this component and the relative cost of providing
fibre by customer end in the WECLA and Non-WECLA geographic areas.
CO447
Backhaul Extension
Services Fibre
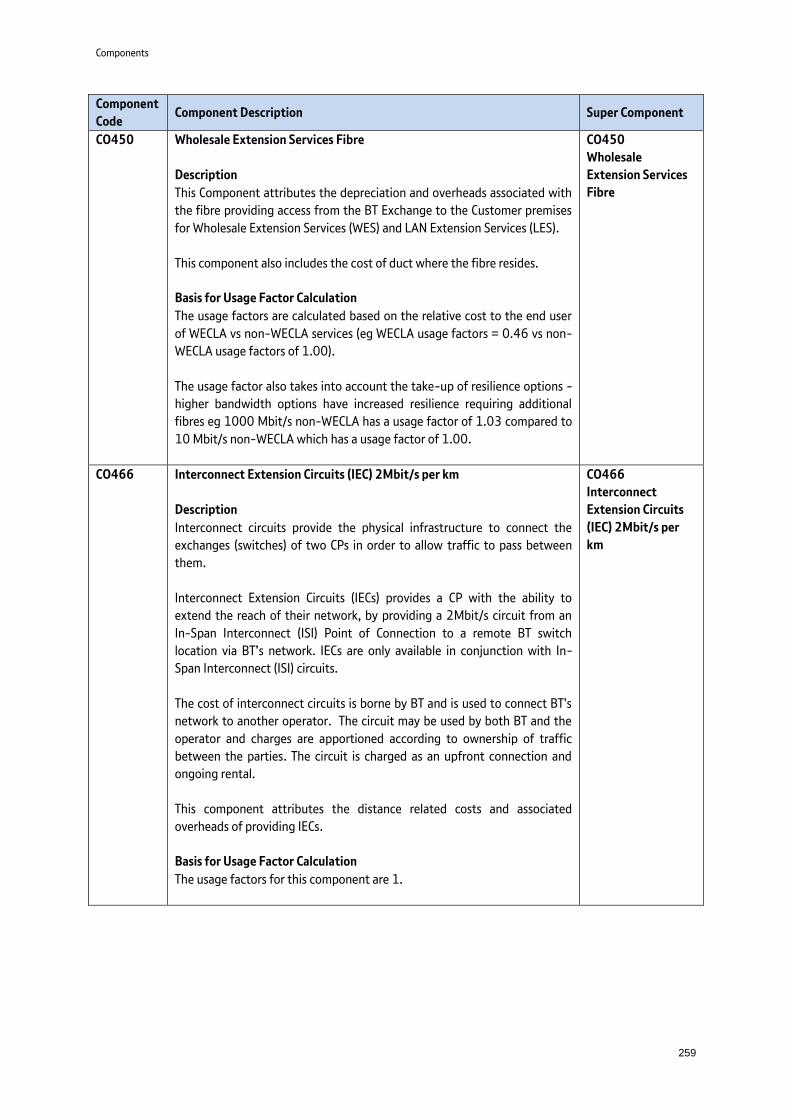
Components
259
Component
Code Component Description Super Component
CO450 Wholesale Extension Services Fibre
Description
This Component attributes the depreciation and overheads associated with
the fibre providing access from the BT Exchange to the Customer premises
for Wholesale Extension Services (WES) and LAN Extension Services (LES).
This component also includes the cost of duct where the fibre resides.
Basis for Usage Factor Calculation
The usage factors are calculated based on the relative cost to the end user
of WECLA vs non-WECLA services (eg WECLA usage factors = 0.46 vs non-
WECLA usage factors of 1.00).
The usage factor also takes into account the take-up of resilience options -
higher bandwidth options have increased resilience requiring additional
fibres eg 1000 Mbit/s non-WECLA has a usage factor of 1.03 compared to
10 Mbit/s non-WECLA which has a usage factor of 1.00.
CO450
Wholesale
Extension Services
Fibre
CO466 Interconnect Extension Circuits (IEC) 2Mbit/s per km
Description
Interconnect circuits provide the physical infrastructure to connect the
exchanges (switches) of two CPs in order to allow traffic to pass between
them.
Interconnect Extension Circuits (IECs) provides a CP with the ability to
extend the reach of their network, by providing a 2Mbit/s circuit from an
In-Span Interconnect (ISI) Point of Connection to a remote BT switch
location via BT’s network. IECs are only available in conjunction with In-
Span Interconnect (ISI) circuits.
The cost of interconnect circuits is borne by BT and is used to connect BT's
network to another operator. The circuit may be used by both BT and the
operator and charges are apportioned according to ownership of traffic
between the parties. The circuit is charged as an upfront connection and
ongoing rental.
This component attributes the distance related costs and associated
overheads of providing IECs.
Basis for Usage Factor Calculation
The usage factors for this component are 1.
CO466
Interconnect
Extension Circuits
(IEC) 2Mbit/s per
km

Components
260
Component
Code Component Description Super Component
CO468 In Span Interconnect circuits (ISI) transmission
Description
Interconnect circuits provide the physical infrastructure to connect the
exchanges (switches) of two CPs in order to allow traffic to pass between
them.
In-Span Interconnect (ISI) provides a Communications Provider (CP) with
the ability to offer telephony services to their customers that connect with
BTR customers.
ISI is a lower cost alternative to Customer Sited Interconnect (CSI). It
provides a 2Mbit/s connection from a BT switch. CPs install equipment at
their premises and this interconnects at an agreed Point of Connection
(PoC) in the public highway. CPs can then benefit from Call Origination and
Call Termination on BT’s network
This component attributes the transmission costs and associated overheads
required to provide ISI services.
Basis for Usage Factor Calculation
The usage factors for this component are 1.
CO468
In Span
Interconnect
circuits ISI
transmission
CO484 Ethernet main links
Description
This component attributes all costs associated with Ethernet main links.
Basis for Usage Factor Calculation
The usage factor of this component is the Main Links WECLA/non-WECLA
costing factor, ie if service is in WECLA the usage factor is 0.37, and if
service is non-WECLA the usage factor is 1.00.
These costing factors were based on a study of fibre links between our
exchanges.
CO484
Ethernet main links

Components
261
Component
Code Component Description Super Component
CO485 Ethernet Electronics
Description
This component attributes the depreciation and overheads associated with
the rental costs of electronics used to provide Ethernet Access Direct (EAD)
services, Wholesale Extension Services (WES), LAN Extension Services.
(LES), Ethernet services, Backhaul Extension Services (BES), Wholesale and
LAN extension services, and Backhaul Network Services.
Basis for Usage Factor Calculation
The usage factor for this component is based on the relative price of the
electronics used to provide the service ie the electronics used for a EAD
1000mbit/s circuit (usage factor 1.70) is approximately 12% more
expensive than the electronics for a EAD 100 Mbit/s circuit (usage factor
1.52).
CO485
Ethernet
Electronics
CO506 Customer Support - partial private circuits
Description
A Partial Private Circuit (PPC) is a service that has the attributes of a
Wholesale half circuit. The PPC routes from the network Point of Presence
(PoP) by means of Point of Handover (PoH) between a communication
provider’s network and BT’s network. A path is then set up across the BT
network to the 3rd party customers to supply an end-to-end path at the
appropriate bandwidth.
This component attributes the costs of the Selling, General and
Administration (SG&A) activities of BT Wholesale in supporting Partial
Private Circuit products.
The bulk of the costs are FTE pay and people related costs within BT
Wholesale and BT Wholesale support costs incurred from BT TSO. It also
includes overheads from other lines of business, such as support costs for IT
and accommodation.
Basis for Usage Factor Calculation
These usage factors represent the unit price of the services to which these
components map to, so that costs are allocated on the basis of revenue.
CO506
Customer Support -
partial private
circuits
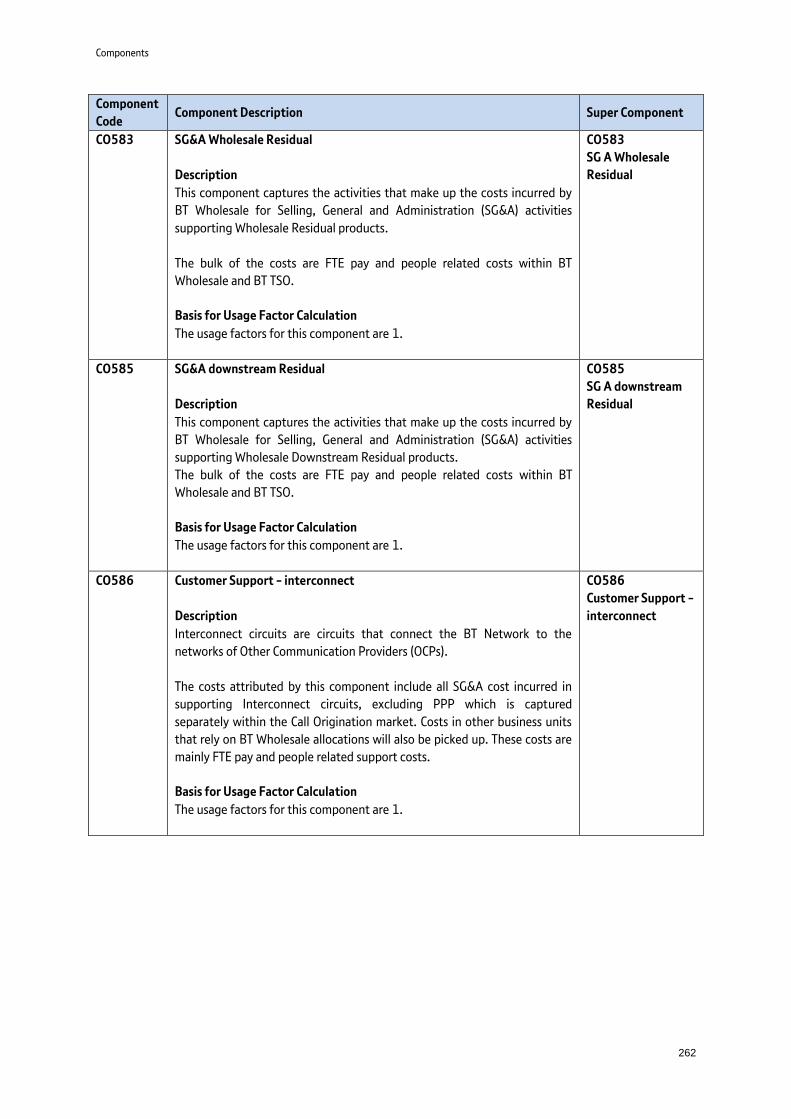
Components
262
Component
Code Component Description Super Component
CO583 SG&A Wholesale Residual
Description
This component captures the activities that make up the costs incurred by
BT Wholesale for Selling, General and Administration (SG&A) activities
supporting Wholesale Residual products.
The bulk of the costs are FTE pay and people related costs within BT
Wholesale and BT TSO.
Basis for Usage Factor Calculation
The usage factors for this component are 1.
CO583
SG A Wholesale
Residual
CO585 SG&A downstream Residual
Description
This component captures the activities that make up the costs incurred by
BT Wholesale for Selling, General and Administration (SG&A) activities
supporting Wholesale Downstream Residual products.
The bulk of the costs are FTE pay and people related costs within BT
Wholesale and BT TSO.
Basis for Usage Factor Calculation
The usage factors for this component are 1.
CO585
SG A downstream
Residual
CO586 Customer Support - interconnect
Description
Interconnect circuits are circuits that connect the BT Network to the
networks of Other Communication Providers (OCPs).
The costs attributed by this component include all SG&A cost incurred in
supporting Interconnect circuits, excluding PPP which is captured
separately within the Call Origination market. Costs in other business units
that rely on BT Wholesale allocations will also be picked up. These costs are
mainly FTE pay and people related support costs.
Basis for Usage Factor Calculation
The usage factors for this component are 1.
CO586
Customer Support -
interconnect

Components
263
Component
Code Component Description Super Component
CO609 Customer Support - broadband
Description
This component attributes the SG&A Broadband costs incurred by BT
Wholesale in supporting Wholesale Broadband Access (WBA). The costs are
determined by the annual FTE activity analysis of the primary BT Wholesale
functional units.
Basis for Usage Factor Calculation
Many of the usage factors are prices (calendarised weighted average prices)
and consequently move year on year to reflect price changes.
Other Ancillaries include all services which we do not separately break out
and we therefore reflect the total revenue in the usage factor (with a
volume of 1).
CO609
Customer Support -
broadband
CO668 IP Network management
Description
IP network management relates to the set of communication tools which
enables computers to 'talk' to each other over the Internet for 20CN
services such as IPstream and Datastream.
This component attributes Internet Protocol (IP) network management
costs. It includes all the costs associated with Operational Support Systems
(OSS) – these are activities used to run the network and business. Typical
activities that are part of OSS are taking a customer’s order, configuring
network components, logging and managing faults.
Basis for Usage Factor Calculation
The usage factors for this component are 1.
CO668
IP Network
Management
CO670 IP Network Fixed Access
Description
This Component attributes the costs of the following types of equipment:
BTnet Direct and Flex NTE (Network Terminal Equipment) Routers,
which connect the customer to the BT Network.
BTnet Access Routers, which connect the MSIP (Multi Services Intranet
Platform) and Synchronous Digital Hierarchy (SDH) access to the IP
Network at Colossus PoPs (Point of Presences).
Basis for Usage Factor Calculation
The usage factors for this component are 1.
CO670
IP Network Fixed
Access

Components
264
Component
Code Component Description Super Component
CO681 Broadband backhaul circuits excl. Virtual Paths
Description
This component attributes the costs of SDH Broadband backhaul circuits.
SDH Broadback backhaul circuits are dedicated circuits that connect the
DSLAM to the ATM platform. The circuits are used to provide bandwidth
and virtual path services to BT Retail and other service providers for 20CN
services such as IPstream and Datastream.
Basis for Usage Factor Calculation
This component is attributed to services based on original end-user volume
factored by bandwidth. This factoring has been taken into account in the
service volumes, so the usage factor is 1 (eg the service SM124 external
IPstream Connect - Bandwidth had a volume of 407,533 average Mbit/s
which is calculated from 479,144 end-users factored by an average
bandwidth usage of 0.85 Mbit/s).
CO681
Broadband
backhaul circuits
excl. Virtual Paths
CO772 OR Systems & Development - Ethernet
Description
This component attributes the development costs for Openreach products
specific to Ethernet.
Basis for Usage Factor Calculation
The costs of this component are attributed based on the number of circuits
ordered or rented during the year. The usage factors are normally 1 except
in these cases:
WES and BES service volumes are measured as local ends so we use a
usage factor of 0.5 to convert into circuits.
Main Link service volumes are measured in kms so the usage a factor is
based on the average circuit length of 7.1kms and is calculated as 1 /
7.1 = 0.14.
CO772
OR Systems &
Development -
Ethernet
CO989 Special Fault Investigation
Description
This component captures the costs of Special Fault Investigations (SFI). A
Local Loop Unbundling (LLU) SFI can be initiated by an LLU
Communications Provider (CP) when a Metallic Path Facility (MPF) or
Shared Metallic Path Facility (SMPF) tests OK on the Openreach line test
system, but where there might be a problem with the CP’s Asymmetric
Digital Subscriber Line (ADSL) or Symmetric Digital Subscriber Line (SDSL)
service.
The LLU SFI is a chargeable investigation product which attempts to
identify and resolve DSL service affecting problems.
Basis for Usage Factor Calculation
The usage factors for this component are 1.
CO989
Special Fault
Investigation

Components
265
Component
Code Component Description Super Component
CP502 Openreach sales product management
Description
This component contains costs for Openreach Sales Product Management.
Basis for Usage Factor Calculation
We calculate Usage Factors by reference to a survey of staff (expressed as
FTE) which relates people to activities, however this survey does not
provide sufficient granularity to map the FTEs directly to services for
Ethernet. To gain this granularity we calculate breakdown of the FTE
information using revenue and volumes Ethernet data, which allows us to
create a weighted associated of the costs in each Ethernet product group to
the appropriate service. Usage Factors are calculated using these
weightings.
CP502
Openreach sales
product
management
CR188 DSLAM Support
Description
Digital Subscriber Line Access Multiplexer (DSLAM) is network equipment
located in telephone exchange that provides access for the broadband end
user. It connects multiple customers’ Digital Subscriber Lines (DSL) to a
high speed internet backbone and allows customers to make faster
connections to the internet.
This component attributes the overhead costs of DSLAMs.
Basis for Usage Factor Calculation
We have modelled the detailed costs of each individual DSLAM and have
been able to attribute the modelled costs to specific services as we have
information on the number of end-users connected at each site, by service,
for each DSLAM.
We use this information to calculate the usage factors such that a
proportion of this component’s costs are allocated to each service.
This component is attributed in proportion to cost analysis for all of our
DSLAMs.
CR188
DSLAM Support
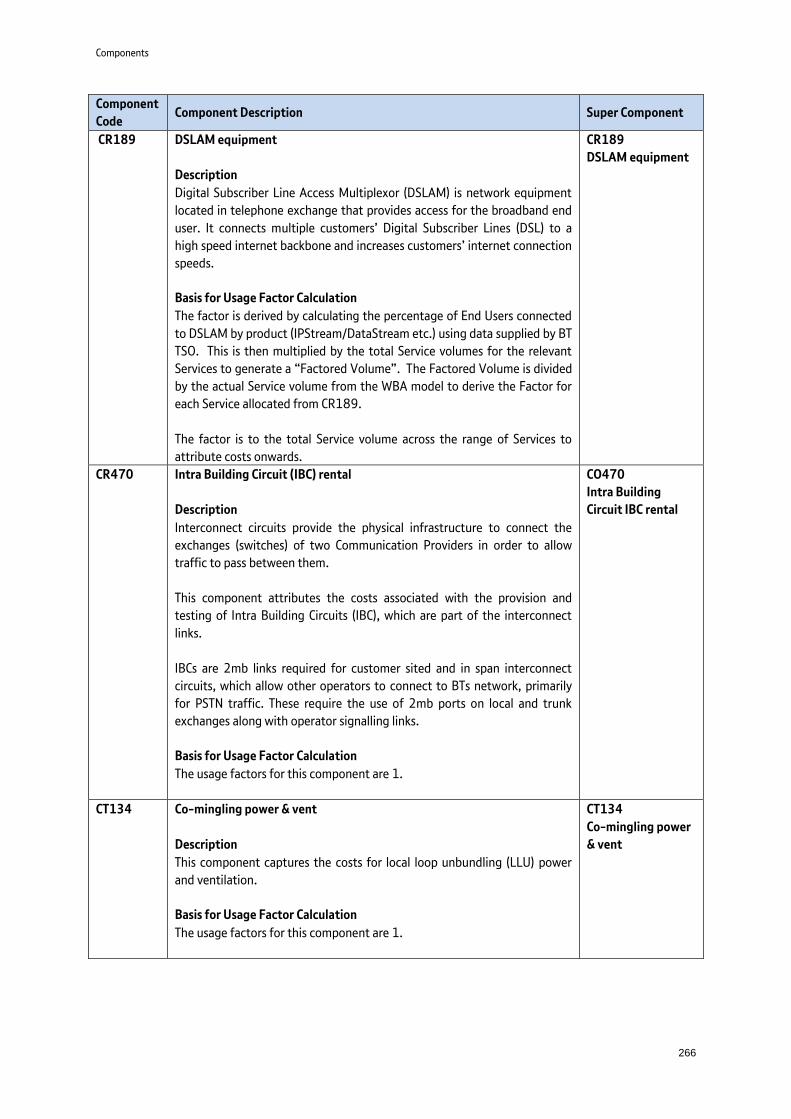
Components
266
Component
Code Component Description Super Component
CR189 DSLAM equipment
Description
Digital Subscriber Line Access Multiplexor (DSLAM) is network equipment
located in telephone exchange that provides access for the broadband end
user. It connects multiple customers’ Digital Subscriber Lines (DSL) to a
high speed internet backbone and increases customers’ internet connection
speeds.
Basis for Usage Factor Calculation
The factor is derived by calculating the percentage of End Users connected
to DSLAM by product (IPStream/DataStream etc.) using data supplied by BT
TSO. This is then multiplied by the total Service volumes for the relevant
Services to generate a “Factored Volume”. The Factored Volume is divided
by the actual Service volume from the WBA model to derive the Factor for
each Service allocated from CR189.
The factor is to the total Service volume across the range of Services to
attribute costs onwards.
CR189
DSLAM equipment
CR470 Intra Building Circuit (IBC) rental
Description
Interconnect circuits provide the physical infrastructure to connect the
exchanges (switches) of two Communication Providers in order to allow
traffic to pass between them.
This component attributes the costs associated with the provision and
testing of Intra Building Circuits (IBC), which are part of the interconnect
links.
IBCs are 2mb links required for customer sited and in span interconnect
circuits, which allow other operators to connect to BTs network, primarily
for PSTN traffic. These require the use of 2mb ports on local and trunk
exchanges along with operator signalling links.
Basis for Usage Factor Calculation
The usage factors for this component are 1.
CO470
Intra Building
Circuit IBC rental
CT134 Co-mingling power & vent
Description
This component captures the costs for local loop unbundling (LLU) power
and ventilation.
Basis for Usage Factor Calculation
The usage factors for this component are 1.
CT134
Co-mingling power
& vent

Components
267
Component
Code Component Description Super Component
CW609 Ethernet Access Direct Fibre
Description
This Component attributes the depreciation and overheads for fibre
providing access from BT Exchange to Customer premises for Ethernet
Access Direct (EAD) services.
This component also includes the cost of duct that the fibre resides in.
Basis for Usage Factor Calculation
The usage factors represent the number of fibres used by each service
weighted by the relative cost to the end user of WECLA vs non-WECLA
services (ie WECLA usage factors = 0.46 vs non-WECLA usage factors of
1.00).
The usage factors also take into account the take-up of resilience options -
higher bandwidth options have increased resilience requiring additional
fibres.
CW609
Ethernet Access
Direct Fibre
CW900,
CW901,
CX902
Revenue Receivables
Description
These components capture system generated figures for receivables for the
RFS. These receivables are an approximation of the amounts owed to BT,
both internal (ie for Openreach representing receivables that would be
generated if trades between BT’s lines of business were undertaken to a
third party and at arm’s length) and external. They are based upon the
average trading terms of BT Group’s external trades which we calculate
external to the REFINE system on an annual basis and the revenue
calculated using price time volume (PxV) calculations as part of the
attribution process.
Basis for Usage Factor Calculation
The Usage Factors are system generated. The attribution of receivables is
directly in proportion to the revenue of each revenue-generating service.
REFINE therefore uses the price of each service as the Usage Factor.
CD900
Revenue
Receivables
CZ252B OR Residual elimination
Description
This component captures the “variance” between the calculated notional
revenues associated with Other Communication Providers (OCPs), and the
actual revenues received from OCPs, relating to Openreach activity.
Basis for Usage Factor Calculation
The usage factors for this component are 1.
CZ252B
OR Residual
elimination

Components
268
Component
Code Component Description Super Component
CZ252N WH Residual elimination
Description
This component captures the “variance” between the calculated notional
revenues associated with Other Communication Providers (OCPs), and the
actual revenues received from OCPs, relating to BT Wholesale activity.
Basis for Usage Factor Calculation
The usage factors for this component are 1.
CZ252N
WH Residual
elimination
n/a Notional creditors
Description
This component captures system generated figures for notional creditors
for WBA Market A in the RFS. These creditors are an approximation of the
amounts owed to Openreach by BT Wholesale for Equivalence of Input (EOI)
charges. They represent an approximation of the creditor balances which
would exist if trades between BT’s lines of business were undertaken to a
third party and at arm’s length. They are based upon the average trading
terms of BT Group’s external trades which we calculate external to the
REFINE system on an annual basis and the costs attributed to WBA Market
A. Note that there is no component code as REFINE automatically overlays
the calculated figure to the services as required in the WBA market.
Basis for Usage Factor Calculation
The Usage Factors are system generated. The attribution of notional
creditors is directly in proportion to the costs incurred by BT Wholesale for
each EOI service consumed as part of providing a Wholesale service. REFINE
therefore uses the cost of each EOI service as the Usage Factor.
Notional creditors
14.4 Component to Service mappings including Usage Factors employed in the attribution process
The component to service mapping for all components listed in the above dictionary and the factors which are
applied to these components is separately published as a separate annex on our website.

Transfer charges
269
15. Transfer Charges
15.1 Introduction to transfer charging Transfer charges occur where there are internal trades between Lines of Business (LoB). The accounting for
transfer charges has two sides: transfers in and transfers out.
A transfer out is the charge received by the LoB providing the service and this is accounted for in that LoB as a
credit to costs under an F8 code starting with “28” eg 2814AE “Managed Services SG&A Out”
A transfer in is the charge paid by the LoB receiving the service and is accounted for in that LoB as a debit to costs
under a matching F8 code starting with “24” eg 2414AE “Managed Services SG&A In”.
In most cases the transfers in and transfer out are matched within cost centres and do not affect the Regulatory
Financial Reporting in any meaningful way.
The Attribution of Transfers In
Since the attribution of these costs do not normally affect the Regulatory Financial Reporting we have simply
attributed the costs to retail residual and not attempted assessing the cost drivers that would be required to
attribute them to activity groups and plant groups. The exceptions to this rule are:
Transfer Charges to Openreach. Under the terms of “the Undertakings” we are required to present the financial
results of Openreach within the RFS and to reconcile them to Openreach segmental financial statements published
in BT’s annual report. This is explained further in section 3 (Openreach reporting). In order for us to understand
and control any variances in the reconciliation report it is been necessary for us to attribute Openreach transfers in
to plant groups and activity groups using the same, or close approximations, to the methodologies used to
attribute the underlying costs in the transfer charging LoB. These attributions are mostly matched by the transfers
out from the charging LoBs, but provide us with valuable information on the total amount of Openreach costs that
have been allocated at each attribution stage.
Transfer Charges from Group Property and BT Fleet. The processing of the transfer charges from these two units
forms an integral part of our attribution methodology for AG106 (Group Property and Facilities Management) and
AG101 (Motor Transport). In order to attribute these costs rather than focus on specific nature of the costs within
the activity group we focus instead on how each LoB uses the services provided by Group Property and BT Fleet.
The process works as follows:
Step 1 - The costs of LoB A relating to services provided to other parts of BT are attribute to Activity Group X
Step 2 – LoB A charges LoB B for the provision of a service
Step 3 – We attribute the “transfer in” paid by LOB B to PGs using an attribution rule that reflects how it uses the
service.
Step 4 – REFINE creates a system generated base to attribute the “transfer out” received by LOB A to the same
PGs as the “transfers in” for LoB B so that they both net to nil.
Step 5 – REFINE creates a system generated base to the attribute Activity Group X to PGs in proportion to the
“transfers out” received by LoB A.

Transfer charges
270
Transfers charges that do not net to zero within the SMP markets. In some cases our attributions of transfers in
and transfers out are not attributed in the same way and do not net to nil in reported markets. We do this for one
of two reasons:
1. The charge has been received is from a non-core unit. In these cases REFINE does not have a detailed
view of the underlying costs in the charging unit but we believe that the transfer-in represents an
appropriate estimate of the relevant costs eg BT Group insurance premiums.
2. The charge relates to an externally available service provided for internal use in which case the charges
are shown at standard prices. In these cases, we consider the prices to be an appropriate estimate of the
costs eg the provision of BT Conferencing services.
We specify which trades do not net to nil at the end of later in this section.
The Attribution of Transfers Out
As explained above each transfer between LoBs has two matching F8 codes: a transfer in starting with “24” and a
transfer out starting with “28”. We normally attribute the transfer out using a system generated base called Rule
Type 28 whereby the system apportions the costs of the transfers out in proportion to how the transfers in have
already been attributed to activity groups and plant groups. In this way the transfers in and transfers out net off
to nil at each stage in our attribution process. There exceptions to this treatment are:
Transfers charges that do not net to zero within the SMP markets. Where do not want treat the transfers in and
transfers out in the same way, for one of the reasons explained above, we attribute the transfers out to Retail
Residual. In this way the relevant transfers in remain unmatched in each stage of the attribution process.
Transfer charges between core units and non-core units. Transfer charges in and transfer charges out all net to
zero in total. However, in the case of transfer charges between LoBs on our core ledgers and business units on our
non-core ledger then we are unable to match the charges in and charges out for each specific trade. This is
because the non-core ledger is at a lower level of granularity and all transfer charges from Core LoBs are reported
under the F8 code 772030 (Direct Transfer Charges In –Other). Therefore, Refine appears to show in balance
between transfer out and transfer in for these trades ie the transfers out are greater than the transfer in.
In these cases the Rule Type 28 matches the transfers out with all the core ledger transfers in and the remaining
balance is attributed to Retail Residual.
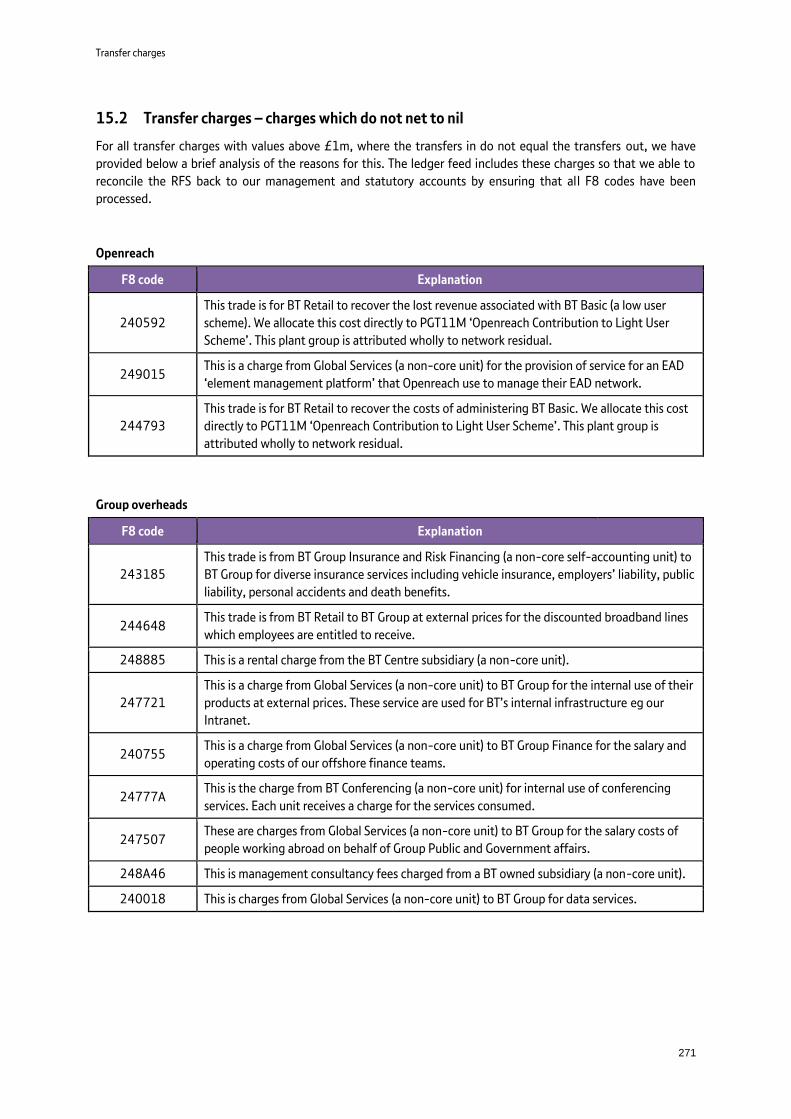
Transfer charges
271
15.2 Transfer charges – charges which do not net to nil
For all transfer charges with values above £1m, where the transfers in do not equal the transfers out, we have
provided below a brief analysis of the reasons for this. The ledger feed includes these charges so that we able to
reconcile the RFS back to our management and statutory accounts by ensuring that all F8 codes have been
processed.
Openreach
F8 code Explanation
240592
This trade is for BT Retail to recover the lost revenue associated with BT Basic (a low user
scheme). We allocate this cost directly to PGT11M ‘Openreach Contribution to Light User
Scheme’. This plant group is attributed wholly to network residual.
249015 This is a charge from Global Services (a non-core unit) for the provision of service for an EAD
‘element management platform’ that Openreach use to manage their EAD network.
244793
This trade is for BT Retail to recover the costs of administering BT Basic. We allocate this cost
directly to PGT11M ‘Openreach Contribution to Light User Scheme’. This plant group is
attributed wholly to network residual.
Group overheads
F8 code Explanation
243185
This trade is from BT Group Insurance and Risk Financing (a non-core self-accounting unit) to
BT Group for diverse insurance services including vehicle insurance, employers’ liability, public
liability, personal accidents and death benefits.
244648 This trade is from BT Retail to BT Group at external prices for the discounted broadband lines
which employees are entitled to receive.
248885 This is a rental charge from the BT Centre subsidiary (a non-core unit).
247721
This is a charge from Global Services (a non-core unit) to BT Group for the internal use of their
products at external prices. These service are used for BT’s internal infrastructure eg our
Intranet.
240755 This is a charge from Global Services (a non-core unit) to BT Group Finance for the salary and
operating costs of our offshore finance teams.
24777A This is the charge from BT Conferencing (a non-core unit) for internal use of conferencing
services. Each unit receives a charge for the services consumed.
247507 These are charges from Global Services (a non-core unit) to BT Group for the salary costs of
people working abroad on behalf of Group Public and Government affairs.
248A46 This is management consultancy fees charged from a BT owned subsidiary (a non-core unit).
240018 This is charges from Global Services (a non-core unit) to BT Group for data services.

Transfer charges
272
TSO
F8 code Explanation
244345 This is a trade from Global Services (a non-core unit) to BT TSO for the salary and operating
costs of our offshore IT development teams.
244772
This represents a charge from BT IT Services Ltd (a non-core subsidiary of BT Group) to TSO
for IT hardware and services that are used in the services that TSO provides for the lines of
business.
241701 This code is used to capitalise some the costs in F8 code 244772, above.
BT Wholesale
F8 code Explanation
247659 This charge represents BT IT Services Ltd (a non-core unit) charging BT Wholesale for ‘Cisco
kit cost recovery’. This cost is wholly attributed to the network residual market.
243187 This is a charge from BT Americas (a non-core unit within Global Services) to BT Wholesale for
global network products. This cost is wholly attributed to the network residual market.
24177A This represents a charge from BT Global Services Solutions (a non-core unit) to BT Wholesale.
This cost is wholly attributed to the network residual market.
246705 These are charges from Global Services (a non-core unit) to BT Wholesale relating to media
and broadcast contracts. This cost is wholly attributed to the network residual market.
242914 This is a trade from Global Services for computing services. This cost is wholly attributed to
the network residual market.
244642 This is a cost of sales charge from BT Directories (a non-core unit) to BT Wholesale for non-
regulated services. This cost is wholly attributed to the network residual market.
244643
This is a charge from Global Services (a non-core unit) to BT Wholesale for the cost of sales
against certain BT Wholesale equipment sales. This cost is wholly attributed to the network
residual market.
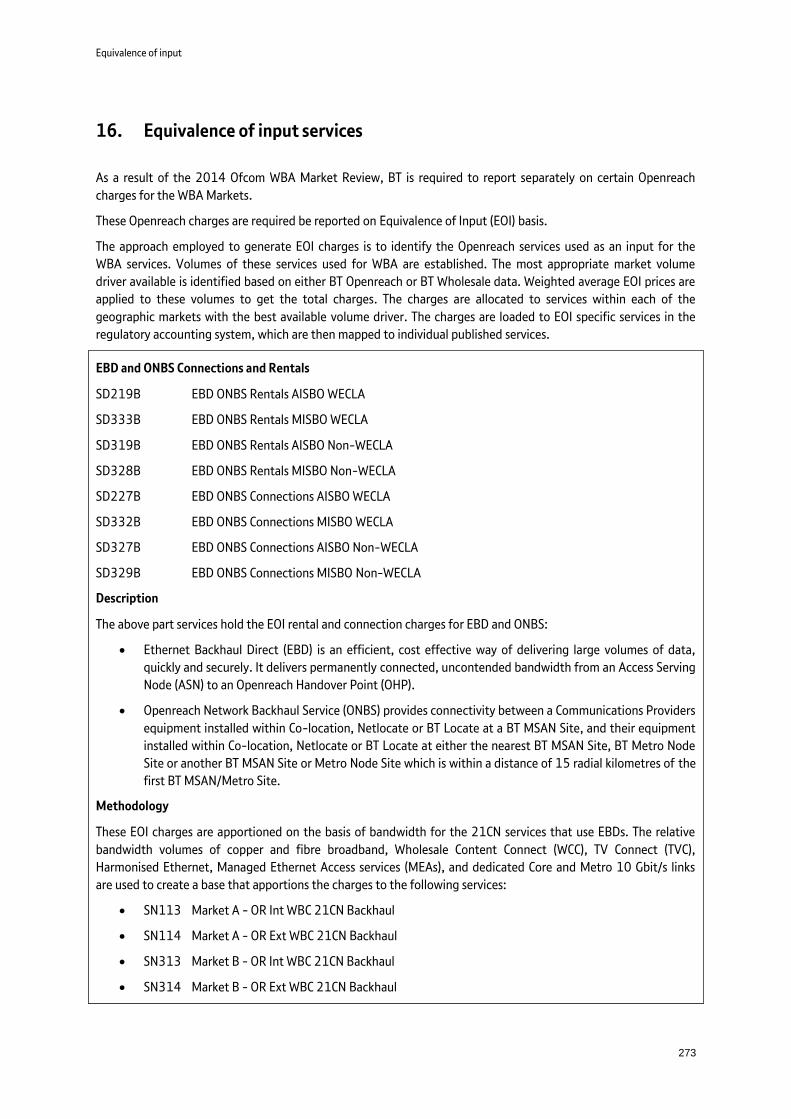
Equivalence of input
273
16. Equivalence of input services
As a result of the 2014 Ofcom WBA Market Review, BT is required to report separately on certain Openreach
charges for the WBA Markets.
These Openreach charges are required be reported on Equivalence of Input (EOI) basis.
The approach employed to generate EOI charges is to identify the Openreach services used as an input for the
WBA services. Volumes of these services used for WBA are established. The most appropriate market volume
driver available is identified based on either BT Openreach or BT Wholesale data. Weighted average EOI prices are
applied to these volumes to get the total charges. The charges are allocated to services within each of the
geographic markets with the best available volume driver. The charges are loaded to EOI specific services in the
regulatory accounting system, which are then mapped to individual published services.
EBD and ONBS Connections and Rentals
SD219B EBD ONBS Rentals AISBO WECLA
SD333B EBD ONBS Rentals MISBO WECLA
SD319B EBD ONBS Rentals AISBO Non-WECLA
SD328B EBD ONBS Rentals MISBO Non-WECLA
SD227B EBD ONBS Connections AISBO WECLA
SD332B EBD ONBS Connections MISBO WECLA
SD327B EBD ONBS Connections AISBO Non-WECLA
SD329B EBD ONBS Connections MISBO Non-WECLA
Description
The above part services hold the EOI rental and connection charges for EBD and ONBS:
Ethernet Backhaul Direct (EBD) is an efficient, cost effective way of delivering large volumes of data,
quickly and securely. It delivers permanently connected, uncontended bandwidth from an Access Serving
Node (ASN) to an Openreach Handover Point (OHP).
Openreach Network Backhaul Service (ONBS) provides connectivity between a Communications Providers
equipment installed within Co-location, Netlocate or BT Locate at a BT MSAN Site, and their equipment
installed within Co-location, Netlocate or BT Locate at either the nearest BT MSAN Site, BT Metro Node
Site or another BT MSAN Site or Metro Node Site which is within a distance of 15 radial kilometres of the
first BT MSAN/Metro Site.
Methodology
These EOI charges are apportioned on the basis of bandwidth for the 21CN services that use EBDs. The relative
bandwidth volumes of copper and fibre broadband, Wholesale Content Connect (WCC), TV Connect (TVC),
Harmonised Ethernet, Managed Ethernet Access services (MEAs), and dedicated Core and Metro 10 Gbit/s links
are used to create a base that apportions the charges to the following services:
SN113 Market A - OR Int WBC 21CN Backhaul
SN114 Market A - OR Ext WBC 21CN Backhaul
SN313 Market B - OR Int WBC 21CN Backhaul
SN314 Market B - OR Ext WBC 21CN Backhaul

Equivalence of input
274
SM413 OR TVC
SM414 OR WCC
SM415 OR SFBB BW
SM416 OR HE/MEAS
Data Sources
The total EOI charge is sourced using Openreach commercial volumes from COSMOSS and EST and Price List prices.
The bandwidth volumes are sourced from: WCR for broadband; Skytide for WCC; GVF for TV Connect; GVF, PACs,
MIS, And Enterprise Information Oracle Platform (EIP) for Harmonised Ethernet and MEAs; and Discoverer for Core
and Metro 10 Gbit/s links.
SMPF Connections:
SL138B SMPF New Provides
Description
The above part services hold the EOI charges for Shared Metallic Path Facility (SMPF) new provides. The SMPF
service allows CPs to provide broadband services over the BT copper network. It enables customers to share a line
with another Communications Provider providing a voice service to the same customer.
Methodology
These EOI charges are apportioned on the basis of connections for the copper services that use SMPF. The number
of connections in the year to IPstream and WBC split by internal and external connections and by geographic
market are used to create a base that apportions the charges to the following services:
SM101 Market A - OR Int IPS Connections
SM102 Market A - OR Ext IPS Connections
SN133 Market A - OR Int WBC Connections
SN134 Market A - OR Ext WBC Connections
SM301 Market B - OR Int IPS Connections
SM302 Market B - OR Ext IPS Connections
SN333 Market B - OR Int WBC Connections
SN334 Market B - OR Ext WBC Connections
SM450 WBA end user access - Conns OR/WS rec service
Data Sources
The total EOI charge for this service is sourced from the Actual Reporting Cube (ARC) reporting system managed
by Openreach Finance.
The connection volumes (split by service, market and internal/external) are sourced from WCR.
SMPF Rentals:
SL158B SMPF Rentals
Description
The above part services hold the ongoing EOI rental charges for SMPF services. This service allows customers to
provide broadband services over the BT copper network. It enables CPs to share a line with another
Communications Provider providing a voice service to the same customer.

Equivalence of input
275
Methodology
These EOI charges are apportioned on the basis of end user rentals for the copper services that use SMPF. The end
user rental volumes for IPstream, Datastream and WBC split by internal and external rentals and by geographic
market are used to create a base that apportions the charges to the following services:
SM103 Market A - OR Int IPS Max and Max Premium Rentals
SM104 Market A - OR Ext IPS Max and Max Premium Rentals
SM105 Market A - OR Int Datastream end user access Rentals
SM106 Market A - OR Ext Datastream end user access Rentals
SM107 Market A - OR Int WBC end user access Rentals
SM108 Market A - OR Ext WBC end user access Rentals
SN129 Market A - OR Int IPS Home and Office Rentals
SN130 Market A - OR Ext IPS Home and Office Rentals
SM303 Market B - OR Int IPS Max and Max Premium Rentals
SM304 Market B - OR Ext IPS Max and Max Premium Rentals
SM305 Market B - OR Int Datast end user access Rentals
SM306 Market B - OR Ext Datast end user access Rentals
SM307 Market B - OR Int WBC end user access Rentals
SM308 Market B - OR Ext WBC end user access Rentals
SN329 Market B - OR Int IPS Home and Office Rentals
SN330 Market B - OR Ext IPS Home and Office Rentals
Data Sources
The total EOI charge for this service is sourced from the Actual Reporting Cube (ARC) reporting system managed
by Openreach Finance.
The end user rental volumes (split by service, market and internal/external) are sourced from WCR.
Migrations
SL139B SMPF Single Migrations
SL199B SMPF Bulk Migrations
Description
The above part services hold the EOI charges where an SMPF service is migrated between two customers. SMPF
service allows customers to provide broadband services over the BT copper network. It enables customers to share
a line with another Communications Provider providing a voice service to the same customer.
Methodology
The volume of single migrations and multiple migrations are added together to create a base. The EOI charges are
then apportioned in total to the migration services based on the geographical location of the migration and an
internal/external split, with the charge apportioned to the following services:
SM175 Market A - OR Int end user access CP Migrations
SM176 Market A - OR Ext end user access CP Migrations
SM375 Market B - OR Int end user access CP Migrations

Equivalence of input
276
SM376 Market B - OR Ext end user access CP Migrations
Data Sources
The total EOI charge for this service is sourced from the Actual Reporting Cube (ARC) reporting system managed
by Openreach Finance.
The single and multiple migration volumes (split by service, market and internal/external) are sourced from WCR.
Ceases
SL201B MPF Hard Ceases
SL202B SMPF Hard Ceases
Description
The above part services hold the EOI charges for:
The cessation of MPF lines - MPF services enable customers offer both voice and broadband services. It
provides a two-wire metallic transmission path between the Network Terminating Equipment at a
customer’s premises and a main distribution or jumper frame at the exchange.
The cessation of SMPF lines - SMPF services allow CPs to provide broadband services over the BT copper
network. It enables CPs to share a line with another Communications Provider providing a voice service to
the same customer.
Methodology
The volume of ceases in Market A and Market B, split by internal and external, are used as a base to apportion all
EOI cease charges to the following services:
SM109 Market A - OR Int WBA end user access ceases
SM110 Market A - OR Ext WBA end user access ceases
SM309 Market B - OR Int WBA end user access ceases
SM310 Market B - OR Ext WBA end user access ceases
Data Sources
The total EOI charge for this service is sourced from the Actual Reporting Cube (ARC) reporting system managed
by Openreach Finance.
The cease volumes (split by service, market and internal/external) are sourced from WCR.
Other Tie Pair Modifications
SL203B Other Tie Pair Modifications
Description
The above part services hold the EOI charges for Next Working Day tie pair modification for SMPF and MPF
services. This service allows customers to move their own end user customers’ service to different equipment in a
BT exchange building.
Methodology
These EOI charges are apportioned on the basis of end user rentals for the copper services that use SMPF. The end
user rental volumes for IPstream, Datastream and WBC split by internal and external rentals and by geographic
market are used to create a base that apportions the charges to the following services:
SM177 Market A - OR Int IPS DSLAM Grooming
SM178 Market A - OR Ext IPS DSLAM Grooming

Equivalence of input
277
SM179 Market A - OR Int Datastream DSLAM Grooming
SM180 Market A - OR Ext Datastream DSLAM Grooming
SN129 Market A - OR Int IPS Home and Office Rentals
SN130 Market A - OR Ext IPS Home and Office Rentals
SM377 Market B - OR Int IPS DSLAM Grooming
SM378 Market B - OR Ext IPS DSLAM Grooming
SM379 Market B - OR Int Datastream DSLAM Grooming
SM380 Market B - OR Ext Datastream DSLAM Grooming
SN329 Market B - OR Int IPS Home and Office Rentals
SN330 Market B - OR Ext IPS Home and Office Rentals
Data Sources
The total EOI charge for this service is sourced from the Actual Reporting Cube (ARC) reporting system managed
by Openreach Finance.
The end user rental volumes (split by service, market and internal/external) are sourced from WCR.
Tie Cables
SL128B Tie Cables
SL206B Other Tie-cables and Comingling
Description
The above part services hold the EOI charges for SMPF and MPF tie cables. Tie Cables connect customers’
equipment within a BT exchange building.
Methodology
The input data is firstly split out between 20CN and 21CN tie cables so that the 21CN tie cables are only allocated
to WBC services whereas the 20CN services are allocated to IPstream and Datastream.
Both the 20CN and 21CN tie cable EOI charges are apportioned on the basis of end user rentals, so the 21CN tie
cables are apportioned between market and internal/external using WBC rental information and 20CN are
apportioned using IPstream and Datastream rentals.
The 21CN charges are apportioned to the following services:
SM185 Market A - OR Int WBC 21CN Tie cables
SM186 Market A - OR Ext WBC 21CN Tie cables
SM385 Market B - OR Int WBC 21CN Tie cables
SM386 Market B - OR Ext WBC 21CN Tie cables
The 21CN charges are apportioned to the following services:
SM187 Market A - OR Int IPstream Connect 20CN Tie cables
SM188 Market A - OR Ext IPstream Connect 20CN Tie cables
SM189 Market A - OR Int Datastream 20CN Tie cables
SM190 Market A - OR Ext Datastream 20CN Tie cables
SM387 Market B - OR Int IPstream Connect 20CN Tie cables

Equivalence of input
278
SM388 Market B - OR Ext IPstream Connect 20CN Tie cables
SM389 Market B - OR Int Datastream 20CN Tie cables
SM390 Market B - OR Ext Datastream 20CN Tie cables
Data Sources
The total EOI charge for this service is sourced from the Actual Reporting Cube (ARC) reporting system managed
by Openreach Finance.
The end user rental volumes (split by service, market and internal/external) are sourced from WCR.
Enhanced Care
SL272B SMPF Enhanced Care
Description
The above part services hold the EOI charges for the SMPF Enhanced Care service. SMPF Enhanced Care provides
higher service maintenance levels for an SMPF line.
Methodology
These EOI charges are apportioned on the basis of end user rentals for the copper services that use SMPF. The end
user rental volumes for IPstream, Datastream and WBC split by internal and external rentals and by geographic
market are added together to create a base that apportions the charges to the following services:
SM191 Market A - OR Int WBA SMPF enhanced care
SM192 Market A - OR Ext WBA SMPF enhanced care
SM391 Market B - OR Int WBA SMPF enhanced care
SM392 Market B - OR Ext WBA SMPF enhanced care
Data Sources
The total EOI charge for this service is sourced from the Actual Reporting Cube (ARC) reporting system managed
by Openreach Finance.
The end user rental volumes (split by service, market and internal/external) are sourced from WCR.
SMPF Expedite
SL274B SMPF Expedite
Description
The above part services hold the EOI charges for the SMPF Expedite service, which provides CPs with faster SMPF
connection times.
Methodology
These EOI charges are apportioned on the basis of connections for the copper services that use SMPF. The
connection volumes for IPstream, Datastream and WBC split by internal and external connections and by
geographic market are added together to create a base that apportions the charges to the following services:
SM197 Market A - OR Int WBA SMPF Expedite
SM198 Market A - OR Ext WBA SMPF Expedite
SM397 Market B - OR Int WBA SMPF Expedite
SM398 Market B - OR Ext WBA SMPF Expedite
Data Sources

Equivalence of input
279
The total EOI charge for this service is sourced from the Actual Reporting Cube (ARC) reporting system managed
by Openreach Finance.
The connection volumes (split by service, market and internal/external) are sourced from WCR.
Broadband Boost
SL276B WBA Broadband Boost
Description
The above part services hold the EOI charges for the Broadband Boost service. This offers a cost-effective way to
try to solve issues that CP customers have with their broadband speed and reliability. A range of activities can be
carried out by BT engineers including; work relating to CPs customer’s own wiring, equipment CP provided them
with, and work on the Openreach access network (back to the local exchange).
Methodology
These EOI charges are apportioned on the basis of broadband boost volumes. The number of copper boost
volumes is split by Market A and Market B based on the total market split of WBC, IPstream and Datastream
connections. Fibre boosts are apportioned to SN403, and any further residual boost volumes charged for by
Openreach are apportioned to a residual reconciliation service. The following services are those that are
apportioned the charges:
SN103 Market A - OR Int Broadband Boost
SN303 Market B - OR Int Broadband Boost
SN403 Residual - OR Int Broadband Boost
SM459 WBA Broadband Boost OR/WS rec service
Data Sources
The total EOI charge for this service is sourced from the Actual Reporting Cube (ARC) reporting system managed
by Openreach Finance.
The broadband boost volumes are sourced from WCR.
The connections based split by market for copper boosts is sourced from WCR.
GEA
SL574B GEA Other
SL950B GEA FTTC Rentals
SL951B GEA FTTC Connections
SL952B GEA FTTP Rentals
SL953B GEA FTTP Connections
SL955B GEA CP to CP Migration
Description
The above part services hold the EOI charges for BT’s Super Fast Fibre Access service:
Generic Ethernet Access over Fibre to the Cabinet (GEA-FTTC) enables CPs to offer superfast broadband
(SFBB) services at up to 80/20 Mbit/s and multiple-play services to SME and residential end user
customers.
Generic Ethernet Access over Fibre to the Premises (GEA-FTTP) enables customers to offer superfast
broadband services to SME and residential end user customers, and develop new high-bandwidth

Equivalence of input
280
services.
Methodology
The GEA EOI charges are all apportioned directly to the following residual service:
SM412 OR WBA Other Residual
Data Sources
The total EOI charge for this service is sourced from the Actual Reporting Cube (ARC) reporting system managed
by Openreach Finance.
Re-grades
SL178B Other LLU ancillaries Basket
Description
The above part services hold the EOI charges for several ancillary services related to SMPF and MPF:
SMPF and MPF Tie Pair Modifications (3 working day lead time re-terminations and Multiple re-
terminations)
Cancellations of SMPF and MPF orders for Provide, Simultaneous provide, migration, modification or
amend.
SMPF and MPF amend orders
SMPF Flexi Cease Fault Investigation Charges
SMPF and MPF Standard Line Test
Methodology
The volume of single re-terminations and multiple re-terminations are added together to create a base. The EOI
charges are then apportioned in total to the migration services based on the geographical location of the
migration and an internal/external split, with the charge apportioned to the following services:
SM161 Market A - Int end user access OR IPstream regrades
SM162 Market A - Ext end user access OR IPstream regrades
SM361 Market B - Int end user access OR IPstream regrades
SM362 Market B - Ext end user access OR IPstream regrades
Data Sources
The total EOI charge for this service is sourced from the Actual Reporting Cube (ARC) reporting system managed
by Openreach Finance.
The single and multiple migration volumes (split by service, market and internal/external) are sourced from WCR.
SFIs
SO481B Special Faults Investigations (SFIs)
Description
The above part service holds the EOI charge for a range of Special Fault Investigation ‘module’ services. These
services fix certain faults that are not covered by the standard rental service. The module types are:
Base Module
Network Module

Equivalence of input
281
Frame Module
Internal Wiring Module
Internal Equipment Module
Frame Direct Module
Methodology
The SFI based EOI charge is split between non chargeable SFIs (which are apportioned to rental services) and
chargeable SFIs (which are apportioned to individual SFI services). The split between non chargeable and
chargeable SFI volumes is sourced from WCR with a market and internal/external split. The chargeable
apportionment is then shared over the following services based on the WCR split by market and internal/external
for chargeable SFIs:
SM165 Market A - Int SFI - OR
SM166 Market A - Ext SFI - OR
SM365 Market B - Int SFI - OR
SM366 Market B - Ext SFI - OR
The non-chargeable apportionment is then shared over the following services based on the WCR split by market
and internal/external for end user rentals:
SM103 Market A - OR Int IPS Max and Max Premium Rentals
SM104 Market A - OR Ext IPS Max and Max Premium Rentals
SM105 Market A - OR Int Datastream end user access Rentals
SM106 Market A - OR Ext Datastream end user access Rentals
SM107 Market A - OR Int WBC end user access Rentals
SM108 Market A - OR Ext WBC end user access Rentals
SN129 Market A - OR Int IPS Home and Office Rentals
SN130 Market A - OR Ext IPS Home and Office Rentals
SM303 Market B - OR Int IPS Max and Max Premium Rentals
SM304 Market B - OR Ext IPS Max and Max Premium Rentals
SM305 Market B - OR Int Datast end user access Rentals
SM306 Market B - OR Ext Datast end user access Rentals
SM307 Market B - OR Int WBC end user access Rentals
SM308 Market B - OR Ext WBC end user access Rentals
SN329 Market B - OR Int IPS Home and Office Rentals
SN330 Market B - OR Ext IPS Home and Office Rentals
Data Sources
The total EOI charge for this service is sourced from the Actual Reporting Cube (ARC) reporting system managed
by Openreach Finance.
The chargeable SFI volumes and the end user rental volumes (split by service, market and internal/external) are
sourced from WCR.
ONBS Main Links

Equivalence of input
282
SD014B ONBS Main Link AISBO WECLA
SD223B ONBS Main Link MISBO WECLA
SD114B ONBS Main Link AISBO Non-WECLA
SD323B ONBS Main Link MISBO Non-WECLA
Description
The above part services hold the EOI Main Link charges for ONBS services.
Openreach Network Backhaul Service (ONBS) provides connectivity between a Communications Providers
equipment installed within Co-location, Netlocate or BT Locate at a BT MSAN Site, and their equipment installed
within Co-location, Netlocate or BT Locate at either the nearest BT MSAN Site, BT Metro Node Site or another BT
MSAN Site or Metro Node Site which is within a distance of 15 radial kilometres of the first BT MSAN/Metro Site.
Methodology
These EOI charges are apportioned on the basis of bandwidth for the 21CN services that use ONBS. The relative
bandwidth volumes of copper and fibre broadband, Wholesale Content Connect (WCC), TV Connect (TVC),
Harmonised Ethernet, Managed Ethernet Access services (MEAs), and dedicated Core and Metro 10 Gbit/s links
are used to create a base that apportions the charges to the following services:
SN113 Market A - OR Int WBC 21CN Backhaul
SN114 Market A - OR Ext WBC 21CN Backhaul
SN313 Market B - OR Int WBC 21CN Backhaul
SN314 Market B - OR Ext WBC 21CN Backhaul
SM413 OR TVC
SM414 OR WCC
SM415 OR SFBB BW
SM416 OR HE/MEAS
Data Sources
The total EOI charge is sourced using Openreach commercial volumes from COSMOSS and EST and Price List prices.
The bandwidth volumes are sourced from: WCR for broadband; Skytide for WCC; GVF for TV Connect; GVF, PACs,
MIS, And Enterprise Information Oracle Platform (EIP) for Harmonised Ethernet and MEAs; and Discoverer for Core
and Metro 10 Gbit/s links.
EAD
SO646B 21CN Backhaul EAD
Description
The above part services hold the EOI charges for Ethernet Access Direct (EAD).
Ethernet Access Direct (EAD) provides point-to-point data connectivity between sites. It can be used to build and
extend customer networks, develop new infrastructure, and meet low-capacity backhaul requirements (ie up to
1Gb, which is the starting bandwidth for Ethernet Backhaul Direct). EAD supports a range of requirements
including cloud computing, simultaneous online pupil access in classrooms and storage area network connectivity.
Methodology
These EOI charges are apportioned on the basis of bandwidth for the 21CN services that use EAD. The relative
bandwidth volumes of copper broadband, Wholesale Content Connect (WCC) and TV Connect (TVC) are used to

Equivalence of input
283
create a base that apportions the charges to the following services:
SN113 Market A - OR Int WBC 21CN Backhaul
SN114 Market A - OR Ext WBC 21CN Backhaul
SN313 Market B OR Int WBC EBD
SN314 Market B OR Ext WBC EBD
SM413 OR TVC
SM414 OR WCC
Data Sources
The total EOI charge is sourced from internal trading data.
The bandwidth volumes are sourced from: WCR for broadband; Skytide for WCC; and GVF for TV Connect.
Time Related Charges (TRCs)
SK990B Time Related Charges
Description
The above part services hold the EOI charges for Time Related Charge work relating to SMPF and MPF lines.
Time Related Charges (TRCs) are raised to recover the cost incurred when BT Openreach engineers perform work
that is not covered under the terms of the Openreach service. For example, TRCs apply where there are no
standard prices for the work required, if it falls outside normal hours, if it is needed earlier than standard
timescales or is at a CP’s site and not covered under our terms.
Methodology
These EOI charges are apportioned on the basis of connections for the copper services that use SMPF. The number
of connections in the year to IPstream and WBC split by internal and external connections and by geographic
market are used to create a base that apportions the charges to the following services:
SM103 Market A - OR Int IPS Max and Max Premium Rentals
SM104 Market A - OR Ext IPS Max and Max Premium Rentals
SM105 Market A - OR Int Datastream end user access Rentals
SM106 Market A - OR Ext Datastream end user access Rentals
SM107 Market A - OR Int WBC end user access Rentals
SM108 Market A - OR Ext WBC end user access Rentals
SN129 Market A - OR Int IPS Home and Office Rentals
SN130 Market A - OR Ext IPS Home and Office Rentals
SM303 Market B - OR Int IPS Max and Max Premium Rentals
SM304 Market B - OR Ext IPS Max and Max Premium Rentals
SM305 Market B - OR Int Datast end user access Rentals
SM306 Market B - OR Ext Datast end user access Rentals
SM307 Market B - OR Int WBC end user access Rentals
SM308 Market B - OR Ext WBC end user access Rentals
SN329 Market B - OR Int IPS Home and Office Rentals

Equivalence of input
284
SN330 Market B - OR Ext IPS Home and Office Rentals
Data Sources
The total EOI charge for this service is sourced from the Actual Reporting Cube (ARC) reporting system managed
by Openreach Finance.
The connection volumes (split by service, market and internal/external) are sourced from WCR.

Data sources
285
17. Data Sources
17.1 Introduction
As part of gathering data to both inform and use as part of our attribution methodologies we use a variety of data
sources from across BT. Where these are systems they are recorded with unique IDs on a BT database called SALSA
(Single Authorised List of Systems and Applications) – it is the approved repository of the list of every IT System
across BT. These systems are often referred to in our methodology dictionaries under the data sources section of
an entry.
In some instances we have considered whether it provides better information to readers if we set out where we
use a mixture of different systems, types of data (eg billing information) and assumptions to derive and employ
our attribution methodologies. We have consequently separately identified 21CN volumes and capital expenditure
data sources and assumptions below.
17.2 21CN volumes and capital Volumes for 21CN apportionments are based on average volumes across the year by service, sourced as follows:
GVF for Calls. The volume of calls crossing the 21CN network is very small, limited to the Pathfinder trial
in Cardiff, Voice over FTTP and SIP Trunking. The Pathfinder trial volumes are assumed to be 65,000 end
users as no detailed source data is available for the trial. Voice over FTTP and SIP Trunking are sourced
from the GVF. It is assumed that all Pathfinder, Voice over FTTP and SIP Trunking use call
origination/termination. Due to immateriality and a lack of available information on the small usage of
21CN by voice, the bandwidth per end user inputs are not updated annually.
GVF and WELF for copper and fibre WBA. The total copper and fibre WBC customers are sourced directly
from the GVF, but the system does not hold an accurate split of customers by those using WBC, WBMC
dedicated, WBMC shared or the Market B VPN services so overlays to the system are used to align the
customers of each type of WBC service to management’s knowledge by customer. The first overlay is to
reclassify internal customers between WBC, WBMC shared and WBMC dedicated where GVF does not
correctly classify the downstream LoB. The second overlay is to move customers from WBMC dedicated
to the Market B VPN service, which is not recorded separately within GVF but uses different network
architecture. A management assumption is therefore made as to how many customers use the VPN
solution rather than WBMC dedicated. Both of these overlays relate to copper and fibre, with the % of
WBMC dedicated volumes reclassified as Market B VPN 11% for copper and 43% for fibre. The
bandwidth per end user volumes are management assumptions sourced from WELF that are reconciled
back to the GVF to ensure it is materially consistent.
Skytide for WCC. The Skytide system provides us with the bandwidth volume which is the key driver of
costs for WCC. The end users and bandwidth per end user are immaterial for WCC.
TV Connect total channel bandwidth is sourced from product management billing data. This is then
assumed to be multicast across every core to core, core to metro and backhaul route simultaneously. All
core to core and metro to core routes are dual plane resilient links so it is assumed that the bandwidth is
transmitted twice over these links. The total TVC multicast bandwidth is 486,416 Mbit/s.
For HE/MEAs the circuits are sourced from GVF, and the bandwidth per end user is calculated using
network management data based on the number of bandwidth and circuit ends, location and status data
of circuit orders to provide the etherways and the class of service for the Etherflows. For 10Mbit/s,
100Mbit/s and 1Gbit/s Harmonised Ethernet services, the bandwidth at each site is the lower of the
Etherway speed per site multiplied by number of etherways or the recorded bandwidth per site. For
10Gbit/s services, the larger of these two values is used. The total bandwidth is divided by the Etherway
count across all sites to provide the bandwidth per end user.

Data sources
286
For MEAs, the Etherway bandwidth on the 100Mbit/s service is the lower of the Etherway count
multiplied by 90 or the recorded bandwidth per site, the 1Gbit/s service is the lower of the Etherway
count multiplied by 900 or the recorded bandwidth per site, and the 10Gbit/s services uses the higher of
the Etherway count multiplied by 2,500 or the recorded bandwidth per site. These calculations are to
factor in expected utilisations.
For the Ethernet - MEAS (MNOs) 1Gbit/s fibre service, not all circuits use the 21CN backhaul and 21CN
core networks so the GVF circuit count is reduced by 23% based on management data.
MSIL product management data is used to reflect the number 10Gbit/s MSILs in the 21CN. WCR then
provides a count of 1Gbit/s and 10Gbit/s MSILs, as well as a number of unidentified MSILs. The product
management volume is used for 10Gbit/s, with the balance of unidentified MSILs from the WCR data
assumed to be 1Gbit/s. This provides an assumption that there are 195 1Gbit/s MSILs and 409 10Gbit/s
MSILs.
EBD volumes are sourced from GVF.
Core to Core and Metro to Core 10Gbit/s Dedicated Links are sourced from Discoverer. Historic data
from the Discoverer system is used as the base for the volume of links, with the year on year growth in
number of links applied per management assumptions. The NGA element was actualised in 2013/14 and
then extrapolated forward and the copper links were sourced in 2011/12 and extrapolated forward.
Each individual Plant Group description states which of the above systems are used for the volume inputs to
apportion the cost of that Plant Group.
Capital inputs for 21CN are sourced as follows:
Capital analysis from BT TSO and asset lives from the LOPLIST are used to model the expected depreciation of
21CN assets, which is reconciled in total to the LOPLIST's depreciation.
The capital analysis is prepared by sourcing the volumes of individual pieces of 21CN equipment, and the
relevant prices that the equipment was purchased at each year.
The equipment is grouped into classes of work based on where the equipment is located in the network.
The cost of the equipment purchased each year is then modelled into depreciation by using the asset lives, as
per the LOPLIST, for each class of work
This depreciation is then reconciled in total to the LOPLIST depreciation for all 21CN classes of work before it
is used as an input to the 21CN model. Variances in reconciliation at class of work level however will be
expected for various reasons, including simplified depreciation modelling used for the 21CN apportionments
(where all capital is assumed to be purchased at mid-year), lack of granularity of LOPLIST indirect capex or any
mis-bookings by class of work. Variances exist for ETHER, MSAN and METRO class of work, but there net off
at a total depreciation level.

Data sources
287
17.3 High level summary of systems
Below is a summary list of data sources used within the RFS as obtained from SALSA.
System SALSA ID Full system name
A&I CMS (Advitium ) APP02540 Accommodation & Infrastructure Content
Management System
AIM APP03186 The 5620 Analysis And Inventory Module
ASC APP00045 Automated Supply Chain
Atlantis APP10024 Geneva - Local Loop Unbundling, Wholesale Line
Rental
Aztec APP12781 AZTEC Platform
CID APP00224 Central Information Database
COSMOSS APP00257 Customer Oriented System for the Management Of
Special Services
CSCS APP00294 Call Statistics Centralisation System
CSS APP00299 Customer Service Systems
CTCS APP03614 Core Transmission Circuit costing System
EXPRES APP00423 Exchange Planning and Review System
Geneva Genius APP00526 GENEVA -Local Loop Unbundling
Geneva Avalon APP07770 AVALON Residential
GVF APP10335 Global Volumes Forecast
HORIZON APP09801 BT Property HORIZON (Telereal)
INS APP00616 Integrated Network Systems
LLUMS APP08506 Local Loop Unbundling Management System
LRIC APP06047 BT Commercial Finance - Long Run Incremental
Costing
NEI APP00755 Network Equipment Inventory
NISM(NT) APP00791 Network Inventory And Spares Management System
- New Technologies
NuNCAS APP00741 Network Capacity Assignment System
ORBIT APP06635 Openreach Business Information Toolset
PACS (NCL PACS) APP00997 Network Control Layer Planning Assignment and
Configuration System
Peacemaker APP00894 Peacemaker
PIPeR APP02847 Physical Inventory Planning E-Records
PIRM APP02481 Power Inventory And Routines Manager
Powerhouse APP00922 Powerhouse
REFINE APP12439 Regulatory Finance Information Environment
RIDE APP01862 Recorded Information Distribution Equipment
STORM APP09456 Story Management
STORM (OR) APP13200 Story Management Openreach

Data sources
288
TITAN APP01114 The Inter-business Transfer Charging and Agreement
Network
Work Activity Unit Calculator APP12879 Work Activity Unit Calculator
17.3 Detailed summary of systems
Below is a list of all of the above systems including a description of the systems’ names and their functions in BT.
System name
Description
A&I CMS (Accommodation & Infrastructure Content Management System)
The system is a Content Management System used to hold all building related CAD records for the Operational Estate in a
central repository. Dimensional footprint of equipment placed onto the CAD diagrams is then synchronised with an oracle
database allowing queries on equipment and space utilisation to be run.
AIM (Analysis and Inventory Module)
AIM is an Alcatel-Lucent application that extracts and stores network inventory, network performance and usage, statistics and
alarm data from the MSIP ATM platform element managers and statistics aggregators
It Collects detailed engineering data from the 5620 Network Manager, the 5620 Stats Collector, and major Alcatel Core and
Edge Switching Products.
ASC (Automated Supply Chain)
ASC is the name given by BT to the AmSOFT system and its interfaces. The ASC primary functions include: stores purchasing,
order management, stock control, accounting systems and foreign currency invoices.
The ASC procurement matching module is used to authorise invoices.
ATLANTIS ( Geneva - Local Loop Unbundling, Wholesale Line Rental)
Atlantis bills BT Openreach services. It is used for the calculation of revenue relating to Openreach related services, and
ultimately is used in the Actuals Reporting Cube (ARC) and EST (Ethernet Service Transmissions) for a more specific analysis of
Ethernet related revenues:
The Actuals Reporting Cube (ARC) is Openreach’s revenue and volumes reporting system. It allows Openreach to analyse it
External and Internal revenues and volumes by Communications Provider (CP) which for Internal means BT Line of Business
(LoB).
The majority of the ARC’s External revenue data are obtained from IOTA which is the interface between the Atlantis billing
system and BT’s ledgers and uses revenue codes to post revenue to the correct general ledger codes and LoB. Three IOTA files,
one each for billed, unbilled and provision are received each month and bespoke csv files are created from them and manually
uploaded into the ARC.
EST provides main link revenues and average lengths. Two set of data are obtained:
1. All Ethernet circuits
2. Data only relating to the WECLA market
Data used for the regulatory accounts includes Openreach Ethernet circuit volume and revenue data for new provides,
migrations, regrades and rentals. EST includes Openreach Ethernet circuit data that is not recorded on COSMOSS.

Data sources
289
AZTEC (AZTEC Platform)
This system is used to record calls that leave/arrive from/to the BT Network via an Interconnect with an Other Communications
Provider (OCP). The records are from some 900+ exchanges and arrive via a mediator. The types of calls are:
• Originating on the BT Network, terminating on an Other Communication Provider (OCP) Network (BT makes a Payment to
Other Communication Provider (POCP) for terminating the call).
• Originating on an OCP Network, terminating on the BT Network (BT receives a Receipt from Other Communication Provider
(ROCP).
• Originating (0800/0808, IA/CPS) on the BT Network, terminating on an Other Communication Provider (OCP) Network (BT
receives a Receipt from Other Communication Provider (ROCP)).
• Originating (0800/0808, IA/CPS) on an OCP Network, terminating on the BT Network (BT makes a Payment to Other
Communication Provider (POCP)).
• Transit Traffic – where calls originate and terminate on OCPs Network. The BT Network is used to carry traffic between these
two networks.
When a customer makes a call that passes between BT and another operator’s network the details of that calls are collected at
the exchange that forms the interconnection point between them. The Streamer takes all the interconnect call records from
MEDIATOR which has polled the exchanges for this data. The Streamer then validates these calls against a model of the network
routing information. Files are then created from these validated records and these are streamed into the Company system for
consolidation into summary tables.
The Company system individually charges each call using the information provided by the contract that BT has with each other
operator. The pricing reference data is maintained using a graphical user interface. Data used for charging is provided by EBC
and NCDB.
AZTEC is the charging engine within the overall GenIUS (Geneva Integrated Universal System) used to pass on charging data to
the pricing engine, Geneva, to bill OCPs for their telephony traffic, carried over the BT Network.
AZTEC is able to apply charging data for the proportion of the BT Network used to transport an interconnect call. AZTEC is also
used extensively to check bills received from OCPs.
CID (Central Information Database)
This system is both a comprehensive data warehouse of financial and non-financial data at General Ledger (GL) level, volumes
and a suite of application software, which enables management information to be extracted. The applications run on the
system and service the needs of Group and Divisional financial analysts, field operational managers and business planners.
COSMOSS (Customer Oriented System for the Management Of Special Services)
COSMOSS is a database used for the provision of Private Services. This includes the provision of Partial Private Circuits sold to
Other Communication Providers (OCPs). It is used for new orders, re-arrangements and ceases. It acts as a 'Front End' and
generates activities for the various groups involved in providing a Private Circuit.
It includes Working System Size (WSS) and equipment volumes for and Revenue System Size (RSS) for revenue purposes.
COSMOSS is a key input into the Core Transmission Circuit costing System (CTCS) system as explained below.
The LLFN (London Local Fibre Network) platform via COSMOSS provides the revenue data for the products routed over LLFN
and other BT equipment.
The LLFN is an analogue private circuit overlay platform providing services to major customers, with an enhanced service wrap
within the 0207 and 0208 areas of London only.
The platform is now over 20 years old and primarily is based on PDH technology but is now making more use of SDH. There are
various bespoke systems that support the platform along with a raft of BAU systems for order/faults management.
Data sources
290
CSCS (Call Statistics Centralisation System)
CSCS is a dynamic and flexible 24x7 Management Information System which processes raw data in the form of priced call
records collected from BT billing systems. It derives additional data fields, summarises the data and feeds it into an Oracle
database. CSCS is used for reporting information about the calls made by customers using BT fixed lines (post & pre-payment)
and BT Mobility offerings.
The information relates to those calls that are paid for by the renter of the line and reports the number of calls, the summed call
durations and summed revenues of those calls (before bulk usage discounts have been applied). It is not primarily intended to
provide data on individual customers, but summarised data for specific groups of customers (eg Business, Residential, those
with common discount options, Geographic Area). These groupings are based either on the calling line identity (CLI) or on codes
supplied in the call record from upstream systems.
This provides an almost immediate view of call revenue & volumes, which enables accurate and timely income accounting to be
maintained and provides a ready analysis of volume activity. Where data supplies are less timely, the window for receipt of call
records is kept open longer (eg Mobility). The exception to this is when the first day of the month falls on a working day, in
which case the results for the final day of each calendar month must be available by WD1 of the following month (instead of the
normal WD2). This is to enable the full month out-turns for the previous month to be posted to the General Ledger (GL) on
WD1.
On average, CSCS processes around 50m call records per day, with summarised details of 18bn calls, worth around £1.5bn of
annual revenue to BT, stored in the database.
CSCS provides direct feeds to the following systems with Call Revenue and Volume data:
the GL (via iOTA) (Enterprise Code Extract, Earned Revenue Cube)
Powerhouse
ICIP/CCBA
CSS (Customer Service Systems)
CSS manages all aspects of Customer Service on the Public Switched Telephone Network (PSTN), from order capture and Job
Management, fault handling, work management and billing. CSS deals with engineering time through National Job Recording
(NJR) system. CSS also supports network management, call itemisation, Issue Handling and line testing. The CSS headquarters
system allows national changes (eg new Products) to be configured in a uniform, speedy and cost effective manner.
The diagram below provides a CSS Overview:

Data sources
291
CTCS (Core Transmission Circuit costing System)
01) CTCS Overview and Purpose
02) CTCS Inputs
PACS
INS
COSMOSS
03) CTCS Process
04) CTCS Outputs
05) Glossary
1. CTCS Overview and Purpose
BT’s Core Transmission network is primarily made up of Electronics (Plesiochronous Digital Hierarchy (PDH) and Synchronous
Digital Hierarchy (SDH)), Cable and Duct. Combinations of these assets (ie two units of electronics joined by fibre and duct)
make up what is known as a “bearer”. See diagram below.
CSS Overview – Simplified View
Order
Handling
Network
Systems
SM I/F
BillingContact
Handling
Repair
Handling
Job
Manager
CSS
Customer Data
What BT Sees
What The
Customer Sees
Customer
Account
Customer
Fault
Report
Customer
Queries
Appointment
Details
Customer
Order
Reminders
Contract
Call Data
Receipts
Receipting Centre
Switch Manager
Work Manager Works InstructionsLine Test
Network Data
Accounting
and
Statistical
Information
DirectoriesMIS
Marketing
Information
CSS Overview

Data sources
292
The bearers within the network carry numerous circuits which relate to several different products and bandwidths. CTCS is
used as the volume source to record all network entities (ie the individual assets), bearers and circuits so that costs can be
apportioned in an objective manner. This enables product managers to get a view of their costs and to find out exactly how
these have been driven according to volumes, bandwidth and utilisation of the network.
Duct and Cable
Duct connects BT’s Network sites with each other and with customers’ premises. Both Access and Core Transmission cables
run through this duct network with access cables primarily connecting the customer to the local exchange and Core cables
primarily interconnecting Network sites.
A cable infrastructure interconnects BT core transmission, access and switching/routing assets. The Integrated Network
Systems (INS) network management system differentiates Core Transmission from Access cables, and within those two
groups, the type of cable used – eg metal, fibre, e-side (from the exchange to the customer point) and d-side (from the
customer point to the network terminating equipment (eg phone socket).
PDH
The PDH was introduced in BT’s Core Transmission network during the 1970’s, as primary 2Mbit/s line systems began to
saturate the core network. PDH was developed as a way to multiplex 2Mbit/s traffic to higher order capacity through a set of
transmission hierarchies.
However, due to the limitations of the PDH technology several multiplexers are required at each point in which circuits are
required to move up the bandwidth scale. This results in multiplex mountains as illustrated below:
CTCS_Overview

Data sources
293
Access to an individual 2Mbit/s circuit is impossible without undergoing a long de-multiplexing process. For this reason PDH
is considered as an “end-to-end” technology: it does not support adding and dropping circuits at intermediary stages as
allowed in SDH line systems.
The PDH platform provided an initial ‘Bearer System’ functionality within the core network. A bearer system transports
circuits of various bit rates, between two geographic points.
A circuit is likely to require several bearers to cover the distance from origin to destination. Therefore a 2Mbit/s circuit
between London and Brighton may travel on an 8Mbit/s bearer between London and Croydon, then on a 140Mbit/s bearer
Croydon and Gatwick, and finally on an 8Mbit/s bearer between Gatwick and Brighton.
Five circuit rates can be carried over PDH line systems: DS-1 (2Mbit/s), DS-2 (8Mbit/s), DS-3 (34Mbit/s), DS-4 (140Mbit/s)
and DS-5 (565Mbit/s). Those rates are obtained by successive multiplexing as shown on above.
SDH - SDH technology was included to BT’s Core Transmission Platform in the late 1980’s as a way to provide reliable and
cost effective transmission services to the end-customer.
A circuit is likely to require several bearers to cover the distance from origin to destination. Therefore a 2Mbit/s circuit
between London and Brighton may travel on an STM-1 bearer at 155Mbit/s between London and Croydon, then on an STM-
16 bearer at 2.5Gbit/s between Croydon and Gatwick, and finally on an STM-1 bearer between Gatwick and Brighton.
SDH offers a number of benefits:
Minimum number of breakdowns:
- Rapid restoration of service
- Separation of circuits
- Rapid circuit configuration
Cost effectiveness:
- Fewer number of components,
- Interchange ability of components amongst suppliers.
Compatibility with previous PDH technology and with Other Communication Providers (OCPs) Transmission networks.
These reasons compelled BT to choose SDH as its main Core Transmission technology. It must however be noted that the PDH
architecture is still dominant for capacity provision to the Public Switched Telephone Network (PSTN) platform. The SDH
2-8
2-8
2-8
2-8
2-8
2-8
2-8
2-8
2-8
2-8
2-8
2-8
2-8
2-8
2-8
2-8
8-34
8-34
8-34
8-34
34-140LTE
2-8
2-8
2-8
2-8
2-8
2-8
2-8
2-8
2-8
2-8
2-8
2-8
2-8
2-8
2-8
2-8
2-8
2-8
2-8
2-8
2-8
2-8
2-8
2-8
2-8
2-8
2-8
2-8
2-8
2-8
2-8
2-8
8-34
8-34
8-34
8-34
34-140 LTE
CTCS_PDH

Data sources
294
Network is organised into a number of different tiers.
Tier 1 – Trunk Network connecting nodes covering Britain. Transmission Links are STM-16 (2.48Gbit/s) and STM-64
(10Gbit/s). Traffic is groomed by Digital Cross Connects (DXCs) for onward transmission and allows incoming signals to be
terminated on a node.
Tier 2 – Regional Network connecting in a ring a number of ADMs. Two configurations are available: Cell and Supercell.
Tier 3 – Smaller rings that may be necessary to interconnect the Access Network to the Tiers 2.
Tier 4 – SDH access. The ADM is located in customer premises.
Tier 0 refers to the international network infrastructure.
Since 1999, BT has been committed to roll out SDH technologies at higher bandwidths as an overlay to the basic network
shown above. These include the MSH and UBB networks.
The Marconi Synchronous Hierarchy (MSH) is a new type of SDH equipment being introduced into the network. The Marconi
Synchronous Hierarchy (MSH) network will be used to deliver the Multi-Service Platform (MSP) and other broadband services
while supporting processes will be kept as similar to existing SDH processes as possible.
Most circuits on the MSH network are at 155Mbit/s. The Ultra Broadband (UBB) could be described as the “next step” in
Transmission technology as this supports bit rates of 2.4 and 10Gbit/s.
User Guide
The following word document can be used as a user guide for anyone working on CTCS.
Purpose of CTCS
CTCS is an Oracle database that records all Transmission network elements, bearers and circuits, this information is used to
drive apportionments for Accounting Separation purposes.
The overall objective of the CTCS process is to provide data to enable apportionments of costs from Class Of Work (CoW) to
Plant Group, Plant Group to Component and Component to Products.
There are 3 key data sources that feed into CTCS:
PACS – contains equipment inventory and circuit routing for SDH transmission equipment
INS – contains equipment inventory and circuit routing for PDH transmission equipment. Also contains all route
lengths for both SDH and PDH
Tier 0
Tier 1
Tier 2
Cross-connect
Add-drop mux
Tier 4Tier 3
Supercell
CTCS_SDH

Data sources
295
COSMOSS – contains circuit billing data.
2. CTCS INPUTS
There are three main interfaces that feed into CTCS
Source
system Files Received Description Timing of Data
INS
(Inventory
Data for
PDH
Network)
CDTCTCS.MVS.HW2.I
NS.TEST.CABLE.CSV
Cable sections - It will include unique details
from Plant files of all 10 regions (relates to
PDH network)
Annual Data feed of 6 files
are sent by INS on 30th Sep
CDTCTCS.MVS.HW2.I
NS.TEST.EQUIPMENT.
CSV
Equipment - It will include all unique
equipment’s present in the EQUIPMENT_UNIT
table and bit rate for equipment’s present in
EQPT_APPEARANCE table. (relates to PDH
network)
CDTCTCS.MVS.HW2.I
NS.TEST.LOCATION.CS
V
Location - It will include all unique 1141 code
present in VSAM file, STATION & DISTRICT
tables. (relates to PDH network)
CDTCTCS.MVS.HW2.I
NS.TEST.CIRCUIT.CSV
Circuit - it will include all unique/distinct
network designations from NETWORK_ITEM
table. (relates to PDH network)
CDTCTCS.MVS.HW2.I
NS.TEST.BEARER.CSV
Bearer - It will include all unique/distinct
Bearer designations from
BLOCK_SECTION,NETWORK_ITEM (relates to
PDH network)
CDTCTCS.MVS.HW2.I Fact Route- It will include all unique

Data sources
296
NS.TEST.FACTRT.CSV entries in PHYSICAL_RTG_COMP table. (relates
to PDH network)
PACS
(Inventory
Data for
SDH
Network)
PACS_EQUIPMENT_CT
CS_v1_1_1.dat
It will include all unique equipment’s present
within PACS, covering SDH network
Annual Data feed of 4 files
are sent by INS on 30th Sep
PACS_BEARER_CTCS_
v1_2_1.dat
It will include all unique/distinct Bearer
designations present in PACS, covering SDH
network
PACS_CIRCUIT_CTCS_
v1_3_1.dat
Includes all unique/distinct circuits
designations present in PACS, covering SDH
network
PACS_FACT_ROUTE_C
TCS_v1_4_1.dat
Details of how the circuits are routed over the
bearers and equipment
COSMOSS
(Billing Data
for SDH and
PDH
Network)
CDTCTCS.MVS.COA.CU
STOMER.CSV
COSMOSS sends complete refresh for required
attributes at CTCS end of Organizational and
Individual customers once in a year.
Annual Data feed of 3 files
are sent by INS on 30th Sep
CDTCTCS.MVS.COA.CI
RCUIT.CSV
COSMOSS sends complete refresh for required
attributes at CTCS end of circuits which are
active and ceased ie in status CURR and CEAS
once in a year.
CDTCTCS.MVS.COA.PR
ODUCT.CSV
COSMOSS sends complete refresh of required
attributes at CTCS end of all Product details
once in a year.
3. CTCS PROCESS
The dataflow for CTCS is as follows:
The CTCS staging area is the database where all of the raw data is captured. The business rules and system logic are
held in this environment and access is restricted to admin/supervisor level only.
The DMART (DataMart) area contains all of the tables which the outputs are based on. The tables in DMART are the
COSMOSS – 3 files
PACS – 4 files

Data sources
297
formatted combinations of all the raw data tables held in the staging area. The rules on how the DMART tables are
created are held within a document called ‘Source to Target Mapping’ (created by E&Y).
The output reports are SQL scripts which draw from the DMART tables. They are run by the end user and then
exported out of the system to be used.
The diagram shows how the DMART tables are related to each other – ie the key fields that need to be linked in order to bring
back data from more than one table in the same report. This diagram should always be used when constructing adhoc
analysis.
NB. This diagram should be printed landscape on A3.
4. CTCS OUTPUT
The data from CTCS is used in a number of cost allocation and volume models. SQL scripts for the output reports can be found
on SharePoint.
Create a new folder on SharePoint for the CTCS raw outputs for each year and ensure all the files are saved down.
Instructions on how to run the models is found within the models themselves.
After completing a model the final outputs must be checked against REFINE to ensure the allocation percentages have input
into the system correctly.
4.1 Model 028. BTW COW to PG CTCS (SDH & PDH)

Data sources
298
PDH Model:
This model apportions Class of Work (CoW) to Plant Group for Plesiochronous Digital Hierarchy (PDH) CoWs. The model
calculates bases for all PDH circuits contained with the Core Transmission Costing System (CTCS).
Several bases produced by the model allocate the depreciation costs and asset values of CoWs to Plant Groups (PGs)
representing bearers in the core network. These assets relate to the older transmission network assets which have largely
been supplemented by the more modern and fault tolerant Synchronous Digital Hierarchy (SDH) assets.
Combinations of assets in the transmission network (ie two bits of electronics joined by fibre and duct) make up what is
known as a “bearer”. The bearers within the network carry circuits that relate to different products and bandwidths. The cost
of a bearer includes an apportionment of the costs of these electronic assets.
Relevant Model Map:
SDH Model:
The base produced by this model drives the Net Book Value (NBV = Gross Book Value – Accumulated Depreciation + Assets in
Course of Construction) and depreciation charge costs for classes of work (CoW) SDH and also the maintenance costs on CoW
IVS (Maintenance, Synchronous Digital Transmission Equipment).
SDH represents newer electronic assets in the Transmission network. They complement the transmission equipment capacity
provided by the Plesiochronous Digital Hierarchy (PDH) assets. IVS capture the corresponding maintenance costs incurred on
SDH equipment. Allocation is to Plant Group (PG), which represent bearers in the core network. SDH CoW is subdivided into a
number of asset policy codes, representing the different asset types within SDH. The driver and destination for these policy
codes does vary. SDH costs are mapped to bearer links, which can either be STM1, STM4, STM16 or STM64, represented by a
number of PGs.

Data sources
299
Relevant Model Map:
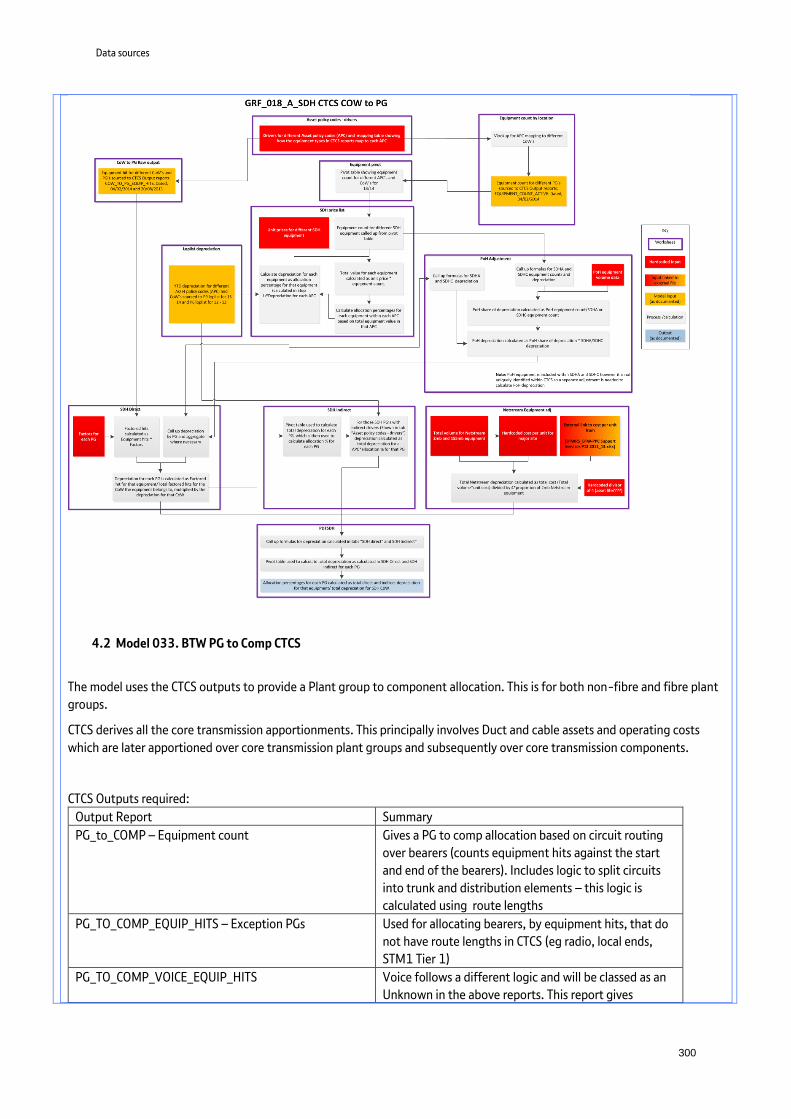
Data sources
300
4.2 Model 033. BTW PG to Comp CTCS
The model uses the CTCS outputs to provide a Plant group to component allocation. This is for both non-fibre and fibre plant
groups.
CTCS derives all the core transmission apportionments. This principally involves Duct and cable assets and operating costs
which are later apportioned over core transmission plant groups and subsequently over core transmission components.
CTCS Outputs required:
Output Report Summary
PG_to_COMP – Equipment count Gives a PG to comp allocation based on circuit routing
over bearers (counts equipment hits against the start
and end of the bearers). Includes logic to split circuits
into trunk and distribution elements – this logic is
calculated using route lengths
PG_TO_COMP_EQUIP_HITS – Exception PGs Used for allocating bearers, by equipment hits, that do
not have route lengths in CTCS (eg radio, local ends,
STM1 Tier 1)
PG_TO_COMP_VOICE_EQUIP_HITS Voice follows a different logic and will be classed as an
Unknown in the above reports. This report gives

Data sources
301
equipment hits based on voice logic (see notes below
for running this report)
PG_to_COMP_REGION_WECLA– Equipment count Effectively the same report as the main PG_to_Comp –
Equipment report but includes and extra field to denote
geographic region.
PG_to_COMP – Cable section Gives a PG to comp allocation based on circuit routing
over bearers (measures circuit usage length). Includes
logic to split circuits into trunk and distribution
elements – this logic is calculated using route lengths
PG_TO_COMP_VOICE_FIBRE/CABLE Voice follows a different logic and will be classed as an
Unknown in the above reports. This report gives usage
lengths based on voice logic (see notes below for
running this report)
CABLE_LENGTH_BY_PG Gives total cable section lengths for each bearer type
(PG)
Relevant Model Map:

Data sources
302
Hardcoded Input
Model input
(as documented)
Process /calculation
Output (as docum
ented)
Key
Worksheet
Worksheet
Input linked to external file
033_BTW_PG_to_Com
p_CTCS_14-15
This input takes the CTCS Output report ‘PG_to_COMP - Equipm
ent count - New'. It contains the PG Code, PG Description, Com
ponent Code and Com
ponent Description. The Circuit Bandwidth and Equipment Count for
each product is given. This is sourced from sheet 1 in ‘Z:\group1\FINANCE\
CORE_NW\2012-13 m
odels\NEW CTCS Output Testing\CTCS Output 2012\
Outputs - Version 15\PG_to_COMP_Equipm
ent_Hits_Feb21.xls’.
B5.Input - Verification
This is a reference tab which drives lookups on the raw data tabs. It is used to verify the Com
ponents and Plant Groups that are not relevant in this model. The source of the data and
mapping is constructed through known offline adjustm
ents/mapping (prior subm
ission), and verification of PG and Com
ponent Codes against ASPIRE.
This sheet takes the CTCS Output report '2a) PG_TO_COMP_EQUIP_HITS - Exception PGs - New'
and pastes the formatted raw data into colum
ns D to I. This contains the PG Code, PG Description, Com
ponent Code and Component Description. The Circuit Bandwidth and Equipm
ent Count for each product is given. This is sourced from
sheet 1 in Z:\group1\FINANCE\CORE_NW\2012-13
models\NEW
CTCS Output Testing\CTCS Output 2012\Outputs - Version 15\PG_to_COM
P_Equipment_Hits_Feb21.xls’.
A number of PGs that are 'exceptions' will not generate an output in the m
ain CTCS PG to Comp
output, as the logic of the report works on route lengths. For these PGs we must use equipm
ent hits to drive the allocations. These are PG311T, PG381T, PG391T, PG393T, NEW
01, NEW02 and
NEW03.
This sheet takes the CTCS Output report 'PG_TO_COMP_EQUIP_VOICE'. It
contains the PG Code, PG Description, Component Code and Com
ponent Description. The Circuit Bandwidth and Equipm
ent Count for each product is given. This is sourced to SharePoint, in the file 2c)
‘PG_TO_COMP - VOICE’ - it is the first report in the file. The link is ‘Z:\
group1\FINANCE\CORE_NW\2012-13 m
odels\NEW CTCS Output Testing\
CTCS Output 2012\Outputs - Version 10\PG_to_COM
P_Equipment_Hits_Feb21_VOICE.xls’.
The data in this report is the same as the m
ain PG to Comp output in B1 with an additional
region column. W
ECLA is the geographical region defined by postcode with which we can report on in CTCS. There is a separate version of the report that contains the region data. This report
strips out the equipment hits that should be attributed to CELA com
ponents from the m
ain output.
We take the CTCS Output report ‘PG_to_Com
p REGION (WECLA) - Equipm
ent count’. This contains the Geographical Region, PG Code, PG Description, Com
ponent Code and Component
Description. The Circuit Bandwidth and Equipment Count for each product is given. This is
sourced to ‘Z:\group1\FINANCE\CORE_NW\2012-13 m
odels\NEW CTCS Output Testing\CTCS
Output 2012\Outputs - Version 10\PG_to_COMP_Equipm
ent_Hits_Feb21_CELA.xls’.
B6.Input – OR Ethernet Volumes
B6.Input – OR Ethernet Volumes
This input tab contains Openreach P6 volumes. W
e are interested in total fibre km
volumes against the Ethernet m
ain link services. We use this figure in our
allocation of Openreach core fibre (PG170B) as Ethernet Main links are not
included in CTCS but need to pick up a share of fibre costs. The OR Ethernet Volum
es are sourced to Nick Burge in file ‘Z:\group1\FINANCE\CORE_NW\
2012-13 models\NEW
CTCS Output Testing\CTCS Output 2012\New Models\
PG to COMP\OR Revenue & Volum
es P06 v2.xlsx’.
The P6 data contains the Market, Description, Service Code, Service
Description, Sub Product Code, Sub Product Description, Volume, Units,
Annual Price and P6 Price for 11/12 and 12/13.
A SUMIF form
ula totals all the different ‘units’
including fibre to produce total volum
e figures.
The total volume of
fibre km is
hardcoded.
C1.Calculations – RAW Com
binedC1.Calculations – RAW
Combined
2. The raw data is converted into a pivot table showing the sum of Equipm
ent Count. This lists the re-mapped PG Code and PG
description, Component Code, Com
ponent Description and Circuit Bandwidth.
C2.Calculations - WECLA
C2.Calculations - WECLA
2. The re-mapped aggregation of the PG Codes is converted into a pivot table showing the sum
of Equipm
ent Count. The pivot table aggregates the source PGs into the groups formed by the
new PG coding.
C3.Calc – Combine + Factors
C3.Calc – Combine + Factors
1.PG Codes, PG Descriptions, Component Codes, Com
ponent Descriptions, Circuit Bandwidth and Equipment Counts for CTCS are
copied across from ‘B1.Inputs - Raw CTCS’, the sam
e information for Exceptions is copied from
‘B2.Inputs - Exception PGs’ and data for Voice is taken from
‘B3.Inputs - Raw Voice’. The source of input is listed in column A.
Some PG Codes need replacing with a different PG Code to be processed in REFINE. This re-m
apping is conducted through VLOOKUPS in colum
n I and J to input ‘B5’ (NEW01 - replace with PG341T, NEW
02 - replace with PG343T, NEW03 - replace with
PG345T).
1.Geographical Area Alternative, PG Codes, PG Descriptions, Component Codes, Com
ponent Descriptions, Circuit Bandwidth, Equipm
ent Counts, WECLA Com
ponent Code and WECLA
Component Descriptions for W
ECLA are copied across from ‘B4.Input - Raw W
ECLA’.
Some PG Codes need replacing with a different PG Code to be processed in REFINE. This re-
mapping is conducted through VLOOKUPS to input sheet ‘B5’ (NEW
01 - replace with PG341T, NEW
02 - replace with PG343T, NEW03 - replace with PG345T) to create a concatenation of the
PG Code, Component Code and Circuit Bandwidth.
2. The WECLA Equipm
ent Hits to remove are pulled from
‘C2’ through a VLOOKUP on the pivot table on the Concatenation produced in step 1.
3. The final Equipment Hits pull the Equipm
ent Count and subtract the hits to rem
ove from step 2, to produce an adjusted value accounting for a
double count.
5. A SUMIF form
ula locates the relevant PG Code, and apportions a % weighting of final Equipm
ent Hits from PG Code to Com
ponent Codes, based on the overall total for each PG.
Circuit Bandwidth
and Bandwidth
Factor are hardcoded.
6. A VLOOKUP matches the correct Bandwidth Factor from
the table pairing factors to each products Circuit Bandwidth.
7. Factored Hits is the % allocation of Equipment Count m
ultiplied by Bandwidth Factor.
8. Columns W
to Y contain a pivot table for the Sum of Factored Hits. This is
broken down by PG Code and PG Description.
9. A SUMIF form
ula uses the pivot table to locate the relevant PG Code, and apportions the % weighting of Factored Hits from
each PG to Components,
based on the overall total for each PG.
C6.312h additional changeC6.312h additional change
The new CTCS does not allocate any costs to CO460 (External Nominated ISI). Unlike the old CTCS, it only seem
s to identify the costs for the W
holesale ISIs (CO468). Therefore without further manual intervention, the External Nom
inated ISI will have no fibre (or duct) costs allocated to it as seen in the 312g run. In order to correct in the absence of CTCS capturing the volum
es we have taken the service volum
es for these services to split the CTCS cable distance for CO468 between CO468 and CO460 (W
holesale ISI and Nominated ISI).
The service volume for SO468 (m
ain component CO468 - W
holesale ISI) is 6,059 for 2013/14 and the volumes for SO460 (m
ain com
ponent CO460 - Nominated ISI) is 18,127 in 2013/14 - (sourced from
Andrew Maben - GRF). W
e will use the ratio between the service volum
es (6,059:18,127) to split the CO468 volume that CTCS calculates. The im
pact is isolated to the Interconnect m
arket, and the change will be reflected in the 312h run.
1b. The CO468 volume is 6,280, the
Total Factored Cable distance for CO468 is called up from
C5
C5.Fibre 312g uploadC5.Fibre 312g upload
A pivot table showing the Sum of Fibre Equivalent (Km
s) by Com
ponent Code, for Openreach and Wholesale linked to data
from C4
2. The Factored Cable Length is calculated for CO468 through m
ultiplying the CO468 volume by 0.25 (25% ratio split for
SO468).
3. The Factored Cable Length for CO460 is the initial CO468 Cable Length m
inus the CO468 value with a 0.25 ratio factor applied.
1a. The Value of Ethernet Main Links is pulled
from input sheet ‘B6’.
1b. The Sum of Fibre Equivalent (Km
s) for Transmission Network is
summ
ed from the pivot table for both Openreach and W
holesale.
2. The % apportionment of 312h (PG170B) and 312g (PG350N) to Com
ponents are calculated through dividing individual Openreach and W
holesale values by the Total Distance (Km
s).
Outputs – Allocations
Final output allocation % mapping of PG to Com
ponents for 2013-14 P9. A pivot table of this inform
ation is also created. Both Fibre and Non-Fibre Components
are included.
C4.Calculations - FibreC4.Calculations - Fibre
Manually paste data from
B7, and B8 including PG code, description, com
ponent code and description, bandwidth and cable usage length,
and LOB
List of Component Codes and Circuit
Bandwidth hardcoded.
1. Concatenation of PG Codes, Com
ponent Codes and Circuit Bandwidth copied from
input ‘C1’.
Equipment Count
hardcoded from C1.
4. The final Equipment Count is revised and sum
med.
VLOOKUPS are used to select the relevant PG and Component from
‘B5’ to be included in the m
odel. A manual lookup checks the data m
atches. If any #N/As are found, the lookup table requires m
anual updating to match correctly
(e.g. new components). Colum
n N lists the Equipment Hits to not be included
in the count. An IF formula indicates whether a PG or Com
ponent contains “Rem
ove” within its Code. If so, these hits are not carried forward from the
Equipment count. Once filtered, the data in colum
ns D to I is going to be pasted into the sheet called 'C1. Calculations - RAW
combined'.
B1.Inputs – Raw CTCS
B1.Inputs – Raw CTCS
B2.Inputs – Exception PGsB2.Inputs – Exception PGs
VLOOKUPS are used to select the relevant PG and Component from
‘B5’ to be included in the m
odel. A manual lookup checks the data m
atches. If any #N/As are found, the lookup table requires m
anual updating to match correctly (e.g. new
components). Colum
n N lists the Equipment Hits to not be included in the count. An
IF formula indicates whether a PG or Com
ponent contains “Remove” within its Code.
If so, these hits are not carried forward from the Equipm
ent count. Once filtered, the data in colum
ns D to I is going to be pasted into the sheet called 'C1. Calculations - RAW
combined'.
B3.Inputs – Raw Voice
B3.Inputs – Raw Voice
VLOOKUPS are used to select the relevant PG and Component from
‘B5’ to be included in the m
odel. A manual lookup checks the data
matches. If any #N/As are found, the lookup table requires m
anual updating to m
atch correctly (e.g. new components). Colum
n N lists the Equipm
ent Hits to not be included in the count. An IF formula
indicates whether a PG or Component contains “Rem
ove” within its Code. If so, these hits are not carried forward from
the Equipment
count. Once filtered, the data in columns D to I is going to be pasted
into the sheet called 'C1. Calculations - RAW com
bined'.
B4.Input – Raw W
ECLAB4.Input – Raw
WECLA
The VLOOKUP on WECLA Com
ponent Codes and Descriptions to sheet ‘B5’ brings up the com
ponent needed to allocate to in REFINE (rather than using the component generated by
CTCS). It also pulls in the PG Codes to select the relevant PG and Component to be included in
the model.
1a. The ratio split for SO468:SO460 volumes are
sourced to Andy Maben. 6,059 is derived based on the
ratio of the reported service volumes in 2012/13
(SO468 = 6,069, SO460 = 18,141). The 18,127 (SO460) service volum
e is derived from the bill (billed revenue
divided by the average price)
Calculate aggregate data on lengths by PG
Calculate factored cable usage length by looking up bandwidth from
fibre usage factor table
Hardcoded fibre usage factor by bandw
idthNo source
Calculate fibre equivalent kms by
multiplying Fibre km
by PG by the ratio of aggregate factored length usage to
aggregate length usage (by PG)
Calculate % of PG usage for each com
ponent by dividing factored cable
usage length by aggregate lengths by PG
Hardcoded component
link to length mapping
table
Calculate final com
ponent by replacing link com
ponents with length com
ponents
Calculate aggregate factored cable usage
lengths by PG
Data on cables by PG, Component,
bandwidth and LengthSourced to CTCS, PG_TO_COM
P Cable section New
VLOOKUPS are used to Call up an include flag and a LOB tag from
B10A concatenated include LOB tag is also
created
B10 Fibre LookupsThis tab contains lookups w
hich are used to tag the Plant Groups and Components that need to be
included in the calculations for Backhaul and Core FibreUnsourced
Data on cables by PG, Component,
bandwidth and LengthSourced to CTCS, PG_to_COM
P_VOICE-new
VLOOKUPS are used to Call up an include flag and a LOB tag from
B10A concatenated include LOB tag is also
created
B7 Inputs Raw fibre data
B7 Inputs Raw fibre data
B8 Inputs Raw fibre data - Voice
B8 Inputs Raw fibre data - Voice
Call up fibre km by PG
from B9
B9.Inputs – Total Fibre by PGB9.Inputs – Total Fibre by PG
Data on Cable section fibre usage by PG
Sourced to “TOTAL_PG_BY_FIBRE”

Data sources
303
4.3 Model 025. Access Rentals Model
CTCS Outputs required:
ACCESS_FIBRE_INPUT
BEARER_COUNT_ACTIVE
PG_TO_COMP_EQUIP_HITS_ACCESS_PGS_New
ISDN30_CIRCUIT_VOLS
ISDN30_ACCESS_RENTALS
ACCESS_DATA_FOR_FIBRE_BEARERS
This model is only interested in the Access Plant Groups (ie local ends) and calculates both COW to PG and PG to Comp
allocations.
COW to PG is for Class of work DTTM – below is a list of the relevant Model Maps and how the inputs are utilised:
Hardcoded Input
Model input (as documented)
Process /calculation
Output (as documented)
Key
WorksheetWorksheet
Input linked to external file
‘Ethernet’Volume of Ethernet LEs by component for CO450, CO447,
CT454, CW609.
‘Redcare’Volume of Redcare LAs by component
for CK985.
Single / dual fibre assumptions for Ethernet and Redcare components.
6b. Fibre volumes for Ethernet (CO450, CO447, CT454, CW609) and
Redcare (CK985) components calculated by multiplying LE/LA
volume by single/dual fibre assumptions.
‘Fibre’Number circuits per
bearer for different bearer types and circuit bit rates/
bandwidths.
1. SUMIFS formula used to summarise CTCS circuit
volumes using a combination of PCODE service, bandwidth
and bearer types.
2. Circuit volumes are translated to bearer equivalents. Calculated as the volume from Step 1 divided by the volume
of circuits per bearer for different circuit bit rates.
3. Volumes from Step 2 multiplied by spare capacity multiplication factor. NB. Some inconsistent formulae used
in table.
4. Volumes from Step 3 by PCODE service, component and bearer type expressed as a % of the total from Step 3 for
each bearer type.
5. SUMIF formulae sums the product of Step 4 by component for each bearer type and the result is multiplied by the number of fibres for each bearer type with the Access
fibre Spine multiple (for the allocation of PG111C and PG111M) or the Access fibre Distribution multiple (for the
allocation of PG959C) applied.
6a. Product of Step 5 aggregated into a final total volume of fibres for each component for CO439, CP439, CO434, CP434,
CO436, CP436, CO437, CO452, CL189 and CF781.
Summarised into full list of fibre volumes by component.
Fibre volumes for each component are expressed as a percentage of the sum of the volumes for all components to
give final allocation
‘CTCS Circuit’ Circuit counts by bandwidth, PCODE service and
Plant Group code.
‘Mapping’ hardcoded input table of bandwidths, PCODE
service description and components - used to add component mapping to Step 1.
Spare capacity multiplication factor: calculated as the volume of bearers qualifying for spare capacity divided by utilised bearers qualifying for spare capacity (based
on the total from Step 2). NB. The model contains some inconsistent formulae to calculate volumes for this
factor.
‘CTCS bearer’Equipment volumes by bearer platform and Plant
Group code.
‘Fibre pairs’Sheet contains data from two different sources. 1.
Volume of single and double fibre bearers. For 2MB, 8MB, 34MB, 140MB and 565MB bearers. Total fibre volume calculated as the volume of single fibre plus 2 x volume of double fibres for Spine multiple and 2
x volume of single fibre plus 2 x volume of double fibres for Distribution multiple.
2. Volumes for STM bearers and numbers of fibres taken from a different source and summarised in a
table using SUMIF formulae.
Spine / Distribution fibre multiples
calculated as the total volume of fibres
(using Spine / Distribution
methodology) by bearer type, divided by total volume of
bearers.

Data sources
304
‘OR Revenue DATA p12 13-14’
Volume, annual price and revenue by service and sub-product codes.
‘CTCS Circuit’
Circuit counts by bandwidth, PCODE service and Plant Group code. Contains a separate
table for ISDN30 data.
‘Fibre’
Total volumes of ISDN30 circuits calculated in Step 1 of the allocation of PG959C,
PG111C and PG111M.
SUMIF formula used to summarise volume of internal and external
ISDN30 rentals (SL124 and SL156).
Total volume of ISDN30 channels divided by the total volume of ISDN30 circuits produces the
ISDN30 ‘Fill Factor’.
Total volume of fibre ISDN30 circuits are divided by the total volume of ISDN30 circuits
and expressed as a percentage. One minus this percentage gives the proportion which
are copper.
‘Output for models’
The ‘Fill factor’ and the proportion of ISDN30 lines over copper are outputs to model: 015. OR - Routing
and Records - PDTRAR_PG140A (need to
be manually entered).
ISDN30 Fill Factor & %CuISDN30 Fill Factor & %Cu
Hardcoded Input
Model input (as documented)
Process /calculation
Output (as documented)
Key
WorksheetWorksheet
Input linked to external file
‘CTCS Circuit’
Circuit counts by bandwidth, PCODE service and Plant Group code.
1. Circuit volumes are summarised based on bandwidth and Plant Group codes contained in the table columns and row labels.
Kilostream circuits are separately identified by a SUMIFS formula. This sums data for each Plant Group Code if the bandwidth is "2", and if the PCODE service description field starts with "Sub 2M“ (logic hardcoded within formula). This summarises multiple variants of PCODE service.
The remaining 2Mbit services are calculated using a SUMIFS formula which sums data using the Plant Group Code, if the bandwidth, is "2" and then the Kilostream volumes are subtracted.
Volumes for other bandwidths are summarised using a SUMIFS formula which sums data using the Plant Group Code and the relevant bandwidth.
2. Circuit volumes are normalised to 2MB equivalents in order to identify the numbers of circuits on each bearer type that are used by Kilostream expressed in 2mbs.
3. Kilostream circuit volumes for each Plant Group from Step 2 are pulled into a new table and expressed as a percentage of the total normalised volume for each Plant Group calculated in Step 2.
4. The percentage of Kilostream circuits for each Plant Group derived in Step 3 is multiplied by the total bearer and LLFN costs for each plant group in Step A to give the total costs for Kilostream by Plant Group.
5. Total costs for Kilostream by Plant Group are summed to give the driver volume for final allocation in revenue terms for 64Kbit Local ends PG412C.
6. Total bearer and LLFN costs for PG442C and PG443C from Step A are summed and total Kilostream costs for these Plant Groups from Step 4 are subtracted to give total 2MB costs.
7. Total 2 MB costs from Step 6 are split between copper PG442C and fibre PG443C local ends, using relative YTD depreciation from the fixed asset register, for use in final apportionment.
‘FA TSO‘BT TSO FIXED ASSETS LISTING - PERIOD 12. YTD depreciation by
CoW and Asset Policy code.
'DTTM LL‘Contains hard coded table of Asset Policy codes. SUMIF formula looks up asset policy codes and brings in YTD depreciation data. Data from ‘Policy mapping’ sheet identifies Asset Policy codes
as copper or fibre. Totals for copper and fibre are summed and expressed as a percentage of the two.
‘Policy mapping‘Table of Asset Policy codes which include field as to whether the policy relates to
copper or fibre.
'DTTM to PG‘Table of factors
by bandwidth to apply
normalisation.
'DTTM to PG‘Hard coded LLFN unit costs based on 10/11 model. Unit cost used for
PG445C is the same as used for PG443C and PG444C but is multiplied by a factor of 4 in the formula.
‘Policy mapping’Mapping table of LLFN size to
bearer size.
‘LLFN’LLFN volumes by bearer size /
Plant Group derived using COUNTIF formula and LLFN size in
input sheet.
'DTTM & ASDH COSTS‘Bearer unit costs for DTTM 2MB,
34MB and 140MB and ASDH 4x2MB and 16*2MB. Cells
manually linked with hardcoded assumption to multiply unit cost
for PG44C by a factor of 2.
‘CTCS bearer’CTCS output detailing circuit counts by bearer platform
and Plant Group Code.
STEP A. For each of bearers and LLFN, volumes for each Plant Group are summarised in a table using a SUMIF formula, using the Plant Group Code to summarise volumes from the respective input sheets.
These volumes are applied to the relevant unit price summarised in a separate table to give the total combined costs of bearers and LLFN by Plant Group.
8. The driver volumes for non-2MB Plant Groups – PG444C 34MB, PG445C 140MB, PG446C 622MB, PG440C ASDH 4x2MB and PG441C ASDH 16x2MB are calculated by taking total costs by Plant Group from Step A and subtracting the Kilostream costs for the relevant Plant Group calculated in Step 4.
Total costs from Steps 5, 7 and 8 are summarised and summed to give total driver volumes. The final apportionment is calculated as the costs for each Plant Group in
each of these steps divided by the total driver cost.
Hardcoded Input
Model input (as documented)
Process /calculation
Output (as documented)
Key
WorksheetWorksheet
Input linked to external file

Data sources
305
‘ctcs circuits 2’
Equipment count by Plant Group code, component and
bandwidth.
‘Calcs 1’
Volumes for each component expressed as a % of total equipment count for PG441C.
SUMIF formula used to look up component codes and summarise equipment counts for components fed by
PG441C. These components are CF383, CL189, CO379, CO439, CO432, CR383, CO682, CO434, CF385, CF781,
CO683, CO658 and CF381
‘Calcs 1’
SUMIF formula uses hardcoded list of component codes in ‘Calcs’ 1 sheet to summarise inputs from a
specific table in the input sheet corresponding to the Plant Group inputs.
Hardcoded Input
Model input (as documented)
Process /calculation
Output (as documented)
Key
WorksheetWorksheet
Input linked to external file
5. CTCS - Glossary
ADM - Add-Drop Multiplexers. Key item of Synchronous Digital Hierarchy (SDH) electronics which allows the circuits of
varying bandwidth to be multiplied up to utilise more efficient high bandwidth bearers.
COSMOSS - Customer Oriented System for the Management of Special Services (Private Circuits).
CTCS - Core Transmission Circuit costing System.
INS - Integrated Network Systems – Computer System for BT's Plesiochronous Digital Hierarchy (PDH) Network, containing
cable and Plesiochronous Digital Hierarchy (PDH) equipment records.
MSH - Marconi Synchronous Hierarchy. High bandwidth Transmission Network.
NDS - Network Decision Support. Tool used to extract data from INS.
OCP - Other Communications Provider (eg Vodafone).
PACS - Planning Assignment and Configuration System.
PDH -Plesiochronous Digital Hierarchy – PDH was the initial structure for organising the hierarchy or possible bit rates in
synchronous time-division multiplexing. Now superseded by Synchronous Digital Hierarchy (SDH).
SDH - Synchronous Digital Hierarchy.
STM - Synchronous Transport Module. Measurement of Transmission bit rate – Where n = 1, 4, 16, 64, ie 155, 622Mbit/s,
2.5, 10Gbit/s.
UBB - Ultra Broadband Network. Network was completed in 2003/04 to carry 2.5Gbit/s and 10Gbit/s circuits.
‘Calcs 1’
Volumes for each component expressed as % of
total equipment count for various Plant groups

Data sources
306
EXPRES (Exchange Planning and Review System)
EXPRES is a system used for capacity planning in BT’s Local Exchange Network. It provides an inventory of 'capacity in service'
available in the Voice Network also known as the Public Switched Telephone Network (PSTN). The system uses this information
to forecast future capacity requirements.
It also links to an equipment-ordering programme for our suppliers.
EXPRES is extensively used to provide regular switch network data for reports and briefings together with data for key reports
to Ofcom and other Communication Providers (CPs). Additionally it is used throughout the business, particularly within planning
offices, to provide management statistics and data on the works programme and asset utilisation. It is the definitive source for
Network Nodal Identifier (NNI) codes.
EXPRES contains details of the hierarchy of the Voice Network. eg which Local exchanges are linked to which Tandem
exchanges
If BT decides to re-parent a Local Exchange, other CPs must be told to enable their traffic to be re-routed.
FAR (Fixed Assets Register)
The Fixed Asset Register is the internal list of all of BT’s fixed assets. The FAR team have the job of maintaining and registering
BT's assets on its Fixed Asset Register.
Together with the Central Information Database (CID) Work In Progress report, the FAR feeds into the LoP List (Life of Plant
List)
LOP List details the Capital Fixed Assets for BT TSO & Openreach on a monthly basis, and is made available to users on a request
only basis. It shows details of registered assets down to Policy Code level; Work in Progress, Backlog Registrations and
Accounting Adjustments at CoW level. The totals should reconcile with the Fixed Assets figures in the published Balance Sheet.
Geneva – Avalon (Avalon Residential)
Avalon is the name of the Geneva/IRB BT Retail instance being used to bill for a multitude of products.
The Infinys Rating and Billing (IRB) Billing platform uses an "off the shelf" billing system supplied by Convergys based in
Cambridge, UK. The system has been built on the core Geneva platform with a number of Pre & Post processors and interfacing
systems. Products billed span a wide range of services, across both corporate and retail customers.
Geneva – Genius (Local Loop Unbundling)
The GenIUS (Geneva Integrated Universal Solution) Programme has a number of applications that delivers a streamlined
wholesale billing capability through a single, integrated billing platform. This enables BT Wholesale to reduce the time between
provision of service and the issue of a bill, realising cost benefits and supporting the expansion of our product, solution and
service portfolio
GVF (Group Volumes Forecast)
A forecast of product volumes, covering at least a 3 year period including the current financial year. The GVF is owned by Group
Finance with input from the Portfolio and Market Unit teams. GVF's are used in many ways, but principally for internal trading,
operational and capital planning purposes and within in-life reporting and reviewing actual volumes against these forecasts
monthly. GVF forecast volumes are delivered twice a year as part of the integrated BRF (Bi-Annual Rolling Forecast) planning
process.
HORIZON (BT Property HORIZON (Telereal))
This database holds detailed records for BT’s properties (eg tenure, ownership and floor areas).
This system contains data on the BT Estate (both office and operational). It holds data such as the Net Internal Area (this is the

Data sources
307
floor space that is billable) and Gross Internal Area (floor space that isn’t billable). It records, at Organisation Unit Code (OUC)
level, who actually occupies the floor space so that a particular OUC can be billed for usage.
The occupancy details on the database contain the footprints of the equipment. This helps to establish the occupancy split
between the specialised, the general purpose or both for each property on the system.
HORIZON is managed and owned by Telereal Trillium who is BT’s outsourced agents for estate management.
INS (Integrated Network Systems)
INS is the family name for the architecture encompassing a group of mainframe subsystems supporting Plesiochronous Digital
Hierarchy (PDH) core network planning and utilisation processes. These processes manage the assignment of BT's core and
wideband network and transmission equipment areas.
It is one of the major Operation Support Systems (OSS) within BT for (PDH) plus the analogue network and holds all data for
Cables (Fibre and Copper - non Customer Service System (CSS)), Radio, Bearers, Switch, Equipment and Private Services and is
one of the largest online data systems in Europe.
It underpins network technologies and topologies such as Ultra Broadband (UBB), Wavelength Division Multiplexing (WDM),
Synchronous Digital Hierarchy (SDH), Internet Protocol (IP), PDH, Kilostream and high bit rate services. It also records the inter
exchange network for Public Switched Telephone Network (PSTN) and Featurenet. It fully supports the three main business
processes of Provision, Build and Repair.
INS is essentially a data warehouse and is a representation of physical bearers and equipment for logical solutions. It provides
end to end routing design and solutions across network platforms for public, private and network services, 20CN and 21CN. It
also provides a level of resilience checking.
LLUMS (Local Loop Unbundling Management System)
The Local Loop Unbundling Management system provides delivery and in-life management of LLU Points of Presence, MDF
Connections and TAM. It also includes customised reporting functionality and disaster management information.
LRIC (Long Run Incremental Cost)
The LRIC model generates the long run incremental cost and stand-alone costs as required by Ofcom. The LRIC approach is a
method of cost analysis based on an economic concept which separates costs of a specific “increment” of business activity from
the overall costs of the business with the advantage of enabling the business to identify the separable costs of providing certain
services.
NEI (Network Equipment Inventory)
NEI is a Find & Assign, service & equipment inventory tool for the MSIP ATM and SDH Data Control Networks, enabling the MSIP
and DCN planning teams to assign new services and connections against planned as well as existing equipment and ports.
NISM NT (Network Inventory And Spares Management System - New Technologies)
NISM NT is used to plan Broadband Equipment.
It is used to manage Core Network Spares & Repair activities for specified technologies. Designed to track Network Equipment,
for example slide in units, at 6,300 sites
NuNCAS (Network Capacity Assignment System
NuNCAS provides the capacity calculations to determine if access capacity exists in the network to support Asymmetric Digital
Subscriber Line (ADSL) Broadband connectivity. NUNCAS supports the following functions:
1 - Service Profile Definition - including connections within the ADSL network, connections within the core network,
association of core connection groupings with the relevant Multiplexer (MUX).
2 - View ADSL model - using object attributes.

Data sources
308
3 - Audit ADSL Network.
4 - Capacity Thresholding.
5 - List incomplete Service Provisions.
6 - Report Planning Failure Exceptions.
7 - Support for automated core VP build.
8 - Configure Service on request from SSD.
ORBIT (Openreach Business Information Toolset)
To comply with the Telecoms Strategic Review (TSR), Openreach has developed a new data warehouse to capture and store
management information and this warehouse is called ORBIT.
The ORBIT data warehouse is the Key stone in the Openreach Management Information System (MIS) strategy. It performs the
task of the central data store and information repository, holding both granular and aggregated data together with measures
and business metrics.
PACS (NCL PACS - Network Control Layer Planning Assignment and Configuration System)
The system supports the planning of the SDH network. It provides support for orders for circuits to be entered manually or via
an interface to SSD. These orders for circuits can then be routed, either manually or automatically across the network.
NCL PACS is a key component in E2E Services like 20C Broadband L2C and T2R, 20C Private Ccts L2C and T2R, Wholesale
Broadband Connect Infrastructure network. NCL PACS is used to place, route, assign and configure 20C Private Circuits, 21C
Infrastructure circuits like WDM, SVLANs, HE/MSIL PACS has two prime functions in terms of providing information on
equipment and bearers in the networks:
20C Transmission (SDH/WDM) - Network Control Layer
21C Converged Core - Network Control Layer
Peacemaker
This Suite of programmes [incl. LARPT] giving radio planners sophisticated tools to aid the design of radio links. Can produce
terrain maps & radio path profiles. It will also identify if a path is workable & free from frequency interference.
PIPeR (Physical Inventory Planning E-Records)
PIPeR supports the Planning & Recording communities within the Openreach organisation. It holds all Openreach external
inventory, and supports planning of all new fibre and copper plant items.
It enables the Planning teams to plan and issue the work out to the build agents and enables the Recording teams to accurately
and efficiently record changes to the network electronically
PIRM (Power Inventory of Routine Manager)
PIRM is designed to “manage” network power equipment. The PIRM system is divided up into a number of Geographical Areas
which are further divided into Patches.
Power equipment can be identified and categorised by use. PIRM identifies if equipment is used specifically by a certain switch,
eg System X or is used for general power purposes but excluding legacy plant. . An equipment Type within the PIRM system
defines a particular model of equipment (eg an IDS (2)48V). Against the Equipment Type are built its characteristics eg
measured load, output voltage rectifier inhibit.
PIRM’s use relating to the RFS is primarily for the allocation of power related costs.

Data sources
309
Powerhouse
Powerhouse is BT’s product volumes Data Warehouse. It has been designed as a solution for provision, from a single source, of
timely and accurate information regarding the installed base of BT products – primarily for BT Retail. . It is a front-end query
tool that interrogates raw data from other systems such as Call Statistics Centralisation System (CSCS), Private Circuits New
Billing System (PCNBS) and Central Database System (CDS). Data stored in the warehouse enables web based reporting &
analysis on Income, revenue and related product volumes (eg calls, lines, inbound services, data network services).
REFINE (Regulatory Finance Information Environment)
REFINE supports the regulatory reporting requirements of the business, providing Accounting Separation (AS) results and
analysis that form the basis of the financial statements formally submitted to Ofcom.
Group Regulatory Finance (GRF) [Users of Refine] is responsible for the production and publication of the Regulatory Financial
Statements (RFS), which are reconciled to BT’s statutory financial statements. The RFS are produced based on regulatory
remedies imposed by Ofcom on those products in which BT is designated as having Significant Market Power (SMP). These
remedies consist of cost orientation requirements, alongside a requirement to provide separated accounts. The cost
information from the RFS is also used to inform price controls, in Ofcom’s strategic market analysis and to inform the resolution
of disputes. The RFS reports are generated via Refine.
This solution takes financial feeds from around the business, merges, transforms, then presents via OBIEE/Smartview.
RIDE (Recorded Information Distribution Equipment)
RIDE is a mass call termination platform playing pre-recorded announcements and capturing voice messages and data. The
platform provides a wide range of services largely focused on the calls market.
STORM (Story Management)
STORM supports Demand E2E - through requirements capture, the release cycle and cost recovery activities. It’s based on an
out of the box tool called Jira, developed by Atlassian.
It is used for the purpose of allocating software depreciation costs.
STORM (Story Management Openreach)
STORM Openreach captures volumes and details of all jobs in CSS STORM queues.
It is used for the purpose of allocating software depreciation costs
TITAN (The Inter-business Transfer Charging and Agreement Network)
TITAN is the BT business-wide system for processing Inter-business charges. It is an Oracle Financials package that has been
customised to meet the requirements of the business. It allows for a consistent and controlled approach throughout the
business in order to eliminate discrepancies and misbalances and to enable a business-wide net settlement of debts and balance
agreement. It is BT Group Finance policy that all Inter-business bills are processed via TITAN (in detail or in summary) and as
such it is mandatory for all BT Core units, self-accounting units and subsidiaries. It is designed so that transactions between
them will always be in equilibrium.
Internal billing data is used as a driver to allocate costs (such as power and property) across various Activity and Plant Groups.
Work Activity Unit Calculator
Work Manager is the primary scheduling, allocation and dispatch system within Openreach to manage work. The system uses
automated scheduling techniques to identify appropriate engineers to undertake work on the basis of skill, location and
customer required by times. The system manages work for all the key regulated and non-regulated products. Work Manager
also manages task closures from data recorded by the field engineers for receipt by Work Manager and upstream systems and
subsequently Communication Providers.

Glossary
310
18. Glossary
Term Description Notes
AC Air Conditioning Plant cooling equipment
ACG Accounting Control Group BT Group which meets monthly to
approve all accounting changes
ACR Accounting Change Request
Form which initiates an accounting or
reporting change including requests for
new GL8 codes
ADM Add and Drop Multiplexor Network device that brings different
links together
ADSL Asymmetric Digital Subscriber Line Broadband Line
AIM Analysis & Inventory BT Data Source
AISBO
Alternative Interface Symmetric broadband
origination
Next generation connection interface
such as Ethernet.
Amsoft a.k.a. ASC BT National Stores system
AS Accounting Separation Separation of cost to products and
services and internal businesses.
ASC Automated Supply Chain
(originally American Software Corporation)
Supply chain system. Used for stores
purchasing, order management, stock
control and stock accounting.
ASDH Access Synchronous Digital Hierarchy
Network devices that push high
bandwidth services closer to the edge
of the network
ASPIRE Accounting Separation, Product Integration Reporting
Environment
Bespoke Oracle system used to produce
BT's regulatory results
ASSURE Accounting Separation SecUre Repository
Environment
BT developed Oracle application used
to load, validate & transform ASPIRE
tables prior to system runs
ATM Asynchronous Transfer Mode Legacy TDM to transport voice and
data.
AVR Automatic Voice Response
Telephony platform that asks an end
user for a response to questions. Eg
press 1 to speak to an operator, press 2
to leave a message

Glossary
311
Term Description Notes
AXE-10 Ericsson TDM Voice switch Legacy TDM switch
BEA Broadband Edge Aggregator Network node where other broadband
communication providers connect to.
BES Backhaul Extension Service A carrier service link that connects from
the MSAN to the BRAS platform.
BIFR Business Insight Financial Reporting also known as Hyperion, Perform &
HFM
BBIP Broadband IP
Generic term for referring to IP
infrastructure and service for
broadband services.
BRAS Broadband Remote Access Server
Network node where broadband traffic
from end users terminate and connects
to the Internet.
BT1P General Ledger Platform Platform which hosts all LoBs ledgers
Also covers the e-journals application.
C7 (SS7) Comité Consultatif International Téléphonique et
Télégraphique (Signalling System No 7)
Global voice signalling standard for
voice communications
CAM Cost Allocation Model
Used to describe the LoB costing
models which assign & apportion costs
to Products & Services
CAMERA Campaign Management Evaluation and Reporting
Used in Core BT units to allocate
marketing budgets to marketing
campaigns and manage and monitor
the spend vs budget.
C-CAT Customer to Channel Allocation Tool
This is used to record the Customer
Hierarchies for larger customer, it is
used to manage the hierarchies
between related customers, allocating
accounts to sales and service people. It
is used to feed SACRS to correctly
record revenues against Accounts,
Customers and Sectors.
CE Customer Edge Customer side equipment
CCRN Command and Control Router Network Private network to manage internal
network nodes.
CCTV Closed Circuit Television Private Visual TV monitoring service

Glossary
312
Term Description Notes
CDR Central Data Repository
Database which provides common
information to Hyperion Reporting &
Planning cubes
CDR Call Data Record File produced when a telephone calls
starts and ends.
CDS Central Data Source BT Data Source
CID Central Information Database see E-Reports
Clarity Clarity
A system which collects, verifies,
reconciles, authorises, collates and
disseminates non-engineering and all
non-UK time allocation and overtime /
allowance data
CMA Change of Management Assignment Use by eOrg to transfer FTE to new
reporting manager
CMSAN Copper Multi Service Access Node
Broadband device where end user
phone lines connect into the BT
Network
CoA Chart of Accounts Used to record and report against all
financial transactions
Colo Colocation Location
Data Centre or telecoms facility where
other communication providers all co-
locate
COSMOSS Customer Oriented System of Management of Special
Services BT Data Source
CoRD Common Reference Data
This is used to store reference data for
Core BT units and then to feed the
financial reporting systems as required.
CoS Change of Structure A process used to create OUCs on eOrg
- controlled via the RDM team.
COS Cost of Sales
A common abbreviation used for direct
costs - used in the calculation of 'Gross
Margin'.
COW Class of Work
Activities (eg Maintenance &
Construction) which identify the plant
type or the product group/service
being worked on. Usually identified as
part of job/project set up

Glossary
313
Term Description Notes
CP Communication Provider Term to describe another telecoms
service provider
CPE Customer Premises Equipment Network device still on the customer
site.
CPL Carrier Price List Price list for carrier services
CPS Carrier Pre-Select Service where customer determine
which carrier to route calls over
CRM Customer relationship management Generic term for managing customer
interfaces.
CSCS Call Statistics Centralisation System
System used to produce call volume &
revenue information from exchange
call records
CSS Customer Service Systems System used to update rental volume
information to support customer billing
CTCS Core Transmission Costing System BT Data Source
CWSS Copper Wideband Servicing Section BT Data Source
DACS Digital Access Cross Connect Device for connecting lines together
DC Data Centre Purpose built facility to house large
scale computing infrastructure.
DLE Digital Local Exchange
Legacy TDM switch that is a small
device that connects to local lines that
connect to the home.
DMSU Digital Main Switching Unit
Legacy TDM switch, that is a large
device connecting to local smaller
exchanges
DP Distribution Point
Point where the BT network connects
to wider end points that terminate at
end user homes.
DQ Directory Enquiries Helpline for finding phone numbers
DSL Digital Subscriber Line Broadband line
DSLAM Digital Subscriber Line Access Multiplexor Broadband device than sends the
broadband IP down the telephony line
DLE Digital Local Exchange Small exchange that is digital

Glossary
314
Term Description Notes
DLT Digital Line Termination
Position where digital phone lines are
connected and terminated on the
network.
DNS Domain Naming Service
Method to convert numeric internet
addresses into useable .co.uk, .org or
.com etc names
EAD Ethernet Access Direct Ethernet Access Services
EBD Ethernet Backhaul Direct Backhaul service that connect access
nodes to the core network.
EBITDA Earnings Before Interest, Taxes, Depreciation and
Amortisation
A widely used measure of
"controllable" profit roughly equating
to operating profit excluding
depreciation
EFM Ethernet First Mile Ethernet services from customer site to
the network.
EIN Employee Identification Number
Unique 9 digit multipurpose number
assigned to each employee. Used to
control access to reporting
applications.
eJV E-journals
The on line input & & authorisation
system for journal vouchers which are
to be posted to the general ledger.
eOrganisation eOrganisation
People & asset management system.
Holds details of OUC and assets
assigned to people at EIN level.
Commonly referred to as eOrg.
EM Element Manager BT Data Source
e-Reports e-Reports
Ageing but dependable management
reporting system previously known as
CID. In the process of being phased out.
essbase Essbase Hyperion Cube System used for
management reporting & planning
ETG Engineering & Technical Grade A band of employee
EU End User A consumer
EUT End User Technology Term to describe voice and data user
services in BT

Glossary
315
Term Description Notes
EOI Equivalence of Inputs
All communication providers are
treated as if they were the same as a BT
internal company
EPPCs Ethernet Partial Private Circuits
Links that are Ethernet based to link
sites together to create a closed private
network
ETL Extract, Transform & Load
Generic process of data extraction,
conversion & upload. In the Hyperion
context the term is used specifically for
the processes of extraction of raw ODC
data, loading to a staging table,
applying further processing and finally
uploading to the CDR.
ETG Engineering & Technical Grade
This is a non-management grade within
the business. It is often used with time
recording systems to allocate hours to
projects.
EVOTAM Evolution Test Access Matrix Advanced Test Equipment to test the
copper lines.
FAC Fully Allocated Cost 100% apportionment on cost
FER Front End Router Routers that provide an IP connection
from one carrier to another.
FMSAN Fibre Multi Service Access Node
Access electronics device that is fibre
ready to connect to the end user and
also fibre back to the exchange.
FSE Force Structure Element
More commonly known as Force Types
- For pay purposes people are classified
into the following categories, known as
Force Types
FTAM Frame Test Access Matrix Test Equipment that sits of the frame in
the exchange
FTE Full Time Employee Member of staff.
FTP File Transfer Protocol Method of moving files between
computers
FTTC Fibre to the cabinet Optical fibre from the BT exchange to
the cabinet
FTTP Fibre to the premises Optical fibre from the BT exchange to

Glossary
316
Term Description Notes
the home.
FTTx Fibre to the (cabinet or home) Optical fibre from the BT network to
either the cabinet or home
GAMMA Gamma
Unified management reporting systems
(including Hyperion cubes) for BT
Global Services
GCS Group Consolidation System
The Hyperion HFM consolidation
system which replaced Planmaster.
Also known as GCS HFM and previously
known as Thin Layer.
GNCM Global Network Costing Model BT Data Source
GEA Generic Ethernet Access Ethernet access using the access fibre
from a street cabinet
GFP Global Finance Platform
The common Global Services platform
which hosts the integrated Oracle
financial applications for countries and
entities that have been migrated.
Progressively all Global Services entities
are being migrated to this single
platform.
GL General Ledger BT Data Source
GL8 code 8-digit General Ledger code Codes used in the Chart of Accounts for
"core" BT units
GLOSSI Global Support for Invoicing BT Data Source
GPRS General Packet Radio Service Mobile data service
GSM Group Special Mobile International Standard for 2nd
Generation mobile digital services
GS HFM Global Services Hyperion Financial Management Hyperion application used by Global
Services for management reporting.
HDF Hybrid Distribution Frame
Added frame in an exchange to connect
consumer lines to the main telecoms
network.
HFM Hyperion Financial Management
Hyperion application used for group
consolidation (see GCS) and GS
reporting (see GS HFM)
IC Interconnect Circuits Links that connect one carrier to

Glossary
317
Term Description Notes
another carrier (another term for point
of handover)
IIE Inter & Intra Eliminations
Module used to manage deals between
BT trading entities to ensure that they
are agreed by both parties
IN Intelligent Network
Computer Platform that translates
non-geographic numbers to
geographic destinations.
iNET Information Network Internal Management Network.
INS Integrated Network Systems BT Data Source
IP Internet Protocol
Packet network that moves
information (Voice & Data) using the
TCP/IP protocol
IP Intelligent Peripheral Network system for giving routing
information for telephone calls.
IPL Internal Project Ledger Project’s private ledger of accounts
IPLC International Private Leased Circuit Line that connects 2 sites on a
dedicated connection
ISDN Integrated Services Digital Network Legacy Digital TDM line
ISP Internet Service Provider Communication provider that enables
end users connect to the internet.
ITC Inter-Tandem Conveyance
Transmission services that links carriers
together who do have a direct link
between them
ITT Inter-Tandem Transit
Transmission services that links carriers
together who do have a direct link
between them
ITU International Telecommunications Union
Executive agency of the United Nations
that sets international
telecommunications standards.
IXBS NG Interconnect Bureau Service New Generation BT Data Source
JRE Java Runtime Environment
"Foundation" module component used
to interface with Hyperion eg as a data
input interface for eliminations,
overlays & deals.

Glossary
318
Term Description Notes
JRMIS
Job Recording Management Information System
From JRMIS, a variety of reports are
available covering many statistical
aspects of the data entered via NJR.
KMH Kilo Man Hours 1000 hours of manpower time
LAN Local Area Network Office network
LC Line Card
Piece of network equipment that
connects into a slot on an network
element
LCC Local Cost Centre A management entity to which only
'COSTS' are allocated.
LDX System X local exchange TDM Legacy Voice Switch
LDY System Y local exchange TDM Legacy Voice Switch
LE Local Exchange The first exchange that a phone line
connects to.
LLCS Local Line Costing Study BT Data Source
LLFN London Local Fibre Network Dedicated optical network for business
customers in London
LLU Local Loop Unbundling Ability to offer other carriers to access
the BT local line.
LRIC Long Run Incremental Cost BT Data Source
LoB Line of Business Internal Subsidiary Company
LoP List Life of Plant List BT Data Source
MDF Main Distribution Frame
Static device in the BT exchange where
all phone lines connect to the BT
network.
MISBO Multiple Interface Symmetric Broadband Origination Term to define services over 1Gb/s
MNS Managed Network Services
Where one carrier manages other
carriers network and services to the
end user
MPLS Multi Protocol Label Switching
IP Network capable of carrying voice
and data. Sometimes known as a
converged network.

Glossary
319
Term Description Notes
MPF Metallic Path Facility Copper line that can offer voice and
broadband
MSAN Multiservice Access Node
Next Generation Access device that
sends broadband down the telephone
line.
MSPE Multi Service Provider Edge
Network device that resides in the
customer environment that can handle
voice and data.
MMM Metadata Maintenance Module Hyperion module which is used to
maintain reporting hierarchies.
MSIP Multi Service Intranet Platform BT Data Source
NAS Network Access Server Computer platform authenticates users
onto the network
NBV Net Book Value
Calculation: [NBV = Gross Book Value
minus the accumulated depreciation
plus assets in course of build.]
NEMOS-DR Network Modelling System Data Recovery BT Data Source
NIMS Network Instruction Management System Used to plan & monitor network
engineering & equipment jobs
NETA Non Engineering Time Apportionment
Employees (predominantly the non-
engineering workforce) - must be
designated Force Type 3 users on eOrg.
NGA Next Generation Access Replacement to copper connectivity to
the home.
NGS Next Generation Switch Legacy TDM switch to work alongside
the System X and System Y devices.
NIP Network Intelligent Platform Computer platform that translates
phone numbers
NISM Network Inventory Spares Management BT Data Source
NJR National Job Recorders
All people who record time using NJR -
must be designated as a Force Type 1
user on eOrg.
NOC Network Operations Centre Purpose built secure facility to monitor
and manage a telecoms network.

Glossary
320
Term Description Notes
NRS Network Records System BT Data Source
NTE Network Termination Equipment The B end of a connection
NTT National Translation Table
This sits at the front end of the TP
(Translation Process) and translates all
'feeder' transactions coming into the
BT Ledgers.
OA Operator Services Telephony helpline information and
services
OAM Overlays & Adjustments Hyperion module which manages the
input of overlays & adjustments
OBI Oracle Business Intelligence Oracle application used for transaction
reporting
OBIEE Oracle Business Intelligence Enterprise Edition The version of OBI implemented in BT
to replace Microstrategy
OC Optical Carrier Generic term to refer to fibre optics
carrying voice or data.
OCP Other Communications Provider Another carrier to BT
ODC Oracle Data Centre
Data warehouse which holds general
ledger information and transaction
detail from feeder systems
ODF Optical Distribution Frame Optical equivalent to a copper frame in
an exchange building.
OLAP Online analytical processing generic term
OM Office Machines BT own use machines
OMC Operations Maintenance Centre BT Data Source
Operational
Buildings
Operational buildings are those that house our
network equipment, also known as Exchange Buildings Generic term
OR Openreach BT Access Company
OSS Operational Support Systems Computer systems that manage the
end to end network
OUC Organisation Unit Code
A management entity to which a
number of employees are mapped. Also
referred to as Cost Centre.

Glossary
321
Term Description Notes
OVP Over Voltage Protection
Fuses that protect the copper network
from a power surge from the access
network.
PACS Planning Assignment and Configuration System BT Data Source
PaBX Private Automatic Branch Exchange Telephony Customer Premises
Equipment that business use.
PBX Private Branch Exchange Telephony Customer Premises
Equipment that business use.
PC Private Circuits Business lines sold to connect sites
together.
PCP Primary Connection Point A green cabinet where copper lines
connect to the BT network.
PDH Plesiochronos Digital Hierarchy Legacy transmission equipment
PE Provider Edge
Router that sits on the edge of the
carrier network that links to the
customer router
PECN Public Electronic Communications Network National telecoms network
P&L Profit & Loss Gain and Loss expenses
POCP Payments to Other Communications Providers Financial payments made to other
phone companies.
PFC Project Financial Control
Oracle application used to monitor
projects & programmes which feeds
into the General Ledger & ODC
PI Purchase Intelligence OBI based reporting system for the
iBuy procurement application.
POH Point of Handover Where one carrier interconnects with
another carrier.
POI Point of Interconnect Handover point where one carrier
connects to another carrier.
POP Point of Presence A site where the network offers
connectivity to end users.
Powerhouse Powerhouse
Oracle application used to hold audited
product volume data for system size,
new supply, takeovers & cessations
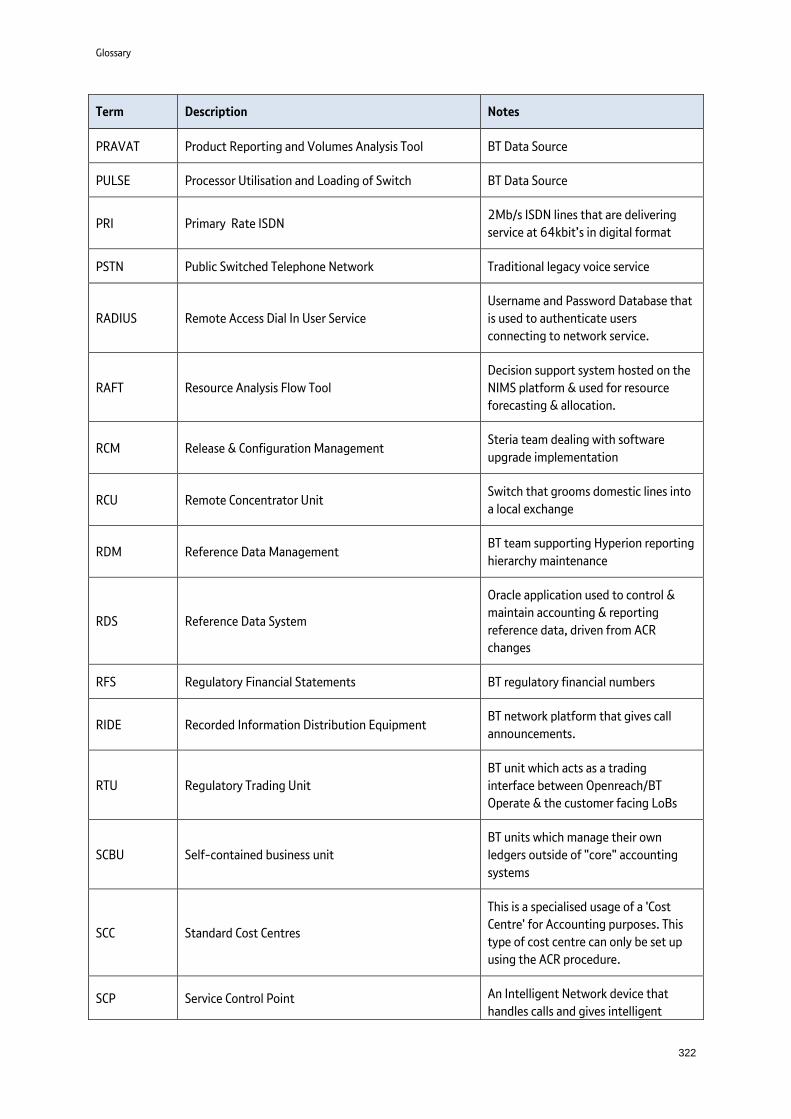
Glossary
322
Term Description Notes
PRAVAT Product Reporting and Volumes Analysis Tool BT Data Source
PULSE Processor Utilisation and Loading of Switch BT Data Source
PRI Primary Rate ISDN 2Mb/s ISDN lines that are delivering
service at 64kbit’s in digital format
PSTN Public Switched Telephone Network Traditional legacy voice service
RADIUS Remote Access Dial In User Service
Username and Password Database that
is used to authenticate users
connecting to network service.
RAFT Resource Analysis Flow Tool
Decision support system hosted on the
NIMS platform & used for resource
forecasting & allocation.
RCM Release & Configuration Management Steria team dealing with software
upgrade implementation
RCU Remote Concentrator Unit Switch that grooms domestic lines into
a local exchange
RDM Reference Data Management BT team supporting Hyperion reporting
hierarchy maintenance
RDS Reference Data System
Oracle application used to control &
maintain accounting & reporting
reference data, driven from ACR
changes
RFS Regulatory Financial Statements BT regulatory financial numbers
RIDE Recorded Information Distribution Equipment BT network platform that gives call
announcements.
RTU Regulatory Trading Unit
BT unit which acts as a trading
interface between Openreach/BT
Operate & the customer facing LoBs
SCBU Self-contained business unit
BT units which manage their own
ledgers outside of "core" accounting
systems
SCC Standard Cost Centres
This is a specialised usage of a 'Cost
Centre' for Accounting purposes. This
type of cost centre can only be set up
using the ACR procedure.
SCP Service Control Point An Intelligent Network device that
handles calls and gives intelligent

Glossary
323
Term Description Notes
routing information
SFR Standard Financial Report How General Ledger Codes are fed to
create a general report.
SFI Special Fault Investigation
Openreach work to identify a complex
network fault, requiring dedicated
technical specialists
SIP Session Initiation Protocol Voice of IP method of voice
communication on an IP network.
SDH Synchronos Digital Hierarchy Legacy optical transmission equipment
sometimes known as SONET
SHDS Short Haul Data Service Optical transport technology using dark
fibre
SDSL Symmetric Digital Subscriber Line
Broadband that offers the same speed
in both directions. (upstream and
downstream)
SG&A Sales General & Admin
A classification of costs commonly
referred to as overheads ie excluding
direct costs
SLR Standard Labour Rate
a common labour costing method with
common components (eg base pay,
pension, NI…), set by grade and
country
SLRC Standard Labour Rate Costing System to cost labour hours
SMDS Switched Megabit Data Service Legacy data service for large
bandwidth users.
SME Small & Medium Enterprises Smaller external companies that are
sold BT products and services
SMP Significant Market Presence A business with influence in the
market.
SMPF Shared Metallic Path Facility.
Copper line that can offer voice from
one communication provider and
broadband from a different
communication provider
SONET Synchronos Optical Network Legacy optical transmission equipment
sometimes known as SDH
SPPL Service Provider Price List BT’s price list for services and products
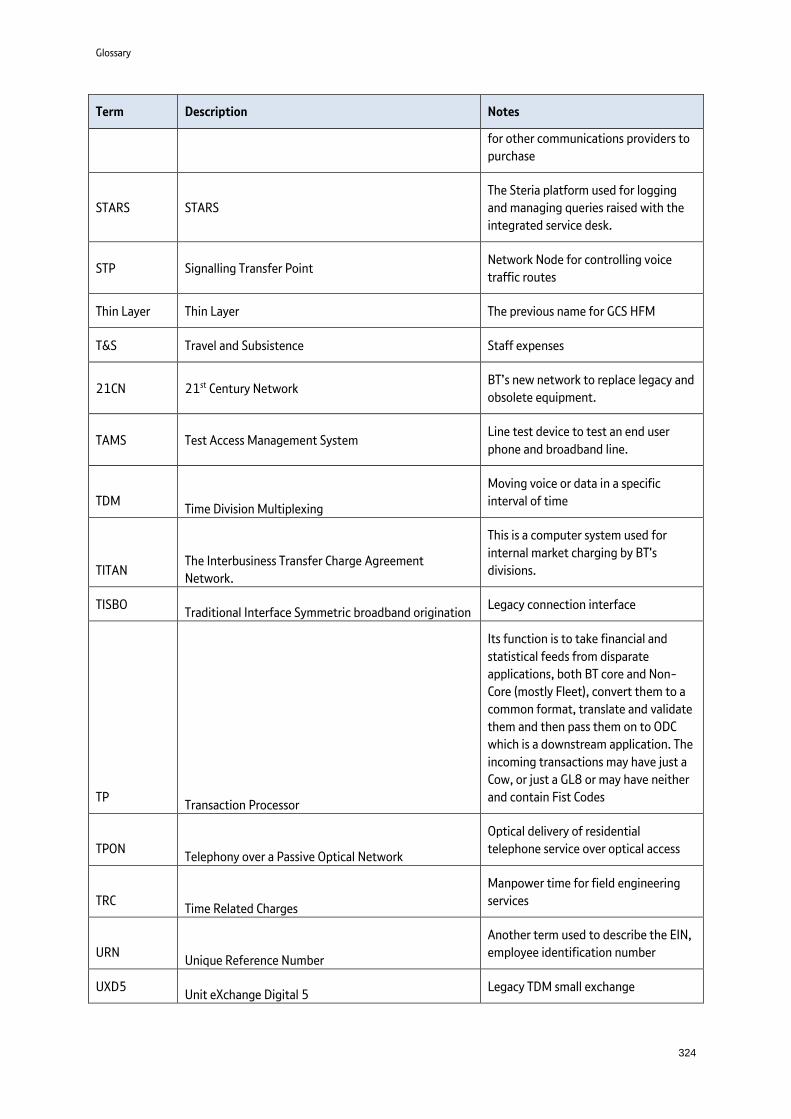
Glossary
324
Term Description Notes
for other communications providers to
purchase
STARS STARS
The Steria platform used for logging
and managing queries raised with the
integrated service desk.
STP Signalling Transfer Point Network Node for controlling voice
traffic routes
Thin Layer Thin Layer The previous name for GCS HFM
T&S Travel and Subsistence Staff expenses
21CN 21st Century Network BT’s new network to replace legacy and
obsolete equipment.
TAMS Test Access Management System Line test device to test an end user
phone and broadband line.
TDM Time Division Multiplexing
Moving voice or data in a specific
interval of time
TITAN The Interbusiness Transfer Charge Agreement
Network.
This is a computer system used for
internal market charging by BT's
divisions.
TISBO Traditional Interface Symmetric broadband origination
Legacy connection interface
TP Transaction Processor
Its function is to take financial and
statistical feeds from disparate
applications, both BT core and Non-
Core (mostly Fleet), convert them to a
common format, translate and validate
them and then pass them on to ODC
which is a downstream application. The
incoming transactions may have just a
Cow, or just a GL8 or may have neither
and contain Fist Codes
TPON Telephony over a Passive Optical Network
Optical delivery of residential
telephone service over optical access
TRC Time Related Charges
Manpower time for field engineering
services
URN Unique Reference Number
Another term used to describe the EIN,
employee identification number
UXD5 Unit eXchange Digital 5
Legacy TDM small exchange

Glossary
325
Term Description Notes
VAT Valued Added Tax
Government Tax on sales
VDM Vendor Data Master
There is 1 Vendor Data Master for the
UK which is a consolidation of a
number of historic vendor mastering
systems.
VDSL Very High Bit Rate Digital Subscriber Line
High Speed Broadband such as NGA
VIP Voice Intelligent Peripheral
Intelligent network device that routes
calls based on specific rules
VoIP Voice over IP
IP method to transport voice traffic.
VPN Virtual Private Network
Closed network
WAN Wide Area Network
Network that connects remote sites.
WBA Wholesale Broadband Access
Broadband access service sold to
carriers from BT Wholesale.
WBC Wholesale Broadband Connect
Broadband service sold to carriers from
BT Wholesale.
WECLA West East Central London Areas
High density of telecom services and
carriers of choice.
WES Wholesale Extension Service
A carrier service that offers
connectivity from an access node to a
network node.
WDM Wave Division Multiplexing
Moving information using optical
connectivity to use varying
wavelengths
WLR Wholesale Line Rental
Opportunity for other carriers to sell BT
network products and services.
YTD Year to Date
For the past 12 months up until now.

Annexes
326
Annex 1. Sectors
A.1.1 Sectors introduction
This section provides a description of key REFINE sectors involved in the cost allocation process. A sector:
Consists of two alphanumeric characters
Group of similar or like F8 Codes used by Regulatory for reporting purposes
A sector can be defined as the:
Types of service provided by BT (revenues)
Main functional activities performed by BT (Operating Costs)
Main fixed assets underpinning BT activities; or
Other assets, liabilities and provisions incurred by BT in support of its services and activities
As described in Section 2 Business Overview sectors are used as a way or grouping one or many F8 codes into
similar functional categories to make regulatory reporting more manageable. A list of all sectors identified in the
RFS is included below.
A.1.2 Operating Cost Sectors
This section describes the operating cost sectors relating to activities that we provide to our customers.
Provision/Maintenance
Provision/Maintenance consists of the following REFINE sectors. The most material cost relates to D-side copper
which is apportioned on the basis of the number of lines.
REFINE
sector Description Includes:
B1 Provision and Installation
Installation activities such as the physical installation of network
equipment, cable and/or customer premises equipment to provide
network connectivity and other services to customers.
Provision activities such as work to activate and enable the service to a
customer. This may involve software configuration to activate or de-
activate particular services, using the underlying physical equipment
and network provided through installation activities.
B2 Maintenance
Costs to operate our network in good working condition to meet
service requirements such as performing activities to test, maintain
and repair the network eg scheduled or planned maintenance of
particular network assets or ad hoc maintenance problems reported by
BT staff or customers.
Network Support
Network Support consists of the REFINE sectors below. The key drivers for the apportionment of network support
costs include pay, the relative floor space occupied by fixed assets and the current cost replacement value of
assets.

Annexes
327
REFINE
sector Description Includes:
BK Plant Support
The costs of activities undertaken to support the running of our
Network. Eg Government levied business rates payable on BT Network
installations and specialised estates such as telephone exchanges,
radio stations; Coaching pay costs booked by Customer Service Coach
(CSC) staff; Transmission Repair and Control pay costs on all core
transmission equipment and private circuits; Pay costs for the
provision, re-arrangement or cessation of network services; Pay costs
relating to plant protection and inspection associated with statutory
notices; eg inspection of low voltage overhead power crossing
clearance; and miscellaneous support work costs eg the cost of
installation (and subsequent recovery) of emergency plant
incorporated in the network at the time of failure of other plant.
General Support
General Support consists of the REFINE sectors below. The key drivers for the apportionment of General Support
include pay costs and activity surveys.
REFINE
sector Description Includes:
B0 General Support
Staff costs for BT people in the UK transition centre or completing
project work. Other costs related to computing, security, mobile and
general network maintenance. Also includes cost for payments relating
to service level guarantee scheme, wayleaves payments in respect of
network plant and the Ofcom administration fee.
B4 Planning and Development
Costs relating to the planning of the network and the development of
new technologies and service offerings eg pay costs for operational
planning and planning agency staff and research and development
contracts.
B6 Supplies
Costs associated with the procurement of materials and services (to
support business operations) and the issuing of supplies from stores eg
outsourcing of finance and accounting work, logistics and
procurement pay costs, freight and carriage costs of items held in
stores, tools and small items.
B7 Transport Costs associated with vehicles eg costs of acquiring, maintaining,
leasing, managing and retiring our fleet of vehicles.
BA Computing
Mainly BT TSO costs re-charged to the rest of BT Group for their use of
services such as computer operations, research and development and
user support to our employees eg installing, setting up computers and
helpdesk support.
BB Customer Service
Costs associated with customer service activities to maintain customer
satisfaction eg call centre management and customer service field
operations such as faults and maintenance tests.
BE Personnel and Costs associated with the provision of personnel services eg

Annexes
328
Administration recruitment, release of staff/redundancies, development and
implementation of performance management processes and other
human resources (HR) support activities.
BV Customer Support
Costs associated with performing diagnostic tests in support of
maintenance and repair work and operation of the work manager
system to schedule and control repair and maintenance work
undertaken by BT engineers.
General Management
General Management consists of the REFINE sectors below. The key drivers are activity surveys and pay costs.
REFINE
sector Description Includes:
BF General Management and
Other
Costs associated with general management activities and other general
expenses eg New Start leaver payments, General management pay
costs for board members for business units, senior managers and
support staff working on general management activities; General
management and other incidentals such as costs for conference
facilities; General legal charges, Group insurance charges, Corporate
provisions, and operating costs incurred by our non-core businesses (ie
subsidiaries, self-accounting units, etc.).
B5 Operator Services
Costs associated with operator assistance (OA) services, emergency
calls and directory enquiry (DQ) services.
Finance and Billing
Finance and Billing consists of the REFINE sectors below. The key drivers for the apportionment of Finance and
Billing include activity surveys and pay costs.
REFINE
sector Description Includes:
B9 Finance and Billing
Costs incurred from various activities of a financial nature, such as
budget building and management reporting, and costs incurred to
generate a bill for the customer and to collect payment. Accounting
and general finance activities include financial and management
accounting, budgeting, forecasting and payroll processing. Billing
activities include customer service, billing and credit control; bad debt
costs and post office handling costs.
Accommodation
Accommodation sector consists of the following REFINE sectors. Accommodation costs are mainly apportioned
based on the use of floor space and utilities.
REFINE
sector Description
Includes:
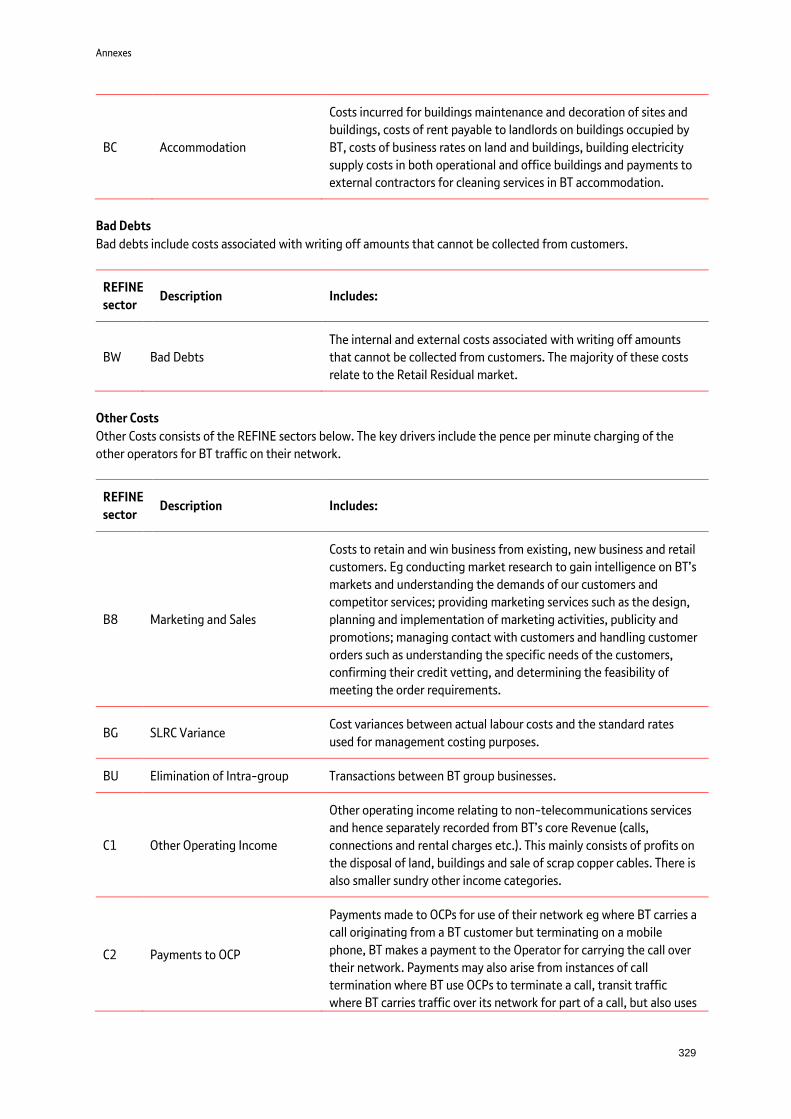
Annexes
329
BC Accommodation
Costs incurred for buildings maintenance and decoration of sites and
buildings, costs of rent payable to landlords on buildings occupied by
BT, costs of business rates on land and buildings, building electricity
supply costs in both operational and office buildings and payments to
external contractors for cleaning services in BT accommodation.
Bad Debts
Bad debts include costs associated with writing off amounts that cannot be collected from customers.
REFINE
sector Description Includes:
BW Bad Debts
The internal and external costs associated with writing off amounts
that cannot be collected from customers. The majority of these costs
relate to the Retail Residual market.
Other Costs
Other Costs consists of the REFINE sectors below. The key drivers include the pence per minute charging of the
other operators for BT traffic on their network.
REFINE
sector Description Includes:
B8 Marketing and Sales
Costs to retain and win business from existing, new business and retail
customers. Eg conducting market research to gain intelligence on BT’s
markets and understanding the demands of our customers and
competitor services; providing marketing services such as the design,
planning and implementation of marketing activities, publicity and
promotions; managing contact with customers and handling customer
orders such as understanding the specific needs of the customers,
confirming their credit vetting, and determining the feasibility of
meeting the order requirements.
BG SLRC Variance Cost variances between actual labour costs and the standard rates
used for management costing purposes.
BU Elimination of Intra-group Transactions between BT group businesses.
C1 Other Operating Income
Other operating income relating to non-telecommunications services
and hence separately recorded from BT’s core Revenue (calls,
connections and rental charges etc.). This mainly consists of profits on
the disposal of land, buildings and sale of scrap copper cables. There is
also smaller sundry other income categories.
C2 Payments to OCP
Payments made to OCPs for use of their network eg where BT carries a
call originating from a BT customer but terminating on a mobile
phone, BT makes a payment to the Operator for carrying the call over
their network. Payments may also arise from instances of call
termination where BT use OCPs to terminate a call, transit traffic
where BT carries traffic over its network for part of a call, but also uses

Annexes
330
REFINE
sector Description Includes:
another operator’s network. Payments are also made for Premium
Rate Services (PRS) where BT customers make calls to the premium
rate service telephone numbers of other operators and calls to BT
Freephone numbers.
C3 Payments to OA Same as sector C2, but for International CPs.
C7 Internal Product Charge from
Core
Transfer charges for Products used internally within BT. For internal
management purposes, BT runs a 'transfer-charging' process. GL codes
for the transfer charges are set up as matched pairs, one for the charge
out and one for the charge in. These GL codes are associated with F8
codes. Therefore there will be matching pairs of F8 codes, one for the
charge out (F8 codes beginning with ‘24’) and one for the charge in
(F8 codes beginning with ‘28’).
EC Other Intangible Asset Identifiable intangible assets such as goodwill and indefinite life assets.
F0 Specific item interest The net amount of interest payable and receivable by BT on its bank
balance which relates to specific items eg pensions.
F1 Employee Profit Sharing The cost of provisions made for payments under the employee profit
sharing scheme.
F2 Net Short Term Interest The net amount of short term interest payable and receivable by BT on
its bank balances.
F3 Associated Companies
The share of profit or loss before tax of associated undertaking and the
profit and loss account charges for the amortisation of goodwill arising
from the acquisition of subsidiary undertakings.
T3 Divisional Supply Service Out Internal trading for BT Basic / Social telephony, billing services,
directories billing, retail billing to Redcare. (Costs transfer out)
U3 Divisional Sup Service In Internal trading for BT Basic / Social telephony, billing services,
directories billing, retail billing to Redcare. (Costs transfer in)
F4 Corporation Tax The current year corporation tax charge for BT and subsidiaries, as well
as prior year adjustments.
F5 Deferred Tax The current year deferred tax charge and prior year adjustments.
Depreciation
Depreciation is analysed between land and buildings, access, switch and transmission and other (including network
power, computers and software). This is described in the individual asset sectors below.
The key drivers are engineering models and direct mapping of BT classes of work to network components and then
onto the appropriate service, based on usage factors and actual service volumes.

Annexes
331
A.1.3 Balance Sheet Sectors
Land & Buildings
This sector contains the asset values that are booked to BT Classes of Work for land and buildings, including
freehold, long leases and short leases. The sector includes corporate office and network buildings owned by BT.
Asset values are mainly apportioned based on the use of floor space and utilities.
REFINE
sector Description Includes:
DF Accommodation Plant Net
The asset values and depreciation for Network Plant Accommodation
necessary for the operation of network equipment eg ventilation and
cooling plant. Specific assets held within this sector (by CoW) include:
ACPM - Accommodation Plant, Equipment-Related - Motor
Transport
ACPS - Accommodation Plant, Security for the provision and
installation of security equipment.
ACPR - Accommodation Communication Plant Rooms.
ACPA - Accommodation Plant Access Services Division such as the
cost of construction provision, installation and recovery of ASD (ie
Openreach) network equipment-related plant (also known as
accommodation plant).
ACPN - Accommodation Plant, Equipment Related - Network
Operational Buildings.
ACPC - Accommodation Plant - Computer Centres.
DP Land
The asset values for land analysed between historic cost values and the
CCA adjustments applied to provide a current cost valuation of the
assets.
The main classes of work against which land values are recorded are
land freehold, land long lease and land short lease.
DQ Buildings
The asset values and depreciation for buildings fixed assets.
Buildings relate to the freehold, long leasehold and short leasehold
buildings that we own such as corporate office building, our shops and
service centres, and network buildings (eg exchange buildings) that we
own.
DR Accommodation Plant
Costs and depreciation costs for accommodation plant.
Accommodation plant is held in our freehold, long leasehold and short
leasehold buildings, and contains asset items such as furniture and
sundry other items used in the buildings eg AFH- Accommodation
Plant in our Freehold buildings, ALL - Accommodation Plant in our
Long lease buildings and ASL - Accommodation Plant in our Short
lease, buildings.

Annexes
332
Access - Copper
This sector contains the asset values for access copper (all the copper cables in the access network and all other
necessary equipment required to carry signals between the user and the exchange). It includes 'Main' Copper and
'Distribution' Copper, as illustrated in the diagram below. The key driver is the direct mapping of Classes of Work
(CoW) to network components and then onto the appropriate service based on usage factors and actual service
volumes.
The sector consists of:
REFINE
sector Description Includes:
D2 Access: Copper
LDC – Construction, Local Distribution Cable for the provision or
recovery of Access Copper Distribution and Branch Cables
applicable to the copper build programme. This covers all work to
increase the capacity of the network. Excludes duct.
LDCR - Renewal, Local Line Copper Distribution Cable for the
replacement of Access network metallic distribution and branch
cables.
LMC - Construction, Local/Main Exchange-side Cable relating to
the provision or recovery of Access copper main cables to increase
the capacity of the network.
LMCR – Renewal, Local Line Copper Main Cable for the
replacement of Access network metallic main cables and ancillary
plant as a result of a fault.
ADSL – costs of contract, store and labour for the Construction of
Digital Subscriber-line.
NWB/NWR - Provision and Installation of business and residential
Exchange lines.
Local
ExchangePrimary Connection
Point “PCP”Main Copper
CU
ST
OM
ER
PR
EM
ISE
S
Distribution
Copper
SectorD2AccessCopper

Annexes
333
Access – Fibre
This sector contains the asset values and depreciation for access fibre and radio. The key driver is the mapping of
CoW to network components and then onto the appropriate service based on usage factors and actual service
volumes.
REFINE
sector
Description Includes:
D1 Access: Fibre and Radio
The asset values and depreciation for Access Fibre (optical fibre cables
in the access network) and Access Radio (cellular, microwave and
satellite radio systems used to connect the user and the exchange).
This includes costs relating to:
LFDC and LFSC - Construction of Local Line Optical Fibre Spine
and Distribution Cable such as the provision, re-arrangement and
recovery of optical fibre cable, blown fibre tubing, blown fibre
bundle, and sub duct in the access fibre network.
LFXE - Construction of Local Line of Exchange Service Module.
LFME - Construction of Local Network Service Module Equipment.
TPWA - Construction of Access Radio Systems.
Access – Duct
This sector contains the asset and depreciation values for duct. Duct is a pipe, tube or conduit through which
underground copper or fibre cables are passed. Duct in the network is split into 'main'/'Exchange Side' (Class of
Work LMD) and 'Distribution' (Class of Work LDD), Main Underground Duct (Class of Work MUD) and Core Junction
Duct (Class of Work CJD). The fibre Network is split into similar sections; the Exchange side is known as ‘Spine
Fibre’ and the Distribution side is known as Distribution Fibre and the main is Core Fibre. The key driver is a duct
occupancy model that allocates CoW to network cable components and then onto the appropriate service based
on usage factors and actual service volumes.
REFINE
sector Description Includes:
D3 &
DB
Access: Duct
Core Transmission: Duct
Asset values and depreciation for Access Duct. Specific assets include
the costs of provision or recovery of:
• LDD - Construction of Local Distribution Duct for Copper Cable.
• LMD - Construction, Local main (Exchange-side) Duct for Copper.
• LDR - Renewal, Local line Duct for Copper Cable (either Main or
Distribution) to replace or partially replace duct for Access copper
cables.
• LFD - Construction, Local Duct for Optical Fibre Cable in the Access
Fibre Network.
• LFD - Construction, Local Duct for Optical Fibre Cable in the Access
Fibre Network.
• MUD/MUDR - Construction/Renewal of Backhaul/Inner Core Duct.
This asset class covers the provision and recovery/renewal of

Annexes
334
Backhaul/Inner Core Duct. Construction covers all Core Network duct
work.
• CJD/CJDR - Construction/Renewal of Backhaul/Inner Core Duct. This
asset class covers the provision and recovery/renewal of Core network
duct.
Switch
This sector contains the asset values and depreciation for switching equipment located in BT exchanges and
provides the switching function of telephone networks. The key drivers are engineering models that allocate CoW
to network component and then onto the appropriate service based on usage factors and actual service volumes.
REFINE
sector Description Includes:
D4 Local Exchanges: Digital
The asset values and depreciation for:
Digital Local Exchanges LDX/LYX - Construction, Local Digital
Exchange. This asset class covers all equipment and associated
costs incurred as part of basic exchange provision, extension, or
re-arrangement. CoW LDX for Digital Local Exchanges
manufactured by System X, LYX for Digital Local Exchanges
manufactured by Ericsson.
Main Distribution Frames LMDF - Construction, MDF for
exchanges. This asset class covers the provision, extension,
upgrade, replacement, re-arrangement and recovery of MDFs
connected with Inland (BTUK) telephone exchanges. MDFs are
those distribution frames providing direct interface with external
circuits terminations (customer or other exchanges).
DMC - Construction Operator Service System - Provision and
recovery of operating access, Automatic Voice Response (AVR),
Directory Assistance System and Operator Keyboard Display
Terminal equipment controlled by Operator Services.
D8 Main Exchanges
The asset values and depreciation for the provision, rearrangement,
recovery and upgrade of:
MDX - Main Network Switching Digital which are digital
exchanges providing the certain functions to digital traffic eg
setting up and clearing down calls, switching traffic and signalling
to other exchanges and subscribers.
NGS - Next Generation Switch which is a new form of switch.
There are two types: one using traditional circuit switching
technology the other a hybrid using ATM packet switching
technology.
DC Intelligent Networks
The asset values and depreciation for the Intelligent Networks
Platform that allows functionality to be distributed flexibly at a variety
of nodes on and off the network and allows the architecture to be
modified to control the services. The 'Intelligent Network' provides
network functionality beyond basic switching. Specific assets include:
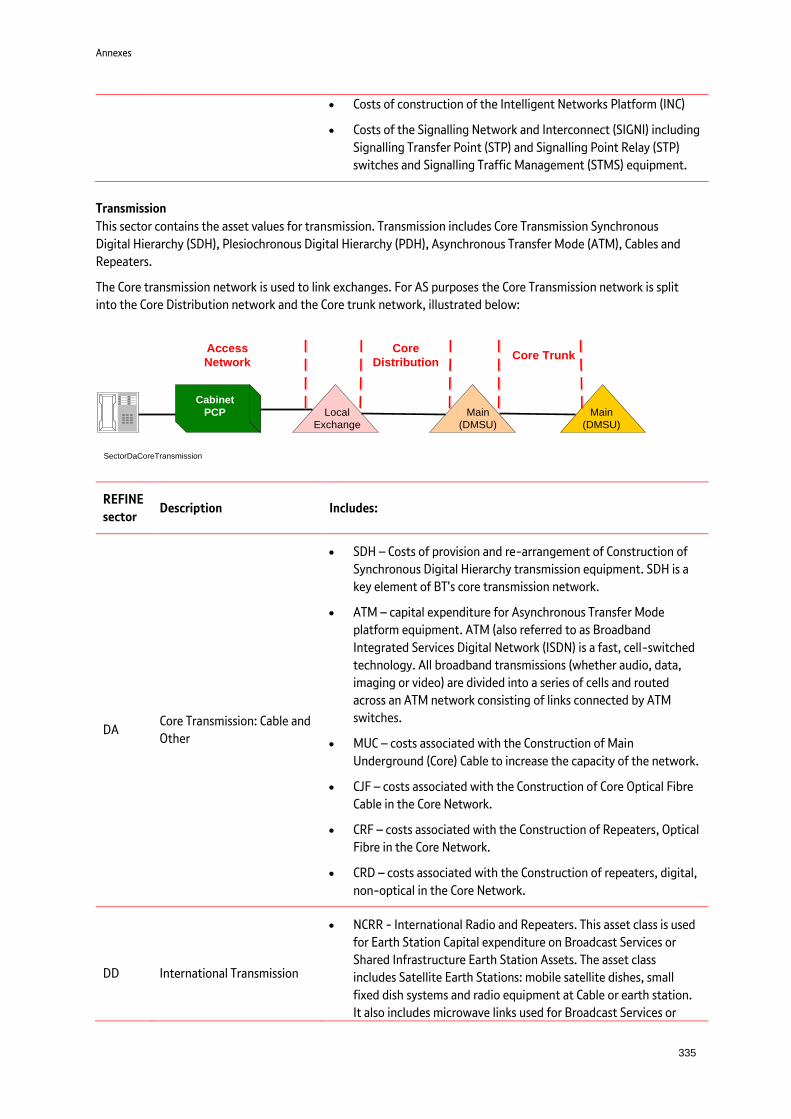
Annexes
335
Costs of construction of the Intelligent Networks Platform (INC)
Costs of the Signalling Network and Interconnect (SIGNI) including
Signalling Transfer Point (STP) and Signalling Point Relay (STP)
switches and Signalling Traffic Management (STMS) equipment.
Transmission
This sector contains the asset values for transmission. Transmission includes Core Transmission Synchronous
Digital Hierarchy (SDH), Plesiochronous Digital Hierarchy (PDH), Asynchronous Transfer Mode (ATM), Cables and
Repeaters.
The Core transmission network is used to link exchanges. For AS purposes the Core Transmission network is split
into the Core Distribution network and the Core trunk network, illustrated below:
REFINE
sector Description Includes:
DA
Core Transmission: Cable and
Other
SDH – Costs of provision and re-arrangement of Construction of
Synchronous Digital Hierarchy transmission equipment. SDH is a
key element of BT's core transmission network.
ATM – capital expenditure for Asynchronous Transfer Mode
platform equipment. ATM (also referred to as Broadband
Integrated Services Digital Network (ISDN) is a fast, cell-switched
technology. All broadband transmissions (whether audio, data,
imaging or video) are divided into a series of cells and routed
across an ATM network consisting of links connected by ATM
switches.
MUC – costs associated with the Construction of Main
Underground (Core) Cable to increase the capacity of the network.
CJF – costs associated with the Construction of Core Optical Fibre
Cable in the Core Network.
CRF – costs associated with the Construction of Repeaters, Optical
Fibre in the Core Network.
CRD – costs associated with the Construction of repeaters, digital,
non-optical in the Core Network.
DD
International Transmission
NCRR - International Radio and Repeaters. This asset class is used
for Earth Station Capital expenditure on Broadcast Services or
Shared Infrastructure Earth Station Assets. The asset class
includes Satellite Earth Stations: mobile satellite dishes, small
fixed dish systems and radio equipment at Cable or earth station.
It also includes microwave links used for Broadcast Services or
Local
Exchange
Main
(DMSU)
Access
Network
Core
DistributionCore Trunk
Cabinet
PCP Main
(DMSU)
SectorDaCoreTransmission

Annexes
336
share infrastructure.
DK
Private Circuits and SMDS
DTTM - Construction of Customer Wideband Services. This asset
class covers contract, stores and labour for the construction,
installation, commissioning, replacement, re-arrangement of
equipment at local exchanges and customer’s premises to carry
wideband services to customers such as Wideband bearer
electronics to support Kilostream service and Access SDH and test
equipment for testing and maintenance of customer’s wideband
services.
DTTK - Construction of Kilostream/Automatic cross Connect
Equipment (ACE) Services. This asset class covers contract, stores
and labour for the construction, installation, commissioning
replacement, re-arrangement of Kilostream core network
equipment for Kilostream Private Circuits eg ACE, Multiplexing
Site Units (MSU) and Equipment Network Access (ENA) Contract,
stores and labour for the work associated with the Analogue
Offload Programme, and supply and installation of all customer
end related equipment used for Kilostream Private Circuits (eg
Line cards, Modern Units, and Network Terminating Units) and
includes Cost of stores or other materials ordered for the provision
of Kilostream service (eg Line Cards, modem units, NTU) and the
racking and cabling for Kilostream core network equipment.
DTTS - Construction of Customer Wideband Services. This asset
class covers construction, provision, installation, commissioning,
replacement, re-arrangement or recovery of electronic equipment
(but not service) for the various Short Haul Data Services (SHDS).
DTTW - This asset class covers cost of provisions and such as stores
and labour for the construction, installation, commissioning,
replacement and upgrade of equipment at BT local exchanges and
customers premises.
DTTSW - Construction of SHDS links. Construction, provision,
installation, commissioning and replacement, electronic
equipment for products incorporating SHDS equipment.
DT
21st Century Network
MSAN (Multi Service Access Nodes) - provide customer access into
the network for Voice, Broadband and some Connectivity via line-
cards and the traffic generated is sent to Metro Nodes for
switching. This can be via other MSANs.
Metro/Core Nodes - Core Nodes are a special type of Metro Node
where there is a mesh or net of transmission between them. Most
Core nodes are connected to all other Core Nodes. Metro Nodes
switch traffic and contain the intelligence to direct its path. All
traffic will traverse the Metro Node to some degree whether it
falls into the category of Voice, Broadband or Connectivity.
21C WDM Transmission (Wave Division Multiplexing).
i-Nodes (Call Servers) - i-Nodes are used just for Voice customers
and contain intelligence for numbering and the intelligence for
routing ie Call Set-Up and Network Features.

Annexes
337
Ethernet Switches - Ethernet Switches are for Connectivity access
into the network and are located at sites that can take advantage
of WDM transmission to send and receive traffic to the Metro
node.
CCI (Common Capability Intelligence) - Common Capability
Intelligence is a set of re-usable components used to build our
products and services. It includes session management and
intelligence voice routing, authentication of customer identity,
identification of customer location and instant messaging.
The key drivers are engineering inventories and models that allocate CoW to network components and then onto
the appropriate service based on usage factors and actual service volumes.
Other
This sector contains the asset values for a range of assets used by BT businesses including categories such as
Software, Motor Transport and 21CN. The key drivers are surveys, engineering models and direct mapping of CoW
to network components and then onto the appropriate service based on usage factors and actual service volumes.
REFINE
sector Description Includes:
DG Network Power
TPC - Construction of Telecom Power Plant. This asset class covers
the provision, installation, construction, replacement and re-
arrangement of power plant systems and distributions feeding
network operational equipment in operational buildings, ie
telephone, radio and repeater stations.
DH Capital Miscellaneous Miscellaneous capital expenditure
DI Other Non-Voice Plant IPNC (Internet Protocol Network Capital) including assets and
depreciation.
DJ Net Enabling Computers Network enabling computing fixed assets and depreciation.
DL Public Payphones
PCOH This asset class covers the planning, provision and recovery
of payphone housing, including lighting and power, other than
managed sites.
DM Apparatus Sector DM contains the asset values and depreciation of
Apparatus equipment.
DN Motor Transport
NVAC - New Vehicles and Accessories purchased and include pool
cars, vans, light goods vehicles, heavy goods vehicles and 4 wheel
drive vehicles and trailers.
DO General Computers
COMPA - BT Own Use Computer Mainframes and Peripherals. This
includes computers which require a controlled environment eg air
conditioning, water cooling, includes front end processors, tape
drives, disk drives, silos, dedicated terminals etc.
COMPE - BT Own Use Personal Computers. Includes the processor,
display monitor, keyboard, internal CD ROM and modem, one or
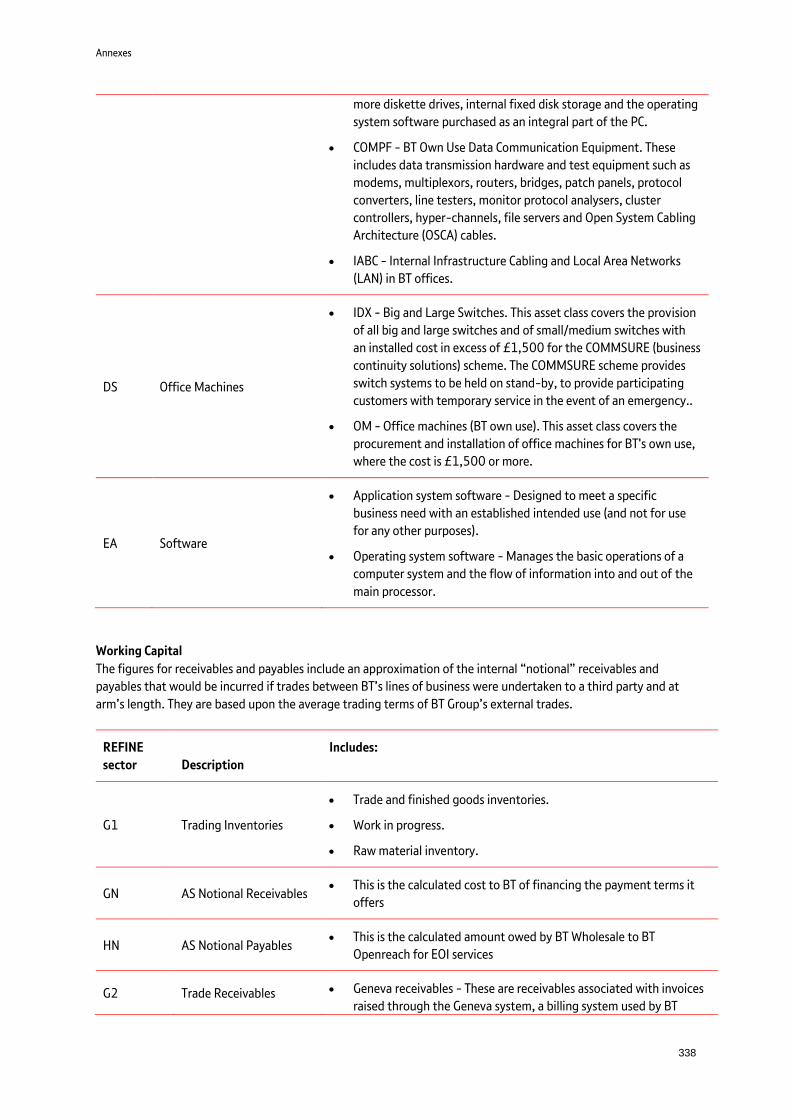
Annexes
338
more diskette drives, internal fixed disk storage and the operating
system software purchased as an integral part of the PC.
COMPF - BT Own Use Data Communication Equipment. These
includes data transmission hardware and test equipment such as
modems, multiplexors, routers, bridges, patch panels, protocol
converters, line testers, monitor protocol analysers, cluster
controllers, hyper-channels, file servers and Open System Cabling
Architecture (OSCA) cables.
IABC - Internal Infrastructure Cabling and Local Area Networks
(LAN) in BT offices.
DS Office Machines
IDX - Big and Large Switches. This asset class covers the provision
of all big and large switches and of small/medium switches with
an installed cost in excess of £1,500 for the COMMSURE (business
continuity solutions) scheme. The COMMSURE scheme provides
switch systems to be held on stand-by, to provide participating
customers with temporary service in the event of an emergency..
OM - Office machines (BT own use). This asset class covers the
procurement and installation of office machines for BT's own use,
where the cost is £1,500 or more.
EA Software
Application system software - Designed to meet a specific
business need with an established intended use (and not for use
for any other purposes).
Operating system software - Manages the basic operations of a
computer system and the flow of information into and out of the
main processor.
Working Capital
The figures for receivables and payables include an approximation of the internal “notional” receivables and
payables that would be incurred if trades between BT’s lines of business were undertaken to a third party and at
arm’s length. They are based upon the average trading terms of BT Group’s external trades.
REFINE
sector Description
Includes:
G1 Trading Inventories
Trade and finished goods inventories.
Work in progress.
Raw material inventory.
GN AS Notional Receivables This is the calculated cost to BT of financing the payment terms it
offers
HN AS Notional Payables This is the calculated amount owed by BT Wholesale to BT
Openreach for EOI services
G2 Trade Receivables Geneva receivables - These are receivables associated with invoices
raised through the Geneva system, a billing system used by BT

Annexes
339
Retail, Global Services and BT Wholesale. It contains customer data,
such as the Products they currently rent, usage and any discounts
applied.
Customer Service System (CSS) billed receivables - These are
receivables associated with invoices raised through the CSS. These
receivables’ balances are generated by the Retail business unit of BT
and include, for example, balances for invoices due from PSTN call
services provided to business and residential customers.
Other Communication Provider (OCP) receivables.
G3 Intra-group Receivables Internal trading between our lines of businesses relating to
receivables.
G4 Short Term Investments:
TP
Listed UK investments.
Listed non-UK investments.
Unlisted investments.
Overnight deposits.
Term deposits at banks.
Certificates of tax deposits.
G5 Short Term Investments:
IG
BT’s intra-group investments (funds deposited by one area of the
business into another part of the business) are directly allocated to
Retail Residual.
G6 Cash At Bank
The material balances in this sector represent sterling bank
accounts, with different F8 codes used for accounts with different
banks.
G9 Accrued Income
This sector relates to the balance sheet value of accrued income for
services provided to and used by customers but not yet invoiced by
BT. Accrued income arises where the invoice schedule for a
particular customer service allows the customer to use the service in
advance of being billed eg for telephony calls made by residential
customers, where customers are billed quarterly in arrears for the
call charges.
GA Prepayments Prepayments of general expenditure from BT.
GB Other Receivables
This sector relates to the balance sheet value of Other Receivables
for amounts owing to BT. It contains sundry and miscellaneous
receivable balances.
GC Pay Recharges Relates to pay accounting in BT. This sector always nets to zero.
GD
Derivative Financial
Instrument (Current
Assets)
This sector holds the balance sheet value of current derivative
financial instruments and relates purely to Retail Residual products.
H1 Short Term Borrowing The borrowings include:

Annexes
340
Overdrafts.
Short-term loans.
Other short-term loans (excluding bank overdrafts).
Commercial paper.
Liability balances on commercial paper held by the Treasury.
H2 Provisions under one
year
Potential liabilities faced by BT that are due within a year.
H3 Trade Payables
The key balances of trade Payables in this sector include:
Accounts Payable control.
Other Communication Provider (OCP) Payables.
Capital Trade Payables other.
H4 Intra-group Payable Internal trading between our lines of businesses relating to
payables.
H6 Other Tax and Social
Security
Key balances include:
Output VAT payables, arising from VAT collected by BT from its
customers.
Input VAT receivable balances, arising from VAT paid by BT on
inputs purchased.
National Insurance contributions for employees, payable by BT.
H7 Provisions Miscellaneous provisions
H8 Other Payables Sundry and miscellaneous payable balances.
H9 Accrued Expenses Accrued expenses not yet paid by BT.
HA Deferred Income Income received for services not yet provided to customers.
HF Derivative Financial
Instrument (Payables)
This sector holds the balance sheet value of derivative financial
instrument payables and relates purely to Retail Residual products.
A.1.4 Sector to F8 mapping table
The destinations or apportionment bases applied to specific F8 code / OUC combinations has been published in a
separate annex on our website. The methodologies applied are described in the methodology dictionary sections 8
– 13.

Annexes
341
Annex 2. Electricity price reporting
A.2.1 Direction
As part of Ofcom’s Directions for Regulatory Financial Reporting (30 March 2015) we have been directed to set
out and explain our methodology for setting the electricity charges, including a clear description on the individual
elements within the charge, how they are calculated and how they are passed through into the per kWh charge
end users.
We also provide the date on which the latest annual contractual price was struck and an aggregate split of the
individual elements in a non-confidential format.
We provide to Ofcom separately additional information that facilitates Ofcom’s monitoring of our compliance with
the basis of charges obligation for electricity.
A.2.2 BT electricity charge calculation
The cost components of the energy price are:
Raw power;
Sub meter operation and maintenance; and
PSTN lines to carry meter data.
Raw power – this is the fixed cost of BT’s energy for a certain year described as per kWh units.
Openreach buys its raw power for the entire forthcoming financial year in advance to fix the price and
remove any volatility in the market thereby providing stability on price. The total power forecast for
consumption in the forthcoming financial year is calculated from two quarters of actual consumption
from the current financial year. No mark-up is added to the raw energy cost; it is passed through at cost.
Sub meter operation and maintenance and PSTN lines – this is the cost of the meter and PSTN line hardware used
to read and record BT’s electricity charge, transfer meter data across the network so that meters can be read
remotely, and also includes the cost of maintaining this equipment.
The majority of points of presence (POPs) have sub meters and a PSTN line to carry meter data. The PSTN
lines are charged at the published price of a WLR line. The cost to Openreach for the sub meter operation
and maintenance is marked up appropriately to cover related costs.
The total charges for the raw power, telephone lines, cost of sub meter operation and maintenance and mark up
on sub meter operation and maintenance are aggregated and divided by the total units of power consumed to
determine the unit price of power for the relevant year (ie cost per kWh).
A.2.3 Contract information and breakdown
The contractual price for our electricity was agreed for the period 1 October 2010 to 31 March 2014. We
subsequently extended the contract with our supplier with effect from 1 April 2014.
The 2014/15 aggregate split of the individual elements of the electricity charge is as follows. For commercial
reasons this information is provided in percentage terms only:
%Cost Cost component
90 - 100% Cost of raw power
0 - 5% Cost of line rental
0 - 5% Cost of meter operation and maintenance (including mark-up)
100% Total cost of power for 2014/15

Annexes
342
A.2.4 Cost attribution process for LLU related electricity costs
The electricity charge follows the following path of attribution. The methodologies employed to attribute the
costs can be seen in the relevant dictionary for the level of attribution.
Base level (other and OUC driven)
DTNELSP attributes costs of raw power onwards to PG120B (LLU Electricity Usage – OR)
Except TB (Service, Strategy & Operations) attributes costs of POP meters and associated engineering work
onwards to PG120B.
Plant Group level
Costs attributed to PG120B (LLU Electricity Usage – OR) are onwards allocated to a dedicated component CL120
(LLU Electricity Usage – OR).
Component level
Costs allocated to CL120 (LLU Electricity Usage – OR) are onwards allocated to a dedicated service SL120 (LLU
Electricity Usage External). Note that for commercial sensitivity reasons we do not separately report this service in
the RFS.

Annexes
343
Annex 3. Detailed valuation methodology bibliography Report to H M Treasury (1986) “Accounting for Economic Costs and Changing Prices”.
The handbook “Accounting for the effects of changing prices”, published in 1986 by the Accounting Standards
Committee.
"Current Cost Accounting - An Introduction to SSAP 16", published in 1981 by the Certified Accountants
Educational Trust.
Report of the Inflation Accounting Committee – presented to Parliament by the Chancellor of the Exchequer and
the Secretary of State for Trade by Command of Her Majesty - September 1975.
“Inflation Accounting – An introduction to the debate”, 1983, Professor Geoffrey Whittington.

Annexes
344
Annex 4. Studies and data sources in current cost accounting valuations The following studies and data sources are utilised in the preparation of the CCA Valuations as described in Section
6.
EXPRES - Exchange Planning & Review System
Used for valuing Local Exchange Switches (LDX only).
This is a database holding information on Local Exchange & Main Exchange with details of units in service with
current capacities and ordering information (both historic and future). It is used to provide connections data for
models used in AS, CCA and LRIC.
INS - Integrated Network System
Used for valuing Junction Cable Optical Fibre (CJF) and Access Fibre Cable (LFSC)
Inventory database for BT's PDH circuits and cabling for PDH and SDH
NRS - Network Recording System
Used for valuing Local Exchange Switches (LDX only).
This is a system that holds details of all BT PSTN network 2Mb port terminations. It allows any system between
two switches to be queried and displayed, showing the switch termination details at each end. NRS allows switch
port terminations to be allocated/de-allocated for the introduction/cessation of routes or systems on a route. NRS
obtains a download of switch data for each switch. This switch data is downloaded on a regular basis (monthly) and
any route/system changes entered on the system are validated against the switch data.
PACS - Planning Assignment and Configuration System
Used for valuing 21CN CoW.
The PACS system is used by the BT planners when planning any jobs relating to the 21st Century Network. It lists
individually the equipment installed in 21CN exchanges.
Office for National Statistics (ONS)
In we use several of the ONS indices in our Indexation and Absolute Methodologies:
ONS Producer Price Indices (PPI)
http://ons.gov.uk/ons/taxonomy/index.html?nscl=Producer+Price+Indices
RPI
http://www.ons.gov.uk/ons/datasets-and-tables/data-selector.html?cdid=CHAW&dataset=mm23&table-id=2.1
Average Earnings
http://www.ons.gov.uk/ons/taxonomy/index.html?nscl=Earnings

Annexes
345
Annex 5. Indices and trends used in current cost accounting The following tables show the indices and trends that are used to derive valuations for those assets using the
indexed historic methodology.
TABLE 1: Indices used for Indexed Historic methodologies
Asset CoW Indices used with sources
Specialised
Accommodation
Assets
ACPN (a) Heating and air conditioning units - ONS index: Non-domestic Cooling &
Ventilation Equipment (ONS reference: Producer Price Index
2825000000)
(b) Internal building work – valued at historic costs
(c) Capitalised planning costs – ONS index: Average Earnings amended for
productivity improvements of 2% per annum
(d) All other assets – ONS index: Electrical Lighting Equipment (ONS
reference: Producer Price Index 2740000000)
Copper Cable LDC Physical assets & capitalised planning costs – RPI
Dropwires NWR
NWB
Physical assets & capitalised planning costs – RPI
Duct LDD Physical assets & capitalised planning costs – RPI
SDH Equipment SDH We have created a bespoke BT index using the following component indices:
(a) Equipment and contracted installation – A further bespoke BT index
modelled from Average Earnings, RPI and observed changes in the SDH
contract prices
(b) BT labour – ONS Average Earnings
(c) Other – RPI
Back-up Power
Equipment
TPC (a) Standby generators – ONS index: Electric Motors, Generators &
Transformers (reference Purchasing Price Index 2711000000)
(b) Capitalised planning costs – ONS index: Average Earnings amended for
productivity improvements of 2% per annum
(c) Other Assets – ONS index: Wiring Devices (reference: Purchasing Price
Index 2733000000)

Annexes
346
TABLE 2: Indices used within the absolute valuation methodologies
Asset CoW Indices used with sources
Access – Fibre
Cables
LFSC (a) Capitalised planning costs – ONS index: Average Earnings amended for
productivity improvements of 2% per annum
System X
Local
Exchanges
LDX (a) In original absolute valuation we used a bespoke index to apply to the 2000
LEMP 2 contract and to non-capacity related expenditure. This was
constructed from the following elements:
i. Equipment and installation – based on changes to contract prices
ii. BT Labour – ONS index: average earnings
iii. Software – bespoke BT index consisting of changes in contract prices,
average earnings and the ONS index: Electric Lighting Equipment (ONS
reference: Producer Price Index 2740000000)
(b) We extrapolated the 2008/09 valuation using this same index
Capitalised planning costs – ONS index: Average Earnings amended for
productivity improvements of 2% per annum
Backhaul and
Core Fibre
CJF (a) Capitalised planning costs – ONS index: Average Earnings amended for
productivity improvements of 2% per annum
21st Century
Network
(a) BT labour costs - ONS index: Average Earnings amended for productivity
improvements of 2% per annum
(b) Capitalised planning costs – ONS index: Average Earnings amended for
productivity improvements of 2% per annum
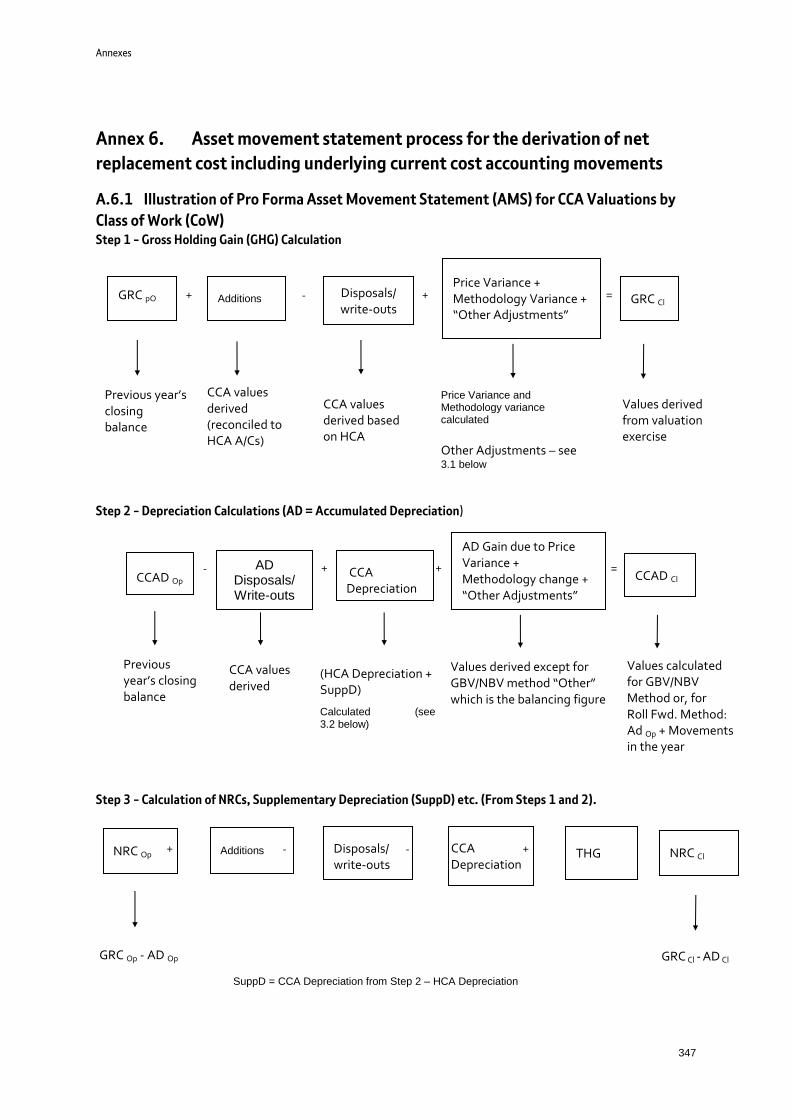
Annexes
347
Annex 6. Asset movement statement process for the derivation of net
replacement cost including underlying current cost accounting movements
A.6.1 Illustration of Pro Forma Asset Movement Statement (AMS) for CCA Valuations by
Class of Work (CoW) Step 1 - Gross Holding Gain (GHG) Calculation
Step 2 - Depreciation Calculations (AD = Accumulated Depreciation)
Step 3 - Calculation of NRCs, Supplementary Depreciation (SuppD) etc. (From Steps 1 and 2).
GRC pO Additions Disposals/ write-outs
Price Variance + Methodology Variance + “Other Adjustments”
GRC Cl + - + =
Previous year’s closing balance
CCA values derived (reconciled to HCA A/Cs)
CCA values derived based on HCA
Price Variance and Methodology variance calculated
Other Adjustments – see 3.1 below
Values derived from valuation exercise
CCAD Op AD
Disposals/ Write-outs
CCA Depreciation
AD Gain due to Price Variance + Methodology change + “Other Adjustments”
CCAD Cl - + + =
Previous year’s closing balance
CCA values derived
(HCA Depreciation + SuppD)
Calculated (see 3.2 below)
Values derived except for GBV/NBV method “Other” which is the balancing figure
Values calculated for GBV/NBV Method or, for Roll Fwd. Method: Ad Op + Movements in the year
NRC Op Additions Disposals/ write-outs
CCA Depreciation
NRC Cl - + =
GRC Op - AD Op GRC Cl - AD Cl
THG
SuppD = CCA Depreciation from Step 2 – HCA Depreciation
- +

Annexes
348
Description of the Asset Movement Statement (AMS) process for derivation of Net Replacement Cost (NRC)
including underlying CCA movements
The above diagram contains an outline of the AMS process and, to aid understanding, the following description
should be read in conjunction with this diagram.
Each AMS spreadsheet pro-forma incorporates the HCA and CCA AMS schedules. The former is populated from the
historic numbers and fully reconciled to the published HCA accounts. The opening balances (ie GRC, CCAD and
NRC) are as per previous year’s financial statements.
Before completing the Asset Movement Statement, the year-end gross replacement costs (GRC) are required.
Explanations of the gross valuations are not included here and are covered under the appropriate sections in this
document.
Once the year-end GRC for a class of work has been calculated, the following steps are followed to derive the CCA
adjustments and Net Replacement Cost (NRC).
Step 1 – Calculation of Gross Holding Gain
Additions – This figure comprises two elements – the assets in service plus the movement in the AICC over the
year. The valuation for assets in service is derived using the volumes of additions in the year and the latest prices.
The unit price applied to the additions is the same as that used to derive the closing gross valuation. The AICC
movement figure is the difference between the current year-end and opening (ie previous year’s closing) figures
reported in HCA accounts.
Disposals/write-outs – These figures are derived from HCA figures using the most appropriate method for the
asset being valued.
The usual method for deriving CCA values of disposals/write-outs is as follows:
CCA value of disposals/write-outs = HCA value of disposals/write-outs x the ratio (opening GRC/opening GBV)
The HCA values of disposals/write-outs are obtained from the Fixed Asset Registers.
For assets valued on indexed historic basis - The indexed values of disposals/write-outs are derived directly from
the FAR data. The indices used are the same ones as those used for deriving the indexed gross valuations.
Price Variance – the price variance is calculated by using the standard approach for variance analysis ie by applying
the change in unit price during the year to the opening volumes (ie last year’s closing) figures. Additionally a half
year’s change is applied to the net movement in the current year, to reflect that on average these occurred at the
midpoint but have now moved to year end prices.
Methodology Variance – Following a change of methodology in the year, a revised valuation is derived using the
same data and underlying calculations as for the previous year-end. The difference between the revised and
existing gross figures gives the methodology variance
Any further differences are reported under the “Other adjustments” category; this includes any differences
between the HCA and CCA additions, and any adjustments arising from the transfer of assets from one CoW to
another.
Step 2 – Depreciation Calculations
For assets valued using absolute valuation methodology
We use two main methods as follows to calculate CCA depreciation. With both methods CCA depreciation is based
on the same principles and lives used in historical accounts (as recommended by the ASC Handbook).

Annexes
349
NBV/GBV Method
Under this method, the CCA asset is assumed to be depreciated in the same ratio as its historical cost equivalent.
This means that the CCA depreciation stays in line with HCA. The following relationship, therefore, holds:
CCAD = HCAD x (GRC/GBV)
(where CCAD = Current Cost Accumulated Depreciation and HCAD = Historic cost Accumulated Depreciation)
This relationship is used to calculate the year-end CCAD. The difference between this derived figure and the
opening CCAD then represents the current year’s movements including the year’s depreciation charge which is the
balancing figure.
[Note: Depreciation for duct is derived using the Indexed NBV/Indexed GBV ratio]
Roll Forward Method
Using this approach, the opening CCAD is uplifted by price change in the year.
- Depreciation relating to disposals, write-outs and transfers is taken out
- Current year’s CC depreciation charge is derived using the relationship, HC depreciation charge x (GRC/GBV)
The closing CCAD is the sum of the above items
To aid the understanding of these two approaches, the methods in context of the AMS are illustrated below. The
GRC and GBV values used in depreciation calculations exclude AICC which is not depreciated.
Illustration of methods used:
(i) NBV/GBV Method
Opening Cumulative balance of CC Depreciation (CCADOp) A
(= previous year’s closing balance)
CC depreciation of disposals, calculated using the default formula:-
(GRC of disposals / GBV of disposals) x HC depreciation of disposals B
CC depreciation of write-outs, calculated using the default formula:-
(GRC of write-outs / GBV of write-outs) x HC depreciation of write-out C
CC depreciation of transfers, calculated using the default formula:-
(GRC of transfers / GBV of transfers) x HC depreciation of transfers D
CC depreciation of methodology variance, calculated using the default formula:-
GRC of method change x (opening total HC depreciation / opening total GBV) E
CC depreciation of “other” adjustments, calculated as the difference between:
the Opening Cumulative balance of CC depreciation plus all movements
and the Closing Cumulative balance of CC depreciation F
(balancing figure)
AD due to price variance, calculated using the formula:-
[Opening Cumulative balance of CC depreciation A
x percentage price movement for the year = H
plus CC depreciation associated with Disposals B
+ CC depreciation associated with Write-outs C
+ CC depreciation associated with Transfers D
+ CC depreciation charge for the year G
+ CC depreciation associated with Methodology Changes E
+ CC depreciation associated with Other adjustments F
x square root of the price movement in the year= J]
K= (H + J)
Closing Cumulative Balance of CC Depreciation calculated using the default formula:-
(Closing GRC / Closing GBV) x Closing Cumulative HC depreciation L
[Closing GBV is adjusted to allow for fully depreciated assets not in service which are not valued in CCA. This brings
the GBV on a consistent basis with the GRC]
CC depreciation charge for the year, calculated as:-

Annexes
350
CC depreciation charge for the year, calculated using the default formula:-
HCA depreciation charge x (mean GRC / mean GBV) G
NOTE: With the exception of price variance and depreciation charge the above formulae are the default calculation
automatically performed by the pro-forma. However, there is a facility within the AMS pro-formas to input the
figures manually, for example, in instances where adequate data is available at sub-CoW level to achieve an
improved figure.
(ii) Roll Forward Method
Opening Cumulative balance of CC Depreciation (CCADOp)
(= previous year’s closing balance) A
CC depreciation of disposals, calculated using the default formula:-
(GRC of disposals / GBV of disposals) x HC depreciation of disposals B
CC depreciation of write-outs, calculated using the default formula:-
(GRC of write-outs / GBV of write-outs) x HC depreciation of write-outs C
CC depreciation of transfers, calculated using the default formula:-
(GRC of transfers / GBV of transfers) x HC depreciation of transfers D
CC depreciation of methodology variance, calculated using the default formula:-
GRC of method change x (opening total CC depreciation / opening total GRC) E
CC depreciation of “other” adjustments, calculated using the default formula:-
GRC of “other” change x (opening total HC depreciation / opening total GBV) F
CC depreciation charge for the year, calculated using the default formula:-
HCA depreciation charge x (mean GRC / mean GBV) G
(GBV is adjusted to allow for fully depreciated assets not in service which are not valued in CCA. This brings the
GBV on a consistent basis with the GRC)
AD due to price variance, calculated using the formula:-
[Opening Cumulative balance of CC depreciation A
x percentage price movement for the year = H
plus
[ CC depreciation associated with Disposals B
+ CC depreciation associated with Write-outs C
+ CC depreciation associated with Transfers D
+ CC depreciation charge for the year G
+ CC depreciation associated with Methodology Changes E
+ CC depreciation associated with Other adjustments F ]
x square root of the price movement in the year = J
K = (H + J)
Closing Cumulative Balance of CC Depreciation calculated as:-
L = A - B - C +/- D +/- E +/- F + G +/- K L
NOTE: With the exception of price variance and depreciation charge the above formulae are the default calculation
automatically performed by the pro-forma. However, there is a facility within the AMS pro-formas to input the
figures manually, for example, in instances where adequate data is available at sub-CoW level to achieve an
improved figure.
For assets valued using indexed historic valuation methodology
BT uses a single method for all assets valued using the indexed historic valuation methodology to calculate CCA
depreciation.
The detailed records from the asset register are summarised by year of registration then indexed forward to the
current year, the aggregate figure being the closing Gross Replacement Cost and Current Cost Accumulated
Depreciation for the year to which is added any Late Registrations. Supplementary Depreciation is calculated using
the mean GRC/GBV method. The values of other movements in the year are then calculated using equivalent HCA
ratios or opening CCA/HCA ratios as appropriate.

Annexes
351
Annex 7. Linkage of DVM asset categories to Activity and Plant Groups
The linkages of all detailed valuation methodology asset categories to their associated plant groups and the
sectors into which they have been categorised have been published together as a separate annex on our website.

Annexes
352
Annex 8. Key destinations
The key destinations of each of the bases identified in this document have been published as a separate annex on
our website.