Embed Size (px)
Citation preview
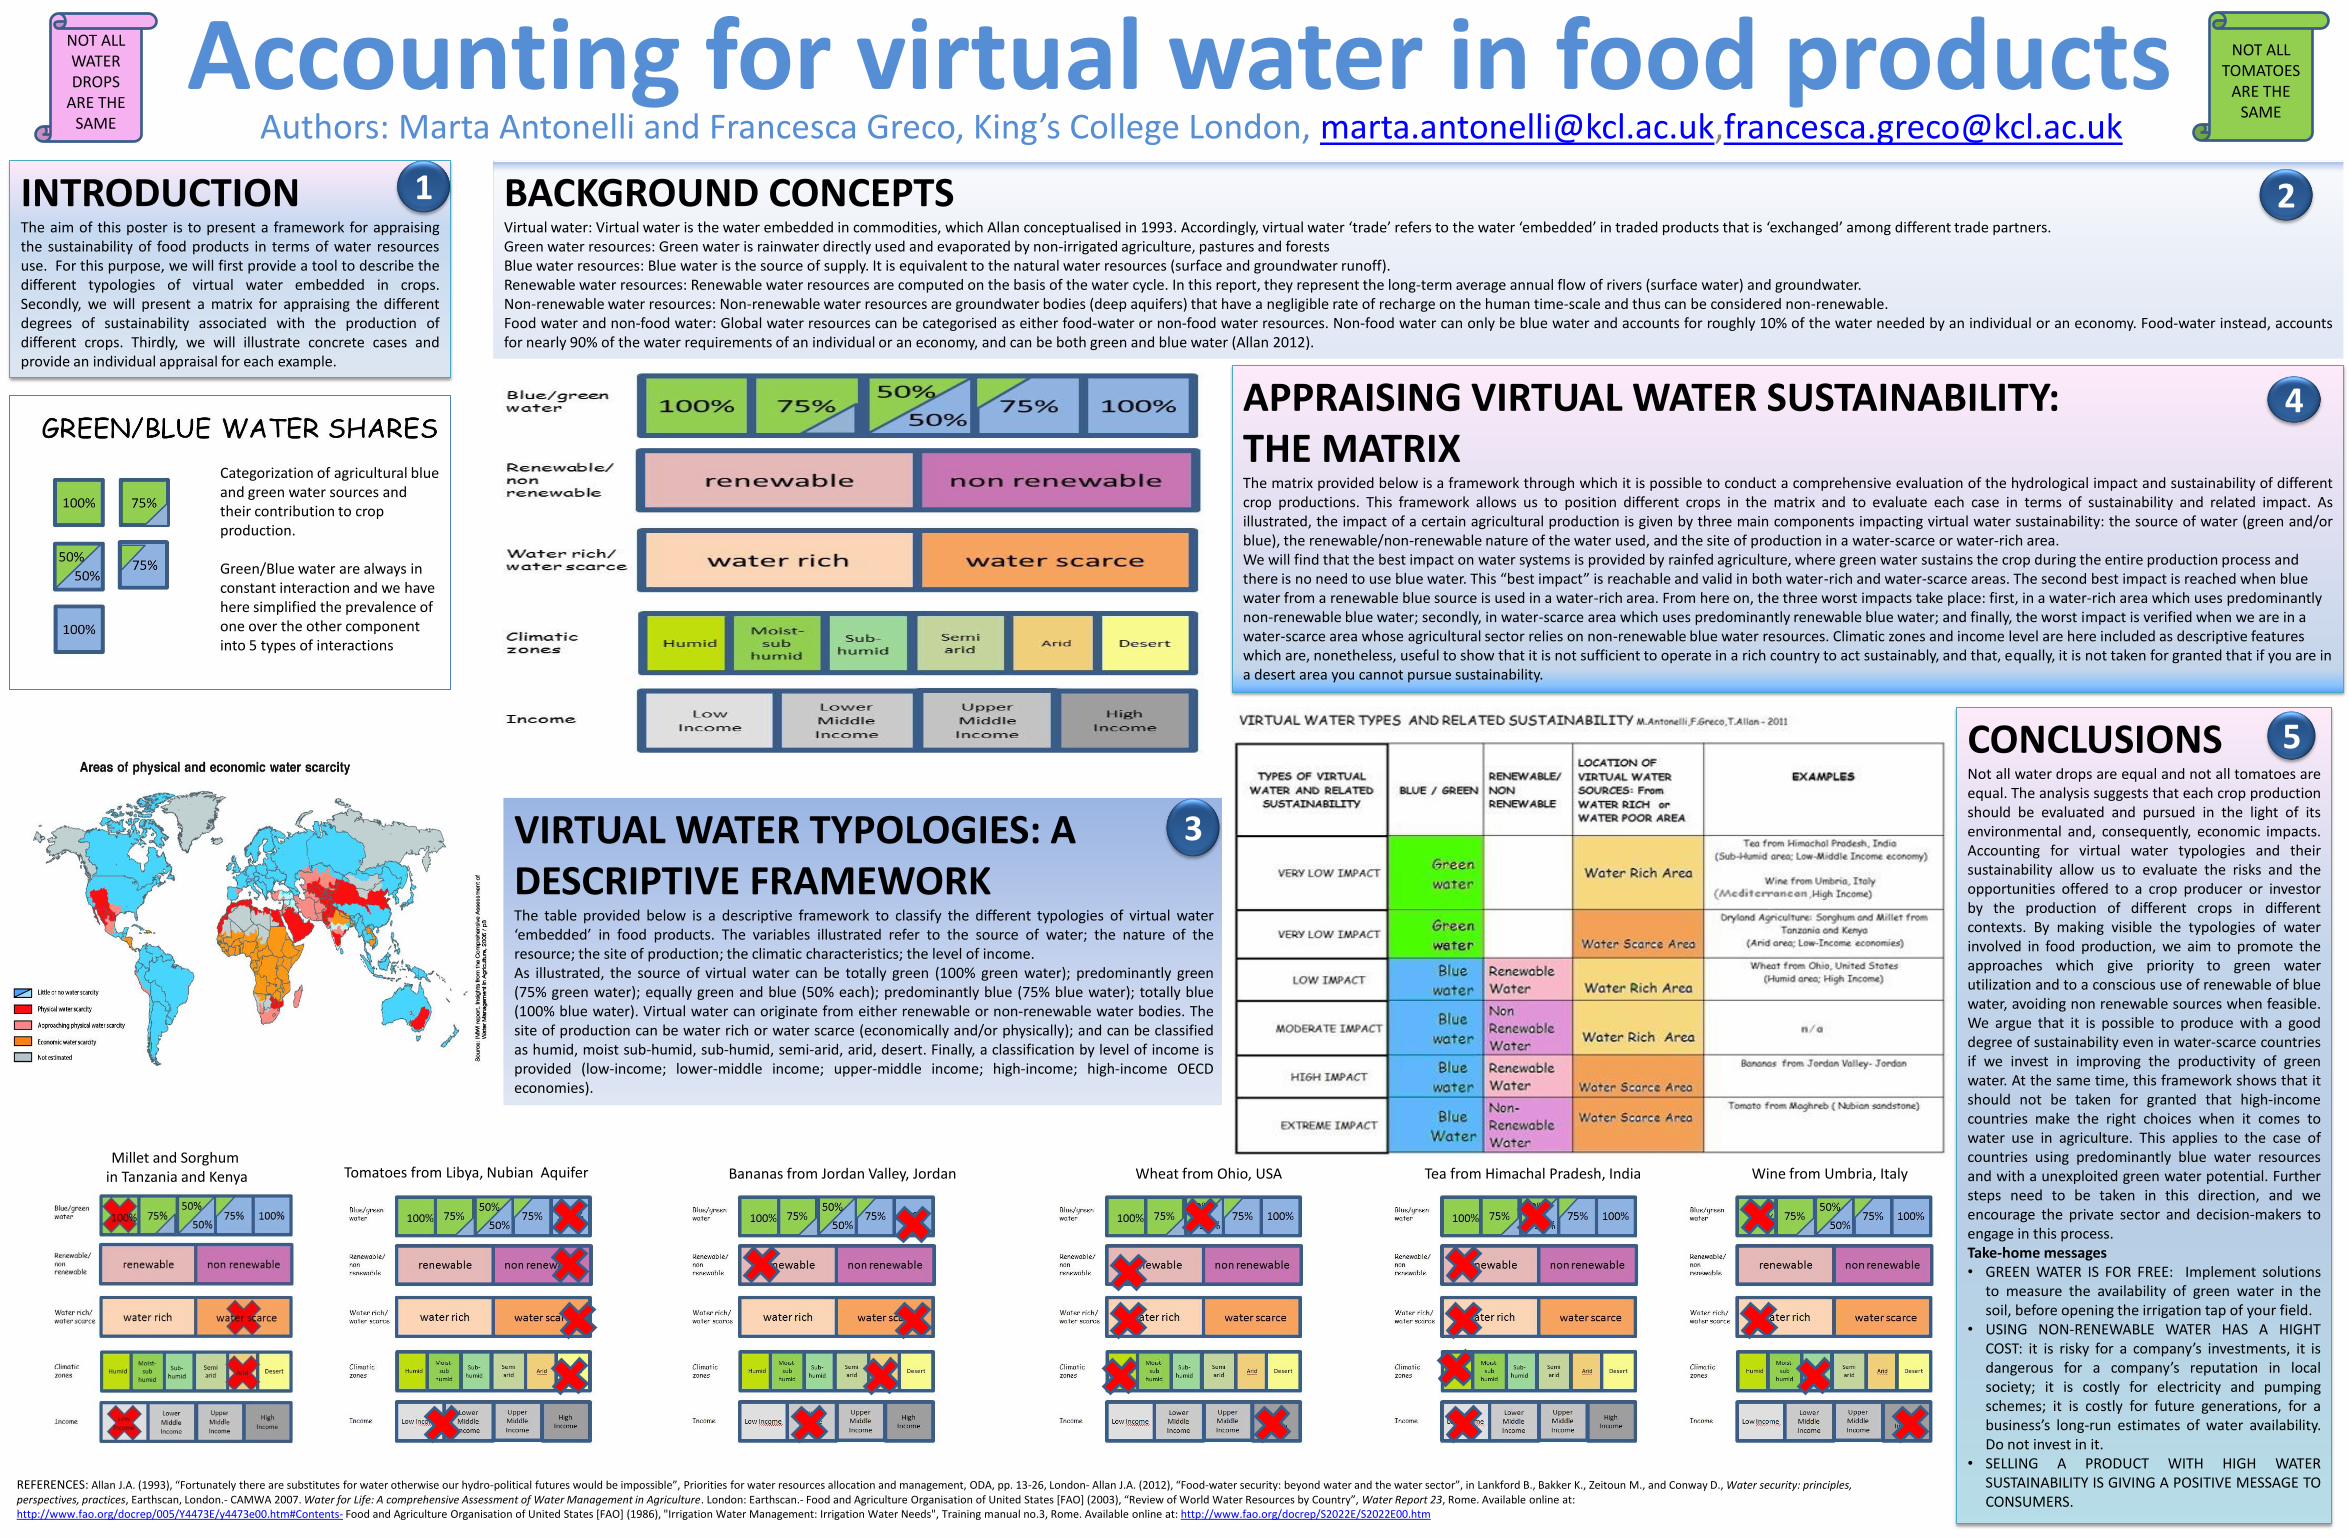
Millet and Sorghumin Tanzania and Kenya Tomatoes from Libya, Nubian Aquifer Bananas from Jordan Valley, Jordan Wheat from Ohio, USA Tea from Himachal Pradesh, India Wine from Umbria, Italy
REFERENCES: Allan J.A. (1993), “Fortunately there are substitutes for water otherwise our hydro-political futures would be impossible”, Priorities for water resources allocation and management, ODA, pp. 13-26, London- Allan J.A. (2012), “Food-water security: beyond water and the water sector”, in Lankford B., Bakker K., Zeitoun M., and Conway D., Water security: principles, perspectives, practices, Earthscan, London.- CAMWA 2007. Water for Life: A comprehensive Assessment of Water Management in Agriculture. London: Earthscan.- Food and Agriculture Organisation of United States *FAO+ (2003), “Review of World Water Resources by Country”, Water Report 23, Rome. Available online at: http://www.fao.org/docrep/005/Y4473E/y4473e00.htm#Contents- Food and Agriculture Organisation of United States [FAO] (1986), "Irrigation Water Management: Irrigation Water Needs", Training manual no.3, Rome. Available online at: http://www.fao.org/docrep/S2022E/S2022E00.htm
Accounting for virtual water in food productsAuthors: Marta Antonelli and Francesca Greco, King’s College London, [email protected],[email protected]
CONCLUSIONSNot all water drops are equal and not all tomatoes areequal. The analysis suggests that each crop productionshould be evaluated and pursued in the light of itsenvironmental and, consequently, economic impacts.Accounting for virtual water typologies and theirsustainability allow us to evaluate the risks and theopportunities offered to a crop producer or investorby the production of different crops in differentcontexts. By making visible the typologies of waterinvolved in food production, we aim to promote theapproaches which give priority to green waterutilization and to a conscious use of renewable of bluewater, avoiding non renewable sources when feasible.We argue that it is possible to produce with a gooddegree of sustainability even in water-scarce countriesif we invest in improving the productivity of greenwater. At the same time, this framework shows that itshould not be taken for granted that high-incomecountries make the right choices when it comes towater use in agriculture. This applies to the case ofcountries using predominantly blue water resourcesand with a unexploited green water potential. Furthersteps need to be taken in this direction, and weencourage the private sector and decision-makers toengage in this process.Take-home messages• GREEN WATER IS FOR FREE: Implement solutions
to measure the availability of green water in thesoil, before opening the irrigation tap of your field.
• USING NON-RENEWABLE WATER HAS A HIGHTCOST: it is risky for a company’s investments, it isdangerous for a company’s reputation in localsociety; it is costly for electricity and pumpingschemes; it is costly for future generations, for abusiness’s long-run estimates of water availability.Do not invest in it.
• SELLING A PRODUCT WITH HIGH WATERSUSTAINABILITY IS GIVING A POSITIVE MESSAGE TOCONSUMERS.
EXAMPLES OF CROPS
Categorization of agricultural blue and green water sources and their contribution to crop production.
Green/Blue water are always in constant interaction and we have here simplified the prevalence of one over the other component into 5 types of interactions
NOT ALL TOMATOES
ARE THE SAME
INTRODUCTIONThe aim of this poster is to present a framework for appraisingthe sustainability of food products in terms of water resourcesuse. For this purpose, we will first provide a tool to describe thedifferent typologies of virtual water embedded in crops.Secondly, we will present a matrix for appraising the differentdegrees of sustainability associated with the production ofdifferent crops. Thirdly, we will illustrate concrete cases andprovide an individual appraisal for each example.
1 BACKGROUND CONCEPTSVirtual water: Virtual water is the water embedded in commodities, which Allan conceptualised in 1993. Accordingly, virtual water ‘trade’ refers to the water ‘embedded’ in traded products that is ‘exchanged’ among different trade partners.Green water resources: Green water is rainwater directly used and evaporated by non-irrigated agriculture, pastures and forestsBlue water resources: Blue water is the source of supply. It is equivalent to the natural water resources (surface and groundwater runoff).Renewable water resources: Renewable water resources are computed on the basis of the water cycle. In this report, they represent the long-term average annual flow of rivers (surface water) and groundwater.Non-renewable water resources: Non-renewable water resources are groundwater bodies (deep aquifers) that have a negligible rate of recharge on the human time-scale and thus can be considered non-renewable.Food water and non-food water: Global water resources can be categorised as either food-water or non-food water resources. Non-food water can only be blue water and accounts for roughly 10% of the water needed by an individual or an economy. Food-water instead, accountsfor nearly 90% of the water requirements of an individual or an economy, and can be both green and blue water (Allan 2012).
2
VIRTUAL WATER TYPOLOGIES: A DESCRIPTIVE FRAMEWORKThe table provided below is a descriptive framework to classify the different typologies of virtual water‘embedded’ in food products. The variables illustrated refer to the source of water; the nature of theresource; the site of production; the climatic characteristics; the level of income.As illustrated, the source of virtual water can be totally green (100% green water); predominantly green(75% green water); equally green and blue (50% each); predominantly blue (75% blue water); totally blue(100% blue water). Virtual water can originate from either renewable or non-renewable water bodies. Thesite of production can be water rich or water scarce (economically and/or physically); and can be classifiedas humid, moist sub-humid, sub-humid, semi-arid, arid, desert. Finally, a classification by level of income isprovided (low-income; lower-middle income; upper-middle income; high-income; high-income OECDeconomies).
3
APPRAISING VIRTUAL WATER SUSTAINABILITY: THE MATRIXThe matrix provided below is a framework through which it is possible to conduct a comprehensive evaluation of the hydrological impact and sustainability of differentcrop productions. This framework allows us to position different crops in the matrix and to evaluate each case in terms of sustainability and related impact. Asillustrated, the impact of a certain agricultural production is given by three main components impacting virtual water sustainability: the source of water (green and/orblue), the renewable/non-renewable nature of the water used, and the site of production in a water-scarce or water-rich area.We will find that the best impact on water systems is provided by rainfed agriculture, where green water sustains the crop during the entire production process and there is no need to use blue water. This “best impact” is reachable and valid in both water-rich and water-scarce areas. The second best impact is reached when blue water from a renewable blue source is used in a water-rich area. From here on, the three worst impacts take place: first, in a water-rich area which uses predominantly non-renewable blue water; secondly, in water-scarce area which uses predominantly renewable blue water; and finally, the worst impact is verified when we are in a water-scarce area whose agricultural sector relies on non-renewable blue water resources. Climatic zones and income level are here included as descriptive features which are, nonetheless, useful to show that it is not sufficient to operate in a rich country to act sustainably, and that, equally, it is not taken for granted that if you are in a desert area you cannot pursue sustainability.
4
5
NOT ALL WATER DROPS
ARE THE SAME


![Antonelli, Nature & Purpose of Numbers [21 pgs]](https://img.pdfslide.us/doc/110x75/577cdfe91a28ab9e78b243ff/antonelli-nature-purpose-of-numbers-21-pgs.jpg)