Embed Size (px)
Citation preview

Accounting for Variation in Spam Effectivness
Shaddi Hasan, Aurojit Panda, Colin Scott
July 27, 2013
1 IntroductionCybercrime today is a profit-driven enterprise. Viewingcomputer security through the lens of business incentivesin this way helps guide the efforts of policy-makers andresearchers, since the effectiveness of countermeasures isdirectly related to their effect on cybercriminals’ profitmotives, the root causes of cybercrime.
In this respect, understanding the structure of the cyber-crime marketplace is a crucial task for the security com-munity. Recent work provides some insight into differentaspects of this so-called “underground economy”, such asPPI pricing factors [1], as well as the supply [2] and de-mand [3, 4] for spam.
One striking finding from this line of work is that thevalue placed on various resources used in cybercrime –e.g. infected zombie machines or spam targets – appearsto vary by the level of economic development of the coun-try where the resource is located. For example, PPI pricescited in [?] indicate that the price of a bot machine in theUnited States costs 1-2 orders of magnitude more than abot located in “Asia”1.
Understanding what drives this variation is vital to un-derstanding the cybercrime underground economy. Varia-tion in pricing could be due to supply-side factors, such asincreased availability, or it could be due to demand-sidefactors, such as targets in certain locations being morelucrative; the final market price of a resource is drivenby both. Untangling the significance of supply-side anddemand-side factors from this market price is a fundamen-tally challenging problem without access to cybercrimi-nals’ accounting information.
Unable to directly measure the influence of each ofthese factors, the research community has turned to an in-direct approach to this problem. For example, price vari-ation in PPI prices driven by supply-side factors can becorrolated with the density of vulnerable computers in agiven geographic region.
In this paper, we attempt to use this indirect measure-ment approach to analyze one facet of cybercrime: spam.
1broadly defined by the source
A spammer places a higher demand on users for whomthey are able to get higher revenue per spam conversion.Likewise, the marginal cost of spamming resources (e.g.bots in a particular IP address block) is related to howeasily those those resources can obtain conversion fromtheir spam targets.2 We focus on the latter, the supply-side characteristics of spam.
In particular, we investigate a finding from the Spama-lytics data [3]: both click and conversion rates for spamdiffers by geographic region. Our hypothesis is that this isdue variation in the type of spam filtering place betweenthe spammer and the user’s inbox, a supply-side factor.
More specifically, our hypothesis is that spam filteringrates across email domains can be correlated with the levelof development of the country in which they are located,as measured by GDP (PPP) per capita. We developed thishypothesis based on the observation that Indian and Pak-istani visitors accounted for a disproportionate amount ofspam click-throughs measured in the Spamalytics study.If our hypothesis were true, we would have direct evi-dence that mail servers in poor countries are more sus-ceptible to spam than those in rich countries. We wouldalso have indirect evidence that cybercrime pricing varia-tion is driven by supply-side factors, since decreased us-age of anti-spam technology is an indication of decreasedsophistication of a country’s general network security in-frastructure.3
Our measurements have shown that our hypothesis doesnot appear to be true: we find no significant correlationbetween the level of income of a country and the resis-tance to spam demonstrated by domains hosted in thatcountry, as measured by multiple independent metricsof spam resistance. In particular, we found no relation-ship between country income level and spam accept rates,spam click-through rates, deployment rates of anti-spamsystems, rates of inferred blacklist usage per domain, or
2We assume all people have equal probability of click on a spammessage that reaches their attention.
3By “indirect evidence” here, we mean only that such a finding wouldsuggest that this may be true, or at least worthy of further investigation;we do not make any claim in this paper to answer the high-level supplyversus demand question.
1

SMTP server software versions.We describe these measurement results in the remain-
der of this paper. We first describe related work in Sec-tion 2. Section 3 describes the datasets that we used,as well as the underlying assumptions used through-out this project. Section 4 describes our experimentalmethodology. We consider the implications of our results,the cross-validation relationship of our individual experi-ments, and the shortcomings of our study design in Sec-tion 5 before concluding in Section 6.
2 Related WorkWe consider three categories of related measurement stud-ies and methodologies: spam blacklisting measurement,studies of spam in developing regions, and geolocation.Spam Blacklisting. The work that is closest to ours is[3]. Our primary data source comes from the Spamalyt-ics email traces. Spamalytics gathered statistics withoutregard to national boundaries, and while some of theiranalysis shows that people in certain countries are morelikely to click through on receiving spam, no analysis wasdone to measure the precise reason. Samalytics also an-alyzed the rate at which a few DNS blacklists were up-dated, and how quickly MX agents responded to these up-dates. While these studies gave substantiative answers tothe rate at which blacklists were updated and their use,the analysis was not motivated by differences in economicbackground, and took a broader view than our study. Ouranalysis complements this global analysis, by testing thehypothesis that this difference in click-through rates wasbased on the efficiency of blacklisting across countries,rather than purely on cultural differences.
We attempt to measure the effectiveness of DNS black-listing, and other spam filtering techniques across coun-tries. The effectiveness of DNS blacklisting in generalhas been well-studied, particularly in [5] and [6]. Studiessuch as [7] have shown a noticeable reduction in spam,and the change in distribution that can be attributed to theadvent of DNS blacklisting.
As demonstrated by [8], DNS-based blacklists are notentirely effective. This is due in part to botnet operatorsusing evidence of blacklist listing to measure the effec-tiveness of their SMTP servers. Other projects ([9]) havealso suggested alternate detection mechanisms for spambased on DNS blacklisting, where they explore the effectsof such blacklisting, in particular demonstrating a mecha-nism for content-independent recognition of spam, basedon a belief that botnets can easily tailor e-mails to individ-ual users, and broad content based spam filtering can beeasily defeated.
Spam in Developing Regions Developing countries standout for several reasons in analyzing spam. According toa 2005 OECD4 report [10], spam has an even greater ad-verse effect on developing countries: because of limitedresources and bandwidth, spam incurs a greater percent-age cost for both users and network operators. In ad-dition, developing nations tend to lack important orga-nizational and legislative infrastructure to combat spam,such as CERTs or anti-spam legislation [11]. Indeed, non-OECD countries are actually some of the largest sourcesof outgoing spam as well [12], with India, Russian, In-donesia, and Brazil accounting for over 25% of worldwidespam. Developing world users have been specifically tar-geted by spam campaigns [13], suggesting that puttingspam in this population’s inbox is worthwhile for spam-mers. Attitudes towards spam are complex. While someusers react to spam as a nuisance [11], others make sub-stantial income from spam activities (e.g. the 419 scam,which is typically conducted without the use of bulk emailsoftware) [14].Geolocation. We rely on geolocation to determine thecountry-of-origin for client IP addresses. Several ge-olocation data sources exist, including delay measure-ments [15], DNS name matching [16], and commercialdatabases [17]. It has been demonstrated by [15] thatIP geolocation can locate an address to within about 400kms, however for our purpose country-level geolocationsuffices.
3 Data
Our main results in this paper are derived from the Spa-malytics data [3]. Specifically, we examine (i) spammessages sent by the Storm botnet, each containing theanonymized e-mail addresses at which spam was targetedand the recepient’s full domain, (ii) positive delivery re-ports, asynchronously received from users’ mail servers,and (iii) click data from the fake spam website adminis-tered by the Spamalytics researchers.
Because the Spamalytics researchers did not have ac-cess to the worker bots sending the spam messages, ourdata does not include SMTP network trace data such asTCP connection failure codes or original DNS records.We therefore found it necessary to re-resolve all DNSrecords for our analysis. Doing so four years laterraises some concern that domains may have changed MXservers or may no longer exist. We addressed this to an
4Organization for Economic Co-operation and Development, an or-ganization of 34 countries intended to stimulate economic progress andworld trade
2

extent by eliminating all reports, and instructions to non-existent MX servers, we however do not account for MXservers that have moved. We describe the logistics of thiseffort below.Measurement Infrastructure. We parallelized the taskof resolving DNS records for user domains across 75Vicci servers [18]. We found this level of parallelism nec-essary to finish the measurements in a reasonable time-frame, as there were over 19 million unique email do-mains in the Spamalytics dataset.MX records. We first resolved MX records for each of the19,488,876 domains in our dataset. Of these, 10,371,346(53%) domains did not have an MX record registered inthe DNS. We observe that a large number of domainsare using third-party mail services such as gmail, whichpartially explains the low number of MX records found.We also suspect that the large number of unregistereddomains is largely due to churn over the last four yearssince the Spam was originally sent. We performed theDNS resolutions twice to verify that our UDP probes werenot dropped due to congestion; our second measurementround only found a small percentage increase in responses(.1% of total domains), indicating that packet loss was nota problem.A records. We then resolved A records for each listedMX server, and found 4,843,504 unique IP addresses(46.7% of MX records). It appears that many MX serversdo not have an associated A record. We again performedthe resolution twice to verify that our probes were not ex-periencing packet loss, and found only a small increase insuccessful responses on the second measurement round.Geolocation. Finally, we geolocated these IP addresses toa particular country using MaxMind’s DNS-name basedgeolocation database [17]5 Our results are shown in aheat-map in Figure 2. In the figure, red signifies therewere no servers in those countries, darker colors signifymore servers. As can be observed a majority of theseservers are in the United States. Figure 3 shows the dis-tribution of MX servers across different locations. Whileonly 0.1% of the servers are in low income countries, and1.3% of servers are in lower-middle income countries, webelieve these numbers reflect the actual truth on where ITinfrastructure is located. Overall our data contained over8.3 million servers, and hence we find that about 20000 ofthese servers are located in low and lower-middle incomecountries, which should be a sufficient population for usto draw some conclusions from our data.Correlation. The positive delivery reports from users’
5We are not overly concerned with the accuracy of this geolocationmethod, since we are only interested in categorizing the location of MXservers by broad economic classification
0
100000
200000
300000
400000
500000
600000
0 5 10 15 20 25 30 35
Bot
ID #
Time after start (days)
0
100000
200000
300000
400000
500000
600000
0 5 10 15 20 25 30 35
Bot
ID #
Time after start (days)
Figure 1: Each point represents a batch of spam instruc-tions (top) or delivery reports (bottom) seen in dataset.Bot ID # is an arbitrary unique identifier assigned to eachbot. Horizontal empty spaces signify a bot that was seeninfrequently in the dataset.
mail servers are delivered asynchronously back to thesending worker, which reports them back to the originalproxy. Since workers might be talking to more than oneproxy over the period of observation, there are successfulreports for which we have no corresponding instruction,and there might be instructions for which we have beenunable to observe successful delivery. To reduce bias be-cause of these effects, we first filter out all instructionsand reports associated with workers for whom we don’thave at least one instruction, and one report, i.e.a workermust appear to have both reported successful delivery atsome point, and received instructions at some point. Fur-thermore, we eliminate all successful report for which wedon’t have a corresponding instruction.
In order for the spammer to obtain a conversion, theirspam message must get through three main filtering steps:
1. The spam message must be accepted by the recipi-ent’s mail server, bypassing IP blacklisting.
2. The message must reach the recipient’s inbox, by-passing content-based filtering.
3

Figure 3: Location of MX servers by income level
3. The user must deem the message worthy of their at-tention, bypassing user training and education.
Our data includes messages that bypass filters (1) and(3). Without visibility into individual mail servers, wehave no way of knowing what spam messages were deliv-ered by then filtered based on their content before beingpresented to the user.
We separately looked at the batch structure of instruc-tions and reports, and used that to investigate the preva-lence of blacklisting.
3.1 Assumptions
Recall that our goal is to verify whether there is correla-tion between the sophistication of anti-spam IT infrastuc-ture and the economic standing of the country in whichthe mail server resides. In answering this questions wemake the following assumptions:
1. Spam filtering occurs either before a spam messageis positively accepted by by users’ mail server (IPblacklisting) or before the email enters users’ maininboxes (Bayesian filtering), but not at any otherpoint.
2. The organization responsible for configuring anti-spam protection for a domain is located in the samecountry as the geolocation result of the IP address ofthe domain’s MX server.
3. All email users are equally likely to click on a spammessage given that it has appeared in their inbox.
4 MethodologyIn this section we present the analysis we performedto verify our hypothesis: we examined spam delivery(§4.1) and click (§4.2) rates normalized by country, theprevalance of explicit anti-spam mechanisms (§4.3), ev-idence of IP blacklist additions over time (§4.4), and fi-nally the relative age of SMTP server version numbers(§4.5).
4.1 Spam Delivery RatesDirectly measuring security sophistication of mail serversis hard since countermeasures in use do not necessarilyexpose a publicly visible signature. Given this shortcom-ing, we rely on a measurement of the probability that amail server accepts spam e-mail as one of our metrics ofsecurity sophistication. It is possible that a mail servermight accept an e-mail that is filtered out by Bayesianfiltering further down the line, however these effects arenearly impossible to measure without user involvement.There might also be other reasons, for instance a non-existent username, for mail delivery failing; given a suf-ficiently large sample, these effects should have minimaleffect on our results.
We rely on data collected for the Spamalytics [3]project, as described previously. The Spamalytics data iscollected by interposing between the botmaster’s HTTPproxies and worker bots by controlling a few of the proxybots. Worker bots can connect to several proxy bots, manyof which are not under observation. This implies that thereare instructions for which we receive no delivery reports,and there are delivery reports for which we have no in-structions. While one cannot correct for these sources ofbias completely, we attempt to reduce their effect in a cou-ple of ways. Firstly we only use entries for worker botsfor which we have both instructions, and successful de-livery reports. It is possible that filtering in this mannermight eliminate cases where a bot receives no successfulresponses, however the chances of this should be reason-ably low. Such filtering eliminates 11% of the instruc-tions, and 9% of reports. In addition, we also filter anyreports for which we do not have a corresponding request.In particular we eliminate reports for those usernames,and domains for which we did not observe an instruction.This eliminates 6% of the reports.
We show our results from these computations in Fig-ure 4, binned by income levels as defined by the WorldBank [19]. Each bar represents spam delivery rates forcountries in a particular income group. One can observethat the rates are fairly similar, and that no obvious corre-lation can be observed between income levels and delivery
4

Unknown
36% 3% 0%
Figure 2: A heat map showing the location of MX servers in our data. The colors show the percentage of all MXservers in our data located in a certain country
High Income Middle Income Low Income0.00
0.05
0.10
0.15
0.20
0.25Global Accept Rates By Development Level
Figure 4: Spam Delivery Rates grouped by Income
rates.
4.2 Clickthrough rates
In addition to spam instructions and delivery reports,we also had access to visitor logs from the fake spamwebsite run by the Spamalytics researchers. While theanonymized data did not allow us to correlate deliveryreports with visitors, we decided to measure probabilitythat someone clicks on a link given a delivery report. Thismeasurement provides an estimate of how much spam thatis delivered to a server is likely to actually be seen. In par-
Figure 5: Location of visitors by income level
ticular, once an MX server accepts an e-mail, the e-mailmight still be subject to content-based filtering and otherfilters which might prevent a user from looking at a spame-mail. While it is also possible that user education alsocontributes to the likelihood that an individual in a par-ticular country would click on a link, we have no data tomeasure this, particularly given the high variance in usereducation that could exist worldwide.
As stated in the Spamalytics paper, the authors ob-served relatively few visitors to their website comparedto the volume of spam messages sent. This lack of visi-tors makes it harder to analyze some of this data given thesources of bias listed above. Figure 5 gives a breakdown
5

High Income Middle Income Low Income0.0000
0.0002
0.0004
0.0006
0.0008
0.0010
0.0012Global Click Rates By Development Level
Figure 6: Click Rates by Income Levels
of where visitors came from, however our click log con-tains about 43,000 data points, and hence any conclusionswe draw from these logs might be suspect. Figure 6 showsthe observed click-rates. While the probability does ap-pear to increase, one should note that these numbers varybetween 0.02% and 0.1%, and are based on about a 170click events for low income countries. We believe the datashows that the probability of visiting a page from coun-tries with disparate income levels is roughly identical, andthat we have no indication that there exists a correlationbetween income levels and click-through rates.
4.3 Explicit antispam deployment ratesOne direct way to measure usage of anti-spam technologyis to simply harvest obvious clues of anti-spam usage fromDNS records for mail servers. While most mail servershave generic MX record names (e.g., mx.example.com),several mail server names were explicitly set with spam inmind. For every email domain from our original datasetof Storm instructions, We harvested mail servers whosename contained the words “spam”, “fakemx”, or “bar-racuda”, as well as those whose MX record mapped tolocalhost.
These keywords are not a comprehensive set of all in-dications that a mail server is configured to block spam,but they do offer a basic indication of deployment ratesof anti-spam technologies. In terms of language support,our dataset only contains domain names that use Englishcharacters. While we do use names of servers in non-English speaking countries, “spam” appears to be a com-monly borrowed word from English. 6
6For example, the relevant page in the language-specific Wikipedia
0
0.02
0.04
0.06
0.08
0.1
0.12
0 10 20 30 40 50 60 70 80 90
Est
. ra
te o
f dom
ain
s usi
ng a
nti
-spam
GDP (PPP) per capita (thousands)
Figure 7: Anti-spam deployment rates versus GDP (PPP)per capita.
We considered all MX domain names which containedthe words “spam”, “fakemx”, or “barracuda” to be indica-tive of domains which employed anti-spam technology.In addition, we also considered mail servers whose MXrecord mapped to localhost to be configured to preventspam. We found approximately 190,000 unique domainswhose mail servers matched these filters; these domainswere distributed across 117 countries.
Figure 7 shows the relationship between percentage ofdomains which show evidence of anti-spam usage percountry versus each country’s GDP (PPP) per capita. Us-ing a linear regression, we found r2 < 0.0001 (Pearsoncorrelation), suggesting no correlation between these twovariables. With the weaker Spearman rank correlation co-efficient, we obtained ρ = 0.145, again not statisticallysignificant.
Admittedly, our set of filters is likely quite noisy: cer-tainly many anti-spam devices don’t advertise their ex-istence in their MX record, and many anti-spam devicesthat do advertise were not included in our filter. In orderto determine whether this low correlation resulted fromsuch noise, or if there were some tenuous underlying rela-tionship, we analyzed how the Spearman coefficient valuechanged as additional data was added to the plot. In-tuitively, if there were some underlying relationship be-tween these two variables, the explanatory power of theindependent variable (in this case, GDP per capita) shouldremain constant as more data is added. In contrast, if therewere actually no relationship, we would expect that thecorrelation coefficient would tend towards zero as moredata was added. Indeed, the latter is what we observe, asshown in Figure 8. The fact that ρ varies between posi-tive and negative before tending towards zero lends cre-dence to the lack of any relationship between these two
for French, German, and Spanish is titled “spam”.
6

-0.3
-0.2
-0.1
0
0.1
0.2
0.3
0.4
0.5
0.6
0 10 20 30 40 50 60 70 80 90
rho
rank
Correlation vs. Rank
Figure 8: Spearman rank correlation coefficient versusrank included in calculation. Countries were ranked byGDP (PPP) per capita, and the correlation coefficient wascalculated for each of the top N countries, where N > 3.
variables.
4.4 Evidence of Blacklist Additions OverTime
If a domain is using IP blacklisting, it is likely to acceptspam from a bot at first, and then stop accepting spamfrom that bot after it “learns” the bot’s IP address is thatof a spammer. This suggests a method to infer evidenceof blacklist usage by a domain given a log of sent spamand spam delivery reports.
We can directly apply the structure of the Storm botnetdata to employ this method. Storm issues spamming in-structions in batches, and bots report successful deliveriesin batches as well. If we see a delivery report from a do-main, but see no further responses to subsequent deliveryinstructions, we define the domain as having “evidence ofblacklist usage” (EBL).
As with all our metrics, this is only a rough estimate.The fact that our dataset may be missing arbitrary batchesof both instructions and reports means that we may over-estimate blacklist usage, since a missing batch of reportscould cause a domain to meet our definition of EBL.Moreover, our definition of EBL does not capture all be-haviors of a site that using blacklisting. For example, asite could subscribe to a blacklist feed on which a bot ispresent before that bot ever sends the site spam; in ourdata, this would manifest itself as simply an unacknowl-edged delivery attempt, and could cause the site to showno EBL. Similarly, a bot may avoid being added to ablacklist long enough for it to send a site multiple batchesof spam. In this case, the site would be in fact usingblacklisting, but because we cannot differentiate between
0.001
0.01
0.1
1
100 1000 10000 100000
% o
f dom
ain
s
GDP (PPP) per capita
Figure 9: Percentage of domains showing evidence ofblacklist usage per country versus GDP (PPP) per capita.Note the log/log axes.
a blocked delivery, a failed delivery, and simply a missingbatch of spam delivery reports, we cannot include suchbehavior in our definition of EBL. As before, we only con-sidered in this analysis bots for which we observed bothspam instructions and spam delivery reports, which re-moved approximately 1,000 domains from consideration(these were domains which were only included in spaminstructions or delivery reports for bots from which weonly saw one type of report). Nevertheless, this metricprovides a rough estimate that should manifest our origi-nal hypothesis if it in fact were to hold.
Figure 9 shows the result of this analysis. Once again,we find only weak negative correlation between EBL ratesand per capita income: r2 = 0.195 for linear regressionusing log/log scales. We note that we obtained a strongercorrelation using this exponential model rather than a lin-ear model (r2 = 0.113).
4.5 SMTP Server Version
It is considered best system administration practice tocontinually update software versions as new securitypatches are released. As an additional method of test-ing our hypothesis that the sophistication of IT infrastruc-ture differs by a country’s economic standing, we gatheredSMTP transfer agent version numbers for all MX serversin our dataset. If SMTP servers administrated in the de-veloping world are running out-of-date software versions,it is likely that those domains also lack sophisticated spamblacklisting infrastructure.
Upon initiating a connection, SMTP servers are re-quired to display their software agent, per RFC 2121.We initiated TCP connections to port 25 for all 1,599,979unique mail server IP addresses in our dataset. Of these,
7

- SM-H SM-M SM-L EX-H EX-M EX-LRank1 08/06 (24.06%) 08/06 (28.33%) 08/06 (55%) 04/07 (62.94%) 04/07 (76.42%) 04/07 (90.0%)Rank2 07/04 (15.493%) 12/09 (18.19%) 07/04 (10.84%) 10/08 (30.43%) 10/08 (15.82%) 10/08 (10.0%)Rank3 05/08 (12.80%) 05/08 (10.25%) 07/04 (10.00%) 05/11 (5.52%) 11/09 (3.40%) N/A (0.00%)
Total 31543 5459 120 73508 6016 20
Table 1: SMTP version numbers for Sendmail and Exim. H, M, and L stand for “High Income”, “Medium Income”,and “Low Income”, respectively.
we were able to successfully connect to 684,114 (42.7%).We suspect however that our connection attempts wererate-limited at some point, since a second run of the mea-surements uncovered many more successful connections.The detailed results of the STMP agents we found areshown in the appendix.
We examined variation in version numbers for the toptwo most popular SMTP servers that displayed versionnumbers in Table 1, Exim and Sendmail. Our results showthat there is very little variance in SMTP software versionnumbers across economic boundaries.
5 Discussion
The analysis discussed previously indicates that the Spa-malytics data, does not indicate a correlation between acountries income levels and the sophistication of spamprevention infrastructure in that country. As we explain inthe next subsection, some of our analysis might be coloredby changes in the landscape since 2008, when the origi-nal data was collected, however nothing we have foundwould indicate that there is such a correlation. One poten-tial explanation for this, based on observations about ver-sions of SMTP servers, is that most low, and lower-middleincome countries have relatively new infrastructure, andbecause of the model used by the software industry, andopen source software, new infrastructure relies on deploy-ing software that is current at that point. For instance, forboth Sendmail and Exchange we saw a little more than10 different versions for Low Income countries, while forHigh Income countries over 60 versions were reported.In addition the rise of e-mail outsourcing services likeGoogle Apps, and others, which will handle e-mail for anorganization for free, makes it less likely that an entity ina low income country would want to maintain their ownSMTP servers, rather than shipping the responsibility tocompanies like Google, which tend to have better infras-tructure, and care more about security. For the rest of thissection, we reiterate what each of our measurements wasattempting to show, show links between them, and afterthat we discuss some shortcomings of our methodology.
Our methodology for establishing correlation betweenincome levels and sophistication of anti-spam measuresrelied on measuring the effect of infrastructure at twoplaces. Firstly we wanted to see if there was a correla-tion between delivery rates, i.e.the probability that spame-mail sent to a user on a server in a particular coun-try will actually be accepted by the receiving MX server.This rate indicates whether DNS blacklisting is used bymail servers, and how frequently these blacklists are up-dated. Our results seem to indicate that these numberslook similar for high and low-income countries, and arein fact lower for middle income countries. This generallyleads us to conclude that there is not a correlation betweenincome and the use of DNS blacklisting.
DNS blacklisting is however relatively easy to deployand use, and uses little in terms of computational power.Our next metric looked at clickthrough rates for spam.Even after a MX server accepts an e-mail, the e-mailmight still be subject to Bayesian filtering, or other anti-spam techniques, and might in fact have been accepted asa way to carry our counter-intelligence, and train such fil-ters. If e-mail is accepted for any of these reasons, or isfiltered by any of these filters, it is unlikely to lead some-one to visit the website. Since each URL was crafted fora specific e-mail address, it is unlikely that there are othersources of traffic clouding these measurements. Given theassumption that most users are equally likely to visit suchlinks upon receiving spam, we would expect countrieswith worse infrastructure to have higher click throughrates. While our analysis does show a small steady in-crease in clickthrough rates as income levels fall, these in-creases are modest, and might reflect the smaller amountof data available for this method. While it is hard to drawany conclusions given the paucity of data, and the smallprobabilities, it does not appear that a user on a server lo-cated in a low income country is significantly more likelyto see spam when compared to someone on a server lo-cated in a significantly richer country. This seems to in-dicate that the people who do run their own servers areequally likely to invest in computational infrastructure, fil-tering products, and other such security infrastructure.
Given these negative results, and the noisy data we had
8

access to, we also attempted to cross-validate our resultsby trying to directly quantify the prevalence of filteringtechnology across countries. In particular we measureddeployment rates for servers specifically dedicated to anti-spam activity, evidence of blacklist usage, and looked intowhat agents were used in various countries. The deploy-ment rates for anti-spam measures helps quantify howmuch investment is made directly towards detecting, andpreventing spam, and given that these measures might re-quire dedicated machines, and maintaining software thatisn’t essential to the functioning of an organization, suchdeployments are a direct economic measure of investmenttowards preventing spam. We find no evidence that one ismore likely to find these counter-measures in richer coun-tries vs poorer ones, thus reinforcing our findings so far.
The structure of instructions and responses from Stormallows us to try and see if there is evidence that DNSblacklisting is in fact used at a site. This informationhelps cross-validate our results for delivery rates, sinceour original explanation for why delivery rates might varywas based on the effect of DNS blacklisting. Our resultsseemed to indicate a weak negative correlation betweenincome and blacklist usage, and thus reinforce our find-ings thus far. We also looked at version numbers for MXagents in various countries, to see if poorer countries weresignificantly more likely to use older, and hence less se-cure versions. While many agents do not advertise ver-sion information, in cases where we did find version infor-mation, the versions used in the developing word did notdiffer significantly from versions in the developed world.Also while these versions were not always the newest,with the most prevalent Sendmail version being over 6years old, we believe this might reflect established best-practices with regards to versions which are particularlysecure, or are better tested. None of our cross-validationseems to have indicated anything different from our orig-inal results.
5.1 Shortcomings of methodology
Much of our analysis is based on information gathered bythe Spamalytics project over 4 years ago, and on serverinformation gathered by us over the last few months. Thisdifference in time period might significantly affect our re-sults, since the current global distribution of servers mightbe vastly different today, especially given that serviceslike Google Apps were not popular in early-2008. Fur-thermore, over this time period many of these sites mighthave updated their software, and perhaps a study donenow would observe significantly different delivery rates,thus leading to vastly different results.
Our data is extremely noisy. In particular a failure todeliver to a particular SMTP server can mean multiplethings, including DNS blacklisting, a temporary problemwith the server, an invalid username, or other problems.Furthermore, acceptance by a SMTP server might not nec-essarily mean that e-mail has not been blacklisted, andis not being accepted by specialized devices for trainingspam filters or for other reasons. While our measures ofdelivery rates are good approximations for the actual rate,we do not have a good way of correcting for these biases,nor for measuring how likely they are.
Lastly, only a small percentage of our data comes fromlow income, and lower-middle income countries, both ofwhich are groups of interest for this study. While this dis-tribution is reasonable given economic factors, availableinfrastructure, and other factors, this might have signifi-cant effects on our results.
6 ConclusionThis paper showed that there is no evidence to supportthe hypothesis that spam is more prevalent on servers inpoorer countries when compared with richer ones. We dothis by showing a lack of correlation between spam de-livery rates and income levels, and between clickthroughrates and income levels. We further validate our results bylooking at prevalence of anti-spam measures, use of DNSblacklisting and versions of MX servers used in countrieswith varying income levels. Our analysis fails to find anysupport for the hypothesis, and all our metrics seem toindicate that anti-spam measures are spread fairly evenlyacross countries.
As future work it would be interesting to measure theprevalence of other security measures across countrieswith different economic situations. In particular mailservers are usually owned by large companies providinginfrastructure to a wide variety of people, and are perhapsmore likely to be maintained similarly across countries,as opposed to personal computers, or other targets ownedby individuals. Another possible direction for future workwould be to carry out this analysis with more recent data,so that the measured delivery rates reflect software cur-rently in use.
References[1] J. Caballero, C. Grier, C. Kreibich, and V. Paxson,
“Measuring pay-per-install: the commoditization ofmalware distribution,” in Proceedings of the 20thUSENIX conference on Security, SEC’11, 2011.
9

[2] K. Levchenko, A. Pitsillidis, N. Chachra, B. Enright,M. Felegyhazi, C. Grier, T. Halvorson, C. Kanich,C. Kreibich, H. Liu, et al., “Click trajectories: End-to-end analysis of the spam value chain,” in Securityand Privacy (SP), 2011 IEEE Symposium on, IEEE,2011.
[3] C. Kanich, C. Kreibich, K. Levchenko, B. Enright,G. M. Voelker, V. Paxson, and S. Savage, “Spam-alytics: an empirical analysis of spam marketingconversion,” in Proceedings of the 15th ACM con-ference on Computer and communications security,CCS ’08, 2008.
[4] C. Kanich, N. Weaver, D. McCoy, T. Halvorson,C. Kreibich, K. Levchenko, V. Paxson, G. Voelker,and S. Savage, “Show me the money: Characteriz-ing spam-advertised revenue,” in Proceedings of the20th USENIX Security Symposium, San Francisco,CA, 2011.
[5] A. Ramachandran, D. Dagon, and N. Feamster, “Candns-based blacklists keep up with bots?,” in CEAS,2006.
[6] C. Dietrich and C. Rossow, “Empirical research onip blacklisting,” in CEAS, 2008.
[7] J. Jung and E. Sit, “An empirical study of spam traf-fic and the use of dns black lists,” in Proceedingsof the 4th ACM SIGCOMM conference on Internetmeasurement, IMC ’04, 2004.
[8] A. Ramachandran, N. Feamster, and D. Dagon, “Re-vealing botnet membership using DNSBL counter-intelligence,” in Proceedings of the 2nd conferenceon Steps to Reducing Unwanted Traffic on the Inter-net - Volume 2, 2006.
[9] A. Brodsky and D. Brodsky, “A distributed contentindependent method for spam detection,” in Pro-ceedings of the first conference on First Workshopon Hot Topics in Understanding Botnets, 2007.
[10] OECD Task Force on Spam, “Spam Issues in Devel-oping Countries,” tech. rep., Organization for Eco-nomic Co-operation and Development, 2005.
[11] W. Chigona, A. Bheekun, M. Spath, S. Der-akhashani, and J. Van Belle, “Perceptions on spamin a south african context,” Internet and InformationTechnology in Modern Organisations: Challenges &Answers, vol. 2069, 2005.
[12] “M86 security Labs, Spam source by country.””http://www.m86security.com/labs/spam statistics.asp”,2011.
[13] S. Kannan, “Social networking sites prone to virusattacks,” The Hindu, 2009.
[14] J. Burrell, “Problematic empowerment: West africaninternet scams as strategic misrepresentation,” In-formation Technologies and International Develop-ment, vol. 4, no. 4.
[15] E. Katz-bassett, J. P. John, A. Krishnamurthy,D. Wetherall, T. Anderson, and Y. Chawathe, “To-wards IP geolocation using delay and topology mea-surements,” in In IMC, 2006.
[16] N. Spring, R. Mahajan, and T. Anderson, “Quanti-fying the causes of path inflation,” in IN ACM SIG-COMM, 2003.
[17] “Maxmind Inc.”
[18] “Vicci: A programmable cloud-computing researchtestbed.,” 2011.
[19] “Country Income Groups (World Bank Classifica-tion),” 2011.
7 AppendixWe show the popularity of SMTP transfer agents acrossour dataset in Figure 7. We were able to initiate a TCPconnection with 684,114 out of 1,599,979 (42.7%) uniquemail server IP addresses in our dataset. The table showthat there is a long tail of SMTP transfer agents.
10
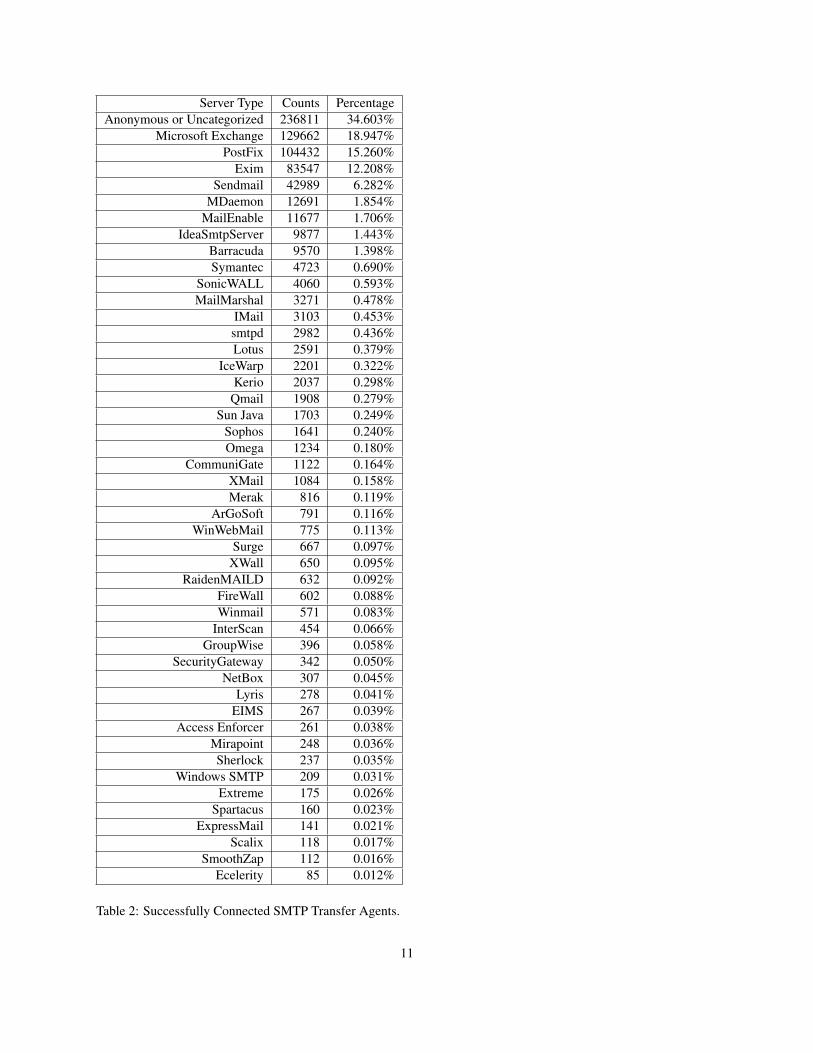
Server Type Counts PercentageAnonymous or Uncategorized 236811 34.603%
Microsoft Exchange 129662 18.947%PostFix 104432 15.260%
Exim 83547 12.208%Sendmail 42989 6.282%
MDaemon 12691 1.854%MailEnable 11677 1.706%
IdeaSmtpServer 9877 1.443%Barracuda 9570 1.398%Symantec 4723 0.690%
SonicWALL 4060 0.593%MailMarshal 3271 0.478%
IMail 3103 0.453%smtpd 2982 0.436%Lotus 2591 0.379%
IceWarp 2201 0.322%Kerio 2037 0.298%Qmail 1908 0.279%
Sun Java 1703 0.249%Sophos 1641 0.240%Omega 1234 0.180%
CommuniGate 1122 0.164%XMail 1084 0.158%Merak 816 0.119%
ArGoSoft 791 0.116%WinWebMail 775 0.113%
Surge 667 0.097%XWall 650 0.095%
RaidenMAILD 632 0.092%FireWall 602 0.088%Winmail 571 0.083%
InterScan 454 0.066%GroupWise 396 0.058%
SecurityGateway 342 0.050%NetBox 307 0.045%
Lyris 278 0.041%EIMS 267 0.039%
Access Enforcer 261 0.038%Mirapoint 248 0.036%Sherlock 237 0.035%
Windows SMTP 209 0.031%Extreme 175 0.026%
Spartacus 160 0.023%ExpressMail 141 0.021%
Scalix 118 0.017%SmoothZap 112 0.016%
Ecelerity 85 0.012%
Table 2: Successfully Connected SMTP Transfer Agents.
11