Embed Size (px)
Citation preview
SHORT COMMUNICATION
Acclimation of clusterbean cotyledon to UV-B radiationin the presence of UV-A: partial restoration of photosyntheticenergy balance and redox homeostasis
Padmanava Joshi • Sasmita Gartia •
Manoj Kumar Pradhan • Srikanta Panigrahi •
Lalitendu Nayak • Basanti Biswal
Received: 20 May 2012 / Revised: 17 February 2013 / Accepted: 18 February 2013 / Published online: 7 March 2013
� Franciszek Gorski Institute of Plant Physiology, Polish Academy of Sciences, Krakow 2013
Abstract The photosynthetic responses of clusterbean
(Cyamopsis tetraganoloba) cotyledons exposed to UV-A,
UV-B or UV-A ? UV-B radiation for 1 h daily until day
10 have been compared. The loss in the rate of O2 evolu-
tion and CO2 assimilation (Pn) are incommensurate with
each other in both UV-A and UV-B exposed samples
indicating the occurrence of loss in photostasis of photo-
synthesis by these two radiation bands. The alteration in
redox status of QA further suggests about a loss in redox
homeostasis in the photosynthetic electron transport chain.
However, both photochemical efficiency of PS II and Pn
are well maintained in UV-A ? UV-B exposed cotyledons
in spite of reduction in water-use efficiency. The accli-
matization of clusterbean cotyledon to UV-B radiation in
the presence of UV-A has been attributed to accumulation
of flavonoids, increase in stomatal conductance (gs) and
reduction in functional size of PS II.
Keywords Chlorophyll fluorescence induction �Photosystem II � Photostasis � Redox homeostasis �Thermoluminescence � Thylakoid
Introduction
The photosystem II (PS II) of the photosynthetic apparatus
has been identified to be the primary target of ultraviolet-B
(UV-B) radiation and the electron carriers on both reduc-
ing and oxidizing sides of PS II are damaged to different
levels (Melis et al. 1992; Vass et al. 2005; Joshi et al.
2011). Consequently, the rate at which PS II reaction
centers are closed through photochemistry is different from
the rate at which they are opened through redox bio-
chemistry. This difference induces a loss in balance
between the energy absorbed by PS II through photo-
physical process and the energy utilized for carbon
assimilation resulting in a loss in photostasis of photo-
synthesis leading to the metabolism of reactive oxygen
species (ROS) (Joshi et al. 2011).
Some topical findings, however, suggest that the pres-
ence of UV-A radiation mitigates the negative impact of
UV-B radiation on photosynthesis (Lud et al. 2002; Joshi
et al. 2007). The alleviation of UV-B-induced damage
could be brought forth through acclimation, defense and/or
repair mechanisms and these mechanisms are modulated
by UV-A radiation (Mohr and Schopfer 1995). The plant
sensitivity and photomorphogenic responses to UV-B
radiation are also influenced by UV-A radiation (Krizek
2004).
However, no attempt has been made to examine if
UV-A radiation, a natural concomitant of UV-B, does play
any role in the acclimation of photosynthetic apparatus to
UV-B-radiation. Therefore, our objectives have been to
differentiate the effects of UV-A on the redox homeostasis
and the energy source and sink relationship of the photo-
synthetic apparatus from those of UV-B discretely and
to examine if UV-A exposure modulates the process of
acclimation of clusterbean cotyledons to UV-B radiation.
Communicated by K. Trebacz.
P. Joshi (&) � S. Gartia � M. K. Pradhan � S. Panigrahi �L. Nayak
Anchal College, Padampur, Rajborasambar,
Bargarh 768036, Odisha, India
e-mail: [email protected]
S. Gartia � B. Biswal
School of Life Sciences, Sambalpur University,
Jyotivihar, Sambalpur 768019, Odisha, India
123
Acta Physiol Plant (2013) 35:2323–2328
DOI 10.1007/s11738-013-1245-6
Materials and methods
Plant materials and UV exposures
Clusterbean (Cyamopsis tetragonoloba L.) seedlings were
grown in different Petri plates on cotton soaked with dis-
tilled water under white light and were exposed to either
UV-A (Philips TL 20, Type 09, 320-400 nm with peak at
365 nm, 75 lmol m-2 s-1), UV-B (Philips TL-20, Type
05, 280-315 nm with peak at 315 nm, 60 lmol m-2 s-1)
or UV-A ? UV-B (UV-A and UV-B radiation simulta-
neously) for 1 h daily from day 1 to 10 as described by
Joshi et al. (2007). The intensity of UV-B used in this work
is much above the level of UV-B in nature so that its
damaging effects are not marginalized subsequently during
growth of seedlings in white light. In a previous work
(Joshi et al. 2007), it has been shown that the cotyledons
follow the developmental pattern of juvenile phase up to
day 6 and steady phase from day 7 to 10 followed by
declining senescence phase. Thus, different biochemical
and biophysical measurements were conducted on day 10
within an hour of the exposures.
Measurement of photosynthetic pigment and isolation
of chloroplasts
Pigments extracted from cotyledons of clusterbean seed-
lings with 100 % chilled acetone were used for determi-
nation of chlorophyll (Chl) and carotenoids (Car) as
described by Wellburn and Lichtenthaler (1984).
Chloroplasts were isolated from cotyledons of cluster-
bean seedlings following the method of Izawa and Good
(1968)
Estimation of malondialdehyde (MDA) and flavonoids
Thylakoid lipid peroxidation was quantified in terms of
accumulation of MDA as described by Panda et al. (1987).
Accumulation of flavonoids in cotyledons was estimated
following the methods of Flint et al. (1985).
Measurement of O2 evolution from cotyledons
and from isolated chloroplasts
Photosynthetic oxygen evolution was measured directly
from the cotyledons with a leaf disk electrode unit (LD 2/3,
Leaf lab 2, Hansatech, UK).
O2 evolution from isolated chloroplasts in 30 mM Na/K
phosphate basic assay buffer (pH 7.2) containing 30 mM
NaCl and 200 mM sucrose with 0.3 mM of 2,6-dichloro-
benzoquinone (DCBQ), as an electron acceptor, was
measured with a Clark-type oxygen electrode at 21 �C in
rate-saturating red light. Chloroplasts containing 40 lg Chl
were placed in 2 mL of reaction mixture for the measure-
ment. Gramicidin (2.5 lM) was used as an uncoupler.
Measurement of PAM fluorescence
Fluorescence transient and different fluorescence parame-
ters were measured with a PAM fluorometer (FMS-1,
Hansatech, UK) from cotyledons of clusterbean seedlings
according to Schreiber et al. (1986).
Gas exchange measurement
The stomatal conductance (gs), internal CO2 concentration
(Ci), rate of evaporation (E) and the rate of CO2 assimi-
lation (Pn) were measured from the cotyledons of cluster-
bean seedlings with the help of an infrared gas analyzer
(CIRCAS 2 pp system, Hitchin, UK) fitted with an ergo-
nomic Parkinson’s universal leaf cuvette PLC6 (U). Water-
use efficiency (WUE) and intrinsic water-use efficiency
(IWUE) were calculated as Pn/E and Pn/gs respectively.
Measurement of thermoluminescence (TL) glow curves
Isolated chloroplasts containing 100 lg Chl mL-1 in
the presence of 3-(3,4-dichlorophenyl)-l,1-dimethyl urea
(DCMU) at a concentration of 10-5 M were frozen to liquid
nitrogen temperature under continuous illumination of
4.5 lmol m-2 s-1 and then TL curves were obtained by
heating the sample at 0.22 �C s-1 following the method of
Desai et al. (1971). Activation energy (EA) of different peaks
was calculated using Chen formula:
EA ¼ 2:29 kT2m=DT
where DT is the temperature difference at half intensity of
glow peak (Tatake and Desai 1981).
Statistical analyses were conducted following the
method described by Simpson et al. (1960).
Results and discussion
The changes in gs, Ci and Pn in 10-day-old cotyledons of
clusterbean seedlings with UV-A, UV-B or UV-A ? UV-
B exposure are described in Table 2. The level of Pn
decreased by 14.5 % (p \ 0.01) in UV-B exposed sample
but it increased marginally in UV-A exposed one (2.4 %;
p \ 0.05). No significant effect on Pn was observed in UV-
A ? UV-B exposed cotyledons. Analyses of gas exchange
data reveal that UV-B-exposure diminishes Pn in spite of a
significant rise in Ci (35.6; p \ 0.005) and gs (38.31;
p \ 0.005). The finding is in conformity with the earlier
report of Sullivan and Teramura (1990) in soybean. On the
contrary, Albert et al. (2005) have observed no change in
2324 Acta Physiol Plant (2013) 35:2323–2328
123
Pn despite a significant rise in Ci and gs in response to UV-
B radiation. Thus, it is perceptible that the inhibition of PS
II and structural damage of chloroplasts have major con-
tribution to UV-B-induced decline in photosynthesis of
clusterbean cotyledon.
Both UV-A and UV-B radiations have damaging effects
on the photosynthetic apparatus of green plants (Melis et al.
1992; Vass et al. 2002, 2005; Ivanova et al. 2008; Joshi et al.
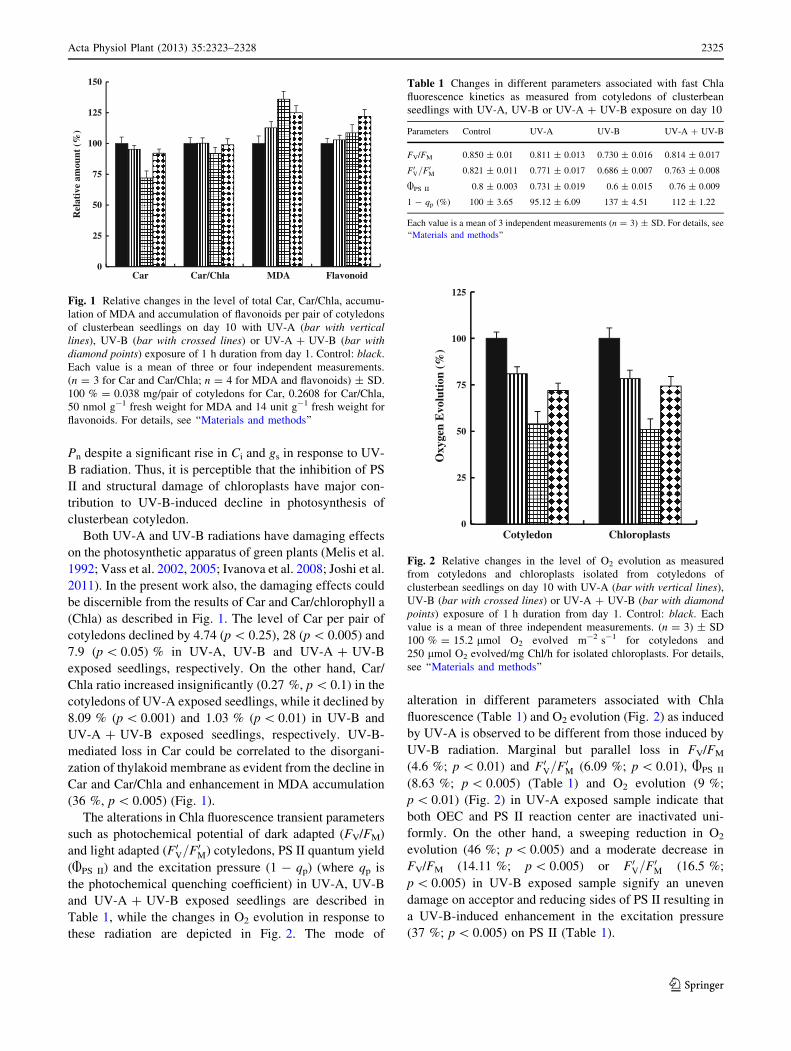
2011). In the present work also, the damaging effects could
be discernible from the results of Car and Car/chlorophyll a
(Chla) as described in Fig. 1. The level of Car per pair of
cotyledons declined by 4.74 (p \ 0.25), 28 (p \ 0.005) and
7.9 (p \ 0.05) % in UV-A, UV-B and UV-A ? UV-B
exposed seedlings, respectively. On the other hand, Car/
Chla ratio increased insignificantly (0.27 %, p \ 0.1) in the
cotyledons of UV-A exposed seedlings, while it declined by
8.09 % (p \ 0.001) and 1.03 % (p \ 0.01) in UV-B and
UV-A ? UV-B exposed seedlings, respectively. UV-B-
mediated loss in Car could be correlated to the disorgani-
zation of thylakoid membrane as evident from the decline in
Car and Car/Chla and enhancement in MDA accumulation
(36 %, p \ 0.005) (Fig. 1).
The alterations in Chla fluorescence transient parameters
such as photochemical potential of dark adapted (FV/FM)
and light adapted (F0V=F0M) cotyledons, PS II quantum yield
(APS II) and the excitation pressure (1 - qp) (where qp is
the photochemical quenching coefficient) in UV-A, UV-B
and UV-A ? UV-B exposed seedlings are described in
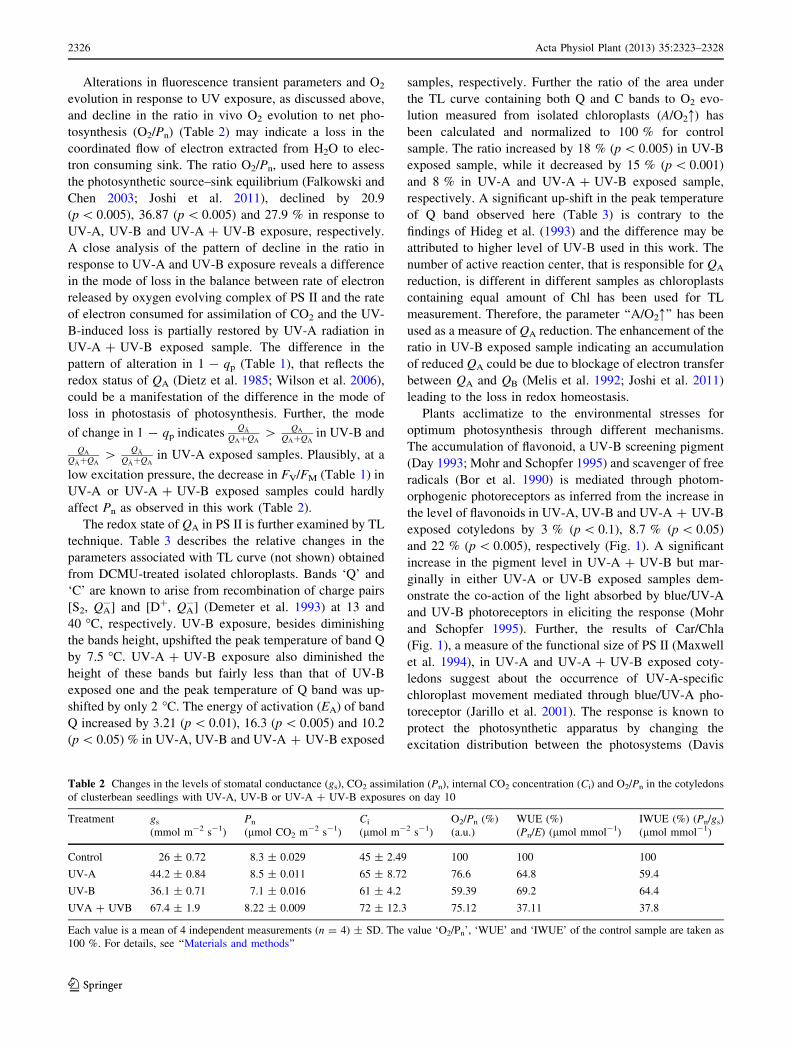
Table 1, while the changes in O2 evolution in response to
these radiation are depicted in Fig. 2. The mode of
alteration in different parameters associated with Chla
fluorescence (Table 1) and O2 evolution (Fig. 2) as induced
by UV-A is observed to be different from those induced by
UV-B radiation. Marginal but parallel loss in FV/FM
(4.6 %; p \ 0.01) and F0V=F0M (6.09 %; p \ 0.01), APS II
(8.63 %; p \ 0.005) (Table 1) and O2 evolution (9 %;
p \ 0.01) (Fig. 2) in UV-A exposed sample indicate that
both OEC and PS II reaction center are inactivated uni-
formly. On the other hand, a sweeping reduction in O2
evolution (46 %; p \ 0.005) and a moderate decrease in
FV/FM (14.11 %; p \ 0.005) or F0V=F0M (16.5 %;
p \ 0.005) in UV-B exposed sample signify an uneven
damage on acceptor and reducing sides of PS II resulting in
a UV-B-induced enhancement in the excitation pressure
(37 %; p \ 0.005) on PS II (Table 1).
0
25
50
75
100
125
150
Car Car/Chla MDA Flavonoid
Rel
ativ
e am
ount
(%
)
Fig. 1 Relative changes in the level of total Car, Car/Chla, accumu-
lation of MDA and accumulation of flavonoids per pair of cotyledons
of clusterbean seedlings on day 10 with UV-A (bar with vertical
lines), UV-B (bar with crossed lines) or UV-A ? UV-B (bar with
diamond points) exposure of 1 h duration from day 1. Control: black.
Each value is a mean of three or four independent measurements.
(n = 3 for Car and Car/Chla; n = 4 for MDA and flavonoids) ± SD.
100 % = 0.038 mg/pair of cotyledons for Car, 0.2608 for Car/Chla,
50 nmol g-1 fresh weight for MDA and 14 unit g-1 fresh weight for
flavonoids. For details, see ‘‘Materials and methods’’
Table 1 Changes in different parameters associated with fast Chla
fluorescence kinetics as measured from cotyledons of clusterbean
seedlings with UV-A, UV-B or UV-A ? UV-B exposure on day 10
Parameters Control UV-A UV-B UV-A ? UV-B
FV/FM 0.850 ± 0.01 0.811 ± 0.013 0.730 ± 0.016 0.814 ± 0.017
F0V=F0M 0.821 ± 0.011 0.771 ± 0.017 0.686 ± 0.007 0.763 ± 0.008
APS II 0.8 ± 0.003 0.731 ± 0.019 0.6 ± 0.015 0.76 ± 0.009
1 - qp (%) 100 ± 3.65 95.12 ± 6.09 137 ± 4.51 112 ± 1.22
Each value is a mean of 3 independent measurements (n = 3) ± SD. For details, see
‘‘Materials and methods’’
0
25
50
75
100
125
Cotyledon Chloroplasts
Oxy
gen
Evo
luti
on (
%)
Fig. 2 Relative changes in the level of O2 evolution as measured
from cotyledons and chloroplasts isolated from cotyledons of
clusterbean seedlings on day 10 with UV-A (bar with vertical lines),
UV-B (bar with crossed lines) or UV-A ? UV-B (bar with diamond
points) exposure of 1 h duration from day 1. Control: black. Each
value is a mean of three independent measurements. (n = 3) ± SD
100 % = 15.2 lmol O2 evolved m-2 s-1 for cotyledons and
250 lmol O2 evolved/mg Chl/h for isolated chloroplasts. For details,
see ‘‘Materials and methods’’
Acta Physiol Plant (2013) 35:2323–2328 2325
123
Alterations in fluorescence transient parameters and O2
evolution in response to UV exposure, as discussed above,
and decline in the ratio in vivo O2 evolution to net pho-
tosynthesis (O2/Pn) (Table 2) may indicate a loss in the
coordinated flow of electron extracted from H2O to elec-
tron consuming sink. The ratio O2/Pn, used here to assess
the photosynthetic source–sink equilibrium (Falkowski and
Chen 2003; Joshi et al. 2011), declined by 20.9
(p \ 0.005), 36.87 (p \ 0.005) and 27.9 % in response to
UV-A, UV-B and UV-A ? UV-B exposure, respectively.
A close analysis of the pattern of decline in the ratio in
response to UV-A and UV-B exposure reveals a difference
in the mode of loss in the balance between rate of electron
released by oxygen evolving complex of PS II and the rate
of electron consumed for assimilation of CO2 and the UV-
B-induced loss is partially restored by UV-A radiation in
UV-A ? UV-B exposed sample. The difference in the
pattern of alteration in 1 - qp (Table 1), that reflects the
redox status of QA (Dietz et al. 1985; Wilson et al. 2006),
could be a manifestation of the difference in the mode of
loss in photostasis of photosynthesis. Further, the mode
of change in 1 - qp indicatesQ�A
QAþQA[ QA
QAþQAin UV-B and
QA
Q�AþQA[ Q�A
Q�AþQAin UV-A exposed samples. Plausibly, at a
low excitation pressure, the decrease in FV/FM (Table 1) in
UV-A or UV-A ? UV-B exposed samples could hardly
affect Pn as observed in this work (Table 2).
The redox state of QA in PS II is further examined by TL
technique. Table 3 describes the relative changes in the
parameters associated with TL curve (not shown) obtained
from DCMU-treated isolated chloroplasts. Bands ‘Q’ and
‘C’ are known to arise from recombination of charge pairs
[S2, QA-] and [D?, QA
-] (Demeter et al. 1993) at 13 and
40 �C, respectively. UV-B exposure, besides diminishing
the bands height, upshifted the peak temperature of band Q
by 7.5 �C. UV-A ? UV-B exposure also diminished the
height of these bands but fairly less than that of UV-B
exposed one and the peak temperature of Q band was up-
shifted by only 2 �C. The energy of activation (EA) of band
Q increased by 3.21 (p \ 0.01), 16.3 (p \ 0.005) and 10.2
(p \ 0.05) % in UV-A, UV-B and UV-A ? UV-B exposed
samples, respectively. Further the ratio of the area under
the TL curve containing both Q and C bands to O2 evo-
lution measured from isolated chloroplasts (A/O2:) has
been calculated and normalized to 100 % for control
sample. The ratio increased by 18 % (p \ 0.005) in UV-B
exposed sample, while it decreased by 15 % (p \ 0.001)
and 8 % in UV-A and UV-A ? UV-B exposed sample,
respectively. A significant up-shift in the peak temperature
of Q band observed here (Table 3) is contrary to the
findings of Hideg et al. (1993) and the difference may be
attributed to higher level of UV-B used in this work. The
number of active reaction center, that is responsible for QA
reduction, is different in different samples as chloroplasts
containing equal amount of Chl has been used for TL
measurement. Therefore, the parameter ‘‘A/O2:’’ has been
used as a measure of QA reduction. The enhancement of the
ratio in UV-B exposed sample indicating an accumulation
of reduced QA could be due to blockage of electron transfer
between QA and QB (Melis et al. 1992; Joshi et al. 2011)
leading to the loss in redox homeostasis.
Plants acclimatize to the environmental stresses for
optimum photosynthesis through different mechanisms.
The accumulation of flavonoid, a UV-B screening pigment
(Day 1993; Mohr and Schopfer 1995) and scavenger of free
radicals (Bor et al. 1990) is mediated through photom-
orphogenic photoreceptors as inferred from the increase in
the level of flavonoids in UV-A, UV-B and UV-A ? UV-B
exposed cotyledons by 3 % (p \ 0.1), 8.7 % (p \ 0.05)
and 22 % (p \ 0.005), respectively (Fig. 1). A significant
increase in the pigment level in UV-A ? UV-B but mar-
ginally in either UV-A or UV-B exposed samples dem-
onstrate the co-action of the light absorbed by blue/UV-A
and UV-B photoreceptors in eliciting the response (Mohr
and Schopfer 1995). Further, the results of Car/Chla
(Fig. 1), a measure of the functional size of PS II (Maxwell
et al. 1994), in UV-A and UV-A ? UV-B exposed coty-
ledons suggest about the occurrence of UV-A-specific
chloroplast movement mediated through blue/UV-A pho-
toreceptor (Jarillo et al. 2001). The response is known to
protect the photosynthetic apparatus by changing the
excitation distribution between the photosystems (Davis
Table 2 Changes in the levels of stomatal conductance (gs), CO2 assimilation (Pn), internal CO2 concentration (Ci) and O2/Pn in the cotyledons
of clusterbean seedlings with UV-A, UV-B or UV-A ? UV-B exposures on day 10
Treatment gs
(mmol m-2 s-1)
Pn
(lmol CO2 m-2 s-1)
Ci
(lmol m-2 s-1)
O2/Pn (%)
(a.u.)
WUE (%)
(Pn/E) (lmol mmol-1)
IWUE (%) (Pn/gs)
(lmol mmol-1)
Control 26 ± 0.72 8.3 ± 0.029 45 ± 2.49 100 100 100
UV-A 44.2 ± 0.84 8.5 ± 0.011 65 ± 8.72 76.6 64.8 59.4
UV-B 36.1 ± 0.71 7.1 ± 0.016 61 ± 4.2 59.39 69.2 64.4
UVA ? UVB 67.4 ± 1.9 8.22 ± 0.009 72 ± 12.3 75.12 37.11 37.8
Each value is a mean of 4 independent measurements (n = 4) ± SD. The value ‘O2/Pn’, ‘WUE’ and ‘IWUE’ of the control sample are taken as
100 %. For details, see ‘‘Materials and methods’’
2326 Acta Physiol Plant (2013) 35:2323–2328
123
and Hangarter 2012). Higher stomatal conductance in
response to UV-A radiation in UV-A and UVA ? UV-B
exposed sample, a UV-A-specific response (Boccalandro
et al. 2011) could also be discerned from the results of gas
exchange measurement (Table 2). The alterations in gs and
Ci as a result of stomata opening lead to a decline in WUE
by 35.22 % (p \ 0.005), 30.8 % (p \ 0.005) and 62.88 %
(p \ 0.005) and in IWUE by 48.65 % (p \ 0.005), 35.6 %
(p \ 0.005) and 63.2 % (p \ 0.005) in UV-A, UV-B and
UV-A ? UV-B exposed samples, respectively.
Author contribution M.K. Pradhan, S. Panigrahi and
L. Nayak conducted biochemical analysis for determina-
tion pigment content, MDA and flavonoids accumulation
while S. Gartia, P.N. Joshi and B. Biswal measured
fluorescence transient, thermoluminescence and net photo-
synthesis.
Acknowledgments We thank Prof. U.C. Biswal for going through
the manuscript and constructive suggestions. We also thank Dr. N.K.
Ramaswamy (NABD, BARC, Mumbai) and Dr. R.K. Iyer (MBAD,
BARC, Mumbai) for providing facilities to carry out TL studies. The
work is supported by UGC, New Delhi, and DST, New Delhi.
References
Albert KR, Ro-Poulsen H, Mikkelesen TN, Bredahl L, Haakansson
KB (2005) Effects of reducing the ambient UV-B radiation in the
high arctic on Salix arctica and Vaccinium uliginosum. Phyton
45:41–49
Boccalandro HE, Giordano CV, Ploschuk EL, Piccoli PN, Bottini R,
Casal JJ (2011) Phototropins but not cryptochromes mediate the
blue light-specific promotion of stomatal conductance, while
both enhance photosynthesis and transpiration under full
sunlight. Plant Physiol 158:1475–1484
Bor SW, HelIer W, Michel C, Saran M (1990) Flavonoids as
antioxidants: determination of radical-scavenging efficiencies.
Methods Enzymol 186:343–355
Day TA (1993) Relating to UV-B radiation screening effectiveness of
foliage to absorbing compound concentration and anatomical
characteristics in a diverse group of plants. Oecologia 96:
542–550
Demeter S, Gouss C, Bernet G, Kovacs L, Petrouleas V (1993)
Participation of the g = 1.9 and g = 1.82 EPR form of the semi
quinone-iron complex QA- Fe2? of photosystem II in the
generation of Q and C thermoluminescence bands, respectively.
FEBS Lett 339:217–221
Desai TS, Sane PV, Tatake VG (1971) Thermoluminescence studies
on spinach leaves and euglena. Photochem Photobiol 21:345–350
Davis PA, Hangarter H (2012) Chloroplast movement provides
photoprotection to plants by redistributing PS II damage within
leaves. Photosynth Res 112:153–161
Dietz KJ, Schreiber U, Huber U (1985) The relation between redox
state of QA and photosynthesis in leaves at various carbon-
dioxides, oxygen and light regime. Planta 166:219–226
Falkowski PG, Chen YB (2003) Photoacclimation of light harvest-
ing system in eukaryotic algae. In: Green BR, Parson WW (eds)
Advances in photosynthesis and respiration: light harvest-
ing antennas in photosynthesis, vol 13. Kluwer, Dordrecht,
pp 423–447
Flint SD, Jordan PW, Caldwell MM (1985) Plant protective response
to enhanced UV-B radiation under field condition. Photochem
Photobiol 41:95–106
Hideg E, Sass L, Barbato R, Vass I (1993) Inactivation of
photosynthetic oxygen evolution by UV-B irradiation: a ther-
moluminescence studies. Photosynth Res 38:455–462
Ivanova PI, Dobrikova AG, Taneva SG, Apostolova EL (2008)
Sensitivity of the photosynthetic apparatus to UV-A radiation:
role of light-harvesting complex II—photosystem II super
complex organization. Radiat Environ Biophys 47:169–177
Izawa S, Good SE (1968) The stoichiometric relation of phosphor-
ylation to electron transport in isolated chloroplasts. Biochim
Biophys Acta 162:380–391
Jarillo JA, Gabry H, Capel J, Alonso JM, Ecker JR, Cashmore AR
(2001) Phototropin-related NPL1 controls relocation induced by
blue light. Nature 410:952–954
Joshi PN, Ramaswamy NK, Iyer RK, Nair JS, Pradhan MK, Gartia S,
Biswal B, Biwal UC (2007) Partial protection of photosynthetic
apparatus from UV-B induced damage by UV-A radiation.
Environ Exp Bot 59:166–172
Joshi PN, Gartia S, Pradhan MK, Biswal B (2011) Photosynthetic
response of clusterbean chloroplasts to UV-B radiation: energy
imbalance and loss in redox homeostasis between QA and QB of
photosystem II. Plant Sci 181:90–95
Krizek DT (2004) Influence of PAR and UV-A in determining plant
sensitivity and photomorphogenic responses to UV-B radiation.
Photochem Photobiol 79:307–315
Lud D, Moerdijk TCW, Van de Poll WH, Buma AGW, Huiskes AHL
(2002) DNA damage and photosynthesis in Antarctic and Arctic
Sanionia uncinata (Hedw) Loeske under ambient and enhanced
levels of UV-B radiation. Plant Cell Environ 25:1570–1589
Maxwell DP, Falk S, Trick CG, Huner NPA (1994) Growth at low
temperature mimics high-light acclimation in Chlorella vulgaris.
Plant Physiol 105:535–543
Melis A, Nemson NA, Harrison MA (1992) Damage to functional
components and partial degradation of photosystem II reaction
centre proteins upon exposure to UV-B radiation. Biochim
Biophys Acta 1100:312–320
Mohr H, Schopfer P (1995) Plant Physiol. Springer, Berlin. ISBN
3-540-58016-6
Panda S, Mishra AK, Biswal UC (1987) Manganese induced
peroxidation of thylakoid lipids and changes in chlorophyll
fluorescence during aging of cell free chloroplasts in light.
Phytochemistry 26:3217–3219
Schreiber U, Schliwa U, Bilger W (1986) Continuous recording of
photochemical and non-photochemical chlorophyll fluorescence
Table 3 Change in peak temperature, EA, height of band Q of TL
curves measured from DCMU treated chloroplast isolated from
cotyledons of clusterbean seedlings with UV-A, UV-B or UV-A ?
UV-B exposure on day 10 and A/O2: [(area enclosed under Q and C
bands)/rate of O2 evolution]
Treatment Q band (Area enclosed under
Q and C bands)/O2:Peak temp.
(�C)
EA (ev) A/O2: (%)
Control 13 0.717 ± 0.03 100 ± 4.5
UV-A 13 0.74 ± 0.04 85 ± 3.6
UV-B 20.5 0.834 ± 0.03 118 ± 7.2
UVA ? UVB 19 0.79 ± 0.06 92 ± 3.1
The height of the band and A/O2: of the control sample is taken as
100 %. Each value is a mean of 3 independent measurements
(n = 3) ± SD. For details, see ‘‘Materials and methods’’
Acta Physiol Plant (2013) 35:2323–2328 2327
123
quenching with a new type of modulation fluorometer. Photo-
synth Res 10(1986):51–62
Simpson GG, Roe A, Lewontin RC (1960) Quantitative zoology.
Harcourt, Brace and World, New York
Sullivan JH, Teramura AH (1990) Field study of the interaction
between solar ultraviolet-B radiation and drought on photosyn-
thesis and growth in soybean. Plant Physiol 92:141–146
Tatake VG, Desai TS (1981) Energy storage states of photosynthetic
membrane: activation energies and lifetimes of electron in trap
state by TL methods. Photochem Photobiol 33:243–250
Vass I, Turcsanyi E, Touloupakis E, Ghanotakis D, Petrouleas V
(2002) The mechanism of UV-A radiation induced inhibition of
photosystem II electron transport studied by EPR and chloro-
phyll fluorescence. Biochemistry 41:10200–10208
Vass I, Szilard A, Sicora C (2005) Adverse effects of UV-B light on
the structure and function of the photosynthetic apparatus. In:
Pessarkli (ed) Handbook of photosynthesis, 2nd edn, Marcel
Dekker, New York, pp 827–833
Wellburn AR, Lichtenthaler HK (1984) Formulae and programme to
determine total carotenoid and chlorophyll a and b of leaf
extracts in different solvents. In: Sybesma C (ed) Advances in
photosynthesis research, vol II. Martinus Nijhoff, Dordrecht,
pp 9–12
Wilson AE, Ivanov AG, Oquist G, Grodzinski B, Sarhan F, Huner
NPA (2006) Energy balance, organellar redox status, and
acclimation to environmental stress. Can J Bot 84:1355–1370
2328 Acta Physiol Plant (2013) 35:2323–2328
123