Embed Size (px)
Citation preview
6th November 2014
9M 2014 2
Disclaimer
This document has been prepared by ACCIONA, S.A. (“ACCIONA” or the “Company”) exclusively for use during the presentation of financial results for the first ninemonths of 2014 (9M 2014). Therefore it cannot be disclosed or made public by any person or entity with an aim other than the one expressed above, without theprior written consent of the Company.The Company does not assume any liability for the content of this document if used for different purposes thereof.The information and any opinions or statements made in this document have not been verified by independent third parties, nor audited; therefore no express orimplied warranty is made as to the impartiality, accuracy, completeness or correctness of the information or the opinions or statements expressed herein.Neither the Company, its subsidiaries or any entity within ACCIONA Group or subsidiaries, any of its advisors or representatives assume liability of any kind,whether for negligence or any other reason, for any damage or loss arising from any use of this document or its contents.The information contained in this document on the price at which securities issued by ACCIONA have been bought or sold, or on the performance of thosesecurities, cannot be used to predict the future performance of securities issued by ACCIONA.Neither this document nor any part of it constitutes a contract, nor may it be used for incorporation into or construction of any contract or agreement.IMPORTANT INFORMATIONThis document does not constitute an offer or invitation to purchase or subscribe shares, in accordance with the provisions of the Spanish Securities Market Law(Law 24/1988, of July 28, as amended and restated from time to time), Royal Decree-Law 5/2005, of March 11, and/or Royal Decree 1310/2005, of November 4,and its implementing regulations.In addition, this document does not constitute an offer of purchase, sale or exchange, nor a request for an offer of purchase, sale or exchange of securities, nor arequest for any vote or approval in any other jurisdiction.Particularly, this document does not constitute an offer to purchase, sell or exchange or the solicitation of an offer to purchase, sell or exchange any securities.FORWARD-LOOKING STATEMENTSThis document contains forward-looking information and statements about ACCIONA, including financial projections and estimates and their underlyingassumptions, statements regarding plans, objectives and expectations with respect to future operations, capital expenditures, synergies, products and services, andstatements regarding future performance. Forward-looking statements are statements that are not historical facts and are generally identified by the words“expects”, “anticipates”, “believes”, “intends”, “estimates” and similar expressions.Although ACCIONA believes that the expectations reflected in such forward-looking statements are reasonable, investors and holders of ACCIONA shares arecautioned that forward-looking information and statements are subject to various risks and uncertainties, many of which are difficult to predict and generallybeyond the control of ACCIONA, that could cause actual results and developments to differ materially from those expressed in, or implied or projected by, theforward-looking information and statements. These risks and uncertainties include those discussed or identified in the documents sent by ACCIONA to the ComisiónNacional del Mercado de Valores, which are accessible to the public.Forward-looking statements are not guarantees of future performance. They have not been reviewed by the auditors of ACCIONA. You are cautioned not to placeundue reliance on the forward-looking statements, which speak only as of the date they were made. All subsequent oral or written forward-looking statementsattributable to ACCIONA or any of its members, directors, officers, employees or any persons acting on its behalf are expressly qualified in their entirety by thecautionary statement above. All forward-looking statements included herein are based on information available to ACCIONA, on the date hereof. Except as requiredby applicable law, ACCIONA does not undertake any obligation to publicly update or revise any forward-looking statements, whether as a result of new information,future events or otherwise.
1. 9M 2014 key highlights
9M 2014 4
9M 2014 key highlights
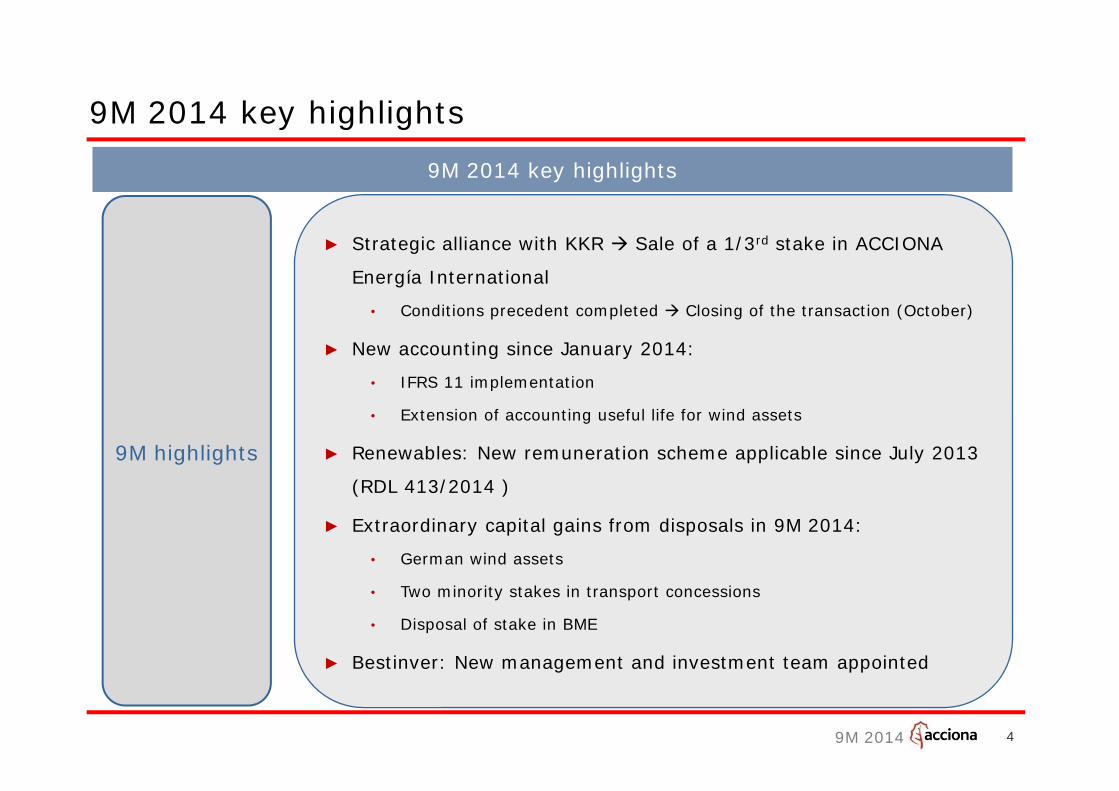
► Strategic alliance with KKR Sale of a 1/3rd stake in ACCIONA
Energía International
• Conditions precedent completed Closing of the transaction (October)
► New accounting since January 2014:
• IFRS 11 implementation
• Extension of accounting useful life for wind assets
► Renewables: New remuneration scheme applicable since July 2013
(RDL 413/2014 )
► Extraordinary capital gains from disposals in 9M 2014:
• German wind assets
• Two minority stakes in transport concessions
• Disposal of stake in BME
► Bestinver: New management and investment team appointed
9M 2014 key highlights
9M highlights
9M 2014 5
9M 2014 key highlights
Strategic
alliance with
KKR
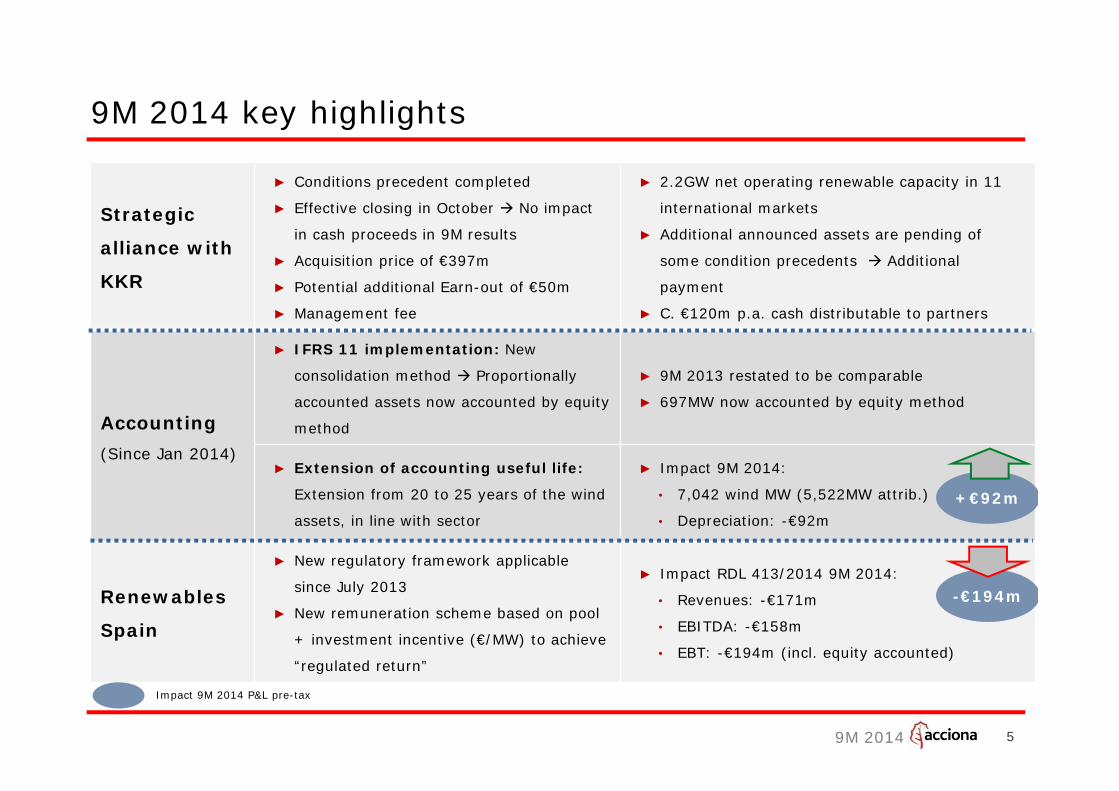
► Conditions precedent completed
► Effective closing in October No impact
in cash proceeds in 9M results
► Acquisition price of €397m
► Potential additional Earn-out of €50m
► Management fee
► 2.2GW net operating renewable capacity in 11
international markets
► Additional announced assets are pending of
some condition precedents Additional
payment
► C. €120m p.a. cash distributable to partners
Accounting (Since Jan 2014)
► IFRS 11 implementation: New
consolidation method Proportionally
accounted assets now accounted by equity
method
► 9M 2013 restated to be comparable
► 697MW now accounted by equity method
► Extension of accounting useful life:
Extension from 20 to 25 years of the wind
assets, in line with sector
► Impact 9M 2014:
• 7,042 wind MW (5,522MW attrib.)
• Depreciation: -€92m
Renewables
Spain
► New regulatory framework applicable
since July 2013
► New remuneration scheme based on pool
+ investment incentive (€/MW) to achieve
“regulated return”
► Impact RDL 413/2014 9M 2014:
• Revenues: -€171m
• EBITDA: -€158m
• EBT: -€194m (incl. equity accounted)
+€92m
-€194m
Impact 9M 2014 P&L pre-tax
9M 2014 6
9M 2014 key highlights
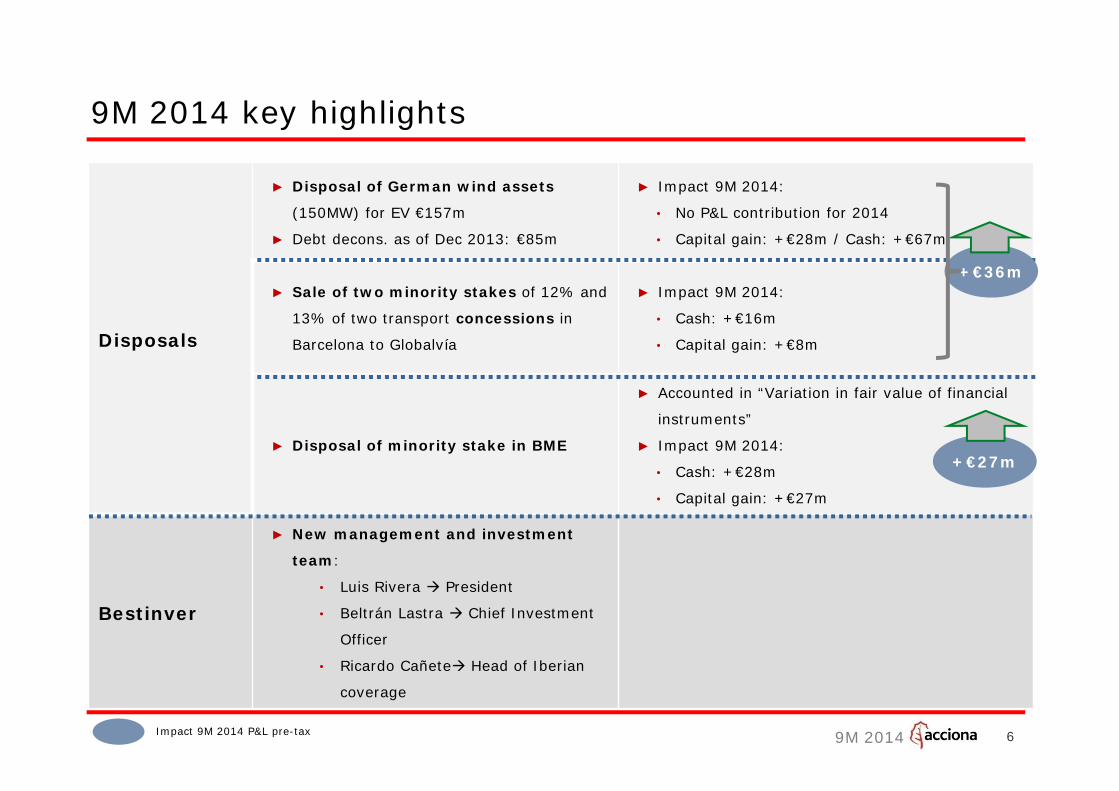
Disposals
► Disposal of German wind assets
(150MW) for EV €157m
► Debt decons. as of Dec 2013: €85m
► Impact 9M 2014:
• No P&L contribution for 2014
• Capital gain: +€28m / Cash: +€67m
► Sale of two minority stakes of 12% and
13% of two transport concessions in
Barcelona to Globalvía
► Impact 9M 2014:
• Cash: +€16m
• Capital gain: +€8m
► Disposal of minority stake in BME
► Accounted in “Variation in fair value of financial
instruments”
► Impact 9M 2014:
• Cash: +€28m
• Capital gain: +€27m
Bestinver
► New management and investment
team:
• Luis Rivera President
• Beltrán Lastra Chief Investment
Officer
• Ricardo Cañete Head of Iberian
coverage
Impact 9M 2014 P&L pre-tax
+€27m
+€36m
9M 2014 7
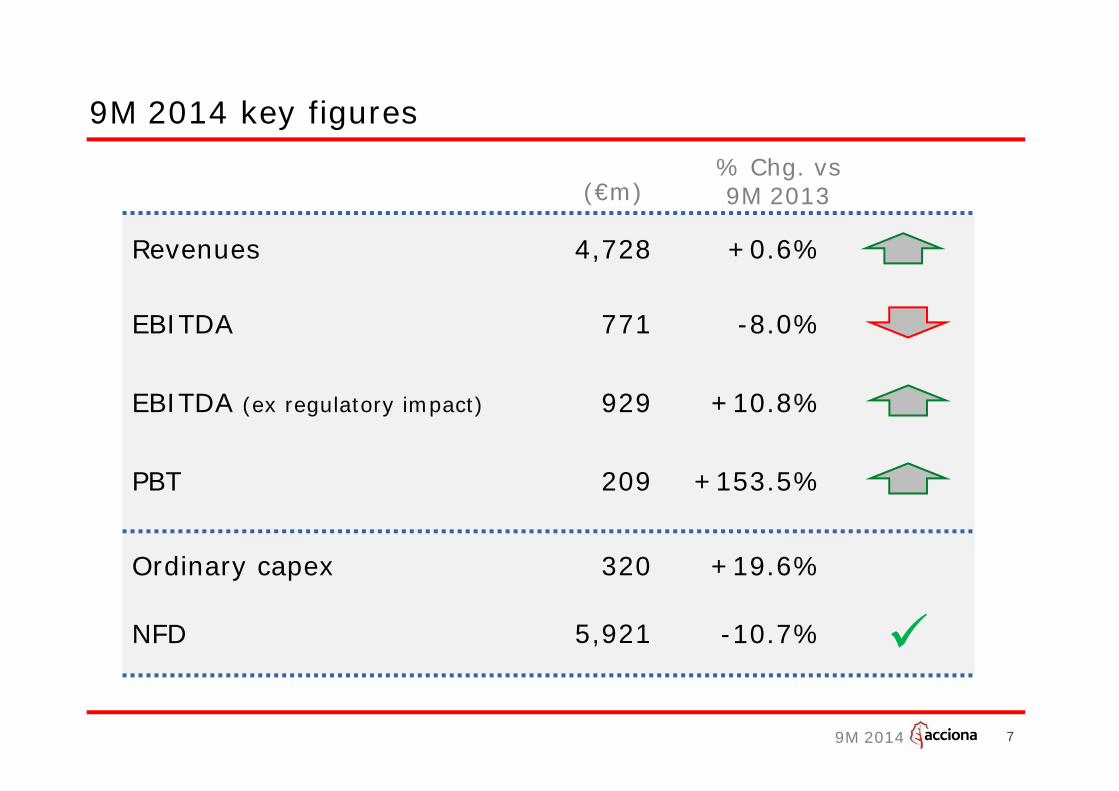
9M 2014 key figures
Revenues
EBITDA
Ordinary capex
NFD
(€m)
4,728
771
320
5,921
+0.6%
-8.0%
+19.6%
-10.7%
% Chg. vs9M 2013
PBT 209 +153.5%
EBITDA (ex regulatory impact) 929 +10.8%
2. Group financial information
9M 2014
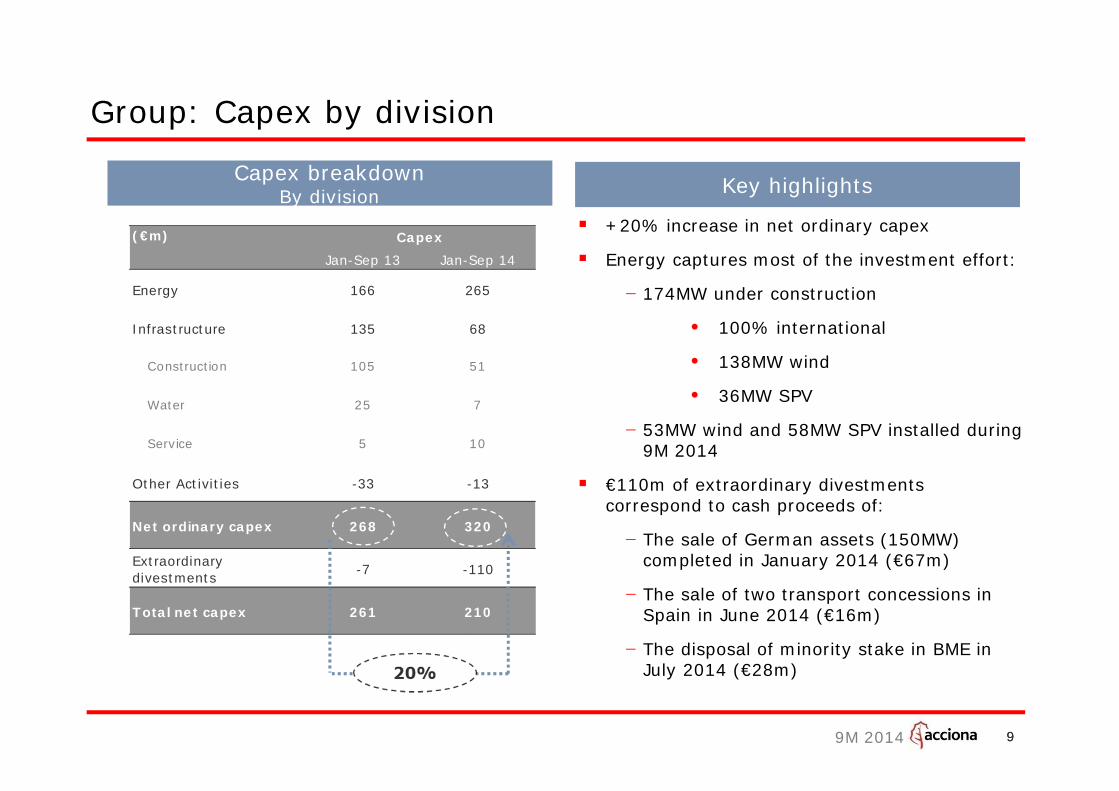
Jan-Sep 13 Jan-Sep 14
Energy 166 265
Infrastructure 135 68
Construction 105 51
Water 25 7
Service 5 10
Other Activities -33 -13
Net ordinary capex 268 320
Extraordinary divestments -7 -110
Total net capex 261 210
Capex(€m)
99
Group: Capex by division
+20% increase in net ordinary capex
Energy captures most of the investment effort:
- 174MW under construction
• 100% international
• 138MW wind
• 36MW SPV
- 53MW wind and 58MW SPV installed during 9M 2014
€110m of extraordinary divestments correspond to cash proceeds of:
- The sale of German assets (150MW) completed in January 2014 (€67m)
- The sale of two transport concessions in Spain in June 2014 (€16m)
- The disposal of minority stake in BME in July 2014 (€28m)
Key highlightsCapex breakdownBy division
9M 2014
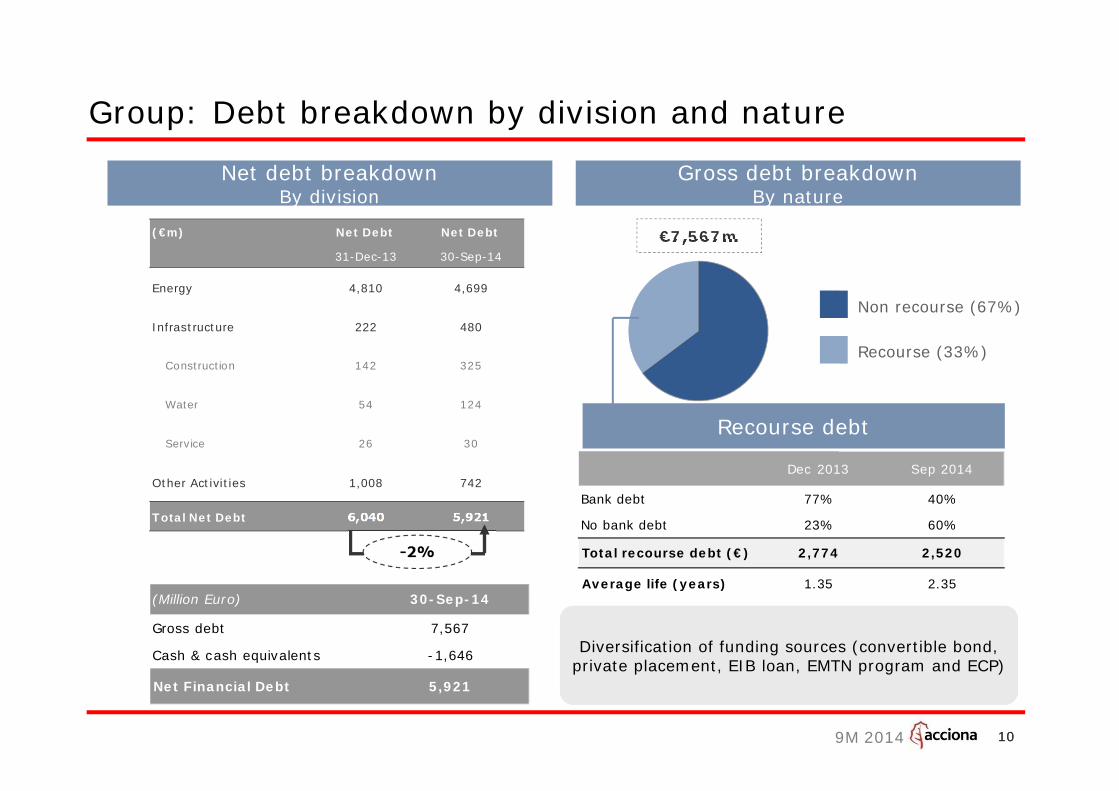
Dec 2013 Sep 2014
Bank debt 77% 40%
No bank debt 23% 60%
Total recourse debt (€) 2,774 2,520
Average life (years) 1.35 2.35
(€m) Net Debt Net Debt
31-Dec-13 30-Sep-14
Energy 4,810 4,699
Infrastructure 222 480
Construction 142 325
Water 54 124
Service 26 30
Other Activities 1,008 742
Total Net Debt 6,040 5,921
10
Group: Debt breakdown by division and nature
Gross debt breakdownBy nature
Recourse (33%)
Non recourse (67%)
€7,567m
10
Diversification of funding sources (convertible bond, private placement, EIB loan, EMTN program and ECP)Diversification of funding sources (convertible bond,
private placement, EIB loan, EMTN program and ECP)
Net debt breakdownBy division
(Million Euro) 30-Sep-14
Gross debt 7,567
Cash & cash equivalents -1,646
Net Financial Debt 5,921
Recourse debt
9M 2014
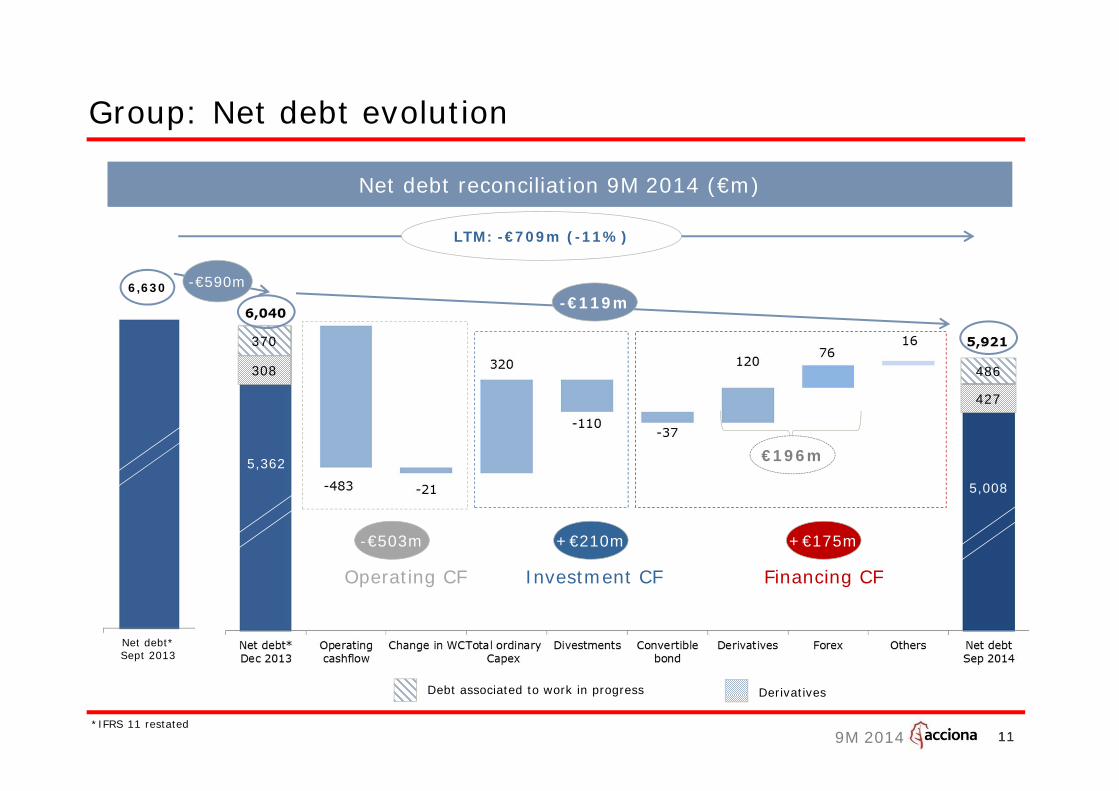
427
370
486308
Operating CF Investment CF Financing CF
-€503m +€210m +€175m
-€119m
5,362
5,008
11
Group: Net debt evolution
11
Debt associated to work in progress Derivatives
-€590m6,630
Net debt reconciliation 9M 2014 (€m)
Net debt*Sept 2013
LTM: -€709m (-11%)
*IFRS 11 restated
€196m
9M 2014 1212
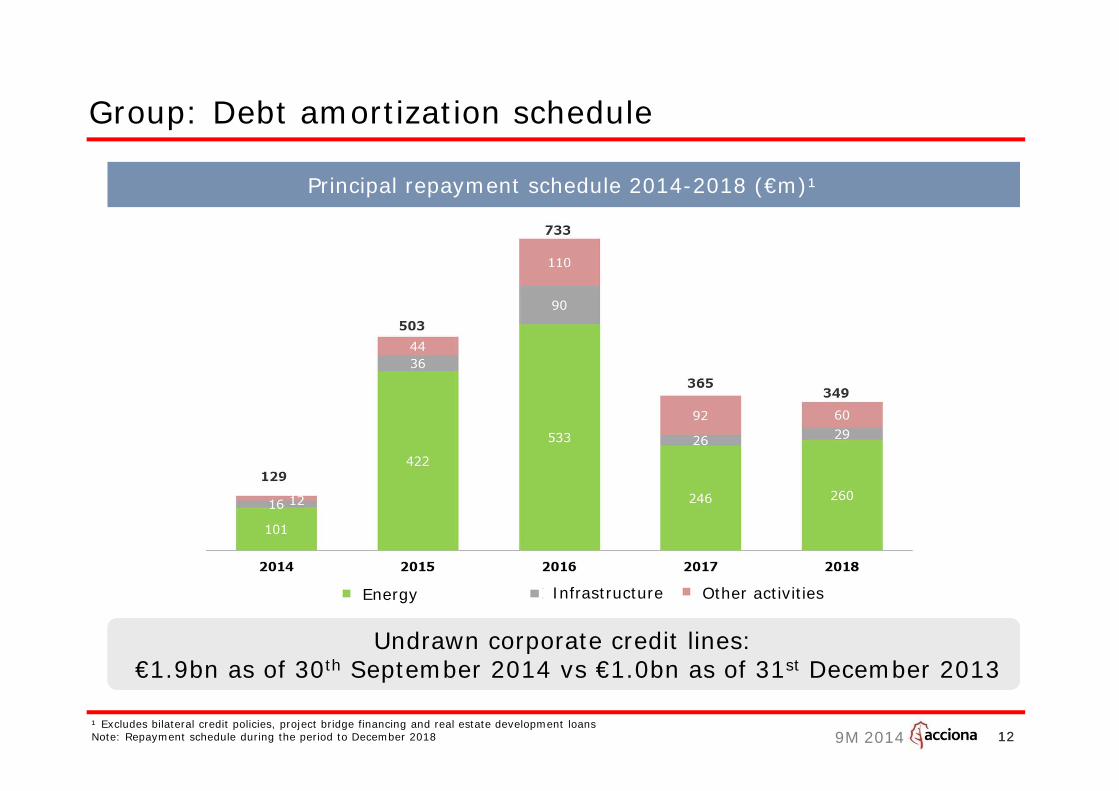
Group: Debt amortization schedule
¹ Excludes bilateral credit policies, project bridge financing and real estate development loansNote: Repayment schedule during the period to December 2018
Undrawn corporate credit lines:€1.9bn as of 30th September 2014 vs €1.0bn as of 31st December 2013
Undrawn corporate credit lines:€1.9bn as of 30th September 2014 vs €1.0bn as of 31st December 2013
Principal repayment schedule 2014-2018 (€m)¹
InfrastructureEnergy Other activities
9M 2014
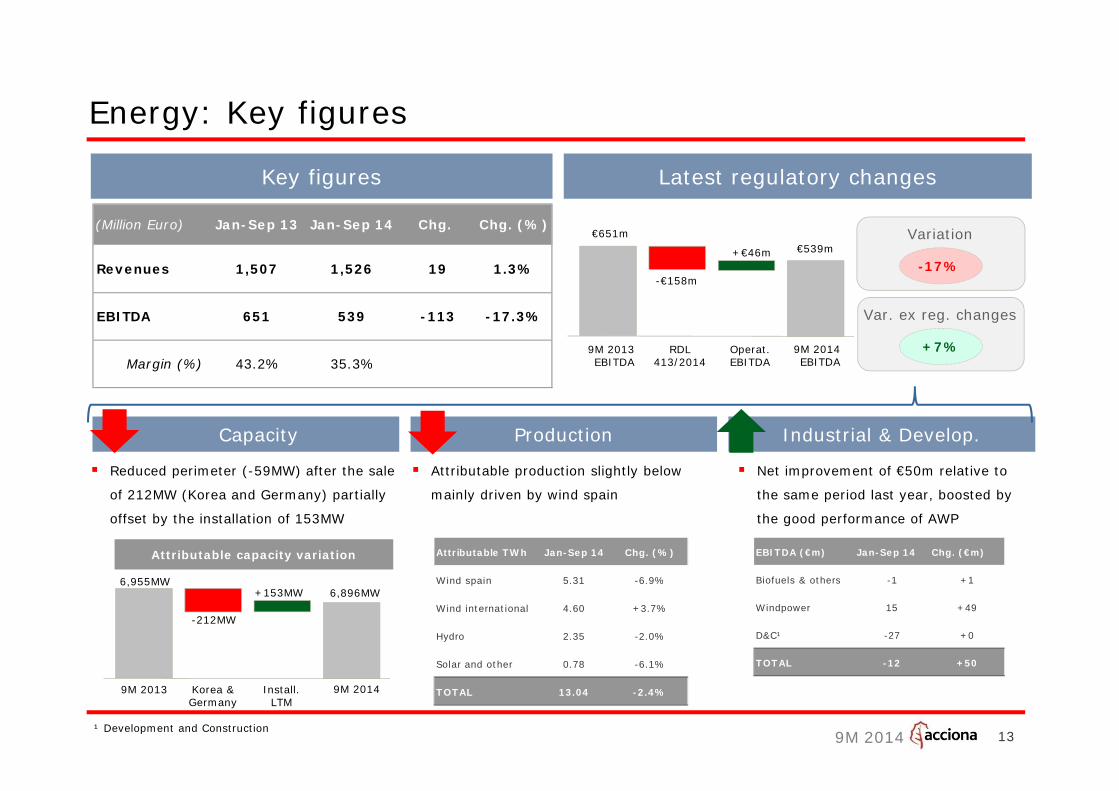
Energy: Key figures
Key figures Latest regulatory changes
€651m
-€158m
+€46m €539m
-17%
+7%
Variation
Var. ex reg. changes
Capacity Production Industrial & Develop.
Net improvement of €50m relative to
the same period last year, boosted by
the good performance of AWP
Attributable production slightly below
mainly driven by wind spain
Reduced perimeter (-59MW) after the sale
of 212MW (Korea and Germany) partially
offset by the installation of 153MW
-212MW
+153MW 6,896MW6,955MW
9M 2013 9M 2014Korea & Germany
Install.LTM
9M 2013EBITDA
9M 2014EBITDA
RDL 413/2014
Operat.EBITDA
Attributable capacity variation
13¹ Development and Construction
(Million Euro) Jan-Sep 13 Jan-Sep 14 Chg. Chg. (%)
Revenues 1,507 1,526 19 1.3%
EBITDA 651 539 -113 -17.3%
Margin (%) 43.2% 35.3%
Attributable TWh Jan-Sep 14 Chg. (%)
Wind spain 5.31 -6.9%
Wind international 4.60 +3.7%
Hydro 2.35 -2.0%
Solar and other 0.78 -6.1%
TOTAL 13.04 -2.4%
EBITDA (€m) Jan-Sep 14 Chg. (€m)
Biofuels & others -1 +1
Windpower 15 +49
D&C¹ -27 +0
TOTAL -12 +50
9M 2014 14
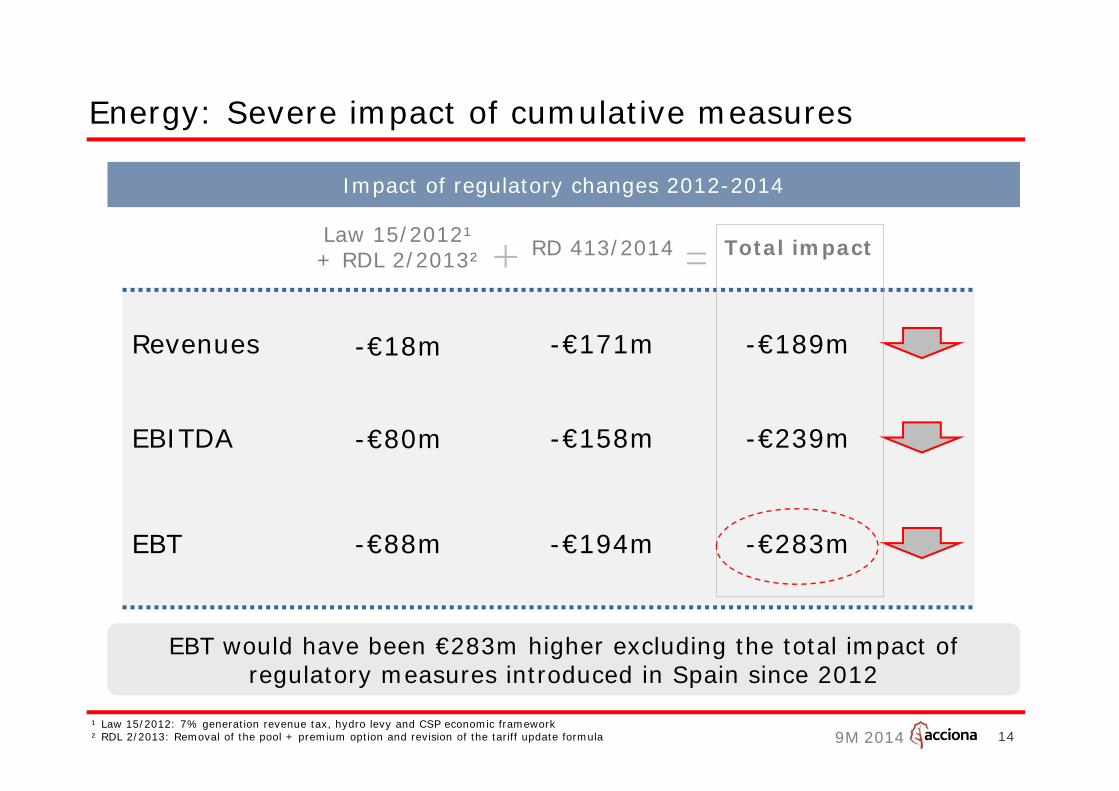
Energy: Severe impact of cumulative measures
Revenues
EBITDA
RD 413/2014
-€18m
-€80m
Total impact
EBT -€88m
Law 15/2012¹ + RDL 2/2013²
-€171m
-€158m
-€194m
-€189m
-€239m
-€283m
Impact of regulatory changes 2012-2014
EBT would have been €283m higher excluding the total impact of regulatory measures introduced in Spain since 2012
EBT would have been €283m higher excluding the total impact of regulatory measures introduced in Spain since 2012
¹ Law 15/2012: 7% generation revenue tax, hydro levy and CSP economic framework² RDL 2/2013: Removal of the pool + premium option and revision of the tariff update formula
9M 2014
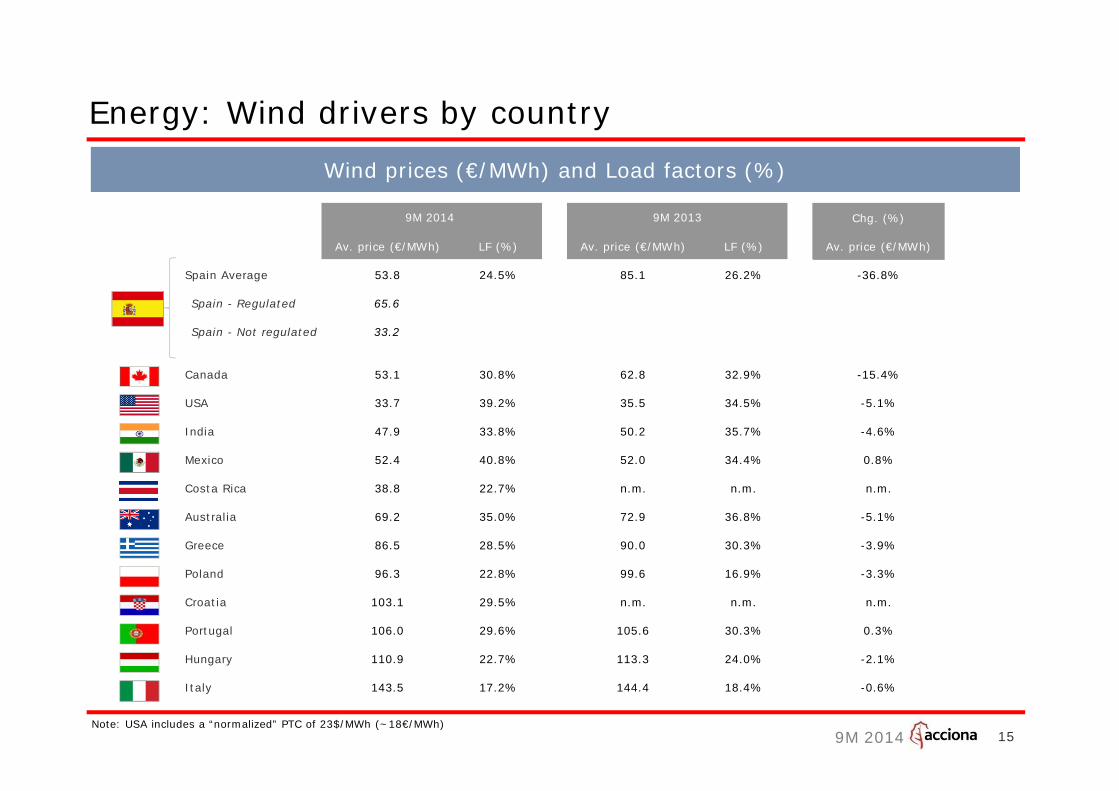
Energy: Wind drivers by country
Wind prices (€/MWh) and Load factors (%)
15Note: USA includes a “normalized” PTC of 23$/MWh (~18€/MWh)
Chg. (%)
Av. price (€/MWh) LF (%) Av. price (€/MWh) LF (%) Av. price (€/MWh)
Spain Average 53.8 24.5% 85.1 26.2% -36.8%
Spain - Regulated 65.6
Spain - Not regulated 33.2
Canada 53.1 30.8% 62.8 32.9% -15.4%
USA 33.7 39.2% 35.5 34.5% -5.1%
India 47.9 33.8% 50.2 35.7% -4.6%
Mexico 52.4 40.8% 52.0 34.4% 0.8%
Costa Rica 38.8 22.7% n.m. n.m. n.m.
Australia 69.2 35.0% 72.9 36.8% -5.1%
Greece 86.5 28.5% 90.0 30.3% -3.9%
Poland 96.3 22.8% 99.6 16.9% -3.3%
Croatia 103.1 29.5% n.m. n.m. n.m.
Portugal 106.0 29.6% 105.6 30.3% 0.3%
Hungary 110.9 22.7% 113.3 24.0% -2.1%
Italy 143.5 17.2% 144.4 18.4% -0.6%
9M 2014 9M 2013
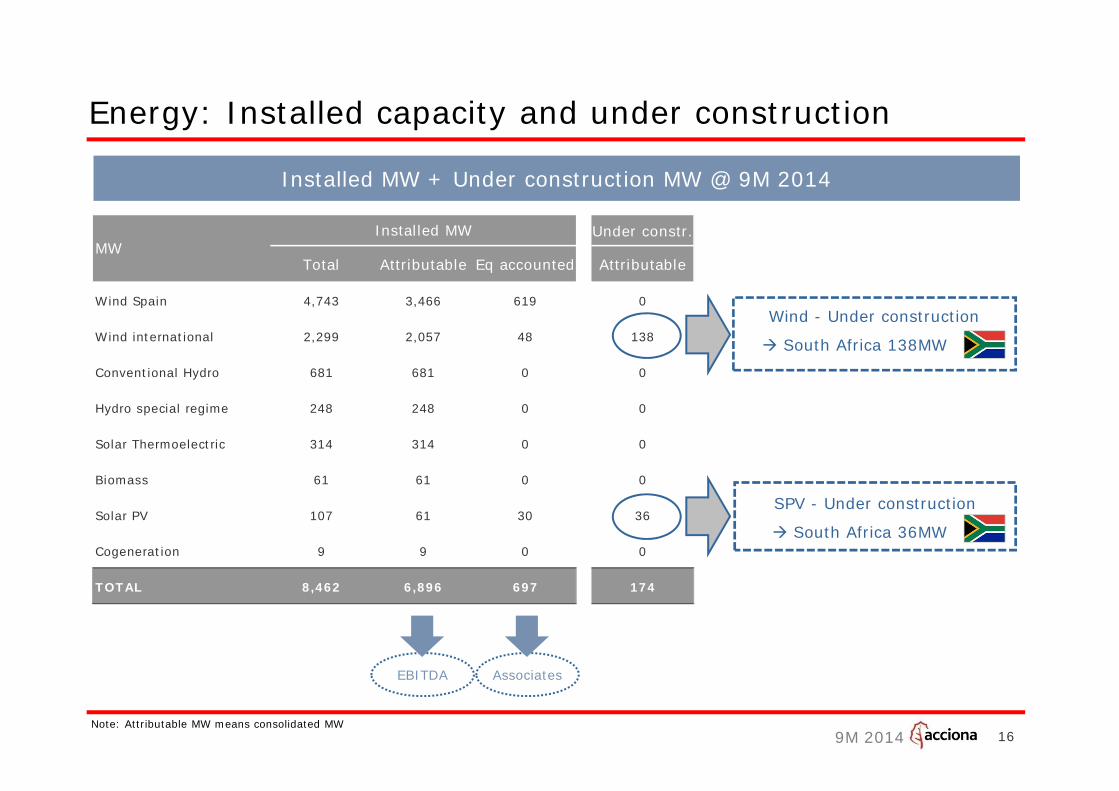
9M 2014
Under constr.
Total Attributable Eq accounted Attributable
Wind Spain 4,743 3,466 619 0
Wind international 2,299 2,057 48 138
Conventional Hydro 681 681 0 0
Hydro special regime 248 248 0 0
Solar Thermoelectric 314 314 0 0
Biomass 61 61 0 0
Solar PV 107 61 30 36
Cogeneration 9 9 0 0
TOTAL 8,462 6,896 697 174
Installed MWMW
EBITDA Associates
16
Energy: Installed capacity and under construction
Installed MW + Under construction MW @ 9M 2014
SPV - Under construction
South Africa 36MW
Wind - Under construction
South Africa 138MW
Note: Attributable MW means consolidated MW
9M 2014 17
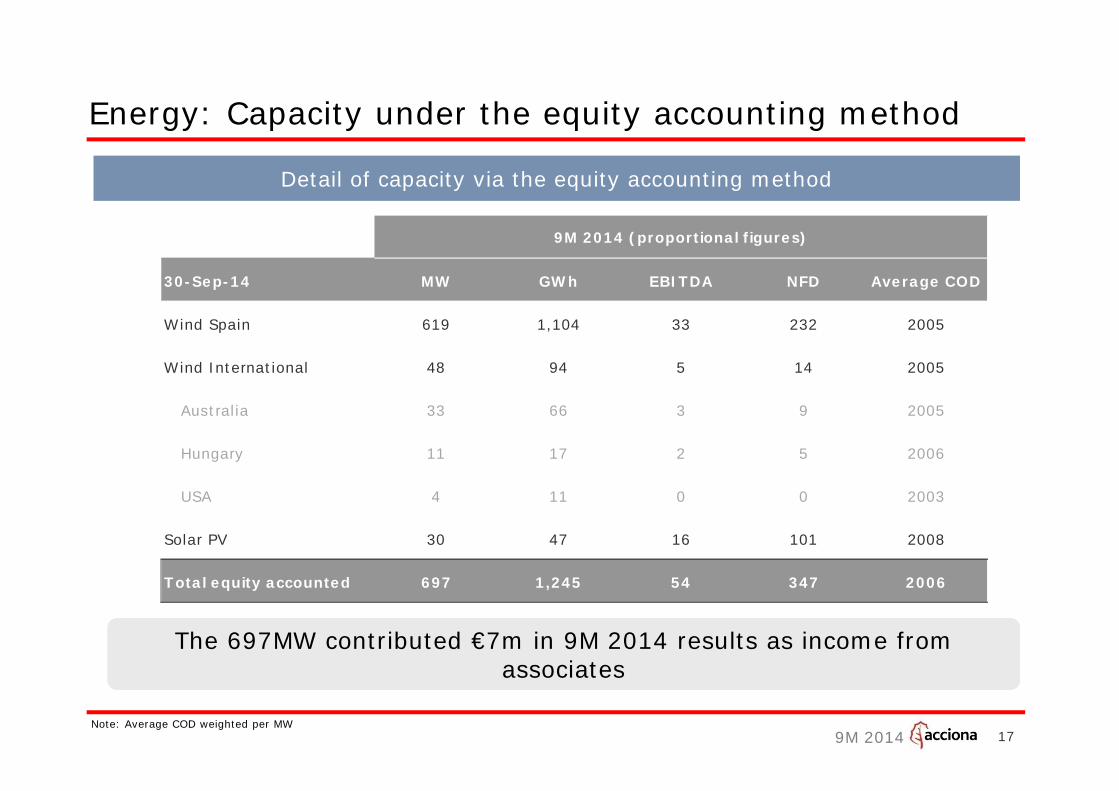
Energy: Capacity under the equity accounting method
Detail of capacity via the equity accounting method
The 697MW contributed €7m in 9M 2014 results as income from associates
The 697MW contributed €7m in 9M 2014 results as income from associates
Note: Average COD weighted per MW
30-Sep-14 MW GWh EBITDA NFD Average COD
Wind Spain 619 1,104 33 232 2005
Wind International 48 94 5 14 2005
Australia 33 66 3 9 2005
Hungary 11 17 2 5 2006
USA 4 11 0 0 2003
Solar PV 30 47 16 101 2008
Total equity accounted 697 1,245 54 347 2006
9M 2014 (proportional figures)
9M 2014 18
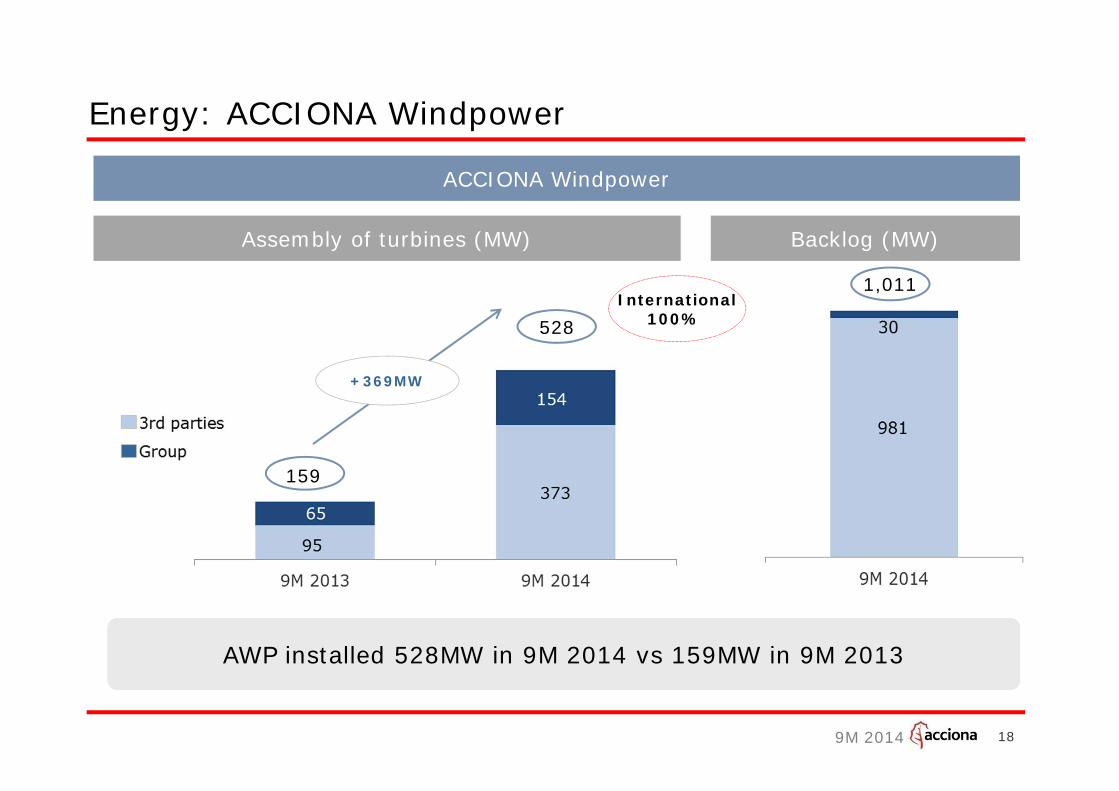
Energy: ACCIONA Windpower
ACCIONA Windpower
AWP installed 528MW in 9M 2014 vs 159MW in 9M 2013AWP installed 528MW in 9M 2014 vs 159MW in 9M 2013
Assembly of turbines (MW) Backlog (MW)
+369MW
528
159
International100%
1,011
9M 2014 19
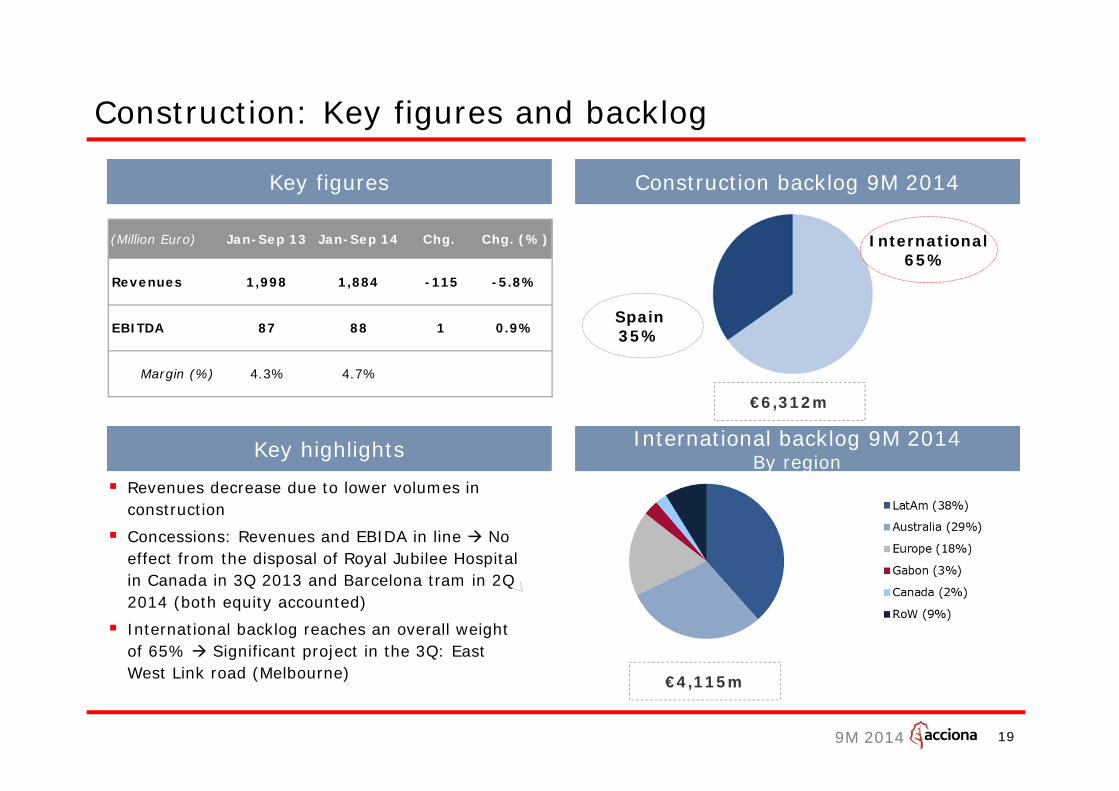
Construction: Key figures and backlog
Key figures
Revenues decrease due to lower volumes in construction
Concessions: Revenues and EBIDA in line No effect from the disposal of Royal Jubilee Hospital in Canada in 3Q 2013 and Barcelona tram in 2Q 2014 (both equity accounted)
International backlog reaches an overall weight of 65% Significant project in the 3Q: East West Link road (Melbourne)
Key highlights
19
International backlog 9M 2014By region
Construction backlog 9M 2014
€6,312m
Spain 35%
International65%
€4,115m
(Million Euro) Jan-Sep 13 Jan-Sep 14 Chg. Chg. (%)
Revenues 1,998 1,884 -115 -5.8%
EBITDA 87 88 1 0.9%
Margin (%) 4.3% 4.7%
9M 2014
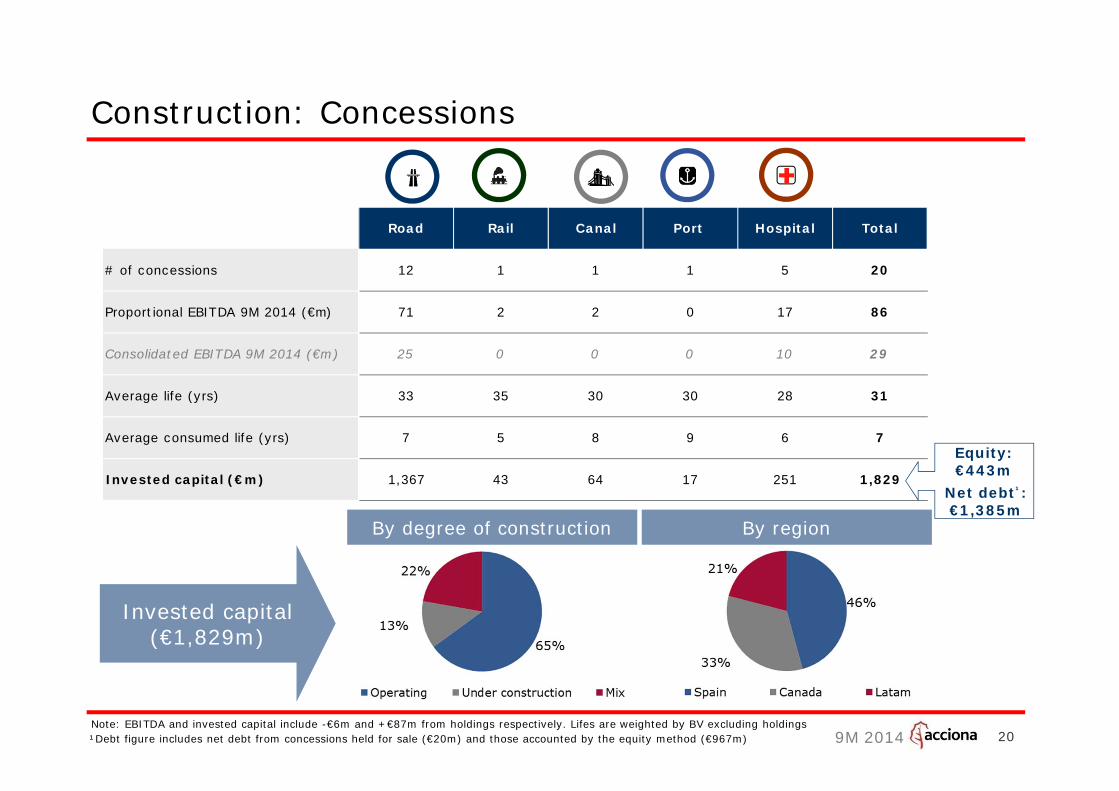
Road Rail Canal Port Hospital Total
# of concessions 12 1 1 1 5 20
Proportional EBITDA 9M 2014 (€m) 71 2 2 0 17 86
Consolidated EBITDA 9M 2014 (€m) 25 0 0 0 10 29
Average life (yrs) 33 35 30 30 28 31
Average consumed life (yrs) 7 5 8 9 6 7
Invested capital (€m) 1,367 43 64 17 251 1,829
Construction: Concessions
¹Debt figure includes net debt from concessions held for sale (€20m) and those accounted by the equity method (€967m)
Invested capital(€1,829m)
Equity:€443m
Net debt¹:€1,385m
20Note: EBITDA and invested capital include -€6m and +€87m from holdings respectively. Lifes are weighted by BV excluding holdings
By degree of construction By region
9M 2014 21
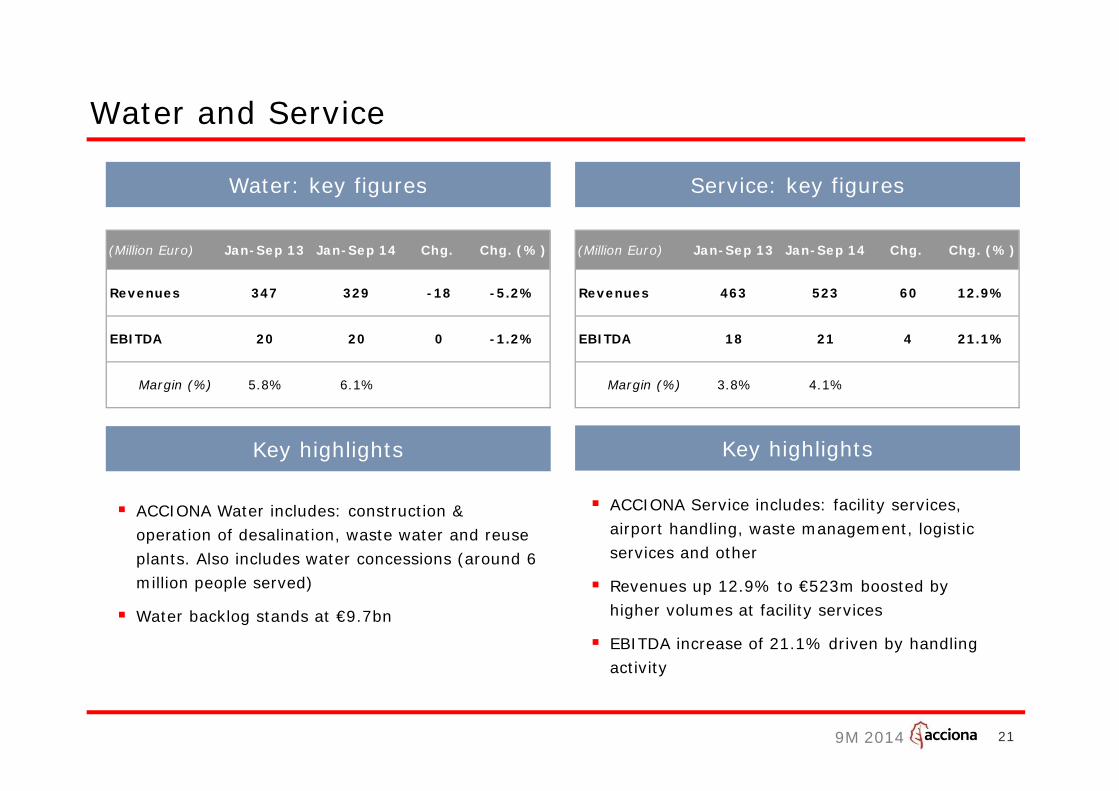
Water and Service
ACCIONA Water includes: construction & operation of desalination, waste water and reuse plants. Also includes water concessions (around 6 million people served)
Water backlog stands at €9.7bn
Water: key figures
Key highlights
Service: key figures
ACCIONA Service includes: facility services, airport handling, waste management, logistic services and other
Revenues up 12.9% to €523m boosted by higher volumes at facility services
EBITDA increase of 21.1% driven by handling activity
Key highlights
(Million Euro) Jan-Sep 13 Jan-Sep 14 Chg. Chg. (%)
Revenues 347 329 -18 -5.2%
EBITDA 20 20 0 -1.2%
Margin (%) 5.8% 6.1%
(Million Euro) Jan-Sep 13 Jan-Sep 14 Chg. Chg. (%)
Revenues 463 523 60 12.9%
EBITDA 18 21 4 21.1%
Margin (%) 3.8% 4.1%
9M 2014 22
Other activities
Other activities: key figures
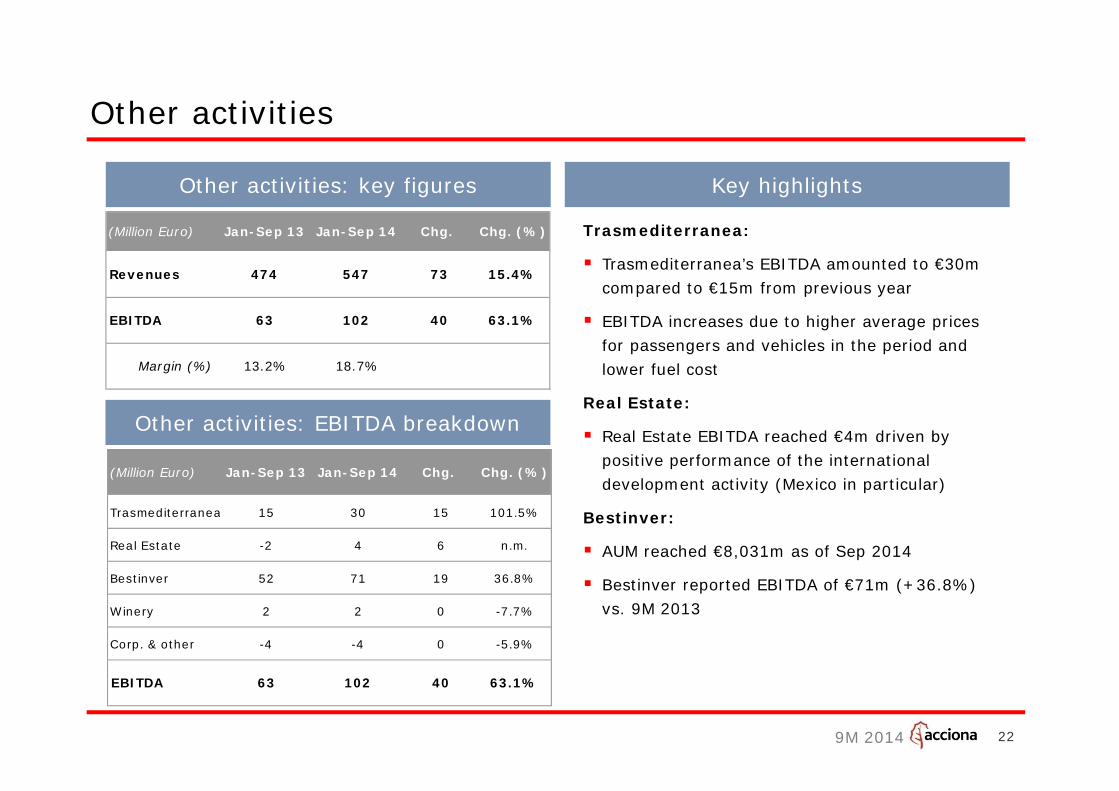
Trasmediterranea:
Trasmediterranea’s EBITDA amounted to €30m compared to €15m from previous year
EBITDA increases due to higher average prices for passengers and vehicles in the period and lower fuel cost
Real Estate:
Real Estate EBITDA reached €4m driven by positive performance of the international development activity (Mexico in particular)
Bestinver:
AUM reached €8,031m as of Sep 2014
Bestinver reported EBITDA of €71m (+36.8%) vs. 9M 2013
Key highlights
Other activities: EBITDA breakdown
(Million Euro) Jan-Sep 13 Jan-Sep 14 Chg. Chg. (%)
Revenues 474 547 73 15.4%
EBITDA 63 102 40 63.1%
Margin (%) 13.2% 18.7%
(Million Euro) Jan-Sep 13 Jan-Sep 14 Chg. Chg. (%)
Trasmediterranea 15 30 15 101.5%
Real Estate -2 4 6 n.m.
Bestinver 52 71 19 36.8%
Winery 2 2 0 -7.7%
Corp. & other -4 -4 0 -5.9%
EBITDA 63 102 40 63.1%
9M 2014 23
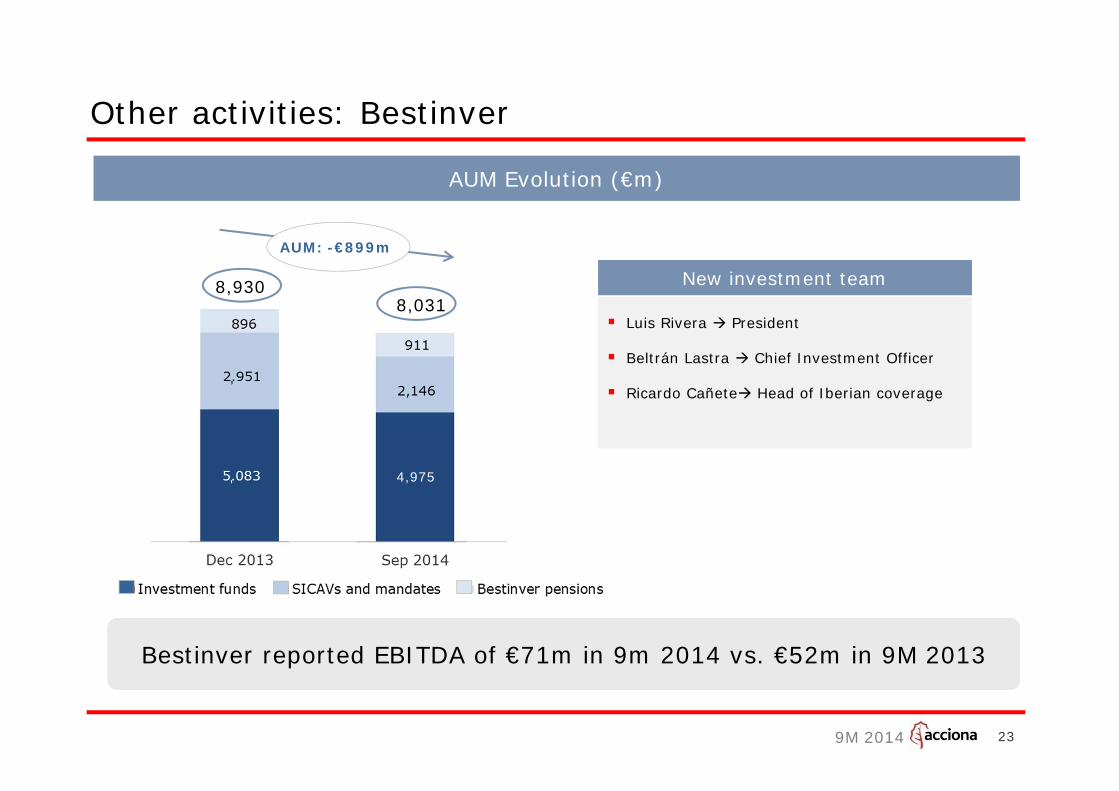
AUM Evolution (€m)
Bestinver reported EBITDA of €71m in 9m 2014 vs. €52m in 9M 2013Bestinver reported EBITDA of €71m in 9m 2014 vs. €52m in 9M 2013
Other activities: Bestinver
AUM: -€899m
8,9308,031
New investment team
Luis Rivera President
Beltrán Lastra Chief Investment Officer
Ricardo Cañete Head of Iberian coverage,
, 4,975
3. Closing remarks
9M 2014
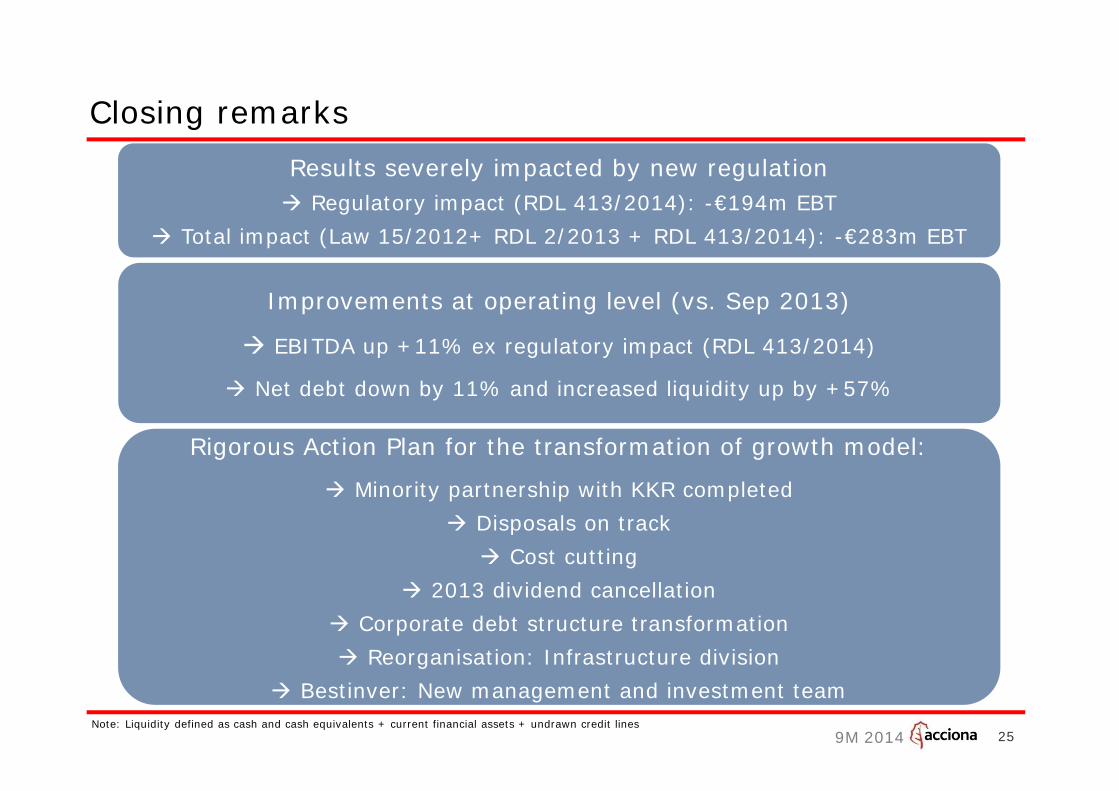
Closing remarks
25
Improvements at operating level (vs. Sep 2013)
EBITDA up +11% ex regulatory impact (RDL 413/2014)
Net debt down by 11% and increased liquidity up by +57%
Results severely impacted by new regulation Regulatory impact (RDL 413/2014): -€194m EBT
Total impact (Law 15/2012+ RDL 2/2013 + RDL 413/2014): -€283m EBT
Rigorous Action Plan for the transformation of growth model:
Minority partnership with KKR completed Disposals on track Cost cutting
2013 dividend cancellation Corporate debt structure transformation Reorganisation: Infrastructure division
Bestinver: New management and investment teamNote: Liquidity defined as cash and cash equivalents + current financial assets + undrawn credit lines

6th November 2014


![ACCIONA Results presentation Q1 2014 V16.ppt [Modo de compatibilidad] · 2017. 10. 5. · Q1 2014 2 Disclaimer This document has been prepared by ACCIONA, S.A. (“ACCIONA” or the](https://img.pdfslide.us/doc/110x75/5fed521616e06161b1746b59/acciona-results-presentation-q1-2014-v16ppt-modo-de-compatibilidad-2017-10.jpg)