Embed Size (px)
Citation preview
Accidents and Fata l i t i es
. Divers Alert Network 919 684 8111
http://rubicon-foundation.org
1989 Report on Diving Accidents and Fatalities, copyright Divers Alert Network, 1991.
Permission to reproduce this document, in whole or in part, is granted, provided proper attribution is given to Divers Alert Network.
- DAN, Box 3823, Duke University Medical Center, Durham, North Carolina 277 10
http://rubicon-foundation.org
Table of Contents
Acknowledgements
Introdluction
1.0 Introduction to Diving Fatalities
2.0 Methods of Fatality Data Collection
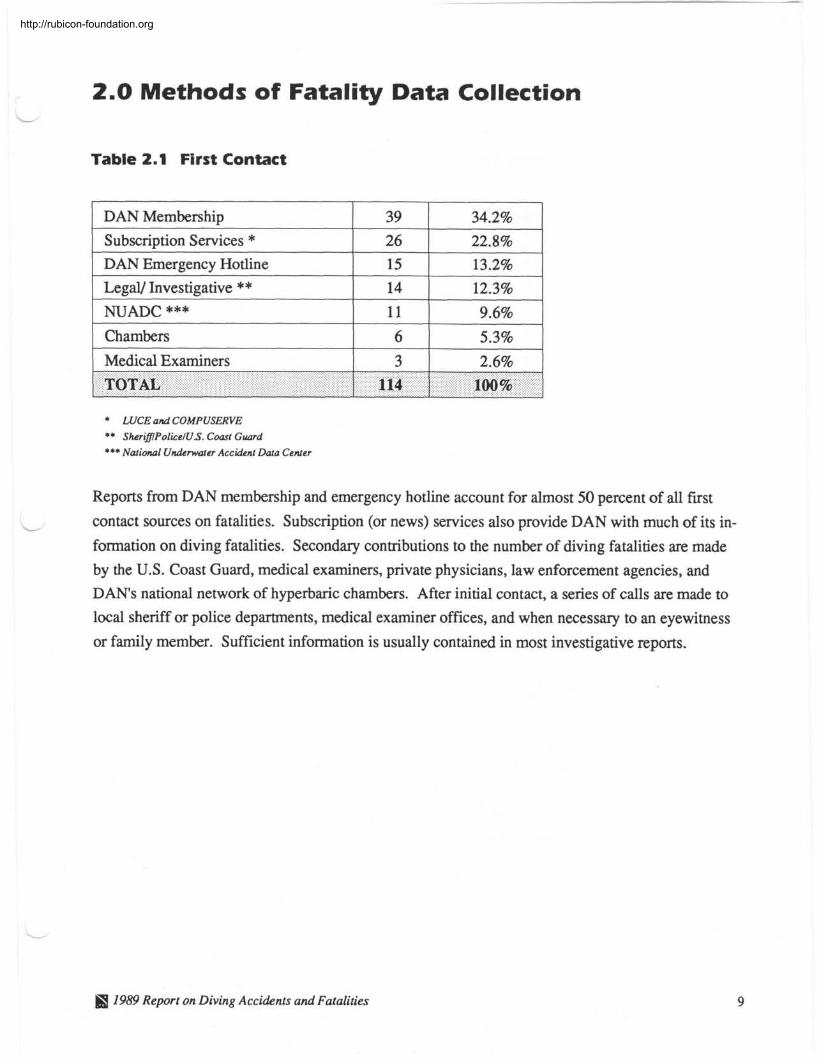
Table 2.1 First Contact
Table 2.2 Location of Diving Fatalities by State
Table 2.3 Location of Diving Fatalities by Country, other than
the United States
3.0 Diiver Population
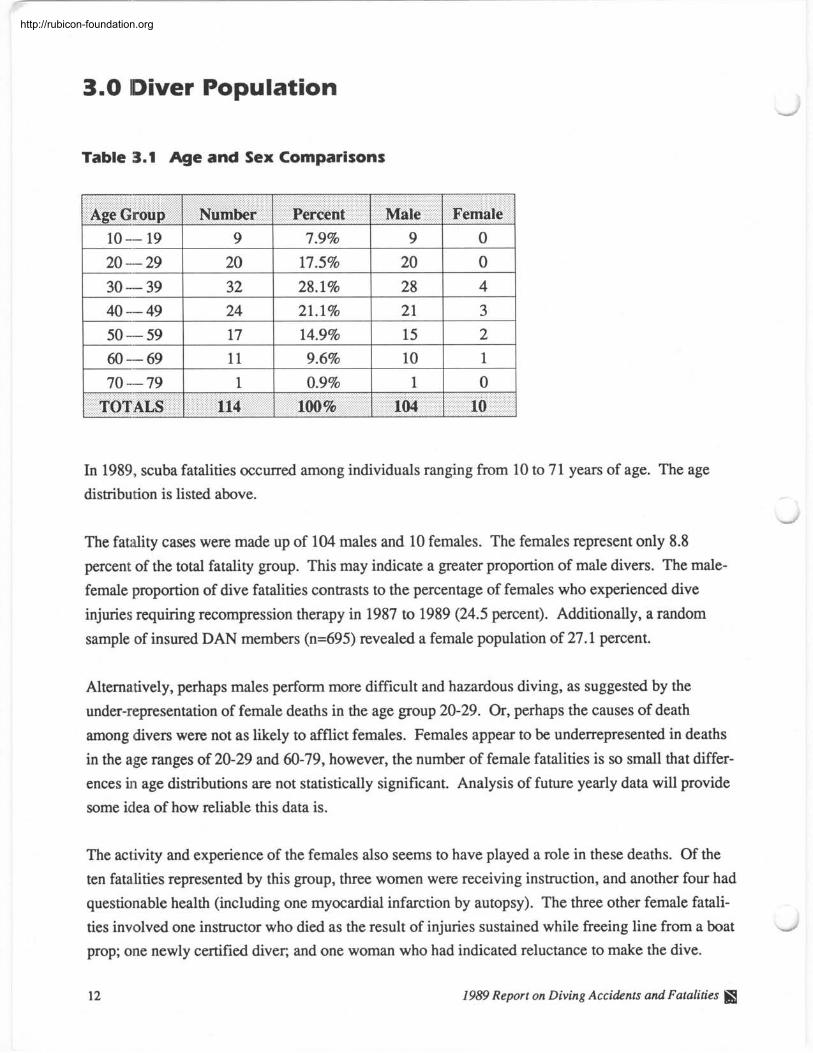
Table 3.1 Age and Sex Comparisons
Graph 3.2 Comparison of Age Range by Percentage in Three
1989 Populations
Table 3.3 Certification
Table 3.4 Diving Experience
4.0 Diiver Health
Table 4.1 Physiological Factors
Table 4.2 Age Group Analysis
5.0 Dive Profile
Table 58.1 Dive Activity
Table 51.2 Dive Platform
Table 5.3 Number of Divers in a Group
Table 5.4 Effective Dive Buddy Teams
6.0 Characteristics of Fatality
Table 6.1 When Problem Occurred
Table 6.2 What Problem Occurred Where
Table 6.3 Diver Recovery and Rescue
1989 Report on Diving Accidents and Fatalities
http://rubicon-foundation.org
7.0 Fatality Information Analysis
Table 7.1 Primary Information Source L
Fatality Summary 3 1
8.0 Introduction to Diving Accidents 32
9.0 Diver Characteristics 34
Table 9.1 Age Distribution of 1989 Accident Victims 34
Table 9.2 Sex of 1989 Accident Victims 35
Table 9.3 Certification Level of 1989 Accident Victims
Table 9.4 Diver Experience by Sex
Graph 9.5 New Diver Profile Traits 3 8
Graph 9.6 New Divers with Less than Two Years of Experience 39
Table 9.7 Physical Fitness of the 1989 Accident Victims 40
Table 9.8 Medication Use of the 1989 Accident Victims 40
Table 9.9 Current Medical History by Disease Severity Code 41
Table 9.10 Past Health Illness by Disease Severity Code 42
L
Table 9.1 1 Alcohol Use of 1989 Accident Victims 43
Table 9.12 Pre-dive Alcohol Use of 1989 Accident Victims 43
Table 9.13 Smoking History of 1989 Accident Victims 44
Table 9.14 Nausea, Hangover, Diarrhea, and Recreational Drug Use 44
Table 9.15 DCS Symptoms Prior to Last Dive 45
Table 9.16 Lack of Sleep and/or Fatigue Prior to Last Dive 45
Table 9.17 Strenuous Exercise
Table 9.18 Type of Water Environment
1 0.0 Dive Profile Graph 10.1 Primary Dive Activity
Graph 10.2 Days Since Last Safe Dive
Graph 10.3 Number of Days Diving
Table 10.4 Total Reported Cases
Table 10.5 Total Cases Treated and Reported in 1989 by DAN
Regional Coordinators
Table 10.6 Accidents by State
.- Table 10.7 Accidents by Country
1989 Report on Diving Accidents and Fatalities
http://rubicon-foundation.org
Graph 10.8 AGE Dive Attributes
Graph 10.9 DCS Dive Attributes
Table 10.10 Equipment Problems
Table 10.11 Table vs. Computer Diving
Graph 10.12 Attributes of Computer Divers
Graph 10.13 Attributes of Table Divers
1 1.0 Symptoms
Table 1 1.. 1 Top Injury Symptoms
Table 11.2 1989 Injury Symptoms
Table 1 1.3 DAN Disease Severity Code Table 1 1.4 1989 Unblinded Disease Diagnosis
Table 11.5 Present Severity Code vs. Previous Dive Injury Diagnosis
by Sex Table 11.6 Age by Disease Severity and Sex
Graph 1.1.7 Severity Code vs. Occurrence
12.0 Treatment
Graph 1.2.1 Delay to Calling for Assistance
Graph 112.2 First Contact for Assistance
Graph 112.3 First Aid Used
Graph 112.4 Delay to Recompression
Graph 112.5 Residual Symptoms by Severity Code
Graph 12.6 Type of Residuals
Accident Summary 69
Appendix A DAN Dive Accident Reporting Form
Appendix B DAN Fatality Worksheet
Appendix C Diagnosis Coding for Disease Severity
1989 Report on Diving Accidents and Fatalities ffl
http://rubicon-foundation.org
Acknowledgments L
Data for the 1989 Report on Diving Accidents and Fatalities was collected and assembled by DAN
employees and staff. Contributions ranged from accident follow-up calls, data entry, editing, proof-
reading, and compiling the final report. DAN wishes to recognize the following people for their
important contributions:
Peter Bennett Ph.D., D.Sc.
Richard Moon M.D.
G. Yancey Mebane M.D. Joel Dovenbarger R.N.
Gary Nichols DMT
Karen Corson MPH Conrad Ireland EMT
Jeffrey Bertsch DMT
Michele Nealen
Barbara Oberg
Mark Langan
Lori Thompson
Sherry Strickland
Jackie Smith
John Rorem
Chris Wachholz R.N.
Phil Tromrnel
MedicalIResearch Coordinator - Joel Dovenbarger L Staff Specialist/Project Assistant - Karen Corson
Layout and Design - Gary Nichols
Direct financial support for this report was provided by the National Oceanic and Atmospheric Ad-
ministration (NOAA) and the Dive Equipment Manufacturers Association (DEMA). DAN also
recognizes the dive clubs, stores, instructors, and many individual members who support DAN and
diving safety.
DAN is indebted to the many hyperbaric physicians, nurses, and technicians from the national net-
work of chambers who fill out DAN reporting forms and send them in for follow-up. DAN also
wishes to thank the local sheriff, police, emergency medical personnel, U.S. Coast Guard, Medical
Examiners, and coroners who submitted information on scuba fatalities. DAN could not perform its
reporting service without the support and contributions of these concerned individuals.
1989 Report on Diving Accidents and Fatalities
http://rubicon-foundation.org
Scuba diving requires training and certification in order to participate. Like most other recreational
sports, there is a risk of personal injury while scuba diving. A special risk exists in scuba diving,
however, because the normal ambient environment changes from air to water. Breathing com-
pressed gas at increased partial pressure while in the water may cause decompression sickness
(DCS) and arterial gas embolism (AGE). Associated injuries such as barotraurna, marine life injury,
drowning., and near-drowning are also possible, in addition to complications of underlying disease.
In 1980, a-n increasing need for a diver assistance service resulted in the initiation of the Divers Alert
Network (DAN). Its mission was to enhance diving safety for recreational scuba divers by:
1. Providing assistance to injured divers, including treatment referral.
2. Collecting statistics on diving casualties to prevent future fatalities and injuries.
3. Providing information to physicians and the general public regarding health issues pertaining to
scuba diving.
The Divers Alert Network has advanced along with the increasingly sophisticated dive equipment
and multitude of divers' destinations. Wherever divers go throughout the world, they can call a
single number for assistance or information.
As the largest diving safety organization in the world, DAN lends its expertise and structural frame-
work to other assistance agencies. In 1991, DAN will host the first International Workshop for Diving Assistance. Additionally, a worldwide accident insurance program is being investigated. It
is hoped that this international event will provide the basis for a global diving safety network.
DAN has been accomplishing its safety mission by providing a wide variety of medical and advisory
services to recreational divers and physicians.
24-Hour Medical Emergency Hotline (9 1 9-684-8 1 1 1 ) - DAN maintains a 24-hour
emergency service to provide injured divers with medical consultations and referrals. This service is
free to everyone. DAN receives over 1,000 emergency calls each year.
Non-Emergency Advisory Line (9 1 9-684-2948) - DAN maintains an information
hotline to provide answers for commonly asked questions about scuba diving medicine and safety.
1989 Report on Diving Accidents and Fatalities fiS
http://rubicon-foundation.org
These include fitness for diving, medications and diving, and advice in areas of scuba safety. Callers
- may be referred to physicians who specialize in dive medicine. Calls are answered 9 a.m. to 5 p.m.,
EST, Monday through Friday. This service is free to everyone. The DAN medical information line
now handles over 8,000 calls each year.
Alert Diver - Alert Diver is the official newsletter of Divers Alert Network. Alert Diver is auto-
matically sent to each DAN member every other month. Issues are also distributed free to medical
professionals, government and law enforcement agencies, and at diving trade shows. Alert Diver is
the industry leader in providing the latest in diving medical safety information.
Diving Safety Courses - Hundreds of divers have benefited from DAN'S One-Week and One-
Day Diving Seminars. These seminars are CME and CEU accredited and offer continuing education
hours for medical professionals. DAN'S Oxygen First Aid in Dive Accidents program is a new and
exciting course to teach the basics of administering oxygen to injured divers. All DAN courses pro-
vide recreational divers an unrivaled opportunity to increase their awareness and level of understand-
ing of diving injuries and accident management.
Dive Accident Insurance - Divers Alert Network pioneered diving injury insurance for rec-
L reational divers. Diving injuries such as decompression sickness, air embolism, and pulmonary
barotrauma are all covered. Also included under this plan are emergency air evacuation and all in-
water injuries. DAN members are protected no matter where they dive.
Annual Report on Scuba Diving Accidents - DAN collects and analyzes recreational
diving injuries in an annual report. Trends in injuries, types of injuries, and effectiveness of treat-
ment are reviewed each year. Identifying specific causes of diving injuries and common denomina-
tors is very useful in educating the diving public in the prevention of accidents.
Report on Diving Fatalities - The latest DAN service to the diving public is a collection
and analysis of recreational scuba diving fatalities. Mortality studies are valuable in identifying
specific causes of death, such as experience, activity, and health. By publishing this report, DAN
hopes to increase diver awareness and ultimately attempt to reduce diving deaths.
1989 Report on Diving Accidents and Fatalities
http://rubicon-foundation.org
1.0 (Introduction to Dive Fatalities
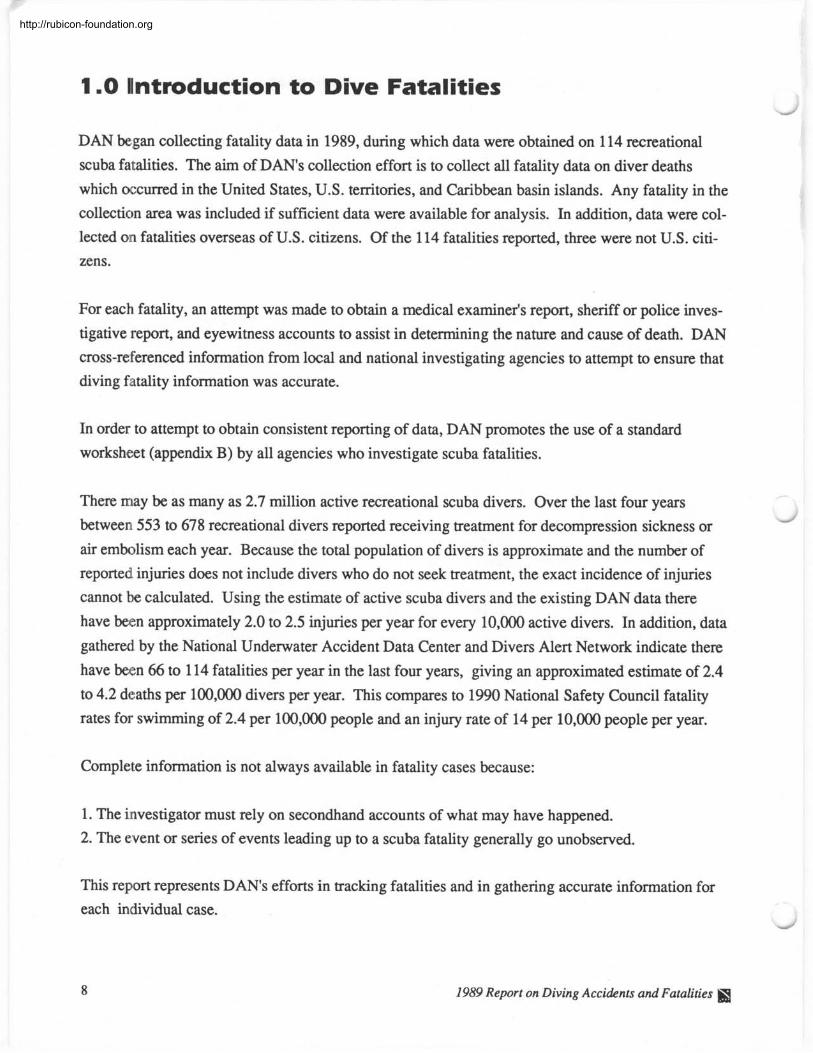
DAN be.gan collecting fatality data in 1989, during which data were obtained on 114 recreational
scuba fatalities. The aim of DAN'S collection effort is to collect all fatality data on diver deaths
which occurred in the United States, U.S. territories, and Caribbean basin islands. Any fatality in the
collection area was included if sufficient data were available for analysis. In addition, data were col-
lected on fatalities overseas of U.S. citizens. Of the 114 fatalities reported, three were not U.S. citi-
zens.
For each fatality, an attempt was made to obtain a medical examiner's report, sheriff or police inves-
tigative report, and eyewitness accounts to assist in determining the nature and cause of death. DAN
cross-referenced information from local and national investigating agencies to attempt to ensure that
diving fatality information was accurate.
In order to attempt to obtain consistent reporting of data, DAN promotes the use of a standard
worksheet (appendix B) by all agencies who investigate scuba fatalities.
There may be as many as 2.7 million active recreational scuba divers. Over the last four years
between 553 to 678 recreational divers reported receiving treatment for decompression sickness or
air embolism each year. Because the total population of divers is approximate and the number of
reported injuries does not include divers who do not seek treatment, the exact incidence of injuries
cannot be calculated. Using the estimate of active scuba divers and the existing DAN data there
have been approximately 2.0 to 2.5 injuries per year for every 10,000 active divers. In addition, data
gathered by the National Underwater Accident Data Center and Divers Alert Network indicate there
have been 66 to 114 fatalities per year in the last four years, giving an approximated estimate of 2.4
to 4.2 deaths per 100,000 divers per year. This compares to 1990 National Safety Council fatality
rates for swimming of 2.4 per 100,000 people and an injury rate of 14 per 10,000 people per year.
Complete information is not always available in fatality cases because:
1. The investigator must rely on secondhand accounts of what may have happened.
2. The event or series of events leading up to a scuba fatality generally go unobserved.
This report represents DAN'S efforts in tracking fatalities and in gathering accurate information for
each individual case.
1989 Report on Diving Accidents and Fatalities
http://rubicon-foundation.org
2.0 Methods of Fatality Data Collection
Table 2.1 First Contact
1 Legal/ Investigative ** 1 14 1 12.3% 1
DAN Membership
Subscription Services * DAN Emergency Hotline
1 NUADC *** 11 9.6%
39
26
15
1 Medical Examiners 1 3 I 2.6% 1
34.2%
22.8% 13.2%
Chambers
* LUCE and COMPUSERVE ** SherifflPo1icelU.S. Coast Guard *** National Underwater Accident Data Center
6
I I
Reports from DAN membership and emergency hotline account for almost 50 percent of all first
contact sources on fatalities. Subscription (or news) services also provide DAN with much of its in-
formation on diving fatalities. Secondary contributions to the number of diving fatalities are made
by the U.S. Coast Guard, medical examiners, private physicians, law enforcement agencies, and
DAN'S national network of hyperbaric chambers. After initial contact, a series of calls are made to
local sheriff or police departments, medical examiner offices, and when necessary to an eyewitness
or family member. Sufficient information is usually contained in most investigative reports.
5.3%
TOTAL
IS 7959 Report on Diving Accidents and Fatalities
114 100%
http://rubicon-foundation.org
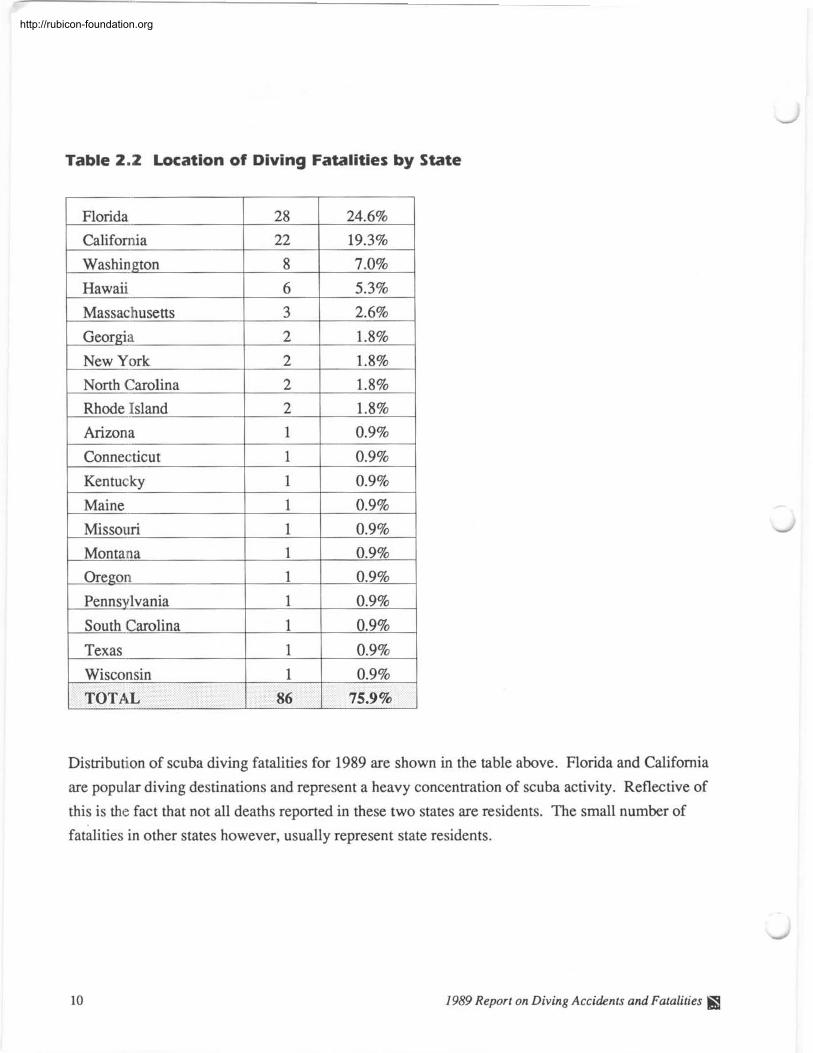
Table 2.2 Location of Diving Fatalities by State
Distribution of scuba diving fatalities for 1989 are shown in the table above. Florida and California
are popular diving destinations and represent a heavy concentration of scuba activity. Reflective of
this is the fact that not all deaths reported in these two states are residents. The small number of
fatalities in other states however, usually represent state residents.
1989 Report on Diving Accidents and Fatalities fQ
http://rubicon-foundation.org
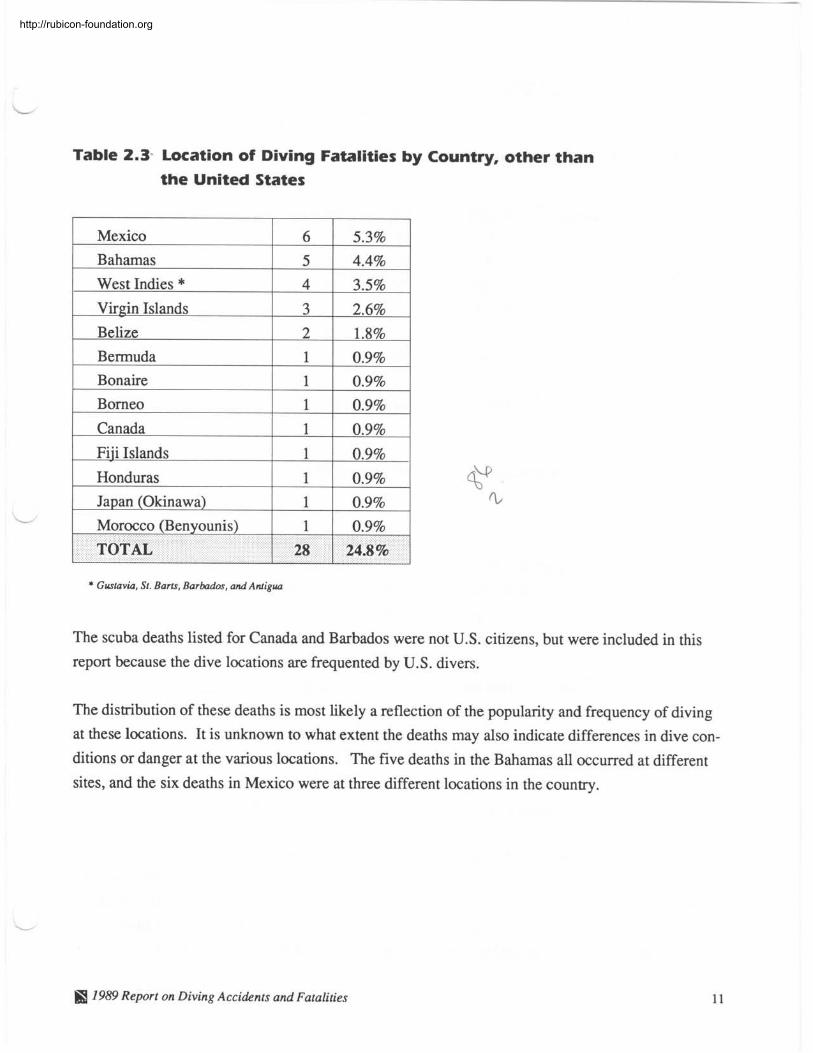
Table 2.3- Location of Diving Fatalities by Country, other than
the United States
Mexico
1 West Indies * 4 1 3.5% I
6 1 5.3% Bahamas
Virgin Islands 3 1 2.6% I
I 1
5 1 4.4% I I
Belize 2 1 1.8% Bermuda 1 I 0.9% Bonaire
1 Canada 1 1 0.9% I
I I
1 1 0.9% Borneo
Honduras 0.9%
0.9%
I I
1 1 0.9% I
* Gustavia, St. Barfs, Barbados, and Migua
L
The scuba deaths listed for Canada and Barbados were not U.S. citizens, but were included in this
report because the dive locations are frequented by U.S. divers.
The distribution of these deaths is most likely a reflection of the popularity and frequency of diving
at these locations. It is unknown to what extent the deaths may also indicate differences in dive con-
ditions or danger at the various locations. The five deaths in the Bahamas all occurred at different
sites, and the six deaths in Mexico were at three different locations in the country.
Morocco (Benyounis)
TOTAL
H 7989 Report on Diving Accidents and Fatalities
1
28 0.9%
24.8%
http://rubicon-foundation.org
3.0 Diver Population
Table 3.1 Age and Sex Comparisons
[_AgeGroup 1 Number 1 Percent Male Female
In 1989, scuba fatalities occurred among individuals ranging from 10 to 71 years of age. The age
distribution is listed above.
The fatality cases were made up of 104 males and 10 females. The females represent only 8.8
percent of the total fatality group. This may indicate a greater proportion of male divers. The male-
female proportion of dive fatalities contrasts to the percentage of females who experienced dive
injuries requiring recompression therapy in 1987 to 1989 (24.5 percent). Additionally, a random
sample of insured DAN members (n=695) revealed a female population of 27.1 percent.
Alternatively, perhaps males perform more difficult and hazardous diving, as suggested by the
under-representation of female deaths in the age group 20-29. Or, perhaps the causes of death
among divers were not as likely to afflict females. Females appear to be underrepresented in deaths
in the age ranges of 20-29 and 60-79, however, the number of female fatalities is so small that differ-
ences in age distributions are not statistically significant. Analysis of future yearly data will provide
some idea of how reliable this data is.
The activity and experience of the females also seems to have played a role in these deaths. Of the
ten fatalities represented by this group, three women were receiving instruction, and another four had
questionable health (including one myocardial infarction by autopsy). The three other female fatali-
ties involved one instructor who died as the result of injuries sustained while freeing line from a boat
prop; one newly certified diver, and one woman who had indicated reluctance to make the dive.
12 1989 Report on Diving Accidents and Fatalities
http://rubicon-foundation.org
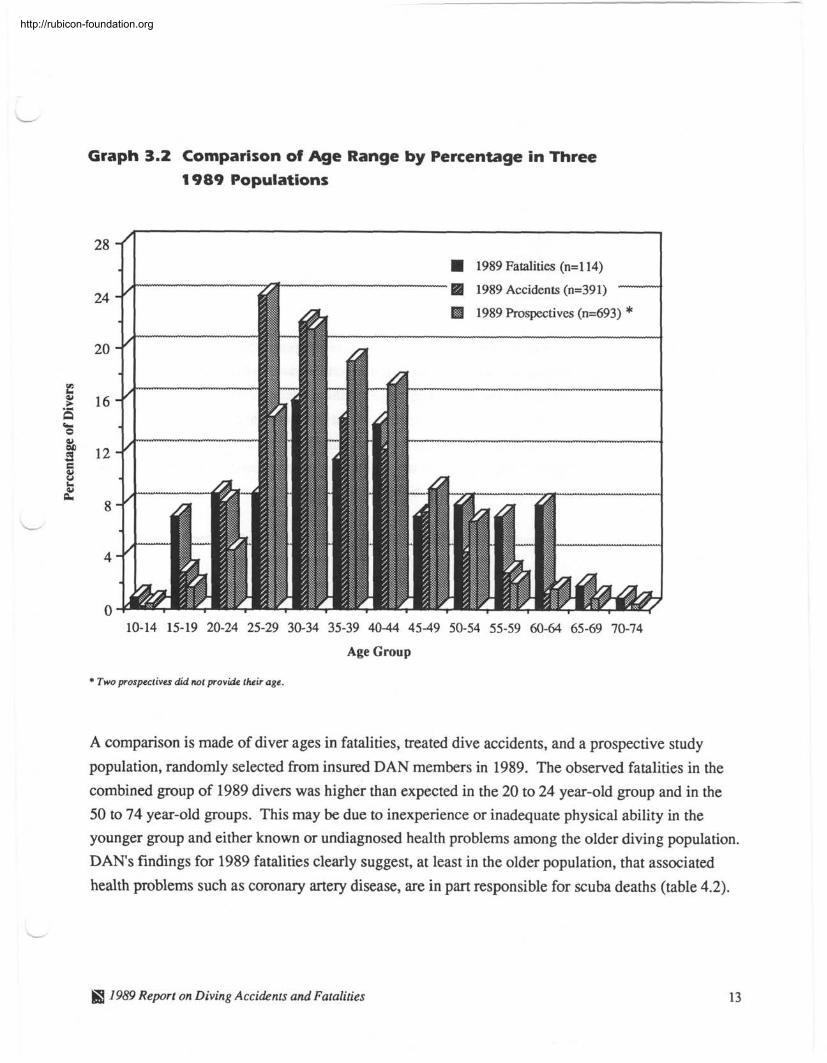
Graph 3.2 Comparison of Age Range by Percentage in Three
1989 Populations
1989 Fatalities (n=l14)
10-14 15-19 20-24 25-29 30-34 35-39 40-44 45-49 50-54 55-59 60-64 65-69 70-74
Age Group
* Two prospectives did not provide their age.
A comparison is made of diver ages in fatalities, treated dive accidents, and a prospective study
population, randomly selected from insured DAN members in 1989. The observed fatalities in the
combined group of 1989 divers was higher than expected in the 20 to 24 year-old group and in the
50 to 74 year-old groups. This may be due to inexperience or inadequate physical ability in the younger group and either known or undiagnosed health problems among the older diving population.
DAN'S findings for 1989 fatalities clearly suggest, at least in the older population, that associated
health problems such as coronary artery disease, are in part responsible for scuba deaths (table 4.2).
1959 Report on Diving Accidents and Fatalities
http://rubicon-foundation.org
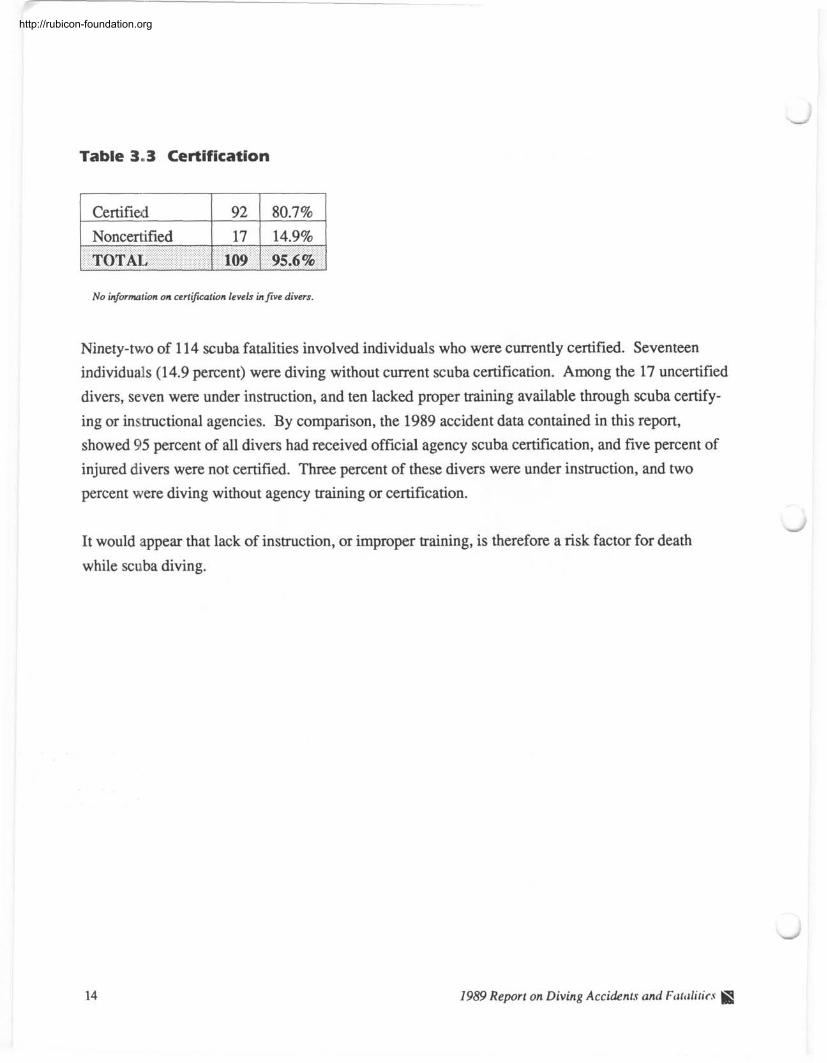
Table 3..3 Certification
Certified
No information on certification levels in five divers.
Ninety-two of 114 scuba fatalities involved individuals who were currently certified. Seventeen
individuals (14.9 percent) were diving without current scuba certification. Among the 17 uncertified
divers, seven were under instruction, and ten lacked proper training available through scuba certify-
ing or in~~tructional agencies. By comparison, the 1989 accident data contained in this report,
showed 95 percent of all divers had received official agency scuba certification, and five percent of
injured divers were not certified. Three percent of these divers were under instruction, and two
percent were diving without agency training or certification.
It would appear that lack of instruction, or improper training, is therefore a risk factor for death
while scuba diving.
1989 Report on Diving Accidents and Fatalities
http://rubicon-foundation.org
Table 3.4 Diving Experience
1 Noncertified 1 17 I 14.9% 1
1 Inexperienced (6 - 20 dives) 1 34 1 29.8% 1 Novice (< 5 dives)
TOTAL 106 1 92.9%
16
Intermediate (21 - 40 dives)
Advanced (41 - 60 dives)
Experienced (2 6 1 dives)
Eight divers missing information.
14.0%
The divers level of experience, and the criteria used to establish this level of experience, is listed in
table 3.4. It is difficult in fatality cases to obtain the exact number of dives and years the individual
has been diving. Therefore, analysis is based upon the number of dives reported to have been made
- by each individual. Nearly sixty percent of all fatalities occurred in divers who made 20 dives or
less in their entire dive career. Additionally, some divers in the intermediate to experienced level
were infrequent divers who only used scuba once yearly.
17 5
17
The data at this point would seem to support the assumption that a relatively inexperienced group of
divers account for the majority of scuba fatalities. However, it is possible that the greatest propor-
tion of diving is done by divers who only take up the sport for a short period of time. Therefore, the
fact that most accidents occur in inexperienced divers could be merely an artifact of that statistical
distribution of divers.
14.9% 4.4%
14.9%
I 1989 Report on Diving Accidents and Fatalities
http://rubicon-foundation.org
4.0 Diver Health
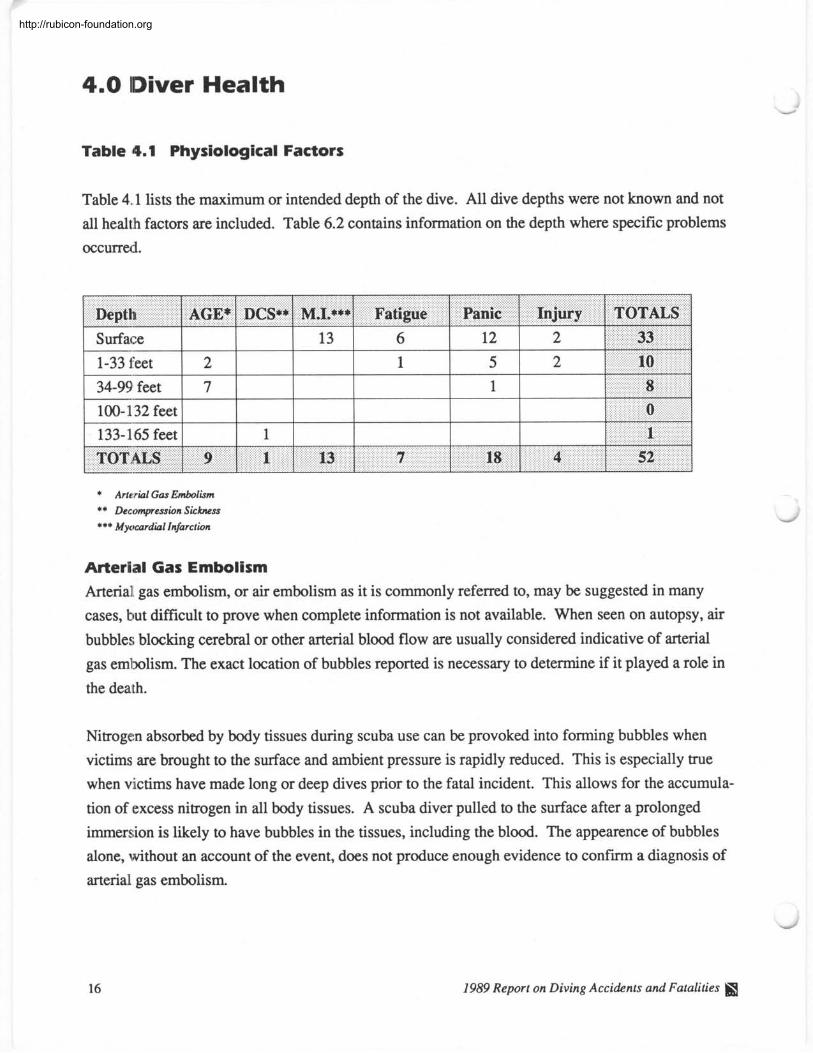
Table 4.1 Physiological Factors
Table 4.1 lists the maximum or intended depth of the dive. All dive depths were not known and not
all health factors are included. Table 6.2 contains information on the depth where specific problems
occurred.
Depth 1 AGE* 1 D C S ~ M.L***~ Fatigue 1 Panic 1 Injury 1 TOTALS 1 Surface 1 1 1 13 1 6 1 2 1 2
* Arterial Gas Embolism ** Decompression Sickness *** Myocardial Infarction
Arterial Gas Embolism Arterial gas embolism, or air embolism as it is commonly referred to, may be suggested in many
cases, but difficult to prove when complete information is not available. When seen on autopsy, air
bubbles blocking cerebral or other arterial blood flow are usually considered indicative of arterial
gas embolism. The exact location of bubbles reported is necessary to determine if it played a role in
the death.
Nitrogen absorbed by body tissues during scuba use can be provoked into forming bubbles when
victims are brought to the surface and ambient pressure is rapidly reduced. This is especially true
when victims have made long or deep dives prior to the fatal incident. This allows for the accumula-
tion of excess nitrogen in all body tissues. A scuba diver pulled to the surface after a prolonged
immersion is likely to have bubbles in the tissues, including the blood. The appearence of bubbles
alone, without an account of the event, does not produce enough evidence to confirm a diagnosis of
arterial gas embolism.
1989 Report on Diving Accidents and Fatalities
http://rubicon-foundation.org
The most common associated event in air embolism cases is a rapid ascent causing pulmonary over-
pressurization. Any activity that would interfere with a patent airway places the diver at risk for an
embolic event. It is important to know what the diver was doing during the dive and the exact nature
of the ascent to the surface. It is also important to know if there was a medical history of obstructive
or restrictive airway disease. Autopsy reports are also reviewed for evidence of respiratory disease.
Illnesses such as pneumonia, emphysema, and asthma could potentially block the free flow of air out
of the lung and trap small volumes of expanding gas in lung alveoli. There were no known asthmat-
ics in the 1989 fatalities, but there was one individual with emphysema by history and autopsy
report. Medical histories remain difficult to obtain, and it is possible that the underrepresentation of
asthmatics among the fatalites is an artifact of incomplete data collection. Efforts are increasing to
achieve more thorough histories on each fatality.
Air embolism (AGE) is listed as the cause of death for nine divers, and as a possible cause of death
for three other divers. Where it was possible, three factors were considered in order to arrive at the
diagnosis of air embolism:
1. An eyewitness account of the dive.
2. A knowledge of any symptoms following the dive.
3. Autopsy results listing cerebral air bubbles.
In five cases, these three factors were met. Accounts of the five dives revealed rapid ascents from
24,25,40, and 40 feet, and one breathhold ascent from 35 feet. Upon reaching the surface, all were
unconscious, and two were bleeding from the mouth. Autopsy findings revealed cerebral air bubbles
in all five instances with two reports of subcutaneous emphysema.
Four cases did not contain enough information for the above criteria to be complete. However, the
sequence of events provided a strong case for the diagnosis of air embolism. The following is a
summary of information in these four cases:
38 year-old male diver was diving at a depth of 50 feet, was caught in an upcurrent and shot rapidly
to the surface. The diver was recovered immediately and was found to be unconscious. There was
no pulse or heartbeat, and the victim could not be revived with CPR.
68 year-old male diver was diving alone with a topside observer. An observer stated that the diver
surfaced after having dived for approximately 45 minutes at a depth of about 40 feet. The diver
surfaced, hung onto a rock, and immediately began yelling for help. He then collapsed after a
SB 1989 Report on Diving Accidents and Fatalities
http://rubicon-foundation.org
minute or two. The medical examiner reported "cerebral bubbles and columns of gas" and diag-
nosed "apparent air embolization versus possible drowning." An examination of the equipment
revealed 700 psi in the tank, and the tank contained some water. This may have interfered with the
proper functioning of the regulator, compromising the diver's ability to breath from the tank in cold
water, possibly resulting in an inadvertant breath hold during ascent.
41 year-old male diver was diving with a buddy at night. They were at a depth of 40 feet with
rough water above and below the surface. The buddies separated, and subject was found six hours
later near the shore in five feet of water. The diver was wearing twin air tanks, but a tank pressure
reading was not obtained. The coroner reported, "systemic air embolism as a consequence of pul-
monary barotrauma after an apparent rapid ascent." This is a typical case where there simply isn't
enough evidence to determine if the victim embolized sometime during the ascent from the dive or simply ran out of air. Trans-pulmonary passage of air into the arterial tree could have occurred .
during recovery of the victim from a shallow depth.
32 year-old male diver became trapped at 85 feet in a cave. He was recovered after one-and-a-half
hours. When discovered, the diver was not wearing his face mask or tank; his tank pressure was
800 psi. The autopsy disclosed "air within vascular channels," and the medical examiner diagnosed
"air embolization." However, the time to recovery of the body and the fact that the autopsy report
does not specify the location of the air bubbles makes it difficult to draw a firm conclusion of air em-
holism.
Air embolism is considered a possible cause of death in three cases:
62 year-old female diver, off the coast of Belize, came out of the water in distress and then col-
lapsed. A U.S. Embassy official confirmed that she died in an island medical clinic. The reported
cause of death was pulmonary embolism, but no autopsy results were available.
38 year-old diver is thought to have died as a result of a strong up-current causing a rapid ascent
from 30 feet. The diver was recovered immediately. Although little is known about this diver, au-
topsy findings of "small bubbles in the meningeal vessels" lends support to air embolism in this
case.
19 year-old diver ran out of air at 90 feet. The diver made a normal ascent to 30 feet, panicked,
then sank to the bottom. The body was found one hour later at 100 feet. The medical examiner's
report listed "systemic air embolus due to barotrauma as a consequence of rapid ascent while scuba
diving" as the cause of death.
1989 Report on Diving Accidents and Fatalities I
http://rubicon-foundation.org
- Decompression Sickness A medical examiner's report listed one death as decompression sickness (DCS). Autopsy evidence
also suggested some pulmonary over-expansion injury. This 33-year-old male diver died during re-
compression therapy, so direct evidence of bubbles may have been eliminated. The diver had a
history of DCS on several occasions with various symptoms including: episodes of paralysis, incoor-
dination, speech, and visual problems.
Injury
Four deaths resulted from injury other than DCS or air embolism, and all four incidents involved a
boat. A buddy team surfaced into a boat propeller killing both divers. A boat propeller also killed a
female diver who was freeing a tangled line around the propeller shaft. One diver was struck by a
speeding boat and died.
Myocardial Infarction Myocardial Infarction (M.I.) was the listed cause of death on the medical examiner's report in five
cases. However, a higher incidence of myocardial infarction is suggested by the case information.
In four cases where the sequence of events seem to indicate a myocardial infarction, asphyxia due to
- drowning is the stated cause of death. Eyewitness accounts, family interviews, and local contacts
provide the evidence for four more apparent myocardial infarctions. Overall, there were thirteen
divers suspected of having experienced a myocardial infarction. This figure represents 1 1.4 percent
of the total fatality population.
All 13 myocardial infarctions occurred on the surface, three just prior to the dive, and the remaining
ten post-dive before they could exit the water or within minutes of surfacing. The diagnosis of
myocardial infarction is supported by medical fact in nine of these cases (autopsies revealed evi-
dence of coronary artery disease in these nine cases). The other four cases of myocardial infarction
rely on information obtained through witness accounts of the dive and through family interviews
revealing previous medical problems. The following is a summary of information in these four
cases:
51 year-old male diver was very experienced, and reportedly very fit. He complained of chest pain
and shortness of breath on the surface prior to making the first dive of the day. He was seen hanging
onto the anchor line prior to descent. The diver had a known medical history of hyperuricemia two
years previous, but this is not considered a contributing factor in his death.
1989 Report on Diving Accidents and Fatalities
http://rubicon-foundation.org
62 year-old male diver was experienced and had no past medical history. Ten minutes into the
dive, the diver signaled to his buddy that he wished to surface. After a normal ascent, he went to the
anchor line and then collapsed. CPR was ineffective.
63 year-old male diver was on the surface following an uneventful dive. He was talking comforta-
bly with his buddy on the surface when he suddenly collapsed. The diver was revived with CPR, and said, "That was close, I felt like I had a heart attack or something." He then collapsed again
without warning. Attempts at resuscitation were not successful.
62 year-old male diver had a history of "weakness in the legs after diving or exertion," The diver
left the dive group early, after only seven minutes, and was observed making a normal ascent from
65 feet to the surface. On the surface, the diver lost consciousness and was brought aboard immedi-
ately by the boat captain, who tried unsuccessfully to revive him with CPR.
In only three of thirteen myocardial infarction cases was the medical condition diagnosed prior to the
dive. In seven of the myocardial infarction cases, the medical condition was not diagnosed prior to
the dive. One diver had a history of high blood cholesterol, one diver had a history of leg weakness
during dives, and there is no known medical history on another diver.
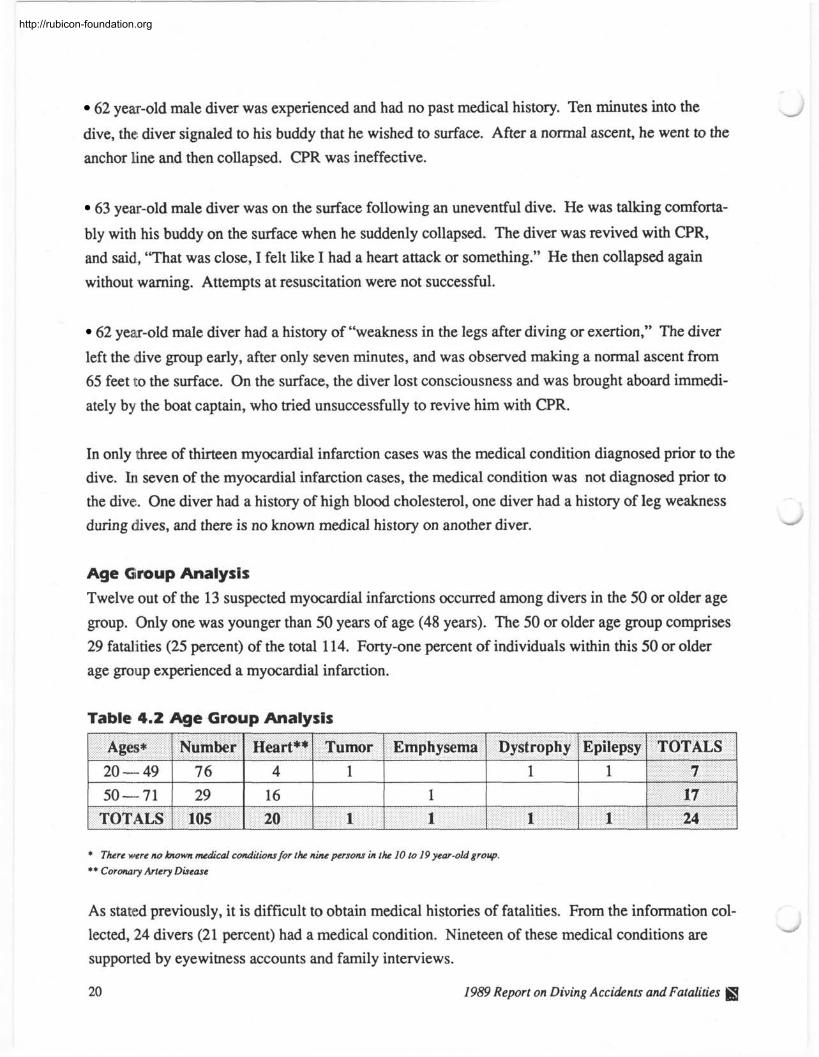
Age Group Analysis
Twelve out of the 13 suspected myocardial infarctions occurred among divers in the 50 or older age
group. Only one was younger than 50 years of age (48 years). The 50 or older age group comprises
29 fatalities (25 percent) of the total 114. Forty-one percent of individuals within this 50 or older
age group experienced a myocardial infarction.
Table 4.2 Age Group Analysis
s * 1 Number ] ~ e a r t * * 1 Tumor 1 Emphysema 1 Dystrophy 1 Epilepsy 1 TOTALS 1 I I I I I I 1
TOTALS 1 105 1 20 1 1 1 1 24
* There were no bwwn medical conditions for the nine persons in the 10 to 19 year-old group.
** Coronary Artery Disease
As stated previously, it is difficult to obtain medical histories of fatalities. From the information col-
lected, 24 divers (21 percent) had a medical condition. Nineteen of these medical conditions are - supported by eyewitness accounts and family interviews.
20 1989 Report on Diving Accidents andFatalities
http://rubicon-foundation.org
By Age Group In the 2 50 year old age group, there are 17 out of a population of 29 (or 59 percent) with known or
suspected medical conditions. Out of these 17 medical conditions, 12 are supported by medical ex-
aminer findings or clinical histories. The following is a listing of the 12 documented conditions:
50 year-old female with a history of high serum cholesterol, and evidence of "small infarcts of the
lower IV septum of the myocardium, old and fresh" on autopsy.
50 year-old male with evidence of "complete occlusion of the left anterior descending coronary ar-
tery'' on autopsy.
62 year-old male with a history of high serum cholesterol, "80 percent occlusion of a coronary
artery" per cardiac catheterization results, and a "silent myocardial infarction" per routine ECG.
56 year-old male with evidence of "irregular dilatation of the alveoli with focal interstitial fibrosis"
(emphysema) on autopsy.
55 year-old male with evidence of "coronary artery disease" on autopsy.
57 year-old male with a history of triple bypass surgery performed five months prior to death. The
body was not recovered.
60 year-old male with a history of hypertension over the past six years.
52 year-old male with a history of hypertension, and evidence of both cardiovascular and cere- brovascular disease on autopsy (cardiomegaly with biventricular hypertrophy, intracerebral, and
recent subarachnoidal hemorrhages).
58 year-old female with evidence of "congestive heart failure" on autopsy.
62 year-old male with evidence of "massive myocardial infarction" on autopsy.
71 year-old male with evidence of "severe aortic atherosclerosis" on autopsy.
54 year-old male with evidence of "80 percent occlusion of a coronary artery" on autopsy. -
1989 Report on Diving Accidents and Fatalities
http://rubicon-foundation.org
The five undocumented medical conditions in the 2 50 year old age group follows They are the
same cases as those listed in the myocardial infarction population with the addition of one case:
51 year-old male was visibly fatigued and required flotation assistance at the surface. Buddy ob-
served that subject was struggling and clinging with one arm to an inner tube. Before his buddy
could reach him, subject collapsed facedown in the water.
All seven medical conditions in the 20 to 49 year-old age group are supported by medical documen- tation, phone interview, or investigators' report.
The seven documented medical conditions in the 20 to 49 year-old age group are as follows:
coronary artery disease (4), brain tumor (I), mild muscular dystrophy (I), and epilepsy (no history
available) (1).
1989 Report on Diving Accidents and Fatalities
http://rubicon-foundation.org
5.0 Dive Profile
Table 5.1 Dive Activity
1 Sightseeing 1 70 1 61.4% I
1 Wreck Divine 1 6 1 5.3% 1
Under Instruction
Cave Diving
S pearfishing,,Game Collecting
1 Night Dive* 1 5 1 4.4% 1 1 Ice Diving**
12 10 9
1 Photography 1 1 1 0.9% 1
10.5% 8.8% 7.9%
- - - I I
TOTAL 1 121 1 106.3%
Four night dives were also sightseeing dives, and one was also a work/task dive.
** One ice dive was also a photography dive, and one was also a sightseeing dive.
Seven divers were involved in more than one dive activity at the time of their death which is re-
flected in the total of 121 activities.
Over 60 percent of dive fatalities occurred while the diver was sightseeing. One cannot infer from
the number of pleasure or sightseeing dives that it carries any higher risk for the diver than any other
style of diving. Since sightseeing or pleasure diving is by far the most popular single activity while
scuba diving, it is within reason that most fatalities would occur during this activity.
Divers who were under instruction was the next most common activity and involved 12 deaths. Four
different areas of being under instruction were identified in these 12 fatalities. Six of these 12 deaths
occurred in divers who were seeking their initial scuba certification. Three more deaths occurred in
certified divers who were under instruction for advanced certification, such as divemaster or ad-
vanced diver. There were two fatalities in certified divers that were very inexperienced and were
participating in a guided scuba activity for inexperienced divers in the Caribbean. Another fatality
occurred in a certified diver who was being trained in the use of a dry suit.
H 7989 Report on Diving Accidents and Fatalities
http://rubicon-foundation.org
There were ten cave diving fatalities, which was the third most common activity among the 1989
fatality population. As in most previous years, none of the individuals who died while cave diving
in 1989 had received specialty training. Wreck and ice diving pose risks similar to cave diving.
There is always a danger of entrapment and losing one's way, once structures have been penetrated
and visual landmarks are lost. Even brief excursions into enclosed underwater structures pose a
greater risk of death, and therefore require a minimum of safety equipment such as a compass, safety
lines, a secondary air source, extra lights, and a knife, in addition to the normal scuba equipment.
Spearfishing was involved in nine deaths. Like scuba itself, spearfishing holds a certain allure for
divers. Three of these nine divers had 12 or more years of diving experience. Four divers were
relatively inexperienced, one was not certified, and another had unknown certification. The skill of
spearfishing involves not only the accuracy of shooting fish, but maintaining an open airway while
making multiple excursions up, down, and along the contour of the ocean bottom. Attention must
also be paid to depth and pressure gauges to prevent excessive depth and running out of air. Manag-
ing the additional equipment of a spear gun and game collection bag or fish stringer are also of
concern. The bodies of two spear fisherman were never recovered, and one was recovered two days
after being reported missing, having sustained shark trauma apparently post-mortem.
Table 5.2 Dive Platform
p p 1 M/V* Private
Entry 1 Frequency
1 M/V Charter 1 45 1 39.5 1
Percent
TOTAL 114 100.0 J
*Motor Vessel
It is difficult to interpret the dive platform data. There is no record of how many private or charter
(for hire) dive vessels operate in the U.S. However, it would seem logical that more dives arc con-
ducted from charter than from private dive vessels. If the latter is true, then the private dive vessels
would seem to have a disproportionate share of the diving fatalities when compared to the charter
vessels.
1989 Report on Diving Accidents and Fatalities fij
http://rubicon-foundation.org
Table 5.3 Number of Divers in a Group
1 Solo Diving 1 12 1 10.5%
# In Dive Group Frequency
9 10 or more
One diver missing information.
Percent
I I
This table shows the number of divers that were at the scene when the fatality occurred. Diving
alone is not recommended by any of the certifying agencies, yet 10.5 percent of fatalities occurred in
lone divers. Most of the divers chose to dive in a buddy team to:
3
6
TOTAL
1. Share the underwater experience or work together on a specific dive project;
2. Provide an experienced dive partner for less experienced divers;
3. Provide for safety-assistance when the unexpected occurs.
2.6%
5.3%
When only a few divers (2 to 4) participate in any dive activity, the likelihood of immediate assis-
tance and recovery is reduced when an emergency or unexpected event occurs. The 1989 fatality
data indicate that 59 percent of all fatalities occurred in groups of four divers or less. This may have
been due to the lack of immediate assistance, or that divers at higher risk tend to dive with others
who have similar diving habits.
113
1989 Report on Diving Accidents and Fatalities
99.2 %
http://rubicon-foundation.org
Table 5.4 Effective Dive Buddy Teams
B u d d y - Yes
1 More Than Two Buddies 1 3 1 2.6%
Buddy - NO
Two Buddies
Two divers missing information.
Twelve divers started their dive alone, however, table 5.4 shows that a total of 27 divers did not use
the buddy system during their dive. Additional information regarding the overall effectiveness or in-
effectiveness of the buddy system is gained from reviewing eyewitness statements and investigation
agency reports. Sixty-four of all fatalities were not directly observed by the dive buddy or anyone at
the surface. Moreover, in 16 instances where the buddy system was reportedly practiced, the bud-
dies became separated.
27 6
1989 Report on Diving Accidents and Fatalities I
23.7% 5.3%
http://rubicon-foundation.org
6.0 Characteristics of Fatalities
The time and phase of the dive that the fatal accident occurred is listed below. These times are fairly
evenly divided with the exception of post-dive fatalities. The post-dive fatalities contain thirteen
deaths listed as myocardial infarction. Exact times of dives are often difficult to obtain. When the
event went unobserved, the last sighting of the diver, and the scheduled time the dive was to end,
have been used as a guide for the phase of the dive and when the event occurred.
Table 6.1 When Problem Occurred
1 Immediately 1 21 1 5 - 10 Minutes 26 Mid-Dive
1 Late-Dive 1 25 1 1 Post-Dive 1 16 1
Three divers missing information.
I
During Descent At Depth
TOTAL
During Ascent
On the Surface
Cave/Wreck
I l l 1 Under Ice 2 1 1 I
TOTAL 1 111 I
There are a number of conditions in scuba diving that make it inherently dangerous without training,
proper skill, and supervision. These conditions can occur at any depth regardless of what specific
activity a diver is participating in. It is clear from table 6.2 that there is no single cause for fatalities
or any certain depth at which they occur. It has already been noted that all cardiac deaths occurred at
the surface, and this is the single exception in the table.
There were six cases where diver equipment was a problem. Equipment failure is believed to have
possibly caused the death of two individuals. One fatality occurred because a free-flowing regulator
caused panic and a rapid ascent in an adolescent. The other death may have been caused by the
powerband breaking when the diver retracted it to load the speargun.
Equipment can be a factor in accidents even when there is no failure involved. Divers were reported
to have not been familiar with the equipment they were using in seven cases. In six other cases
divers knew they were using at least one piece of faulty equipment Five divers were reported to be
overweighted with 24 to 54 pounds of weight. One can only say that these circumstances most
I likely contributed to the events in the diver deaths and may have hampered self-rescue. They did not
directly cause the deaths.
JS 1959 Report on Diving Accidents and Fatalities
http://rubicon-foundation.org
Table 6.2 What Problem Occurred Where*
Rough LowIOut
Depth # MI AGE DCS Injury Fatigue Panic EntangleTrapped Water Air Equip.
* This table has the primary problem counted only. No factor is counted twice.
- Surface 1-5 6-20 21-33 34-66 67-99 100-132 133-1,65 166-198 199-23 1
232+
The number of cases with successful CPR is not recorded by any agency. There are no valid num-
bers for a comparison between near drowning victims who received CPR and survived, and scuba
diving fatalities where CPR was not effective. There is strong evidence in the general drowning
literature to indicate that survivability is a function of the length of time it takes to establish a patent
airway and effective CPR is begun. The shorter the underwater, non-breathing interval, the better
the chance of survival. We know that scuba has two distinct disadvantages which prolong the
interval after the event and delay immediate rescue. First, special equipment is required to perform
in the underwater environment. This is especially true when depth is a factor in a rescue. Second,
the event is often unobserved, and the time to recovery is increased.
Much of recreational diving is done in the oceans and at sites distant to emergency medical care.
The need for such care is just as urgent in diving accidents as it is for any other land-based injury.
Unfortunately, by the above definition, urgently needed care will be further delayed by distance.
Not all divers know CPR or could perform it, in the event it is needed. Despite the best efforts of
35 7
13 10 18 17 5 2 0 0 3 4
1989 Report on Diving Accidents and Fatalities
9
13
1
2 7
4
1
7
2 2
20
6
1
6
12
3 2 1
1 1
15
2 2 1
1
9
1 2 7 2 3
12
1
2 1 2 2
1
1 6
1
8 2 1
2 2
1
1
http://rubicon-foundation.org
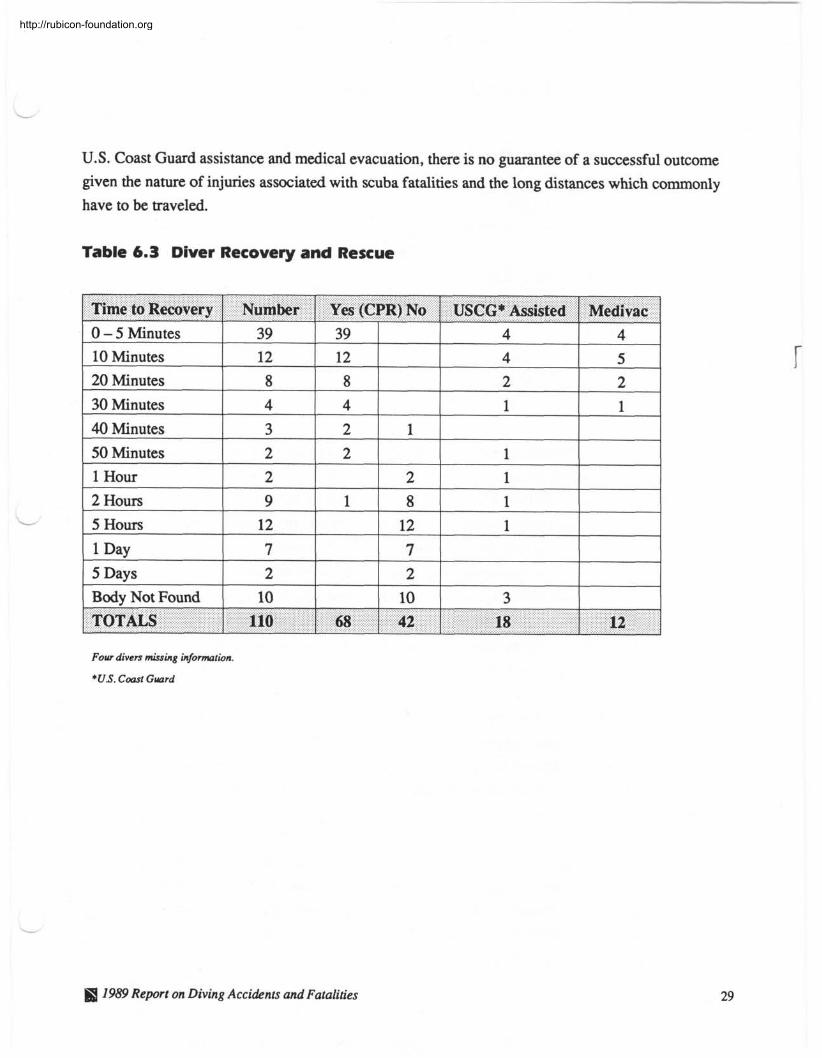
U.S. Coast Guard assistance and medical evacuation, there is no guarantee of a successful outcome given the nature of injuries associated with scuba fatalities and the long distances which commonly have to be traveled.
Table 6.3 Diver Recovery and Rescue
Time to Recovery 1 Number 1 Yes (CPR) No 1 USCG* Assisted 1 Medivac
L
Four divers missing information.
*US. Coast Guard
I I
1989 Report on Diving Accidents and Fatalities
0 - 5 Minutes 10 Minutes 20 Minutes 30 Minutes 40 Minutes 50 Minutes 1 Hour 2 Hours 5 Hours 1 Day 5 Days Body Not Found TOTALS
39 12 8 4
3 2 2 9
12 7 2
10
110 1 68 1 42
39 12 8 4 2 2
1
18 12
1
2 8
12 7 2
10
4 4 2 1
1 1 1 1
3
4
5 2 1
http://rubicon-foundation.org
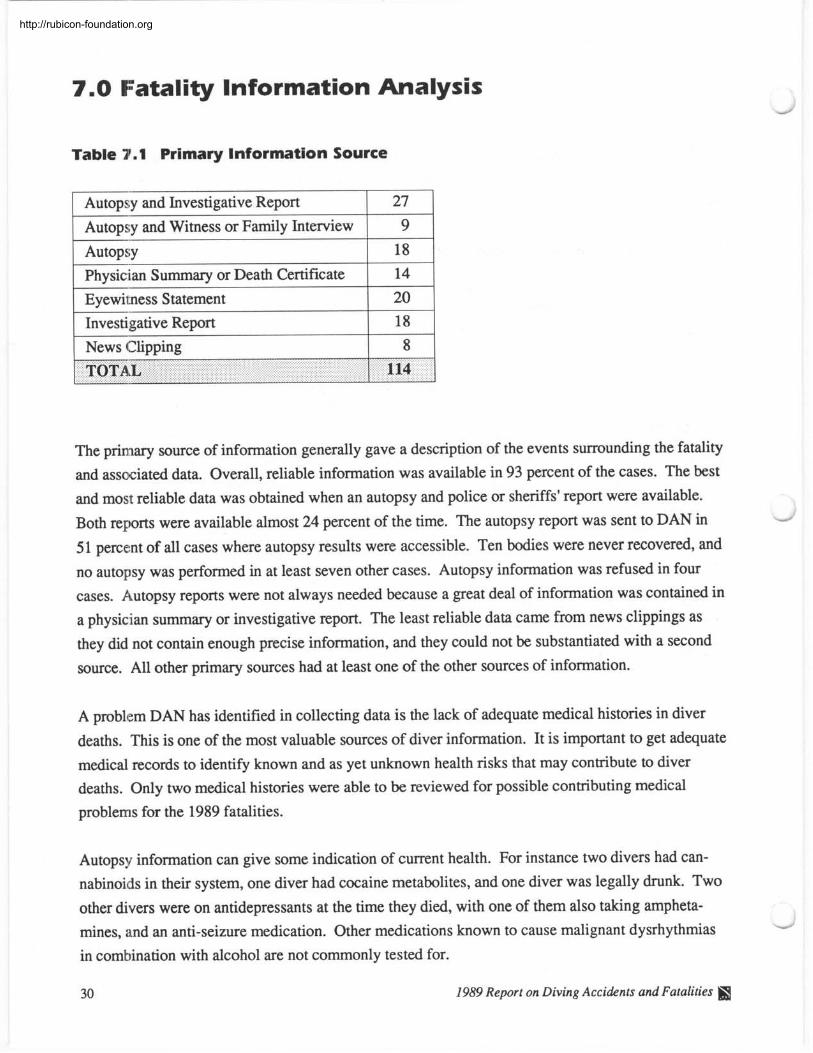
7.0 Fatality Information Analysis
Table 7.1 Primary Information Source
18 News Clipping 8
Autopsy and Investigative Report
Autopsy and Witness or Family Interview
Autopsy Physician Summary or Death Certificate
Eyewitness Statement
The primary source of information generally gave a description of the events surrounding the fatality
and associated data. Overall, reliable information was available in 93 percent of the cases. The best
and most reliable data was obtained when an autopsy and police or sheriffs' report were available.
Both reports were available almost 24 percent of the time. The autopsy report was sent to DAN in
51 percent of all cases where autopsy results were accessible. Ten bodies were never recovered, and
no autopsy was performed in at least seven other cases. Autopsy information was refused in four
cases. Autopsy reports were not always needed because a great deal of information was contained in
a physician summary or investigative report. The least reliable data came from news clippings as
they did not contain enough precise information, and they could not be substantiated with a second
source. All other primary sources had at least one of the other sources of information.
27
9 18 14
20
A problem DAN has identified in collecting data is the lack of adequate medical histories in diver
deaths. This is one of the most valuable sources of diver information. It is important to get adequate
medical records to identify known and as yet unknown health risks that may contribute to diver deaths. Only two medical histories were able to be reviewed for possible contributing medical
problems for the 1989 fatalities.
Autopsy information can give some indication of current health. For instance two divers had can-
nabinoids in their system, one diver had cocaine metabolites, and one diver was legally drunk. Two
other divers were on antidepressants at the time they died, with one of them also taking ampheta-
mines, and an anti-seizure medication. Other medications known to cause malignant dysrhythmias
in combination with alcohol are not commonly tested for.
30 1989 Report on Diving Accidents and Fatalities
http://rubicon-foundation.org
Fatality Summary
Intitial analysis of these preliminary data for the first year of collection suggest that more in-depth
information is needed on a case by case basis for accurate and consistent reporting. The data does
suggest several possible hypotheses for the cause of some of these deaths.
1. A disproportionate number of these deaths may be caused by medical conditions, such as coronary
artery disease, especially in the older male population.
2. The lack of scuba certification by a recognized training agency appears to lead to a high probabil-
ity for death.
3. Diving alone or without the benefit of a dive buddy during scuba activity decreases the chance for
survival when an unexpected underwater event occurs and assistance is required.
In future reports, DAN will continue to look very closely at these hypotheses and other questions
that may come from fatality reporting and analysis.
ffl 1989 Report on Diving Accidents and Fatalities
http://rubicon-foundation.org
8.0 Introduction to Dive Accidents
Divers Alert Network (DAN) celebrated its tenth anniversary in 1990. DAN'S mission has evolved
from its original purpose of assisting injured divers, to compiling and analyzing diving statistics in
order to learn more about what causes diving accidents and how to prevent them. 1989 proved to be
the most fruitful year in terms of information gathering. Five hundred and sixty cases were received
for analysis by DAN. Divers Alert Network receives accident reporting forms from two main
sources: hyperbaric treatment facilities and injured divers. Most of the reports received by DAN
involve Americans or citizens of other countries diving in locations that Americans frequent, how-
ever, reports are received from various places around the world. A copy of the DAN Dive Accident Reporting Form and DAN Fatality Worksheet are provided in appendices A and B.
Accident forms received by DAN are reviewed by medical personnel for completeness and consis-
tency. They are then followed up for a maximum period of three months or until residual symptoms
are resolved. The completed record is then entered into the DAN Diving Accident Database and
analyzed. Appendix C has a list of severity codes DAN uses to classify symptoms.
There were 678 cases reported treated in 1989 compared to 553 in 1988. This represents a 23 per-
cent increase in reported treatments for 1989. This increase is consistent with the increases reported
by some regions of the country. The majority of the increased treatments have come from popular
dive regions which have been well reported in past years. The southwest DAN region containing
California reported an increase of 77 percent in cases treated. The southeast DAN region with
Florida had a 14 percent increase in treatments, and the Caribbean basin reported a 26 percent
increase in total cases treated. Also, Hawaii reported an overall increase of 61 percent in 1989. It is
apparent that these areas represent some of the most popular dive locations in the northern hemi-
sphere. This increase may represent the increasing popularity of scuba, or that more diving is occur-
ring at these popular locations.
General Information The collection of injury statistics presented in the 1989 Report on Diving Accidents and Fatalities attempts to shed light on the often uncertain causes of scuba diving related injury and death. DAN
uses this yearly report in addition to articles and seminars throughout the year to educate the diving
public. It is DAN'S hope that increased education will lead to increased diving safety awareness.
1989 Report on Diving Accidents and Fatalities I
http://rubicon-foundation.org
Research and education are key to preventing diving accidents. With this in mind, DAN is expand- ing its services to better serve the diver. DAN has made its hotline more accessible, trained more
medical staff to answer non-emergency questions, enlarged its educational programs, and stepped up
its research efforts to make diving as safe as possible.
Technical Information In 1989, DAN collected information on 560 injured divers. From these divers, 391 accident forms
were completed and verified. These completed reports were used as the basis for this 1989 annual
report. The DAN Dive Accident Reporting Form has 7 1 different questions, and includes such
information as age, sex, dive profile, level of certification, and current health. DAN has looked for
significant correlations between these data, and common statistical terms are used to describe the
central tendencies of our sample population, in this case, injured divers.
In some tables, the total doesn't equal the sample population of 391 for 1989. This is because divers
fill out their own form. On some questions they might not remember what they did pre-dive, and
thus would leave it blank. This creates what is called a "null field" in the database and is respon-
sible for the "no response" or "frequency missing" footnote. However, DAN has endeavored to
follow up as completely as possible with each diver.
a 1989 Report on Diving Accidents and Fatalities
http://rubicon-foundation.org
9.0 Diver Characteristics -"
This secti,on lists epidemiological information on the population of injured divers. As of yet, we can
not compare injured divers to a normal population. Future studies will give us this capability. For
now, however, these arc known characteristics for the data on injured scuba divers.
Age The mean age of 1989 injured divers was 34 years, with the range being 13-63 and the median being
33. Numerically there was an increase in every age category except the 10-14 year-olds. Percen-
tagewise, only the 15-19 and the 55-59 year-old age groups showed a notable increase from the 1988
figures. The 15-19 year-olds nearly doubled while the 55-59 year-olds quadrupled. The 25-29 year-
olds and the 30-34 year-olds represented 46 percent of the entire injured population. Table 9.1 lists
the age distribution.
Table 9.1 Age Distribution of 1989 Accident Cases
I I 1
TOTALS 1 391 1 100.0 289 1 102 1
Sex
In 1989, women had 26 percent of the total diving accidents, however, the number of women who
were injured rose from 58 in 1988 to 102 in 1989, which is almost double the number from 1988.
Yet, the actual percentage increase from 1988 is 4 percent. This slight increase may be due to better
Females
34 1989 Report on Diving Accidents and Fatalities \
Males Percent Age Frequency
http://rubicon-foundation.org
accident collection and follow-up, or perhaps that more women are now diving. Table 9.2 shows the
L
gender of the 1989 diving injuries.
Table 9.2 Sex of 1989 Accident Cases
1 Female Divers 1 102 1 26.1 1 Sex
1 Male Divers 1 289 1 73.9 1
Frequency 1 Percent
Certification Level
Fifty-two percent of the 1989 divers held beginning level certification or were in the process of
being certified (student, basic, or open water). Forty-five percent were trained at advanced levels
with three percent listing other or unknown, as shown in table 9.3. It should be noted that the diver
listing commercial certification was diving recreationally at the time of his injury.
I I . - - -
Table 9.3 Certification Level of 1989 Accident Cases L
TOTAL 391
Certification 1 Male
I 1989 Report on Diving Accidents and Fatalities
100.0
Student
Basic
Open Water
Advanced
Divemaster
Instructor
Commercial
Other
Unknown
TOTALS
I I
Female 1 Totals Percent 6
22
115
8 1
22
32
1
4
6 289
6
8
47
28
2
9
0
2
0
102
12
30
162
109
24
41
1
6
6
391
3.07
7.67
41.43
27.88
6.14
10.49
0.26
1.53
1.53
100.00
http://rubicon-foundation.org
Table 9.4 Diver Experience by Sex
Frequency missing = 39
Female
Frequency missing = 32
1989 Report on Diving Accidents and Fatalities
http://rubicon-foundation.org
Experience There is not necessarily a correlation between the number of years diving and individual experience.
Although a diver might have been certified for 10 years, they could have made 20 dives or just two
dives per year. A diver may make more than 20 dives in their first year, but this doesn't mean they
are experienced. The essential quality of experience is the ability to apply previously learned skills
to new underwater situations.
For the purpose of research, we have established a minimum level of experience as two years of
diving and more than 20 total dives. That is, if a diver has made twenty dives or less, they are
placed into the novice category. This novice category also includes divers with less than two years
of diving experience.
Thirty-three percent (129 of 391) of the 1989 injured divers fall into this category. Eighty-four
percent (31 of 37) of the divers with buoyancy control problems fall into this category of novice diver. Fifty-two percent (13 of 25) of the out-of-air situations and 53 percent (60 of 114) of the rapid
ascents were also associated with novice divers. Table 9.4 gives the number of dives by sex and
years diving.
1959 Report on Diving Accidents and Fatalities
http://rubicon-foundation.org
Graph 9.5 New Diver Profile Traits
Outs ide L i m i t s
Rap id Ascent 03 0 * u => 80 FSW E
Square D i v e s .- Qi
Repet D ive
=< 20 D i v e s li , , , / l ' l ' l ' l ' l ' l ' l ' l '
0 10 20 30 40 50 60 70 80
Percentage of 114 New Divers
In the 1989 data set, 114 divers had less than two years of diving experience. Of the 114 divers, 72 percent (82 of 114) had made 20 dives or less. Fifty-nine percent of the 114 were doing repetitive
diving, and 51 percent were doing square dives. Forty-six percent (53 of 114) of the new divers
were diving at eighty feet or deeper. Of the 114 new divers, 43 percent had a rapid ascent. Graph
9.5 shows the character traits of diving being done by new divers on the dive they were injured.
The extent to which these traits contributed to their lack of experience is not known, but similar traits
are found in more experienced divers.
38 1989 Report on Diving Accidents and Fatalities S&
http://rubicon-foundation.org
L
Graph 9.6 New Divers With Less than Two Years of Experience
Eighty-two percent of the 114 new divers had a severity code of 4 or greater. Codes 4'5, and 6 rep-
resent the most severe symptoms. These codes are used to indicate probable spinal cord DCS.
Graph 9.6 shows the severity code of the 114 new divers by male and female. Appendix C has a
listing of DAN'S severity coding system.
Fitness to Dive
Physical fitness is reported by the individual diver. Of the 391 injured divers in 1989,360 replied
they were fit and 29 replied they weren't fit. Table 9.7 shows the breakdown by sex. Additionally,
65 percent of males (188 of 289) and 74 percent of females (75 of 102) stated that they exercised
weekly.
@ 7989 Report on Diving Accidents and Fatalities 39
http://rubicon-foundation.org
Table 9.7 Physical Fitness* of the 1989 Accident Cases
Sex 1 Fit 1 Not Fit
*As reported by diver. No response = 2
Table 9.8 Medication Use of the 1989 Accident Cases
No Response = 17 No Response = 66
Of the 391 injured divers, 25 percent (93 of 374) indicated that they were taking a prescription drug
at the time of their accident Eight percent (25 of 325) responded that they were using a non-
prescription drug. Table 9.8 shows the frequency of medication use. Frequently used nonprescrip-
tion medications were decongestants for ears or sinuses, and antihistamines to prevent seasickness.
1989 Report on Diving Accidents and Fatalities I
http://rubicon-foundation.org
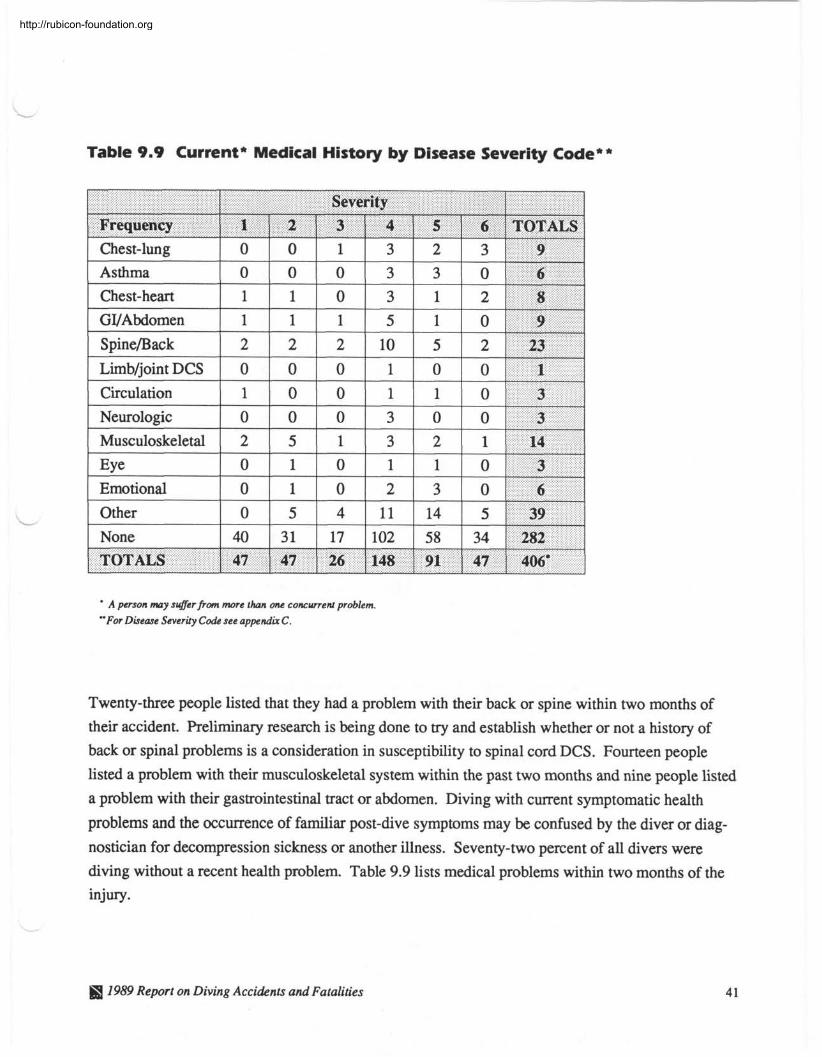
Table 9.9 Current* Medical History by Disease Severity Code**
Severity Frequency 1 1 2 ! 1 1 1
I I I I I I
TOTALS 1 47 I 47 1 26 1148 1 91 1 47 1 406"
' A person may suffer from more than one concurrent problem. 'For Disease Severity Code see appendix C.
Twenty-three people listed that they had a problem with their back or spine within two months of
their accident. Preliminary research is being done to try and establish whether or not a history of
back or spinal problems is a consideration in susceptibility to spinal cord DCS. Fourteen people
listed a problem with their musculoskeletal system within the past two months and nine people listed
a problem with their gastrointestinal tract or abdomen. Diving with current symptomatic health
problems and the occurrence of familiar post-dive symptoms may be confused by the diver or diag-
nostician for decompression sickness or another illness. Seventy-two percent of all divers were
diving without a recent health problem. Table 9.9 lists medical problems within two months of the
injury.
1989 Report on Diving Accidents and Fatalities
http://rubicon-foundation.org
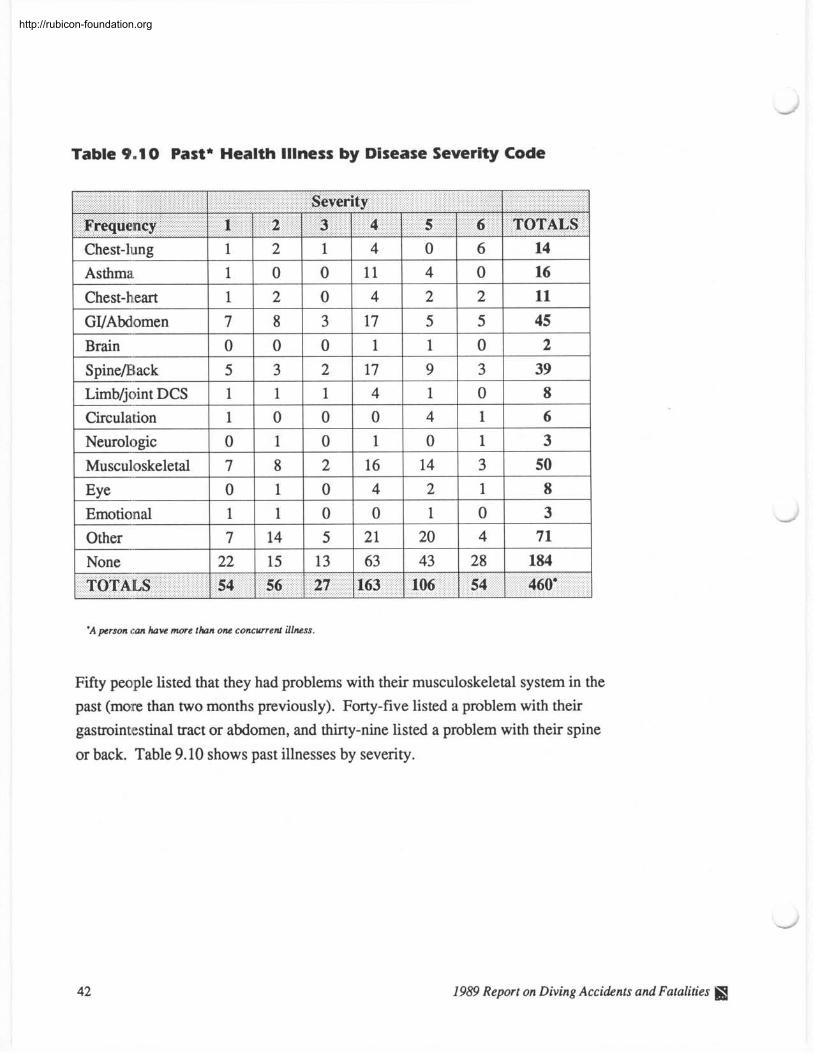
Table 9.1 0 Past* Health Illness by Disease Severity Code
Chest-lung
Asthma
Chest-heart
GVAbdomen
Brain
1
1
Other None 'A person can have more than one concurrent illness.
1
7 0
I ! 6 ,
Fifty people listed that they had problems with their musculoskeletal system in the
past (more than two months previously). Forty-five listed a problem with their
gastrointestinal tract or abdomen, and thirty-nine listed a problem with their spine
or back. Table 9.10 shows past illnesses by severity.
2
0
7
22
1989 Report on Diving Accidents and Fatalities I
2
8
0
54 1 460'
1
0
14
15
TOTALS
0
3
0
27
4
11
5
13
163 54
4
17 1
56
0
4
21
63
2
5 1
6
0
20
43
14 16
2
5 0
11
45 2
4
28
7 1
184
http://rubicon-foundation.org
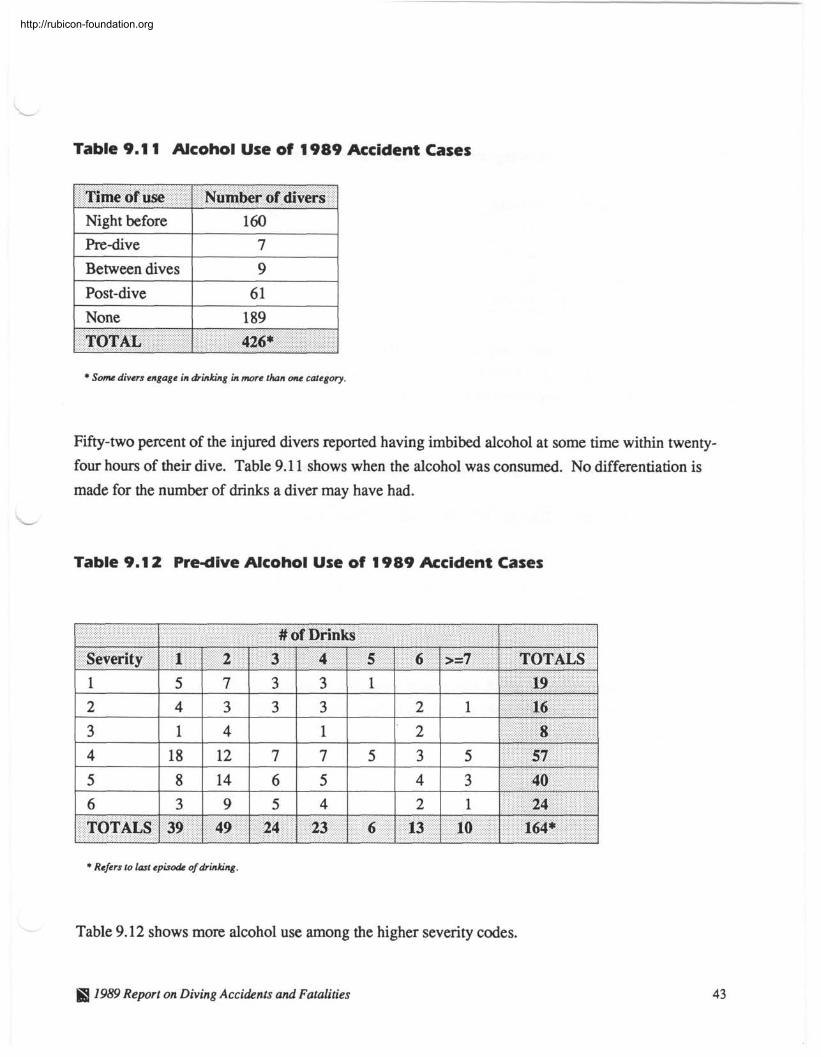
Table 9.1 1 Alcohol Use of 1989 Accident Cases
Time of use 1 Number of divers Night before
Pre-dive
Between dives
1 post-dive 1 6 1 1 1 None 1 189 1
* Some divers engage in drinking in more than one category.
I
Fifty-two percent of the injured divers reported having imbibed alcohol at some time within twenty-
four hours of their dive. Table 9.1 1 shows when the alcohol was consumed. No differentiation is
made for the number of drinks a diver may have had.
TOTAL
Table 9.1 2 Pre-dive Alcohol Use of 1 989 Accident Cases
426*
* Refers to last episode of drinking.
Table 9.12 shows more alcohol use among the higher severity codes.
&S 1989 Report on Diving Accidents and Fatalities
http://rubicon-foundation.org
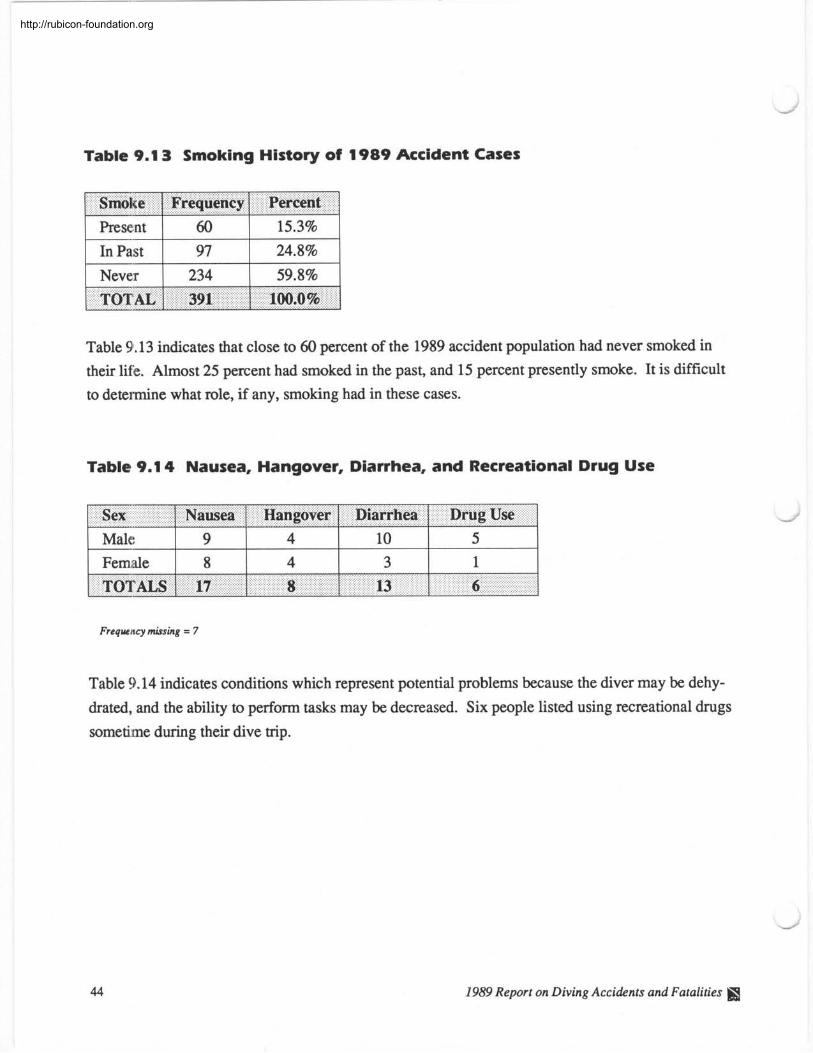
Table 9.1 3 Smoking History of 1989 Accident Cases
1 Smoke 1 Frequency 1 Percent 1 Present 1 60 1 15.3% 1 In Past 24.8%
1 Never 1 234 1 59.8% 1
Table 9.13 indicates that close to 60 percent of the 1989 accident population had never smoked in
their life. Almost 25 percent had smoked in the past, and 15 percent presently smoke. It is difficult
to determine what role, if any, smoking had in these cases.
Table 9.1 4 Nausea, Hangover, Diarrhea, and Recreational Drug Use
Sex 1 Nausea 1 Hangover 1 Diarrhea 1 Drug Use
Freqnency missing = 7
Table 9.14 indicates conditions which represent potential problems because the diver may be dehy-
drated, and the ability to perform tasks may be decreased. Six people listed using recreational drugs
sometime during their dive trip.
1989 Report on Diving Accidents and Fatalities a
http://rubicon-foundation.org
L
Table 9.1 5 DCS Symptoms Prior to Last Dive
1 Male 1 35 of 282 1 1 Female 1 25 of 99 1
I
TOTAL 1 60 of 381
Table 9.15 indicates that sixty people listed having dived while having some symptom later associ- ated with decompression sickness.
Table 9.1 6 Lack of Sleep and/or Fatigue Prior to Last Dive
I
TOTAL 1 125 of 385
Frequency Missing = 6
Table 9.16 indicates that 125 people were fatigued or had a lack of sleep prior to the dive in which they were injured.
1989 Report on Diving Accidents and Fatalities
http://rubicon-foundation.org
Table 9.1 7 Strenuous Exercise
After Dive 32
I I 1
Frequency Mining = 12 8 22
During Dive 86
Sex 1 Prior to Dive
1
Table 9.17 indicates sixty-nine people had some strenuous activity before diving. One hundred and
eight reported some strenuous activity during the dive, and 39 exercised after diving.
Male
7 Female 1 19
Table 9.1 8 Type of Water Environment
50 22
39 TOTAL 1 69
T y p e - 1 Frequency 1 Percent
J 108
1 Saltwater 1 342 1 87.5% 1
Table 9.18 indicates forty-nine divers were diving in freshwater at the time of their accident. Three
hundred and forty-two were diving in saltwater when their accident occurred.
1989 Report on Diving Accidents and Fatalities
http://rubicon-foundation.org
10.0 Dive Profile -
Graph 1 0.1 Primary Dive Activity
Night Cave Teaching Photo Learning Wreck Spear Fish Sight See
Graph 10.1 indicates 5 1 percent of the divers were primarily sight-seeing. Sixteen percent of the - divers were spearfishing and 15 percent were wreck diving. The remaining 18 percent were doing
different types of diving such as: night, cave, teaching, photo, and learning.
Graph 10.2 Days Since Last Safe Dive
250
g 200 > .- n 150 a
^ I00 E z 5 0
0
Graph 10.2 indicates that the majority of dive injuries occurred in divers who had been diving within L the last 30 days. The breakdown for the frequency of diving in 1989 is similiar to the results found
in the 1988 report. Uncertified divers (=< 6 dives) were not included elsewhere in this graph.
1989 Report on Diving Accidents and Fatalities 47
http://rubicon-foundation.org
One Day 2 Days 3 Days 4 Days s> 5 Days
Graph 10.3 illustrates the breakdown of the days of diving in a series. It shows that approximately
50 percent of all accidents occurred on the first day of diving. This may represent a number of
possible dive accident causes such as: lack of experience, lack of physical fitness, lack of prepara-
tion, or excessive diving in a single day.
Dive (Location
Table 10.4 lists the location of the reported treated injuries since 1986. It should be noted that all re-
ported DCSIAGE injuries, including those not treated, are also included in this table.
Table 10.5 lists the location of 1989 accidents by state and DAN Region. It also breaks down these
injuries by diagnosis. Tables 10.6 and 10.7 show the location of 1989 accidents by state and country
respectively . -
48 1989 Report on Diving Accidents and Fatalities
http://rubicon-foundation.org
- Table 10.4 Total Reported Cases
* Represents DCS iypus I and 11 cases combined.
** SE includes Caribbean basin. --- + Hawaii only reports number of cases treated.
++ No Treatment represents cases with no treatment, refused treatment, or spontaneous resolution.
DCS-I DCS-I1 AGE
@ 1989 Report on Diving Accidents and Fatalities
69* 28
6 11 2
No DX reported 25 No Treatment++
2 13
1 4 8 3
TOTALS 9
1
8
-----
100 32
7
19 7 15 44 1 343 1 562 I
33 10
68
133 4 1
77 274*
81 -
http://rubicon-foundation.org
Table 10.5 Total Cases Treated and Reported in 1989 by
DAN Regional Coordinators
F y e s t Region 1 DCS-I 1 DCS-II 1 AGE 1 TOTALS 1
Northwest Region Alaska 0 1 0 1 Oregon 8 0 0 8
Washington 4 14 3 21 -- - -. , , . . . . . . . .-
12 IS 3 30
1 Colora~Io 1 0 1 7 1 0 1
I Louisiana 1 4 1 5 I l l 1 1 Missouri 1 1 1 0 1 0 1 1 Texas 2
m+ Region I I I I
1 Hawaii* 1 1 1
1
*Hawaii only reports number of cases treated.
50
29 TOTALS
1989 Report on Diving Acci&nts and Fatalities
11 1 41
http://rubicon-foundation.org
Northeast Region 1 DCS-I 1 DCS-II 1 AGE 1 TOTALS 1 Connecticut 1 1 1 1 ., . . .. , . 3 :.!..: ..,., .: 1 . . . . . .. . .. .. . . ..
- !hutheast Region
I
0 Alabama 5 1
Florida 48 75 3 8
TOTALS
I I I
TOTALS 1 54 96 1 42 192 I I I
Caribbean Basin
14
I I I I
TOTALS 24 60 23 107
1989 Report on Diving Accihnts and Fatalities
47 4 65
http://rubicon-foundation.org
Table 10.6 Accidents by State
1 Alabama 1 0.4%
State
1 Arizona 1 1 1 0-4% 1
1 Wyoming I 1
Frequency
1 Maine 1 2 1 07% 1
Percent
2 0.7%
Ohio 2 0.7%
2 0.7%
3 1.1%
3 1.1%
4 1.5%
4 1.5%
4 1.5%
8 3.0%
9 3.3%
North Carolina 10 3.7%
Washington
New Jersey California 20.3%
Florida 119 43.9%
1989 Report on Diving Accidents and Fatalities
http://rubicon-foundation.org
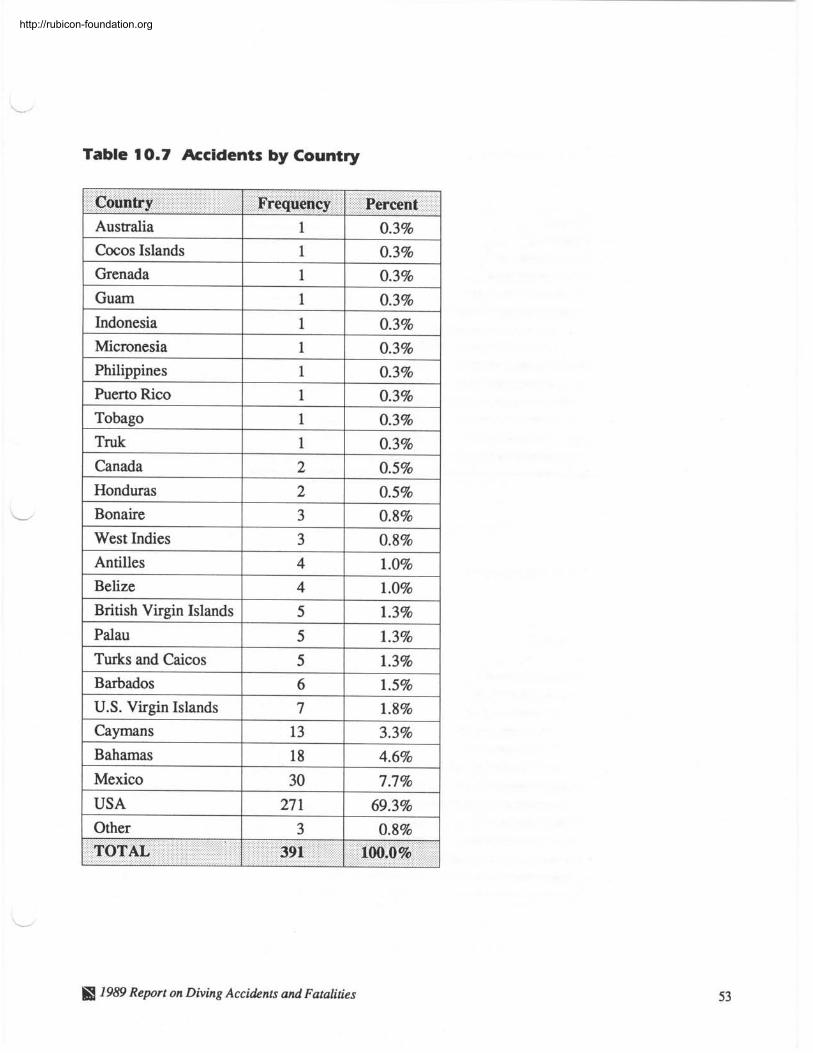
Table 10.7 Accidents by Country
Country 1 Frequency 1 Percent I
Australia Cwos Islands Grenada Guam Indonesia Micronesia Philippines
1 Tobago 1 1 1 0.3% 1
1 1
her to Rico
1 Canada 1 2 1 0.5% 1
0.3% 0.3%
1 1 1 1 1
0.3% 0.3% 0.3% 0.3% 0.3%
I
1 0.3%
1 U.S. Virgin Islands 1 I I
1 Bahamas 1 18 1 4.6% 1
7 - I I 1.8%
Caymans
1 Other 1 3 1 0.8% 1
Mexico USA
13
1989 Report on Diving Acci&nts and Fatalities
3.3%
30 27 1
7.7% 69.3%
.-
10.0% I
TOTAL 391
http://rubicon-foundation.org
Graph 10.8 AGE Dive Attributes
Percentage of 52 AGE Cases
Graph 10.9 DCS Dive Attributes
Within tables
No Decom I
0 2 5 5 0 7 5 100
Percentage of 339 DCS Cases
1989 Report on Diving Accidents and Fatalities
http://rubicon-foundation.org
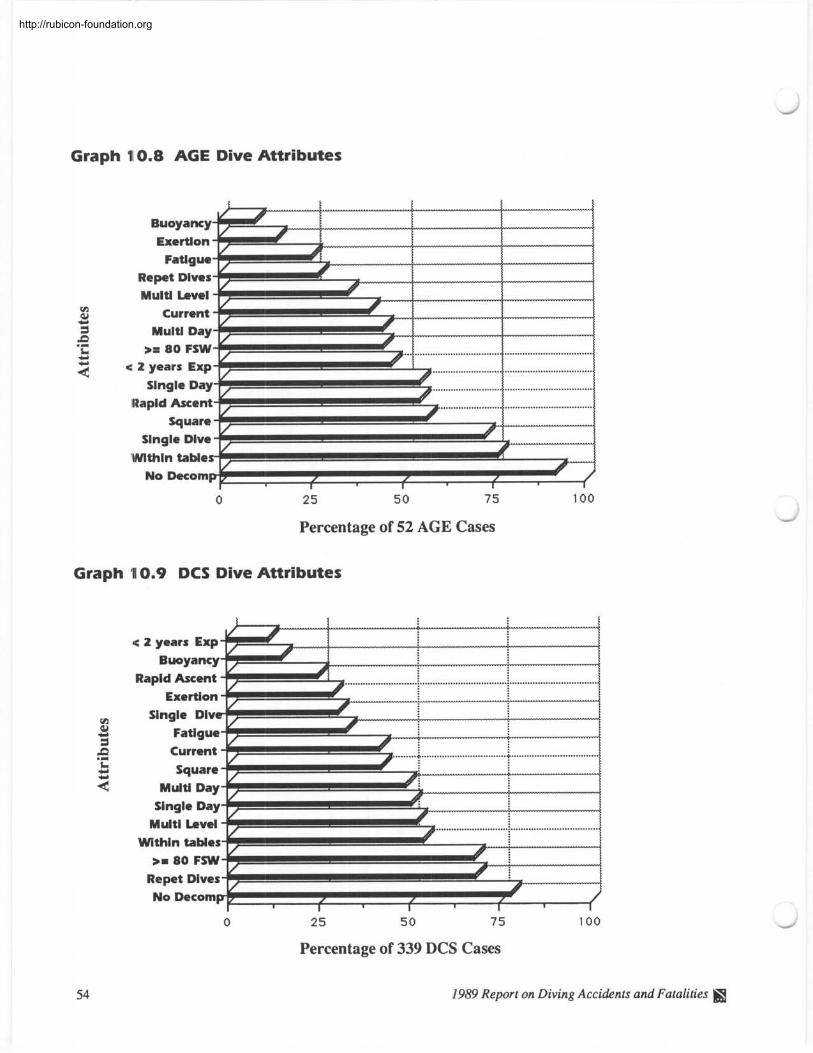
Dive attributes or diver preferences are shown in graphs 10.8 and 10.9. They are listed in order of
frequency. The most common attributes in DCS cases for the last three years have been no decom-
pression diving, ranging from 7 1 to 90 percent, and diving equal to or greater than 80 feet, which has
remained relatively stable at approximately 70 percent yearly. Repetitive diving has also remained
consistent at approximately 63 percent. The greatest changes have been in multiple and single day
diving. Although there was 18 percent more multiple than single day diving in 1987, by 1989 there
was two percent more single than multiple day diving (5 1 versus 49 percent).
Most AGE cases seem to be the result of a no decompression, single day, and single square dive.
Depths of 80 feet or greater have been associated with about 45 percent of all AGE cases each year.
Rapid ascent is commonly associated with AGE by the diving public, and it has been reported in
approximately 50 percent of all AGE cases from 1987 to 1989.
Table 1 0.1 0 Equipment Problems
- Equipment 1 Frequency 1 DCS 1 AGE Regulator
BC Vest
Weight Belt
14
10
Dry Suit
DC Computer
2
Inflator Hose
Contaminated Air
9
10
2
6
Unfamiliar Equipment
Timing
1989 Report on Diving Accidents and Fatalities
5
0
1
3 1
- , I 1
--
1
1
4
10
1
TOTALS
1
2
2
0
1
1
8
1
49
2
0
36 13
http://rubicon-foundation.org
Computer diving has become very popular with recreational diving and thousands of units are being
used today. Fifteen percent of divers in the 1987 accident report were using computers compared to
3 1 percent in 1988. In 1989,32 percent of all injured divers were using computers.
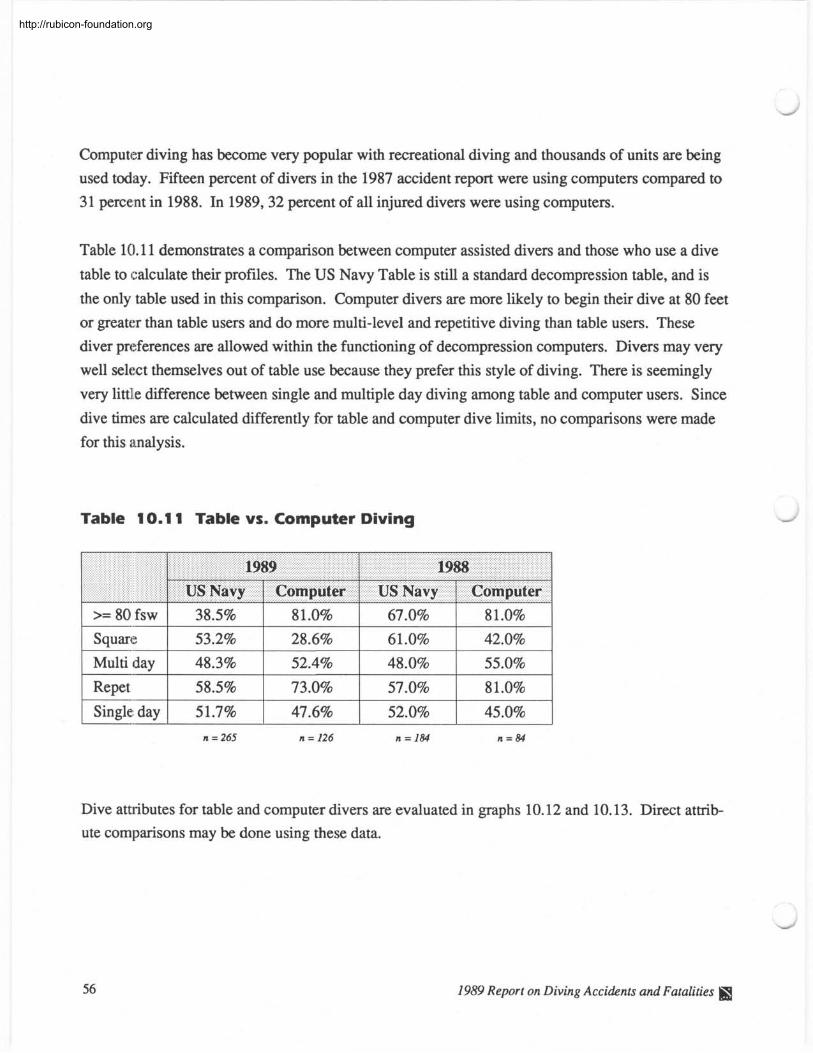
Table 10.11 demonstrates a comparison between computer assisted divers and those who use a dive
table to calculate their profiles. The US Navy Table is still a standard decompression table, and is
the only table used in this comparison. Computer divers are more likely to begin their dive at 80 feet
or greater than table users and do more multi-level and repetitive diving than table users. These
diver preferences are allowed within the functioning of decompression computers. Divers may very
well select themselves out of table use because they prefer this style of diving. There is seemingly
very little difference between single and multiple day diving among table and computer users. Since
dive times are calculated differently for table and computer dive limits, no comparisons were made
for this analysis.
Table 10.1 1 Table vs. Computer Diving
R e p e t 1 58.5% 1 73.0% 1 57.0% 1 81.0% 1 1 Single; day 1 51.7% 1 47.6% 1 52.0% 1 45.0% 1
Dive attributes for table and computer divers arc evaluated in graphs 10.12 and 10.13. Direct attrib- ute comparisons may be done using these data.
1989 Report on Diving Accidents and Fatalities \
http://rubicon-foundation.org
Graph 1 0.1 2 Attributes of Computer Divers
Outside Tables
Decompression
Within Tables
8 Fatigue
M 3 Exer t ion
Current
M u l t i Day
M u l t i Level
Repet Dives
>= 80 FSW
Percent of 126 Computer Divers
Graph 1 0.1 3 Attributes of Table Divers
Decompressio
Outside Table -4
Exertion
>= 80 FSW
Current
Multi Level
Single Dive 7 Multi Day
Single ~ a ~ #
Re pet Dives -1
Percent of 265 Table Divers
1989 Report on Diving Accidents and Fatalities 57
http://rubicon-foundation.org
1 1.0 Symptoms
Symptom recognition is important for accurate diagnosis and symptom reporting. The most com- mon symptoms arc shown in order of frequency, beginning with the first injury through the sixth.
Table 1 1.1 Top Injury Symptoms
1 pain 1 154 1 39.4 1 1 Numbness 1 76 1 19.4 1
Extreme fatigue Dizziness 4.6
Weakness 4.3
1 TOTAL 1 316 1 80.7 1
I - Frequency Missing = 0
1 Numbness 1 99 1 27.3 1 1 Pain 1 74 1 20.4 1 1 Weakness 1 37 1 10.2 1 1 Dizziness 1 19 1 5.2 1 1 Headache 1 Extreme fatigue 1 15 1 4.1 1 1 TOTAL
1 Frequency Missing = 29 1 Third Injury L I
1 Numbness 1 61 1 20.1 1 1 Pain 1 59 1 19.5 1 1 Weakness 1 33 1 10.9 1 1 Dizziness 1 18 1 5.9 1
1 Headache 1 15 1 5.0 1
Frequency Missing = 88
58 1989 Report on Diving Accidents and Fatalities
http://rubicon-foundation.org
Numbness
Pain
1 Extreme fatigue 1 16 1 7.6
Weakness
Nausea
1 Dizziness 1 15 1 7.1
37
3 1
17.6
14.8 17
17
Frequency Missing = 181
8.1
8.1
TOTAL
1 I
Fifth Injury -
133
1 Nausea 1 13 1 9.7
63.3
Numbness
Pain
1 Headache 1 7 1 5.2
23 21
Dizziness
Extreme fatigue
1 Difficulty walking 1 7 1 5.2
17.2 15.7
11
8
Frequency Missing = 257
8.2
6.0
< " 1 I
I I
Sixth Injury
TOTAL
1 Numbness 1 16 1 20.3
1 Difficulty walking 1
90
1 Pain 1 10 1 12.7
67.2
1 Extreme fatigue 1 4 1 5.1
1 Headache 1 4 1 5.1
1 Muscle twitch 1 4 1 5.1
1 Weakness 1 4 1 5.1
Frequency Missing = 312
I I
1989 Report on Diving Accidents and Fatalities
TOTAL 53 67.3
http://rubicon-foundation.org
A complete list of f i r t and second symptoms are shown in table 11.2. Although pain is the most
common symptom, many other symptoms may also indicate decompression illness.
Table 1 1.2 1989 Injury Symptoms
1 pain 1 154 1 39.4 1 74
1 Numbness 1 76 1 19.4 1 99 1 27.3 1 I
--
Headache 29 1 7.4 1 17 I 4 . 7 1
Weakness 1 17 1 4.3 1 37 1 10.2 1
Extr fatigue
Dizziness -.
22
18
Nausea
Unconsciousness
Visual disturbance
5.6
4.6
12
11
10
Paralysis
Bowel problem --
Personality change -.
Diff walking -.
Reflex changes -.
Semi-conscious
10
9
5
I --
Restless 2 I 0.5 1 8
15
19
3.1 2.8
2.6
2 2
2
2
2
2
2.2 Musclle twitching
-.
Rash
1 sensation
4.1
5.2
2.6
2.3
1.3
Decreased skin
9 11
10
0.5
0.5
0.5
0.5
0.5
0.5
1
1
No response = 29
1989 Report on Diving Accidents and Fatalities I
2.5
3.0 2.8
7
3
5
1
1
Convulsions
1.9
0.8
1.4 4
1
4
7
1
3
0.3
0.3
1.1
0.3
1.1
1.9
0.3
0.8
0.3
0.3
0
0
6
6
1.7
1.7 1
12
0.0
0.0
0.3
3.3
2
1 0.6
0.3
http://rubicon-foundation.org
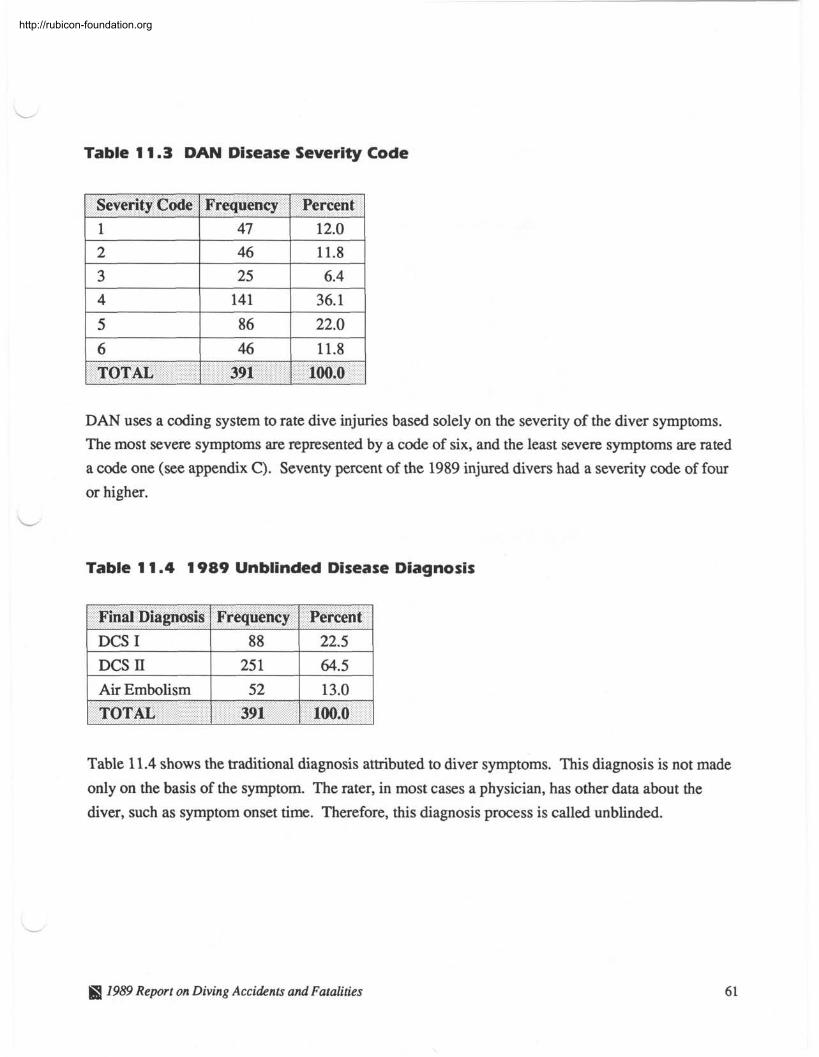
Table 1 1.3 DAN Disease Severity Code
1 Severity Code 1 Frequency 1 Percent 1
I
TOTAL 1 391 1 100.0
DAN uses a coding system to rate dive injuries based solely on the severity of the diver symptoms.
The most severe symptoms are represented by a code of six, and the least severe symptoms are rated
a code one (see appendix C). Seventy percent of the 1989 injured divers had a severity code of four
or higher.
Table 1 1.4 1 989 Unblinded Disease Diagnosis
1 Final Diagnosis 1 Frequency 1 Percent 1 1 DCS I 1 88 1 22.5 1 1 DCS II 1 251 1 64.5 1 1 Air Embolism 1 52 1 13.0 1
Table 11.4 shows the traditional diagnosis attributed to diver symptoms. This diagnosis is not made
only on the basis of the symptom. The rater, in most cases a physician, has other data about the
diver, such as symptom onset time. Therefore, this diagnosis process is called unblinded.
TOTAL
1989 Report on Diving Accidents and Fatalities
391 1 100.0
http://rubicon-foundation.org
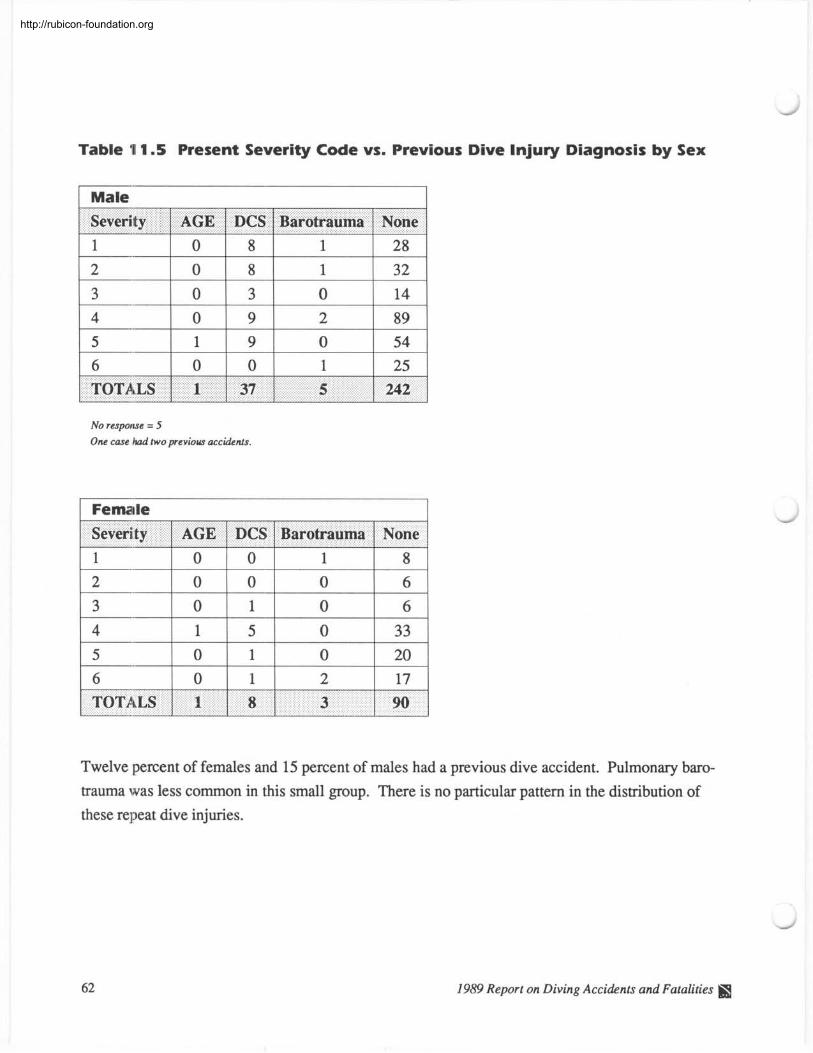
Table 1 1.5 Present Severity Code vs. Previous Dive Injury Diagnosis by Sex
1 Male
Severity 1 AGE 1 DCS 1 Barotrauma 1 None
No response = 5 One case had two previous accidents.
1 Female 1 writy 1 AGE 1 DCS 1 Barotrauma 1 None
Twelve percent of females and 15 percent of males had a previous dive accident. Pulmonary baro-
trauma was less common in this small group. There is no particular pattern in the distribution of
these repeat dive injuries.
1989 Report on Diving Accidents and Fatalities I
http://rubicon-foundation.org
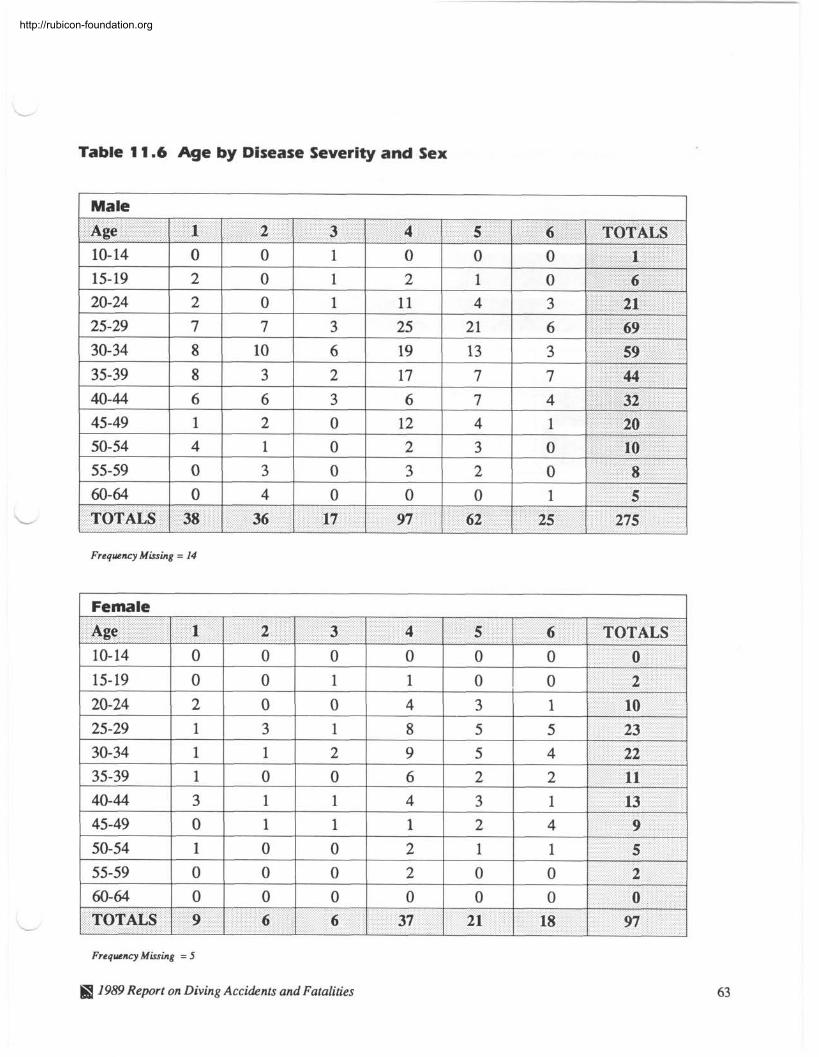
Table 11.6 Age by Disease Severity and Sex
1 Male
Frequency Missing = 14
1 Female
Frequency Missing = 5
1959 Report on Diving Accidents and Fatalities
http://rubicon-foundation.org
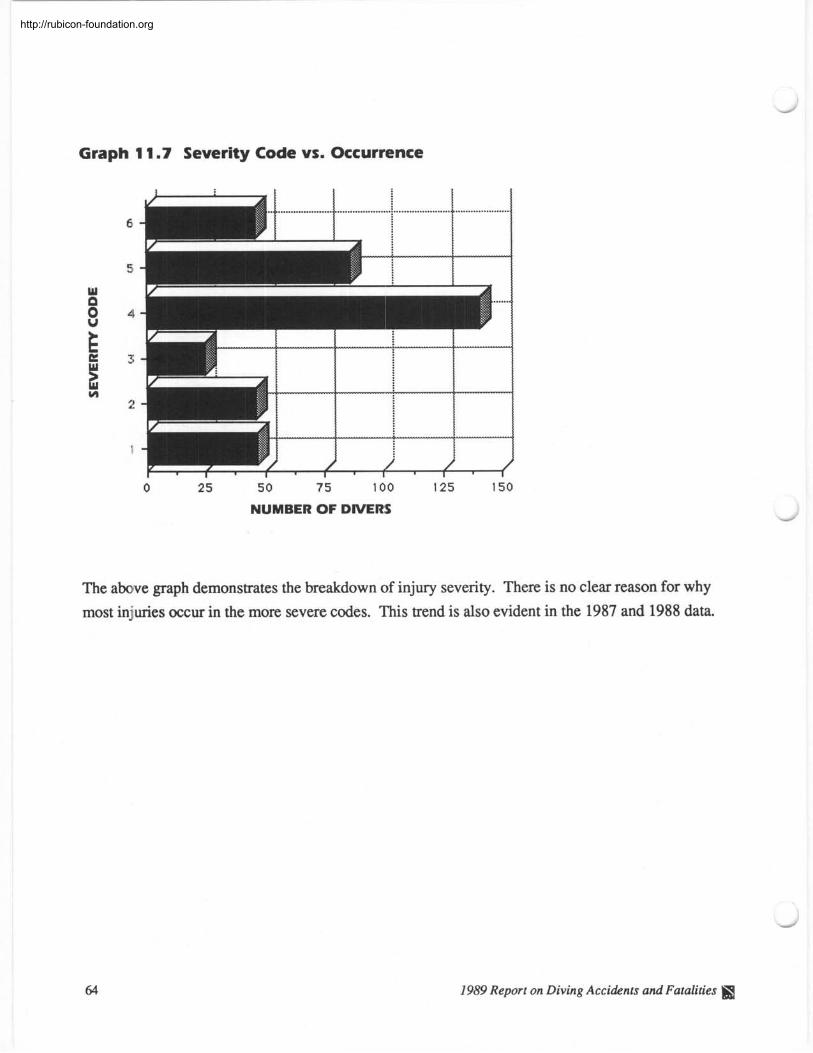
Graph 1 1.7 Severity Code vs. Occurrence
0 2 5 5 0 7 5 100 125 150
NUMBER OF DIVERS
The above graph demonstrates the breakdown of injury severity. There is no clear reason for why most injuries occur in the more severe codes. This trend is also evident in the 1987 and 1988 data.
-
1989 Report on Diving Accidents and Fatalities V&
http://rubicon-foundation.org
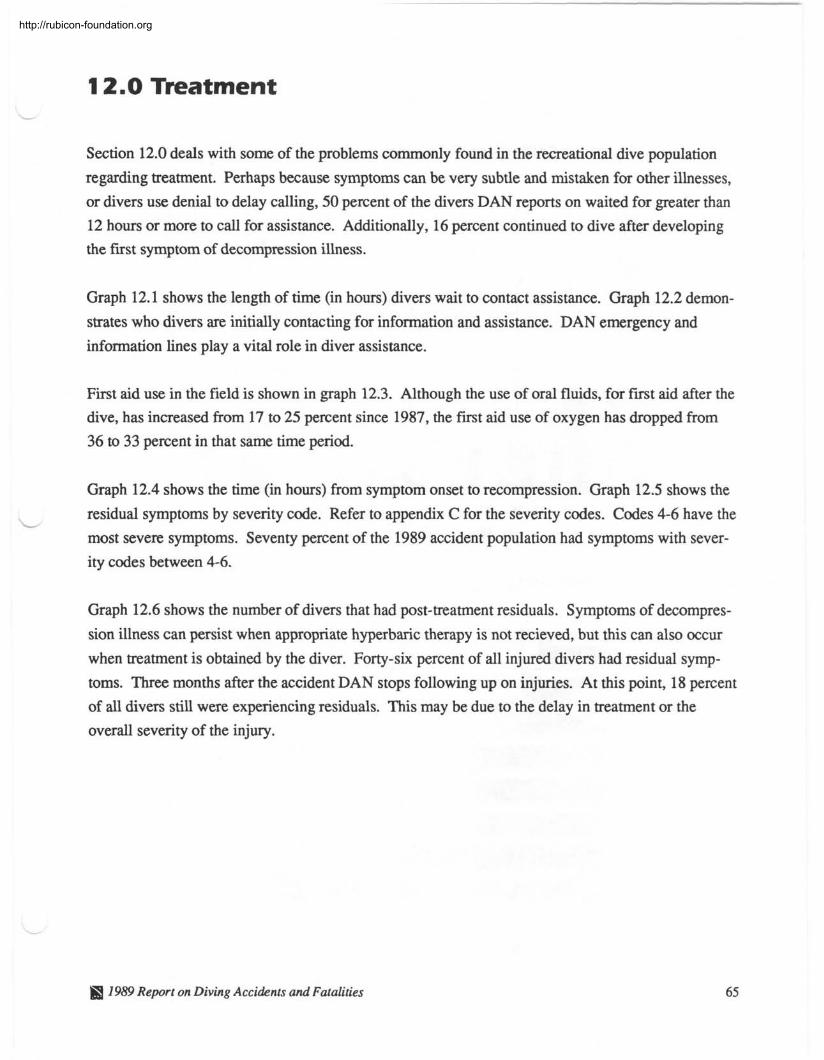
12.0 Treatment
Section 12.0 deals with some of the problems commonly found in the recreational dive population
regarding treatment. Perhaps because symptoms can be very subtle and mistaken for other illnesses,
or divers use denial to delay calling, 50 percent of the divers DAN reports on waited for greater than
12 hours or more to call for assistance. Additionally, 16 percent continued to dive after developing
the first symptom of decompression illness.
Graph 12.1 shows the length of time (in hours) divers wait to contact assistance. Graph 12.2 demon-
strates who divers are initially contacting for information and assistance. DAN emergency and
information lines play a vital role in diver assistance.
First aid use in the field is shown in graph 12.3. Although the use of oral fluids, for f i r t aid after the
dive, has increased from 17 to 25 percent since 1987, the first aid use of oxygen has dropped from
36 to 33 percent in that same time period.
Graph 12.4 shows the time (in hours) from symptom onset to recompression. Graph 12.5 shows the
residual symptoms by severity code. Refer to appendix C for the severity codes. Codes 4-6 have the
most severe symptoms. Seventy percent of the 1989 accident population had symptoms with sever-
ity codes between 4-6.
Graph 12.6 shows the number of divers that had post-treatment residuals. Symptoms of decompres-
sion illness can persist when appropriate hyperbaric therapy is not recieved, but this can also occur
when treatment is obtained by the diver. Forty-six percent of all injured divers had residual symp-
toms. Three months after the accident DAN stops following up on injuries. At this point, 18 percent
of all divers still were experiencing residuals. This may be due to the delay in treatment or the
overall severity of the injury.
ffl 1989 Report on Diving Accidents and Fatalities
http://rubicon-foundation.org
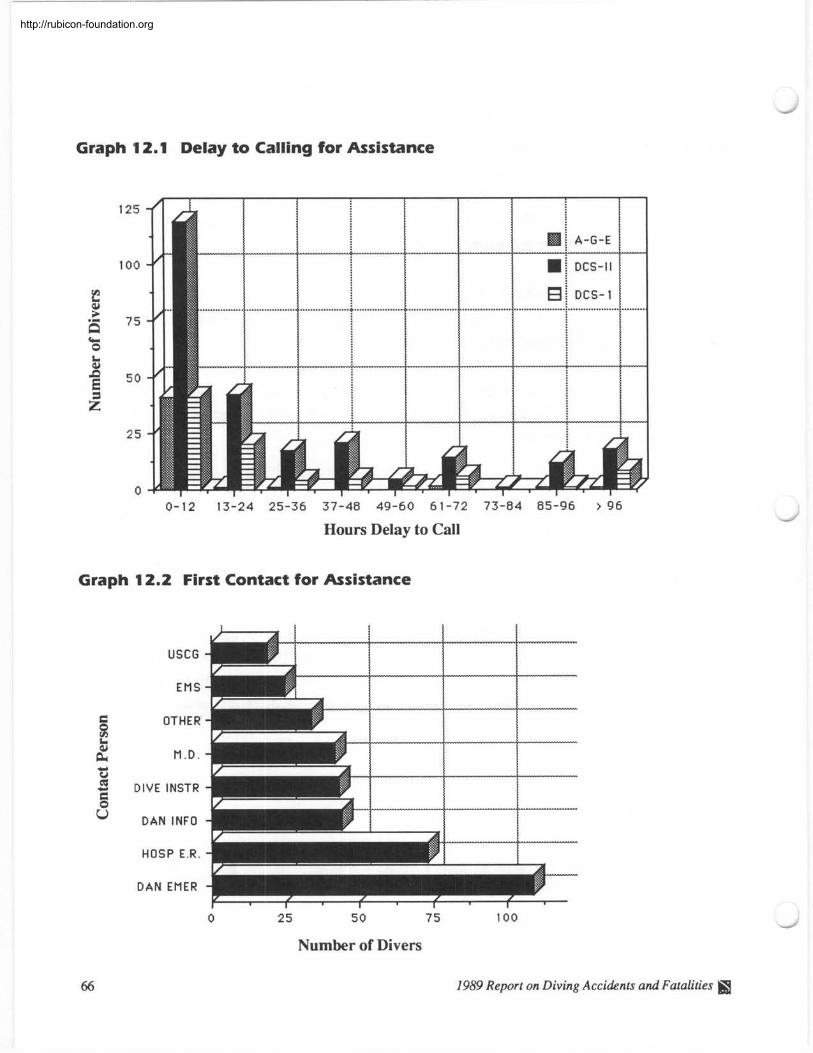
-
Graph 1 2.1 Delay to Calling for Assistance
0-12 13-24 25-36 37-48 49-60 61-72 73-84 85-96 > 96
Hours Delay to Call
Graph 12.2 First Contact for Assistance
USCG
EMS
OTHER
M . D .
DIVE INSTR
DAN INFO
-r HOSP E.R.
D A N EMER
Number of Divers
66 1989 Report on Diving Accidents and Fatalities
http://rubicon-foundation.org
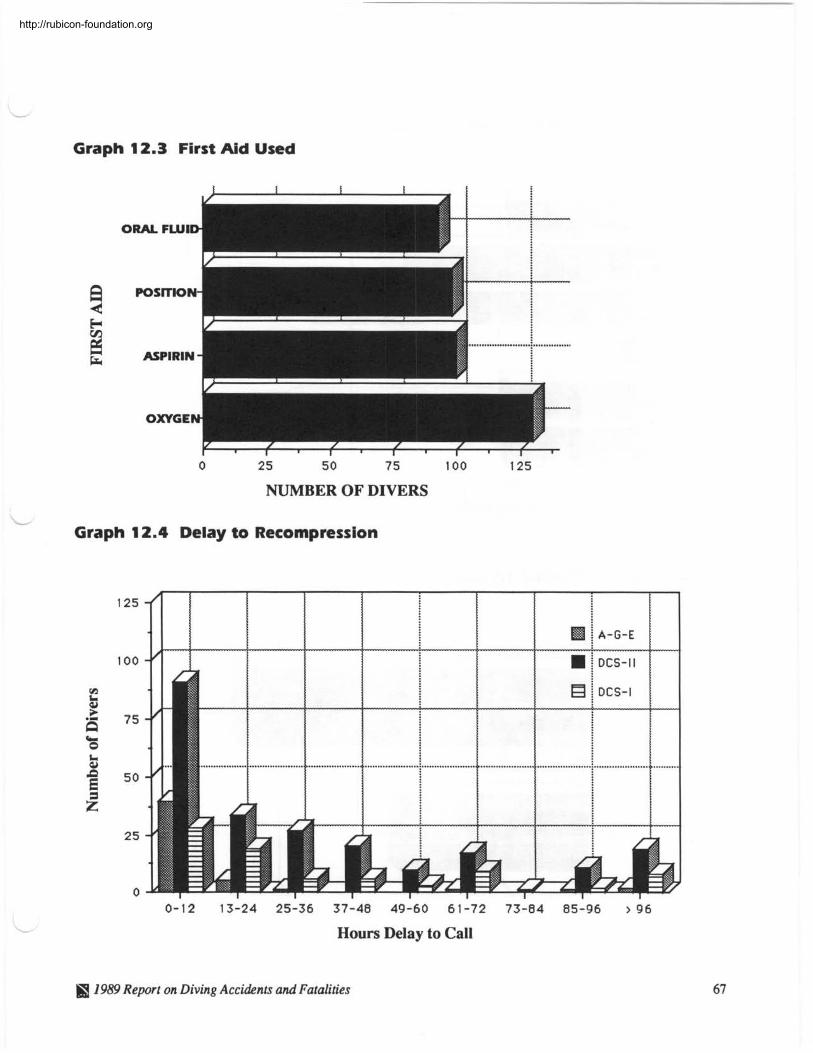
Graph 12.3 First Aid Used
0 2 5 5 0 7 5 100 125
NUMBER OF DIVERS
- Graph 1 2.4 Delay to Recompression
Hours Delay to Call
7989 Report on Diving Accidents and Fatalities
http://rubicon-foundation.org
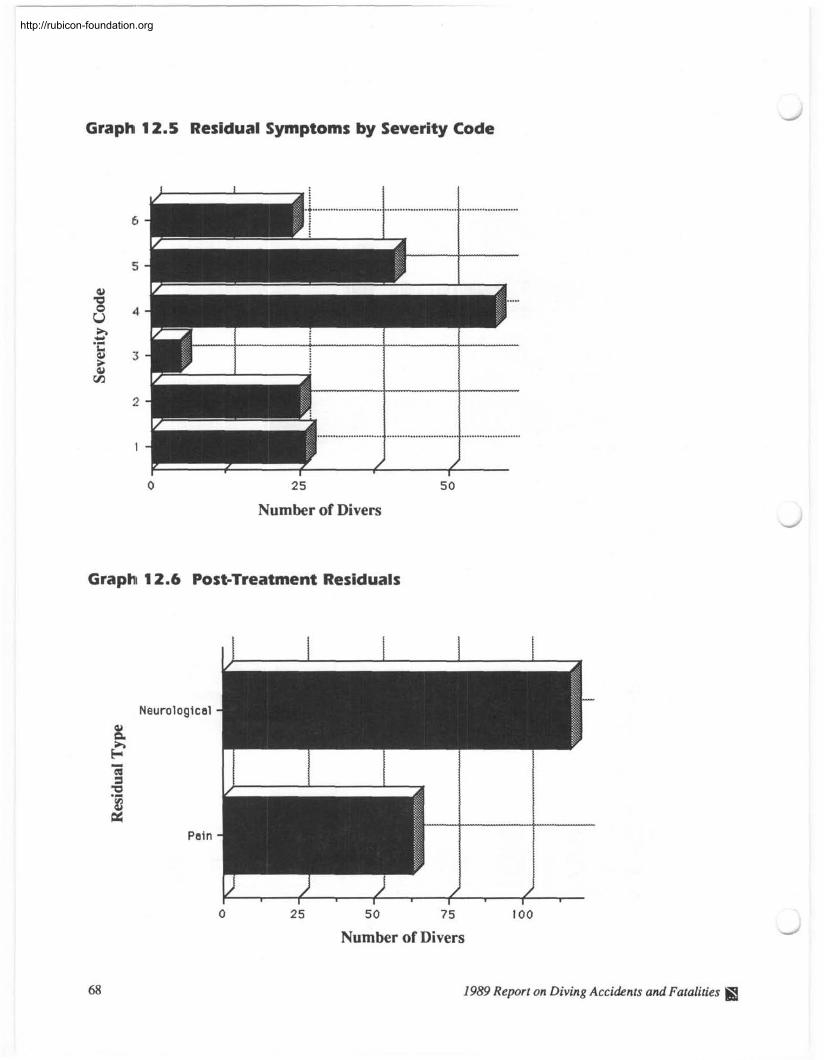
--- -
Graph 12.5 Residual Symptoms by Severity Code
2 5 5 0
Number of Divers
Graph 12.6 Post-Treatment Residuals
Neurological
Pain
Number of Divers
1989 Report on Diving Accidents and Fatalities S3
http://rubicon-foundation.org
Accident Summary
This is DAN'S third annual Report on Diving Accidents, however, this year we have expanded our
report to include diving fatalities.
Scuba diving continues to be popular among men and women of all ages. From these accident and
fatality cases, there are trends which can be consistently identified from previous years.
For example, divers who lack adequate experience and underwater skills seem to be undertaking
dive situations they are not yet prepared to handle, resulting in rapid ascents, buoyancy problems,
and out-of-air situations. More experienced divers may continue diving despite current or past health
problems which have the potential to contribute to dive injuries or limit the diver's ability to perform
adequately in the water.
Additionally, recreational divers continue to dive with decompression illness symptoms and delay
calling for assistance. The general lack of symptom recognition may be, in part, responsible for this
behavior. The wide variety of possible symptom presentations adds to the divers' indecision to seek
treatment once symptoms occur.
The most consistent findings associated with decompression illness are: diving at 80 feet or greater,
repetitive diving, and no-decompression diving. These are not, however, considered true risk factors
because they only pertain to the injured population. DAN will continue to follow up its prospective
study of non-injured divers throughout 199 1.
With the results gained from this prospective study and the annual accident reports, more informa-
tion will be available to enable DAN to learn the causes of diving-related problems and how to avoid
them in the future.
1989 Report on Diving Accidents and Fatalities
http://rubicon-foundation.org

http://rubicon-foundation.org
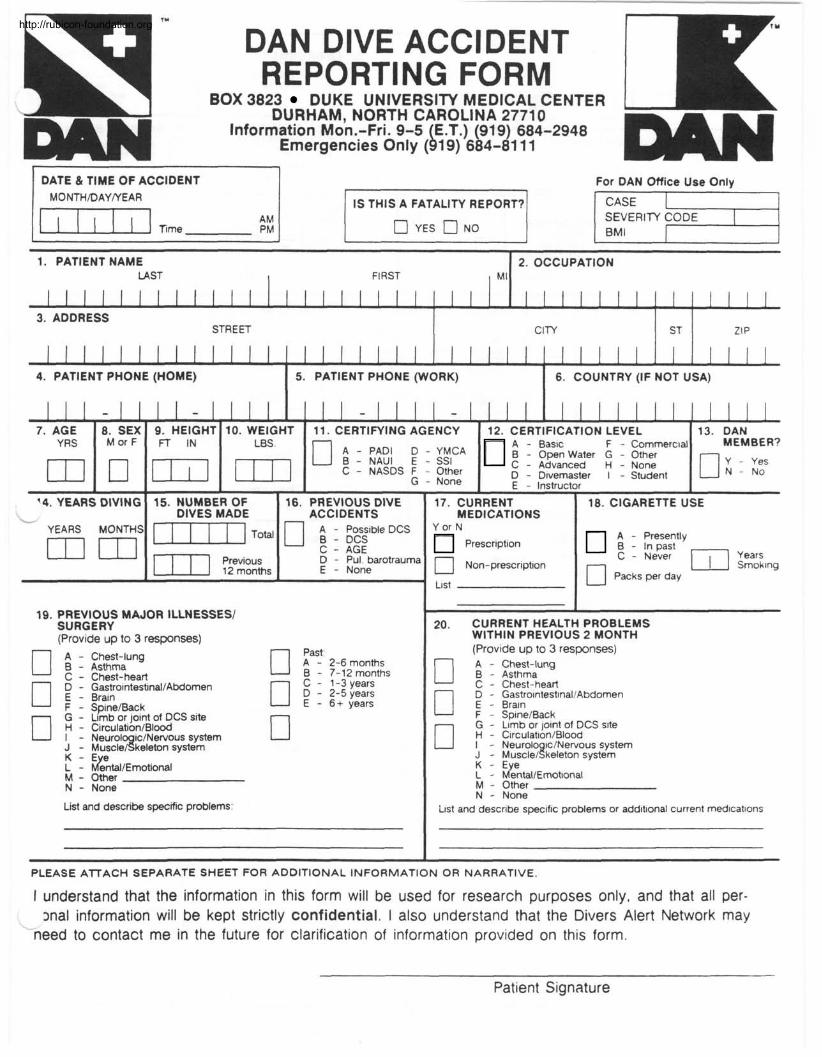
n- r" DAN DIVE ACCIDENT REPORTING FORM
1 BOX 3823 DUKE UNIVERSITY MEDICAL CENTER 1 4
DAN DURHAM, NORTH CAROLINA 27710 Information Mon.-Fri. 9-5 E.T.) (919) 684-2948
Emergencies Only ( b 19) 684-81 1 1 DAN 1 DATE & TIME OF ACCIDENT I For DAN Office Use Only
IS THIS A FATALITY REPORT? 1 a a No 1 1 BMI m - -
1. PATIENT NAME LAST FIRST M l
l l l l l l l l l l l l l l l l l l l l l
1 1 1 1 1 1 1 1 1 1 1 1
I
16. PREVIOUS DIVE - ACCIDENTS
2. OCCUPATION
1 1 1 1 1
I - 1 1 1 1 - l l l l l - - l l l l l l l l l l l l l l l
74. YEARS DIVING
3. ADDRESS STREET
1 1 1 1 1
7. AGE 8. SEX 9. HEIGHT 10. WEIGHT 11. CERTIFYING AGENCY YRS M or F FT IN
A - PAD1 D -YMCA B - NAUI E - SSI C - NASDS F - Other
G - None
15. NUMBER OF DIVES MADE lm Total
I l l 1
4. PATIENT PHONE (HOME)
17. CURRENT 1 18. CIGARETTE USE MEDICATIONS
CITY
12. CERTIFICATION LEVEL A - Basic F - Commercial B - Open Water G - Other C - Advanced H - None D - Divemaster I - Student E - Instructor
- YEARS MONTHS
5. PATIENT PHONE (WORK)
13. DAN MEMBER?
a Y - Yes N - No
YorN
ST
6. COUNTRY (IF NOT USA)
; 1 p;;;tIy
C - Never
0 Packs per day
ZIP
u A - Possible DCS B - DCS C - AGE
Prescription
D - Pul barotraumc E - None
19. PREVIOUS MAJOR ILLNESSES1 SURGERY (Provide up to 3 responses)
- -- -- --
20. CURRENT HEALTH PROBLEMS WITHIN PREVIOUS 2 MONTH (Provide up to 3 responses)
D A - Chest-lung B - Asthma C - Chest-heart
IÑà D - Gastrointestmal/Abdomen
Chest-lung Asthma Chest-heart Gastro~ntestinal/Abdomen Brain
A - 2-6 months B - 7-12 months a C - 1-3 years D - 2-5 years E - 6+ years Brain Spine/Back
Limb or joint of DCS site Circulation/Blood
SpineIBack Limb or joint of DCS site Circulation/Blood Neurol ic/Nervous system
~uscle/Skeleton system Neurolo ic1Nervous system ~uscle18keleton system
%ntal/Ernotional Other None
b%tal/Ernottonal Other None
List and describe specific problems: and describe specific problems or additional current medications
PLEASE ATTACH SEPARATE SHEET FOR ADDITIONAL INFORMATION OR NARRATIVE,
I understand that the information in this form will be used for research purposes only, and that all per-
- snal information will be kept strictly confidential. I also understand that the Divers Alert Network may
need to contact me in the future for clarification of information provided on this form.
Patient Signature
http://rubicon-foundation.org
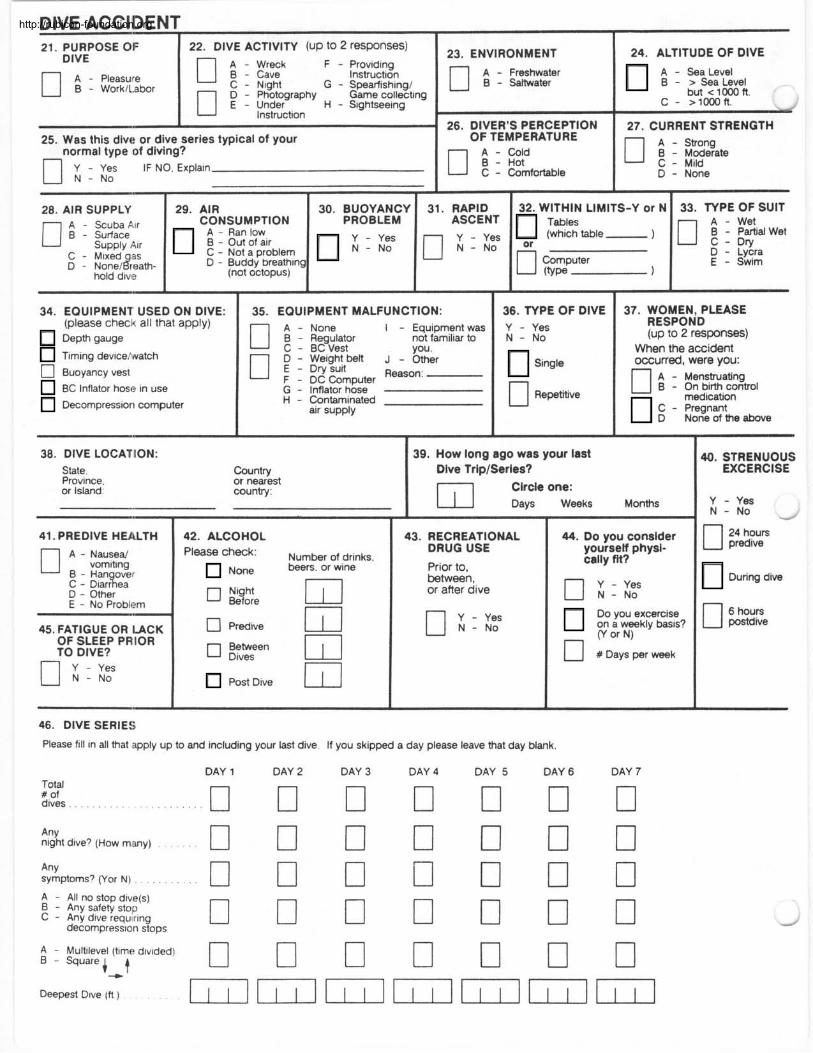
DIVE ACCIDENT . I
24. ALTITUDE OF DIVE 21. PURPOSE Ol= DIVE
A - Pleasure 0 B - VVorkLabor
A - B - > Sea Level
c - >1mft.
27. CURRENT STRENGTH A - Strong
D - None
22. DIVE ACTIVITY (UP to 2 responses)
A - Wreck 0 B - cave F - Providing
Instruction C - Nlght G - Spearfishing1 0 D - Photography Game collecting E - Under H - Sightseeing
Instruction
23.
25. Was this dive or dive series typical of your ,,normal type of diving?
Y - Yes IF NO, Explain N - NO
34. EQUIPMENT USED ON DIVE: (please check all that apply) Depth gauge
Timing dev~celvvatch
26. DIVER'S PERCEPTION OF TEMPERATURE
A - Cold B - Hot
'S-Y or N
-1 - - 1
0 Buoyancy vest
BC Inflator hose in use
33. TYPE OF SUIT A - Wet 0 ; I ; ~ w e t D - Lycra E - Swim
Decompression computer
EQUIPMENT MALFUNCTION:
28. AIR SUPPLY A - Scuba Air
C - M~xed qas D - ~onelflfeath-
hold dtif~!
A - None I - Equipment was B - Regulator not familiar to C - BC Vest you. D - Weight belt J - Other E - Dry suit F - DC Computer Reason:
G - Inflator hose
30. BUOYANCY PROBLEM
Y - Yes N - NO
29. AIR CONSUMPTION
A - Ran low B - Out of air C - Not a problem D - Buddy breathing
(not octopus)
H - Contaminated air supply
31. RAPID 32. WITHIN LIMI
&?!:table-
computer ( V P -
36. TYPE OF DIVE Y - Yes N - NO
Single
0 Repetitive
37. WOMEN, PLEASE RESPOND (up to 2 responses)
When the accident occurred. were vou:
- Menstruating - On birth control medication
C - Pregnant D None of the above
38. DIVE LOCAKtON: State, Province. or Island:
Country or nearest county:
39. How long ago was your last Dive TripISerles? r l Circle one:
1 Days Weeks Months
41. PREDIVE HEA,LTH A - NauseaJ
vom~ting B - Han over C - ~ I a r i e a D - Other E - No Problem
45. FATIGUE OR LACK OF SLEEP PRIOR TO DIVE?
Y - Yes N - NO
42. ALCOHOL
'Ieaw check' Number of drinks, N~~~ beers. or wine
Post Dive 1 1 1
43. RECREATIONAL DRUG USE
Prior to, between, or after dive
46. DIVE SERIES
Please f111 in all mat ,apply up to and including your last dive. If you skipped a day please leave that day blank.
Total # of dives
Any night dive? (How many)
44. Do you consider yourself physi- cally fit?
Do you excercise on a weekly basis?
n v or N)
#Days perweek
Any symptoms7 (Yor N) . . . . . . . . . .
DAY 1 DAY 2 DAY 3 DAY 4 DAY 5 DAY 6 DAY 7
A - All no stop d~ve(s) B - Any safety stolp
- Any dlve requrlng decompress~on stops
A - Multilevel (time d~v~ded) B - Square i t + Deepest Dlve (f! )
a. STRENUOUS EXCERCISE
Y - Yes N - NO -
predive 0 24
During dive
http://rubicon-foundation.org
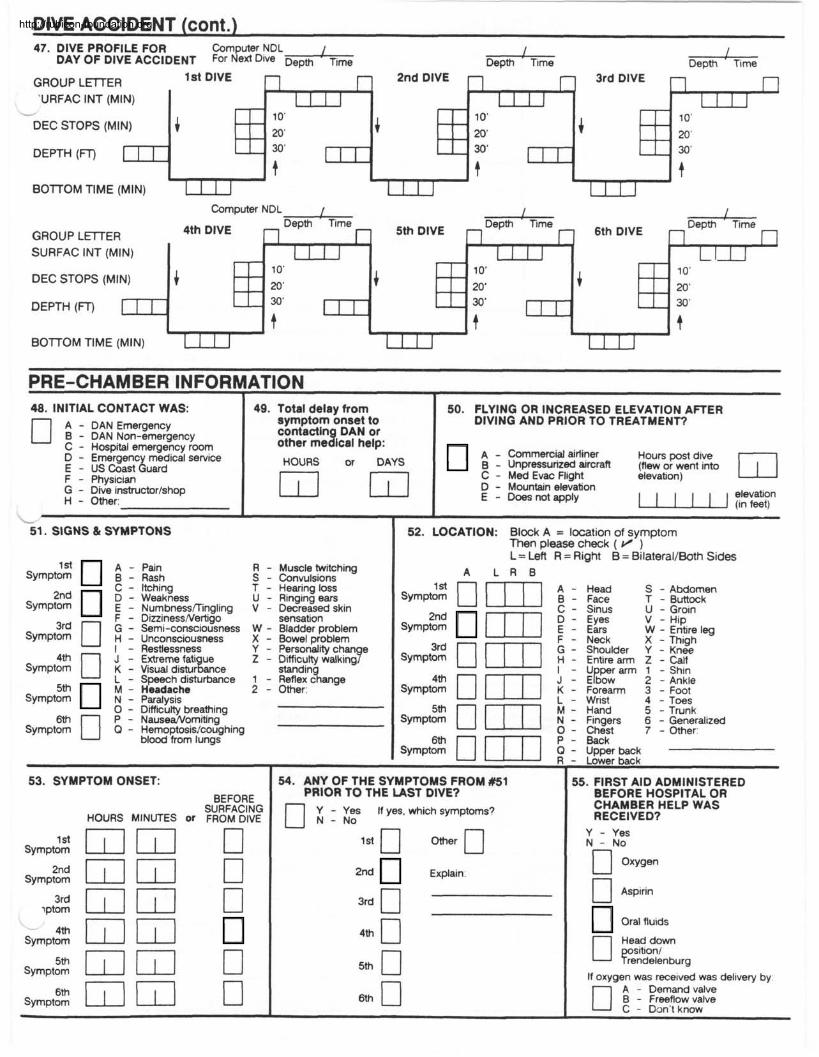
DIVE ACCIDENT (cont.) 47. DIVE PROFILE FOR Computer NDL 1 I
DAY OF DIVE ACCIDENT For Ne* Dive Depth Time Depth ' Time D e ~ m ' Time
GROUP LETTER 'URFAC INT (MIN)
6
DEC STOPS (MI
DEPTH ( q
BOlTOM TIME (MIN)
Computer NDL I 1 I
GROUP LElTER SURFAC INT (MIN)
DEC STOPS (MI
DEPTH ( W
BOlTOMTlME(M1N) 7
PRE-CHAMBER INFORMATION . 48. INITIAL CONTACT WAS:
A - DAN Emergency B - DAN Non-emergency C - Hospital emergency room D - Emergency medical service E - US Coast Guard F - Physician G - Dive instructor/shop H - Other:
49. Total delay from symptom onset to contacting DAN or other medical help:
HOURS or DAYS
50. FLYING OR INCREASED ELEVATION AmER DIVING AND PRIOR TO TREATMENT?
A - Commercid airliner Hours post dive - Unpressurized aircraft (flew or went inm C - Med Evac Fl~ght elevation) D - Mountain elevation E - Does not apply 1 1 1 1 1 1 $':?
53. SYMPTOM ONSET: BEFORE
SURFACING HOURS MINUTES Or FROM DIVE
symptom l dQGI 0 !3yrnptom 2nd GI Q 0
lptom 3rd GI Iil 0 - IT1 rn Symptom
symptom 5 t h ~ ~ LI Symptom
I L
51. SIGNS & SYMPTONS
sympt;$ 1 g[h S R - - Convulsions Muscle twiichirg C - Itching T - Hearing loss
Symp?;: D E - - Weakness Numbnessflingling V - Decreased skin U - Ringing ears
3d F - DizzinessNert~go sensat~on G - Semi-consciousness W - Bladder problem
Symptom H - Unconsciousness X - Bowel problem I - Restlessness Y - Personahty chan e J - Ex-treme fati ue
4th 0 K - Visual d1sturLce Z - Difficulty walk,ng?
Symptom stand~n L - Speech disturbance 1 - Reflex
5th M - Headache 2 - Other: S P P ~ O ~ N - Paralysis
0 - D~fficutty breathing
sympt% 0 P - Nause&orniting Q - Hemoptosis/coughing
blood from lungs
54. ANY OF THE SYMPTOMS FROM #51 PRIOR TO THE IAST DIVE?
I
52. LOCATION: Block A = location of symptom Then please check ( v ) L = Left R = Right B = BilateraIlBoth Sides
A L R B
syrnp;: 0 Wl 1 ;::: S - Abdomen
C - Sinus U - Groin T - Buttock
sympg: m] 1 ::;: V - HIP W - Entire leg
F - Neck X - Thigh
sympg: 0 m1 G - Shoulder Y - Knee
H - Entire arm Z - Calf I - U per arm 1 - Sh~n
S y m p t 2 0 ml K - Forearm 3 - Foot J - E ~ O W 2 - Ankle
L - Wrist 4 - Toes M - Hand 5 - Trunk
~YmPtzc 0 F l N - F~ngers 6 - Generalized 0 - Chest 7 - Other:
n Y - Yes If yes, which symptoms? N - NO
2nd Explain:
3rd n
. Upper back
. Lower back
55. FIRST AID ADMINISTERED BEFORE HOSPITAL OR CHAMBER HELP WAS RECEIVED?
Y - Yes N - NO
0 Aspirin
Ora\ fluids
Head down 0 y ~ t i o n , rendelenburg
If oxygen was received was delivery by:
0 A - Demand valve B - Freeflow valve C - Don't know
http://rubicon-foundation.org
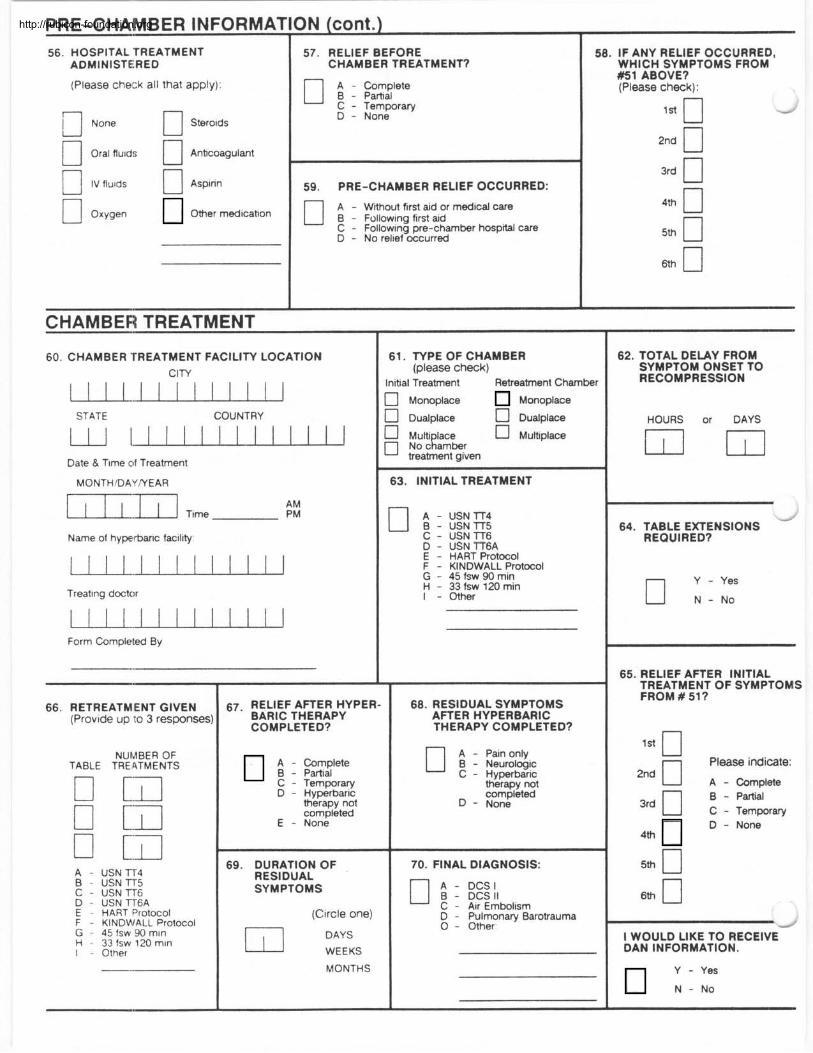
PRE-CHAMBER INFORMATION (cont.) I I
56. HOSPITAL TREATMENT ADMINISTERED
(Please che12k all that apply):
None 0 Stero~ds
n oral fiu~ds 0 Anficoagulant
B IV fluids 0 Aspirin
Oxygen Other medication
57. RELIEF BEFORE 1 CHAMBER TREATMENT?
C - Temporary D - None
1 59. PRE-CHAMBER RELIEF OCCURRED: 0 A - Wfihout ftrst aid or medical care B - Follow~ng first aid C - Follow~ng pre-chamber hospital care D - No rel~ef occurred
CHAMBER TREATMENT
60. CHAMBER TREATMENT FACILITY LOCATION CIW
STATE COUNTRY
Date & Tlme of Treatment
Name of hyperbaric facility
Treat~ng doctor
Form Completed By
RETREATMENT GIVEN (Prov~de up I:O 3 responses:
TABLE NUMBER OF
TRE 4TMENTS
A - USN lT4 B - USN lT5 C - USN lT6 D - USN T T 6 A E - HART Protocol F - KINDMIALL Protocol G - 45 fsw 90 mln H - 33 fsw 120 mln I - Other
67- RELIEF AFTER HYPER- BARIC THERAPY COMPLETED?
; : ;:::Iete C - Temporary D - Hyperbaric
therapy not completed
E - None
69. DURATION OF RESIDUAL SYMPTOMS
(Circle one)
w E K S
MONTHS
58. IF ANY RELIEF OCCURRED, WHICH SYMPTOMS FROM #I ABOVE? (Please check):
l a 0 - 2nd 0 3rd 0 n 0
61. TYPE OF CHAMBER (please check)
Initial Treatment Retreatment Chamber
3 Monoplace Monoplace
2 Dualplace - 0 Dualplace - A MUN lace Multiplace
No cRambr treatment gtven
63. INITIAL TREATMENT
USN TT4 USN TT5 USN lT6 USN TT6A HART Protocol KINDWALL Protocol 45 fsw 90 min 33 fsw 120 rnin Other
68. RESIDUAL SYMPTOMS AFTER HYPERBARIC THERAPY COMPLETED?
A - Pain only B - Neurologtc C - Hyperbaric
therapy not completed
D - None
70. FINAL DIAGNOSIS:
A - DCS I B - DCS I1 ' C - Air Embolism D - Pulmonary Barotrauma 0 - Other
62. TOTAL DELAY FROM SYMPTOM ONSET TO RECOMPRESSION
HOURS or DAYS - -
- 64. TABLE EXTENSIONS
REQUIRED?
Y - Yes n N - N O
65. RELIEF AFTER INITIAL TREATMENT OF SYMPTOMS FROM # 519
l a 0 n Please indicate:
3rd n B - Partial C - Temporary
4th
D - None
5th 0
d
l WOULD LIKE TO RECEIVE DAN INFORMATION.
Y - Yes
N - N O
http://rubicon-foundation.org
DAN Case Number
DIVER PROFILE
Name
Occupation
Date of m t h
Age Sex
Certified Years Diving
Total number of dives made
DIVE CONDITIONS
ME Case Number
Date of Birth Race
S.S. Number Marital Status
Time (24 Hour Clock) First Contact
Height Weight
Certification level
Dives in last 12 months Experience Level
Location
Water environment Water temp
Visibility Wave height
Weather condition EnW
Number in dive group Buddy separation-
Dive Activity
DIVER HEALTH
Fatigue Alcohol
Mental Status Pre-dive Health
Undiagnosed health problems
Current health problems
New dive site Altitude (ft)
Current Water depth
Amount of surge - Bottom type
Air consumption * Tender Type of Suit
Specialty Certified
Drugs Physically Fit
Previous dive accidents
Previous major illness
Rescription medications
Non-p~scription medication
EQUIPMENT AND OTHER DIVE PROBLEMS
Equipment problems Problem 1 Problem 2
Air Supply (scuba, surface, etc.) Entanglement TWPed
Rapid ascent Buoyancy problem Nitrogen narcosis
Infrequent diver Weight belt lbskg -
* Air consumption: Out of air, Low on air, no problem
http://rubicon-foundation.org
DIVE PROFILE
Single dive Decompression diving Last dive triplseries
Using a computer? Type of computer
Depth 1: (ft) Bottom Time 1: (min) Surface interval 1:
Depth 2: (ft) Bottom Time 2: (min) Surface interval 2:
Depth 3: (ft) Bottom Time 3: (min) Surface interval 3:
RECOVERY/FIRST AID
Was event witnessed How long into dive did the problem occur? (minutes)
where (descent, bttom, ascent) What depth (fw)
Immediate Search After (days) (hours) (minutes)
Body R m v e d After (days) (hours) (minutes)
USCG Assistance Medivac
CPR done Oxygen available Oxygen administered
Signs diver knew s/he was in distress
Place death registered (City, County) (State)
AUTOPSY FINDINGS-SOURCES OF INFORMATION
Source 1 Source 2 Source 3
F'rimary cause of death Secondary cause
Heart g Liver g Left Lung g Right Lung-g
Gallbladder g Spleen g Right kidney g Left kidney g
Brain g
Scenario Nmtive:
http://rubicon-foundation.org
CODE = 0
DIAGNOSIS CODING FOR DISEASE SEVERITY BLINDED DIAGNOSIS
CODE = 1 DCS-I PAIN RASH ITCHING
CODE = 2 DCS-I1 PAIN NUMB/TINGLE RESTLESS HEADACHE SKIN-SENSATION MUSCLE-TWITCH
CODE = 3 DCS-I1 RINGING EARS DIZZINESS PAIN FATIGUE REFLEX
CODE = 4 DCS-I1 WEAKNESS NUMBITINGLE BREATHING NASIVOMIT HEARING LOSS SKIN-SENSATION PERSONALITY WALK/ STANDING
CODE = 5 DCS-I1 VISUAL-DIS SPEECH-DIS WEAKNESS PARALYSIS BLADDER BOWEL
CODE = 6 A-G-E SEMI-CONSCIOUS UNCONSCIOUS PARALYSIS CONVULSIONS
ASYMPTOMATIC
ANY ANY
LOCATION* FtDtQtRtStTt4t5. ANY ANY ANY ANY ANY
LOCATION* ANY ANY 0 ANY ANY
LOCATION ANY ANY ANY ANY ANY ANY ANY ANY
LOCATION ANY ANY ANY ANY ANY ANY
LOCATION ANY ANY ANY ANY
SIDE ANY ANY ANY
SIDE ANY L/R ANY ANY LIR ANY
SIDE ANY ANY ANY ANY ANY
SIDE L/R BOTH ANY ANY ANY BOTH ANY ANY
SIDE ANY ANY BOTH BOTH ANY ANY
SIDE ANY ANY L/R ANY
*Location of symptom i s used i n dif ferential diagnosis and refers to question #52 on the DAN Dive Accident Reporting Form i n appendix A.
http://rubicon-foundation.org

NOTES
http://rubicon-foundation.org