Embed Size (px)
Citation preview

Service Technique des Remontées Mécaniques et des Transports Guidés
REPORT MEDDTL DGITM Technical Department for Mechanical Lifts and Guided Transport Systems systems TramWay Division December 2010
ACCIDENTOLOGY
OF TRAMWAYS
Analysis of reported events
year 2009
evolution 2003 2009
Ministry of Ecology, Sustainable Development,
Transport and Housing
wwwdeveloppementdurable.gouv.fr

Service Technique des Remontées Mécaniques et des Transports Guidés
Tramway accident report 2009 – December 2010 Page 2 of 28

Service Technique des Remontées Mécaniques et des Transports Guidés
Tramway accident report 2009 – December 2010 Page 3 of 28
History of document versions
Version Date Remarks
0.1 23 December 2010 Version 1 0.2 7 January 2011 Corrections following latest update of database information
0.3 1 February 2011 Minor corrections
Case Controller
Michel ARRAS STRMTG
Tel: 04.76.63.78.78. / Fax: 04.76.42.39.33.
Email: michel.arras@developpementdurable.gouv.fr
Author
Michel ARRAS – TramWay Division
Verifier
Laetitia MENETRIEUX – TramWay Division

Tramway accident report 2009 – December 2010 Page 4 of 28

Tramway accident report 2009 – December 2010 Page 5 of 28
Contents
1. REMINDER ON THE SUBJECT OF THE DATABASE........................................................................8
1.1 THE FIELDS IN THE DATABASE ..............................................................................................................8 1.2 THE CODIFICATION OF TRAMWAY LINES ...............................................................................................8 1.3 DATA .....................................................................................................................................................8
2. SCOPE OF STUDY .....................................................................................................................................9
2.1 SYSTEMS IN SERVICE ...........................................................................................................................9 2.2 SYSTEMS ANALYSED ............................................................................................................................9 2.3 EVOLUTION OF THE SYSTEMS ANALYSED...........................................................................................10
3. RESULTS ...................................................................................................................................................11
3.1 GENERAL.............................................................................................................................................11 3.1.1 Overall data for 2009.....................................................................................................................11 3.1.2 Remarks concerning the victims ....................................................................................................11 3.1.3 Remarks concerning the events......................................................................................................11
3.2 EVENTS ...............................................................................................................................................12 3.2.1 Breakdown by type – evolution 2003-2009....................................................................................12 3.2.2 Possible indicator for event monitoring : comparison with bus systems .......................................13
3.3 EVENTS – ANALYSIS OF "STPG LINES"...............................................................................................13 3.3.1 Introduction – definition of panel ..................................................................................................13 3.3.2 STPG lines – event monitoring indicator.......................................................................................14
3.4 BREAKDOWN OF VICTIMS....................................................................................................................14 3.4.1 Year 2009.......................................................................................................................................14 3.4.2 2003-2009 evolution ......................................................................................................................15 3.4.3 Indicators for monitoring victims ..................................................................................................16
3.5 SERIOUS EVENTS.................................................................................................................................17 3.5.1 2003-2009 evolution ......................................................................................................................17 3.5.2 STPG lines - serious events............................................................................................................18
4. COLLISIONS WITH THIRD PARTIES ...................... ..........................................................................19
4.1 BREAKDOWN BY THIRD PARTY............................................................................................................19 4.1.1 Year 2009.......................................................................................................................................19 4.1.2 2003-2009 evolution ......................................................................................................................19
4.2 CAUSES OF COLLISIONS.......................................................................................................................20 4.2.1 Preliminary remark........................................................................................................................20 4.2.2 2003-2009 evolution ......................................................................................................................20
4.3 POSSIBLE INDICATORS FOR MONITORING COLLISIONS WITH THIRD PARTIES........................................20 4.3.1 Indicators by intersection ..............................................................................................................20 4.3.2 Indicators per kilometre travelled..................................................................................................21
4.4 IMPACT OF THE COLOUR OF ROLLING STOCK.......................................................................................21
5. ANALYSIS OF CONFIGURATIONS .....................................................................................................23
5.1 BREAKDOWN OF COLLISIONS ACCORDING TO PREDEFINED CONFIGURATIONS.....................................23 5.1.1 Collisions with third parties...........................................................................................................23 5.1.2 The case of pedestrian incidents ....................................................................................................24 5.1.3 Breakdown of collisions with third parties by configuration.........................................................25 5.1.4 Comparison of gyratory configurations and "TURN" junctions....................................................26
6. CONCLUSIONS ........................................................................................................................................28

Tramway accident report 2009 – December 2010 Page 6 of 28

Tramway accident report 2009 – December 2010 Page 7 of 28
INTRODUCTION
This report presents the results of the operation of the tramway accident database for 2009, with the evolution of accidentology since 2003, the first year for which data were recorded. This national database is created from declarations by operators. The term “tramway” covers systems on rails and railguided systems on tyres.
The report largely follows the same format as for earlier years. We have slightly restructured the report by creating a separate section devoted to an analysis of collisions with third parties. A further change is the introduction of an analysis of collisions with pedestrians. In addition, we have attempted a brief analysis of any effect of the tram colour on the risk of collision.

Tramway accident report 2009 – December 2010 Page 8 of 28
1. REMINDER ON THE SUBJECT OF THE DATABASE
More detailed information on the database is provided in the 2004 tramway accidentology report and the present Report will merely reiterate the essential points.
1.1 THE FIELDS IN THE DATABASE
The database fields contain the following information: - Network identification (city and operator) - Type of event, based on a predefined list of undesirable events - Temporal position (date and time) - Geographical position (line, tramway line, tram number, site of event) - Configuration of the site of the event, using a predefined coding system - Environment of the event (external conditions: adhesion, visibility, degraded operation,
works, etc.) - Bodily, material and operating consequences (duration of disruption) - Record of system parameters (according to driver’s statement or data from tachymetric
system) - Police report (yes or no) - Circumstances of the event (summary of event, suicidal action, thirdparty manoeuvre,
etc.) - Followup action taken (investigation in progress, planned modification, action plan
launched, etc.)
1.2 THE CODIFICATION OF TRAMWAY LINES
Codification consists of describing the various tramway line configurations in order to create a descriptive database common to all the lines. The system makes it possible to analyse events in all networks according to the characteristics of the sites where they occur, to make comparisons between configurations and to identify the most accidentprone. New lines and extensions of existing lines are codified as and when they enter service. Please note that the year 2010 was devoted to a total revision of codification. The new codification system aims to give a more precise description of the various existing configurations, particularly for intersections, by identifying crossings which permit “TURN” movements and the different signs or light signals. This should be operational in 2011 and hence used for the accident report on 2010 events.
1.3 DATA
The information comes from operator declarations. The serious work by operators to complete the database should be underlined. However, not all the information to be entered in the database is yet available for all networks, and declaration procedures differ from one network to another. Some networks declare all events, while others declare only those events which are likely to result in a claim against their insurers. As in previous years, we again see significant differences between networks, which leads us to remain prudent in considering the raw annual results and to give priority in the analysis of their evolution.
Tramway accident report 2009 – December 2010 Page 9 of 28
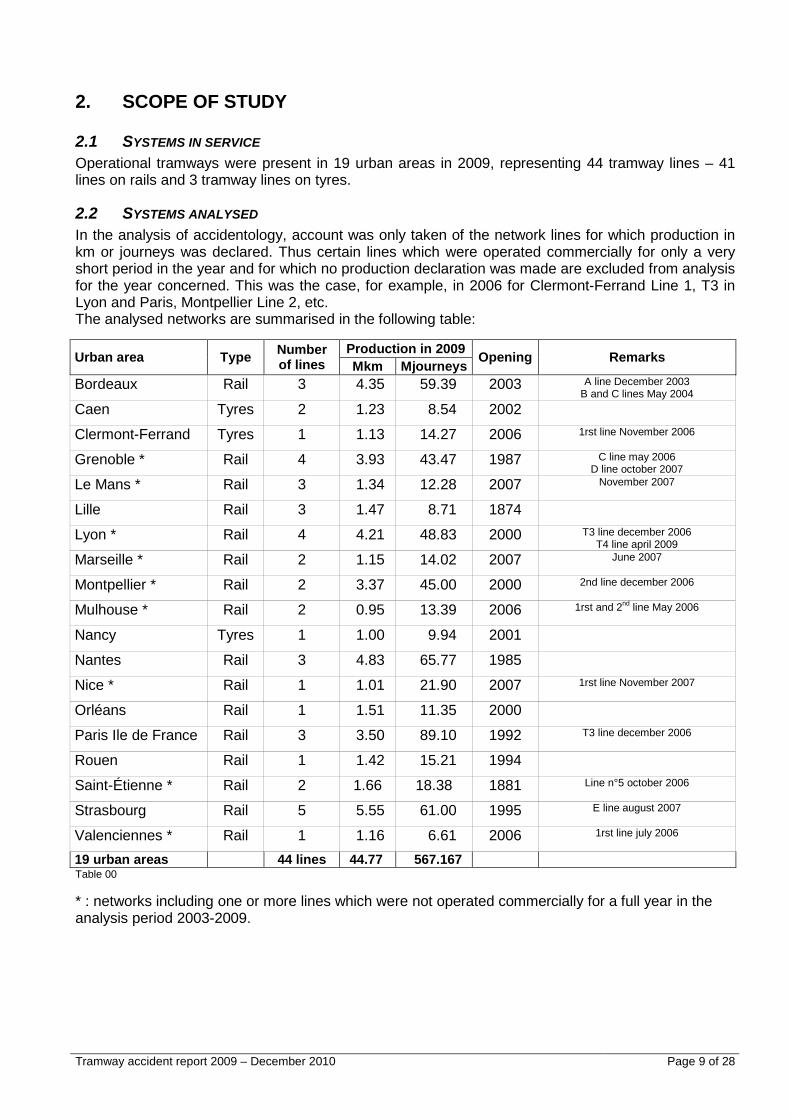
2. SCOPE OF STUDY
2.1 SYSTEMS IN SERVICE
Operational tramways were present in 19 urban areas in 2009, representing 44 tramway lines – 41 lines on rails and 3 tramway lines on tyres.
2.2 SYSTEMS ANALYSED
In the analysis of accidentology, account was only taken of the network lines for which production in km or journeys was declared. Thus certain lines which were operated commercially for only a very short period in the year and for which no production declaration was made are excluded from analysis for the year concerned. This was the case, for example, in 2006 for ClermontFerrand Line 1, T3 in Lyon and Paris, Montpellier Line 2, etc. The analysed networks are summarised in the following table:
Production in 2009 Urban area Type
Number of lines Mkm Mjourneys
Opening Remarks
Bordeaux Rail 3 4.35 59.39 2003 A line December 2003 B and C lines May 2004
Caen Tyres 2 1.23 8.54 2002
ClermontFerrand Tyres 1 1.13 14.27 2006 1rst line November 2006
Grenoble * Rail 4 3.93 43.47 1987 C line may 2006 D line october 2007
Le Mans * Rail 3 1.34 12.28 2007 November 2007
Lille Rail 3 1.47 8.71 1874
Lyon * Rail 4 4.21 48.83 2000 T3 line december 2006 T4 line april 2009
Marseille * Rail 2 1.15 14.02 2007 June 2007
Montpellier * Rail 2 3.37 45.00 2000 2nd line december 2006
Mulhouse * Rail 2 0.95 13.39 2006 1rst and 2nd line May 2006
Nancy Tyres 1 1.00 9.94 2001
Nantes Rail 3 4.83 65.77 1985
Nice * Rail 1 1.01 21.90 2007 1rst line November 2007
Orléans Rail 1 1.51 11.35 2000
Paris Ile de France Rail 3 3.50 89.10 1992 T3 line december 2006
Rouen Rail 1 1.42 15.21 1994
SaintÉtienne * Rail 2 1.66 18.38 1881 Line n°5 october 2006
Strasbourg Rail 5 5.55 61.00 1995 E line august 2007
Valenciennes * Rail 1 1.16 6.61 2006 1rst line july 2006
19 urban areas 44 lines 44.77 567.167
Table 00
* : networks including one or more lines which were not operated commercially for a full year in the analysis period 20032009.

Tramway accident report 2009 – December 2010 Page 10 of 28
2.3 EVOLUTION OF THE SYSTEMS ANALYSED
The evolution is represented by the graphs below: in numbers of urban areas and lines, then in production in km travelled and journeys.
Number of urban areas and lines
0
10
20
30
40
50
2003 2004 2005 2006 2007 2008 2009
No of urban areas No of lines Graph 01
Elements of production
0
10
20
30
40
50
60
2003 2004 2005 2006 2007 2008 2009
Mkm 10Mjourneys Graph 02

Tramway accident report 2009 – December 2010 Page 11 of 28
3. RESULTS
3.1 GENERAL
3.1.1 Overall data for 2009 The number of declarations processed was 1698, breaking down as follows in accordance with the established list of undesirable events:
Events Victims Totals: Third party Passengers
Type No Total Slightly injured
Seriously injured
Fatalit. Slightly injured
Seriously injured
Fatalit. Slightly injured
Seriously injured
Fatalit.
Fire, explosion 3 Panic 0 Electrocution 0 Derailment 17 1 1 1 Passenger accidents 514 556 551 5 551 5 Collision between trams 10 1 1 1 Collision with fixed obstacle 11 2 2 2 Collision with third parties 1082 380 357 17 6 271 17 6 86 Other events 61 3 3 3
Totals: 1698 943 915 22 6 274 17 6 641 5 0 Table 03
Three categories of event account for the majority of declarations: collisions with third parties, passenger accidents and other events.
3.1.2 Remarks concerning the victims It is important to define what is meant by a “victim” in this report.
Persons who do not emerge unharmed from an event are designated as victims and declared as such by the operators. This concept in no way prejudges the seriousness of personal injuries.
The definitions of serious injuries and fatalities are however those accepted and used within the European Union. Seriously injured = duration of hospitalisation more than 24 h. Fatal = death within the 30 days following the event.
These statistical elements on the nature of the victims clearly depend on the information available and the extent of the operator's knowledge.
3.1.3 Remarks concerning the events
3.1.3.1 Fire, explosion
3 events in 2009: - Fire in a tram on tyres following heating caused by a seized wheel brake - incipient fire on one axle of a tram on tyres caused by a brake seizure - incipient fire in a tram wheel mud flap due to rubbing by the tyre
3.1.3.2 Derailment
Of the 17 events: - 9 cases of guide rail malfunction on tram on tyres - 1 derailment caused by running over an cowcatcher which had fallen onto the track
- derailment in an tram junction caused by a switch automatic positioning when a train was passing (modification of the PLC)
- 1 derailment caused by a driver error : speed too high for the configuration of the site - 3 derailments due to driver error when turning back at terminus - 2 incidents of passing the end-of-line derailer, one of which resulted in significant damage

Tramway accident report 2009 – December 2010 Page 12 of 28
3.1.3.3 Passenger accidents
This category of event is analysed later in this document (Chapter 3.4). 3.1.3.4 Collision between trams
Of the 10 declared collisions, 8 were harmless events involving rear view mirror contact on tram on tyres. The 2 others resulted from low-speed driving errors 3.1.3.5 Collision with obstacle on track
These events require no particular comments for 2009. 3.1.3.6 Collision with third parties
A detailed analysis of the category can be found in Chapters 4 and 5 of this Report. We now relate the circumstances of the 7 fatal events.
- Five pedestrian events Two losses of balance when crossing the track Two pedestrians unexpectedly crossing in front of a tram One pedestrian crossing in front of a tram which was restarting after a saturated junction cleared.
- One incident involving a scooter Hidden by a bus, a scooter ran a red light at high speed and collided with a tram. 3.1.3.7 Other events
As the name suggests, this category covers events which do not fall within the other types. We therefore find mainly the following:
- Events affecting the system: 8 events, including 6 tram on tyres brake caliper breakages - Acts of vandalism or incivility: 53 events, 43 of which were declared by a single network (a
recurring item in declarations from this network)
3.2 EVENTS
3.2.1 Breakdown by type – evolution 2003-2009
3.2.1.1 All events - raw data
Graph 04
0 300 600 900
1200 1500 1800
2003 2004 2005 2006 2007 2008 2009 Fire - Explosion Derailment Passenger accident Collision between trams Collision with fixed obstacle Collision with a third party Other events
3.2.1.2 All events - relative distribution
0% 15% 30% 45% 60% 75% 90%
Fire Explosion
Derailment Passengert accident
Collision between trams
Collision with fixed obstacle
Collision with third party
Other events
2003 2004 2005 2006 2007 2008 2009 Graph 05

Tramway accident report 2009 – December 2010 Page 13 of 28
We observe a breakdown of events which is virtually identical for the seven years, with contrary trends in passenger accidents and collisions with third parties.
3.2.2 Possible indicator for event monitoring : comparison with bus systems The number of events per 10,000 km is a routine indicator for certain tram and bus systems. We obtained accidentology information for 5 bus networks. These were the following networks: Bordeaux, Marseille, Nantes, Nice and Paris. The events taken into account for buses are broadly the same as those for trams: collisions with third parties, essentially passengers. Applying this to all the networks which declared their production, we obtain the following graph:
Graph 06
0,455 0,494 0,468 0,462 0,453 0,389 0,376
0,894 0,844 0,854 0,842 0,741
0,350
0,550
0,750
2003 2004 2005 2006 2007 2008 2009
Tramway Bus
Although there were different panels for the urban areas compared, it remains true that, for this indicator, the comparison with buses is advantageous to tram systems.
3.3 EVENTS – ANALYSIS OF "STPG LINES"
3.3.1 Introduction – definition of panel We refer to "STPG" lines as opposed to "conventional" lines: this is a linguistic device to allow easy identification of tram systems constructed under the definition of the STPG Decree of 2003.
This means that STPG lines are those which entered commercial operation from the year 2006.
They are summarised in the table below:
Urban area Name of line Type of system Entry into service: Clermont-Ferrand Line 1 Tram on tyres 13/11/2006 Grenoble Line C Rail 20/05/2006 Grenoble Line D Rail 06/10/2007 Le Mans Line 1 Rail 14/11/2007 Lyon T3 Rail 04/12/2006 Lyon T4 Rail 20/04/2009 Marseille Line 1 Rail 01/06/2007 Montpellier Line 2 Rail 16/12/2006 Mulhouse Tram 1 Rail 12/05/2006 Mulhouse Tram 2 Rail 12/05/2006 Nice Line 1 Rail 26/11/2007 Paris / Paris Region T3 Rail 16/12/2006 Saint-Etienne Line 5 Rail 06/10/2006 Valenciennes Transvilles-1 Rail 03/07/2006
Table 06ter
We point out, however, that the present configuration of the accident database does not allow us to identify STPG extensions of conventional lines and thus to make a comparative analysis of accidentology. The new database scheduled for 2011 should allow this.

Tramway accident report 2009 – December 2010 Page 14 of 28
These STPG lines together, for the years 2006-2009, represent the following production parameters :
2006 2007 2008 2009 km 5% 22% 27% 28% Journeys 4% 20% 27% 28%
Table 07
3.3.2 STPG lines – event monitoring indicator
Number of events per 10,000 km
Graph 08
0,455 0,494
0,468 0,462 0,453
0,389 0,376
0,551
0,389 0,389
0,339
0,455 0,494
0,468 0,457 0,471
0,389 0,391
0,3
0,4
0,5
0,6
2003 2004 2005 2006 2007 2008 2009
All lines STPG lines
Conventional lines
After two opposite and significant deviations in 2006 and 2006, we observe an alignment of indicators in 2008, together with a more significant reduction of the indicator for STPG lines in 2009.
3.4 BREAKDOWN OF VICTIMS
3.4.1 Year 2009
3.4.1.1 All victims
The number of victims resulting from events in 2009 amounts to 943. It breaks down as follows according to the nature of the events and the victims:
Victims Third party victims Passenger victims Total % Seriously inj.
+ fatalities Total % Seriously inj.
+ fatalities Fire, explosion Panic Electrocution Derailment 1 0.1% 1 0.2% Passenger accidents 556 59% 556 86.1% 5 Collision between trams 1 0.1% 1 0.2% Collision with fixed obstacles 2 0.2% 2 0.3% Collision with third parties 380 40.3% 294 99% 23 86 13.3% Other events 3 0.3% 3 1% Totals: 943 100% 297 31.5% 23 646 68.5% 5 Table 09
The two main events which result in victims are passenger accidents and collisions with third parties; the majority of the victims are passengers.
Collisions with third parties are however more serious consequence and account for the 23 serious injuries and fatalities observed. 3.4.1.2 Passenger victims of passenger accidents
In addition to collisions with third parties, passengers can be the victims of “passenger accident” events, which represent more than 86% of all victims among passengers This event breaks down into the following different types:

Tramway accident report 2009 – December 2010 Page 15 of 28
Falls in the tram 463 83.3% Falls from the tram onto the line 0 Falls from the tram at the station 25 4.5% Falls from the platform 15 2.7% Trapping in the tram 50 9.0% Dragging by the tram 3 0.5%
Including 311 - 67% after an emergency braking The majority (72%) of passenger victims is caused by falls in the tram, most of these falls (67%) being a result of emergency braking
3.4.2 2003-2009 evolution
3.4.2.1 All victims
- Raw data
Graph 11
0
300
600
900
1200
2003 2004 2005 2006 2007 2008 2009
Third party Passenger
- Annual breakdown by event
Graph 12
0%
20%
40%
60%
Fire - Explosion
Derailment Passenger accident
Collision between trams
Collision with fixed obstacle
Collision with third party
Other event
2003 2004 2005 2006 2007 2008 2009
Passenger accidents and collisions with third parties continue to be the predominant events resulting in victims. We see a very slight reverse tendency in the breakdown of victims between these two events during the last period 2006-2009. 3.4.2.2 "Serious" victims
With effect from 2007, operators were asked to indicate, among the victims, those which correspond to the definition of seriously injured (more than 24 hours of hospitalisation). We feel it to be of interest to analyse the previous breakdown for serious victims (serious injuries + fatalities), restricted to the years 2007 to 2009.
- Annual breakdown of the proportion of serious victims according to event
Graph 13
0% 1% 2% 3% 4%
Fire - Explosion
Derailment Passenger accident
Collision between trams
Collision with fixed obstacle
Collision with third party
Other event
2007 2008 2009

Tramway accident report 2009 – December 2010 Page 16 of 28
Collisions with third parties create a greater proportion of serious victims than passenger accidents. Globally, this proportion of serious victims caused by all the events above remains at a low level : less than 1.5% for passengers and less than 4% for third parties. Finally, we see no significant trend in the evolution of this proportion between 2007 and 2009.
- Annual evolution of the proportion of serious victims, distinguishing between serious injuries and fatalities
Graph 13ter
0%
2%
4%
6%
2007 2008 2009
Seriously injured Fatalities
Here again, we underline the low proportion of serious victims (less than 6% of all victims). Furthermore, the essential part of the annual change concerns the variation in the number of seriously injured, although it is not possible to discern a trend over these three years 3.4.2.3 Passenger victims of passenger accidents
The comparison is done on the breakdown of passenger victims of the “passenger accident” event in accordance with the breakdown shown under 3.4.1.2 above.
Graph 15
0%
30%
60%
90%
2003 2004 2005 2006 2007 2008 2009
Fall in the tram
Fall from the tram on the line
Fall from the tram in station
Fall from the platform
Trapping in the tram
Dragging by the tram
Vandalism Fall on the platform
Falls in the tram remain predominant and no significant trend appears in the overall evolution for these four years.
3.4.3 Indicators for monitoring victims
3.4.3.1 Overall results
We propose to monitor the evolution of accidentology according to three indicators: the number of passenger victims per 10 million journeys, the number of third-party victims per million km and the number of fatalities per 10 million km. On the basis of these three indicators, we obtain the following evolution:
Graph 16
0 3 6 9
12 15
Passengers/10Mjourneys Third parties/Mkm Fatalities/10Mkm
2003 2004 2005 2006 2007 2008 2009
The trend in the passengers indicator follows that observed previously under § 3.4.2.1 on the annual breakdown by event (Graph 12).
Tramway accident report 2009 – December 2010 Page 17 of 28
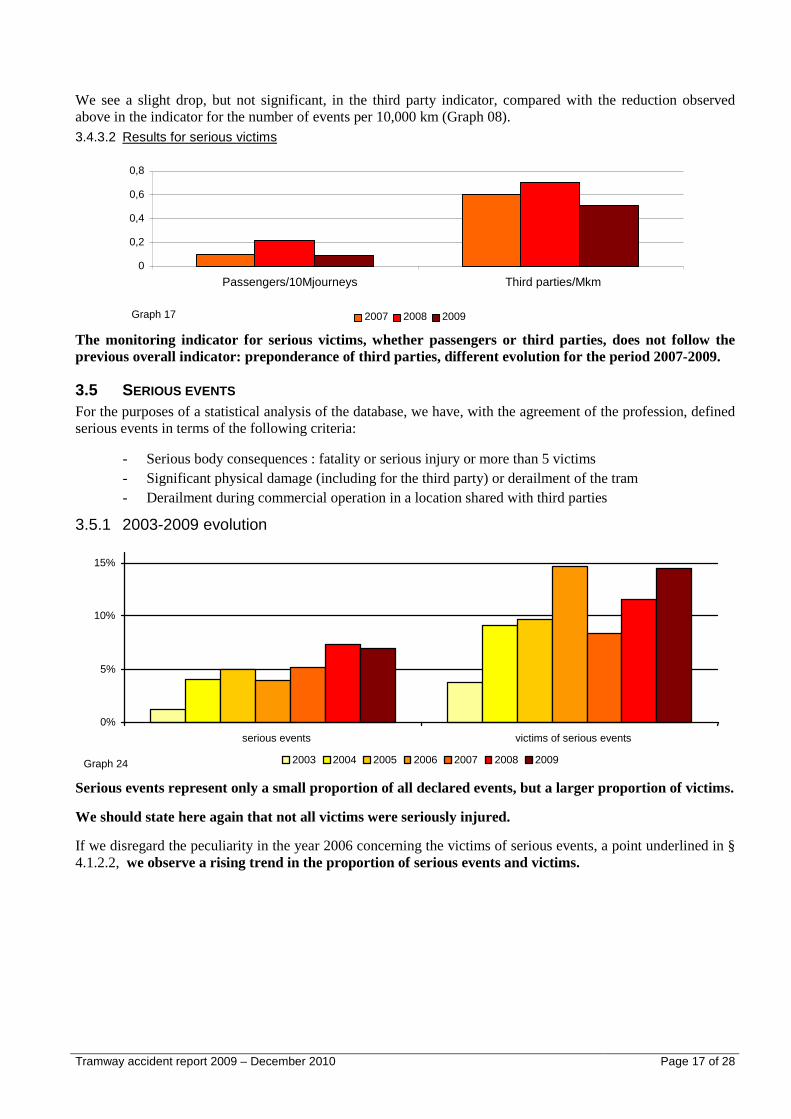
We see a slight drop, but not significant, in the third party indicator, compared with the reduction observed above in the indicator for the number of events per 10,000 km (Graph 08). 3.4.3.2 Results for serious victims
Graph 17
0
0,2
0,4
0,6
0,8
2007 2008 2009
Passengers/10Mjourneys Third parties/Mkm
The monitoring indicator for serious victims, whether passengers or third parties, does not follow the previous overall indicator: preponderance of third parties, different evolution for the period 2007-2009.
3.5 SERIOUS EVENTS For the purposes of a statistical analysis of the database, we have, with the agreement of the profession, defined serious events in terms of the following criteria:
- Serious body consequences : fatality or serious injury or more than 5 victims - Significant physical damage (including for the third party) or derailment of the tram - Derailment during commercial operation in a location shared with third parties
3.5.1 2003-2009 evolution
Graph 24
0%
5%
10%
15%
serious events victims of serious events 2003 2004 2005 2006 2007 2008 2009
Serious events represent only a small proportion of all declared events, but a larger proportion of victims.
We should state here again that not all victims were seriously injured.
If we disregard the peculiarity in the year 2006 concerning the victims of serious events, a point underlined in § 4.1.2.2, we observe a rising trend in the proportion of serious events and victims.

Tramway accident report 2009 – December 2010 Page 18 of 28
3.5.2 STPG lines - serious events These lines entered service in 2006 (cf. § 3.3.1) The following graph chows the evolution of serious events for these lines.
Graph 25
0%
5%
10%
15%
20%
25%
serious events Victims of serious events
2006 2007 2008 2009
For STPG lines, the proportion of serious events and victims of those events is greater than for all lines taken together.
Annual variations for the period 2006-2009 follow those for all lines taken together.

Tramway accident report 2009 – December 2010 Page 19 of 28
4. COLLISIONS WITH THIRD PARTIES
4.1 BREAKDOWN BY THIRD PARTY
4.1.1 Year 2009 With 1082 events in 2009, collisions with third parties represent 64% of all reported events and 40% of victims.
The breakdown of these collisions and the resulting victims according to the type of third party is shown in the following graphic.
Graph 18
0%
20%
40%
60%
80%
Motorcycle Others Pedestrians Public transport or HGV > 3.5 t
Bicycle Car Van < 3.5 t
Collisions Victims
Collisions with private cars account for the great majority of cases. Collisions with pedestrians are much less numerous but create an equivalent proportion of the victims.
4.1.2 2003-2009 evolution
4.1.2.1 Collisions - Overall results
Graph 19
0% 20% 40% 60% 80%
2003 2004 2005 2006 2007 2008 2009
Motorcycle Others Pedestrians Bicycle Car Van < 3.5 t Public transport or HGV > 3.5 t
The overall variation in the breakdown of collisions according to the third party was small for the period analysed. Although we note a slight reduction in the proportion of cars and an increase in that of vans and pedestrians. 4.1.2.2 Collision victims - Overall results
Graph 20
0% 15% 30% 45% 60%
2003 2004 2005 2006 2007 2008 2009
Motorcycle Others Pedestrians Bicycle Car Van < 3.5 t Public transport or HGV > 3.5 t
The breakdown of victims is different: we see more marked variations for pedestrians and private cars. We note lorries as a particular feature in 2006 for the public transport category. Three collisions in this category resulted in a total of 29 victims.

Tramway accident report 2009 – December 2010 Page 20 of 28
4.1.2.3 Serious victims of collisions
Graph 21
0%
2%
4%
2007 2008 2009
Motorcycle Others Pedestrians Bicycle Car Van < 3.5 t Public transport or HGV > 3.5 t
The proportion of serious victims in collisions remains low (less than 5% of total pedestrian victims). However, the latter category represents the largest fraction of serious victims and increased over the period.
4.2 CAUSES OF COLLISIONS
4.2.1 Preliminary remark Collisions with trams are essentially caused by third parties failing to comply with signals. In the current state of the information available in the database, we can identify the following failures to comply with: red lights or STOP signs, R24 and other static signals such as C20c and AB3a (GIVE WAY). The future codification system should allow an improved analysis by more precise identification of the configurations where collisions occur, in particular the type of light signals : R24, R11, etc.
4.2.2 2003-2009 evolution The evolution of causes is shown in the following graphic:
Graph 22
0%
15%
30%
45%
60%
Red/Stop Other priority refusals R24 R17 2003 2004 2005 2006 2007 2008 2009
The evolution in the proportion of running red lights or stop signs in the last four years is close to that for R24’s. Non-compliance with R17 signals (a few cases per year) by tram drivers, declared since 2007, still occurred in 2009, even though the offence represents a very low proportion of causes of collision in the 3 last years.
4.3 POSSIBLE INDICATORS FOR MONITORING COLLISIONS WITH THIRD PARTIES
4.3.1 Indicators by intersection With regard to collisions between trams and third party vehicles, it is interesting to relate their number to the number of intersections.
Graph 23
0 2 4 6 8
No. of events/10 intersections
2003 2004 2005 2006 2007 2008 2009
The indicator for the number of collisions per 10 intersections continues to fall.

Tramway accident report 2009 – December 2010 Page 21 of 28
However, we must observe that this indicator is imperfect, because of the operation of certain recent lines for a part of the year.
It also appears more appropriate to monitor the evolution of collisions with third parties on the basis of an indicator relating the number of collisions to the distance travelled.
4.3.2 Indicators per kilometre travelled In § 3.3.2, we presented a kilometre-related indicator for monitoring events. We have however observed a marked disparity between networks in the modalities of declaring certain events, such as passenger accidents.
On the other hand, we are reasonably confident in the homogeneity of declarations concerning collisions with third parties, both between networks and in their continuity with time. We therefore find a collision monitoring indicator related to kilometres travelled to be more relevant.
The following graph shows the evolution in the number of collisions per 10,000 km, the specific evolution for STPG lines, defined in § 3.3, is also shown.
Figure 08bis
0,378 0,361
0,326 0,337 0,32
0,264 0,24
0,456
0,263 0,259 0,209
0,378 0,361
0,326 0,33 0,336
0,266 0,252
0,15
0,3
0,45
2003 2004 2005 2006 2007 2008 2009
All lines STPG lines Conventionnal lines
The general trend is a reduction: note the better performance of STPG lines over the last three years.
4.4 IMPACT OF THE COLOUR OF ROLLING STOCK Certain urban areas have chosen high-visibility colour schemes for their trams:
- Le Mans - Montpellier line 2 - Mulhouse
The liveries of these trams are shown in the photographs below. We have chosen the trams with bright colours, since we believe them to be clearly differentiated from the usual urban environment.
Le Mans Montpellier L2 Mulhouse
For the period 2006-2009, the number of these trams represents the following respective percentages:
2006 2007 2008 2009 Number of trams 6.7% 9.4% 9.3% 8.8%
Number of km travelled 1.7% 6.6% 8.7% 8.5%
0,264 0,259

Tramway accident report 2009 – December 2010 Page 22 of 28
Are these high-visibility colours more likely to enable other road users to perceive the presence of a tram clearly ?
We consider the maximum effectiveness of these colours to be during the daylight hours (low light levels do not allow the colours to be distinguished clearly). In addition, and in order to simplify database queries, we have made no distinction between summer and winter: collisions included in the comparison are therefore those occurring between 8h and 17h over the whole of the year in question.
The graph below illustrates this comparison in the number of collisions per 10,000 km for high-visibility and "dull" trams.
Graph 26
0
0,1
0,2
0,3
2003 2004 2005 2006 2007 2008 2009
High visibility Dull
According to this indicator, a high-visibility tram colour does not improve safety in terms of reducing the number of collisions with third parties.
The graphs are similar to those observed earlier under § 4.3.2; the (small) differences in the values of these indicators arise from the limitation of the period observed. The graph for high-visibility trams has the shape of the curve for STPG lines, which corroborates the fact that the high-visibility trams are indeed those in service on STPG lines !

Tramway accident report 2009 – December 2010 Page 23 of 28
5. ANALYSIS OF CONFIGURATIONS The codification of lines allows an analysis of the breakdown of events according to the various line configurations, together with an identification of the most accident-prone zones, particularly for intersections. Over a period of time successive verifications are performed on the database. These checks allow the fix errors errors concerning codification and location of events. It means that the results presented in this report may be slightly different from those in previous reports.
5.1 BREAKDOWN OF COLLISIONS ACCORDING TO PREDEFINED CONFIGURATIONS In analysing collisions with third parties, we have adopted 11 basic configurations: corresponding to all stations grouped together without distinguishing between the different types, 7 types of intersection and 3 types of running section.
5.1.1 Collisions with third parties
5.1.1.1 Year 2009
The following graphic shows the breakdown of collisions and victims observed (passengers + third parties) according to the various configurations adopted. LEGEND for the diagram below
Graph 27
0%
10%
20%
30%
40%
Collisions Victims
stations simple crossing
simple junction
complex junction
roundabout gyratory
pedestrian cyclist
crossing
ordinary site entry
resident’s access
reserved lane
shared site
ordinary site
We see that the proportion of victims is generally less than that of collisions, except at stations and reserved lanes of running sections. 5.1.1.2 Evolution of the breakdown of collisions for 2003-2009
Graph 28
0%
15%
30%
45%
2003 2004 2005 2006 2007 2008 2009
stations simple crossing
simple junction
complex junction
roundabout gyratory
ordinary site entry
resident’s access
reserved lane
shared site
ordinary site
pedestrian cyclist
crossing
The majority of collisions with third parties occur in simple intersections, gyratories and reserved lanes of running sections.
We observe no significant trend in the evolution of the breakdown of collisions over the period 2003-2009.

Tramway accident report 2009 – December 2010 Page 24 of 28
5.1.1.3 Evolution of the breakdown of victims for 2003-2009
Graph 29
0%
10%
20%
30%
40%
2003 2004 2005 2006 2007 2008 2009
stations simple crossing
simple junction
complex junction
roundabout gyratory
ordinary site entry
resident’s access
reserved lane
shared site
ordinary site
pedestrian cyclist
crossing
LEGEND for the diagrams above and below
The breakdown of victims is slightly different from that of collisions, with a greater proportion in stations.
We observe no significant trend in the evolution of the breakdown of victims over the period.
5.1.2 The case of pedestrian incidents
5.1.2.1 Evolution of the breakdown of collisions with pedestrians for 2003-2009
Graph 29-2
0%
13%
25%
38%
50%
2003 2004 2005 2006 2007 2008 2009
stations simple crossing
simple junction
complex junction
roundabout gyratory
ordinary site entry
resident’s access
reserved lane
shared site
ordinary site
pedestrian cyclist
crossing
The majority of collisions with pedestrians occur in stations, then in running sections (reserved lanes) and simple intersections. The year 2009 is distinguished by a high proportion of collisions with pedestrians in reserved lanes. 5.1.2.2 Breakdown of serious victims in collisions with pedestrians (2007-2009)
Graph 21 in § 4.1.2.3 on serious victims of collisions illustrates the preponderant proportion of pedestrians.We felt it was useful to identify the locations prone to serious pedestrian victims. The graph below shows the proportion of serious pedestrian victims among all pedestrian victims, together with a breakdown by configuration.
Graph 29-4
0%
2%
4%
6%
2007 2008 2009
stations simple crossing
simple junction
complex junction
roundabout gyratory
ordinary site entry
resident’s access
reserved lane
shared site
ordinary site
pedestrian cyclist
crossing
Serious victims of collisions with pedestrians mostly occur when crossing platforms and not within stations or marked crossings.
This may be explained by the speed of trams in these locations and by the effect of driver surprise linked to the existence of visual masks which are often present in these places.

Tramway accident report 2009 – December 2010 Page 25 of 28
5.1.3 Breakdown of collisions with third parties by configuration
5.1.3.1 The value of a relative breakdown
The results presented above record the breakdown of collisions according to the configurations of the places where they occurred. We believe it be relevant to relate this breakdown to the number of configurations present in the networks. 5.1.3.2 Results for 2009
The following graphic evaluates the relative proportions of collisions and victims (third parties and passengers) according to the number of configurations in existence. This can be described, somewhat inaccurately, as the “level of risk” presented by each configuration for collisions and victims.
Graph 30
0
1
2
3
4
5
6
Risk of collision Risk of victims
stations simple crossing
simple junction
complex junction
roundabout gyratory
ordinary site entry
resident’s access
reserved lane
shared site
ordinary site
pedestrian cyclist
crossing
- Collisions
The "simple junction" configuration, which accounted for the greatest proportion of collisions (35%) is "only" of level 2, while the "roundabout/gyratory" configuration (15%) almost reached level 5.5.
- Victims We have seen above that a significant proportion of victims (23%) occurs at simple intersections, but its “risk level” is 1.3 against a value of 4 for a “roundabout/gyratory” intersection (around 12%).
For the year 2009, among all the types of intersection between tramways and roads, the “roundabout or gyratory” configuration is always the most problematic in terms of collisions and victims.
5.1.3.3 Evolution of the relative breakdown of collisions for 2003-2009
The following graphic shows the 2003-2009 evolution in the relative proportion of collisions according to configuration.
Graph 31
0
1
2
3
4
5
6
2003 2004 2005 2006 2008 2009
stations simple crossing
simple junction
complex junction
roundabout gyratory
ordinary site entry
resident’s access
reserved lane
shared site
ordinary site
pedestrian cyclist
crossing
It confirms the characteristic position of "roudabout/gyratory" configurations for collisions with thi rd parties.

Tramway accident report 2009 – December 2010 Page 26 of 28
5.1.3.4 Collisions in roundabouts/gyratories – STPG lines
The following graph represents the number of collisions per roundabout/gyratory and its evolution over the period 2003-2009. It identifies STPG lines according to the definition in § 3.3.
Graph 32
0
0,5
1
1,5
2
2003 2004 2005 2006 2007 2008 2009
Conventional lines STPG lines
We observe stability in the indicator for the number of collisions per roundabout/gyratory over the period, and convergence of the indicator for STPG lines with the indicator for conventional lines: to be monitored.
5.1.4 Comparison of gyratory configurations and "TURN" junctions
5.1.4.1 Preliminary remark
The comparison made previously of accidentology for different intersections was criticised because we compared the gyratory configuration, which allows all vehicle movements (left turn, right turn, U-turn, etc.) with other configurations, some of which only offer simple trajectories, most frequently with direct crossing of the tram platform.
TURN manoeuvres (to the left or right) in intersections are reputed to be more hazardous than simple platform crossings. A road user follows a road parallel to the platform then, at the intersection, carries out a TURN manoeuvre to cross it. In these conditions, the user may not have a clear view of the presence of a tram behind him, and may also be misled by a light signal authorising STRAIGHT ON but prohibiting TURN when crossing the tramway.
Line codification is not at present sufficiently refined for precise identification of intersections in which TURN movements are permitted and performed, and the associated signal type. However, in anticipation of the new codification, we suggest a first approach. 5.1.4.2 Intersections with TURNS
In the present codification system, this concerns the following three configurations: - Local access - Simple junction - Complex junction
The database also includes third party movements when collisions occur, in particular TURN manoeuvres. 5.1.4.3 2003-2009 evolution of the relative distribution of collisions in gyratories and junctions with TURNS
Graph 33
0
0,5
1
1,5
2003 2004 2005 2006 2007 2008 2009
TURN manœuvre TURN configuration Roundabout/gyratory
Tramway accident report 2009 – December 2010 Page 27 of 28
The illustration above shows graphs for the following indicators:
In red: The number of collisions caused by TURN manoeuvres in intersections with “TURN”, related to the number of those intersections.
In green: The number of collisions in intersections with TURN, related to the number of those intersections. In practice, as we are not certain of the exhaustiveness of the indications provided in operator declarations, we have included all collisions in this graph, even if TURN movements by third parties are not mentioned.
In blue: The number of collisions in roundabouts/gyratories, relative to the number of roundabouts/ gyratories.
Whether we only target, in intersections with a “TURN” possibility, events caused by third party “TURN” movements, or extend the analysis to all events, the number of collisions per gyratory is always greater (more than double) than for “TURN” intersections.

Tramway accident report 2009 – December 2010 Page 28 of 28
6. CONCLUSIONS The conclusions of the preceding report for the years 2007-2008 and dealing with the period 2003-2008 remain globally valid.
���� Constant factors
- The heterogeneous nature of operator declarations, although each is mainly based on the same modalities over the period.
- The breakdown of events according to type (passenger accident, collision with third party, etc.). - The breakdown of events according to tramway configurations - The position of roundabouts /gyratories in hazardous configurations
���� Satisfactions
- The effort devoted by operators for completing the database - The drop in the indicator based on number of events per 10,000 km, particularly in 2009 for STPG
lines - The favourable comparison of this indicator with that for bus networks - The low proportion of serious victims: 0.5% for passengers and 2.5% for third parties in 2009 - The low proportion of serious events: 7% in 2009.
���� What remains preoccupying
- A rise in the proportion of serious victims (2007-2009), for pedestrians in particular - A rise in the proportion of serious events (2003-2009) - The significant proportion of STPG lines (entering service since 2006) in serious events
���� A new codification system
This should allow a finer analysis of configurations It should be operational for 2011 (with retroactive effect for the analysis of earlier accidents).