Embed Size (px)
Citation preview

Accident and Health Insurance Market Report for 2008
State of West Virginia
Offices of the Insurance Commissioner
November 2008

Table of Contents
List of Tables and Figures………………………………………………………………….........2
Executive Summary……………………………………………………………………..…….…3
I. Introduction……………………………………………………………………………… ..…...4 A Cautionary Note 4 Healthcare Insurance Markets 4 Organization of the Report 5
II. Comprehensive Major Medical Coverage…………………………………………………..5 Group Coverage 5
Individual Coverage 8 Market Stability 8 Cost of Major Medical Coverage 9
III. Disability Coverage…………………………………………………………………….…...10 Group Disability Coverage 10 Individual Disability Coverage 11
IV. Medigap (Medicare Supplement) Coverage………………………………………….…...13
V. Long-Term Care Coverage…………………………………………………………….……15
VI. Other Healthcare Insurance Products……………………………………………...……..17
VII. Summation…………………………………………………………………………….…...18
VIII. References……………………………………………………………………………...…19
IX. Appendices………………………………………………………………………………….20 Appendix A: Copy of the 2008 Survey with instructions requesting data 20 Appendix B: Aggregated 2008 responses in Survey format 25 Appendix C: Responses by Purchaser Type by Line of Business 28

Tables and Figures 1. Figure 1, Comp. Major Medical Insurance Percent of Covered Lives by Type of Purchaser …...….6 2. Table 1, Top 10 Carriers of Large Group Major Medical Coverage.……….…………………………..…7 3. Table 2, Top 10 Carriers of Small Group Major Medical Coverage ………………………………..…….7 4. Table 3, Top 10 Carriers of Individual Major Medical Coverage …………….…………………………..8 5. Table 4, Active Carriers in the Major Medical Coverage Market …… ……………………………...9 6. Table 5, Table 5. Average Annual Cost per Insured (Major Medical)… …………………….….......9 7. Table 6, Top 5 Carriers of Group Coverage: Short-Term Disability …………….... ........................10 8. Table 7, Top 5 Carriers of Group Coverage: Long-Term Disability ……………………...………..11 9. Table 8, Top 5 Carriers of Individual Coverage: Short-Term Disability …...………………............11 10. Table 9, Top 5 Carriers of Individual Coverage: Long-Term Disability…………………………..12 11. Figure 2, 3-Year snapshot of the Disability Market (Premium Basis/ Covered Lives Basis)……..12 12. Table 10, Top 10 Carriers of Medigap Individual Coverage ……………………..…………….....13 13. Table 11, Top 10 Carriers of Medigap Group Coverage …………………………………..……....14 14. Table 12, Top 10 Carriers of Individual Long Term Care, Tax Qualified …………………...…....15 15. Table 13, Top 10 Carriers of Individual Long Term Care, Non-Tax Qualified……………………16 16. Table 14, LTC Covered Lives and Premium…………………………………………………...…..16 17. Figure 3, A History of Active A&H Carriers—WV Selected Lines……...……………………….18

Executive Summary
The Accident and Health Insurance Market Report for 2008 examines the high-volume products sold in West Virginia’s insurance market. These products are: comprehensive major medical, disability, Medicare supplement and long-term care policies. Both group and individual policies are considered for each product line. The findings of the report indicate that the accident and health market is relatively stable by the measures of carrier entry and exit, premium volume, and number of covered lives. The noted drop in the number of lives covered by comprehensive major medical insurance contained in the previous report appears to have lessened and remains just below the 2005 level in the aggregate with a general shift from large group to individual coverage occurring. New for 2008, the individual and aggregated by line responses are provided in the Appendices of this report. A summarization of those tables follows indicating which particular lines of business can be measured as competitive, as well as the pure direct loss ratio for those specific lines of business.
2007 Herfindahl-Hirschman Index (HHI) 2007 Pure Direct Loss Ratios Line of Business Individual Group Combined Line of Business Individual Group Combined
Comprehensive Major Medical (Excl HDHP) 6,372.00 N/A N/A Comprehensive Major Medical (Excl HDHP) 65.42% N/A N/A Small Group Comp. Major Medical N/A 3,306.41 N/A Small Group Comp. Major Medical N/A 75.54% N/A Large Group Comp. Major Medical N/A 2,519.53 N/A Large Group Comp. Major Medical N/A 90.01% N/A Non-Exempt Assoc. Group CMM N/A 2,200.42 N/A Non-Exempt Assoc. Group CMM N/A 89.39% N/A Exempt Assoc. Group CMM N/A 4,525.25 N/A Exempt Assoc. Group CMM N/A 73.41% N/A Group Trust Comp. Major Medical N/A 8,959.94 N/A Group Trust Comp. Major Medical N/A 12.19% N/A Discretionary Groups CMM N/A 2,976.14 N/A Discretionary Groups CMM N/A 22.10% N/A Comp. Major Medical (HDHP Only) 4,732.92 1,965.15 N/A Comp. Major Medical (HDHP Only) 67.00% 77.32% N/A Comprehensive Major Medical (All) 5,966.49 2,720.36 2,863.41 Comprehensive Major Medical (All) 65.48% 83.32% 82.67% Federal Employees Health Plans N/A 9,498.10 N/A Federal Employees Health Plans N/A 93.63% N/A Other Medical (Non-Comprehensive) 7,352.24 4,032.35 5,749.53 Other Medical (Non-Comprehensive) 91.93% 49.12% 86.76% Specified/Named Disease 1,621.62 3,997.03 1,935.88 Specified/Named Disease 43.79% 116.46% 62.42% Limited Benefit 1,761.85 3,833.61 2,958.46 Limited Benefit 114.93% 66.36% 72.53% Student Policies 6,467.69 1,571.10 1,264.04 Student Policies 88.86% 64.84% 65.74% Accident Only or AD&D 2,720.04 1,075.72 956.53 Accident Only or AD&D 31.74% 60.08% 45.95% Short Term Disability 1,742.27 630.12 635.13 Short Term Disability 64.51% 79.99% 72.04% Long Term Disability 1,922.53 1,089.55 804.81 Long Term Disability 85.86% 103.43% 99.80% Total Disability (Short & Long) 919.75 855.98 529.00 Total Disability (Short & Long) 74.78% 98.50% 91.39% Long Term Care (Tax Qualified) 1,689.75 1,789.57 1,416.88 Long Term Care (Tax Qualified) 51.11% 46.77% 50.45% Long Term Care (Non-Tax Qualified) 1,301.70 2,494.09 1,273.29 Long Term Care (Non-Tax Qualified) 74.13% 124.55% 75.23% Total LTC (Tax & Non-Tax Qual.) 1,229.62 1,696.64 1,072.93 Total LTC (Tax & Non-Tax Qual.) 55.35% 48.91% 54.51% Medicare Supplement (Standardized) 1,751.22 6,085.89 2,238.33 Medicare Supplement (Standardized) 66.46% 77.37% 71.78% Medicare Supplement (Pre-Standardized) 1,550.91 8,100.55 4,149.37 Medicare Supplement (Pre-Standardized) 71.14% 76.87% 75.17% Total Medicare Supplement 1,439.38 6,505.12 2,362.07 Total Medicare Supplement 67.04% 77.24% 72.45% Dental 9,205.95 1,324.97 1,251.94 Dental 19.96% 71.02% 69.41% Medicare Part C (PPO's) 9,518.33 N/A N/A Medicare Part C (PPO's) 76.02% N/A N/A Medicare Part C (PFFS's) 3,656.70 N/A N/A Medicare Part C (PFFS's) 81.69% N/A N/A Total Medicare Part C 2,695.38 N/A N/A Total Medicare Part C 80.14% N/A N/A Medicare Part D 1,928.27 N/A N/A Medicare Part D 82.59% N/A N/A Total Medicare (Parts C & D) 2,034.27 N/A N/A Total Medicare (Parts C & D) 81.17% N/A N/A Other Lines (Not Otherwise Classified) 6,106.98 4,249.63 N/A Other Lines (Not Otherwise Classified) 92.00% 73.71% N/A TPA and ASO N/A 7,931.20 N/A TPA and ASO N/A 291.01% N/A Stop Loss/Excess Loss N/A 1,579.92 N/A Stop Loss/Excess Loss N/A 71.24% N/A
Total Business 1,024.27 2,051.20 1,158.46 Total Business 80.65% 106.37% 98.41% Competitive > 999 Above Average <72% Moderately Competitive 1,000 => 1,800 Average 72%=> 82% Concentrated <1,800 Below Average >82% See References section for “HHI” definition (A.M. Best's 2008 QAR Comb. A&H L/R =77.4%)

I. Introduction Healthcare costs and health insurance issues are constantly in the news. These expenditures become more visible as medical treatments and drug therapies improve and as healthcare continues to become a more significant portion of the U.S. Gross Domestic Product. Today, healthcare spending accounts for about 16 percent of national output and this proportion appears to be growing. (13.7% in 1995, 13.8% in 2000) This growth, coupled with a multi-party delivery system, makes analysis of the industry difficult. Complexity is added to healthcare discussions because national, state, and even local-level issues are often combined. To help focus the discussion, the Offices of the West Virginia Insurance Commissioner produced this Accident and Health Insurance Report to provide state-specific information about our health insurance market. The purpose of this report is to inform consumers and policymakers of the availability, market concentrations and trends affecting various health and accident insurance products. The data for this report come from several sources. The main data source is from survey responses provided by companies licensed to sell health and accident insurance products in West Virginia. Additional data were collected from national medical organizations and the NAIC (National Association of Insurance Commissioners). In obtaining information from many sources, occasionally terms will not be uniformly defined. In preparing this report we have tried to resolve any definitional inconsistencies that arise, and it is our belief that this report largely represents current market conditions. A cautionary note: The insurance data by type of product and per company contained in this report was afforded to the West Virginia Offices of the Insurance Commissioner from insurers in response to a survey that we remit annually and on a voluntary basis. As such, the data has not been audited for accuracy and may prove accurate in certain instances, for example an insurer responding with data reported on an incorrect line, by incorrect purchaser type (individual as opposed to group), from a year other than 2007, or on a basis which results in the under-reporting or over-reporting of actual transactions. However, comparing the 2007 data to that which was received in prior years, the data does appear to have been afforded on a reasonably similar basis. Healthcare Insurance Markets Healthcare insurance markets are characterized by a patchwork of private and government providers. Moreover, coverage levels are influenced by age, work status, income and other factors. A first step to understanding healthcare markets in West Virginia is to distinguish between the sector of the market that is regulated by the Insurance Commissioner and that which is not. The Commissioner only regulates private carriers which are in the business of selling insurance. Various government agencies provide health insurance to the poor and to the elderly. For example, under the Medicaid and Medicare programs, the non-poor and the working age population are largely covered by employer-based private insurance. Indeed, estimates made by the U.S. Bureau of the Census (2007) suggest that total health care expenses can be broken down into 53.2 percent private and 46.8 percent public. Only private market insurance will be examined in this report.

Organization of the Report The report is organized around four major health and accident products that are sold in West Virginia’s private insurance market: 1) Comprehensive major medical coverage; 2) Disability coverage; 3) Medicare supplement products; and 4) Long-Term care insurance. For each of these major products we evaluate the availability, major carriers, market stability and costs for both group and individual policies. In addition, this report evaluates the condition of health insurance in West Virginia, including a discussion of trends affecting our health insurance market.
II. Comprehensive Major Medical Insurance The biggest market for healthcare products is the comprehensive major medical line of business. We think of this product when we refer to “health insurance.” For the purposes of this report, this line of business is defined as insurance coverage that provides hospitalization, physician services, lab services and medications. In West Virginia, this line of business indicated earned premium revenues of $786 million in 2007 and covered approximately 215,166 lives. Group Coverage Major medical coverage is insurance that is provided primarily by employers as a part of an employee benefits package. The history for linking insurance to the job dates back over 50 years. After World War II, employers found they could circumvent price freezes on wages by adding a non-wage benefit to the pay of their employees. This provides a tax advantage in that a dollar’s pay can buy more healthcare coverage on a pre-tax basis than it can after taxation. Additionally, administrative costs are lowered when employers buy insurance in bulk as opposed to buying insurance on an individual basis. Over time additional tax advantages have been built into employer-provided insurance. Since employer-based medical insurance is so common, we have organized this report according to the buyer of insurance. According to our definition, major medical insurance sold by commercial providers in the State is broken down into large groups (employers with over 50 eligible employees) and small groups (employers with 2 to 50 eligible employees). A chart of the purchasing patterns of those sectors follows.

Figure 1 The preceding chart indicates that the employer groups account for ninety-two percent of covered lives for major medical products. As long as the tax advantages remain, this buying pattern is expected to continue. It should be mentioned, however, that this purchasing tendency has a downside in that when employees tend to become heavily locked into their employers, job mobility will be reduced. The 1996 federal legislation called “HIPAA” (the Health Insurance Portability and Accountability Act of 1996) was created, in part, to increase the portability of healthcare benefits when workers separated from their employers (Rosen, 2004). However, this legislation appears to have had a limited impact on the purchasing patterns of health and accident products since workers still move cautiously from job-to-job trying to maintain their health insurance. In West Virginia, 2007 was marked by relative stability in the major medical lines of business. West Virginia’s top five companies for large group sales account for about 93 percent of premium earned and nearly 90 percent of covered lives. The number of carriers in this line of business declined to 22 for 2007 from the 26 which were observed in 2006.
Comprehensive Major Medical Insurance Percent of Covered Lives by Type of Purchaser (WV, 2007)
Small Group39%
Large Group53%
Individual8%

Table 1. Top 10 Carriers of Large Group Major Medical Coverage Earned
Premium ($) Company Name
Covered Lives
$171,064,583 Mountain State BlueCross BlueShield (Highmark) 41,331 $73,249,668 The Health Plan of the Upper Ohio Valley 21,811 $55,823,265 Carelink Health Plans, Inc. 13,811 $37,871,408 Coventry Health & Life Insurance Company 9,790 $35,685,451 United Healthcare Insurance Company 9,647 $6,551,662 Aetna Life Insurance Company 2,775 $5,269,384 Connecticut General Life Insurance Company 2,786 $3,659,721 THP Insurance Company 1,347 $2,653,417 Consumers Life Insurance Company 1,233 $2,446,648 State Farm Mutual Automobile Insurance Co. 573 $6,958,538 Others (12) 2,122 401,233,745 Totals (22) 107,226
The number of carriers in the small group market decreased from the 2006 total (30) back to the 2005 level of 27. Earned premium volume increased approximately 14 percent over 2006 for the combined sales of large and small group major medical. While at the same time, the number of covered lives decreased by nearly 7% for these group markets.
Table 2. Top 10 Carriers of Small Group Major Medical Coverage
Earned Premium ($)
Company Name Covered
Lives
$162,029,170 Mountain State BlueCross BlueShield (Highmark) 40,152 $41,868,043 Coventry Health & Life Insurance Company 12,878 $25,376,798 Carelink Health Plans, Inc. 5,490 $13,814,190 United Healthcare Insurance Company 5,083 $9,277,927 Principal Life Insurance Company 2,367 $8,929,211 The Health Plan of the Upper Ohio Valley 2,227 $5,551,645 Union Security Insurance Company 1,106 $5,319,156 First Health Life & Health Insurance Company 1,033 $5,096,802 Consumers Life Insurance Company 1,530 $5,031,363 Medical Benefits Mutual Life Insurance Company 1,445
$14,662,570 Others (17) 3,730 296,956,875 Totals (27) 77,041
As one evaluates the previous tables, it is helpful to remember that people continually move in and out of health insurance markets. For example, as incomes change, the eligibility for Medicaid and SCHIP is affected. As people change jobs they move in and out of group plans, and as people reach 65 they become eligible for Medicare. In some cases, people move from uninsured to insured and vice-versa. A special part of the health insurance literature is devoted to these movements. One topic of current interest is the movement from private to government-sponsored insurance as public programs are expanded. This is called “crowding out,” suggesting that increased levels of public assistance induce people to drop or reduce their private healthcare coverage and take publicly-provided benefits. This is a popular topic of current research although it is beyond the scope of this report.

Individual Coverage The final topic in the major medical section is the individual buyer of major medical coverage. As shown in Table 3, this line of business is small relative to that of group, but remains important nonetheless. Its importance comes from the fact that individual buyers are generally different as compared with those participating in the group insurance market. Specifically, the individual buyer is likely to have a job that does not provide healthcare or have no job at all, and the younger and healthier individuals of this market segment often abstain from purchasing healthcare coverage altogether or simply purchase lower levels of coverage. This results in a general adverse selection problem in the individual insurance market (i.e. those with individual insurance are most likely to be individuals who have a medical need and will utilize these products). Accordingly, we expect that lower levels of coverage and more stringent underwriting considerations are in place for individual market products as compared to group insurance products.
Table 3. Top 10 Carriers of Individual Major Medical Coverage Earned
Premium ($) Company Name
Covered Lives
$36,437,253 Mountain State BlueCross BlueShield (Highmark) 8,910 $5,664,108 Time Insurance Company 2,887 $2,779,807 John Alden Life Insurance Company 1,480
$945,894 The Health Plan of the Upper Ohio Valley 264 $658,975 Continental General Insurance Company 86 $330,659 Aetna Life Insurance Company 125 $247,126 American Republic Insurance Company 43 $162,771 Metropolitan Life Insurance Company 148 $117,562 American National Insurance Company 30 $107,794 Prudential Insurance Company of America 397 $449,889 Others (28) 1,025
47,901,838 Totals (38) 15,395 Careful comparison of Table 3 with Tables 1-2 indicates that several of the sellers of individual major medical insurance are different carriers than the sellers of group benefits with the exception of Mountain State BlueCross BlueShield (Highmark). This specialization is a result of companies having different marketing strategies and by the level of underwriting that they utilize. For 2007, premium revenue increased over 2006 by 15%, the number of active carriers remained at 38. However, the number of covered lives increased by nearly 9%. Market Stability Another way to evaluate the major medical markets is to look at the concentration of carriers. Tables 1-3 indicate that, in West Virginia, sales are concentrated in a few major carriers although many firms sell the product. This market structure is characterized by heavy concentration at the top and a large “competitive fringe.” Some fringe firms are renewing existing business but not writing new business. Thus, they do not show up as having exited the market, but they are not available to write new policies either. Other firms are writing new policies after a period of inactivity. Table 4 gives evidence about the total number of carriers in the West Virginia healthcare insurance market writing any kind of major medical coverage.

Table 4. Active Carriers in the Major Medical Coverage Market
Policy Type Carriers Writing New Business
Carriers Renewing Existing Business
Large Group 20 28 Small Group 23 25 Individual 18 60 Totals 61 113
Cost of Major Medical Coverage To better interpret this highly aggregated data, some perspective is helpful. Namely, what does it mean to have a $786 million private major medical market? Some context can be given to these numbers by calculating monthly earned premiums per covered life. This gives a rough approximation of what an individual or family may spend per month on health insurance. Using this approximation, we can estimate the average annual cost per insured.
Table 5. Average Annual Cost per Insured (Major Medical) Policy Type 2005 Increase => 2006 Increase => 2007 Large Group $3,182.12 0.85% $3,209.46 14.23% $3,741.94 Small Group $3,338.51 8.12% $3,633.60 5.73% $3,854.53 Individual $2,715.32 7.71% $2,942.18 5.44% $3,111.52
While we would not expect these policies to have exactly the same coverages, these numbers do serve as useful benchmarks. Considering a family of four, we could estimate that a total premium may be about $10,852 per year, or about $904 per month under an average policy. Since this amount is much higher than most workers spend out-of-pocket for health benefits, employers inevitably absorb much of this cost. But this cost sharing should not obscure a central point: major medical healthcare expenses are a substantial portion of the family budget.

III. Disability Insurance Our society considers major medical insurance essential to financial security. Disability insurance, however, is considered desirable but not essential. Thus, the premium volume and number of carriers writing this product are relatively small when compared with major medical insurance. In West Virginia, disability insurance earned premium was $75.1 million in 2007. Representing a 9.8 percent increase from the previous year. Disability insurance continues to generate approximately one tenth of the premium volume of major medical coverage however. Disability insurance is marketed both to groups and to individuals. A disability policy provides income replacement for those who become unable to work. A “short-term” policy normally provides benefits over a disability period of 13 to 26 weeks, whereas a “long-term” disability policy generally provides benefits beyond 26 weeks. In West Virginia during 2007, 71,892 lives were covered by short-term policies and 230,627 lives were covered by long-term policies in the entire disability market. Since disability insurance pays benefits when a person is unable to work, it is helpful to estimate the percentage of the labor force covered. According to the West Virginia Bureau of Employment Programs, it was estimated that West Virginia’s civilian labor force averaged 808,800 during 2007. From the policy counts above, it is clear that only a small fraction of these workers have disability coverage. There are several reasons for this. One reason is that many workers are covered by sick leave benefits that provide income in the event of disability or long-term illness. Another reason is that Social Security provides small disability payments, and so does Workers’ Compensation if the loss of income is due to an on-the-job injury. A final reason, perhaps less rational, is that people may misjudge the likelihood of injury and illness. Group Disability Coverage Disability coverage sold to employee groups accounted for a $52.6 million in sales in 2007, or about 70 percent of the total disability premium. Tables 6 and 7 below contain information for the top five group carriers by premium volume in West Virginia for this line of business.
Table 6. Top 5 Carriers of Group Coverage: Short-Term Disability Earned
Premium ($) Company Name
Covered Lives
$1,222,021 Metropolitan Life Insurance Company 8,223 $1,143,940 Unum Life Insurance Company of America 4,220 $1,090,597 Sun Life & Health Insurance Company (US) 1,312
$970,769 Fort Dearborn Life Insurance Company 2,881 $859,619 Guardian Life Insurance Company 4,415
$5,785,800 Others (61) 24,003 11,072,746 Totals (66) 45,054

Table 7. Top 5 Carriers of Group Coverage: Long-Term Disability Earned
Premium ($) Company Name
Covered Lives
$10,295,554 Hartford Life and Accident Insurance Company 55,695 $4,768,173 Unum Life Insurance Company of America 21,171 $4,212,308 Standard Insurance Company 14,109 $4,029,493 Metropolitan Life Insurance Company 21,081 $3,123,070 Life Insurance Company of North America 14,526
$15,113,547 Others (52) 91,455 41,542,145 Totals (57) 218,037
Group disability premium grew by 16.6 percent over the 2006 totals. The number of active carriers declined by 1 from 124 to 123, and remained below the 2005 level (130). Significantly however, the reported number of covered lives under all group disability increased from 180,838 in 2006 to 263,091 in 2007. Individual Disability Coverage About 30 percent of disability insurance sales are made directly to individuals. This product is especially attractive to the self-employed and those workers who are not afforded sick leave benefits. Like other accident and health products, sales of individual disability coverage are generally concentrated in a few leading firms. The competitive fringe is large, and activity has increased over 2006. On net, two carriers entered the long-term market and six additional firms became active in short-term disability sales. This market appears to have adequate availability for the product due to the sheer volume of active carriers. Yet the total number of covered lives actually decreased from 2006 to 2007 by less than 1%. It is also notable that a decrease of 11% in the total number of covered lives in this market occurred between 2006 and 2005.
Table 8. Top 5 Carriers of Individual Coverage: Short-Term Disability Earned
Premium ($) Company Name
Covered Lives
$3,457,936 American Family Life Assurance Company 7,419 $2,121,603 Combined Insurance Company of America 8,329 $1,639,631 Colonial Life & Accident Insurance Company 3,705 $1,549,976 Provident Life and Accident Insurance Company 2,005 $1,163,937 Paul Revere Life Insurance Company 637 $1,758,023 Others (47) 4,743 11,691,106 Totals (52) 26,838

Table 9. Top 5 Carriers of Individual Coverage: Long-Term Disability
Earned Premium ($)
Company Name Covered
Lives $4,422,215 Northwestern Mutual Life Insurance Company 4,709 $1,186,367 Massachusetts Mutual Life Insurance Co. 994
$599,057 Berkshire Life Insurance Company of America 271 $589,067 Professional Insurance Company 937 $481,075 AXA Equitable Life Insurance Company 275
$3,553,975 Others (68) 5,404 10,831,756 Totals (73) 12,590
The four preceding tables demonstrate that: 1) Group disability sales are larger than individual sales; 2) The top five carriers in the individual markets (except Unum Life and Metropolitan Life for individual coverages) are different from those in the group market, and the top five carriers in the short-term market are different from those in the long-term market. Suggesting that in general the products are specialized and companies tend to sell one or the other, but rarely both; and 3) The major carriers continue to be life insurance companies and therefore these disability products are likely marketed along with life insurance products. Figure 2
Premium basis 2007
Lives basis 2007
Individual Group Combined Individual Group Combined Short Term $11,691,106 $11,072,746 $22,763,852 Short Term 26,838 45,054 71,892 Long Term $10,831,756 $41,542,145 $52,373,901 Long Term 12,590 218,037 230,627
Total $22,522,862 $52,614,891 $75,137,753 Total 39,428 263,091 302,519
Premium basis 2006
Lives basis 2006
Individual Group Combined Individual Group Combined Short Term $12,788,011 $10,104,502 $22,892,513 Short Term 26,953 42,922 69,875 Long Term $10,503,683 $35,024,097 $45,527,780 Long Term 12,854 137,916 150,770
Total $23,291,694 $45,128,599 $68,420,293 Total 39,807 180,838 220,645
Premium basis 2005
Lives basis 2005
Individual Group Combined Individual Group Combined Short Term $13,493,489 $9,741,158 $23,234,647 Short Term 30,263 56,593 86,856 Long Term $9,675,249 $29,594,697 $39,269,946 Long Term 12,520 134,474 146,994
Total $23,168,738 $39,335,855 $62,504,593 Total 42,783 191,067 233,850

IV. Medigap Insurance Like the name suggests, Medigap (a.k.a. Medicare Supplement) insurance fills the gaps in Medicare coverage for those aged 65 and older. This coverage cannot duplicate a benefit provided by Medicare, but it may pay deductibles, co-payments, and other non-covered expenses. If you join one of these plans, you will generally have all Medicare-covered healthcare provided through that plan. This coverage can also include Medicare Part D prescription drug coverage or separate enrollment in the Medicare Part D prescription drug coverage plan can be obtained. Medicare Advantage Plans include:
• Medicare Health Maintenance Organization (HMOs) • Preferred Provider Organizations (PPO) • Private Fee-for-Service (PFFS) Plans • Medicare Special Needs Plans (SNP) • Medicare Medical Savings Accounts (MSA)
Medigap is a considerable market in West Virginia with earned premiums of $139.5 million. This equates to about $145 per month for each covered life. It is a well-known fact that West Virginia’s population is older than the national average. According to the U.S. Census Bureau, in 2000 the median age in West Virginia was 38.9 years compared to the national median of 35.3 years. Furthermore, the state’s median age is projected to become 41.4 by 2010. Given the age distribution of the population, it is likely that Medigap sales will continue to grow in our State.
Table 10. Top 10 Carriers of Medigap Individual Coverage Earned
Premium ($) Company Name
Covered Lives
$21,257,822 Mountain State BlueCross BlueShield (Highmark) 8,179 $6,416,911 Bankers Life and Casualty Company 2,541 $6,118,053 Mutual of Omaha Insurance Company 2,195 $5,049,174 United American Insurance Company 1,674 $4,485,658 United World Life Insurance Company 3,427 $4,080,100 State Farm Mutual Automobile Insurance Co. 1,834 $3,098,978 Bankers Fidelity Life Insurance Company 1,200 $2,473,205 American Network Insurance Company 885 $1,594,429 Continental General Insurance Company 692 $1,347,082 Constitution Life Insurance Company 645 $9,630,791 Others (66) 4,914
$65,552,203 Totals (76) 28,186

Table 11. Top 10 Carriers of Medigap Group Coverage Earned
Premium ($) Company Name
Covered Lives
$58,840,494 United Healthcare Insurance Company 45,974 $9,491,434 Mountain State BlueCross BlueShield (Highmark) 3,287 $1,508,975 Hartford Life and Accident Insurance Company 541 $1,289,316 Bankers Life and Casualty Company 127 $1,033,068 Life Investors Insurance Company of America 562
$657,938 Hartford Life Insurance Company 650 $411,655 Principal Life Insurance Company 165 $186,118 Monumental Life Insurance Company 95 $169,349 Sterling Life Insurance Company 124 $153,690 Union Fidelity Life Insurance Company 62 $214,194 Others (18) 175
$73,956,231 Totals (28) 51,762 Tables 10 and 11 above show the major carriers, earned premiums, and covered lives. Medigap group coverage requires more explanation than other group markets. This is because health insurance is typically employer-based, and coverage changes when retirement occurs. When Medicare eligibility begins at age 65, the take-up rate is nearly 100 percent (Rosen, p. 222). But Medicare does not cover all medical expenses so supplemental insurance may be desired. This creates a niche for Medigap policies, which are typically bought by individuals. Occasionally groups form, the most popular being the American Association of Retired Persons (AARP) group. In West Virginia, AARP individual policies are marketed through the United Healthcare Insurance Company. In 2007 this company had earned premium of $58.8 million, and insured 45,974 lives. This makes United Healthcare by far the largest seller of group Medigap policies in the state. Only a slight increase in the number of carriers in this market occurred over the prior year with two new carriers entering the group market only. Indications are that product availability is not lacking in this market as covered lives increased by 9,805 while at the same time, premium volume decreased by a little more than 2 percent.

V. Long-Term Care Insurance As society ages, the insurance products it needs change too. One indication of these changes is the growth of long-term care products. Long-term care (LTC) insurance is designed to provide protection from unanticipated expenses associated with long life. Because we cannot perfectly predict either the length of our lives or the physical condition of our later years, LTC insurance is designed to provide financial support for late-in-life nursing home care and in-home medical care. As the average age of the U.S. population has increased, these types of policies have become more popular.
Furthermore, changes in the federal tax laws have motivated people to reconsider LTC insurance. The Health Insurance Portability and Accountability Act of 1996 (HIPAA) made it clear that long-term care is not to be funded by Medicare, and suggested that households need to provide their own funding. Accordingly, many people have found that LTC insurance is a good way to pre-fund these expenses. At the same time, HIPAA did provide favorable tax treatment for LTC insurance products as discussed below. These products continue to be a growing portion of West Virginia’s healthcare insurance markets with a premium volume of $28.9 million for 2007. Long-Term Care Coverage Long Term Care insurance consists of “Tax Qualified” and “Non-Tax Qualified” products. The premiums paid to Tax Qualified plans, under Internal Revenue Service regulations, are treated as tax deductible healthcare expenses. Conversely, Non-Tax Qualified plans do not allow the deduction of LTC costs. Also, when evaluating the LTC market we will only examine individual policies. This is because LTC products are typically purchased later in life and fewer of the buyers are working. However, there is a small market of employer sponsored LTC products with approximately $3.7 million in earned premium for the Tax Qualified product and only $104 thousand for the Non-Tax Qualified product reported for 2007 in West Virginia. Tables 12 and 13 list the 2007 earned premiums and number of covered lives reported for the individual LTC products.
Table 12. Top 10 Carriers of Individual Long Term Care, Tax Qualified Earned Premium Company Name Covered Lives
$7,356,997 Genworth Life Insurance Company 4,988 $3,038,826 Bankers Life and Casualty Company 2,213 $1,621,385 Northwestern Long Term Care Insurance Company 1,066 $1,353,472 Metropolitan Life Insurance Company 590 $1,155,885 John Hancock Life Insurance Company 682
$613,224 Teachers Insurance & Annuity Association of America 302 $504,445 Unum Life Insurance Company of America 343 $457,426 New York Life Insurance Company 368 $414,990 Prudential Insurance Company of America 239 $379,349 TIAA-CREF Life Insurance Company 176
$3,605,039 Others (47) 3,497 20,501,038 Totals (55) 14,464

Table 13. Top 10 Carriers of Individual Long Term Care, Non-Tax Qualified Earned Premium Company Name Covered Lives
$1,219,207 Riversource Life Insurance Company 1,019 $665,668 Conseco Senior Health Insurance Company 440 $516,187 American Network Insurance Company 270 $463,761 Bankers Life and Casualty Company 498 $374,682 Mutual of Omaha Insurance Company 281 $312,044 MetLife Insurance Company of Connecticut 160 $223,959 Allianz Life Insurance Company of North America 212 $180,898 American Family Life Assurance Company 160 $152,536 John Hancock Life Insurance Company 682 $137,788 Continental General Insurance Company 93 $383,864 Others (20) 330
4,630,594 Totals (29) 4,145 The data suggest two major themes. First, the majority of policies in the marketplace are Tax Qualified. Second, only two companies are in the top 10 for both of these products, suggesting that product specialization is occurring and that carriers generally do not move as easily between the product lines. Compared to last year, the total number of LTC product carriers remained exactly the same for both the Tax Qualified and Non-Tax Qualified products. However, the number of covered lives increased by more than 21% for the Non-Tax qualified products and the average cost for that product also declined over 2006 amounts.
Table 14. LTC Covered Lives and Premium Tax Qualified 2006 2007 Covered Lives 13,754 14,464 Premium $17,985,575.00 $20,501,038.00 Average Cost $1,307.66 $1,417.38 Non-Tax Qualified 2006 2007 Covered Lives 3,421 4,145 Premium $4,876,948.00 $4,630,594.00 Average Cost $1,425.59 $1,117.15

VI. Other Health Insurance Products The products discussed thus far are the most popular health care insurance coverages in West Virginia. However due to the large number of health exposures, other insurance coverages are available, many of which cover specific medical conditions. Although an analysis of these products goes beyond the scope of this report, several are listed below to demonstrate the many insurance options available. • Accident only insurance • Association/Trust group insurance • Dental insurance • Group long-term care insurance • Limited benefit insurance • Named diseases (e.g., cancer) insurance • Student health insurance

Figure 3. Active A&H Insurance Carriers for selected lines
0
10
20
30
40
50
60
70
80
Large GroupMajor
Medical
Small GroupMajor
Medical
IndividualMajor
Medical
Short TermGroup
Disability
Long TermGroup
Disability
IndividualMedicare
Supplement
2005
2006
2007
VII. Summation Like all active businesses, the insurance industry is constantly in flux. Change occurs as a result of economic conditions, health conditions, aging, economic activity, technology, the regulatory and tax environment, and much more. This report has summarized the product mix, revenues, policy counts, and key carriers in West Virginia’s accident and health insurance market. The industry offers a wide array of products and is enjoying relatively stable market conditions. Although most lines of business are heavily concentrated when measured by sales, there are dozens of carriers in each line of business and active entry and exit exist. This entry and exit gives us some idea of which lines are profitable and thus are likely to induce changes in the number of carriers. This is the normal ebb and flow of a dynamic industry (see Appendix). Finally, we note that the product mix in the accident and health lines is constantly changing. Recently, there has been a surge in products for the elderly. This follows from the aging of the U.S. population and the older-than-national-average population of West Virginia in particular. We expect that these trends may continue for many years to come.

VIII. References "HHI" means the Herfindahl-Hirschman Index, a commonly accepted measure of market concentration. It is calculated by squaring the market share of each firm competing in the market and then summing the resulting numbers. For example, for a market consisting of four firms with shares of thirty, thirty, twenty and twenty percent, the HHI is 2600 (302 + 302 + 202 + 202 = 2600). The HHI takes into account the relative size and distribution of the firms in a market and approaches zero when a market consists of a large number of firms of relatively equal size. The HHI increases both as the number of firms in the market decreases and as the disparity in size between those firms increases. Markets in which the HHI is between 1000 and 1800 points are considered to be moderately concentrated and those in which the HHI is in excess of 1800 points are considered to be concentrated. Transactions that increase the HHI by more than 100 points in concentrated markets presumptively raise antitrust concerns under the Horizontal Merger Guidelines issued by the U.S. Department of Justice and the Federal Trade Commission. See Merger Guidelines § 1.51. Rosen, Harvey S., Public Finance, 7th Edition McGraww-Hill Irwin, Boston, 2004. U.S. Department of Labor; Bureau of Labor Statistics, http://www.bls.gov/lau U.S. Census Bureau, The 2008 Statistical Abstract, http://www.census.gov/compendia/statab/cats/health_nutrition/health_expenditures.html United States Department of Health and Human Services;
Office for Civil Rights—HIPPA; http://www.hhs.gov/ocr/hipaa/ Centers for Medicare and Medicaid Services; http://www.cms.hhs.gov/
Medicare; http://www.cms.hhs.gov/home/medicare.asp Medicaid; http://www.cms.hhs.gov/home/medicaid.asp SCHIP; http://www.cms.hhs.gov/home/schip.asp
West Virginia Bureau of Employment Programs, 2007 Employment Data: http://www.wvbep.org/bep/lmi/TABLE2/T207west.HTM Comments and questions about items contained in this report should be directed to: Aaron Baughman Insurance Market Analyst West Virginia Offices of the Insurance Commissioner Research/Executive Division P.O. Box 50540 Charleston, WV 25305 [email protected]

VIII. Appendix -A Copy of the 2008 Survey with instructions provided to admitted A&H Carriers in West Virginia requesting 2007 data.
2007 SURVEY ACCIDENT & HEALTH LINES OF BUSINESS IN WEST VIRGINI A FOR YEAR ENDING DECEMBER 31, 2007 Company Name: NAIC #: Name of Person Completing Form: Telephone: Email of Person Completing Form: Date Completed:
I. INDIVIDUAL BUSINESS A. B. C. D. E. F.
LINE OF BUSINESS NUMBER
OF POLICIES
NUMBER OF
LIVES
MEMBER MONTHS
DIRECT PREMIUM EARNED/PREMIUM EQUIVALENTS FOR
SELF INSURED BUSINESS
DIRECT CLAIMS INCURRED/CLAIM
PAYMENTS FOR SELF INSURED
BUSINESS
1a. Comprehensive Major Medical (excludes "High Deductible Health Plan")
1b. “High Deductible Health Plan” TOTAL OF 1a. AND 1b. ABOVE 0 0 0 $0 $0
2. Other Medical (Non-Comprehensive)
3. Specified/Named Disease 4. Limited Benefit 5. Student Policies 6. Accident Only or AD&D 7. Disability (Short Term) 8. Disability (Long Term) 9. Long Term Care (Tax Qualified)
10. Long Term Care (Non-Tax Qualified)
11. Medicare Supplement (Medigap) Standardized Plans
12. Medicare Supplement (Medigap) Pre-Standardized Plans
13. Dental 14. Medicare Part C Preferred Provider Organizations (PPOs) Provider Sponsored Organizations (PSOs) Private fee-for-service (PFFS) Medical Savings Accounts (MSAs) Special Needs Plans (SNPs) 15. Medicare Part D 16. Other* TOTAL INDIVIDUAL BUSINESS 0 0 0 $0 $0
*Please describe Other Individual Accident & Health on the line below:

II. GROUP BUSINESS A. B. C. D. E. F.
LINE OF BUSINESS NUMBER
OF P0LICIES
NUMBER OF
LIVES
MEMBER MONTHS
DIRECT PREMIUM EARNED/PREMIUM
EQUIVALENTS FOR SELF INSURED BUSINESS
DIRECT CLAIMES INCURRED/CLAIM
PAYMENTS FOR SELF INSURED
BUSINESS
1. Comprehensive Major Medical: a. Small Employer (50 and Under) Total including "HDHP" “HDHP” Only b. Large Group (51 and More) Total including “HDHP” “HDHP” Only c. Non-Exempt Associations Total including “HDHP” “HDHP” Only d. Exempt Associations Total including “HDHP” “HDHP” Only e. Trusts Total including “HDHP”
“HDHP” Only f. Discretionary Groups Total including “HDHP” “HDHP” Only g. Federal Employees Health Plan
2. Other Medical (Non-Comprehensive)
3. Specified/Named Disease 4. Limited Benefit 5. Student Policies 6. Accident Only or AD&D 7. Disability (Short Term) 8. Disability (Long Term) 9. Long Term Care (Tax Qualified)
10. Long Term Care (Non-Tax Qualified)
11. Medicare Supplement (Medigap) Standardized Plans
12. Medicare Supplement (Medigap) Pre-Standardized Plans
13. Dental 14. Other* 15. TPA and ASO 16. Stop Loss/Excess Loss TOTAL GROUP BUSINESS 0 0 0 $0 $0
*Please describe Other Group Accident & Health on line below on the line below:

III. MARKET ACTIVITY – Sections I and II, Subsection 1 (only) – COMPREHENSIVE Major Medical Lines of Business in West Virginia
Are you currently writing NEW business? NEW BUSINESS 2007 DIRECT PREMIUMS EARNED
Are you currently renewing existing
business? COMPREHENSIVE COMPREHENSIVE As of December 31, 2007 Large Group Yes No $ Yes No Small Group Yes No $ Yes No Individual Yes No $ Yes No
Report Current
Activity by line
Responses should
be
Of the above NEW Business:
Number of NEW POLICIES Issued
during 2007
Number of Lives covered under NEW POLICIES issued during 2007
(A, B, C, D or E) Only**
Large Group Small Group Individual ** A. The Company does not have the product line B. The Company is actively marketing the product line C. The Company is renewing coverage in this product line, but not issuing new business D. The Company is withdrawing from this product line E. Other (describe) ______________________________________________________________________

INSTRUCTIONS FOR COMPLETING 2007 SURVEY ACCIDENT & HEALTH LINES OF BUSINESS IN WEST VIRGINI A For the Year Ending December 31, 2007 NO SUBSTITUTE FORMS WILL BE ACCEPTED This information is being collected for statistical research purposes by the Market and Research Division.
*************************************************** ********************************************************
Submit the reporting form even if there has been no activity.
Report all amounts in whole dollars.
Please do not complete areas that have been shaded.
*************************************************** ********************************************************
Definitions for Column Headings: Column A – Lists the type of health insurance business on which to report.
Column B – Number of policies in force as of December 31, 2007. This is the number of policies in force that covers any West Virginians, not the number of lives.
Column C – Total number of West Virginian lives as of December 31, 2007. This number is the total of the policy holders/certificate holders and all covered dependents, including spouses.
Column D – Member months are the total number of lives as calculated on a pre-specified day of each month. The date is an arbritrary date set by the company. Total member months are the cumulative total of member months for the calendar year 2007.
Column E – Direct Premium Earned – This amount is the total of premium collected and attributable to 2007. Include any premiums paid in 2007 for 2007, but do not include premiums paid in 2007 for the year 2008.
Column F – Direct Claims Incurred – This amount is the total of claims incurred during 2007, whether paid in 2007 or later.
Definitions for Selected Row Headings: Under I. INDIVIDUAL BUSINESS
Line 1a. Comprehensive/Major-Medical includes but is not limited to health insurance plan types such as indemnity, HMO, PPO and POS offering comprehensive major medical health insurance coverage. This category excludes other types of non-comprehensive hospital-surgical-medical coverage such as hospital expense coverage and hospital confinement indemnity coverage. (See Line 2 for Other Medical/Non-Comprehensive).
Line 1b. “High Deductible Health Plan” (HDHP) as defined in the Medicare Modernization and Prescription Drug Act of 2003.
***Note: Under II. Group Business for Comprehensive Major Medical, each line of business contains two reporting items.
The first row includes both “High Deductible Health Plans” (HDHP) and Non-“HDHP” business combined. The second row includes the “HDHP” portion of the business.

Line 1c. Non-Exempt Associations are subject to the statewide community rate. The total number of policies includes the number of associations not the number of groups within the association. The total number of lives includes all the members/employees and all their dependents of all the groups that belong to every association. Line 1d. Exempt Associations applied and received exemption from the statewide community rate. Exempt associations are community rated within the association. The total number of polices includes the number of associations not the number of groups within the association. The total number of lives includes all the members/employees and all their dependents of all the groups that belong to every association. Line 1e. Trusts: This line pertains to the total number of policies issued to a trust, or to one or more trustees of a fund established or adopted by two or more employers or one or more labor unions or similar employee organizations. The total number of policies includes the number of trusts not the number of groups within the trust. The total number of lives includes all the members/employees and all their dependents of all the groups that belong to every trust. Line 1f. Discretionary Groups: This line pertains to the total number of groups that do not meet the statutory requirements of associations or trusts, and have received approval by the Department of Banking, Insurance, Securities and Health Care Administration as a discretionary group. The total number of policies includes the number of discretionary groups not the number of groups within the category. The total number of lives includes all the members/employees and all their dependents of all the groups that belong to every discretionary group. Line 2. Other Medical (non-comprehensive) includes policies such as hospital only, hospital and surgical policies (including scheduled type policies), etc. Expense reimbursement and indemnity models plans should be included. This category does not include Medicare Supplemental policies. Line 3. Specified or Named Disease includes cancer policies and any other policy that pays benefits only upon the confirmed diagnosis of a listed illness. Line 4. Limited Benefit includes vision, prescription drug, athletic policies (professional, amateur, or student policies providing coverage while participating in or while traveling to or from an athletic activity), and/or any other single service plan or program. Line 5. Student Policies are policies that cover students while they are enrolled and attending school or college. These are individual policies or they can be policies sponsored by the school or college. Line 11. Medicare Supplement (MEDIGAP) Standardized Plans are any of the plans that describe benefits specified by law and that have been available since July 1, 1992. Line 12. Medicare Supplement (MEDIGAP) Pre-Standardized Plans are any Medicare Supplement plans issued before July 1, 1992. Line 14. Other plans not fitting in the categories listed must be identified. Line 15. Third Party Administrator (TPA) and Administrative Services Only (ASO) includes business where a TPA/ASO assumes no risk, but provides administrative services for a self-insured or self-funded group providing employees/members with comprehensive/major medical coverage. Line 16. Stop Loss/Excess Loss includes coverage issued or provided through minimum premium plans or other self-funded health benefits plans for comprehensive major medical coverage only.

Appendix -B 2007 Survey Responses (315 Companies)
A & H Lines of Business in WV (Year ending December 31, 2007)
Individual Business
Line of Business Number
of Policies
Number of Lives
Member Months
Direct Earned Premium/(Premium Equivalents for Self-
Insured Business)
Direct Claims Incurred/ (Claim
Payments for Self-Insured
Business) Comprehensive Major Medical (excl "High Deductible Health Plan") 10,165 14,501 164,018 $45,971,581 $30,072,848 “High Deductible Health Plan” only 460 894 10,412 $1,929,129 $1,292,567 Total Comp. Major Medical 10,625 15,395 174,430 $47,900,710 $31,365,415 Other Medical (Non-Comprehensive) 60,592 78,587 900,112 $65,549,322 $60,259,521 Specified/Named Disease 80,478 118,118 1,278,137 $23,598,418 $10,334,068 Limited Benefit 1,977 2,924 23,522 $758,083 $871,230 Student Policies 878 955 11,579 $243,328 $168,982 Accident Only or AD&D 140,240 133,047 1,352,791 $16,282,915 $5,168,975 Disability (Short Term) 26,619 26,838 221,060 $11,691,106 $7,542,095 Disability (Long Term) 12,901 12,590 149,308 $10,831,756 $9,299,693 Total Disability 39,520 39,428 370,368 $22,522,862 $16,841,788 Long Term Care (Tax Qualified) 13,348 14,464 109,059 $20,501,038 $10,477,409 Long Term Care (Non-Tax Qualified) 3,289 4,145 43,188 $4,630,594 $3,432,444 Total Long Term Care 16,637 18,609 152,247 $25,131,632 $13,909,853 Medicare Supplement (Medigap) Standardized Plans 25,175 25,243 297,079 $57,405,674 $38,153,237 Medicare Supplement (Medigap) Pre-Standardized Plans 2,897 2,943 36,373 $8,146,529 $5,795,353 Total Medicare Supplement 28,072 28,186 333,452 $65,552,203 $43,948,590 Dental 2,648 4,762 53,346 $1,298,857 $259,211 Medicare Part C
Preferred Provider Organizations (PPOs) 4,798 4,798 52,469 $40,627,037 $30,884,935
Provider Sponsored Organizations (PSOs) 0 0 0 $0 $0
Private fee-for-service (PFFS) 13,138 15,276 169,472 $108,005,860 $88,230,672 Medical Savings Accounts (MSAs) 0 0 0 $0 $0
Special Needs Plans (SNPs) 0 0 0 $0 $0 Medicare Part D 78,410 90,921 1,109,922 $107,840,297 $89,064,405 Total Medicare C & D 96,346 110,995 1,331,863 $256,473,194 $208,180,012 Other* 85,638 85,987 1,018,537 $190,276,285 $175,047,050 Total Individual Business 563,651 636,993 7,000,384 $715,587,809 $566,354,695

2007 Survey Responses (315 Companies) A & H Lines of Business in WV (Year ending December 31, 2007)
Group Business
Line of Business Number
of Policies Number of
Lives Member Months
Direct Earned Premium/(Premium Equivalents for Self-
Insured Business)
Direct Claims Incurred/ (Claim
Payments for Self-Insured Business)
Comprehensive Major Medical: Small Employer (50 and Under)
Total including "HDHP" 36,320 77,041 930,327 $296,956,875 $224,312,193 “HDHP” Only 715 2,547 520,329 $8,363,682 $6,083,660
Large Group (51 and More) Total including “HDHP” 49,809 107,226 1,274,006 $401,233,745 $361,151,511
“HDHP” Only 45 470 6,469 $1,174,354 $1,386,150 Non-Exempt Associations Total including “HDHP” 111 1,647 24,321 $4,960,249 $4,433,833
“HDHP” Only 328 660 13,008 $3,527,068 $3,919,122 Exempt Associations
Total including “HDHP” 911 13,427 163,644 $33,479,929 $24,575,954 “HDHP” Only 988 3,167 33,075 $7,159,799 $4,259,796
Trusts Total including “HDHP” 27 46 1,090 $114,680 $13,974
“HDHP” Only 0 0 0 $0 $0 Discretionary Groups
Total including “HDHP” 220 384 4,274 $1,047,360 $231,512 “HDHP” Only 17 40 264 $39,938 $20,727
Total CMM incl "HDHP" 87,398 199,771 2,397,662 $737,792,838 $614,718,977 Total CMM "HDHP" Only 2,093 6,884 573,145 $20,264,841 $15,669,455
Federal Employees Health Plan 26,003 62,319 740,477 $218,845,709 $204,905,887 Other Medical (Non-Comprehensive) 3,567 5,618 56,593 $9,010,517 $4,425,548 Specified/Named Disease 20,329 44,245 516,465 $8,137,464 $9,476,904 Limited Benefit 3,066 85,299 917,372 $5,201,080 $3,451,182 Student Policies 24 4,669 31,247 $1,000,719 $648,833 Accident Only or AD&D 18,613 703,446 7,645,452 $16,357,953 $9,828,068 Disability (Short Term) 3,687 45,054 370,621 $11,072,746 $8,857,107 Disability (Long Term) 1,366 218,037 2,038,212 $41,542,145 $42,966,855 Total Disability 5,053 263,091 2,408,833 $52,614,891 $51,823,962 Long Term Care (Tax Qualified) 400 10,330 52,210 $3,658,271 $1,710,951 Long Term Care (Non-Tax Qualified) 44 93 1,026 $103,595 $129,031 Total Long Term Care 444 10,423 53,236 $3,761,866 $1,839,982 Medicare Supplement (Medigap) Standardized Plans 4,388 37,473 450,447 $54,595,501 $42,238,139 Medicare Supplement (Medigap) Pre-Standardized Plans 198 14,289 171,474 $19,360,730 $14,882,322 Total Medicare Supplement 4,586 51,762 621,921 $73,956,231 $57,120,461 Dental 7,001 300,603 3,496,973 $39,899,654 $28,335,443 Other* 54,740 92,061 973,861 $64,013,848 $47,184,447 TPA and ASO 2,299 189,233 2,263,323 $161,330,427 $469,493,615 Stop Loss/Excess Loss 5,809 105,247 1,219,934 $55,583,530 $39,596,459 Total Group Business 238,932 2,117,787 23,343,349 $1,447,506,726 $1,542,849,768

2007 Survey Responses (315 Companies) A & H Lines of Business in WV (Year ending December 31, 2007)
Combined Individual and
Group
Line of Business Number
of Policies
Number of Lives
Member Months
Direct Earned Premium/(Premium
Equivalents for Self-Insured
Business)
Direct Claims Incurred/ (Claim
Payments for Self-Insured
Business) Total Comp Major Medical 98,023 215,166 2,572,092 $785,693,548 $646,084,392 Total Other Medical (Non-Comp.) 64,159 84,205 956,705 $74,559,839 $64,685,069 Total Specified/Named Disease 100,807 162,363 1,794,602 $31,735,882 $19,810,972 Total Limited Benefit 5,043 88,223 940,894 $5,959,163 $4,322,412 Total Student Policies 902 5,624 42,826 $1,244,047 $817,815 Total Accident Only or AD&D
158,853 836,493 8,998,243 $32,640,868 $14,997,043 Total Short Term Disability 30,306 71,892 591,681 $22,763,852 $16,399,202 Total Long Term Disability 14,267 230,627 2,187,520 $52,373,901 $52,266,548 Total Disability 44,573 302,519 2,779,201 $75,137,753 $68,665,750 Total Tax Qualified LTC 13,748 24,794 161,269 $24,159,309 $12,188,360 Total Non-Tax Qualified LTC 3,333 4,238 44,214 $4,734,189 $3,561,475 Total Long Term Care 17,081 29,032 205,483 $28,893,498 $15,749,835 Total Standardized Med. Supp
29,563 62,716 747,526 $112,001,175 $80,391,376 Total Pre-Standardized Med Supp
3,095 17,232 207,847 $27,507,259 $20,677,675 Total Medicare Supplement 32,658 79,948 955,373 $139,508,434 $101,069,051 Total Dental 9,649 305,365 3,550,319 $41,198,511 $28,594,654
Totals of all Sub-Lines 802,583 2,754,780 30,343,733 $2,163,094,535 $2,109,204,463

Individual Comp. Major Med. (Excl HDHP) Policies Lives Member Months Premium Earned Claims Incurred Loss Ratio Market Share HHIHighmark West Virginia, Inc. 6,039 8,830 110,608 $36,333,657 $24,464,154 67.33% 79.04% 6246.54Time Ins. Co. 1,552 2,405 25,658 $4,535,514 $1,660,318 36.61% 9.87% 97.34John Alden Life Ins. Co. 710 1,159 12,133 $2,089,238 $721,594 34.54% 4.54% 20.65The Health Plan of the Upper Ohio Valley 179 264 3,357 $945,894 $1,080,933 114.28% 2.06% 4.23Continental General Ins. Co. 60 86 1,249 $658,975 $171,998 26.10% 1.43% 2.05Aetna Life Ins. Co. 125 125 1,939 $330,659 $671,238 203.00% 0.72% 0.52American Republic Ins. Co. 33 43 0 $247,126 $231,382 93.63% 0.54% 0.29Metropolitan Life Ins. Co. 148 148 1,776 $162,771 $253,302 155.62% 0.35% 0.13American National Ins. Co. 18 30 392 $117,562 $121,963 103.74% 0.26% 0.07Prudential Ins. Co. of America 344 397 4,764 $107,794 $93,195 86.46% 0.23% 0.05AXA Equitable Life Ins. Co. 6 29 468 $101,482 $71,138 70.10% 0.22% 0.05Physicians Mutual Ins. Co. 14 15 180 $79,634 $50,786 63.77% 0.17% 0.03Golden Rule Ins. Co. 7 9 98 $64,797 $374,777 578.39% 0.14% 0.02World Ins. Co. 13 26 383 $55,491 $16,038 28.90% 0.12% 0.01Guardian Life Ins. Co. 11 20 276 $54,635 $90,873 166.33% 0.12% 0.01American National Life Ins. Co. of Texas 3 4 64 $21,146 $6,344 30.00% 0.05% 0.00Kanawha Ins. Co. 4 4 48 $15,812 $4,231 26.76% 0.03% 0.00Universal Guaranty Life Ins. Co. 870 870 0 $12,553 $16,151 128.66% 0.03% 0.00Mutual of Omaha Ins. Co. 6 6 72 $8,856 ($35,695) -403.06% 0.02% 0.00Farm Family Life Ins. Co. 6 11 135 $7,156 $6,762 94.49% 0.02% 0.00Unicare Life & Health Ins. Co. 1 1 49 $6,617 $403 6.09% 0.01% 0.00United Teacher Associates Ins. Co. 0 0 0 $2,582 $0 0.00% 0.01% 0.00American General Life and Accident Ins. Co. 1 1 12 $2,262 $0 0.00% 0.00% 0.00Central Reserve Life Ins. Co. 0 0 23 $1,741 ($337) -19.36% 0.00% 0.00Bankers Life and Casualty Co. 1 1 16 $1,569 $0 0.00% 0.00% 0.00New England Life Ins. Co. 1 3 36 $1,320 ($73) -5.53% 0.00% 0.00Guarantee Trust Life Ins. Co. 2 2 24 $1,231 $0 0.00% 0.00% 0.00World Corp Ins. Co. 0 0 96 $985 $0 0.00% 0.00% 0.00Washington National Ins. Co. 1 1 12 $851 $356 41.83% 0.00% 0.00National Benefit Life Ins. Co. 2 3 36 $763 $0 0.00% 0.00% 0.00Union Bankers Ins. Co. 1 1 12 $462 $0 0.00% 0.00% 0.00U.S. Life Ins. Co. In the City of NY 2 2 72 $343 $2,381 694.17% 0.00% 0.00Unified Life Ins. Co. 4 4 12 $172 $0 0.00% 0.00% 0.00Commonwealth Annuity & Life Ins. Co. 1 1 12 $43 $0 0.00% 0.00% 0.00Principal Life Ins. Co. 0 0 0 $0 $64 ----- 0.00% 0.00American Community Mutual Ins. 0 0 0 $0 ($20) ----- 0.00% 0.00Kansas City Life Ins. Co. 0 0 6 ($112) ($1,408) 1257.14% 0.00% 0.00TOTALS 10,165 14,501 164,018 $45,971,581.00 $30,072,848.00 65.42% 100.00% 6372.00
Individual Comp. Major Medical (HDHP Only) Policies Lives Member Months Premium Earned Claims Incurred Loss Ratio Market Share HHITime Ins. Co. 241 482 6,115 $1,128,594 $836,795 74.14% 58.50% 3,422.57 John Alden Life Ins. Co. 158 321 3,894 $690,569 $432,534 62.63% 35.80% 1,281.42 Highmark West Virginia, Inc. 50 80 374 $103,596 $23,202 22.40% 5.37% 28.84 Guarantee Trust Life Ins. Co. 11 11 27 $5,560 $36 0.65% 0.29% 0.08 World Ins. Co. 0 0 2 $810 $0 0.00% 0.04% 0.00 TOTALS 460 894 10,412 $1,929,129 $1,292,567 67.00% 100.00% 4,732.92
Individual Comp. Major Medical (All) Total Policies Total Lives Total Member Months Total Premium Earned Total Claims Incurred Loss Ratio Market Share HHIHighmark West Virginia, Inc. 6,089 8,910 110,982 $36,437,253 $24,487,356 67.20% 76.07% 5,786.11Time Ins. Co. 1,793 2,887 31,773 $5,664,108 $2,497,113 44.09% 11.82% 139.82John Alden Life Ins. Co. 868 1,480 16,027 $2,779,807 $1,154,128 41.52% 5.80% 33.68The Health Plan of the Upper Ohio Valley 179 264 3,357 $945,894 $1,080,933 114.28% 1.97% 3.90Continental General Ins. Co. 60 86 1,249 $658,975 $171,998 26.10% 1.38% 1.89Aetna Life Ins. Co. 125 125 1,939 $330,659 $671,238 203.00% 0.69% 0.48American Republic Ins. Co. 33 43 0 $247,126 $231,382 93.63% 0.52% 0.27Metropolitan Life Ins. Co. 148 148 1,776 $162,771 $253,302 155.62% 0.34% 0.12American National Ins. Co. 18 30 392 $117,562 $121,963 103.74% 0.25% 0.06Prudential Ins. Co. of America 344 397 4,764 $107,794 $93,195 86.46% 0.23% 0.05AXA Equitable Life Ins. Co. 16 29 468 $101,482 $71,138 70.10% 0.21% 0.04Physicians Mutual Ins. Co. 14 15 180 $79,634 $50,786 63.77% 0.17% 0.03Golden Rule Ins. Co. 7 9 98 $64,797 $374,777 578.39% 0.14% 0.02World Ins. Co. 13 26 385 $56,301 $16,038 28.49% 0.12% 0.01Guardian Life Ins. Co. 11 20 276 $54,635 $90,873 166.33% 0.11% 0.01American National Life Ins. Co. of Texas 3 4 64 $21,146 $6,344 30.00% 0.04% 0.00Kanawha Ins. Co. 4 4 48 $15,812 $4,231 26.76% 0.03% 0.00Universal Guaranty Life Ins. Co. 870 870 0 $12,553 $16,151 128.66% 0.03% 0.00Mutual of Omaha Ins. Co. 6 6 72 $8,856 ($35,695) -403.06% 0.02% 0.00Farm Family Life Ins. Co. 6 11 135 $7,156 $6,762 94.49% 0.01% 0.00Guarantee Trust Life Ins. Co. 13 13 51 $6,791 $36 0.53% 0.01% 0.00Unicare Life & Health Ins. Co. 1 1 49 $6,617 $403 6.09% 0.01% 0.00United Teacher Associates Ins. Co. 0 0 0 $2,582 $0 0.00% 0.01% 0.00American General Life and Accident Ins. Co. 1 1 12 $2,262 $0 0.00% 0.00% 0.00Central Reserve Life Ins. Co. 0 0 23 $1,741 ($337) -19.36% 0.00% 0.00Bankers Life and Casualty Co. 1 1 16 $1,569 $0 0.00% 0.00% 0.00New England Life Ins. Co. 1 3 36 $1,320 ($73) -5.53% 0.00% 0.00United American Ins. Co. 0 0 0 $1,128 $1,762 156.21% 0.00% 0.00World Corp Ins. Co. 0 0 96 $985 $0 0.00% 0.00% 0.00Washington National Ins. Co. 1 1 12 $851 $356 41.83% 0.00% 0.00National Benefit Life Ins. Co. 2 3 36 $763 $0 0.00% 0.00% 0.00Union Bankers Ins. Co. 1 1 12 $462 $0 0.00% 0.00% 0.00U.S. Life Ins. Co. In the City of NY 2 2 72 $343 $2,381 694.17% 0.00% 0.00Unified Life Ins. Co. 4 4 12 $172 $0 0.00% 0.00% 0.00Commonwealth Annuity & Life Ins. Co. 1 1 12 $43 $0 0.00% 0.00% 0.00Allmerica Financial Benefit Ins. Co. 0 0 6 $0 $0 ---- 0.00% 0.00American Community Mutual Ins. 0 0 0 $0 ($20) ---- 0.00% 0.00Principal Life Ins. Co. 0 0 0 $0 $64 ---- 0.00% 0.00Kansas City Life Ins. Co. 0 0 6 ($112) ($1,408) 1257.14% 0.00% 0.00TOTALS 10,635 15,395 174,436 $47,901,838 $31,367,177 65.48% 100.00% 5,966.49
Appendix C

Individual Other Medical (Non-Comp.) Policies Lives Member Months Premium Earned Claims Incurred Loss Ratio Market Share HHIThe Health Plan of the Upper Ohio Valley 31,664 31,664 388,602 $56,028,733 $55,733,936 99.47% 85.48% 7,306.09United American Ins. Co. 1,128 1,762 13,523 $2,707,051 $1,598,986 59.07% 4.13% 17.06American Family Life Assurance Co. 14,938 30,694 337,180 $2,673,333 $1,101,399 41.20% 4.08% 16.63State Farm Mutual Automobile Ins. Co. 5,816 6,757 81,436 $1,985,627 $768,302 38.69% 3.03% 9.18Bankers Life and Casualty Co. 1,929 2,015 23,258 $1,136,093 $831,648 73.20% 1.73% 3.00Combined Ins. Co. of America 1,056 1,191 13,029 $283,238 ($130,204) -45.97% 0.43% 0.19Monumental Life Ins. Co. 102 102 1,296 $107,365 $26,527 24.71% 0.16% 0.03Mutual of Omaha Ins. Co. 334 396 4,752 $89,668 $53,212 59.34% 0.14% 0.02Colonial Life & Accident Ins. Co. 269 269 0 $85,527 $43,716 51.11% 0.13% 0.02United National Life Ins. Co. of America 157 157 2,045 $68,817 $56,466 82.05% 0.10% 0.01American General Life and Accident Ins. Co. 943 943 11,754 $59,985 $20,750 34.59% 0.09% 0.01Aetna Life Ins. Co. 86 86 1,295 $42,282 $56,854 134.46% 0.06% 0.00Central United Life Ins. Co. 6 7 12 $30,507 $11,207 36.74% 0.05% 0.00Assurity Life Ins. Co. 10 10 204 $25,390 $3,321 13.08% 0.04% 0.00American Income Life Ins. Co. 77 84 1,254 $25,177 $14,105 56.02% 0.04% 0.00Washington National Ins. Co. 112 128 1,746 $23,900 $9,998 41.83% 0.04% 0.00Globe Life and Accident Ins. Co. 13 14 162 $21,029 $3,170 15.07% 0.03% 0.00United Ins. Co. of America 168 336 4,428 $16,790 $16,322 97.21% 0.03% 0.00Pennsylvania Life Ins. Co. 60 60 756 $15,153 $3,140 20.72% 0.02% 0.00Guarantee Trust Life Ins. Co. 53 53 510 $14,607 $16,362 112.01% 0.02% 0.00Continental General Ins. Co. 14 18 172 $13,333 $0 0.00% 0.02% 0.00Conseco Senior Health Ins. Co. 29 30 396 $10,187 $3,685 36.17% 0.02% 0.00New York Life Ins. Co. 37 41 492 $9,149 $2,566 28.05% 0.01% 0.00Professional Ins. Co. 3 3 36 $6,293 $0 0.00% 0.01% 0.00MetLife Ins. Co. of Connecticut 18 22 264 $4,764 $154 3.23% 0.01% 0.00Unified Life Ins. Co. 116 116 348 $4,666 $940 20.15% 0.01% 0.00Union Fidelity Life Ins. Co. 33 60 720 $4,543 $0 0.00% 0.01% 0.00Kanawha Ins. Co. 33 39 166 $4,008 $386 9.63% 0.01% 0.00Guardian Life Ins. Co. 3 3 31 $3,831 $1,144 29.86% 0.01% 0.00Prudential Ins. Co. of America 54 57 684 $3,683 $1,981 53.79% 0.01% 0.00Reassure America Life Ins. Co. 42 42 504 $3,674 $1,856 50.52% 0.01% 0.00Mega Life and Health Ins. Co. 2 3 76 $3,368 $65 1.93% 0.01% 0.00United Teacher Associates Ins. Co. 26 29 348 $3,070 $121 3.94% 0.00% 0.00Medico Ins. Co. 11 11 132 $3,020 $5,100 168.87% 0.00% 0.00Citizens Security Ins. Co. 28 36 432 $2,913 $778 26.71% 0.00% 0.00American National Ins. Co. 6 6 72 $2,759 $11 0.40% 0.00% 0.00Bankers Fidelity Life Ins. Co. 4 4 48 $2,464 $15,750 639.20% 0.00% 0.00Liberty Life Ins. Co. 199 251 3,144 $2,404 $120 4.99% 0.00% 0.00Golden Rule Ins. Co. 10 11 133 $2,353 $3,204 136.17% 0.00% 0.00Ord of Utd Comm'l Trav. of Amer.-Frtnl 13 16 192 $2,193 $0 0.00% 0.00% 0.00Mony Life Ins. Co. 9 13 156 $2,176 $0 0.00% 0.00% 0.00Loyal American Life Ins. Co. 33 79 1,026 $2,124 $0 0.00% 0.00% 0.00Conseco Ins. Co. 35 40 348 $2,108 $584 27.70% 0.00% 0.00Liberty National Life Ins. Co. 9 14 1,512 $1,383 $211 15.26% 0.00% 0.00Time Ins. Co. 10 11 148 $1,198 $14 1.17% 0.00% 0.00Standard Life & Accident Ins. Co. 15 16 147 $1,045 $0 0.00% 0.00% 0.00Farm Family Life Ins. Co. 10 16 192 $885 $1,451 163.95% 0.00% 0.00National Guardian Life Ins. Co. 5 5 60 $876 $0 0.00% 0.00% 0.00Cincinnati Life Ins. Co. 37 37 444 $849 $137 16.14% 0.00% 0.00Unum Life Ins. Co. of America 0 0 0 $830 $0 0.00% 0.00% 0.00Provident Life and Accident Ins. Co. 11 11 0 $790 $0 0.00% 0.00% 0.00Physicians Mutual Ins. Co. 1 1 12 $605 $259 42.81% 0.00% 0.00Nationwide Life Ins. Co. of America 3 4 48 $589 $40 6.79% 0.00% 0.00Protective Life Ins. Co. 5 5 60 $518 $0 0.00% 0.00% 0.00Paul Revere Life Ins. Co. 9 9 0 $474 $700 147.68% 0.00% 0.00Central Reserve Life Ins. Co. 0 0 8 $416 ($103) -24.76% 0.00% 0.00National States Ins. Co. 1 1 12 $366 $0 0.00% 0.00% 0.00Jackson National Life Ins. Co. 2 2 24 $281 $10 3.56% 0.00% 0.00Old American Ins. Co. 4 4 60 $197 $118 59.90% 0.00% 0.00Life Investors Ins. Co. of America 1 1 12 $176 $0 0.00% 0.00% 0.00New England Life Ins. Co. 2 2 31 $154 ($35) -22.73% 0.00% 0.00Kansas City Life Ins. Co. 1 1 12 $139 $3 2.16% 0.00% 0.00Unity Mutual Life Ins. Co. 1 1 12 $120 $0 0.00% 0.00% 0.00Banner Life Ins. Co. 2 3 36 $113 $0 0.00% 0.00% 0.00Lincoln National Life Ins. Co. 1 1 12 $111 $155 139.64% 0.00% 0.00Jefferson National Life Ins. Co. 1 1 12 $53 $13 24.53% 0.00% 0.00Great American Life Ins. Co. 1 1 12 $42 $0 0.00% 0.00% 0.00Federal Life Ins. Co. (Mutual) 1 1 12 $36 $0 0.00% 0.00% 0.00American Int'l Life Assur. Co. of NY 1 1 12 $25 $0 0.00% 0.00% 0.00EMC National Life Co. 1 1 12 $5 $0 0.00% 0.00% 0.00Western & Southern Life Ins. Co. 775 775 $0 $0 ---- 0.00% 0.00National Casualty Co. 3 4 48 ($2,309) ($21,114) 914.42% 0.00% 0.00TOTALS 60,592 78,587 900,112 $65,549,322 $60,259,521 91.93% 100.00% 7,352.24

Individual Specified/Named Disease Policies Lives Member Months Premium Earned Claims Incurred Loss Ratio Market Share HHIAmerican Family Life Assurance Co. 23,226 47,694 571,733 $7,008,273 $3,593,355 51.27% 29.70% 881.97Conseco Health Ins. Co. 16,048 16,048 202,248 $5,628,139 $2,125,150 37.76% 23.85% 568.81Combined Ins. Co. of America 4,981 8,228 87,604 $1,526,080 $319,391 20.93% 6.47% 41.82Provident Life and Accident Ins. Co. 4,337 4,337 0 $1,417,041 $291,942 20.60% 6.00% 36.06Colonial Life & Accident Ins. Co. 3,640 3,640 0 $1,178,541 $411,255 34.90% 4.99% 24.94Monumental Life Ins. Co. 4,636 4,637 55,410 $1,112,254 $220,615 19.83% 4.71% 22.21American General Life and Accident Ins. Co. 2,711 2,711 33,618 $663,669 $191,959 28.92% 2.81% 7.91United Teacher Associates Ins. Co. 1,742 2,996 35,445 $649,234 $249,328 38.40% 2.75% 7.57American Heritage Life Ins. Co. 1,339 2,678 31,572 $614,016 $237,906 38.75% 2.60% 6.77American Income Life Ins. Co. 2,990 4,549 35,178 $609,605 $380,324 62.39% 2.58% 6.67Loyal American Life Ins. Co. 3,004 6,650 82,060 $574,630 $477,478 83.09% 2.44% 5.93American Fidelity Assurance Co. 1,401 2,546 26,395 $561,050 $327,836 58.43% 2.38% 5.65Protective Life Ins. Co. 292 292 3,504 $326,774 $229,516 70.24% 1.38% 1.92Conseco Ins. Co. 711 711 6,498 $245,056 $67,888 27.70% 1.04% 1.08Reassure America Life Ins. Co. 715 715 8,580 $160,833 $432,608 268.98% 0.68% 0.46Liberty Life Ins. Co. 1,527 2,707 31,722 $155,572 $58,634 37.69% 0.66% 0.43Family Heritage Life Ins. Co. of America 176 342 0 $125,229 $31,550 25.19% 0.53% 0.28Freedom Life Ins. Co. of America 293 295 3,798 $121,789 $56,264 46.20% 0.52% 0.27Mutual of Omaha Ins. Co. 447 556 6,568 $89,327 $77,440 86.69% 0.38% 0.14Life Investors Ins. Co. of America 104 118 2,771 $78,912 $8,467 10.73% 0.33% 0.11Kanawha Ins. Co. 269 396 4,992 $71,971 $7,166 9.96% 0.30% 0.09United American Ins. Co. 215 368 2,438 $68,076 ($335) -0.49% 0.29% 0.08Conseco Senior Health Ins. Co. 200 200 2,472 $60,158 $146,473 243.48% 0.25% 0.06Reliastar Life Ins. Co. of New York 79 168 2,016 $60,142 $875 1.45% 0.25% 0.06National Union Fire Ins. Co. of Pittsburgh, PA 156 156 1,872 $54,533 $858 1.57% 0.23% 0.05Bankers Fidelity Life Ins. Co. 189 189 2,305 $51,931 $24,427 47.04% 0.22% 0.05Central United Life Ins. Co. 72 101 12 $49,492 $207,386 419.03% 0.21% 0.04EMC National Life Co. 61 110 549 $45,363 $749 1.65% 0.19% 0.04Cincinnati Life Ins. Co. 809 809 9,708 $43,206 ($784) -1.81% 0.18% 0.03Assurity Life Ins. Co. 105 105 1,182 $41,308 $41,751 101.07% 0.18% 0.03Physicians Mutual Ins. Co. 191 234 2,190 $29,511 $24,793 84.01% 0.13% 0.02United National Life Ins. Co. of America 74 74 872 $16,269 $0 0.00% 0.07% 0.00Continental General Ins. Co. 44 63 775 $15,622 $7,404 47.39% 0.07% 0.00Medico Ins. Co. 201 340 4,080 $14,802 $10,170 68.71% 0.06% 0.00Jackson National Life Ins. Co. 23 23 276 $13,708 $0 0.00% 0.06% 0.00Transamerica Life Ins. Co. 7 15 213 $11,045 $0 0.00% 0.05% 0.00Liberty National Life Ins. Co. 18 27 5,832 $10,907 $1,667 15.28% 0.05% 0.00Bankers Life and Casualty Co. 61 78 1,147 $9,634 $0 0.00% 0.04% 0.00Washington National Ins. Co. 81 125 1,500 $9,438 $3,948 41.83% 0.04% 0.00Guarantee Trust Life Ins. Co. 35 35 334 $9,014 $0 0.00% 0.04% 0.00National Teachers Associates Life Ins. Co. 35 30 336 $8,632 $55 0.64% 0.04% 0.00Union Fidelity Life Ins. Co. 33 37 444 $8,410 $6,887 81.89% 0.04% 0.00American National Ins. Co. 27 46 559 $8,075 $17,864 221.23% 0.03% 0.00Citizens Security Ins. Co. 74 78 936 $7,968 $0 0.00% 0.03% 0.00United Ins. Co. of America 54 108 1,392 $7,235 $483 6.68% 0.03% 0.00Hartford Life & Annuity Ins. Co. 59 59 708 $5,415 $8,181 151.08% 0.02% 0.00American Public Life Ins. Co. 0 0 0 $4,869 $0 0.00% 0.02% 0.00Globe Life and Accident Ins. Co. 87 106 1,287 $3,499 $1,072 30.64% 0.01% 0.00Union Security Ins. Co. 12 12 144 $2,735 $0 0.00% 0.01% 0.00Union Bankers Ins. Co. 129 129 1,548 $2,200 $772 35.09% 0.01% 0.00Genworth Life & Annuity Ins. Co. 10 10 120 $1,638 $0 0.00% 0.01% 0.00American General Life Ins. Co. 2 2 24 $1,270 $0 0.00% 0.01% 0.00Continental Life Ins. Co. of Brentwood, TN 2 2 24 $626 $0 0.00% 0.00% 0.00John Alden Life Ins. Co. 1 1 19 $587 $38 6.47% 0.00% 0.00United of Omaha Life Ins. Co. 37 37 504 $476 $0 0.00% 0.00% 0.00Professional Ins. Co. 14 14 168 $384 $0 0.00% 0.00% 0.00Pennsylvania Life Ins. Co. 4 4 48 $310 $0 0.00% 0.00% 0.00Mega Life and Health Ins. Co. 2 2 24 $257 $0 0.00% 0.00% 0.00Lifesecure Ins. Co. 3 3 0 $253 $0 0.00% 0.00% 0.00ING USA Annuity and Life Ins. Co. 4 4 48 $244 $0 0.00% 0.00% 0.00Old American Ins. Co. 1 1 12 $224 $13 5.80% 0.00% 0.00Unified Life Ins. Co. 22 23 69 $204 $2,475 1213.24% 0.00% 0.00Central States Health & Life Co. of Omaha 1 1 12 $134 ($44) -32.84% 0.00% 0.00Standard Life & Accident Ins. Co. 5 5 67 $125 $0 0.00% 0.00% 0.00National Guardian Life Ins. Co. 3 3 36 $116 $0 0.00% 0.00% 0.00National Casualty Co. 1 1 12 $113 $0 0.00% 0.00% 0.00Teachers Protective Mutual Life Ins. Co. 4 4 48 $109 $30,877 28327.52% 0.00% 0.00United Family Life Ins. Co. 1 1 12 $62 $0 0.00% 0.00% 0.00Life Ins. Co. of the Southwest 1 1 12 $38 $0 0.00% 0.00% 0.00New England Life Ins. Co. 0 0 2 $23 ($54) -234.78% 0.00% 0.00World Ins. Co. 2 4 48 $20 $0 0.00% 0.00% 0.00Reliable Life Ins. Co. 0 0 5 $13 $0 0.00% 0.00% 0.00Medico Life Ins. Co. 0 0 0 $0 ($5) ---- 0.00% 0.00Western & Southern Life Ins. Co. 2,638 1,324 0 $0 $0 ---- 0.00% 0.00TOTALS 80,478 118,118 1,278,137 $23,598,418 $10,334,068 43.79% 100.00% 1,621.62

Individual Limited Benefit Policies Lives Member Months Premium Earned Claims Incurred Loss Ratio Market Share HHIHighmark West Virginia, Inc. 133 179 1,220 $210,513 $177,561 84.35% 27.77% 771.12American Family Life Assurance Co. 836 1,149 11,229 $183,741 $60,150 32.74% 24.24% 587.46American Fidelity Assurance Co. 306 484 4,265 $115,098 $30,538 26.53% 15.18% 230.52Central United Life Ins. Co. 165 186 12 $68,383 $126,349 184.77% 9.02% 81.37Stonebridge Life Ins. Co. 219 237 2,844 $54,464 $196,933 361.58% 7.18% 51.62Individual Assur. Co., Life, Health & Acc. 2 328 0 $36,249 $9,005 24.84% 4.78% 22.86Bankers Life and Casualty Co. 0 0 0 $21,328 $232,758 1091.33% 2.81% 7.92Monumental Life Ins. Co. 135 157 1,884 $14,521 $3,144 21.65% 1.92% 3.67Continental Life Ins. Co. of Brentwood, TN 34 34 276 $10,057 $1,280 12.73% 1.33% 1.76American General Life Ins. Co. 4 4 48 $8,977 $10,460 116.52% 1.18% 1.40Chesapeak Life Ins. Co. 4 5 50 $7,911 $7,566 95.64% 1.04% 1.09Genworth Life & Annuity Ins. Co. 5 5 60 $4,972 $2,408 48.43% 0.66% 0.43American Republic Ins. Co. 0 0 0 $2,884 $974 33.77% 0.38% 0.14Reassure America Life Ins. Co. 36 36 432 $2,228 $2,534 113.73% 0.29% 0.09Gerber Life Ins. Co. 15 15 180 $2,142 $592 27.64% 0.28% 0.08Standard Life & Accident Ins. Co. 4 4 36 $1,825 $2,025 110.96% 0.24% 0.06Horace Mann Life Ins. Co. 0 0 0 $1,806 $1,701 94.19% 0.24% 0.06Security Life of Denver Ins. Co. 9 9 90 $1,549 $1,339 86.44% 0.20% 0.04Transamerica Life Ins. Co. 6 14 201 $1,289 $0 0.00% 0.17% 0.03Union Security Ins. Co. 1 1 12 $1,263 $3,776 298.97% 0.17% 0.03Mega Life and Health Ins. Co. 4 4 48 $1,210 $58 4.79% 0.16% 0.03John Alden Life Ins. Co. 2 3 36 $1,158 $59 5.09% 0.15% 0.02Transamerica Financial Life Ins. Co. 7 9 108 $1,132 $0 0.00% 0.15% 0.02USAA Life Ins. Co. 2 2 24 $1,021 $0 0.00% 0.13% 0.02Union Bankers Ins. Co. 14 14 168 $714 $0 0.00% 0.09% 0.01Life Investors Ins. Co. of America 8 18 216 $696 $0 0.00% 0.09% 0.01New England Life Ins. Co. 2 3 36 $549 ($48) -8.74% 0.07% 0.01Time Ins. Co. 4 4 23 $306 $68 22.22% 0.04% 0.00Allstate Life Ins. Co. 18 18 0 $56 $0 0.00% 0.01% 0.00World Ins. Co. 1 1 12 $40 $0 0.00% 0.01% 0.00United Liberty Life Ins. Co. 1 1 12 $1 $0 0.00% 0.00% 0.00TOTALS 1,977 2,924 23,522 $758,083 $871,230 114.93% 100.00% 1,761.85
Individual Student Policies Policies Lives Member Months Premium Earned Claims Incurred Loss Ratio Market Share HHITime Ins. Co. 186 186 2,351 $190,162 $166,759 87.69% 78.15% 6,107.50Gerber Life Ins. Co. 597 597 7,164 $45,548 $0 0.00% 18.72% 350.39Union Fidelity Life Ins. Co. 95 172 2,064 $7,618 $2,251 1.18% 3.13% 9.80Guarantee Trust Life Ins. Co. 0 0 0 $0 ($28) -0.01% 0.00% 0.00TOTALS 878 955 11,579 $243,328 $168,982 88.86% 100.00% 6,467.69
Individual Accident Only or AD&D Policies Lives Member Months Premium Earned Claims Incurred Loss Ratio Market Share HHICombined Ins. Co. of America 67,666 41,760 440,997 $6,480,774 $2,395,733 36.97% 39.80% 1,584.12American Family Life Assurance Co. 15,494 32,744 377,275 $5,302,806 $1,602,369 30.22% 32.57% 1,060.59Colonial Life & Accident Ins. Co. 3,698 3,698 0 $821,144 $224,225 27.31% 5.04% 25.43American Heritage Life Ins. Co. 1,207 2,414 29,712 $496,245 $242,660 48.90% 3.05% 9.29American General Life and Accident Ins. Co. 7,401 7,401 91,050 $488,265 $64,515 13.21% 3.00% 8.99American Income Life Ins. Co. 7,158 14,285 86,646 $459,381 $145,449 31.66% 2.82% 7.96Sears Life Ins. Co. 4,774 9,548 107,970 $458,262 $218,557 47.69% 2.81% 7.92Conseco Health Ins. Co. 1,526 1,526 15,612 $455,772 $37,647 8.26% 2.80% 7.83Provident Life and Accident Ins. Co. 1,148 1,148 0 $282,566 $80,970 28.66% 1.74% 3.01Mutual of Omaha Ins. Co. 1,983 2,865 32,902 $222,558 ($4,429) -1.99% 1.37% 1.87Monumental Life Ins. Co. 3,798 3,804 47,340 $206,805 $103,932 50.26% 1.27% 1.61Stonebridge Life Ins. Co. 526 642 7,704 $108,996 $2,464 2.26% 0.67% 0.45Life Ins. Co. of North America 5 5 0 $98,547 $0 0.00% 0.61% 0.37Merit Life Ins. Co. 3,663 4,741 54,522 $80,605 $740 0.92% 0.50% 0.25Globe Life and Accident Ins. Co. 566 575 6,659 $73,038 $34,599 47.37% 0.45% 0.20Lincoln Heritage Life Ins. Co. 294 294 3,432 $37,650 $0 0.00% 0.23% 0.05Zurich American Ins. Co. 7 376 2,880 $23,977 $0 0.00% 0.15% 0.02Ord of Utd Comm'l Trav. of Amer.-Frtnl 535 576 7,170 $19,618 $11,076 56.46% 0.12% 0.01Bankers Fidelity Life Ins. Co. 38 38 560 $14,160 $1,667 11.77% 0.09% 0.01United Ins. Co. of America 155 310 4,188 $12,636 $2,254 17.84% 0.08% 0.01Bankers Life and Casualty Co. 150 150 2,227 $12,512 $3,651 29.18% 0.08% 0.01United Teacher Associates Ins. Co. 41 53 493 $11,859 $1,514 12.77% 0.07% 0.01Transamerica Life Ins. Co. 67 103 1,365 $11,037 $0 0.00% 0.07% 0.00Liberty Life Ins. Co. 271 271 3,366 $10,902 $0 0.00% 0.07% 0.00American General Life Ins. Co. 33 33 396 $9,951 $2,102 21.12% 0.06% 0.00Genworth Life & Annuity Ins. Co. 103 103 1,236 $9,481 $1,882 19.85% 0.06% 0.00Conseco Ins. Co. 187 350 1,554 $8,232 $2,280 27.70% 0.05% 0.00Standard Life & Accident Ins. Co. 351 351 4,288 $6,296 $15 0.24% 0.04% 0.00Continental General Ins. Co. 24 24 329 $6,220 $163 2.62% 0.04% 0.00Family Heritage Life Ins. Co. of America 14 18 0 $5,983 $9,022 150.79% 0.04% 0.00Reassure America Life Ins. Co. 63 63 756 $5,758 $2,111 36.66% 0.04% 0.00Life Investors Ins. Co. of America 37 57 707 $4,757 $0 0.00% 0.03% 0.00Colonial Penn Life Ins. Co. 24 24 330 $3,307 $2,236 67.61% 0.02% 0.00Guarantee Trust Life Ins. Co. 7 7 182 $3,028 ($25,666) -847.62% 0.02% 0.00Baltimore Life Ins. Co. 99 99 1,200 $2,989 $0 0.00% 0.02% 0.00Starmount Life Ins. Co. 37 37 444 $2,136 $0 0.00% 0.01% 0.00Assurity Life Ins. Co. 4 4 42 $2,135 $6 0.28% 0.01% 0.00Allstate Life Ins. Co. 0 0 0 $1,902 $20,172 1060.57% 0.01% 0.00Kanawha Ins. Co. 5 5 60 $1,842 $0 0.00% 0.01% 0.00Physicians Mutual Ins. Co. 17 19 223 $1,632 ($20,914) -1281.50% 0.01% 0.00Horace Mann Life Ins. Co. 47 47 564 $1,540 ($3) -0.19% 0.01% 0.00Perico Life Ins. Co. 10 14 168 $1,203 $158 13.13% 0.01% 0.00Reliance Standard Life Ins. Co. 24 24 0 $1,077 $0 0.00% 0.01% 0.00
Individual Accident Only or AD&D Policies Lives Member Months Premium Earned Claims Incurred Loss Ratio Market Share HHI

Individual Accident Only or AD&D Policies Lives Member Months Premium Earned Claims Incurred Loss Ratio Market Share HHIAmerican Home Assurance Co. 8 8 96 $1,071 ($62) -5.79% 0.01% 0.00Cincinnati Life Ins. Co. 921 921 11,052 $923 $0 0.00% 0.01% 0.00Unified Life Ins. Co. 163 183 549 $816 $0 0.00% 0.01% 0.00Conseco Senior Health Ins. Co. 19 19 228 $781 $0 0.00% 0.00% 0.00American Bankers Life Assurance Co. 0 0 0 $700 $4,882 697.43% 0.00% 0.00Loyal American Life Ins. Co. 4 7 89 $694 $0 0.00% 0.00% 0.00Old American Ins. Co. 37 37 462 $675 $39 5.78% 0.00% 0.00Medico Ins. Co. 0 0 0 $614 ($5) -0.81% 0.00% 0.00Liberty National Life Ins. Co. 13 13 2,028 $577 $24 4.16% 0.00% 0.00Central United Life Ins. Co. 5 5 12 $521 $0 0.00% 0.00% 0.00AIG Life Ins. Co. 12 12 144 $506 $0 0.00% 0.00% 0.00Union Labor Life Ins. Co. 7 22 234 $495 $267 53.94% 0.00% 0.00Commercial Travelers Mutual Ins. Co. 4 4 48 $490 $0 0.00% 0.00% 0.00John Alden Life Ins. Co. 14 15 170 $461 $129 27.98% 0.00% 0.00Government Employees Ins. Co. 4 4 48 $454 ($1) -0.22% 0.00% 0.00Pennsylvania Life Ins. Co. 0 0 6 $451 $0 0.00% 0.00% 0.00Federal Ins. Co. 3 7 7 $426 $80 18.78% 0.00% 0.00National Casualty Co. 17 21 252 $422 $0 0.00% 0.00% 0.00Washington National Ins. Co. 28 28 348 $374 $156 41.71% 0.00% 0.00Jefferson National Life Ins. Co. 3 3 36 $365 $89 24.38% 0.00% 0.00Security Life of Denver Ins. Co. 1 1 10 $316 $0 0.00% 0.00% 0.00Transamerica Financial Life Ins. Co. 4 6 72 $282 $0 0.00% 0.00% 0.00Farmers New World Life Ins. 0 0 0 $229 $0 0.00% 0.00% 0.00Transamerica Occidental Life Ins. Co. 1 2 26 $190 $0 0.00% 0.00% 0.00American Progressive Life & Health Ins. Co. 4 4 48 $153 $0 0.00% 0.00% 0.00American National Ins. Co. 2 2 24 $76 $0 0.00% 0.00% 0.00Central Security Life Ins. Co. 1 1 12 $73 $0 0.00% 0.00% 0.00Security Life Ins. Co. of America 1 2 12 $62 $0 0.00% 0.00% 0.00Stonebridge Casualty Ins. Co. 1 3 36 $58 $0 0.00% 0.00% 0.00Federal Life Ins. Co. (Mutual) 9 9 121 $32 $0 0.00% 0.00% 0.00State Farm Mutual Automobile Ins. Co. 1 1 12 $21 $0 0.00% 0.00% 0.00Jackson National Life Ins. Co. 3 3 36 $13 $0 0.00% 0.00% 0.00Union Security Ins. Co. 2 2 24 $10 $0 0.00% 0.00% 0.00Old Republic Life Ins. Co. 14,461 0 0 $0 $316 ---- 0.00% 0.00Western & Southern Life Ins. Co. 1,230 1,096 0 $0 $0 ---- 0.00% 0.00Individual Assur. Co., Life, Health & Acc. 0 0 0 $0 ($96) ---- 0.00% 0.00TOTALS 140,240 133,047 1,352,791 $16,282,915 $5,168,975 31.74% 100.00% 2,720.04
Individual Short Term Disability Policies Lives Member Months Premium Earned Claims Incurred Loss Ratio Market Share HHIAmerican Family Life Assurance Co. 7,419 7,419 83,229 $3,457,936 $1,421,804 41.12% 29.58% 874.83Combined Ins. Co. of America 8,114 8,329 86,618 $2,121,603 $87,322 4.12% 18.15% 329.32Colonial Life & Accident Ins. Co. 3,705 3,705 0 $1,639,631 $562,628 34.31% 14.02% 196.69Provident Life and Accident Ins. Co. 2,005 2,005 0 $1,549,976 $1,522,238 98.21% 13.26% 175.77Paul Revere Life Ins. Co. 637 637 0 $1,163,937 $1,719,008 147.69% 9.96% 99.12State Farm Mutual Automobile Ins. Co. 2,691 2,691 33,398 $894,677 $557,276 62.29% 7.65% 58.56Guardian Life Ins. Co. 198 198 2,376 $275,363 $284,445 103.30% 2.36% 5.55American Heritage Life Ins. Co. 213 213 2,412 $116,765 $67,134 57.49% 1.00% 1.00Unum Life Ins. Co. of America 522 522 0 $92,055 $1,103,003 1198.20% 0.79% 0.62Farm Family Life Ins. Co. 103 103 1,230 $55,655 $16,426 29.51% 0.48% 0.23National Guardian Life Ins. Co. 85 85 1,074 $38,090 $37,034 97.23% 0.33% 0.11Horace Mann Life Ins. Co. 122 122 1,464 $37,902 $7,916 20.89% 0.32% 0.11Ohio National Life Assurance Corporation 26 26 0 $36,457 $0 0.00% 0.31% 0.10Liberty Life Ins. Co. 264 264 3,288 $33,106 $49,240 148.73% 0.28% 0.08Kanawha Ins. Co. 91 91 1,230 $29,138 $27,317 93.75% 0.25% 0.06Bankers Fidelity Life Ins. Co. 44 44 547 $24,692 $0 0.00% 0.21% 0.04Continental General Ins. Co. 37 37 476 $18,687 $4,301 23.02% 0.16% 0.03Symetra Life Ins. Co. 27 27 0 $18,059 $23,160 128.25% 0.15% 0.02USAA Life Ins. Co. 14 14 180 $15,561 $0 0.00% 0.13% 0.02United Ins. Co. of America 121 121 1,572 $12,821 $30,716 239.58% 0.11% 0.01American General Life and Accident Ins. Co. 20 20 234 $11,935 $75 0.63% 0.10% 0.01Mutual of Omaha Ins. Co. 17 17 201 $9,157 ($957) -10.45% 0.08% 0.01Ohio National Life Ins. Co. 25 25 0 $6,679 $2,279 34.12% 0.06% 0.00Fidelity Security Life Ins. Co. 2 2 12 $4,529 $0 0.00% 0.04% 0.00American States Ins. Co. 0 0 0 $3,609 $6,934 192.13% 0.03% 0.00Transamerica Life Ins. Co. 3 6 69 $2,207 $0 0.00% 0.02% 0.00Colorado Bankers Life Ins. Co. 7 7 84 $2,059 $0 0.00% 0.02% 0.00American National Ins. Co. 2 2 24 $1,976 ($227) -11.49% 0.02% 0.00American Network Ins. Co. 1 1 12 $1,902 $0 0.00% 0.02% 0.00Conseco Senior Health Ins. Co. 3 3 42 $1,665 $0 0.00% 0.01% 0.00CUNA Mutual Ins. Co. 3 3 36 $1,536 $0 0.00% 0.01% 0.00American Public Life Ins. Co. 0 0 0 $1,410 $0 0.00% 0.01% 0.00Bankers Life and Casualty Co. 7 7 192 $1,365 $777 56.92% 0.01% 0.00Union Bankers Ins. Co. 23 23 276 $1,322 $7,525 569.21% 0.01% 0.00Pennsylvania Life Ins. Co. 3 3 36 $1,226 $0 0.00% 0.01% 0.00Commercial Travelers Mutual Ins. Co. 38 38 492 $958 $0 0.00% 0.01% 0.00American Income Life Ins. Co. 3 3 42 $932 $0 0.00% 0.01% 0.00Central United Life Ins. Co. 7 7 12 $722 $8,660 1199.45% 0.01% 0.00Old Republic Life Ins. Co. 0 0 0 $565 ($4,735) -838.05% 0.00% 0.00Hartford Life & Annuity Ins. Co. 4 4 48 $481 $727 151.14% 0.00% 0.00John Alden Life Ins. Co. 1 1 8 $460 $79 17.17% 0.00% 0.00EMC National Life Co. 1 1 12 $408 $0 0.00% 0.00% 0.00American Sentinel Ins. Co. 2 2 24 $405 ($11) -2.72% 0.00% 0.00Monumental Life Ins. Co. 1 1 12 $279 $0 0.00% 0.00% 0.00Transamerica Occidental Life Ins. Co. 1 1 12 $218 $0 0.00% 0.00% 0.00Mega Life and Health Ins. Co. 1 1 12 $217 $0 0.00% 0.00% 0.00Transamerica Financial Life Ins. Co. 1 2 14 $215 $0 0.00% 0.00% 0.00
Individual Short Term Disability Policies Lives Member Months Premium Earned Claims Incurred Loss Ratio Market Share HHI

Individual Short Term Disability Policies Lives Member Months Premium Earned Claims Incurred Loss Ratio Market Share HHIUnion Security Ins. Co. 1 1 12 $214 $0 0.00% 0.00% 0.00First Investors Life Ins. Co. 1 1 12 $149 $0 0.00% 0.00% 0.00Medico Ins. Co. 2 2 24 $70 $1 1.43% 0.00% 0.00Union Fidelity Life Ins. Co. 0 0 0 $67 $0 0.00% 0.00% 0.00Teachers Protective Mutual Life Ins. Co. 1 1 12 $58 $0 0.00% 0.00% 0.00TOTALS 26,619 26,838 221,060 $11,691,106 $7,542,095 64.51% 100.00% 1,742.27
Individual Long Term Disability Policies Lives Member Months Premium Earned Claims Incurred Loss Ratio Market Share HHINorthwestern Mutual Life Ins. Co. 4,709 4,709 55,434 $4,422,215 $3,627,684 82.03% 40.83% 1,666.79Massachusetts Mutual Life Ins. Co. 1,219 994 15,117 $1,186,367 $1,391,614 117.30% 10.95% 119.96Berkshire Life Ins. Co. of America 271 271 3,252 $599,057 ($40,754) -6.80% 5.53% 30.59Professional Ins. Co. 937 937 11,244 $589,067 $480,728 81.61% 5.44% 29.58AXA Equitable Life Ins. Co. 275 275 3,432 $481,075 $936,452 194.66% 4.44% 19.73Assurity Life Ins. Co. 735 735 9,360 $414,942 $343,572 82.80% 3.83% 14.67New York Life Ins. Co. 410 410 4,920 $317,106 ($87,808) -27.69% 2.93% 8.57Riversource Life Ins. Co. 338 338 4,056 $280,812 $177,581 63.24% 2.59% 6.72Ohio National Life Assurance Corporation 117 117 0 $241,192 $269,710 111.82% 2.23% 4.96Reassure America Life Ins. Co. 191 191 2,292 $213,874 $328,204 153.46% 1.97% 3.90Ohio National Life Ins. Co. 116 116 0 $188,132 $47,090 25.03% 1.74% 3.02Mony Life Ins. Co. 155 155 1,950 $175,480 $94,726 53.98% 1.62% 2.62State Farm Mutual Automobile Ins. Co. 161 161 1,998 $134,132 $366,236 273.04% 1.24% 1.53American General Life Ins. Co. 288 288 3,456 $124,215 $117,087 94.26% 1.15% 1.32Mutual of Omaha Ins. Co. 365 366 4,381 $117,581 $267,563 227.56% 1.09% 1.18Minnesota Life Ins. Co. 58 54 678 $111,017 $193,961 174.71% 1.02% 1.05Standard Ins. Co. 93 84 876 $100,902 $1,233 1.22% 0.93% 0.87Centre Life Ins. Co. 50 50 642 $97,848 ($33,996) -34.74% 0.90% 0.82Union Central Life Ins. Co. 38 38 0 $91,759 $0 0.00% 0.85% 0.72Federated Life Ins. Co. 82 82 996 $88,031 $0 0.00% 0.81% 0.66Illinois Mutual Life Ins. Co. 108 108 1,236 $83,091 $51,335 61.78% 0.77% 0.59National Life Ins. Co. 168 94 0 $82,319 $558,910 678.96% 0.76% 0.58Farm Family Life Ins. Co. 100 100 1,194 $68,589 $406,780 593.07% 0.63% 0.40Lincoln National Life Ins. Co. 221 221 2,652 $64,975 $202,933 312.32% 0.60% 0.36Pan-American Life Ins. Co. 25 25 300 $59,731 $26,162 43.80% 0.55% 0.30Pennsylvania Life Ins. Co. 521 521 6,480 $49,441 $111,975 226.48% 0.46% 0.21Protective Life Ins. Co. 44 44 528 $35,277 $11,911 33.76% 0.33% 0.11MetLife Ins. Co. of Connecticut 45 45 540 $34,103 ($58,634) -171.93% 0.31% 0.10Lafayette Life Ins. Co. 42 42 12 $33,829 $4,000 11.82% 0.31% 0.10Bankers Life and Casualty Co. 101 101 1,578 $30,907 $6,743 21.82% 0.29% 0.08Prudential Ins. Co. of America 131 131 1,572 $29,553 $27,759 93.93% 0.27% 0.07John Hancock Life Ins. Co. 27 27 324 $27,948 $0 0.00% 0.26% 0.07Crown Life Ins. Co. 23 23 276 $24,481 $72,161 294.76% 0.23% 0.05Horace Mann Life Ins. Co. 75 75 890 $23,398 $3,818 16.32% 0.22% 0.05Monumental Life Ins. Co. 154 154 1,992 $22,507 $29,904 132.87% 0.21% 0.04Erie Family Life Ins. Co. 69 69 864 $21,088 $26,810 127.13% 0.19% 0.04Continental General Ins. Co. 18 18 217 $15,873 $3,017 19.01% 0.15% 0.02Bankers Fidelity Life Ins. Co. 14 14 161 $15,069 $12,634 83.84% 0.14% 0.02Country Life Ins. Co. 11 11 132 $14,544 $23,795 163.61% 0.13% 0.02Connecticut General Life Ins. Co. 12 12 144 $14,187 ($381,963) -2692.35% 0.13% 0.02CUNA Mutual Ins. Co. 10 10 93 $12,893 ($210) -1.63% 0.12% 0.01Indianapolis Life Ins. Co. 16 16 192 $11,411 $4,465 39.13% 0.11% 0.01Penn Mutual Life Ins. Co. 14 14 0 $11,014 ($437,028) -3967.93% 0.10% 0.01United Teacher Associates Ins. Co. 22 22 264 $7,108 $22,721 319.65% 0.07% 0.00Merit Life Ins. Co. 27 27 252 $6,744 ($4) -0.06% 0.06% 0.00Washington National Ins. Co. 15 15 180 $6,021 $2,519 41.84% 0.06% 0.00Great-West Life Assurance Co. 0 0 0 $5,907 $8,276 140.10% 0.05% 0.00Commonwealth Annuity & Life Ins. Co. 8 8 96 $5,171 $8,112 156.87% 0.05% 0.00Jefferson National Life Ins. Co. 4 4 60 $4,898 $1,201 24.52% 0.05% 0.00Physicians Mutual Ins. Co. 7 7 84 $3,819 $3,739 97.91% 0.04% 0.00American General Life and Accident Ins. Co. 156 156 1,908 $3,780 $4,910 129.89% 0.03% 0.00Kansas City Life Ins. Co. 11 11 174 $3,712 $3,284 88.47% 0.03% 0.00Combined Ins. Co. of America 12 12 144 $3,138 $129 4.11% 0.03% 0.00Unified Life Ins. Co. 17 17 51 $3,080 $2,407 78.15% 0.03% 0.00American United Life Ins. Co. 3 3 36 $2,807 $0 0.00% 0.03% 0.00Life Investors Ins. Co. of America 4 4 48 $2,430 $0 0.00% 0.02% 0.00Phoenix Life Ins. Co. 0 0 0 $1,832 $0 0.00% 0.02% 0.00Genworth Life & Annuity Ins. Co. 7 7 84 $1,804 $0 0.00% 0.02% 0.00MTL Ins. 1 1 12 $1,647 $0 0.00% 0.02% 0.00Primerica Life Ins. Co. 6 6 72 $1,589 $40,583 2554.00% 0.01% 0.00National Guardian Life Ins. Co. 3 3 42 $1,344 $1,307 97.25% 0.01% 0.00United American Ins. Co. 9 9 107 $1,274 ($1,973) -154.87% 0.01% 0.00Teachers Protective Mutual Life Ins. Co. 7 7 92 $948 $7,139 753.06% 0.01% 0.00First Allmerica Financial Life Ins. Co. 3 3 36 $564 $0 0.00% 0.01% 0.00Conseco Ins. Co. 2 2 24 $406 $112 27.59% 0.00% 0.00American Pioneer Life Ins. Co. 1 1 12 $385 $5,290 1374.03% 0.00% 0.00State Automobile Mutual Ins. Co. 0 0 9 $248 $1,781 718.15% 0.00% 0.00Liberty Life Assurance Co. of Boston 1 1 12 $201 $0 0.00% 0.00% 0.00American Income Life Ins. Co. 1 1 12 $189 $0 0.00% 0.00% 0.00Lifesecure Ins. Co. 5 5 0 $49 $0 0.00% 0.00% 0.00AIG Life Ins. Co. 0 0 0 $31 $0 0.00% 0.00% 0.00Columbus Life Ins. Co. 9 9 0 $0 $0 ---- 0.00% 0.00Parker Centennial Assurance Co. 0 0 0 $0 $0 ---- 0.00% 0.00National Casualty Co. 3 3 36 ($402) $0 0.00% 0.00% 0.00TOTALS 12,901 12,590 149,308 $10,831,756 $9,299,693 85.86% 100.00% 1,922.53

Total Individual Dis. (Short & Long) Policies Lives Member Months Premium Earned Claims Incurred Loss Ratio Market Share HHINorthwestern Mutual Life Ins. Co. 4,709 4,709 55,434 $4,422,215 $3,627,684 82.03% 19.63% 385.51American Family Life Assurance Co. 7,419 7,419 83,229 $3,457,936 $1,421,804 41.12% 15.35% 235.71Combined Ins. Co. of America 8,126 8,341 86,762 $2,124,741 $87,451 4.12% 9.43% 88.99Colonial Life & Accident Ins. Co. 3,705 3,705 0 $1,639,631 $562,628 34.31% 7.28% 53.00Provident Life and Accident Ins. Co. 2,005 2,005 0 $1,549,976 $1,522,238 98.21% 6.88% 47.36Massachusetts Mutual Life Ins. Co. 1,219 994 15,117 $1,186,367 $1,391,614 117.30% 5.27% 27.75Paul Revere Life Ins. Co. 637 637 0 $1,163,937 $1,719,008 147.69% 5.17% 26.71State Farm Mutual Automobile Ins. Co. 2,852 2,852 35,396 $1,028,809 $923,512 89.77% 4.57% 20.87Berkshire Life Ins. Co. of America 271 271 3,252 $599,057 ($40,754) -6.80% 2.66% 7.07Professional Ins. Co. 937 937 11,244 $589,067 $480,728 81.61% 2.62% 6.84AXA Equitable Life Ins. Co. 275 275 3,432 $481,075 $936,452 194.66% 2.14% 4.56Assurity Life Ins. Co. 735 735 9,360 $414,942 $343,572 82.80% 1.84% 3.39New York Life Ins. Co. 410 410 4,920 $317,106 ($87,808) -27.69% 1.41% 1.98Riversource Life Ins. Co. 338 338 4,056 $280,812 $177,581 63.24% 1.25% 1.55Ohio National Life Assurance Corporation 143 143 0 $277,649 $269,710 97.14% 1.23% 1.52Guardian Life Ins. Co. 198 198 2,376 $275,363 $284,445 103.30% 1.22% 1.49Reassure America Life Ins. Co. 191 191 2,292 $213,874 $328,204 153.46% 0.95% 0.90Ohio National Life Ins. Co. 141 141 0 $194,811 $49,369 25.34% 0.86% 0.75Mony Life Ins. Co. 155 155 1,950 $175,480 $94,726 53.98% 0.78% 0.61Mutual of Omaha Ins. Co. 382 383 4,582 $126,738 $266,606 210.36% 0.56% 0.32Farm Family Life Ins. Co. 203 203 2,424 $124,244 $423,206 340.62% 0.55% 0.30American General Life Ins. Co. 288 288 3,456 $124,215 $117,087 94.26% 0.55% 0.30American Heritage Life Ins. Co. 213 213 2,412 $116,765 $67,134 57.49% 0.52% 0.27Minnesota Life Ins. Co. 58 54 678 $111,017 $193,961 174.71% 0.49% 0.24Standard Ins. Co. 93 84 876 $100,902 $1,233 1.22% 0.45% 0.20Centre Life Ins. Co. 50 50 642 $97,848 ($33,996) -34.74% 0.43% 0.19Unum Life Ins. Co. of America 522 522 0 $92,055 $1,103,003 1198.20% 0.41% 0.17Union Central Life Ins. Co. 38 38 0 $91,759 $0 0.00% 0.41% 0.17Federated Life Ins. Co. 82 82 996 $88,031 $0 0.00% 0.39% 0.15Illinois Mutual Life Ins. Co. 108 108 1,236 $83,091 $51,335 61.78% 0.37% 0.14National Life Ins. Co. 168 94 0 $82,319 $558,910 678.96% 0.37% 0.13Lincoln National Life Ins. Co. 221 221 2,652 $64,975 $202,933 312.32% 0.29% 0.08Horace Mann Life Ins. Co. 197 197 2,354 $61,300 $11,734 19.14% 0.27% 0.07Pan-American Life Ins. Co. 25 25 300 $59,731 $26,162 43.80% 0.27% 0.07Pennsylvania Life Ins. Co. 524 524 6,516 $50,667 $111,975 221.00% 0.22% 0.05Bankers Fidelity Life Ins. Co. 58 58 708 $39,761 $12,634 31.77% 0.18% 0.03National Guardian Life Ins. Co. 88 88 1,116 $39,434 $38,341 97.23% 0.18% 0.03Protective Life Ins. Co. 44 44 528 $35,277 $11,911 33.76% 0.16% 0.02Continental General Ins. Co. 55 55 693 $34,560 $7,318 21.17% 0.15% 0.02MetLife Ins. Co. of Connecticut 45 45 540 $34,103 ($58,634) -171.93% 0.15% 0.02Lafayette Life Ins. Co. 42 42 12 $33,829 $4,000 11.82% 0.15% 0.02Liberty Life Ins. Co. 264 264 3,288 $33,106 $49,240 148.73% 0.15% 0.02Bankers Life and Casualty Co. 108 108 1,770 $32,272 $7,520 23.30% 0.14% 0.02Prudential Ins. Co. of America 131 131 1,572 $29,553 $27,759 93.93% 0.13% 0.02Kanawha Ins. Co. 91 91 1,230 $29,138 $27,317 93.75% 0.13% 0.02John Hancock Life Ins. Co. 27 27 324 $27,948 $0 0.00% 0.12% 0.02Crown Life Ins. Co. 23 23 276 $24,481 $72,161 294.76% 0.11% 0.01Monumental Life Ins. Co. 155 155 2,004 $22,786 $29,904 131.24% 0.10% 0.01Erie Family Life Ins. Co. 69 69 864 $21,088 $26,810 127.13% 0.09% 0.01Symetra Life Ins. Co. 27 27 0 $18,059 $23,160 128.25% 0.08% 0.01American General Life and Accident Ins. Co. 176 176 2,142 $15,715 $4,985 31.72% 0.07% 0.00USAA Life Ins. Co. 14 14 180 $15,561 $0 0.00% 0.07% 0.00Country Life Ins. Co. 11 11 132 $14,544 $23,795 163.61% 0.06% 0.00CUNA Mutual Ins. Co. 13 13 129 $14,429 ($210) -1.46% 0.06% 0.00Connecticut General Life Ins. Co. 12 12 144 $14,187 ($381,963) -2692.35% 0.06% 0.00United Ins. Co. of America 121 121 1,572 $12,821 $30,716 239.58% 0.06% 0.00Indianapolis Life Ins. Co. 16 16 192 $11,411 $4,465 39.13% 0.05% 0.00Penn Mutual Life Ins. Co. 14 14 0 $11,014 ($437,028) -3967.93% 0.05% 0.00United Teacher Associates Ins. Co. 22 22 264 $7,108 $22,721 319.65% 0.03% 0.00Merit Life Ins. Co. 27 27 252 $6,744 ($4) -0.06% 0.03% 0.00Washington National Ins. Co. 15 15 180 $6,021 $2,519 41.84% 0.03% 0.00Great-West Life Assurance Co. 0 0 0 $5,907 $8,276 140.10% 0.03% 0.00Commonwealth Annuity & Life Ins. Co. 8 8 96 $5,171 $8,112 156.87% 0.02% 0.00Jefferson National Life Ins. Co. 4 4 60 $4,898 $1,201 24.52% 0.02% 0.00Fidelity Security Life Ins. Co. 2 2 12 $4,529 $0 0.00% 0.02% 0.00Physicians Mutual Ins. Co. 7 7 84 $3,819 $3,739 97.91% 0.02% 0.00Kansas City Life Ins. Co. 11 11 174 $3,712 $3,284 88.47% 0.02% 0.00American States Ins. Co. 0 0 0 $3,609 $6,934 192.13% 0.02% 0.00Unified Life Ins. Co. 17 17 51 $3,080 $2,407 78.15% 0.01% 0.00American United Life Ins. Co. 3 3 36 $2,807 $0 0.00% 0.01% 0.00Life Investors Ins. Co. of America 4 4 48 $2,430 $0 0.00% 0.01% 0.00Transamerica Life Ins. Co. 3 6 69 $2,207 $0 0.00% 0.01% 0.00Colorado Bankers Life Ins. Co. 7 7 84 $2,059 $0 0.00% 0.01% 0.00American National Ins. Co. 2 2 24 $1,976 ($227) -11.49% 0.01% 0.00American Network Ins. Co. 1 1 12 $1,902 $0 0.00% 0.01% 0.00Phoenix Life Ins. Co. 0 0 0 $1,832 $0 0.00% 0.01% 0.00Genworth Life & Annuity Ins. Co. 7 7 84 $1,804 $0 0.00% 0.01% 0.00Conseco Senior Health Ins. Co. 3 3 42 $1,665 $0 0.00% 0.01% 0.00MTL Ins. 1 1 12 $1,647 $0 0.00% 0.01% 0.00Primerica Life Ins. Co. 6 6 72 $1,589 $40,583 2554.00% 0.01% 0.00American Public Life Ins. Co. 0 0 0 $1,410 $0 0.00% 0.01% 0.00Union Bankers Ins. Co. 23 23 276 $1,322 $7,525 569.21% 0.01% 0.00United American Ins. Co. 9 9 107 $1,274 ($1,973) -154.87% 0.01% 0.00American Income Life Ins. Co. 4 4 54 $1,121 $0 0.00% 0.00% 0.00Teachers Protective Mutual Life Ins. Co. 8 8 104 $1,006 $7,139 709.64% 0.00% 0.00Commercial Travelers Mutual Ins. Co. 38 38 492 $958 $0 0.00% 0.00% 0.00
Total Individual Dis. (Short & Long) Policies Lives Member Months Premium Earned Claims Incurred Loss Ratio Market Share HHI

Total Individual Dis. (Short & Long) Policies Lives Member Months Premium Earned Claims Incurred Loss Ratio Market Share HHICentral United Life Ins. Co. 7 7 12 $722 $8,660 1199.45% 0.00% 0.00Old Republic Life Ins. Co. 0 0 0 $565 ($4,735) -838.05% 0.00% 0.00First Allmerica Financial Life Ins. Co. 3 3 36 $564 $0 0.00% 0.00% 0.00Hartford Life & Annuity Ins. Co. 4 4 48 $481 $727 151.14% 0.00% 0.00John Alden Life Ins. Co. 1 1 8 $460 $79 17.17% 0.00% 0.00EMC National Life Co. 1 1 12 $408 $0 0.00% 0.00% 0.00Conseco Ins. Co. 2 2 24 $406 $112 27.59% 0.00% 0.00American Sentinel Ins. Co. 2 2 24 $405 ($11) -2.72% 0.00% 0.00American Pioneer Life Ins. Co. 1 1 12 $385 $5,290 1374.03% 0.00% 0.00State Automobile Mutual Ins. Co. 0 0 9 $248 $1,781 718.15% 0.00% 0.00Transamerica Occidental Life Ins. Co. 1 1 12 $218 $0 0.00% 0.00% 0.00Mega Life and Health Ins. Co. 1 1 12 $217 $0 0.00% 0.00% 0.00Transamerica Financial Life Ins. Co. 1 2 14 $215 $0 0.00% 0.00% 0.00Union Security Ins. Co. 1 1 12 $214 $0 0.00% 0.00% 0.00Liberty Life Assurance Co. of Boston 1 1 12 $201 $0 0.00% 0.00% 0.00First Investors Life Ins. Co. 1 1 12 $149 $0 0.00% 0.00% 0.00Medico Ins. Co. 2 2 24 $70 $1 1.43% 0.00% 0.00Union Fidelity Life Ins. Co. 0 0 0 $67 $0 0.00% 0.00% 0.00Lifesecure Ins. Co. 5 5 0 $49 $0 0.00% 0.00% 0.00AIG Life Ins. Co. 0 0 0 $31 $0 0.00% 0.00% 0.00Columbus Life Ins. Co. 9 9 0 $0 $0 ---- 0.00% 0.00National Casualty Co. 3 3 36 ($402) $0 0.00% 0.00% 0.00TOTALS 39,520 39,428 370,368 $22,522,862 $16,841,788 74.78% 100.00% 919.75
Individual LTC (Tax Qualified) Policies Lives Member Months Premium Earned Claims Incurred Loss Ratio Market Share HHIGenworth Life Ins. Co. 4,448 4,988 0 $7,356,997 $4,025,283 54.71% 35.89% 1,287.80Bankers Life and Casualty Co. 1,772 2,213 29,628 $3,038,826 $1,772,647 58.33% 14.82% 219.72Northwestern Long Term Care Ins. Co. 1,066 1,066 11,873 $1,621,385 $416,292 25.68% 7.91% 62.55Metropolitan Life Ins. Co. 590 590 7,080 $1,353,472 ($75,199) -5.56% 6.60% 43.59John Hancock Life Ins. Co. 682 682 8,184 $1,155,885 $935,982 80.98% 5.64% 31.79
Teachers Ins. & Annuity Association of America 302 302 3,624 $613,224 $513,085 83.67% 2.99% 8.95Unum Life Ins. Co. of America 343 343 0 $504,445 $235,039 46.59% 2.46% 6.05New York Life Ins. Co. 368 368 4,375 $457,426 $233,517 51.05% 2.23% 4.98Prudential Ins. Co. of America 239 239 2,868 $414,990 $43,779 10.55% 2.02% 4.10TIAA-CREF Life Ins. Co. 176 176 2,112 $379,349 $0 0.00% 1.85% 3.42Massachusetts Mutual Life Ins. Co. 108 175 1,262 $360,355 ($154,366) -42.84% 1.76% 3.09Principal Life Ins. Co. 232 232 2,750 $341,135 $228,435 66.96% 1.66% 2.77Mutual of Omaha Ins. Co. 156 156 1,872 $327,553 $113,888 34.77% 1.60% 2.55American Network Ins. Co. 137 137 1,644 $270,042 $43,018 15.93% 1.32% 1.74Continental Casualty Co. 571 571 7,065 $237,839 $1,015,710 427.06% 1.16% 1.35United Teacher Associates Ins. Co. 271 271 3,168 $199,411 $62,220 31.20% 0.97% 0.95Provident Life and Accident Ins. Co. 105 105 0 $163,382 $0 0.00% 0.80% 0.64American Family Life Assurance Co. 151 187 2,059 $150,627 $102,599 68.11% 0.73% 0.54Monumental Life Ins. Co. 195 195 2,388 $134,076 $0 0.00% 0.65% 0.43Lincoln Benefit Life Co. 39 39 708 $124,624 $0 0.00% 0.61% 0.37Union Security Ins. Co. 86 86 1,032 $113,992 $0 0.00% 0.56% 0.31Transamerica Occidental Life Ins. Co. 62 62 543 $113,796 $92,738 81.49% 0.56% 0.31John Alden Life Ins. Co. 69 69 828 $109,757 $32 0.03% 0.54% 0.29State Farm Mutual Automobile Ins. Co. 551 551 6,547 $101,935 $212,954 208.91% 0.50% 0.25Great American Life Ins. Co. 84 84 918 $101,600 $0 0.00% 0.50% 0.25Time Ins. Co. 92 92 1,110 $99,786 $208,390 208.84% 0.49% 0.24Life Investors Ins. Co. of America 69 69 682 $94,476 $0 0.00% 0.46% 0.21Combined Ins. Co. of America 77 86 999 $83,425 $97,212 116.53% 0.41% 0.17Washington National Ins. Co. 32 32 396 $51,535 $84,724 164.40% 0.25% 0.06Berkshire Life Ins. Co. of America 15 15 180 $49,583 $0 0.00% 0.24% 0.06Medamerica Ins. Co. 28 28 304 $48,989 $0 0.00% 0.24% 0.06Conseco Senior Health Ins. Co. 24 30 391 $45,386 $54,588 120.27% 0.22% 0.05American Fidelity Assurance Co. 32 32 363 $44,626 $70,862 158.79% 0.22% 0.05United American Ins. Co. 25 32 305 $39,178 $25,077 64.01% 0.19% 0.04Lincoln National Life Ins. Co. 17 17 219 $34,013 $0 0.00% 0.17% 0.03Transamerica Life Ins. Co. 16 19 180 $21,697 $0 0.00% 0.11% 0.01Cincinnati Life Ins. Co. 6 6 72 $16,247 $1,718 10.57% 0.08% 0.01Country Life Ins. Co. 6 6 72 $14,978 $0 0.00% 0.07% 0.01United of Omaha Life Ins. Co. 13 13 111 $14,547 $0 0.00% 0.07% 0.01Kanawha Ins. Co. 10 10 126 $14,389 $0 0.00% 0.07% 0.00Genworth Life & Annuity Ins. Co. 33 33 396 $13,148 $26,419 200.94% 0.06% 0.00Continental General Ins. Co. 7 13 120 $11,877 $3,397 28.60% 0.06% 0.00State Life Ins. Co. 9 9 108 $8,938 $5,000 55.94% 0.04% 0.00Reassure America Life Ins. Co. 6 6 90 $7,889 $11,424 144.81% 0.04% 0.00Medico Ins. Co. 3 3 36 $5,701 ($19,708) -345.69% 0.03% 0.00Equitable Life & Casualty Ins. Co. 3 4 45 $5,690 $0 0.00% 0.03% 0.00American Heritage Life Ins. Co. 0 0 0 $5,558 $90,586 1629.83% 0.03% 0.00Medico Life Ins. Co. 3 3 36 $4,801 $67 1.40% 0.02% 0.00Allianz Life Ins. Co. of North America 3 3 36 $4,739 $0 0.00% 0.02% 0.00Genesis Ins. Co. 1 1 12 $3,947 $0 0.00% 0.02% 0.00Loyal American Life Ins. Co. 3 3 25 $2,842 $0 0.00% 0.01% 0.00American Pioneer Life Ins. Co. 2 2 24 $2,098 $0 0.00% 0.01% 0.00Continental Life Ins. Co. of Brentwood, TN 1 1 12 $1,288 $0 0.00% 0.01% 0.00Standard Life & Accident Ins. Co. 2 2 24 $1,263 $0 0.00% 0.01% 0.00Pennsylvania Life Ins. Co. 3 3 36 $1,181 $0 0.00% 0.01% 0.00Guarantee Trust Life Ins. Co. 1 1 12 $634 $0 0.00% 0.00% 0.00Unified Life Ins. Co. 3 3 9 $466 $0 0.00% 0.00% 0.00TOTALS 13,348 14,464 109,059 $20,501,038 $10,477,409 51.11% 100.00% 1,689.75

Individual LTC (Non-Tax Qualified) Policies Lives Member Months Premium Earned Claims Incurred Loss Ratio Market Share HHIRiversource Life Ins. Co. 1,019 1,019 12,228 $1,219,207 $444,345 36.45% 26.33% 693.24Conseco Senior Health Ins. Co. 390 440 5,729 $665,668 $800,626 120.27% 14.38% 206.65American Network Ins. Co. 270 270 3,240 $516,187 $496,648 96.21% 11.15% 124.26Bankers Life and Casualty Co. 394 498 6,672 $463,761 $192,378 41.48% 10.02% 100.30Mutual of Omaha Ins. Co. 281 281 3,285 $374,682 $412,323 110.05% 8.09% 65.47MetLife Ins. Co. of Connecticut 160 160 1,920 $312,044 $266,751 85.49% 6.74% 45.41Allianz Life Ins. Co. of North America 185 212 2,520 $223,959 $78,566 35.08% 4.84% 23.39American Family Life Assurance Co. 160 160 1,761 $180,898 $123,218 68.11% 3.91% 15.26John Hancock Life Ins. Co. 90 682 1,080 $152,536 $123,517 80.98% 3.29% 10.85Continental General Ins. Co. 47 93 862 $137,788 $74,200 53.85% 2.98% 8.85United American Ins. Co. 66 67 762 $81,091 $215,496 265.75% 1.75% 3.07Kanawha Ins. Co. 38 38 438 $53,665 $0 0.00% 1.16% 1.34Physicians Mutual Ins. Co. 35 35 386 $49,848 $22,590 45.32% 1.08% 1.16State Life Ins. Co. 19 19 228 $40,379 $0 0.00% 0.87% 0.76AIG Life Ins. Co. 20 25 300 $39,467 $0 0.00% 0.85% 0.73Standard Life & Accident Ins. Co. 21 27 324 $25,271 $47,045 186.16% 0.55% 0.30New York Life Ins. Co. 18 18 223 $23,094 $33,618 145.57% 0.50% 0.25Lincoln Benefit Life Co. 9 15 180 $18,878 $0 0.00% 0.41% 0.17Reassure America Life Ins. Co. 17 36 444 $17,107 $34,986 204.51% 0.37% 0.14Transamerica Life Ins. Co. 10 10 120 $9,849 $33,232 337.41% 0.21% 0.05Conseco Health Ins. Co. 3 3 36 $6,108 $1,660 27.18% 0.13% 0.02Union Bankers Ins. Co. 10 10 120 $5,728 $0 0.00% 0.12% 0.02United National Life Ins. Co. of America 5 5 60 $4,452 $0 0.00% 0.10% 0.01Old American Ins. Co. 5 5 66 $3,167 $8,225 259.71% 0.07% 0.00Equitable Life & Casualty Ins. Co. 1 1 12 $1,337 $0 0.00% 0.03% 0.00Transamerica Occidental Life Ins. Co. 1 1 12 $1,328 $23,020 1733.43% 0.03% 0.00Union Security Ins. Co. 1 1 12 $1,325 $0 0.00% 0.03% 0.00Principal Life Ins. Co. 13 13 156 $1,077 $0 0.00% 0.02% 0.00Monumental Life Ins. Co. 1 1 12 $768 $0 0.00% 0.02% 0.00Primerica Life Ins. Co. 0 0 0 ($75) $0 0.00% 0.00% 0.00TOTALS 3,289 4,145 43,188 $4,630,594 $3,432,444 74.13% 100.00% 1,301.70
Total Indiv. LTC (Tax & Non-Tax Qual.) Policies Lives Member Months Premium Earned Claims Incurred Loss Ratio Market Share HHIGenworth Life Ins. Co. 4,448 4,988 0 7,356,997 4,025,283 54.71% 29.27% 856.96Bankers Life and Casualty Co. 2,166 2,711 36,300 3,502,587 1,965,025 56.10% 13.94% 194.24Northwestern Long Term Care Ins. Co. 1,066 1,066 11,873 1,621,385 416,292 25.68% 6.45% 41.62Metropolitan Life Ins. Co. 590 590 7,080 1,353,472 (75,199) -5.56% 5.39% 29.00John Hancock Life Ins. Co. 772 1,364 9,264 1,308,421 1,059,499 80.98% 5.21% 27.11Riversource Life Ins. Co. 1,019 1,019 12,228 1,219,207 444,345 36.45% 4.85% 23.53American Network Ins. Co. 407 407 4,884 786,229 539,666 68.64% 3.13% 9.79Conseco Senior Health Ins. Co. 414 470 6,120 711,054 855,214 120.27% 2.83% 8.01Mutual of Omaha Ins. Co. 437 437 5,157 702,235 526,211 74.93% 2.79% 7.81
Teachers Ins. & Annuity Association of America 302 302 3,624 613,224 513,085 83.67% 2.44% 5.95Unum Life Ins. Co. of America 343 343 0 504,445 235,039 46.59% 2.01% 4.03New York Life Ins. Co. 386 386 4,598 480,520 267,135 55.59% 1.91% 3.66Prudential Ins. Co. of America 239 239 2,868 414,990 43,779 10.55% 1.65% 2.73TIAA-CREF Life Ins. Co. 176 176 2,112 379,349 0 0.00% 1.51% 2.28Massachusetts Mutual Life Ins. Co. 108 175 1,262 360,355 (154,366) -42.84% 1.43% 2.06Principal Life Ins. Co. 245 245 2,906 342,212 228,435 66.75% 1.36% 1.85American Family Life Assurance Co. 311 347 3,820 331,525 225,817 68.11% 1.32% 1.74MetLife Ins. Co. of Connecticut 160 160 1,920 312,044 266,751 85.49% 1.24% 1.54Continental Casualty Co. 571 571 7,065 237,839 1,015,710 427.06% 0.95% 0.90Allianz Life Ins. Co. of North America 188 215 2,556 228,698 78,566 34.35% 0.91% 0.83United Teacher Associates Ins. Co. 271 271 3,168 199,411 62,220 31.20% 0.79% 0.63Provident Life and Accident Ins. Co. 105 105 0 163,382 0 0.00% 0.65% 0.42Continental General Ins. Co. 54 106 982 149,665 77,597 51.85% 0.60% 0.35Lincoln Benefit Life Co. 48 54 888 143,502 0 0.00% 0.57% 0.33Monumental Life Ins. Co. 196 196 2,400 134,844 0 0.00% 0.54% 0.29United American Ins. Co. 91 99 1,067 120,269 240,573 200.03% 0.48% 0.23Union Security Ins. Co. 87 87 1,044 115,317 0 0.00% 0.46% 0.21Transamerica Occidental Life Ins. Co. 63 63 555 115,124 115,758 100.55% 0.46% 0.21John Alden Life Ins. Co. 69 69 828 109,757 32 0.03% 0.44% 0.19State Farm Mutual Automobile Ins. Co. 551 551 6,547 101,935 212,954 208.91% 0.41% 0.16Great American Life Ins. Co. 84 84 918 101,600 0 0.00% 0.40% 0.16Time Ins. Co. 92 92 1,110 99,786 208,390 208.84% 0.40% 0.16Life Investors Ins. Co. of America 69 69 682 94,476 0 0.00% 0.38% 0.14Combined Ins. Co. of America 77 86 999 83,425 97,212 116.53% 0.33% 0.11Kanawha Ins. Co. 48 48 564 68,054 0 0.00% 0.27% 0.07Washington National Ins. Co. 32 32 396 51,535 84,724 164.40% 0.21% 0.04Physicians Mutual Ins. Co. 35 35 386 49,848 22,590 45.32% 0.20% 0.04Berkshire Life Ins. Co. of America 15 15 180 49,583 0 0.00% 0.20% 0.04State Life Ins. Co. 28 28 336 49,317 5,000 10.14% 0.20% 0.04Medamerica Ins. Co. 28 28 304 48,989 0 0.00% 0.19% 0.04American Fidelity Assurance Co. 32 32 363 44,626 70,862 158.79% 0.18% 0.03AIG Life Ins. Co. 20 25 300 39,467 0 0.00% 0.16% 0.02Lincoln National Life Ins. Co. 17 17 219 34,013 0 0.00% 0.14% 0.02Transamerica Life Ins. Co. 26 29 300 31,546 33,232 105.34% 0.13% 0.02Standard Life & Accident Ins. Co. 23 29 348 26,534 47,045 177.30% 0.11% 0.01Reassure America Life Ins. Co. 23 42 534 24,996 46,410 185.67% 0.10% 0.01Cincinnati Life Ins. Co. 6 6 72 16,247 1,718 10.57% 0.06% 0.00Country Life Ins. Co. 6 6 72 14,978 0 0.00% 0.06% 0.00United of Omaha Life Ins. Co. 13 13 111 14,547 0 0.00% 0.06% 0.00Genworth Life & Annuity Ins. Co. 33 33 396 13,148 26,419 200.94% 0.05% 0.00Equitable Life & Casualty Ins. Co. 4 5 57 7,027 0 0.00% 0.03% 0.00Conseco Health Ins. Co. 3 3 36 6,108 1,660 27.18% 0.02% 0.00Union Bankers Ins. Co. 10 10 120 5,728 0 0.00% 0.02% 0.00
Total Indiv. LTC (Tax & Non-Tax Qual.) Policies Lives Member Months Premium Earned Claims Incurred Loss Ratio Market Share HHI

Total Indiv. LTC (Tax & Non-Tax Qual.) Policies Lives Member Months Premium Earned Claims Incurred Loss Ratio Market Share HHIMedico Ins. Co. 3 3 36 5,701 (19,708) -345.69% 0.02% 0.00American Heritage Life Ins. Co. 0 0 0 5,558 90,586 1629.83% 0.02% 0.00Medico Life Ins. Co. 3 3 36 4,801 67 1.40% 0.02% 0.00United National Life Ins. Co. of America 5 5 60 4,452 0 0.00% 0.02% 0.00Genesis Ins. Co. 1 1 12 3,947 0 0.00% 0.02% 0.00Old American Ins. Co. 5 5 66 3,167 8,225 259.71% 0.01% 0.00Loyal American Life Ins. Co. 3 3 25 2,842 0 0.00% 0.01% 0.00American Pioneer Life Ins. Co. 2 2 24 2,098 0 0.00% 0.01% 0.00Continental Life Ins. Co. of Brentwood, TN 1 1 12 1,288 0 0.00% 0.01% 0.00Pennsylvania Life Ins. Co. 3 3 36 1,181 0 0.00% 0.00% 0.00Guarantee Trust Life Ins. Co. 1 1 12 634 0 0.00% 0.00% 0.00Unified Life Ins. Co. 3 3 9 466 0 0.00% 0.00% 0.00Primerica Life Ins. Co. 0 0 0 (75) 0 0.00% 0.00% 0.00TOTALS 16,637 18,609 152,247 25,131,632 13,909,853 55.35% 100.00% 1,229.62
Indiv. Medicare Supp. (Standardized) Policies Lives Member Months Premium Earned Claims Incurred Loss Ratio Market Share HHIHighmark West Virginia, Inc. 8,179 8,179 101,292 $21,257,822 $15,495,466 72.89% 37.03% 1,371.29Mutual of Omaha Ins. Co. 2,132 2,132 25,577 $5,917,172 $3,596,052 60.77% 10.31% 106.25Bankers Life and Casualty Co. 2,007 2,007 26,906 $5,066,064 $2,980,354 58.83% 8.83% 77.88United World Life Ins. Co. 3,427 3,427 33,570 $4,485,658 $3,224,915 71.89% 7.81% 61.06United American Ins. Co. 1,290 1,290 16,698 $3,917,129 $2,482,713 63.38% 6.82% 46.56State Farm Mutual Automobile Ins. Co. 1,587 1,587 19,465 $3,430,894 $2,007,573 58.51% 5.98% 35.72Bankers Fidelity Life Ins. Co. 1,200 1,200 15,523 $3,098,978 $1,874,387 60.48% 5.40% 29.14Continental General Ins. Co. 628 628 8,177 $1,397,670 $923,693 66.09% 2.43% 5.93Constitution Life Ins. Co. 645 645 7,740 $1,347,082 $872,759 64.79% 2.35% 5.51United Teacher Associates Ins. Co. 435 435 5,201 $973,646 $662,717 68.07% 1.70% 2.88Combined Ins. Co. of America 282 337 3,654 $822,436 $523,270 63.62% 1.43% 2.05Standard Life & Accident Ins. Co. 354 354 4,248 $774,435 $585,672 75.63% 1.35% 1.82Physicians Mutual Ins. Co. 234 241 2,545 $722,021 $454,036 62.88% 1.26% 1.58Ord of Utd Comm'l Trav. of Amer.-Frtnl 1,028 1,028 7,302 $703,560 $481,319 68.41% 1.23% 1.50Provident American Life & Health Ins. Co. 216 216 2,322 $356,760 $242,930 68.09% 0.62% 0.39Golden Rule Ins. Co. 193 193 2,390 $319,378 $234,725 73.49% 0.56% 0.31Washington National Ins. Co. 76 76 1,014 $281,352 $117,691 41.83% 0.49% 0.24Humana Ins. Co. 268 268 2,071 $273,361 $198,653 72.67% 0.48% 0.23American Family Life Assurance Co. 70 70 830 $223,265 $121,546 54.44% 0.39% 0.15USAA Life Ins. Co. 147 147 1,638 $222,420 $167,464 75.29% 0.39% 0.15American General Life and Accident Ins. Co. 60 60 810 $201,941 $96,201 47.64% 0.35% 0.12Genworth Life & Annuity Ins. Co. 65 65 780 $196,731 $111,629 56.74% 0.34% 0.12Continental Life Ins. Co. of Brentwood, TN 79 79 930 $165,593 $89,537 54.07% 0.29% 0.08Allianz Life Ins. Co. of North America 18 24 288 $154,322 $0 0.00% 0.27% 0.07Lincoln Heritage Life Ins. Co. 48 48 559 $109,325 $73,538 67.27% 0.19% 0.04Shenandoah Life Ins. Co. 89 89 642 $95,983 $35,901 37.40% 0.17% 0.03Union Bankers Ins. Co. 22 22 264 $79,850 $22,308 27.94% 0.14% 0.02Central Reserve Life Ins. Co. 38 38 502 $76,541 $41,733 54.52% 0.13% 0.02New York Life Ins. Co. 28 28 336 $73,241 $50,769 69.32% 0.13% 0.02Pacificare Life & Health Ins. Co. 25 25 408 $72,653 $59,423 81.79% 0.13% 0.02Conseco Ins. Co. 37 37 534 $60,113 $16,653 27.70% 0.10% 0.01Central States Health & Life Co. of Omaha 22 22 289 $59,830 $28,843 48.21% 0.10% 0.01Globe Life and Accident Ins. Co. 38 38 419 $51,099 $22,010 43.07% 0.09% 0.01Colonial Penn Life Ins. Co. 28 28 360 $39,423 $23,180 58.80% 0.07% 0.00Sterling Life Ins. Co. 15 15 169 $39,144 $29,100 74.34% 0.07% 0.00American Pioneer Life Ins. Co. 20 20 240 $38,633 $30,596 79.20% 0.07% 0.00United National Life Ins. Co. of America 6 6 92 $33,486 $15,493 46.27% 0.06% 0.00American Republic Ins. Co. 10 10 0 $32,418 $11,410 35.20% 0.06% 0.00Monumental Life Ins. Co. 17 17 210 $29,727 $11,185 37.63% 0.05% 0.00Central Benefits National Life Ins. Co. 11 11 132 $23,563 $11,867 50.36% 0.04% 0.00Unicare Life & Health Ins. Co. 1 1 9 $22,635 ($2,119) -9.36% 0.04% 0.00Medico Life Ins. Co. 6 6 72 $20,992 $22,013 104.86% 0.04% 0.00Oxford Life Ins. Co. 5 5 12 $17,490 $4,789 27.38% 0.03% 0.00Medico Ins. Co. 6 6 72 $16,724 $11,936 71.37% 0.03% 0.00American Income Life Ins. Co. 5 5 66 $15,996 $4,214 26.34% 0.03% 0.00Guarantee Trust Life Ins. Co. 16 16 87 $13,638 $23,468 172.08% 0.02% 0.00Genworth Life Ins. Co. 8 8 0 $12,327 $3,768 30.57% 0.02% 0.00Life Investors Ins. Co. of America 2 2 24 $9,084 $793 8.73% 0.02% 0.00Marquette National Life Ins. Co. 16 16 192 $8,629 $896 10.38% 0.02% 0.00Equitable Life & Casualty Ins. Co. 3 3 40 $8,088 $7,769 96.06% 0.01% 0.00Conseco Senior Health Ins. Co. 4 4 48 $7,005 $6,552 93.53% 0.01% 0.00Physicians Life Ins. Co. 5 5 60 $6,551 $7,467 113.98% 0.01% 0.00HCC Life Ins. Co. 1 1 12 $4,769 ($717) -15.03% 0.01% 0.00Christian Fidelity Life Ins. Co. 2 2 12 $4,327 $502 11.60% 0.01% 0.00American Progressive Life & Health Ins. Co. 13 13 156 $3,695 $29,775 805.82% 0.01% 0.00Jefferson National Life Ins. Co. 1 1 6 $3,417 $837 24.50% 0.01% 0.00National Guardian Life Ins. Co. 2 2 24 $1,852 $3,155 170.36% 0.00% 0.00Time Ins. Co. 0 0 0 $1,586 $0 0.00% 0.00% 0.00Union Labor Life Ins. Co. 1 1 12 $1,506 $150 9.96% 0.00% 0.00Aetna Life Ins. Co. 1 1 12 $620 $0 0.00% 0.00% 0.00World Corp Ins. Co. 0 0 0 $24 $0 0.00% 0.00% 0.00American Community Mutual Ins. 0 0 0 $0 ($1,391) ---- 0.00% 0.00World Ins. Co. 3 3 36 $0 $0 ---- 0.00% 0.00Country Life Ins. Co. 0 0 0 $0 $69 ---- 0.00% 0.00TOTALS 25,175 25,243 297,079 $57,405,674 $38,153,237 66.46% 100.00% 1,751.22

Indiv. Med. Supp. (Pre-Std) Policies Lives Member Months Premium Earned Claims Incurred Loss Ratio Market Share HHIAmerican Network Ins. Co. 885 885 10,620 $2,473,205 $1,652,772 66.83% 30.36% 921.67Bankers Life and Casualty Co. 527 534 7,434 $1,350,847 $768,488 56.89% 16.58% 274.96United American Ins. Co. 384 384 4,986 $1,132,045 $707,998 62.54% 13.90% 193.10State Farm Mutual Automobile Ins. Co. 239 247 3,107 $649,206 $438,892 67.60% 7.97% 63.51American Family Life Assurance Co. 181 181 2,146 $540,839 $335,867 62.10% 6.64% 44.07Unicare Life & Health Ins. Co. 76 76 775 $357,825 $853,285 238.46% 4.39% 19.29Combined Ins. Co. of America 75 89 961 $259,796 $131,008 50.43% 3.19% 10.17Mutual of Omaha Ins. Co. 63 63 756 $200,881 $91,142 45.37% 2.47% 6.08Continental General Ins. Co. 64 64 854 $196,759 $139,830 71.07% 2.42% 5.83American General Life and Accident Ins. Co. 45 45 594 $178,845 $62,914 35.18% 2.20% 4.82Golden Rule Ins. Co. 27 27 319 $129,727 $76,740 59.15% 1.59% 2.54Physicians Mutual Ins. Co. 28 33 376 $99,227 $45,541 45.90% 1.22% 1.48United Teacher Associates Ins. Co. 21 21 252 $62,817 $24,969 39.75% 0.77% 0.59Union Bankers Ins. Co. 24 24 288 $59,244 $64,754 109.30% 0.73% 0.53Celtic Ins. Co. 18 18 234 $54,974 $30,534 55.54% 0.67% 0.46Conseco Health Ins. Co. 14 14 264 $50,452 $24,512 48.58% 0.62% 0.38Conseco Senior Health Ins. Co. 24 24 294 $42,033 $39,312 93.53% 0.52% 0.27Union Fidelity Life Ins. Co. 29 29 348 $40,436 $49,374 122.10% 0.50% 0.25Colonial Penn Life Ins. Co. 17 17 222 $37,306 $42,014 112.62% 0.46% 0.21New York Life Ins. Co. 15 15 180 $37,068 $21,272 57.39% 0.46% 0.21Washington National Ins. Co. 12 12 162 $33,808 $14,142 41.83% 0.41% 0.17New England Life Ins. Co. 28 31 380 $25,703 $92,093 358.30% 0.32% 0.10American Republic Ins. Co. 9 9 0 $21,428 $5,634 26.29% 0.26% 0.07Loyal American Life Ins. Co. 9 9 98 $13,723 $13,646 99.44% 0.17% 0.03Continental Life Ins. Co. of Brentwood, TN 4 4 48 $13,596 $0 0.00% 0.17% 0.03Standard Life & Accident Ins. Co. 7 7 72 $13,414 $296 2.21% 0.16% 0.03Unified Life Ins. Co. 36 45 135 $11,071 $30,837 278.54% 0.14% 0.02Jackson National Life Ins. Co. 4 4 48 $8,780 $1,342 15.28% 0.11% 0.01Ord of Utd Comm'l Trav. of Amer.-Frtnl 6 6 78 $8,432 $3,907 46.34% 0.10% 0.01American Pioneer Life Ins. Co. 4 4 48 $7,874 $5,826 73.99% 0.10% 0.01Monumental Life Ins. Co. 2 2 24 $5,554 $0 0.00% 0.07% 0.00Globe Life and Accident Ins. Co. 2 2 35 $5,183 $13,573 261.88% 0.06% 0.00AIG Premier Ins. Co. 5 5 60 $5,179 $3,828 73.91% 0.06% 0.00World Ins. Co. 3 3 47 $5,074 $2,205 43.46% 0.06% 0.00Medico Ins. Co. 3 3 36 $4,348 ($39) -0.90% 0.05% 0.00Gerber Life Ins. Co. 3 3 36 $4,185 $104 2.49% 0.05% 0.00National States Ins. Co. 2 2 24 $2,032 $2,741 134.89% 0.02% 0.00Equitable Life & Casualty Ins. Co. 0 0 7 $1,656 $4,734 285.87% 0.02% 0.00Prudential Ins. Co. of America 1 1 12 $1,351 $1,708 126.42% 0.02% 0.00Old American Ins. Co. 1 1 12 $340 ($12) -3.53% 0.00% 0.00American Capitol Ins. Co. 0 0 1 $196 $0 0.00% 0.00% 0.00World Corp Ins. Co. 0 0 0 $70 $1,646 2351.43% 0.00% 0.00American National Ins. Co. 0 0 0 $0 ($4,076) ---- 0.00% 0.00TOTALS 2,897 2,943 36,373 $8,146,529 $5,795,353 71.14% 100.00% 1,550.91
Total Indiv. Medicare Supplement Policies Lives Member Months Premium Earned Claims Incurred Loss Ratio Market Share HHIHighmark West Virginia, Inc. 8,179 8,179 101,292 $21,257,822 $15,495,466 72.89% 32.43% 1,051.63Bankers Life and Casualty Co. 2,534 2,541 34,340 $6,416,911 $3,748,842 58.42% 9.79% 95.82Mutual of Omaha Ins. Co. 2,195 2,195 26,333 $6,118,053 $3,687,194 60.27% 9.33% 87.11United American Ins. Co. 1,674 1,674 21,684 $5,049,174 $3,190,711 63.19% 7.70% 59.33United World Life Ins. Co. 3,427 3,427 33,570 $4,485,658 $3,224,915 71.89% 6.84% 46.82State Farm Mutual Automobile Ins. Co. 1,826 1,834 22,572 $4,080,100 $2,446,465 59.96% 6.22% 38.74Bankers Fidelity Life Ins. Co. 1,200 1,200 15,523 $3,098,978 $1,874,387 60.48% 4.73% 22.35American Network Ins. Co. 885 885 10,620 $2,473,205 $1,652,772 66.83% 3.77% 14.23Continental General Ins. Co. 692 692 9,031 $1,594,429 $1,063,523 66.70% 2.43% 5.92Constitution Life Ins. Co. 645 645 7,740 $1,347,082 $872,759 64.79% 2.05% 4.22Combined Ins. Co. of America 357 426 4,615 $1,082,232 $654,278 60.46% 1.65% 2.73United Teacher Associates Ins. Co. 456 456 5,453 $1,036,463 $687,686 66.35% 1.58% 2.50Physicians Mutual Ins. Co. 262 274 2,921 $821,248 $499,577 60.83% 1.25% 1.57Standard Life & Accident Ins. Co. 361 361 4,320 $787,849 $585,968 74.38% 1.20% 1.44American Family Life Assurance Co. 251 251 2,976 $764,104 $457,413 59.86% 1.17% 1.36Ord of Utd Comm'l Trav. of Amer.-Frtnl 1,034 1,034 7,380 $711,992 $485,226 68.15% 1.09% 1.18Golden Rule Ins. Co. 220 220 2,709 $449,105 $311,465 69.35% 0.69% 0.47American General Life and Accident Ins. Co. 105 105 1,404 $380,786 $159,115 41.79% 0.58% 0.34Unicare Life & Health Ins. Co. 77 77 784 $380,460 $851,166 223.72% 0.58% 0.34Provident American Life & Health Ins. Co. 216 216 2,322 $356,760 $242,930 68.09% 0.54% 0.30Washington National Ins. Co. 88 88 1,176 $315,160 $131,833 41.83% 0.48% 0.23Humana Ins. Co. 268 268 2,071 $273,361 $198,653 72.67% 0.42% 0.17USAA Life Ins. Co. 147 147 1,638 $222,420 $167,464 75.29% 0.34% 0.12Genworth Life & Annuity Ins. Co. 65 65 780 $196,731 $111,629 56.74% 0.30% 0.09Continental Life Ins. Co. of Brentwood, TN 83 83 978 $179,189 $89,537 49.97% 0.27% 0.07Allianz Life Ins. Co. of North America 18 24 288 $154,322 $0 0.00% 0.24% 0.06Union Bankers Ins. Co. 46 46 552 $139,094 $87,062 62.59% 0.21% 0.05New York Life Ins. Co. 43 43 516 $110,309 $72,041 65.31% 0.17% 0.03Lincoln Heritage Life Ins. Co. 48 48 559 $109,325 $73,538 67.27% 0.17% 0.03Shenandoah Life Ins. Co. 89 89 642 $95,983 $35,901 37.40% 0.15% 0.02Colonial Penn Life Ins. Co. 45 45 582 $76,729 $65,194 84.97% 0.12% 0.01Central Reserve Life Ins. Co. 38 38 502 $76,541 $41,733 54.52% 0.12% 0.01Pacificare Life & Health Ins. Co. 25 25 408 $72,653 $59,423 81.79% 0.11% 0.01Conseco Ins. Co. 37 37 534 $60,113 $16,653 27.70% 0.09% 0.01Central States Health & Life Co. of Omaha 22 22 289 $59,830 $28,843 48.21% 0.09% 0.01Globe Life and Accident Ins. Co. 40 40 454 $56,282 $35,583 63.22% 0.09% 0.01Celtic Ins. Co. 18 18 234 $54,974 $30,534 55.54% 0.08% 0.01American Republic Ins. Co. 19 19 0 $53,846 $17,044 31.65% 0.08% 0.01Conseco Health Ins. Co. 14 14 264 $50,452 $24,512 48.58% 0.08% 0.01
Total Indiv. Medicare Supplement Policies Lives Member Months Premium Earned Claims Incurred Loss Ratio Market Share HHI

Total Indiv. Medicare Supplement Policies Lives Member Months Premium Earned Claims Incurred Loss Ratio Market Share HHIConseco Senior Health Ins. Co. 28 28 342 $49,038 $45,864 93.53% 0.07% 0.01American Pioneer Life Ins. Co. 24 24 288 $46,507 $36,422 78.32% 0.07% 0.01Union Fidelity Life Ins. Co. 29 29 348 $40,436 $49,374 122.10% 0.06% 0.00Sterling Life Ins. Co. 15 15 169 $39,144 $29,100 74.34% 0.06% 0.00Monumental Life Ins. Co. 19 19 234 $35,281 $11,185 31.70% 0.05% 0.00United National Life Ins. Co. of America 6 6 92 $33,486 $15,493 46.27% 0.05% 0.00New England Life Ins. Co. 28 31 380 $25,703 $92,093 358.30% 0.04% 0.00Central Benefits National Life Ins. Co. 11 11 132 $23,563 $11,867 50.36% 0.04% 0.00Medico Ins. Co. 9 9 108 $21,072 $11,897 56.46% 0.03% 0.00Medico Life Ins. Co. 6 6 72 $20,992 $22,013 104.86% 0.03% 0.00Oxford Life Ins. Co. 5 5 12 $17,490 $4,789 27.38% 0.03% 0.00American Income Life Ins. Co. 5 5 66 $15,996 $4,214 26.34% 0.02% 0.00Loyal American Life Ins. Co. 9 9 98 $13,723 $13,646 99.44% 0.02% 0.00Guarantee Trust Life Ins. Co. 16 16 87 $13,638 $23,468 172.08% 0.02% 0.00Genworth Life Ins. Co. 8 8 0 $12,327 $3,768 30.57% 0.02% 0.00Unified Life Ins. Co. 36 45 135 $11,071 $30,837 278.54% 0.02% 0.00Equitable Life & Casualty Ins. Co. 3 3 47 $9,744 $12,503 128.31% 0.01% 0.00Life Investors Ins. Co. of America 2 2 24 $9,084 $793 8.73% 0.01% 0.00Jackson National Life Ins. Co. 4 4 48 $8,780 $1,342 15.28% 0.01% 0.00Marquette National Life Ins. Co. 16 16 192 $8,629 $896 10.38% 0.01% 0.00Physicians Life Ins. Co. 5 5 60 $6,551 $7,467 113.98% 0.01% 0.00AIG Premier Ins. Co. 5 5 60 $5,179 $3,828 73.91% 0.01% 0.00World Ins. Co. 6 6 83 $5,074 $2,205 43.46% 0.01% 0.00HCC Life Ins. Co. 1 1 12 $4,769 ($717) -15.03% 0.01% 0.00Christian Fidelity Life Ins. Co. 2 2 12 $4,327 $502 11.60% 0.01% 0.00Gerber Life Ins. Co. 3 3 36 $4,185 $104 2.49% 0.01% 0.00American Progressive Life & Health Ins. Co. 13 13 156 $3,695 $29,775 805.82% 0.01% 0.00Jefferson National Life Ins. Co. 1 1 6 $3,417 $837 24.50% 0.01% 0.00National States Ins. Co. 2 2 24 $2,032 $2,741 134.89% 0.00% 0.00National Guardian Life Ins. Co. 2 2 24 $1,852 $3,155 170.36% 0.00% 0.00Time Ins. Co. 0 0 0 $1,586 $0 0.00% 0.00% 0.00Union Labor Life Ins. Co. 1 1 12 $1,506 $150 9.96% 0.00% 0.00Prudential Ins. Co. of America 1 1 12 $1,351 $1,708 126.42% 0.00% 0.00Aetna Life Ins. Co. 1 1 12 $620 $0 0.00% 0.00% 0.00Old American Ins. Co. 1 1 12 $340 ($12) -3.53% 0.00% 0.00American Capitol Ins. Co. 0 0 1 $196 $0 0.00% 0.00% 0.00World Corp Ins. Co. 0 0 0 $94 $1,646 1751.06% 0.00% 0.00American Community Mutual Ins. 0 0 0 $0 ($1,391) ---- 0.00% 0.00American National Ins. Co. 0 0 0 $0 ($4,076) ---- 0.00% 0.00Country Life Ins. Co. 0 0 0 $0 $69 ---- 0.00% 0.00TOTALS 28,072 28,186 333,452 $65,552,203 $43,948,590 67.04% 100.00% 1,439.38
Individual Dental Policies Lives Member Months Premium Earned Claims Incurred Loss Ratio Market Share HHIAmerican Family Life Assurance Co. 2,503 4,505 51,292 $1,245,793 $233,956 18.78% 95.91% 9,199.60Continental General Ins. Co. 43 73 1,022 $31,798 $15,340 48.24% 2.45% 5.99Time Ins. Co. 51 100 413 $4,167 $1,113 26.71% 0.32% 0.10Central Reserve Life Ins. Co. 3 3 84 $3,485 $1,038 29.78% 0.27% 0.07Dental Choice, Inc. 10 27 76 $3,091 $3,140 101.59% 0.24% 0.06Renaissance Life & Health Ins. Co. of America 5 7 84 $2,802 $1,135 40.51% 0.22% 0.05John Alden Life Ins. Co. 16 28 125 $2,371 $1,067 45.00% 0.18% 0.03Mutual of Omaha Ins. Co. 11 12 144 $2,108 $645 30.60% 0.16% 0.03American Public Life Ins. Co. 1 1 12 $1,153 $496 43.02% 0.09% 0.01Unicare Life & Health Ins. Co. 1 1 14 $553 $388 70.16% 0.04% 0.00HumanaDental Ins. Co. 0 0 0 $515 $231 44.85% 0.04% 0.00Constitution Life Ins. Co. 2 2 24 $480 $190 39.58% 0.04% 0.00Kanawha Ins. Co. 1 2 24 $311 $472 151.77% 0.02% 0.00American Pioneer Life Ins. Co. 1 1 12 $154 $0 0.00% 0.01% 0.00Mega Life and Health Ins. Co. 0 0 20 $76 $0 0.00% 0.01% 0.00TOTALS 2,648 4,762 53,346 $1,298,857 $259,211 19.96% 100.00% 9,205.95
Individual Medicare Part C (PPO's) Policies Lives Member Months Premium Earned Claims Incurred Loss Ratio Market Share HHIHM Health Ins. Co. 4,647 4,647 51,183 $39,623,832 $30,026,071 75.78% 97.53% 9,512.24Humana Ins. Co. 151 151 1,286 $1,003,205 $858,864 85.61% 2.47% 6.10TOTALS 4,798 4,798 52,469 $40,627,037 $30,884,935 76.02% 100.00% 9,518.33
Individual Medicare Part C (PFFS's) Policies Lives Member Months Premium Earned Claims Incurred Loss Ratio Market Share HHIHumana Ins. Co. 6,658 6,658 78,170 $58,751,426 $50,298,249 85.61% 54.40% 2,958.98First Health Life & Health Ins. Co. 3,414 3,414 30,083 $23,566,221 $19,216,866 81.54% 21.82% 476.09American Progressive Life & Health Ins. Co. 2,601 2,601 31,212 $14,166,453 $10,574,154 74.64% 13.12% 172.04Wellcare Health Ins. of Illinois 1 738 7,057 $6,737,073 $3,793,461 56.31% 6.24% 38.91Pacificare Life & Health Ins. Co. 308 308 4,293 $3,239,501 $2,559,933 79.02% 3.00% 9.00Aetna Life Ins. Co. 125 125 1,424 $1,394,999 $1,655,367 118.66% 1.29% 1.67Sterling Life Ins. Co. 30 30 275 $154,341 $129,057 83.62% 0.14% 0.02UPMC Health Benefits, Cin 1 1,402 16,958 $0 $0 ---- 0.00% 0.00Marquette National Life Ins. Co. 0 0 0 ($4,154) $3,585 -86.30% 0.00% 0.00TOTALS 13,138 15,276 169,472 $108,005,860 $88,230,672 81.69% 100.00% 3,656.70

Total Individual Medicare Part C Policies Lives Member Months Premium Earned Claims Incurred Loss Ratio Market Share HHIHumana Ins. Co. 6,809 6,809 79,456 $59,754,631 $51,157,113 85.61% 40.20% 1,616.27HM Health Ins. Co. 4,647 4,647 51,183 $39,623,832 $30,026,071 75.78% 26.66% 710.69First Health Life & Health Ins. Co. 3,414 3,414 30,083 $23,566,221 $19,216,866 81.54% 15.86% 251.39American Progressive Life & Health Ins. Co. 2,601 2,601 31,212 $14,166,453 $10,574,154 74.64% 9.53% 90.84Wellcare Health Ins. of Illinois 1 738 7,057 $6,737,073 $3,793,461 56.31% 4.53% 20.55Pacificare Life & Health Ins. Co. 308 308 4,293 $3,239,501 $2,559,933 79.02% 2.18% 4.75Aetna Life Ins. Co. 125 125 1,424 $1,394,999 $1,655,367 118.66% 0.94% 0.88Sterling Life Ins. Co. 30 30 275 $154,341 $129,057 83.62% 0.10% 0.01UPMC Health Benefits, Cin 1 1,402 16,958 $0 $0 ---- 0.00% 0.00Marquette National Life Ins. Co. 0 0 0 ($4,154) $3,585 -86.30% 0.00% 0.00TOTALS 17,936 20,074 221,941 $148,632,897 $119,115,607 80.14% 100.00% 2,695.38
Individual Medicare Part D Policies Lives Member Months Premium Earned Claims Incurred Loss Ratio Market Share HHIHumana Ins. Co. 35,258 35,258 428,450 $41,450,524 $32,418,072 78.21% 38.44% 1,477.40Highmark Senior Resources, Inc. 12,595 12,595 152,859 $15,157,770 $15,282,945 100.83% 14.06% 197.56Wellcare Prescription Ins. 1 8,094 97,040 $9,709,477 $7,984,106 82.23% 9.00% 81.06Pennsylvania Life Ins. Co. 4,293 4,293 51,840 $7,207,597 $4,891,475 67.87% 6.68% 44.67Aetna Life Ins. Co. 4,862 4,862 61,527 $7,101,861 $3,780,225 53.23% 6.59% 43.37Silverscript Ins. Co. 3,931 3,931 47,907 $4,793,871 $3,409,629 71.12% 4.45% 19.76First Health Life & Health Ins. Co. 4,084 4,084 51,779 $4,469,856 $4,583,508 102.54% 4.14% 17.18Unicare Life & Health Ins. Co. 4,174 4,174 50,847 $4,440,503 $3,681,492 82.91% 4.12% 16.96QCC Ins. Co. 4,561 4,561 57,923 $4,274,470 $2,804,778 65.62% 3.96% 15.71Connecticut General Life Ins. Co. 1 3,082 36,984 $2,915,649 $2,900,473 99.48% 2.70% 7.31United American Ins. Co. 1,404 1,404 18,660 $1,967,622 $1,478,030 75.12% 1.82% 3.33Sierra Health and Life Ins. Co., Inc. 46 0 0 $1,407,313 $2,307,656 163.98% 1.30% 1.70Medco Containment Life Ins. Co. 989 989 15,853 $1,360,054 $835,266 61.41% 1.26% 1.59Avalon Ins. Co. 1,461 1,461 14,788 $697,515 $983,496 141.00% 0.65% 0.42Elder Health Ins. Co. 652 652 5,657 $363,220 $296,886 81.74% 0.34% 0.11Health Net Life Ins. Co. 1 0 0 $360,882 $2,139,479 592.85% 0.33% 0.11Envision Ins. Co. 64 64 622 $112,899 $89,161 78.97% 0.10% 0.01Sterling Life Ins. Co. 32 32 430 $76,802 $91,971 119.75% 0.07% 0.01UPMC Health Benefits, Cin 1 1,385 16,756 $0 $0 ---- 0.00% 0.00Pacificare Life & Health Ins. Co. 0 0 0 ($27,588) ($894,243) 3241.42% -0.03% 0.00TOTALS 78,410 90,921 1,109,922 $107,840,297 $89,064,405 82.59% 100.00% 1,928.27
Total Indiv. Medicare (Parts C & D) Policies Lives Member Months Premium Earned Claims Incurred Loss Ratio Market Share HHIHumana Ins. Co. 42,067 42,067 507,906 $101,205,155 $83,575,185 82.58% 39.46% 1,557.12HM Health Ins. Co. 4,647 4,647 51,183 $39,623,832 $30,026,071 75.78% 15.45% 238.69First Health Life & Health Ins. Co. 7,498 7,498 81,862 $28,036,077 $23,800,374 84.89% 10.93% 119.50Highmark Senior Resources, Inc. 12,595 12,595 152,859 $15,157,770 $15,282,945 100.83% 5.91% 34.93American Progressive Life & Health Ins. Co. 2,601 2,601 31,212 $14,166,453 $10,574,154 74.64% 5.52% 30.51Wellcare Prescription Ins. 1 8,094 97,040 $9,709,477 $7,984,106 82.23% 3.79% 14.33Aetna Life Ins. Co. 4,987 4,987 62,951 $8,496,860 $5,435,592 63.97% 3.31% 10.98Pennsylvania Life Ins. Co. 4,293 4,293 51,840 $7,207,597 $4,891,475 67.87% 2.81% 7.90Wellcare Health Ins. of Illinois 1 738 7,057 $6,737,073 $3,793,461 56.31% 2.63% 6.90Silverscript Ins. Co. 3,931 3,931 47,907 $4,793,871 $3,409,629 71.12% 1.87% 3.49Unicare Life & Health Ins. Co. 4,174 4,174 50,847 $4,440,503 $3,681,492 82.91% 1.73% 3.00QCC Ins. Co. 4,561 4,561 57,923 $4,274,470 $2,804,778 65.62% 1.67% 2.78Pacificare Life & Health Ins. Co. 308 308 4,293 $3,211,913 $1,665,690 51.86% 1.25% 1.57Connecticut General Life Ins. Co. 1 3,082 36,984 $2,915,649 $2,900,473 99.48% 1.14% 1.29United American Ins. Co. 1,404 1,404 18,660 $1,967,622 $1,478,030 75.12% 0.77% 0.59Sierra Health and Life Ins. Co., Inc. 46 0 0 $1,407,313 $2,307,656 163.98% 0.55% 0.30Medco Containment Life Ins. Co. 989 989 15,853 $1,360,054 $835,266 61.41% 0.53% 0.28Avalon Ins. Co. 1,461 1,461 14,788 $697,515 $983,496 141.00% 0.27% 0.07Elder Health Ins. Co. 652 652 5,657 $363,220 $296,886 81.74% 0.14% 0.02Health Net Life Ins. Co. 1 0 0 $360,882 $2,139,479 592.85% 0.14% 0.02Sterling Life Ins. Co. 62 62 705 $231,143 $221,028 95.62% 0.09% 0.01Envision Ins. Co. 64 64 622 $112,899 $89,161 78.97% 0.04% 0.00UPMC Health Benefits, Cin 2 2,787 33,714 $0 $0 ---- 0.00% 0.00Marquette National Life Ins. Co. 0 0 0 ($4,154) $3,585 -86.30% 0.00% 0.00TOTALS 96,346 110,995 1,331,863 $256,473,194 $208,180,012 81.17% 100.00% 2,034.27

Individual Other Lines (NOC) Policies Lives Member Months Premium Earned Claims Incurred Loss Ratio Market Share HHIUnicare Health Plan of West Virginia, Inc. 75,786 75,786 905,161 $141,231,132 $131,737,566 93.28% 74.22% 5,509.24The Health Plan of the Upper Ohio Valley 5,086 5,086 60,441 $46,504,361 $41,727,853 89.73% 24.44% 597.34Metropolitan Life Ins. Co. 616 616 7,392 $872,632 $444,780 50.97% 0.46% 0.21Physicians Mutual Ins. Co. 1,980 2,321 22,560 $641,243 $323,152 50.39% 0.34% 0.11Geisinger Indemnity Ins. Co. 440 440 3,864 $445,325 $402,991 90.49% 0.23% 0.05Protective Life Ins. Co. 1,036 1,036 12,432 $324,269 $299,177 92.26% 0.17% 0.03Cincinnati Life Ins. Co. 63 63 756 $63,793 $21,806 34.18% 0.03% 0.00Old Republic Ins. Co. 94 94 1,116 $58,766 $30,322 51.60% 0.03% 0.00Life Ins. Co. of North America 3 3 0 $42,200 $8,983 21.29% 0.02% 0.00American Heritage Life Ins. Co. 0 0 0 $34,564 $10,830 31.33% 0.02% 0.00New England Life Ins. Co. 29 29 348 $21,753 $3,324 15.28% 0.01% 0.00Federated Mutual Ins. Co. 2 2 28 $7,788 $6,353 81.57% 0.00% 0.00Bankers Fidelity Life Ins. Co. 12 12 152 $5,608 $2,183 38.93% 0.00% 0.00Sterling Life Ins. Co. 2 2 24 $4,088 $3,039 74.34% 0.00% 0.00Canada Life Assurance Co. (The) 3 3 36 $3,857 $529 13.72% 0.00% 0.00Reliastar Life Ins. Co. 4 4 0 $3,245 ($2,135) -65.79% 0.00% 0.00Mutual of Omaha Ins. Co. 139 139 1,668 $2,666 $840 31.51% 0.00% 0.00Renaissance Life & Health Ins. Co. of America 3 16 198 $2,131 ($5) -0.23% 0.00% 0.00National Safety Life Ins. Co. 14 14 168 $1,525 $15,286 1002.36% 0.00% 0.00Medico Ins. Co. 1 1 12 $1,432 $15,439 1078.14% 0.00% 0.00Union Labor Life Ins. Co. 1 1 12 $1,234 ($168) -13.61% 0.00% 0.00AAA Life Ins. Co. 1 1 12 $787 $284 36.09% 0.00% 0.00Primerica Life Ins. Co. 1 1 12 $767 $0 0.00% 0.00% 0.00Hartford Life & Annuity Ins. Co. 9 9 108 $460 $695 151.09% 0.00% 0.00Equitable Life & Casualty Ins. Co. 0 0 8 $396 $0 0.00% 0.00% 0.00Mega Life and Health Ins. Co. 29 45 51 $139 $0 0.00% 0.00% 0.00Conseco Life Ins. Co. 1 1 12 $79 $9,039 11441.77% 0.00% 0.00Investors Life Ins. Co. of North America 1 1 12 $60 $0 0.00% 0.00% 0.00Chesapeak Life Ins. Co. 2 2 24 $36 $0 0.00% 0.00% 0.00Pennsylvania Life Ins. Co. 0 0 12 $27 $0 0.00% 0.00% 0.00Old Republic Life Ins. Co. 23 0 0 $0 ($519) ---- 0.00% 0.00Central States Indemnity Co. of Omaha 124 126 0 $0 $0 ---- 0.00% 0.00Life of the South Ins. Co. 0 0 (2) ($23) $0 0.00% 0.00% 0.00Bankers Life Ins. Co. 133 133 1,920 ($55) ($14,594) 26534.55% 0.00% 0.00TOTALS 85,638 85,987 1,018,537 $190,276,285 $175,047,050 92.00% 100.00% 6,106.98
Total Individual Business Total Pols T Lives T Member Mo's T Earned Premium T Claims Incurred Loss Ratio Market Share HHIUnicare Health Plan of West Virginia, Inc. 75,786 75,786 905,161 $141,231,132 $131,737,566 93.28% 21.19% 449.21The Health Plan of the Upper Ohio Valley 36,750 36,750 449,043 $102,533,094 $97,461,789 95.05% 15.39% 236.76Humana Ins. Co. 42,335 42,335 509,977 $101,478,516 $83,773,838 82.55% 15.23% 231.92HM Health Ins. Co. 4,647 4,647 51,183 $39,623,832 $30,026,071 75.78% 5.95% 35.36First Health Life & Health Ins. Co. 7,498 7,498 81,862 $28,036,077 $23,800,374 84.89% 4.21% 17.70Highmark West Virginia, Inc. 8,312 8,358 102,512 $21,468,335 $15,673,027 73.01% 3.22% 10.38American Family Life Assurance Co. 64,978 124,803 1,438,734 $20,967,511 $8,696,263 41.47% 3.15% 9.90Highmark Senior Resources, Inc. 12,595 12,595 152,859 $15,157,770 $15,282,945 100.83% 2.27% 5.17American Progressive Life & Health Ins. Co. 2,618 2,618 31,416 $14,170,301 $10,603,929 74.83% 2.13% 4.52Combined Ins. Co. of America 82,263 60,032 634,006 $11,580,490 $3,423,861 29.57% 1.74% 3.02Bankers Life and Casualty Co. 6,948 7,603 99,042 $11,131,337 $6,789,444 60.99% 1.67% 2.79United American Ins. Co. 4,521 5,316 57,479 $9,913,466 $6,502,970 65.60% 1.49% 2.21Wellcare Prescription Ins. 1 8,094 97,040 $9,709,477 $7,984,106 82.23% 1.46% 2.12Aetna Life Ins. Co. 5,074 5,074 64,258 $8,539,762 $5,492,446 64.32% 1.28% 1.64Genworth Life Ins. Co. 4,456 4,996 0 $7,369,324 $4,029,051 54.67% 1.11% 1.22Mutual of Omaha Ins. Co. 5,928 6,983 82,106 $7,353,353 $4,607,719 62.66% 1.10% 1.22Pennsylvania Life Ins. Co. 4,884 4,884 59,214 $7,275,386 $5,006,590 68.82% 1.09% 1.19State Farm Mutual Automobile Ins. Co. 11,046 11,995 145,693 $7,196,492 $4,351,233 60.46% 1.08% 1.17Wellcare Health Ins. of Illinois 1 738 7,057 $6,737,073 $3,793,461 56.31% 1.01% 1.02Conseco Health Ins. Co. 17,591 17,591 218,160 $6,140,471 $2,188,969 35.65% 0.92% 0.85Unicare Life & Health Ins. Co. 4,252 4,252 51,645 $4,821,516 $4,533,046 94.02% 0.72% 0.52Silverscript Ins. Co. 3,931 3,931 47,907 $4,793,871 $3,409,629 71.12% 0.72% 0.52United World Life Ins. Co. 6,427 3,427 33,570 $4,485,658 $3,224,915 71.89% 0.67% 0.45Northwestern Mutual Life Ins. Co. 4,709 4,709 55,434 $4,422,215 $3,627,684 82.03% 0.66% 0.44QCC Ins. Co. 4,561 4,561 57,923 $4,274,470 $2,804,778 65.62% 0.64% 0.41Colonial Life & Accident Ins. Co. 11,312 11,312 0 $3,724,843 $1,241,824 33.34% 0.56% 0.31Provident Life and Accident Ins. Co. 7,606 7,606 0 $3,413,755 $1,895,150 55.52% 0.51% 0.26Pacificare Life & Health Ins. Co. 333 333 4,701 $3,284,566 $1,725,113 52.52% 0.49% 0.24American Network Ins. Co. 1,293 1,293 15,516 $3,261,336 $2,192,438 67.23% 0.49% 0.24Bankers Fidelity Life Ins. Co. 1,501 1,501 19,296 $3,212,902 $1,931,048 60.10% 0.48% 0.23Connecticut General Life Ins. Co. 13 3,094 37,128 $2,929,836 $2,518,510 85.96% 0.44% 0.19Metropolitan Life Ins. Co. 1,206 1,206 14,472 $2,226,104 $369,581 16.60% 0.33% 0.11United Teacher Associates Ins. Co. 2,558 3,827 45,171 $1,907,145 $1,023,590 53.67% 0.29% 0.08Continental General Ins. Co. 926 1,031 13,004 $1,845,627 $1,171,345 63.47% 0.28% 0.08Monumental Life Ins. Co. 9,041 9,070 110,568 $1,633,856 $395,307 24.19% 0.25% 0.06Northwestern Long Term Care Ins. Co. 1,066 1,066 11,873 $1,621,385 $416,292 25.68% 0.24% 0.06American General Life and Accident Ins. Co. 11,336 11,336 139,968 $1,608,420 $441,324 27.44% 0.24% 0.06Physicians Mutual Ins. Co. 2,493 2,891 28,376 $1,547,906 $853,196 55.12% 0.23% 0.05Massachusetts Mutual Life Ins. Co. 1,327 1,169 16,379 $1,546,722 $1,237,248 79.99% 0.23% 0.05Riversource Life Ins. Co. 1,357 1,357 16,284 $1,500,019 $621,926 41.46% 0.23% 0.05Sierra Health and Life Ins. Co., Inc. 46 0 0 $1,407,313 $2,307,656 163.98% 0.21% 0.04Medco Containment Life Ins. Co. 989 989 15,853 $1,360,054 $835,266 61.41% 0.20% 0.04Constitution Life Ins. Co. 647 647 7,764 $1,347,562 $872,949 64.78% 0.20% 0.04American Heritage Life Ins. Co. 2,759 5,305 63,696 $1,267,148 $649,116 51.23% 0.19% 0.04Paul Revere Life Ins. Co. 646 646 0 $1,164,411 $1,719,708 147.69% 0.17% 0.03American Income Life Ins. Co. 10,234 18,927 123,198 $1,111,280 $544,092 48.96% 0.17% 0.03New York Life Ins. Co. 876 880 10,526 $917,081 $253,934 27.69% 0.14% 0.02Conseco Senior Health Ins. Co. 693 750 9,600 $832,883 $1,051,236 126.22% 0.12% 0.02Standard Life & Accident Ins. Co. 759 766 9,206 $823,674 $635,053 77.10% 0.12% 0.02
Total Individual Business Total Pols T Lives T Member Mo's T Earned Premium T Claims Incurred Loss Ratio Market Share HHI

Total Individual Business Total Pols T Lives T Member Mo's T Earned Premium T Claims Incurred Loss Ratio Market Share HHIOrd of Utd Comm'l Trav. of Amer.-Frtnl 1,582 1,626 14,742 $733,803 $496,302 67.63% 0.11% 0.01American Fidelity Assurance Co. 1,739 3,062 31,023 $720,774 $429,236 59.55% 0.11% 0.01Avalon Ins. Co. 1,461 1,461 14,788 $697,515 $983,496 141.00% 0.10% 0.01Protective Life Ins. Co. 1,377 1,377 16,524 $686,838 $540,604 78.71% 0.10% 0.01Berkshire Life Ins. Co. of America 286 286 3,432 $648,640 ($40,754) -6.28% 0.10% 0.01
Teachers Ins. & Annuity Association of America 302 302 3,624 $613,224 $513,085 83.67% 0.09% 0.01Unum Life Ins. Co. of America 865 865 0 $597,330 $1,338,042 224.00% 0.09% 0.01Professional Ins. Co. 954 954 11,448 $595,744 $480,728 80.69% 0.09% 0.01Loyal American Life Ins. Co. 3,053 6,748 83,298 $594,013 $491,124 82.68% 0.09% 0.01Assurity Life Ins. Co. 854 854 10,788 $483,775 $3,888,650 803.81% 0.07% 0.01AXA Equitable Life Ins. Co. 275 275 3,432 $481,075 $936,452 194.66% 0.07% 0.01Sears Life Ins. Co. 4,774 9,518 107,970 $458,262 $218,557 47.69% 0.07% 0.00Golden Rule Ins. Co. 230 231 2,842 $451,458 $314,669 69.70% 0.07% 0.00Prudential Ins. Co. of America 425 428 5,136 $449,577 $75,227 16.73% 0.07% 0.00Geisinger Indemnity Ins. Co. 440 440 3,864 $445,325 $402,991 90.49% 0.07% 0.00Reassure America Life Ins. Co. 1,070 1,089 13,098 $411,363 $813,723 197.81% 0.06% 0.00Washington National Ins. Co. 356 416 5,346 $406,428 $233,178 57.37% 0.06% 0.00Allianz Life Ins. Co. of North America 206 239 2,844 $383,020 $78,566 20.51% 0.06% 0.00TIAA-CREF Life Ins. Co. 176 176 2,112 $379,349 $0 0.00% 0.06% 0.00Elder Health Ins. Co. 652 652 5,657 $363,220 $296,886 81.74% 0.05% 0.00Health Net Life Ins. Co. 1 0 0 $360,882 $2,139,479 592.85% 0.05% 0.00Provident American Life & Health Ins. Co. 216 216 2,322 $356,760 $242,930 68.09% 0.05% 0.00MetLife Ins. Co. of Connecticut 223 227 2,724 $350,911 $208,271 59.35% 0.05% 0.00Principal Life Ins. Co. 245 245 2,906 $342,212 $228,435 66.75% 0.05% 0.00Conseco Ins. Co. 972 1,140 8,958 $315,915 $87,517 27.70% 0.05% 0.00Time Ins. Co. 343 393 4,045 $297,205 $376,344 126.63% 0.04% 0.00Guardian Life Ins. Co. 201 201 2,407 $279,194 $285,589 102.29% 0.04% 0.00Ohio National Life Assurance Corporation 143 143 0 $277,649 $269,710 97.14% 0.04% 0.00Sterling Life Ins. Co. 79 79 898 $274,375 $253,167 92.27% 0.04% 0.00USAA Life Ins. Co. 163 163 1,842 $239,002 $167,464 70.07% 0.04% 0.00Continental Casualty Co. 571 571 7,065 $237,839 $1,015,710 427.06% 0.04% 0.00Genworth Life & Annuity Ins. Co. 223 223 2,676 $227,774 $142,338 62.49% 0.03% 0.00Liberty Life Ins. Co. 2,261 3,493 41,520 $201,984 $107,994 53.47% 0.03% 0.00Ohio National Life Ins. Co. 141 141 0 $194,811 $49,369 25.34% 0.03% 0.00Continental Life Ins. Co. of Brentwood, TN 120 120 1,290 $191,160 $90,817 47.51% 0.03% 0.00Life Investors Ins. Co. of America 225 269 4,460 $190,531 $9,260 4.86% 0.03% 0.00Mony Life Ins. Co. 164 168 2,106 $177,656 $94,726 53.32% 0.03% 0.00Kanawha Ins. Co. 447 581 7,036 $175,324 $35,341 20.16% 0.03% 0.00Stonebridge Life Ins. Co. 745 879 10,548 $163,460 $199,397 121.99% 0.02% 0.00Globe Life and Accident Ins. Co. 718 735 8,562 $153,848 $74,424 48.38% 0.02% 0.00Central United Life Ins. Co. 255 306 60 $149,625 $353,602 236.33% 0.02% 0.00Union Bankers Ins. Co. 222 222 2,664 $149,058 $95,359 63.97% 0.02% 0.00Lincoln Heritage Life Ins. Co. 342 342 3,991 $146,975 $73,538 50.03% 0.02% 0.00American General Life Ins. Co. 327 327 3,924 $144,413 $129,649 89.78% 0.02% 0.00Lincoln Benefit Life Co. 48 74 888 $143,502 $0 0.00% 0.02% 0.00Life Ins. Co. of North America 8 8 0 $140,747 $8,983 6.38% 0.02% 0.00Family Heritage Life Ins. Co. of America 190 360 0 $131,212 $40,572 30.92% 0.02% 0.00Farm Family Life Ins. Co. 213 219 2,616 $125,129 $424,657 339.38% 0.02% 0.00Cincinnati Life Ins. Co. 1,836 1,836 22,032 $125,018 $22,877 18.30% 0.02% 0.00United National Life Ins. Co. of America 242 242 3,069 $123,024 $71,959 58.49% 0.02% 0.00Freedom Life Ins. Co. of America 293 295 3,798 $121,789 $56,264 46.20% 0.02% 0.00Union Security Ins. Co. 103 103 1,236 $119,539 $3,776 3.16% 0.02% 0.00Transamerica Occidental Life Ins. Co. 65 66 593 $115,532 $115,758 100.20% 0.02% 0.00John Alden Life Ins. Co. 103 117 1,186 $114,794 $1,404 1.22% 0.02% 0.00Envision Ins. Co. 64 64 622 $112,899 $89,161 78.97% 0.02% 0.00Minnesota Life Ins. Co. 58 54 678 $111,017 $193,961 174.71% 0.02% 0.00Great American Life Ins. Co. 85 85 930 $101,642 $0 0.00% 0.02% 0.00Standard Ins. Co. 93 84 876 $100,902 $1,233 1.22% 0.02% 0.00Lincoln National Life Ins. Co. 239 239 2,883 $99,099 $203,088 204.93% 0.01% 0.00Centre Life Ins. Co. 50 50 642 $97,848 ($33,996) -34.74% 0.01% 0.00Shenandoah Life Ins. Co. 89 89 642 $95,983 $35,901 37.40% 0.01% 0.00Union Central Life Ins. Co. 38 38 0 $91,759 $0 0.00% 0.01% 0.00Federated Life Ins. Co. 82 82 996 $88,031 $0 0.00% 0.01% 0.00Merit Life Ins. Co. 3,690 4,768 54,774 $87,349 $736 0.84% 0.01% 0.00Illinois Mutual Life Ins. Co. 108 108 1,236 $83,091 $51,335 61.78% 0.01% 0.00National Life Ins. Co. 168 94 0 $82,319 $558,910 678.96% 0.01% 0.00Central Reserve Life Ins. Co. 41 41 594 $80,442 $42,668 53.04% 0.01% 0.00Colonial Penn Life Ins. Co. 69 69 912 $80,036 $67,430 84.25% 0.01% 0.00Horace Mann Life Ins. Co. 244 244 2,918 $64,646 $13,342 20.64% 0.01% 0.00Union Fidelity Life Ins. Co. 190 298 3,576 $61,074 $58,512 95.81% 0.01% 0.00Reliastar Life Ins. Co. of New York 79 168 2,016 $60,142 $875 1.45% 0.01% 0.00Central States Health & Life Co. of Omaha 23 23 301 $59,964 $28,799 48.03% 0.01% 0.00Pan-American Life Ins. Co. 25 25 300 $59,731 $26,162 43.80% 0.01% 0.00Old Republic Ins. Co. 94 94 1,116 $58,766 $30,322 51.60% 0.01% 0.00Transamerica Life Ins. Co. 109 167 2,148 $57,124 $33,232 58.18% 0.01% 0.00American Republic Ins. Co. 19 19 0 $56,730 $18,018 31.76% 0.01% 0.00Celtic Ins. Co. 18 18 234 $54,974 $30,534 55.54% 0.01% 0.00National Union Fire Ins. Co. of Pittsburgh, PA 156 156 1,872 $54,533 $858 1.57% 0.01% 0.00Gerber Life Ins. Co. 615 615 7,380 $51,875 $696 1.34% 0.01% 0.00United Ins. Co. of America 498 875 11,580 $49,482 $49,775 100.59% 0.01% 0.00State Life Ins. Co. 28 28 336 $49,317 $5,000 10.14% 0.01% 0.00American Pioneer Life Ins. Co. 28 28 336 $49,144 $41,712 84.88% 0.01% 0.00Medamerica Ins. Co. 28 28 304 $48,989 $0 0.00% 0.01% 0.00Medico Ins. Co. 227 366 4,392 $46,711 $22,894 49.01% 0.01% 0.00EMC National Life Co. 63 112 573 $45,776 $749 1.64% 0.01% 0.00National Guardian Life Ins. Co. 98 98 1,236 $42,278 $41,496 98.15% 0.01% 0.00Guarantee Trust Life Ins. Co. 112 112 1,125 $40,921 $14,136 34.54% 0.01% 0.00
Total Individual Business Total Pols T Lives T Member Mo's T Earned Premium T Claims Incurred Loss Ratio Market Share HHI

Total Individual Business Total Pols T Lives T Member Mo's T Earned Premium T Claims Incurred Loss Ratio Market Share HHIAIG Life Ins. Co. 32 37 444 $40,004 $0 0.00% 0.01% 0.00Individual Assur. Co., Life, Health & Acc. 2 328 0 $36,249 $8,909 24.58% 0.01% 0.00Lafayette Life Ins. Co. 42 42 12 $33,829 $4,000 11.82% 0.01% 0.00Country Life Ins. Co. 17 17 204 $29,522 $23,864 80.83% 0.00% 0.00New England Life Ins. Co. 32 36 449 $26,429 $91,956 347.94% 0.00% 0.00Medico Life Ins. Co. 9 9 108 $25,793 $22,075 85.59% 0.00% 0.00Crown Life Ins. Co. 23 23 276 $24,481 $72,161 294.76% 0.00% 0.00Zurich American Ins. Co. 7 376 2,880 $23,977 $0 0.00% 0.00% 0.00Central Benefits National Life Ins. Co. 11 11 132 $23,563 $11,867 50.36% 0.00% 0.00Jackson National Life Ins. Co. 32 32 384 $22,782 $1,352 5.93% 0.00% 0.00New England Life Ins. Co. 29 29 348 $21,753 $3,324 15.28% 0.00% 0.00American National Life Ins. Co. of Texas 3 4 64 $21,146 $6,344 30.00% 0.00% 0.00Erie Family Life Ins. Co. 69 69 864 $21,088 $26,810 127.13% 0.00% 0.00Unified Life Ins. Co. 357 387 1,161 $20,303 $36,659 180.56% 0.00% 0.00Symetra Life Ins. Co. 27 27 0 $18,059 $23,160 128.25% 0.00% 0.00Oxford Life Ins. Co. 5 5 12 $17,490 $4,789 27.38% 0.00% 0.00Equitable Life & Casualty Ins. Co. 7 8 112 $17,167 $12,503 72.83% 0.00% 0.00United of Omaha Life Ins. Co. 50 50 615 $15,023 $0 0.00% 0.00% 0.00CUNA Mutual Ins. Co. 13 13 129 $14,429 ($210) -1.46% 0.00% 0.00American National Ins. Co. 37 56 679 $12,886 $13,572 105.32% 0.00% 0.00Liberty National Life Ins. Co. 40 54 9,372 $12,867 $1,902 14.78% 0.00% 0.00Indianapolis Life Ins. Co. 16 16 192 $11,411 $4,465 39.13% 0.00% 0.00Penn Mutual Life Ins. Co. 14 14 0 $11,014 ($437,028) -3967.93% 0.00% 0.00Citizens Security Ins. Co. 102 114 1,368 $10,881 $778 7.15% 0.00% 0.00Jefferson National Life Ins. Co. 9 9 114 $8,733 $2,140 24.50% 0.00% 0.00National Teachers Associates Life Ins. Co. 30 30 336 $8,632 $55 0.64% 0.00% 0.00Chesapeak Life Ins. Co. 6 7 74 $7,947 $7,566 95.21% 0.00% 0.00Federated Mutual Ins. Co. 2 2 28 $7,788 $6,353 81.57% 0.00% 0.00American Public Life Ins. Co. 1 1 12 $7,432 $496 6.67% 0.00% 0.00Hartford Life & Annuity Ins. Co. 72 72 864 $6,356 $9,603 151.09% 0.00% 0.00Great-West Life Assurance Co. 0 0 0 $5,907 $8,276 140.10% 0.00% 0.00Mega Life and Health Ins. Co. 38 55 231 $5,267 $123 2.34% 0.00% 0.00AIG Premier Ins. Co. 5 5 60 $5,179 $3,828 73.91% 0.00% 0.00Commonwealth Annuity & Life Ins. Co. 8 8 96 $5,171 $8,112 156.87% 0.00% 0.00World Ins. Co. 9 11 143 $5,134 $2,205 42.95% 0.00% 0.00Renaissance Life & Health Ins. Co. of America 8 23 282 $4,933 $1,130 22.91% 0.00% 0.00HCC Life Ins. Co. 1 1 12 $4,769 ($717) -15.03% 0.00% 0.00Old American Ins. Co. 48 48 612 $4,603 $8,383 182.12% 0.00% 0.00Fidelity Security Life Ins. Co. 2 2 12 $4,529 $0 0.00% 0.00% 0.00Marquette National Life Ins. Co. 16 16 192 $4,475 $4,481 100.13% 0.00% 0.00Christian Fidelity Life Ins. Co. 2 2 12 $4,327 $502 11.60% 0.00% 0.00Genesis Ins. Co. 1 1 12 $3,947 $0 0.00% 0.00% 0.00Canada Life Assurance Co. (The) 3 3 36 $3,857 $529 13.72% 0.00% 0.00Kansas City Life Ins. Co. 12 12 186 $3,851 $3,287 85.35% 0.00% 0.00American States Ins. Co. 0 0 0 $3,609 $6,934 192.13% 0.00% 0.00Union Labor Life Ins. Co. 9 24 258 $3,235 $249 7.70% 0.00% 0.00Dental Choice, Inc. 10 27 76 $3,091 $3,140 101.59% 0.00% 0.00Baltimore Life Ins. Co. 99 99 1,200 $2,989 $0 0.00% 0.00% 0.00American United Life Ins. Co. 3 3 36 $2,807 $0 0.00% 0.00% 0.00National States Ins. Co. 3 3 36 $2,398 $2,741 114.30% 0.00% 0.00Colorado Bankers Life Ins. Co. 7 7 84 $2,059 $0 0.00% 0.00% 0.00Allstate Life Ins. Co. 18 18 0 $1,958 $20,172 1030.23% 0.00% 0.00Security Life of Denver Ins. Co. 10 10 100 $1,865 $1,339 71.80% 0.00% 0.00Phoenix Life Ins. Co. 0 0 0 $1,832 $0 0.00% 0.00% 0.00MTL Ins. 1 1 12 $1,647 $0 0.00% 0.00% 0.00Transamerica Financial Life Ins. Co. 12 17 194 $1,629 $0 0.00% 0.00% 0.00National Safety Life Ins. Co. 14 14 168 $1,525 $15,286 1002.36% 0.00% 0.00Commercial Travelers Mutual Ins. Co. 42 42 540 $1,448 $0 0.00% 0.00% 0.00Perico Life Ins. Co. 10 14 168 $1,203 $158 13.13% 0.00% 0.00Teachers Protective Mutual Life Ins. Co. 12 12 152 $1,115 $38,016 3409.51% 0.00% 0.00Reliance Standard Life Ins. Co. 24 24 0 $1,077 $0 0.00% 0.00% 0.00American Home Assurance Co. 8 8 96 $1,071 ($62) -5.79% 0.00% 0.00AAA Life Ins. Co. 1 1 12 $787 $284 36.09% 0.00% 0.00American Bankers Life Assurance Co. 0 0 0 $700 $4,882 697.43% 0.00% 0.00Nationwide Life Ins. Co. of America 3 4 48 $589 $40 6.79% 0.00% 0.00Old Republic Life Ins. Co. 14,484 0 0 $565 ($4,938) -873.98% 0.00% 0.00First Allmerica Financial Life Ins. Co. 3 3 36 $564 $0 0.00% 0.00% 0.00HumanaDental Ins. Co. 0 0 0 $515 $231 44.85% 0.00% 0.00Government Employees Ins. Co. 4 4 48 $454 ($1) -0.22% 0.00% 0.00Federal Ins. Co. 3 3 7 $426 $80 18.78% 0.00% 0.00American Sentinel Ins. Co. 2 2 24 $405 ($11) -2.72% 0.00% 0.00Lifesecure Ins. Co. 8 8 0 $302 $0 0.00% 0.00% 0.00State Automobile Mutual Ins. Co. 0 0 9 $248 $1,781 718.15% 0.00% 0.00ING USA Annuity and Life Ins. Co. 4 4 48 $244 $0 0.00% 0.00% 0.00Farmers New World Life Ins. 0 0 0 $229 $0 0.00% 0.00% 0.00Liberty Life Assurance Co. of Boston 1 1 12 $201 $0 0.00% 0.00% 0.00American Capitol Ins. Co. 0 0 1 $196 $0 0.00% 0.00% 0.00First Investors Life Ins. Co. 1 1 12 $149 $0 0.00% 0.00% 0.00Banner Life Ins. Co. 2 3 36 $113 $0 0.00% 0.00% 0.00World Corp Ins. Co. 0 0 0 $94 $1,646 1751.06% 0.00% 0.00Conseco Life Ins. Co. 1 1 12 $79 $9,039 11441.77% 0.00% 0.00Central Security Life Ins. Co. 1 1 12 $73 $0 0.00% 0.00% 0.00Federal Life Ins. Co. (Mutual) 10 10 133 $68 $0 0.00% 0.00% 0.00Security Life Ins. Co. of America 1 2 12 $62 $0 0.00% 0.00% 0.00United Family Life Ins. Co. 1 1 12 $62 $0 0.00% 0.00% 0.00Investors Life Ins. Co. of North America 1 1 12 $60 $0 0.00% 0.00% 0.00Stonebridge Casualty Ins. Co. 1 3 36 $58 $1 1.72% 0.00% 0.00
Total Individual Business Total Pols T Lives T Member Mo's T Earned Premium T Claims Incurred Loss Ratio Market Share HHI

Total Individual Business Total Pols T Lives T Member Mo's T Earned Premium T Claims Incurred Loss Ratio Market Share HHILife Ins. Co. of the Southwest 1 1 12 $38 $0 0.00% 0.00% 0.00American Int'l Life Assur. Co. of NY 1 1 12 $25 $0 0.00% 0.00% 0.00Reliable Life Ins. Co. 0 0 5 $13 $0 0.00% 0.00% 0.00United Liberty Life Ins. Co. 1 1 12 $1 $0 0.00% 0.00% 0.00Western & Southern Life Ins. Co. 4,643 3,195 0 $0 $0 ---- 0.00% 0.00UPMC Health Benefits, Cin 2 2,787 33,714 $0 $0 ---- 0.00% 0.00Central States Indemnity Co. of Omaha 124 126 0 $0 $0 ---- 0.00% 0.00Columbus Life Ins. Co. 9 9 0 $0 $0 ---- 0.00% 0.00Primerica Life Ins. Co. 7 7 84 $0 $0 ---- 0.00% 0.00American Community Mutual Ins. 0 0 0 $0 ($1,411) ---- 0.00% 0.00Life of the South Ins. Co. 0 0 (2) ($23) $0 0.00% 0.00% 0.00Bankers Life Ins. Co. 133 133 1,920 ($55) ($14,594) 26534.55% 0.00% 0.00National Casualty Co. 24 29 348 ($2,176) ($21,114) 970.31% 0.00% 0.00TOTALS 555,190 620,150 6,815,644 $666,357,540 $537,387,079 80.65% 100.00% 1,024.27
Small Group Comp. Major Medical Policies Lives Member Months Premium Earned Claims Incurred Loss Ratio Market Share HHIHighmark West Virginia, Inc. 22,627 40,152 500,733 $162,029,170 $126,081,047 77.81% 54.56% 2,977.14Coventry Health & Life Ins. Co. 7,165 12,878 134,531 $41,868,043 $30,050,047 71.77% 14.10% 198.78Carelink Health Plans, Inc. 3,132 5,490 71,380 $25,376,798 $17,015,254 67.05% 8.55% 73.03United Healthcare Ins. Co. 359 5,083 60,996 $13,814,190 $10,396,041 75.26% 4.65% 21.64Principal Life Ins. Co. 109 2,367 28,158 $9,277,927 $6,255,139 67.42% 3.12% 9.76Health Plan of the Upper OH Val. 1,138 2,227 27,112 $8,929,211 $7,702,956 86.27% 3.01% 9.04Union Security Ins. Co. 111 1,106 14,759 $5,551,645 $3,118,738 56.18% 1.87% 3.50First Health Life & Health Ins. Co. 159 1,033 12,396 $5,319,156 $4,330,100 81.41% 1.79% 3.21Consumers Life Ins. Co. 781 1,530 18,897 $5,096,802 $5,930,569 116.36% 1.72% 2.95Medical Benefits Mutual Life Ins. Co. 60 1,445 14,879 $5,031,363 $4,124,674 81.98% 1.69% 2.87Central Reserve Life Ins. Co. 65 1,318 18,120 $4,197,759 $3,028,061 72.14% 1.41% 2.00John Alden Life Ins. Co. 122 957 11,864 $3,899,132 $1,807,083 46.35% 1.31% 1.72THP Ins. Co. 329 527 5,818 $1,454,058 $1,144,181 78.69% 0.49% 0.24Guardian Life Ins. Co. 12 163 2,083 $1,424,694 $867,051 60.86% 0.48% 0.23Federated Mutual Ins. Co. 24 259 2,764 $1,058,290 $490,866 46.38% 0.36% 0.13Standard Security Life Ins. Co. of NY 11 106 1,254 $821,875 $796,626 96.93% 0.28% 0.08Time Ins. Co. 11 99 1,484 $717,501 $728,658 101.55% 0.24% 0.06Aetna Life Ins. Co. 10 57 684 $435,105 $175,450 40.32% 0.15% 0.02Madison National Life Ins. Co., Inc. 9 73 876 $356,091 $146,039 41.01% 0.12% 0.01Mega Life and Health Ins. Co. 70 119 1,275 $234,280 $63,943 27.29% 0.08% 0.01Unicare Life & Health Ins. Co. 2 5 74 $41,743 $6,071 14.54% 0.01% 0.00Lincoln National Life Ins. Co. 8 8 96 $13,434 ($8,242) -61.35% 0.00% 0.00Connecticut General Life Ins. Co. 2 2 24 $8,481 $0 0.00% 0.00% 0.00Wilton ReAssur. Life Co. of NY 1 1 12 $127 $0 0.00% 0.00% 0.00Stonebridge Casualty Ins. Co. 3 36 58 $0 $0 ---- 0.00% 0.00Continental General Ins. Co. 0 0 0 $0 $60,000 ---- 0.00% 0.00Metropolitan Life Ins. Co. 0 0 0 $0 $1,841 ---- 0.00% 0.00TOTALS 36,320 77,041 930,327 $296,956,875 $224,312,193 75.54% 100.00% 3,306.41
Large Group Comp. Major Medical Policies Lives Member Months Premium Earned Claims Incurred Loss Ratio Market Share HHIHighmark West Virginia, Inc. 25,646 41,331 481,097 $171,064,583 $157,367,020 91.99% 42.63% 1,817.71Health Plan of the Upper OH Val. 9,381 21,811 265,528 $73,249,668 $68,108,473 92.98% 18.26% 333.29Carelink Health Plans, Inc. 6,887 13,811 174,367 $55,823,265 $46,939,919 84.09% 13.91% 193.57Coventry Health & Life Ins. Co. 5,421 9,790 109,266 $37,871,408 $30,706,809 81.08% 9.44% 89.09United Healthcare Ins. Co. 596 9,647 115,764 $35,685,451 $32,598,406 91.35% 8.89% 79.10Aetna Life Ins. Co. 331 2,775 32,642 $6,551,662 $5,458,341 83.31% 1.63% 2.67Connecticut General Life Ins. Co. 131 2,786 33,432 $5,269,384 $4,104,866 77.90% 1.31% 1.72THP Ins. Co. 605 1,347 14,871 $3,659,721 $3,806,751 104.02% 0.91% 0.83Consumers Life Ins. Co. 753 1,233 9,957 $2,653,417 $2,892,109 109.00% 0.66% 0.44State Farm Mutual Auto. Ins. Co. 1 573 6,935 $2,446,648 $2,552,005 104.31% 0.61% 0.37Principal Life Ins. Co. 11 721 8,494 $2,315,512 $1,643,748 70.99% 0.58% 0.33Guardian Life Ins. Co. 3 615 9,886 $1,888,427 $1,780,437 94.28% 0.47% 0.22Medical Benefits Mutual Life Ins. Co. 4 497 6,541 $1,427,670 $2,195,703 153.80% 0.36% 0.13Unicare Life & Health Ins. Co. 32 180 3,012 $883,293 $630,096 71.33% 0.22% 0.05Great-West Life & Annuity Ins. Co. 5 17 264 $218,391 $197,459 90.42% 0.05% 0.00Central Reserve Life Ins. Co. 1 83 1,073 $133,334 $99,329 74.50% 0.03% 0.00Mid-West National Life Ins. Co. of TN 0 0 745 $54,592 $28,247 51.74% 0.01% 0.00Union Labor Life Ins. Co. 0 0 24 $32,158 $31,660 98.45% 0.01% 0.00Mutual of Omaha Ins. Co. 1 9 108 $4,581 $439 9.58% 0.00% 0.00American National Ins. Co. 0 0 0 $580 ($2,890) -498.28% 0.00% 0.00Chesapeak Life Ins. Co. 0 0 0 $0 ($129) ---- 0.00% 0.00United of Omaha Life Ins. Co. 0 0 0 $0 $12,713 ---- 0.00% 0.00TOTALS 49,809 107,226 1,274,006 $401,233,745 $361,151,511 90.01% 100.00% 2,519.53
Non-Exempt Assoc. Group CMM Policies Lives Member Months Premium Earned Claims Incurred Loss Ratio Market Share HHIContinental General Ins. Co. 1 572 9,365 $1,509,611 $858,272 56.85% 30.43% 926.24Central Reserve Life Ins. Co. 4 303 4,075 $1,297,098 $852,211 65.70% 26.15% 683.81Medical Savings Ins. Co. 0 0 4,464 $816,335 $1,770,279 216.86% 16.46% 270.85New York Life Ins. Co. 12 108 1,296 $739,173 $766,540 103.70% 14.90% 222.07Guarantee Trust Life Ins. Co. 15 521 4,330 $481,577 $131,566 27.32% 9.71% 94.26Standard Life & Accident Ins. Co. 57 110 663 $83,305 $51,689 62.05% 1.68% 2.82American Nat. Life Ins. Co. of TX 21 32 116 $29,770 $3,276 11.00% 0.60% 0.36Jefferson National Life Ins. Co. 1 1 12 $3,380 $0 0.00% 0.07% 0.00TOTALS 111 1,647 24,321 $4,960,249 $4,433,833 89.39% 100.00% 2,200.42

Exempt Assoc. Group CMM Policies Lives Member Months Premium Earned Claims Incurred Loss Ratio Market Share HHIHighmark West Virginia, Inc. 2 8,812 106,316 $20,782,470 $16,826,200 80.96% 62.07% 3,853.23Golden Rule Ins. Co. 1 2,994 35,890 $8,245,766 $5,213,944 63.23% 24.63% 606.59American Medical Security Life Ins. Co. 454 755 10,338 $2,232,881 $1,646,394 73.73% 6.67% 44.48World Ins. Co. 307 589 7,972 $1,270,913 $366,176 28.81% 3.80% 14.41Carelink Health Plans, Inc. 114 228 2,856 $852,827 $476,025 55.82% 2.55% 6.49Coventry Health & Life Ins. Co. 30 43 272 $70,534 $24,904 35.31% 0.21% 0.04American Republic Ins. Co. 3 6 0 $24,538 $22,311 90.92% 0.07% 0.01TOTALS 911 13,427 163,644 $33,479,929 $24,575,954 73.41% 100.00% 4,525.25
Group Trust Comp. Major Medical Policies Lives Member Months Premium Earned Claims Incurred Loss Ratio Market Share HHIAmerican Nat. Life Ins. Co. of TX 27 46 639 $108,369 $18,408 16.99% 94.50% 8,929.66Union Labor Life Ins. Co. 0 0 451 $6,311 ($4,434) -70.26% 5.50% 30.28TOTALS 27 46 1,090 $114,680 $13,974 12.19% 100.00% 8,959.94
Discretionary Groups CMM Policies Lives Member Months Premium Earned Claims Incurred Loss Ratio Market Share HHICeltic Ins. Co. 121 182 1,790 $448,478 $102,195 22.79% 42.82% 1,833.54Continental General Ins. Co. 1 66 691 $246,680 $55,798 22.62% 23.55% 554.72Standard Security Life Ins. Co. of NY 96 96 1,344 $233,141 $44,575 19.12% 22.26% 495.50Fidelity Security Life Ins. Co. 0 22 372 $100,067 $44,126 44.10% 9.55% 91.28Consumers Life Ins. Co. 1 17 48 $8,846 $84 0.95% 0.84% 0.71Guarantee Trust Life Ins. Co. 0 0 18 $4,780 $15,994 334.60% 0.46% 0.21American Medical Security Life Ins. Co. 0 0 10 $4,201 $23,154 551.15% 0.40% 0.16John Alden Life Ins. Co. 1 1 1 $1,167 ($54,414) -4662.72% 0.11% 0.01TOTALS 220 384 4,274 $1,047,360 $231,512 22.10% 100.00% 2,976.14
Total Group CMM HDHP Only Policies Lives Member Months Premium Earned Claims Incurred Loss Ratio Market Share HHICoventry Health & Life Ins. Co. 1,591 2,814 27,075 $7,261,590 $5,760,746 79.33% 35.83% 1,284.04Golden Rule Ins. Co. 0 1,435 16,799 $3,412,861 $1,234,059 36.16% 16.84% 283.63Medical Benefits Mutual Life Ins. Co. 35 1,111 13,617 $3,242,341 $3,178,186 98.02% 16.00% 255.99Central Reserve Life Ins. Co. 27 453 6,042 $1,529,307 $1,039,455 67.97% 7.55% 56.95Mega Life and Health Ins. Co. 0 0 493,410 $1,200,221 $1,104,474 92.02% 5.92% 35.08Medical Savings Ins. Co. 0 0 4,442 $807,934 $1,770,279 219.11% 3.99% 15.90Union Security Ins. Co. 19 108 749 $665,440 $367,288 55.19% 3.28% 10.78Consumers Life Ins. Co. 94 194 2,337 $636,608 $412,554 64.81% 3.14% 9.87World Ins. Co. 146 278 3,556 $552,357 $198,471 35.93% 2.73% 7.43Highmark West Virginia, Inc. 110 225 1,564 $316,865 $112,919 35.64% 1.56% 2.44Time Ins. Co. 3 60 933 $291,590 $190,021 65.17% 1.44% 2.07American Medical Security Life Ins. Co. 41 79 953 $167,092 $215,122 128.74% 0.82% 0.68Continental General Ins. Co. 1 24 420 $77,850 $55,326 71.07% 0.38% 0.15John Alden Life Ins. Co. 2 15 233 $65,452 $9,828 15.02% 0.32% 0.10Celtic Ins. Co. 16 31 243 $37,333 $8,154 21.84% 0.18% 0.03Principal Life Ins. Co. 8 57 772 $0 $0 ---- 0.00% 0.00Mutual of Omaha Ins. Co. 0 0 0 $0 $12,573 ---- 0.00% 0.00TOTALS 2,093 6,884 573,145 $20,264,841 $15,669,455 77.32% 100.00% 1,965.15
Total Group CMM (Incl HDHP) Policies Lives Member Months Premium Earned Claims Incurred Loss Ratio Market Share HHIHighmark West Virginia, Inc. 48,275 90,295 1,088,146 $353,876,223 $300,274,267 84.85% 47.96% 2,300.56Health Plan of the Upper OH Val. 10,519 24,038 292,640 $82,178,879 $75,811,429 92.25% 11.14% 124.07Carelink Health Plans, Inc. 10,133 19,529 248,603 $82,052,890 $64,431,198 78.52% 11.12% 123.69Coventry Health & Life Ins. Co. 12,616 22,711 244,069 $79,809,985 $60,781,760 76.16% 10.82% 117.02United Healthcare Ins. Co. 955 14,730 176,760 $49,499,641 $42,994,447 86.86% 6.71% 45.01Principal Life Ins. Co. 120 3,088 36,652 $11,593,439 $7,898,887 68.13% 1.57% 2.47Golden Rule Ins. Co. 1 2,994 35,890 $8,245,766 $5,213,944 63.23% 1.12% 1.25Consumers Life Ins. Co. 1,535 2,780 28,902 $7,759,065 $8,822,762 113.71% 1.05% 1.11Aetna Life Ins. Co. 341 2,832 33,326 $6,986,767 $5,633,791 80.64% 0.95% 0.90Medical Benefits Mutual Life Ins. Co. 64 1,942 21,420 $6,459,033 $6,320,377 97.85% 0.88% 0.77Central Reserve Life Ins. Co. 70 1,704 23,268 $5,628,191 $3,979,601 70.71% 0.76% 0.58Union Security Ins. Co. 111 1,106 14,759 $5,551,645 $3,118,738 56.18% 0.75% 0.57First Health Life & Health Ins. Co. 159 1,033 12,396 $5,319,156 $4,330,100 81.41% 0.72% 0.52Connecticut General Life Ins. Co. 133 2,788 33,456 $5,277,865 $4,104,866 77.78% 0.72% 0.51THP Ins. Co. 934 1,874 20,689 $5,113,779 $4,950,932 96.82% 0.69% 0.48John Alden Life Ins. Co. 123 958 11,865 $3,900,299 $1,752,669 44.94% 0.53% 0.28Guardian Life Ins. Co. 15 778 11,969 $3,313,121 $2,647,488 79.91% 0.45% 0.20State Farm Mutual Auto. Ins. Co. 1 573 6,935 $2,446,648 $2,552,005 104.31% 0.33% 0.11American Medical Security Life Ins. Co. 454 755 10,348 $2,237,082 $1,669,548 74.63% 0.30% 0.09Continental General Ins. Co. 2 638 10,056 $1,756,291 $974,070 55.46% 0.24% 0.06World Ins. Co. 307 589 7,972 $1,270,913 $366,176 28.81% 0.17% 0.03Federated Mutual Ins. Co. 24 259 2,764 $1,058,290 $490,866 46.38% 0.14% 0.02Standard Security Life Ins. Co. of NY 107 202 2,598 $1,055,016 $841,201 79.73% 0.14% 0.02Unicare Life & Health Ins. Co. 34 185 3,086 $925,036 $636,167 68.77% 0.13% 0.02Medical Savings Ins. Co. 0 0 4,464 $816,335 $1,770,279 216.86% 0.11% 0.01New York Life Ins. Co. 12 108 1,296 $739,173 $766,540 103.70% 0.10% 0.01Time Ins. Co. 11 99 1,484 $717,501 $728,658 101.55% 0.10% 0.01Guarantee Trust Life Ins. Co. 15 521 4,348 $486,357 $147,560 30.34% 0.07% 0.00Celtic Ins. Co. 121 182 1,790 $448,478 $102,195 22.79% 0.06% 0.00Madison National Life Ins. Co., Inc. 9 73 876 $356,091 $146,039 41.01% 0.05% 0.00Mega Life and Health Ins. Co. 70 119 1,275 $234,280 $63,943 27.29% 0.03% 0.00Great-West Life & Annuity Ins. Co. 5 17 264 $218,391 $197,459 90.42% 0.03% 0.00American Nat. Life Ins. Co. of TX 48 78 755 $138,139 $21,684 15.70% 0.02% 0.00Fidelity Security Life Ins. Co. 0 22 372 $100,067 $44,126 44.10% 0.01% 0.00Standard Life & Accident Ins. Co. 57 110 663 $83,305 $51,689 62.05% 0.01% 0.00Mid-West National Life Ins. Co. of TN 0 0 745 $54,592 $28,247 51.74% 0.01% 0.00Union Labor Life Ins. Co. 0 0 475 $38,469 $27,226 70.77% 0.01% 0.00
Total Group CMM (Incl HDHP) Policies Lives Member Months Premium Earned Claims Incurred Loss Ratio Market Share HHI

Total Group CMM (Incl HDHP) Policies Lives Member Months Premium Earned Claims Incurred Loss Ratio Market Share HHIAmerican Republic Ins. Co. 3 6 0 $24,538 $22,311 90.92% 0.00% 0.00Lincoln National Life Ins. Co. 8 8 96 $13,434 ($8,242) -61.35% 0.00% 0.00Mutual of Omaha Ins. Co. 1 9 108 $4,581 $439 9.58% 0.00% 0.00Jefferson National Life Ins. Co. 1 1 12 $3,380 $0 0.00% 0.00% 0.00American National Ins. Co. 0 0 0 $580 ($2,890) -498.28% 0.00% 0.00Wilton ReAssur. Life Co. of NY 1 1 12 $127 $0 0.00% 0.00% 0.00Stonebridge Casualty Ins. Co. 3 36 58 $0 $0 ---- 0.00% 0.00Chesapeak Life Ins. Co. 0 0 0 $0 ($129) ---- 0.00% 0.00Metropolitan Life Ins. Co. 0 0 0 $0 $1,841 ---- 0.00% 0.00United of Omaha Life Ins. Co. 0 0 0 $0 $12,713 ---- 0.00% 0.00TOTALS 87,398 199,771 2,397,662 $737,792,838 $614,718,977 83.32% 100.00% 2,720.36
Group Federal Employees Health Plans Policies Lives Member Months Premium Earned Claims Incurred Loss Ratio Market Share HHIHighmark West Virginia, Inc. 25,479 54,850 651,547 $213,240,057 $199,841,071 93.72% 97.44% 9,494.27Health Plan of the Upper OH Val. 522 1,138 13,572 $4,134,579 $3,607,896 87.26% 1.89% 3.57Mutual of Omaha Ins. Co. 0 0 0 $1,066,813 $1,120,255 105.01% 0.49% 0.24Aetna Life Ins. Co. 1 212 2,038 $348,926 $303,558 87.00% 0.16% 0.03United Healthcare Ins. Co. 1 6,110 73,320 $37,802 $20,465 54.14% 0.02% 0.00BCS Ins. Co. 0 9 0 $17,532 $12,642 72.11% 0.01% 0.00TOTALS 26,003 62,319 740,477 $218,845,709 $204,905,887 93.63% 100.00% 9,498.10
Group Other Medical (Non-Comp.) Policies Lives Member Months Premium Earned Claims Incurred Loss Ratio Market Share HHIMega Life and Health Ins. Co. 1,363 2,398 28,499 $5,424,334 $2,046,116 37.72% 60.20% 3,624.04Connecticut General Life Ins. Co. 38 124 1,484 $1,532,249 $1,193,627 77.90% 17.01% 289.17United American Ins. Co. 354 354 4,441 $817,943 $600,327 73.39% 9.08% 82.40Continental Assur. Co. 0 0 0 $484,720 $2,696 0.56% 5.38% 28.94BCS Ins. Co. 0 38 0 $175,511 $212,655 121.16% 1.95% 3.79Freedom Life Ins. Co. of America 13 25 312 $105,132 $108,615 103.31% 1.17% 1.36Symetra Life Ins. Co. 6 125 1,319 $96,074 $78,835 82.06% 1.07% 1.14Mid-West National Life Ins. Co. of TN 19 35 564 $75,297 $29,452 39.11% 0.84% 0.70Fidelity Security Life Ins. Co. 1 62 1,260 $38,338 $24,921 65.00% 0.43% 0.18United States Fire Ins. 669 669 1,905 $30,604 $17,596 57.50% 0.34% 0.12Amex Assur. Co. 0 265 3,299 $28,546 ($77) -0.27% 0.32% 0.10Monumental Life Ins. Co. 88 88 1,056 $28,140 $5,218 18.54% 0.31% 0.10American Heritage Life Ins. Co. 9 126 1,512 $22,641 $860 3.80% 0.25% 0.06Fairmont Specialty Ins. Co. 850 850 8,075 $22,605 $35,308 156.20% 0.25% 0.06Provident Life and Acc. Ins. Co. 0 182 0 $17,697 $174 0.98% 0.20% 0.04Reliance Standard Life Ins. Co. 3 29 0 $15,091 $12,287 81.42% 0.17% 0.03Colonial Life & Accident Ins. Co. 0 15 0 $14,183 $10,435 73.57% 0.16% 0.02Life Investors Ins. Co. of America 16 17 210 $11,833 $2,102 17.76% 0.13% 0.02Genworth Life & Annuity Ins. Co. 2 2 24 $11,576 $4,381 37.85% 0.13% 0.02Bankers Fidelity Life Ins. Co. 20 20 293 $10,361 $2,930 28.28% 0.11% 0.01Loyal American Life Ins. Co. 41 41 512 $9,382 $1,422 15.16% 0.10% 0.01Mutual of Omaha Ins. Co. 28 32 384 $8,989 $12,671 140.96% 0.10% 0.01Union Labor Life Ins. Co. 0 37 450 $8,679 $1,450 16.71% 0.10% 0.01Nationwide Life Ins. Co. of America 28 32 408 $4,826 $859 17.80% 0.05% 0.00Conseco Ins. Co. 1 6 72 $4,441 $11,383 256.32% 0.05% 0.00Pan-American Life Ins. Co. 5 11 76 $3,379 $0 0.00% 0.04% 0.00American Gen. Life and Acc. Ins. Co. 2 2 36 $2,569 $234 9.11% 0.03% 0.00Allianz Life Ins. Co. of North America 2 21 252 $2,391 $7,840 327.90% 0.03% 0.00AIG Life Ins. Co. 4 4 48 $1,477 $0 0.00% 0.02% 0.00AIG Premier Ins. Co. 2 4 54 $904 $187 20.69% 0.01% 0.00HM Life Ins. Co. 1 2 24 $371 $0 0.00% 0.00% 0.00Guarantee Trust Life Ins. Co. 2 2 24 $234 $1,044 446.15% 0.00% 0.00TOTALS 3,567 5,618 56,593 $9,010,517 $4,425,548 49.12% 100.00% 4,032.35
Group Specified/Named Disease Policies Lives Member Months Premium Earned Claims Incurred Loss Ratio Market Share HHIConseco Health Ins. Co. 9,782 24,391 289,538 $4,730,272 $6,976,863 147.49% 58.13% 3,379.05American Family Life Assur. Co. 5,066 11,526 129,881 $1,626,241 $1,628,322 100.13% 19.98% 399.38United Teacher Associates Ins. Co. 2,439 3,928 44,567 $1,169,600 $415,431 35.52% 14.37% 206.58Monumental Life Ins. Co. 1,640 1,647 19,764 $244,520 $117,016 47.86% 3.00% 9.03Mutual of Omaha Ins. Co. 808 990 11,877 $90,045 $54,068 60.05% 1.11% 1.22Mega Life and Health Ins. Co. 339 572 6,637 $78,540 $43,197 55.00% 0.97% 0.93American Heritage Life Ins. Co. 1 1 12 $57,424 $4,189 7.29% 0.71% 0.50Zurich American Ins. Co. 1 268 3,216 $22,079 $0 0.00% 0.27% 0.07HM Life Ins. Co. 1 97 1,164 $19,743 $0 0.00% 0.24% 0.06Continental American Ins. Co. 22 22 264 $17,139 $7,491 43.71% 0.21% 0.04Baltimore Life Ins. Co. 13 144 1,474 $16,607 $10,000 60.22% 0.20% 0.04Union Fidelity Life Ins. Co. 115 173 2,076 $16,432 $1,763 10.73% 0.20% 0.04Fidelity Security Life Ins. Co. 0 204 2,460 $15,070 $2,141 14.21% 0.19% 0.03Washington National Ins. Co. 1 195 2,388 $13,807 $10,675 77.32% 0.17% 0.03Transamerica Life Ins. Co. 3 20 372 $6,532 $99 1.52% 0.08% 0.01Physicians Mutual Ins. Co. 6 6 72 $4,910 $0 0.00% 0.06% 0.00Combined Ins. Co. of America 14 22 264 $2,474 $990 40.02% 0.03% 0.00Colonial Life & Accident Ins. Co. 54 0 0 $1,799 $0 0.00% 0.02% 0.00Guarantee Trust Life Ins. Co. 11 11 82 $1,725 $0 0.00% 0.02% 0.00Mid-West National Life Ins. Co. of TN 7 10 152 $1,442 $937 64.98% 0.02% 0.00Reliastar Life Ins. Co. 3 3 36 $319 $0 0.00% 0.00% 0.00Union Labor Life Ins. Co. 0 12 144 $226 $0 0.00% 0.00% 0.00Nationwide Life Ins. Co. of America 1 1 12 $215 $0 0.00% 0.00% 0.00Genworth Life & Annuity Ins. Co. 1 1 12 $210 $0 0.00% 0.00% 0.00American Public Life Ins. Co. 0 0 0 $89 $0 0.00% 0.00% 0.00Allianz Life Ins. Co. of North America 1 1 1 $4 $13 325.00% 0.00% 0.00Life Ins. Co. of North America 0 0 0 $0 $203,709 ---- 0.00% 0.00TOTALS 20,329 44,245 516,465 $8,137,464 $9,476,904 116.46% 100.00% 3,997.03

Group Limited Benefit Policies Lives Member Months Premium Earned Claims Incurred Loss Ratio Market Share HHIVision Service Plan Ins. Co. 88 48,049 537,659 $3,119,141 $2,341,889 75.08% 59.97% 3,596.52Guardian Life Ins. Co. 179 17,858 149,241 $586,212 $250,836 42.79% 11.27% 127.03Monumental Life Ins. Co. 451 493 5,916 $370,907 $212,202 57.21% 7.13% 50.86National Guardian Life Ins. Co. 2 1,530 20,142 $268,546 $159,214 59.29% 5.16% 26.66Standard Security Life Ins. Co. of NY 5 233 0 $157,932 $50,814 32.17% 3.04% 9.22Pan-American Life Ins. Co. 4 195 2,346 $144,329 $131,260 90.94% 2.77% 7.70Stonebridge Life Ins. Co. 2,033 3,234 38,808 $130,713 $154,401 118.12% 2.51% 6.32Ameritas Life Ins. Corporation 18 11,245 134,940 $110,778 $50,582 45.66% 2.13% 4.54Principal Life Ins. Co. 16 985 14,721 $88,178 $44,068 49.98% 1.70% 2.87ACE American Ins. Co. 1 5 66 $51,612 $0 0.00% 0.99% 0.98Union Fidelity Life Ins. Co. 101 119 1,428 $22,435 $13,188 58.78% 0.43% 0.19AIG Life Ins. Co. 6 36 432 $18,971 $1,141 6.01% 0.36% 0.13Fidelity Security Life Ins. Co. 4 352 4,038 $18,299 $8,617 47.09% 0.35% 0.12American Fidelity Assur. Co. 5 71 566 $18,098 $3,912 21.62% 0.35% 0.12Security Life Ins. Co. of America 9 141 12 $13,479 $4,048 30.03% 0.26% 0.07Highmark West Virginia, Inc. 8 13 77 $12,149 $3,171 26.10% 0.23% 0.05Continental American Ins. Co. 22 22 264 $11,667 $5,100 43.71% 0.22% 0.05Allstate Life Ins. Co. 6 50 600 $10,908 $1,352 12.39% 0.21% 0.04Kanawha Ins. Co. 34 34 240 $9,600 $0 0.00% 0.18% 0.03Mega Life and Health Ins. Co. 24 37 418 $8,725 $1,250 14.33% 0.17% 0.03HM Life Ins. Co. 1 6 72 $7,998 $0 0.00% 0.15% 0.02Washington National Ins. Co. 1 6 72 $7,837 $6,059 77.31% 0.15% 0.02Combined Ins. Co. of America 15 15 180 $6,273 $1,277 20.36% 0.12% 0.01National Benefit Life Ins. Co. 16 16 192 $2,407 $3,286 136.52% 0.05% 0.00Aetna Life Ins. Co. 1 1 32 $1,628 $100 6.14% 0.03% 0.00Companion Life Ins. Co. 1 7 88 $804 $650 80.85% 0.02% 0.00Colonial Penn Life Ins. Co. 1 3 42 $754 $44 5.84% 0.01% 0.00Transamerica Life Ins. Co. 1 7 42 $355 $1,575 443.66% 0.01% 0.00Transamerica Financial Life Ins. Co. 2 2 24 $214 $0 0.00% 0.00% 0.00American Republic Ins. Co. 3 3 0 $204 $0 0.00% 0.00% 0.00Reliastar Life Ins. Co. 0 0 0 $11 ($64) -581.82% 0.00% 0.00Nationwide Life Ins. 0 321 3,152 $0 $0 ---- 0.00% 0.00Markel Ins. Co. 2 200 1,550 $0 $0 ---- 0.00% 0.00Central United Life Ins. Co. 5 10 12 $0 $0 ---- 0.00% 0.00Colonial Life & Accident Ins. Co. 1 0 0 $0 $1,223 ---- 0.00% 0.00Reliastar Life Ins. Co. of New York 0 0 0 ($84) ($13) 15.48% 0.00% 0.00TOTALS 3,066 85,299 917,372 $5,201,080 $3,451,182 66.36% 100.00% 3,833.61
Group Student Policies Policies Lives Member Months Premium Earned Claims Incurred Loss Ratio Market Share HHICommercial Travelers Mutual Ins. Co. 3 1,188 11,164 $203,084 $100,977 49.72% 20.29% 411.84Nat. Un. Fire Ins. Co. of Pitt, PA 1 57 399 $185,387 $158,095 85.28% 18.53% 343.19Unicare Life & Health Ins. Co. 1 5 2,767 $166,706 $104,988 62.98% 16.66% 277.51United States Fire Ins. 1 279 3,348 $148,341 $91,403 61.62% 14.82% 219.73HM Life Ins. Co. 2 184 2,208 $143,968 $0 0.00% 14.39% 206.97Sentry Life Ins. Co. 4 85 1,020 $96,394 $20,399 21.16% 9.63% 92.78Nationwide Life Ins. 6 14 70 $42,476 $3,362 7.92% 4.24% 18.02Mutual of Omaha Ins. Co. 4 2,580 8,879 $9,605 $339 3.53% 0.96% 0.92Columbian Life Ins. Co. 0 0 0 $3,420 $48,566 1420.06% 0.34% 0.12Monumental Life Ins. Co. 1 1 12 $1,338 $112,761 8427.58% 0.13% 0.02Markel Ins. Co. 1 276 1,380 $0 $0 ---- 0.00% 0.00BCS Ins. Co. 0 0 0 $0 $7,943 ---- 0.00% 0.00TOTALS 24 4,669 31,247 $1,000,719 $648,833 64.84% 100.00% 1,571.10
Group Accident Only or AD&D Policies Lives Member Months Premium Earned Claims Incurred Loss Ratio Market Share HHIHartford Life and Accident Ins. Co. 95 26,376 304,512 $4,608,588 $2,205,504 47.86% 28.17% 793.74Life Ins. Co. of North America 13 36,434 0 $1,176,816 $1,415,555 120.29% 7.19% 51.76CUNA Mutual Ins. Co. 42 114,339 1,344,335 $1,076,378 $386,233 35.88% 6.58% 43.30Continental Casualty Co. 0 0 0 $916,577 $216,002 23.57% 5.60% 31.40Stonebridge Life Ins. Co. 8,488 18,581 222,972 $886,448 $43,237 4.88% 5.42% 29.37Metropolitan Life Ins. Co. 219 51,566 618,792 $879,314 $907,810 103.24% 5.38% 28.90Symetra Life Ins. Co. 7 885 10,345 $716,626 $0 0.00% 4.38% 19.19Nat. Un. Fire Ins. Co. of Pitt, PA 17 56,219 674,628 $704,914 $433,326 61.47% 4.31% 18.57Hartford Life Ins. Co. 0 10,710 128,520 $585,173 $365,796 62.51% 3.58% 12.80Mutual of Omaha Ins. Co. 251 19,279 127,471 $496,717 $126,340 25.44% 3.04% 9.22AIG Life Ins. Co. 35 39 468 $453,337 $536,657 118.38% 2.77% 7.68Prudential Ins. Co. of America 1 1 12 $446,082 $890,017 199.52% 2.73% 7.44Monumental Life Ins. Co. 3,428 3,458 41,496 $382,233 $121,714 31.84% 2.34% 5.46Aetna Life Ins. Co. 13 1,724 20,688 $350,345 $328,337 93.72% 2.14% 4.59Unum Life Ins. Co. of America 138 14,400 0 $241,471 $771,942 319.68% 1.48% 2.18Amex Assur. Co. 0 96,744 1,233,584 $239,207 ($3,214) -1.34% 1.46% 2.14Allstate Life Ins. Co. 11 3,406 40,872 $223,809 $130,699 58.40% 1.37% 1.87Guardian Life Ins. Co. 260 12,457 127,980 $192,107 $105,821 55.08% 1.17% 1.38American Income Life Ins. Co. 292 163,938 2,012,868 $130,343 $92,692 71.11% 0.80% 0.63Boston Mutual Life Ins. Co. 6 1,151 21,120 $124,620 $58,080 46.61% 0.76% 0.58Great-West Life & Annuity Ins. Co. 0 0 0 $122,180 $110,469 90.41% 0.75% 0.56Security Life Ins. Co. of America 52 1,378 12 $102,469 $6,218 6.07% 0.63% 0.39Washington National Ins. Co. 1 3,088 39,456 $97,959 $75,736 77.31% 0.60% 0.36Federal Ins. Co. 19 1,226 14,712 $93,477 $2,792 2.99% 0.57% 0.33Liberty Life Ins. Co. 728 1,104 12,978 $92,028 $0 0.00% 0.56% 0.32Standard Ins. Co. 63 3,075 83,142 $89,816 $27,624 30.76% 0.55% 0.30Lincoln National Life Ins. Co. 58 9,299 111,588 $85,493 $5,420 6.34% 0.52% 0.27Untd Sts Life Ins. Co. In the City of NY 48 251 3,011 $73,729 $4,685 6.35% 0.45% 0.20United of Omaha Life Ins. Co. 51 4,057 0 $51,125 $2,768 5.41% 0.31% 0.10
Group Accident Only or AD&D Policies Lives Member Months Premium Earned Claims Incurred Loss Ratio Market Share HHI

Group Accident Only or AD&D Policies Lives Member Months Premium Earned Claims Incurred Loss Ratio Market Share HHIUnion Security Ins. Co. 128 846 4,579 $48,283 $13,250 27.44% 0.30% 0.09Union Labor Life Ins. Co. 28 7,910 92,496 $44,478 $101,998 229.32% 0.27% 0.07New York Life Ins. Co. 31 995 11,940 $43,923 $9,285 21.14% 0.27% 0.07Union Fidelity Life Ins. Co. 483 1,015 12,180 $39,010 $4,246 10.88% 0.24% 0.06American Sentinel Ins. Co. 4 1,181 13,992 $35,786 $7,086 19.80% 0.22% 0.05Guarantee Trust Life Ins. Co. 10 184 1,407 $32,668 $2,031 6.22% 0.20% 0.04Life Investors Ins. Co. of America 160 240 2,988 $29,511 $0 0.00% 0.18% 0.03State Farm Mutual Auto. Ins. Co. 1 646 7,891 $28,156 ($264) -0.94% 0.17% 0.03Conseco Health Ins. Co. 55 137 1,804 $27,412 $9,450 34.47% 0.17% 0.03ACE American Ins. Co. 3 1,428 17,136 $25,806 $0 0.00% 0.16% 0.02Shenandoah Life Ins. Co. 66 1,943 22,428 $25,130 $6,513 25.92% 0.15% 0.02Reliance Standard Life Ins. Co. 9 1,391 0 $24,144 $68,455 283.53% 0.15% 0.02Starnet Ins. Co. 55 4,856 4 $23,445 $0 0.00% 0.14% 0.02Continental American Ins. Co. 175 175 2,100 $21,995 $9,614 43.71% 0.13% 0.02American Health & Life Ins. Co. 1,914 2,029 0 $21,127 ($1,550) -7.34% 0.13% 0.02HM Life Ins. Co. 1 97 1,164 $19,877 $0 0.00% 0.12% 0.01American Heritage Life Ins. Co. 0 0 0 $19,482 $2,311 11.86% 0.12% 0.01Republic Western Ins. Co. 1 1 12 $18,742 ($1,850) -9.87% 0.11% 0.01National Casualty Co. 28 12,780 153,360 $16,327 $1,307 8.01% 0.10% 0.01Lafayette Life Ins. Co. 12 777 9,324 $15,683 $0 0.00% 0.10% 0.01American United Life Ins. Co. 20 1,164 13,968 $15,107 $0 0.00% 0.09% 0.01Zurich American Ins. Co. 1 99 1,188 $15,036 $29,832 198.40% 0.09% 0.01Balboa Life Ins. Co. 668 716 8,592 $13,418 $1,553 11.57% 0.08% 0.01Kanawha Ins. Co. 49 49 654 $12,906 $0 0.00% 0.08% 0.01John Alden Life Ins. Co. 120 623 7,714 $12,687 $24 0.19% 0.08% 0.01American General Assur. Co. 0 137 1,644 $12,131 $6,483 53.44% 0.07% 0.01Medical Benefits Mutual Life Ins. Co. 57 996 11,554 $11,554 $0 0.00% 0.07% 0.00Mega Life and Health Ins. Co. 32 44 11,783 $10,671 $15,044 140.98% 0.07% 0.00OneBeacon America Ins. Co. 2 327 1,962 $8,986 $0 0.00% 0.05% 0.00Conseco Ins. Co. 1 10 120 $6,662 $17,074 256.29% 0.04% 0.00Transamerica Life Ins. Co. 4 21 276 $5,877 $0 0.00% 0.04% 0.00Perico Life Ins. Co. 18 22 264 $4,680 $0 0.00% 0.03% 0.00Paul Revere Life Ins. Co. 4 172 0 $3,895 $0 0.00% 0.02% 0.00Sentry Ins. A Mutual Co. 1 88 1,056 $3,518 $0 0.00% 0.02% 0.00Combined Ins. Co. of America 21 38 456 $2,715 $722 26.59% 0.02% 0.00Standard Security Life Ins. Co. of NY 1 45 0 $2,640 $0 0.00% 0.02% 0.00Chesapeak Life Ins. Co. 3 119 1,398 $2,234 ($244) -10.92% 0.01% 0.00Provident Life and Acc. Ins. Co. 2 353 0 $2,091 $152,981 7316.16% 0.01% 0.00Alta Health & Life Ins. Co. 0 0 0 $1,926 $1,458 75.70% 0.01% 0.00Time Ins. Co. 21 108 1,440 $1,790 $0 0.00% 0.01% 0.00QBE Ins. Corporation 13 0 0 $1,652 $1,004 60.80% 0.01% 0.00Fidelity Security Life Ins. Co. 0 15 174 $1,402 $2,899 206.78% 0.01% 0.00Commercial Travelers Mutual Ins. Co. 0 14 180 $1,376 $0 0.00% 0.01% 0.00Unicare Life & Health Ins. Co. 1 50 608 $996 $0 0.00% 0.01% 0.00Bankers Life and Casualty Co. 2 3 36 $906 $0 0.00% 0.01% 0.00Colonial Penn Life Ins. Co. 3 7 90 $704 $48 6.82% 0.00% 0.00Government Employees Ins. Co. 4 4 48 $517 ($4) -0.77% 0.00% 0.00American Fidelity Assur. Co. 1 1 12 $470 $1,494 317.87% 0.00% 0.00Reliastar Life Ins. Co. 3 44 528 $459 $0 0.00% 0.00% 0.00New England Life Ins. Co. 0 0 0 $422 $0 0.00% 0.00% 0.00Pan-American Life Ins. Co. 1 1 5 $400 $352 88.00% 0.00% 0.00Nationwide Life Ins. Co. of America 3 4 54 $389 $0 0.00% 0.00% 0.00USAA Life Ins. Co. 1 3 24 $197 $0 0.00% 0.00% 0.00Old Republic Life Ins. Co. 1 0 0 $120 $0 0.00% 0.00% 0.00Reassure America Life Ins. Co. 1 1 12 $100 $0 0.00% 0.00% 0.00Transamerica Financial Life Ins. Co. 1 1 12 $61 $0 0.00% 0.00% 0.00American General Life Ins. Co. 0 0 0 $36 $0 0.00% 0.00% 0.00Brokers National Life Assur. Co. 10 10 120 $16 $0 0.00% 0.00% 0.00Baltimore Life Ins. Co. 0 0 1 $12 $0 0.00% 0.00% 0.00Anthem Life Ins. Co. 1 4 48 $8 $0 0.00% 0.00% 0.00Markel Ins. Co. 39 4,302 28,645 $0 $0 ---- 0.00% 0.00Gerber Life Ins. Co. 1 32 384 $0 $0 ---- 0.00% 0.00Connecticut General Life Ins. Co. 2 3 35 ($3,180) ($2,794) 87.86% -0.02% 0.00TOTALS 18,613 703,446 7,645,452 $16,357,953 $9,828,068 60.08% 100.00% 1,075.72

Group Short Term Disability Policies Lives Member Months Premium Earned Claims Incurred Loss Ratio Market Share HHIMetropolitan Life Ins. Co. 70 8,223 98,676 $1,222,021 $1,106,768 90.57% 11.04% 121.80Unum Life Ins. Co. of America 66 4,220 0 $1,143,940 $937,769 81.98% 10.33% 106.73Sun Life & Health Ins. Co. (US) 42 1,312 15,744 $1,090,597 $0 0.00% 9.85% 97.01Fort Dearborn Life Ins. Co. 102 2,881 0 $970,769 $643,007 66.24% 8.77% 76.86Guardian Life Ins. Co. 111 4,415 50,202 $859,619 $511,911 59.55% 7.76% 60.27Prudential Ins. Co. of America 17 425 5,100 $740,083 $391,520 52.90% 6.68% 44.67Monumental Life Ins. Co. 2,597 2,640 31,684 $614,553 $417,441 67.93% 5.55% 30.80American Fidelity Assur. Co. 23 2,371 21,396 $533,616 $243,567 45.64% 4.82% 23.22Standard Ins. Co. 41 2,286 30,757 $479,008 $386,908 80.77% 4.33% 18.71Union Security Ins. Co. 37 1,644 19,017 $324,276 $170,226 52.49% 2.93% 8.58Reliance Standard Life Ins. Co. 11 948 0 $283,346 $695,715 245.54% 2.56% 6.55Boston Mutual Life Ins. Co. 1 49 3,444 $253,349 $192,298 75.90% 2.29% 5.24Lincoln National Life Ins. Co. 16 1,547 18,564 $249,886 $104,691 41.90% 2.26% 5.09American Bankers Life Assur. Co. 0 0 0 $209,227 ($17,984) -8.60% 1.89% 3.57Eastern Life and Health Ins. Co. 14 970 12,678 $202,210 $130,817 64.69% 1.83% 3.33Sun Life Assur. Co. of Canada (US) 22 2,031 15,144 $187,936 $316,614 168.47% 1.70% 2.88Hartford Life and Accident Ins. Co. 0 103 1,236 $187,784 $135,362 72.08% 1.70% 2.88American United Life Ins. Co. 7 510 6,120 $173,780 $58,533 33.68% 1.57% 2.46Colonial Life & Accident Ins. Co. 2 455 0 $159,259 $142,861 89.70% 1.44% 2.07Principal Life Ins. Co. 47 760 8,453 $141,456 $90,300 63.84% 1.28% 1.63Northwestern Mutual Life Ins. Co. 13 309 3,603 $136,747 $20,531 15.01% 1.23% 1.53Hartford Life Ins. Co. 0 138 1,656 $100,219 $62,648 62.51% 0.91% 0.82American General Assur. Co. 23 3,567 0 $90,733 $663,313 731.06% 0.82% 0.67Companion Life Ins. Co. 27 306 3,653 $84,405 $72,827 86.28% 0.76% 0.58Aetna Life Ins. Co. 19 212 2,428 $82,827 $283,518 342.30% 0.75% 0.56United of Omaha Life Ins. Co. 12 292 0 $60,621 $191,063 315.18% 0.55% 0.30Shenandoah Life Ins. Co. 16 287 3,834 $56,418 $24,232 42.95% 0.51% 0.26Life Ins. Co. of North America 5 244 0 $52,469 $419,983 800.44% 0.47% 0.22CUNA Mutual Ins. Co. 10 232 2,806 $44,950 $34,291 76.29% 0.41% 0.16Provident Life and Acc. Ins. Co. 1 386 0 $44,011 $30,579 69.48% 0.40% 0.16Liberty Life Ins. Co. 96 96 1,338 $40,592 ($6,958) -17.14% 0.37% 0.13Mega Life and Health Ins. Co. 89 89 1,031 $29,500 $17,700 60.00% 0.27% 0.07Transamerica Life Ins. Co. 5 76 666 $28,391 $1,448 5.10% 0.26% 0.07AIG Life Ins. Co. 5 76 912 $24,885 $9,146 36.75% 0.22% 0.05American Heritage Life Ins. Co. 23 211 2,532 $21,519 $6,055 28.14% 0.19% 0.04Untd Sts Life Ins. Co. In the City of NY 15 69 828 $17,257 $3,513 20.36% 0.16% 0.02Illinois Mutual Life Ins. Co. 4 53 660 $14,693 $18,299 124.54% 0.13% 0.02Great-West Life & Annuity Ins. Co. 0 0 0 $13,451 $12,161 90.41% 0.12% 0.01Horace Mann Life Ins. Co. 2 41 492 $11,128 $1,644 14.77% 0.10% 0.01Reliastar Life Ins. Co. 7 38 456 $10,220 $24,512 239.84% 0.09% 0.01Unicare Life & Health Ins. Co. 1 50 608 $9,789 $47,443 484.66% 0.09% 0.01Paul Revere Life Ins. Co. 3 48 0 $8,579 $851 9.92% 0.08% 0.01John Alden Life Ins. Co. 8 28 351 $7,978 $10,932 137.03% 0.07% 0.01Lafayette Life Ins. Co. 2 30 360 $7,734 $0 0.00% 0.07% 0.00Minnesota Life Ins. Co. 3 110 1,152 $6,862 $19,650 286.36% 0.06% 0.00Kanawha Ins. Co. 30 30 204 $5,931 $1,098 18.51% 0.05% 0.00Life Investors Ins. Co. of America 13 13 204 $5,637 ($7,878) -139.76% 0.05% 0.00Medical Benefits Mutual Life Ins. Co. 2 80 1,046 $4,706 $11,596 246.41% 0.04% 0.00New York Life Ins. Co. 1 2 24 $4,276 $2,223 51.99% 0.04% 0.00American Public Life Ins. Co. 0 0 0 $4,273 $1,119 26.19% 0.04% 0.00Fidelity Security Life Ins. Co. 0 9 108 $4,008 $0 0.00% 0.04% 0.00Kansas City Life Ins. Co. 1 11 132 $3,449 $0 0.00% 0.03% 0.00Humana Ins. Co. 2 9 108 $2,863 $2,887 100.84% 0.03% 0.00Mutual of Omaha Ins. Co. 3 7 77 $2,247 ($1,510) -67.20% 0.02% 0.00Harleysville Life Ins. Co. 1 17 204 $2,232 $396 17.74% 0.02% 0.00Federated Mutual Ins. Co. 6 49 366 $2,198 $278 12.65% 0.02% 0.00BCS Life Ins. Co. 0 0 0 $1,898 $3,756 197.89% 0.02% 0.00Union Labor Life Ins. Co. 0 2 24 $1,116 $585 52.42% 0.01% 0.00Great Southern Life Ins. Co. 2 2 24 $407 $0 0.00% 0.00% 0.00Heritage Casualty Ins. Co. 1 24 288 $378 $0 0.00% 0.00% 0.00Sentry Life Ins. Co. 0 0 35 $290 $0 0.00% 0.00% 0.00Teachers Prot. Mutual Life Ins. Co. 1 1 12 $164 $0 0.00% 0.00% 0.00Allianz Life Ins. Co. of North America 1 6 72 $160 $526 328.75% 0.00% 0.00Pan-American Life Ins. Co. 5 11 76 $158 $0 0.00% 0.00% 0.00Baltimore Life Ins. Co. 0 0 1 $102 $17,837 17487.25% 0.00% 0.00Liberty Life Assur. Co. of Boston 0 0 0 $0 $202,147 ---- 0.00% 0.00Connecticut General Life Ins. Co. 3 3 35 ($6,440) ($5,658) 87.86% -0.06% 0.00TOTALS 3,687 45,054 370,621 $11,072,746 $8,857,107 79.99% 100.00% 630.12

Group Long Term Disability Policies Lives Member Months Premium Earned Claims Incurred Loss Ratio Market Share HHIHartford Life and Accident Ins. Co. 87 55,695 668,340 $10,295,554 $8,455,361 82.13% 24.78% 614.22Unum Life Ins. Co. of America 172 21,171 0 $4,768,173 $6,237,780 130.82% 11.48% 131.74Standard Ins. Co. 84 14,109 163,562 $4,212,308 $2,829,919 67.18% 10.14% 102.82Metropolitan Life Ins. Co. 72 21,081 252,972 $4,029,493 $3,781,151 93.84% 9.70% 94.09Life Ins. Co. of North America 16 14,526 0 $3,123,070 $4,729,189 151.43% 7.52% 56.52Prudential Ins. Co. of America 10 4,155 49,860 $2,126,336 $2,158,516 101.51% 5.12% 26.20Guardian Life Ins. Co. 136 6,627 72,798 $1,460,319 $1,097,276 75.14% 3.52% 12.36Sun Life & Health Ins. Co. (US) 42 1,596 19,152 $1,314,937 $244,494 18.59% 3.17% 10.02Reliastar Life Ins. Co. 40 2,470 29,640 $1,090,211 $588,500 53.98% 2.62% 6.89Northwestern Mutual Life Ins. Co. 100 2,780 28,995 $975,437 ($476,643) -48.86% 2.35% 5.51Lincoln National Life Ins. Co. 20 5,887 70,644 $967,332 $1,033,518 106.84% 2.33% 5.42Union Security Ins. Co. 54 35,013 420,156 $937,452 $691,712 73.79% 2.26% 5.09Sun Life Assur. Co. of Canada (US) 40 7,682 19,692 $891,834 $794,083 89.04% 2.15% 4.61Mutual of Omaha Ins. Co. 39 3,149 37,788 $860,390 $1,174,820 136.55% 2.07% 4.29Principal Life Ins. Co. 35 2,357 27,507 $695,517 $240,263 34.54% 1.67% 2.80Untd Sts Life Ins. Co. In the City of NY 14 489 5,865 $472,419 $416,925 88.25% 1.14% 1.29American Fidelity Assur. Co. 21 2,417 24,977 $456,814 $338,030 74.00% 1.10% 1.21Fort Dearborn Life Ins. Co. 49 2,217 0 $455,968 $202,464 44.40% 1.10% 1.20United of Omaha Life Ins. Co. 37 1,553 0 $453,438 $479,909 105.84% 1.09% 1.19New York Life Ins. Co. 25 340 4,080 $371,795 $198,910 53.50% 0.89% 0.80Reliance Standard Life Ins. Co. 15 1,459 0 $213,813 $1,738,715 813.19% 0.51% 0.26Liberty Life Assur. Co. of Boston 2 1,588 19,056 $187,376 $593,137 316.55% 0.45% 0.20Aetna Life Ins. Co. 4 1,397 15,527 $175,914 $2,157,724 1226.58% 0.42% 0.18Boston Mutual Life Ins. Co. 8 1,487 27,426 $160,945 $106,497 66.17% 0.39% 0.15Paul Revere Life Ins. Co. 19 205 0 $142,452 $160,204 112.46% 0.34% 0.12Companion Life Ins. Co. 24 484 5,824 $129,005 $50,698 39.30% 0.31% 0.10CUNA Mutual Ins. Co. 48 530 6,387 $125,753 $17,218 13.69% 0.30% 0.09Hartford Life Ins. Co. 0 3,449 41,388 $106,665 $101,937 95.57% 0.26% 0.07Horace Mann Life Ins. Co. 2 722 8,664 $73,673 $164,127 222.78% 0.18% 0.03American United Life Ins. Co. 5 339 4,068 $49,411 $73,182 148.11% 0.12% 0.01Continental American Ins. Co. 95 95 1,140 $48,390 $21,151 43.71% 0.12% 0.01Eastern Life and Health Ins. Co. 6 274 4,746 $39,399 $134,945 342.51% 0.09% 0.01Mutual of America Life Ins. Co. 14 94 1,128 $34,092 $74,637 218.93% 0.08% 0.01Shenandoah Life Ins. Co. 7 275 2,844 $31,483 $110,432 350.77% 0.08% 0.01Harleysville Life Ins. Co. 4 111 1,332 $26,953 $0 0.00% 0.06% 0.00Lafayette Life Ins. Co. 2 65 780 $23,266 $28,505 122.52% 0.06% 0.00AIG Life Ins. Co. 2 15 180 $17,930 ($523) -2.92% 0.04% 0.00Fidelity Security Life Ins. Co. 0 4 48 $10,330 $0 0.00% 0.02% 0.00Provident Life and Acc. Ins. Co. 0 12 0 $9,123 $370,142 4057.24% 0.02% 0.00Kanawha Ins. Co. 4 48 576 $8,958 $33,545 374.47% 0.02% 0.00Commercial Travelers Mutual Ins. Co. 1 27 426 $6,160 $0 0.00% 0.01% 0.00American Heritage Life Ins. Co. 4 14 168 $4,917 $0 0.00% 0.01% 0.00American General Assur. Co. 0 14 168 $4,023 $0 0.00% 0.01% 0.00Central Reserve Life Ins. Co. 0 0 182 $3,442 $2,753 79.98% 0.01% 0.00Kansas City Life Ins. Co. 1 2 24 $3,184 $0 0.00% 0.01% 0.00Mony Life Ins. Co. 2 3 42 $1,694 $0 0.00% 0.00% 0.00Humana Ins. Co. 1 2 24 $1,358 $0 0.00% 0.00% 0.00Minnesota Life Ins. Co. 1 2 24 $840 $7,048 839.05% 0.00% 0.00Reassure America Life Ins. Co. 0 0 0 $835 $0 0.00% 0.00% 0.00Great-West Life & Annuity Ins. Co. 0 0 0 $368 $333 90.49% 0.00% 0.00Union Fidelity Life Ins. Co. 0 0 0 $163 $0 0.00% 0.00% 0.00National Casualty Co. 1 4 0 $128 $0 0.00% 0.00% 0.00Reliastar Life Ins. Co. of New York 0 0 0 $76 $279 367.11% 0.00% 0.00American Gen. Life and Acc. Ins. Co. 1 1 12 $0 $10,423 ---- 0.00% 0.00Colonial Life & Accident Ins. Co. 0 1 0 $0 $2,237 ---- 0.00% 0.00American Int'l Life Assur. Co. of NY 0 0 0 $0 $4,225 ---- 0.00% 0.00Lincoln Life & Annuity Co. of New York 0 0 0 $0 $16,497 ---- 0.00% 0.00Lumbermens Mutual Casualty Co. 0 0 0 $0 $164,696 ---- 0.00% 0.00Teachers Ins. & Ann. Assoc. of Amer. 0 0 0 $0 $1,460,061 ---- 0.00% 0.00Union Central Life Ins. Co. 0 0 0 $0 $17,656 ---- 0.00% 0.00Connecticut General Life Ins. Co. 0 0 0 ($54) ($47) 87.04% 0.00% 0.00Continental Casualty Co. 0 0 0 ($58,717) $128,244 -218.41% -0.14% 0.02TOTALS 1,366 218,037 2,038,212 $41,542,145 $42,966,855 103.43% 100.00% 1,089.55

Total Group Disability (Short & Long) Policies Lives Member Months Premium Earned Claims Incurred Loss Ratio Market Share HHIHartford Life and Accident Ins. Co. 87 55,798 669,576 $10,483,338 $8,590,723 81.95% 19.92% 396.99Unum Life Ins. Co. of America 238 25,391 0 $5,912,113 $7,175,549 121.37% 11.24% 126.26Metropolitan Life Ins. Co. 142 29,304 351,648 $5,251,514 $4,887,919 93.08% 9.98% 99.62Standard Ins. Co. 125 16,395 194,319 $4,691,316 $3,216,827 68.57% 8.92% 79.50Life Ins. Co. of North America 21 14,770 0 $3,175,539 $5,149,172 162.15% 6.04% 36.43Prudential Ins. Co. of America 27 4,580 54,960 $2,866,419 $2,550,036 88.96% 5.45% 29.68Sun Life & Health Ins. Co. (US) 84 2,908 34,896 $2,405,534 $244,494 10.16% 4.57% 20.90Guardian Life Ins. Co. 247 11,042 123,000 $2,319,938 $1,609,187 69.36% 4.41% 19.44Fort Dearborn Life Ins. Co. 151 5,098 0 $1,426,737 $845,471 59.26% 2.71% 7.35Union Security Ins. Co. 91 36,657 439,173 $1,261,728 $861,938 68.31% 2.40% 5.75Lincoln National Life Ins. Co. 36 7,434 89,208 $1,217,218 $1,138,209 93.51% 2.31% 5.35Northwestern Mutual Life Ins. Co. 113 3,089 32,598 $1,112,184 ($456,112) -41.01% 2.11% 4.47Reliastar Life Ins. Co. 47 2,508 30,096 $1,100,431 $613,012 55.71% 2.09% 4.37Sun Life Assur. Co. of Canada (US) 62 9,713 34,836 $1,079,770 $1,110,697 102.86% 2.05% 4.21American Fidelity Assur. Co. 44 4,788 46,373 $990,430 $581,597 58.72% 1.88% 3.54Mutual of Omaha Ins. Co. 42 3,156 37,865 $862,637 $1,173,310 136.01% 1.64% 2.69Principal Life Ins. Co. 82 3,117 35,960 $836,973 $330,563 39.50% 1.59% 2.53Monumental Life Ins. Co. 2,597 2,640 31,684 $614,553 $417,441 67.93% 1.17% 1.36United of Omaha Life Ins. Co. 49 1,845 0 $514,059 $670,972 130.52% 0.98% 0.95Reliance Standard Life Ins. Co. 26 2,407 0 $497,159 $2,434,430 489.67% 0.94% 0.89Untd Sts Life Ins. Co. In the City of NY 29 558 6,693 $489,676 $420,438 85.86% 0.93% 0.87Boston Mutual Life Ins. Co. 9 1,536 30,870 $414,294 $298,795 72.12% 0.79% 0.62New York Life Ins. Co. 26 342 4,104 $376,071 $201,133 53.48% 0.71% 0.51Aetna Life Ins. Co. 23 1,609 17,955 $258,741 $2,441,242 943.51% 0.49% 0.24Eastern Life and Health Ins. Co. 20 1,244 17,424 $241,609 $265,762 110.00% 0.46% 0.21American United Life Ins. Co. 12 849 10,188 $223,191 $131,715 59.01% 0.42% 0.18Companion Life Ins. Co. 51 790 9,477 $213,410 $123,525 57.88% 0.41% 0.16American Bankers Life Assur. Co. 0 0 0 $209,227 ($17,984) -8.60% 0.40% 0.16Hartford Life Ins. Co. 0 3,587 43,044 $206,884 $164,585 79.55% 0.39% 0.15Liberty Life Assur. Co. of Boston 2 1,588 19,056 $187,376 $795,284 424.43% 0.36% 0.13CUNA Mutual Ins. Co. 58 762 9,193 $170,703 $51,509 30.17% 0.32% 0.11Colonial Life & Accident Ins. Co. 2 456 0 $159,259 $145,098 91.11% 0.30% 0.09Paul Revere Life Ins. Co. 22 253 0 $151,031 $161,055 106.64% 0.29% 0.08American General Assur. Co. 23 3,581 168 $94,756 $663,313 700.02% 0.18% 0.03Shenandoah Life Ins. Co. 23 562 6,678 $87,901 $134,664 153.20% 0.17% 0.03Horace Mann Life Ins. Co. 4 763 9,156 $84,801 $165,771 195.48% 0.16% 0.03Provident Life and Acc. Ins. Co. 1 398 0 $53,134 $400,721 754.17% 0.10% 0.01Continental American Ins. Co. 95 95 1,140 $48,390 $21,151 43.71% 0.09% 0.01AIG Life Ins. Co. 7 91 1,092 $42,815 $8,623 20.14% 0.08% 0.01Liberty Life Ins. Co. 96 96 1,338 $40,592 ($6,958) -17.14% 0.08% 0.01Mutual of America Life Ins. Co. 14 94 1,128 $34,092 $74,637 218.93% 0.06% 0.00Lafayette Life Ins. Co. 4 95 1,140 $31,000 $28,505 91.95% 0.06% 0.00Mega Life and Health Ins. Co. 89 89 1,031 $29,500 $17,700 60.00% 0.06% 0.00Harleysville Life Ins. Co. 5 128 1,536 $29,185 $396 1.36% 0.06% 0.00Transamerica Life Ins. Co. 5 76 666 $28,391 $1,448 5.10% 0.05% 0.00American Heritage Life Ins. Co. 27 225 2,700 $26,436 $6,055 22.90% 0.05% 0.00Kanawha Ins. Co. 34 78 780 $14,889 $34,643 232.68% 0.03% 0.00Illinois Mutual Life Ins. Co. 4 53 660 $14,693 $18,299 124.54% 0.03% 0.00Fidelity Security Life Ins. Co. 0 13 156 $14,338 $0 0.00% 0.03% 0.00Great-West Life & Annuity Ins. Co. 0 0 0 $13,819 $12,494 90.41% 0.03% 0.00Unicare Life & Health Ins. Co. 1 50 608 $9,789 $47,443 484.66% 0.02% 0.00John Alden Life Ins. Co. 8 28 351 $7,978 $10,932 137.03% 0.02% 0.00Minnesota Life Ins. Co. 4 112 1,176 $7,702 $26,698 346.64% 0.01% 0.00Kansas City Life Ins. Co. 2 13 156 $6,633 $0 0.00% 0.01% 0.00Commercial Travelers Mutual Ins. Co. 1 27 426 $6,160 $0 0.00% 0.01% 0.00Life Investors Ins. Co. of America 13 13 204 $5,637 ($7,878) -139.76% 0.01% 0.00Medical Benefits Mutual Life Ins. Co. 2 80 1,046 $4,706 $11,596 246.41% 0.01% 0.00American Public Life Ins. Co. 0 0 0 $4,273 $1,119 26.19% 0.01% 0.00Humana Ins. Co. 3 11 132 $4,221 $2,887 68.40% 0.01% 0.00Central Reserve Life Ins. Co. 0 0 182 $3,442 $2,753 79.98% 0.01% 0.00Federated Mutual Ins. Co. 6 49 366 $2,198 $278 12.65% 0.00% 0.00BCS Life Ins. Co. 0 0 0 $1,898 $3,756 197.89% 0.00% 0.00Mony Life Ins. Co. 2 3 42 $1,694 $0 0.00% 0.00% 0.00Union Labor Life Ins. Co. 0 2 24 $1,116 $585 52.42% 0.00% 0.00Reassure America Life Ins. Co. 0 0 0 $835 $0 0.00% 0.00% 0.00Great Southern Life Ins. Co. 2 2 24 $407 $0 0.00% 0.00% 0.00Heritage Casualty Ins. Co. 1 24 288 $378 $0 0.00% 0.00% 0.00Sentry Life Ins. Co. 0 0 35 $290 $0 0.00% 0.00% 0.00Teachers Prot. Mutual Life Ins. Co. 1 1 12 $164 $0 0.00% 0.00% 0.00Union Fidelity Life Ins. Co. 0 0 0 $163 $0 0.00% 0.00% 0.00Allianz Life Ins. Co. of North America 1 6 72 $160 $526 328.75% 0.00% 0.00Pan-American Life Ins. Co. 5 11 76 $158 $0 0.00% 0.00% 0.00National Casualty Co. 1 4 0 $128 $0 0.00% 0.00% 0.00Baltimore Life Ins. Co. 0 0 1 $102 $17,837 17487.25% 0.00% 0.00Reliastar Life Ins. Co. of New York 0 0 0 $76 $279 367.11% 0.00% 0.00American Gen. Life and Acc. Ins. Co. 1 1 12 $0 $10,423 ---- 0.00% 0.00American Int'l Life Assur. Co. of NY 0 0 0 $0 $4,225 ---- 0.00% 0.00Lincoln Life & Annuity Co. of New York 0 0 0 $0 $16,497 ---- 0.00% 0.00Lumbermens Mutual Casualty Co. 0 0 0 $0 $164,696 ---- 0.00% 0.00Teachers Ins. & Ann. Assoc. of Amer. 0 0 0 $0 $1,460,061 ---- 0.00% 0.00Union Central Life Ins. Co. 0 0 0 $0 $17,656 ---- 0.00% 0.00Connecticut General Life Ins. Co. 3 3 35 ($6,494) ($5,705) 87.85% -0.01% 0.00Continental Casualty Co. 0 0 0 ($58,717) $128,244 -218.41% -0.11% 0.01TOTALS 5,053 263,091 2,408,833 $52,614,891 $51,823,962 98.50% 100.00% 855.98

Group Long Term Care (Tax Qual.) Policies Lives Member Months Premium Earned Claims Incurred Loss Ratio Market Share HHIMetropolitan Life Ins. Co. 1 2,089 25,068 $1,106,736 $511,627 46.23% 30.25% 915.24Unum Life Ins. Co. of America 22 5,781 0 $675,047 $20,337 3.01% 18.45% 340.50Aetna Life Ins. Co. 39 693 9,719 $563,684 $603,131 107.00% 15.41% 237.42John Hancock Life Ins. Co. 0 619 6,915 $380,954 ($43,549) -11.43% 10.41% 108.44United Teacher Associates Ins. Co. 249 249 2,988 $376,197 $85,019 22.60% 10.28% 105.75Genworth Life Ins. Co. 5 524 $301,091 $295,788 98.24% 8.23% 67.74Prudential Ins. Co. of America 10 10 24 $111,056 $143,591 129.30% 3.04% 9.22Medamerica Ins. Co. 0 7 84 $48,989 $0 0.00% 1.34% 1.79New York Life Ins. Co. 2 24 288 $44,208 $35,108 79.42% 1.21% 1.46Life Investors Ins. Co. of America 12 12 96 $26,666 $0 0.00% 0.73% 0.53Mutual of Omaha Ins. Co. 42 205 2,326 $24,461 $109,281 446.76% 0.67% 0.45Provident Life and Acc. Ins. Co. 0 13 0 $11,701 $0 0.00% 0.32% 0.10Transamerica Life Ins. Co. 10 14 48 $9,255 $14,625 158.02% 0.25% 0.06Connecticut General Life Ins. Co. 3 19 288 $8,021 $1,681 20.96% 0.22% 0.05Washington National Ins. Co. 1 3 48 $1,761 ($6,343) -360.19% 0.05% 0.00Sentry Ins. A Mutual Co. 1 2 24 $932 $0 0.00% 0.03% 0.00Monumental Life Ins. Co. 1 1 12 $408 $0 0.00% 0.01% 0.00Allianz Life Ins. Co. of North America 1 1 12 $110 $360 327.27% 0.00% 0.00Continental Casualty Co. 1 64 4,270 ($33,006) ($59,705) 180.89% -0.90% 0.81TOTALS 400 10,330 52,210 $3,658,271 $1,710,951 46.77% 100.00% 1,789.57
Group LTC (Non-Tax Qual.) Policies Lives Member Months Premium Earned Claims Incurred Loss Ratio Market Share HHILife Investors Ins. Co. of America 24 24 261 $40,791 $0 0.00% 39.38% 1,550.43Mutual of Omaha Ins. Co. 0 0 117 $24,383 $1,704 6.99% 23.54% 553.98Conseco Senior Health Ins. Co. 13 13 144 $13,196 $123,093 932.81% 12.74% 162.26American Fidelity Assur. Co. 1 50 432 $11,802 $4,234 35.88% 11.39% 129.79Riversource Life Ins. Co. 5 5 60 $9,877 $0 0.00% 9.53% 90.90Transamerica Occidental Life Ins. Co. 1 1 12 $2,457 $0 0.00% 2.37% 5.63Allstate Life Ins. Co. 0 0 0 $1,089 $0 0.00% 1.05% 1.11TOTALS 44 93 1,026 $103,595 $129,031 124.55% 100.00% 2,494.09
Total Group Long Term Care Policies Lives Member Months Premium Earned Claims Incurred Loss Ratio Market Share HHIMetropolitan Life Ins. Co. 1 2,089 25,068 $1,106,736 $511,627 46.23% 29.42% 865.53Unum Life Ins. Co. of America 22 5,781 0 $675,047 $20,337 3.01% 17.94% 322.00Aetna Life Ins. Co. 39 693 9,719 $563,684 $603,131 107.00% 14.98% 224.53John Hancock Life Ins. Co. 0 619 6,915 $380,954 ($43,549) -11.43% 10.13% 102.55United Teacher Associates Ins. Co. 249 249 2,988 $376,197 $85,019 22.60% 10.00% 100.01Genworth Life Ins. Co. 5 524 0 $301,091 $295,788 98.24% 8.00% 64.06Prudential Ins. Co. of America 10 10 24 $111,056 $143,591 129.30% 2.95% 8.72Life Investors Ins. Co. of America 36 36 357 $67,457 $0 0.00% 1.79% 3.22Medamerica Ins. Co. 0 7 84 $48,989 $0 0.00% 1.30% 1.70Mutual of Omaha Ins. Co. 42 205 2,443 $48,844 $110,985 227.22% 1.30% 1.69New York Life Ins. Co. 2 24 288 $44,208 $35,108 79.42% 1.18% 1.38Conseco Senior Health Ins. Co. 13 13 144 $13,196 $123,093 932.81% 0.35% 0.12American Fidelity Assur. Co. 1 50 432 $11,802 $4,234 35.88% 0.31% 0.10Provident Life and Acc. Ins. Co. 0 13 0 $11,701 $0 0.00% 0.31% 0.10Riversource Life Ins. Co. 5 5 60 $9,877 $0 0.00% 0.26% 0.07Transamerica Life Ins. Co. 10 14 48 $9,255 $14,625 158.02% 0.25% 0.06Connecticut General Life Ins. Co. 3 19 288 $8,021 $1,681 20.96% 0.21% 0.05Transamerica Occidental Life Ins. Co. 1 1 12 $2,457 $0 0.00% 0.07% 0.00Washington National Ins. Co. 1 3 48 $1,761 ($6,343) -360.19% 0.05% 0.00Allstate Life Ins. Co. 0 0 0 $1,089 $0 0.00% 0.03% 0.00Sentry Ins. A Mutual Co. 1 2 24 $932 $0 0.00% 0.02% 0.00Monumental Life Ins. Co. 1 1 12 $408 $0 0.00% 0.01% 0.00Allianz Life Ins. Co. of North America 1 1 12 $110 $360 327.27% 0.00% 0.00Continental Casualty Co. 1 64 4,270 ($33,006) ($59,705) 180.89% -0.88% 0.77TOTALS 444 10,423 53,236 $3,761,866 $1,839,982 48.91% 100.00% 1,696.64
Group Medicare Supplement (Stand.) Policies Lives Member Months Premium Earned Claims Incurred Loss Ratio Market Share HHIUnited Healthcare Ins. Co. 1 32,420 389,040 $41,482,548 $33,050,602 79.67% 75.98% 5,773.21Highmark West Virginia, Inc. 3,287 3,287 40,184 $9,491,434 $6,511,322 68.60% 17.39% 302.24Bankers Life and Casualty Co. 117 127 1,799 $1,289,316 $925,660 71.79% 2.36% 5.58Life Investors Ins. Co. of America 534 534 6,408 $903,049 $755,764 83.69% 1.65% 2.74Hartford Life Ins. Co. 0 650 7,800 $657,938 $411,281 62.51% 1.21% 1.45Principal Life Ins. Co. 163 165 2,085 $411,655 $299,409 72.73% 0.75% 0.57Sterling Life Ins. Co. 124 124 1,497 $169,349 $125,895 74.34% 0.31% 0.10Monumental Life Ins. Co. 14 14 168 $38,634 $42,019 108.76% 0.07% 0.01Transamerica Life Ins. Co. 29 29 348 $36,882 $25,130 68.14% 0.07% 0.00Cont'l Life Ins. Co. of Brentwood, TN 40 40 414 $32,809 $35,229 107.38% 0.06% 0.00American Nat. Life Ins. Co. of TX 36 36 306 $20,540 $21,192 103.17% 0.04% 0.00American Republic Ins. Co. 8 8 0 $20,033 $13,821 68.99% 0.04% 0.00Oxford Life Ins. Co. 8 8 12 $11,987 $3,945 32.91% 0.02% 0.00Central Sts H & Life Co. of Omaha 4 4 58 $8,797 $3,070 34.90% 0.02% 0.00Mutual of Omaha Ins. Co. 15 15 173 $4,947 $2,774 56.07% 0.01% 0.00CUNA Mutual Ins. Co. 0 2 24 $3,987 $1,789 44.87% 0.01% 0.00Guarantee Trust Life Ins. Co. 2 2 24 $3,914 $1,532 39.14% 0.01% 0.00Globe Life and Accident Ins. Co. 1 1 23 $2,923 $2,831 96.85% 0.01% 0.00United American Ins. Co. 1 1 12 $1,583 ($49) -3.10% 0.00% 0.00Allianz Life Ins. Co. of North America 2 4 48 $1,430 $4,688 327.83% 0.00% 0.00Companion Life Ins. Co. 1 1 12 $1,154 $225 19.50% 0.00% 0.00National Benefit Life Ins. Co. 1 1 12 $592 $10 1.69% 0.00% 0.00TOTALS 4,388 37,473 450,447 $54,595,501 $42,238,139 77.37% 100.00% 6,085.89

Group Med. Supplement (Pre-Stand.) Policies Lives Member Months Premium Earned Claims Incurred Loss Ratio Market Share HHIUnited Healthcare Ins. Co. 1 13,554 162,648 $17,357,946 $13,829,684 79.67% 89.66% 8,038.10Hartford Life and Accident Ins. Co. 4 541 6,492 $1,508,975 $708,280 46.94% 7.79% 60.75Union Fidelity Life Ins. Co. 62 62 744 $153,690 $89,850 58.46% 0.79% 0.63Monumental Life Ins. Co. 81 81 972 $147,484 $119,588 81.09% 0.76% 0.58Life Investors Ins. Co. of America 28 28 336 $130,019 $95,839 73.71% 0.67% 0.45Mutual of Omaha Ins. Co. 13 13 156 $36,150 $23,644 65.41% 0.19% 0.03United Teacher Associates Ins. Co. 5 5 60 $11,936 $6,842 57.32% 0.06% 0.00AIG Premier Ins. Co. 1 3 42 $8,116 $6,658 82.04% 0.04% 0.00World Ins. Co. 2 2 24 $6,309 $1,315 20.84% 0.03% 0.00Health Net Life Ins. Co. 1 0 0 $105 $622 592.38% 0.00% 0.00TOTALS 198 14,289 171,474 $19,360,730 $14,882,322 76.87% 100.00% 8,100.55
Total Group Medicare Supplement Policies Lives Member Months Premium Earned Claims Incurred Loss Ratio Market Share HHIUnited Healthcare Ins. Co. 2 45,974 551,688 $58,840,494 $46,880,286 79.67% 79.56% 6,329.99Highmark West Virginia, Inc. 3,287 3,287 40,184 $9,491,434 $6,511,322 68.60% 12.83% 164.71Hartford Life and Accident Ins. Co. 4 541 6,492 $1,508,975 $708,280 46.94% 2.04% 4.16Bankers Life and Casualty Co. 117 127 1,799 $1,289,316 $925,660 71.79% 1.74% 3.04Life Investors Ins. Co. of America 562 562 6,744 $1,033,068 $851,603 82.43% 1.40% 1.95Hartford Life Ins. Co. 0 650 7,800 $657,938 $411,281 62.51% 0.89% 0.79Principal Life Ins. Co. 163 165 2,085 $411,655 $299,409 72.73% 0.56% 0.31Monumental Life Ins. Co. 95 95 1,140 $186,118 $161,607 86.83% 0.25% 0.06Sterling Life Ins. Co. 124 124 1,497 $169,349 $125,895 74.34% 0.23% 0.05Union Fidelity Life Ins. Co. 62 62 744 $153,690 $89,850 58.46% 0.21% 0.04Mutual of Omaha Ins. Co. 28 28 329 $41,097 $26,418 64.28% 0.06% 0.00Transamerica Life Ins. Co. 29 29 348 $36,882 $25,130 68.14% 0.05% 0.00Cont'l Life Ins. Co. of Brentwood, TN 40 40 414 $32,809 $35,229 107.38% 0.04% 0.00American Nat. Life Ins. Co. of TX 36 36 306 $20,540 $21,192 103.17% 0.03% 0.00American Republic Ins. Co. 8 8 0 $20,033 $13,821 68.99% 0.03% 0.00Oxford Life Ins. Co. 8 8 12 $11,987 $3,945 32.91% 0.02% 0.00United Teacher Associates Ins. Co. 5 5 60 $11,936 $6,842 57.32% 0.02% 0.00Central Sts H & Life Co. of Omaha 4 4 58 $8,797 $3,070 34.90% 0.01% 0.00AIG Premier Ins. Co. 1 3 42 $8,116 $6,658 82.04% 0.01% 0.00World Ins. Co. 2 2 24 $6,309 $1,315 20.84% 0.01% 0.00CUNA Mutual Ins. Co. 0 2 24 $3,987 $1,789 44.87% 0.01% 0.00Guarantee Trust Life Ins. Co. 2 2 24 $3,914 $1,532 39.14% 0.01% 0.00Globe Life and Accident Ins. Co. 1 1 23 $2,923 $2,831 96.85% 0.00% 0.00United American Ins. Co. 1 1 12 $1,583 ($49) -3.10% 0.00% 0.00Allianz Life Ins. Co. of North America 2 4 48 $1,430 $4,688 327.83% 0.00% 0.00Companion Life Ins. Co. 1 1 12 $1,154 $225 19.50% 0.00% 0.00National Benefit Life Ins. Co. 1 1 12 $592 $10 1.69% 0.00% 0.00Health Net Life Ins. Co. 1 0 0 $105 $622 592.38% 0.00% 0.00TOTALS 4,586 51,762 621,921 $73,956,231 $57,120,461 77.24% 100.00% 6,505.12
Group Dental Policies Lives Member Months Premium Earned Claims Incurred Loss Ratio Market Share HHIDelta Dental of West Virginia 76 42,197 473,638 $9,468,939 $6,541,230 69.08% 23.73% 563.20Metropolitan Life Ins. Co. 235 37,023 444,276 $6,710,325 $5,237,706 78.05% 16.82% 282.85Guardian Life Ins. Co. 348 25,488 300,605 $6,524,527 $4,663,106 71.47% 16.35% 267.40United Concordia Ins. Co. 103 16,513 214,573 $4,629,297 $3,101,867 67.01% 11.60% 134.61Ameritas Life Ins. Corporation 47 46,784 561,408 $2,111,844 $1,304,579 61.77% 5.29% 28.01Connecticut General Life Ins. Co. 47 5,961 71,532 $1,400,295 $1,229,649 87.81% 3.51% 12.32Aetna Life Ins. Co. 359 5,188 59,833 $1,160,417 $957,536 82.52% 2.91% 8.46Dental Choice, Inc. 2,577 5,143 56,626 $1,043,737 $865,166 82.89% 2.62% 6.84United Healthcare Ins. Co. 179 7,763 93,156 $959,113 $532,735 55.54% 2.40% 5.78Sun Life & Health Ins. Co. (US) 76 1,075 12,900 $773,001 $539,733 69.82% 1.94% 3.75Principal Life Ins. Co. 74 2,772 33,954 $707,864 $439,848 62.14% 1.77% 3.15HumanaDental Ins. Co. 38 3,939 40,752 $649,866 $449,058 69.10% 1.63% 2.65Delta Dental Ins. Co. 747 92,244 1,054,295 $523,570 $287,245 54.86% 1.31% 1.72Union Security Ins. Co. 46 604 5,569 $402,184 $478,385 118.95% 1.01% 1.02Companion Life Ins. Co. 44 794 8,746 $388,731 $229,774 59.11% 0.97% 0.95Shenandoah Life Ins. Co. 21 584 5,880 $271,844 $152,226 56.00% 0.68% 0.46Reliance Standard Life Ins. Co. 8 361 0 $221,714 $143,820 64.87% 0.56% 0.31Brokers National Life Assur. Co. 752 752 9,024 $212,000 $117,000 55.19% 0.53% 0.28Fort Dearborn Life Ins. Co. 79 400 0 $204,828 $112,774 55.06% 0.51% 0.26Untd Sts Life Ins. Co. In the City of NY 24 412 4,944 $193,671 $122,067 63.03% 0.49% 0.24Securian Life Ins. Co. 6 829 9,822 $154,532 $100,279 64.89% 0.39% 0.15Mega Life and Health Ins. Co. 341 594 6,939 $114,238 $36,183 31.67% 0.29% 0.08First Health Life & Health Ins. Co. 1 228 2,736 $110,346 $78,495 71.14% 0.28% 0.08Lincoln National Life Ins. Co. 1 52 624 $106,881 $208,339 194.93% 0.27% 0.07Compbenefits Ins. Co. 509 911 5,464 $91,527 $53,485 58.44% 0.23% 0.05John Alden Life Ins. Co. 28 283 3,512 $89,187 $36,401 40.81% 0.22% 0.05Citizens Security Ins. Co. 11 408 1,389 $84,919 $48,918 57.61% 0.21% 0.05Standard Ins. Co. 5 141 1,740 $79,952 $57,534 71.96% 0.20% 0.04Eastern Life and Health Ins. Co. 11 152 2,184 $77,324 $27,450 35.50% 0.19% 0.04Security Life Ins. Co. of America 0 120 12 $65,867 $35,036 53.19% 0.17% 0.03AIG Life Ins. Co. 2 103 1,236 $52,193 $15,531 29.76% 0.13% 0.02Time Ins. Co. 4 54 633 $43,142 $11,248 26.07% 0.11% 0.01Madison National Life Ins. Co., Inc. 8 31 372 $42,374 $15,854 37.41% 0.11% 0.01World Ins. Co. 51 51 612 $33,525 $18,107 54.01% 0.08% 0.01Unicare Life & Health Ins. Co. 15 64 1,137 $32,158 $9,671 30.07% 0.08% 0.01BCS Ins. Co. 0 17 0 $31,975 $4,914 15.37% 0.08% 0.01CUNA Mutual Ins. Co. 0 50 628 $20,219 $12,824 63.43% 0.05% 0.00Federated Mutual Ins. Co. 9 94 917 $17,360 $10,396 59.88% 0.04% 0.00Humana Ins. Co. 0 0 1,021 $17,196 $8,453 49.16% 0.04% 0.00National Guardian Life Ins. Co. 2 30 180 $15,506 $7,445 48.01% 0.04% 0.00Physicians Mutual Ins. Co. 46 53 502 $13,515 $6,130 45.36% 0.03% 0.00
Group Dental Policies Lives Member Months Premium Earned Claims Incurred Loss Ratio Market Share HHI

Group Dental Policies Lives Member Months Premium Earned Claims Incurred Loss Ratio Market Share HHIColorado Bankers Life Ins. Co. 4 27 324 $9,465 $723 7.64% 0.02% 0.00American Heritage Life Ins. Co. 9 185 2,220 $9,088 $11,445 125.94% 0.02% 0.00Continental General Ins. Co. 13 27 335 $8,279 $6,718 81.15% 0.02% 0.00Medical Benefits Mutual Life Ins. Co. 1 12 194 $4,942 $3,398 68.76% 0.01% 0.00Mid-West National Life Ins. Co. of TN 15 35 183 $2,808 $269 9.58% 0.01% 0.00Standard Security Life Ins. Co. of NY 16 27 0 $2,506 $564 22.51% 0.01% 0.00Freedom Life Ins. Co. of America 4 6 54 $2,433 $0 0.00% 0.01% 0.00Pan-American Life Ins. Co. 5 11 76 $2,279 $683 29.97% 0.01% 0.00Fidelity Security Life Ins. Co. 0 2 126 $1,983 $1,310 66.06% 0.00% 0.00Kansas City Life Ins. Co. 1 6 54 $1,525 $1,155 75.74% 0.00% 0.00American Public Life Ins. Co. 0 0 0 $1,197 $754 62.99% 0.00% 0.00American Pioneer Life Ins. Co. 1 1 12 $690 $160 23.19% 0.00% 0.00American Underwriters Life Ins. Co. 1 1 12 $576 $90 15.63% 0.00% 0.00Gerber Life Ins. Co. 0 0 0 $125 $0 0.00% 0.00% 0.00Renaissance Life & H Ins. Co. of Amer. 1 1 12 $55 $0 0.00% 0.00% 0.00United of Omaha Life Ins. Co. 0 0 0 $0 ($23) ---- 0.00% 0.00TOTALS 7,001 300,603 3,496,973 $39,899,654 $28,335,443 71.02% 100.00% 1,324.97
Other Group (NOC) Policies Lives Member Months Premium Earned Claims Incurred Loss Ratio Market Share HHIUnited Healthcare Ins. Co. 34,870 34,870 418,440 $39,413,464 $30,650,907 77.77% 61.57% 3,790.89HM Health Ins. Co. 1,405 1,405 16,163 $13,130,187 $10,394,289 79.16% 20.51% 420.72CUNA Mutual Ins. Co. 113 17,839 216,567 $2,892,888 $1,266,311 43.77% 4.52% 20.42American Health & Life Ins. Co. 5,815 5,815 0 $1,925,252 $1,240,239 64.42% 3.01% 9.05American Security Ins. Co. 0 0 0 $840,372 $3,948 0.47% 1.31% 1.72Medco Containment Life Ins. Co. 543 543 7,484 $809,682 $813,764 100.50% 1.26% 1.60Sterling Life Ins. Co. 353 353 4,337 $743,757 $567,690 76.33% 1.16% 1.35Household Life Ins. Co. 4 1,716 21,744 $597,362 $259,375 43.42% 0.93% 0.87American Modern Life Ins. Co. 55 2,305 0 $487,247 $288,801 59.27% 0.76% 0.58Highmark West Virginia, Inc. 829 1,961 23,053 $409,238 $262,590 64.17% 0.64% 0.41Merit Life Ins. Co. 3,580 3,842 45,696 $407,865 $136,701 33.52% 0.64% 0.41Minnesota Life Ins. Co. 27 4,491 54,828 $398,701 $227,899 57.16% 0.62% 0.39American United Life Ins. Co. 44 2,329 27,948 $352,384 $140,960 40.00% 0.55% 0.30American Bankers Life Assur. Co. 0 0 0 $305,789 $19,021 6.22% 0.48% 0.23Untd Sts Life Ins. Co. In the City of NY 14 401 5,607 $291,242 $209,343 71.88% 0.45% 0.21Unicare Life & Health Ins. Co. 12 183 2,086 $279,288 $104,718 37.49% 0.44% 0.19HM Life Ins. Co. 4 1,983 23,652 $239,947 $189,684 79.05% 0.37% 0.14AAA Life Ins. Co. 3 1,475 17,770 $82,392 $77,660 94.26% 0.13% 0.02Stonebridge Life Ins. Co. 3,286 3,286 39,432 $75,509 $23,095 30.59% 0.12% 0.01Hartford Life and Accident Ins. Co. 0 155 1,860 $67,478 $31,673 46.94% 0.11% 0.01American Public Life Ins. Co. 0 0 0 $58,587 $20,276 34.61% 0.09% 0.01Mega Life and Health Ins. Co. 827 1,536 18,501 $52,417 $22,974 43.83% 0.08% 0.01Amex Assur. Co. 0 408 5,093 $48,505 $10,555 21.76% 0.08% 0.01Fidelity Security Life Ins. Co. 0 27 930 $45,163 $2,614 5.79% 0.07% 0.00Assurity Life Ins. Co. 1 3 12 $37,250 $13,327 35.78% 0.06% 0.00Fairmont Specialty Ins. Co. 331 331 1,175 $31,987 $7,938 24.82% 0.05% 0.00Compbenefits Ins. Co. 590 1,107 7,544 $31,447 $23,267 73.99% 0.05% 0.00Balboa Life Ins. Co. 701 701 8,412 $17,461 $32,156 184.16% 0.03% 0.00Govt Personnel Mutual Life Ins. Co. 0 44 491 $14,936 $7,588 50.80% 0.02% 0.00Oxford Life Ins. Co. 1 32 12 $14,935 ($534) -3.58% 0.02% 0.00J.M.I.C. Life Ins. Co. 0 0 0 $14,594 $18,006 123.38% 0.02% 0.00American Republic Ins. Co. 1,246 1,246 0 $13,722 $23,073 168.15% 0.02% 0.00Celtic Ins. Co. 14 14 208 $12,889 $2,160 16.76% 0.02% 0.00United States Fire Ins. 0 135 479 $11,774 $160 1.36% 0.02% 0.00Hartford Life Ins. Co. 0 80 960 $7,438 $4,649 62.50% 0.01% 0.00New York Life Ins. Co. 9 28 336 $7,179 $7,368 102.63% 0.01% 0.00Madison National Life Ins. Co., Inc. 0 1,095 0 $6,628 $23,026 347.40% 0.01% 0.00AIG Premier Ins. Co. 1 21 282 $3,102 $743 23.95% 0.00% 0.00Central Sts H & Life Co. of Omaha 9 9 108 $1,923 $0 0.00% 0.00% 0.00BCS Ins. Co. 0 16 0 $1,735 $22 1.27% 0.00% 0.00Nationwide Life Ins. 1 55 353 $1,638 $0 0.00% 0.00% 0.00Parker Centennial Assur. Co. 1 0 0 $1,572 $16,412 1044.02% 0.00% 0.00Mid-West National Life Ins. Co. of TN 25 51 393 $1,102 $665 60.34% 0.00% 0.00HCC Life Ins. Co. 1 1 12 $1,072 ($1,159) -108.12% 0.00% 0.00MetLife Ins. Co. of Connecticut 0 1 12 $813 $10,968 1349.08% 0.00% 0.00Standard Security Life Ins. Co. of NY 11 11 0 $743 $0 0.00% 0.00% 0.00Physicians Mutual Ins. Co. 2 2 24 $442 $9 2.04% 0.00% 0.00United Fidelity Life Ins. Co. 1 1 12 $433 $57 13.16% 0.00% 0.00Independence American Ins. Co. 1 1 1 $430 $91 21.16% 0.00% 0.00American National Ins. Co. 2 2 24 $354 $0 0.00% 0.00% 0.00Union Labor Life Ins. Co. 1 104 1,248 $278 $0 0.00% 0.00% 0.00Protective Life Ins. Co. 0 0 0 $219 $0 0.00% 0.00% 0.00Mutual of Omaha Ins. Co. 3 4 48 $56 $0 0.00% 0.00% 0.00Chesapeak Life Ins. Co. 1 1 12 $27 $0 0.00% 0.00% 0.00Columbian Mutual Life Ins. Co. 1 25 300 $0 $1,299 ---- 0.00% 0.00United Family Life Ins. Co. 0 14 168 $0 $0 ---- 0.00% 0.00Baltimore Life Ins. Co. 1 1 24 $0 $4,056 ---- 0.00% 0.00Life Ins. Co. of North America 0 0 0 $0 $120,776 ---- 0.00% 0.00United of Omaha Life Ins. Co. 0 0 0 $0 $25 ---- 0.00% 0.00Pacificare Life & Health Ins. Co. 1 2 20 ($179,047) ($96,788) 54.06% -0.28% 0.08TOTALS 54,740 92,061 973,861 $64,013,848 $47,184,447 73.71% 100.00% 4,249.63

Group TPA and ASO Policies Lives Member Months Premium Earned Claims Incurred Loss Ratio Market Share HHIConnecticut General Life Ins. Co. 1,052 86,846 1,042,152 $143,092,528 $136,221,899 95.20% 88.70% 7,866.86Aetna Life Ins. Co. 465 65,723 790,211 $12,308,298 $223,097,514 1812.58% 7.63% 58.21United Healthcare Ins. Co. 535 26,988 323,856 $3,501,890 $104,713,314 2990.19% 2.17% 4.71Principal Life Ins. Co. 3 1,148 13,888 $1,888,558 $1,888,558 100.00% 1.17% 1.37Unicare Life & Health Ins. Co. 24 331 2,585 $268,205 $1,148,249 428.12% 0.17% 0.03Vision Benefits of America 15 7,122 83,739 $240,308 $219,125 91.19% 0.15% 0.02Oxford Life Ins. Co. 2 28 12 $16,863 $0 0.00% 0.01% 0.00Carelink Health Plans, Inc. 200 309 3,716 $13,778 $2,204,956 16003.45% 0.01% 0.00Medical Benefits Mutual Life Ins. Co. 3 738 3,164 $0 $0 ---- 0.00% 0.00TOTALS 2,299 189,233 2,263,323 $161,330,427 $469,493,615 291.01% 100.00% 7,931.20
Group Stop Loss/Excess Loss Policies Lives Member Months Premium Earned Claims Incurred Loss Ratio Market Share HHIHighmark West Virginia, Inc. 1,453 2,549 31,376 $19,650,461 $9,753,812 49.64% 35.35% 1,249.84Great-West Life & Annuity Ins. Co. 180 13,250 169,304 $7,502,391 $6,783,305 90.42% 13.50% 182.18Life Investors Ins. Co. of America 12 3,057 39,768 $3,115,498 $1,686,312 54.13% 5.61% 31.42HCC Life Ins. Co. 15 7,961 95,532 $2,779,679 $2,175,824 78.28% 5.00% 25.01ACE American Ins. Co. 33 2,175 22,287 $2,503,166 $2,686,977 107.34% 4.50% 20.28Connecticut General Life Ins. Co. 1 3 36 $2,019,006 $1,712,326 84.81% 3.63% 13.19THP Ins. Co. 3,702 8,442 106,197 $2,001,430 $1,708,174 85.35% 3.60% 12.97Hartford Life and Accident Ins. Co. 3 2,561 30,732 $1,923,404 $1,579,621 82.13% 3.46% 11.97Companion Life Ins. Co. 5 898 9,869 $1,316,491 $1,057,147 80.30% 2.37% 5.61Sun Life & Health Ins. Co. (US) 0 0 0 $1,163,755 $0 0.00% 2.09% 4.38Gerber Life Ins. Co. 9 664 7,968 $1,113,651 $937,451 84.18% 2.00% 4.01United States Fire Ins. 4 4,620 39,639 $902,345 $605,285 67.08% 1.62% 2.64Standard Security Life Ins. Co. of NY 3 1,567 0 $857,589 $400,851 46.74% 1.54% 2.38Aetna Life Ins. Co. 184 12,064 145,713 $829,821 $150,132 18.09% 1.49% 2.23Perico Life Ins. Co. 7 699 8,388 $750,238 $526,382 70.16% 1.35% 1.82Metropolitan Life Ins. Co. 1 61 732 $701,358 $395,054 56.33% 1.26% 1.59Medical Benefits Mutual Life Ins. Co. 3 738 3,164 $670,494 $2,264,655 337.76% 1.21% 1.46Canada Life Assur. Co. (The) 3 5,527 57,321 $510,144 $400,905 78.59% 0.92% 0.84Monumental Life Ins. Co. 2 489 5,886 $508,612 $778,475 153.06% 0.92% 0.84Boston Mutual Life Ins. Co. 23 4,476 35,736 $484,380 $89,093 18.39% 0.87% 0.76Reliastar Life Ins. Co. 108 24,840 298,080 $449,381 $161,617 35.96% 0.81% 0.65Transamerica Life Ins. Co. 2 989 16,443 $443,826 $307,011 69.17% 0.80% 0.64American Fidelity Assur. Co. 2 2,028 22,798 $380,534 $647,350 170.12% 0.68% 0.47Fidelity Security Life Ins. Co. 1 956 12,330 $377,427 $101,114 26.79% 0.68% 0.46HM Life Ins. Co. 3 887 10,644 $367,919 $995,842 270.67% 0.66% 0.44Nationwide Life Ins. 1 282 3,384 $342,453 $3,098 0.90% 0.62% 0.38Alta Health & Life Ins. Co. 9 213 2,707 $325,467 $246,483 75.73% 0.59% 0.34American United Life Ins. Co. 1 442 5,304 $290,631 $3,928 1.35% 0.52% 0.27Delos Ins. Co. 1 179 1,719 $276,852 $229,577 82.92% 0.50% 0.25Sun Life Assur. Co. of Canada (US) 3 519 15,204 $262,526 $12,388 4.72% 0.47% 0.22United of Omaha Life Ins. Co. 12 380 0 $219,366 $58,919 26.86% 0.39% 0.16New England Life Ins. Co. 0 0 0 $174,253 $59,741 34.28% 0.31% 0.10Zurich American Ins. Co. 2 127 1,524 $149,349 $0 0.00% 0.27% 0.07Unicare Life & Health Ins. Co. 4 823 11,590 $107,125 $845,738 789.49% 0.19% 0.04Fairmont Specialty Ins. Co. 2 350 4,080 $39,377 $118,971 302.13% 0.07% 0.01QBE Ins. Corporation 1 99 495 $31,219 $22,353 71.60% 0.06% 0.00AIG Life Ins. Co. 2 201 2,412 $21,345 $0 0.00% 0.04% 0.00Reliastar Life Ins. Co. of New York 12 131 1,572 $15,492 $0 0.00% 0.03% 0.00Union Labor Life Ins. Co. 0 0 0 $5,075 $0 0.00% 0.01% 0.00American General Assur. Co. 0 0 0 $0 $86,342 ---- 0.00% 0.00Central Benefits National Life Ins. Co. 0 0 0 $0 $769 ---- 0.00% 0.00Life Ins. Co. of North America 0 0 0 $0 $3,437 ---- 0.00% 0.00TOTALS 5,809 105,247 1,219,934 $55,583,530 $39,596,459 71.24% 100.00% 1,579.92

Total Group Business Policies Lives Member Months Premium Earned Claims Incurred Loss Ratio Market Share HHIHighmark West Virginia, Inc. 79,331 152,955 1,834,383 $596,679,562 $516,646,233 86.59% 41.42% 1,715.46Connecticut General Life Ins. Co. 1,280 95,779 1,145,803 $153,320,676 $144,458,348 94.22% 10.64% 113.27United Healthcare Ins. Co. 36,542 136,435 1,637,220 $152,252,404 $225,792,154 148.30% 10.57% 111.69Health Plan of the Upper OH Val. 11,041 25,176 306,212 $86,313,458 $79,419,325 92.01% 5.99% 35.90Carelink Health Plans, Inc. 10,333 19,838 252,319 $82,066,668 $66,636,154 81.20% 5.70% 32.45Coventry Health & Life Ins. Co. 12,616 22,711 244,069 $79,809,985 $60,781,760 76.16% 5.54% 30.69Aetna Life Ins. Co. 3,137 109,010 1,409,172 $22,786,619 $233,187,036 1023.35% 1.58% 2.50Hartford Life and Accident Ins. Co. 26,470 363,567 5,317,248 $16,188,699 $10,910,392 67.40% 1.12% 1.26Principal Life Ins. Co. 458 11,275 137,260 $15,526,666 $10,901,380 70.21% 1.08% 1.16Metropolitan Life Ins. Co. 51,945 687,269 1,701,038 $14,677,743 $11,034,436 75.18% 1.02% 1.04HM Health Ins. Co. 1,405 1,405 16,163 $13,130,187 $10,394,289 79.16% 0.91% 0.83Guardian Life Ins. Co. 13,246 183,146 776,922 $12,849,619 $9,170,988 71.37% 0.89% 0.80Delta Dental of West Virginia 76 42,197 473,638 $9,468,939 $6,541,230 69.08% 0.66% 0.43Golden Rule Ins. Co. 1 2,994 35,890 $8,245,766 $5,213,944 63.23% 0.57% 0.33Great-West Life & Annuity Ins. Co. 185 13,267 291,748 $7,845,070 $6,993,258 89.14% 0.54% 0.30Consumers Life Ins. Co. 1,535 2,780 28,902 $7,759,065 $8,822,762 113.71% 0.54% 0.29Unum Life Ins. Co. of America 14,660 31,172 241,471 $7,359,102 $7,196,090 97.78% 0.51% 0.26Union Security Ins. Co. 1,094 42,946 507,784 $7,228,807 $4,459,226 61.69% 0.50% 0.25Medical Benefits Mutual Life Ins. Co. 1,069 15,064 40,542 $7,139,175 $8,600,085 120.46% 0.50% 0.25THP Ins. Co. 4,636 10,316 126,886 $7,115,209 $6,659,106 93.59% 0.49% 0.24Mega Life and Health Ins. Co. 3,097 17,128 73,971 $5,957,078 $2,231,484 37.46% 0.41% 0.17Central Reserve Life Ins. Co. 70 1,704 23,450 $5,631,633 $3,982,354 70.71% 0.39% 0.15First Health Life & Health Ins. Co. 160 1,261 15,132 $5,429,502 $4,408,595 81.20% 0.38% 0.14Standard Ins. Co. 3,205 99,678 285,875 $4,798,892 $3,274,465 68.23% 0.33% 0.11Conseco Health Ins. Co. 9,919 26,195 316,950 $4,739,722 $6,976,918 147.20% 0.33% 0.11United Concordia Ins. Co. 103 16,513 214,573 $4,629,297 $3,101,867 67.01% 0.32% 0.10Life Ins. Co. of North America 36,455 14,770 1,176,816 $4,591,094 $5,477,112 119.30% 0.32% 0.10Sun Life & Health Ins. Co. (US) 160 3,983 47,796 $4,342,290 $784,269 18.06% 0.30% 0.09Life Investors Ins. Co. of America 879 6,673 76,794 $4,233,493 $2,532,312 59.82% 0.29% 0.09John Alden Life Ins. Co. 782 8,983 28,415 $3,997,488 $1,800,130 45.03% 0.28% 0.08Prudential Ins. Co. of America 38 4,602 501,066 $3,867,492 $2,693,645 69.65% 0.27% 0.07CUNA Mutual Ins. Co. 114,510 1,362,988 1,302,790 $3,474,030 $1,332,485 38.36% 0.24% 0.06Vision Service Plan Ins. Co. 88 48,049 537,659 $3,119,141 $2,341,889 75.08% 0.22% 0.05HCC Life Ins. Co. 16 7,962 95,544 $2,780,751 $2,174,665 78.20% 0.19% 0.04ACE American Ins. Co. 1,462 19,316 48,159 $2,554,778 $2,686,980 105.17% 0.18% 0.03State Farm Mutual Auto. Ins. Co. 647 8,464 35,091 $2,446,384 $2,552,006 104.32% 0.17% 0.03Mutual of Omaha Ins. Co. 22,811 140,774 559,376 $2,249,741 $2,498,400 111.05% 0.16% 0.02American Medical Security Life Ins. Co. 454 755 10,348 $2,237,082 $1,669,548 74.63% 0.16% 0.02Ameritas Life Ins. Corporation 65 58,029 696,348 $2,222,622 $1,355,161 60.97% 0.15% 0.02Monumental Life Ins. Co. 8,333 46,961 449,029 $2,187,733 $1,697,984 77.61% 0.15% 0.02Standard Security Life Ins. Co. of NY 187 2,040 5,238 $2,073,786 $1,293,431 62.37% 0.14% 0.02American Health & Life Ins. Co. 7,844 5,815 21,127 $1,923,702 $1,242,153 64.57% 0.13% 0.02Companion Life Ins. Co. 102 2,490 28,192 $1,920,590 $1,411,348 73.49% 0.13% 0.02Continental General Ins. Co. 15 665 10,391 $1,764,570 $980,788 55.58% 0.12% 0.02Unicare Life & Health Ins. Co. 145 5,011 188,794 $1,726,589 $2,791,988 161.71% 0.12% 0.01Fort Dearborn Life Ins. Co. 230 5,498 0 $1,631,565 $958,347 58.74% 0.11% 0.01American Family Life Assur. Co. 5,066 11,526 129,881 $1,626,241 $1,628,322 100.13% 0.11% 0.01United Teacher Associates Ins. Co. 2,693 4,182 47,615 $1,557,733 $507,292 32.57% 0.11% 0.01Reliastar Life Ins. Co. 202 27,879 328,671 $1,550,142 $774,575 49.97% 0.11% 0.01American Fidelity Assur. Co. 53 6,949 70,639 $1,402,358 $1,237,117 88.22% 0.10% 0.01Lincoln National Life Ins. Co. 9,344 119,082 175,421 $1,342,953 $1,338,380 99.66% 0.09% 0.01Sun Life Assur. Co. of Canada (US) 65 10,232 50,040 $1,342,296 $1,123,107 83.67% 0.09% 0.01World Ins. Co. 360 642 8,608 $1,310,747 $385,598 29.42% 0.09% 0.01Bankers Life and Casualty Co. 120 163 2,705 $1,289,316 $925,662 71.79% 0.09% 0.01Hartford Life Ins. Co. 10,710 132,837 636,977 $1,238,056 $580,515 46.89% 0.09% 0.01New York Life Ins. Co. 1,044 12,442 49,947 $1,175,916 $1,010,181 85.91% 0.08% 0.01Gerber Life Ins. Co. 41 1,048 7,968 $1,113,776 $937,452 84.17% 0.08% 0.01Northwestern Mutual Life Ins. Co. 113 3,089 32,598 $1,112,184 ($456,099) -41.01% 0.08% 0.01Federated Mutual Ins. Co. 39 402 4,047 $1,077,848 $501,546 46.53% 0.07% 0.01Dental Choice, Inc. 2,577 5,143 56,626 $1,043,737 $865,166 82.89% 0.07% 0.01United States Fire Ins. 952 8,772 190,364 $1,036,126 $623,041 60.13% 0.07% 0.01Untd Sts Life Ins. Co. In the City of NY 318 4,382 90,973 $979,274 $751,911 76.78% 0.07% 0.00Boston Mutual Life Ins. Co. 1,183 27,132 191,226 $956,754 $387,895 40.54% 0.07% 0.00Sterling Life Ins. Co. 477 477 5,834 $913,106 $693,585 75.96% 0.06% 0.00American United Life Ins. Co. 1,221 17,588 58,547 $866,206 $276,630 31.94% 0.06% 0.00American Security Ins. Co. 0 0 0 $840,372 $3,948 0.47% 0.06% 0.00United American Ins. Co. 355 355 4,453 $819,526 $600,278 73.25% 0.06% 0.00Medical Savings Ins. Co. 0 0 4,464 $816,335 $1,770,279 216.86% 0.06% 0.00Medco Containment Life Ins. Co. 543 543 7,484 $809,682 $813,764 100.50% 0.06% 0.00Reliance Standard Life Ins. Co. 1,428 2,797 24,144 $802,419 $2,590,557 322.84% 0.06% 0.00Time Ins. Co. 123 1,593 3,907 $760,643 $739,927 97.28% 0.05% 0.00Perico Life Ins. Co. 29 963 13,068 $750,238 $526,400 70.16% 0.05% 0.00United of Omaha Life Ins. Co. 4,118 2,225 51,125 $736,193 $742,669 100.88% 0.05% 0.00AIG Life Ins. Co. 60 903 458,557 $673,458 $25,335 3.76% 0.05% 0.00HumanaDental Ins. Co. 38 3,939 40,752 $649,866 $449,058 69.10% 0.05% 0.00HM Life Ins. Co. 291 6,347 199,401 $635,978 $1,185,527 186.41% 0.04% 0.00Fidelity Security Life Ins. Co. 21 1,812 23,074 $613,584 $184,843 30.13% 0.04% 0.00Household Life Ins. Co. 4 1,716 21,744 $597,362 $259,375 43.42% 0.04% 0.00Nat. Un. Fire Ins. Co. of Pitt, PA 56,276 675,027 890,301 $591,421 $17 0.00% 0.04% 0.00Transamerica Life Ins. Co. 71 1,411 23,796 $525,241 $349,897 66.62% 0.04% 0.00Delta Dental Ins. Co. 747 92,244 1,054,295 $523,570 $287,245 54.86% 0.04% 0.00American Bankers Life Assur. Co. 0 0 0 $515,016 $1,037 0.20% 0.04% 0.00Canada Life Assur. Co. (The) 3 5,527 57,321 $510,144 $400,905 78.59% 0.04% 0.00Guarantee Trust Life Ins. Co. 214 1,943 37,146 $494,261 $150,146 30.38% 0.03% 0.00American Modern Life Ins. Co. 55 2,305 0 $487,247 $288,801 59.27% 0.03% 0.00Continental Assur. Co. 0 0 0 $484,720 $2,696 0.56% 0.03% 0.00Celtic Ins. Co. 135 196 1,998 $461,367 $104,355 22.62% 0.03% 0.00
Total Group Business Policies Lives Member Months Premium Earned Claims Incurred Loss Ratio Market Share HHI

Total Group Business Policies Lives Member Months Premium Earned Claims Incurred Loss Ratio Market Share HHIMerit Life Ins. Co. 3,580 3,842 45,696 $407,865 $136,701 33.52% 0.03% 0.00Minnesota Life Ins. Co. 31 4,603 56,004 $406,403 $254,600 62.65% 0.03% 0.00Madison National Life Ins. Co., Inc. 17 1,199 1,248 $405,093 $184,919 45.65% 0.03% 0.00John Hancock Life Ins. Co. 0 619 6,915 $380,954 ($43,549) -11.43% 0.03% 0.00Shenandoah Life Ins. Co. 1,987 23,574 37,688 $366,258 $286,972 78.35% 0.03% 0.00Nationwide Life Ins. 16 728 49,365 $347,453 $3,098 0.89% 0.02% 0.00Alta Health & Life Ins. Co. 9 213 4,633 $326,925 $246,483 75.39% 0.02% 0.00Eastern Life and Health Ins. Co. 31 1,396 19,608 $318,933 $293,226 91.94% 0.02% 0.00Genworth Life Ins. Co. 5 524 0 $301,091 $295,788 98.24% 0.02% 0.00National Guardian Life Ins. Co. 4 1,560 20,322 $284,052 $166,659 58.67% 0.02% 0.00Delos Ins. Co. 1 179 1,719 $276,852 $229,577 82.92% 0.02% 0.00Stonebridge Life Ins. Co. 23,900 229,492 964,688 $249,459 $185,984 74.55% 0.02% 0.00Vision Benefits of America 15 7,122 83,739 $240,308 $219,125 91.19% 0.02% 0.00Provident Life and Acc. Ins. Co. 354 593 2,091 $235,513 $400,898 170.22% 0.02% 0.00BCS Ins. Co. 0 80 0 $234,696 $230,233 98.10% 0.02% 0.00Brokers National Life Assur. Co. 762 872 9,040 $212,000 $117,010 55.19% 0.01% 0.00Zurich American Ins. Co. 102 1,583 19,776 $201,260 $1 0.00% 0.01% 0.00Union Fidelity Life Ins. Co. 1,293 12,534 43,258 $196,966 $105,284 53.45% 0.01% 0.00Liberty Life Assur. Co. of Boston 2 1,588 19,056 $187,376 $795,284 424.43% 0.01% 0.00Colonial Life & Accident Ins. Co. 57 471 0 $175,241 $156,758 89.45% 0.01% 0.00New England Life Ins. Co. 0 0 422 $174,253 $59,741 34.28% 0.01% 0.00American Nat. Life Ins. Co. of TX 84 114 1,061 $158,679 $42,876 27.02% 0.01% 0.00Union Labor Life Ins. Co. 7,911 92,651 46,819 $155,841 $29,289 18.79% 0.01% 0.00Securian Life Ins. Co. 6 829 9,822 $154,532 $100,279 64.89% 0.01% 0.00Paul Revere Life Ins. Co. 194 253 3,895 $151,031 $161,062 106.64% 0.01% 0.00Pan-American Life Ins. Co. 20 233 2,974 $150,497 $131,949 87.68% 0.01% 0.00Allstate Life Ins. Co. 3,412 40,922 224,409 $142,696 $1,363 0.96% 0.01% 0.00Mid-West National Life Ins. Co. of TN 66 131 2,037 $135,241 $59,570 44.05% 0.01% 0.00Continental Casualty Co. 1 64 920,847 $124,279 $68,539 55.15% 0.01% 0.00Compbenefits Ins. Co. 1,099 2,018 13,008 $122,974 $76,752 62.41% 0.01% 0.00American Heritage Life Ins. Co. 46 537 25,926 $117,900 $22,572 19.15% 0.01% 0.00Freedom Life Ins. Co. of America 17 31 366 $107,565 $108,615 100.98% 0.01% 0.00Commercial Travelers Mutual Ins. Co. 1,203 11,371 204,886 $107,137 $0 0.00% 0.01% 0.00American General Assur. Co. 160 5,225 12,299 $101,239 $749,678 740.50% 0.01% 0.00Washington National Ins. Co. 3,091 39,660 100,467 $99,141 $10,392 10.48% 0.01% 0.00Symetra Life Ins. Co. 891 10,470 717,945 $96,074 $78,842 82.06% 0.01% 0.00Fairmont Specialty Ins. Co. 1,183 1,531 13,330 $93,969 $162,217 172.63% 0.01% 0.00American Income Life Ins. Co. 163,938 2,012,868 130,343 $92,692 $292 0.32% 0.01% 0.00Continental American Ins. Co. 314 2,239 23,663 $86,810 $33,917 39.07% 0.01% 0.00Security Life Ins. Co. of America 1,387 273 102,493 $85,564 $39,136 45.74% 0.01% 0.00Citizens Security Ins. Co. 11 408 1,389 $84,919 $48,918 57.61% 0.01% 0.00Horace Mann Life Ins. Co. 4 763 9,156 $84,801 $165,773 195.48% 0.01% 0.00Standard Life & Accident Ins. Co. 57 110 663 $83,305 $51,689 62.05% 0.01% 0.00AAA Life Ins. Co. 3 1,475 17,770 $82,392 $77,660 94.26% 0.01% 0.00Amex Assur. Co. 96,744 1,234,257 247,599 $73,837 $10,478 14.19% 0.01% 0.00American Public Life Ins. Co. 0 0 0 $64,146 $22,149 34.53% 0.00% 0.00American Republic Ins. Co. 1,260 1,263 0 $58,497 $59,205 101.21% 0.00% 0.00Medamerica Ins. Co. 0 7 84 $48,989 $0 0.00% 0.00% 0.00Columbian Life Ins. Co. 0 0 3,420 $48,566 $0 0.00% 0.00% 0.00Oxford Life Ins. Co. 11 68 36 $43,785 $3,411 7.79% 0.00% 0.00Liberty Life Ins. Co. 1,200 13,074 93,366 $40,592 ($6,134) -15.11% 0.00% 0.00Assurity Life Ins. Co. 1 3 12 $37,250 $13,327 35.78% 0.00% 0.00Mutual of America Life Ins. Co. 14 94 1,128 $34,092 $74,637 218.93% 0.00% 0.00Cont'l Life Ins. Co. of Brentwood, TN 40 40 414 $32,809 $35,229 107.38% 0.00% 0.00QBE Ins. Corporation 1 99 2,147 $32,223 $22,366 69.41% 0.00% 0.00Lafayette Life Ins. Co. 781 9,419 16,823 $31,000 $28,519 92.00% 0.00% 0.00Harleysville Life Ins. Co. 5 128 1,536 $29,185 $397 1.36% 0.00% 0.00Kanawha Ins. Co. 117 766 13,926 $24,489 $34,722 141.79% 0.00% 0.00Conseco Ins. Co. 11 126 6,734 $21,515 $11,384 52.91% 0.00% 0.00Humana Ins. Co. 3 11 1,153 $21,417 $11,342 52.96% 0.00% 0.00Sentry Life Ins. Co. 85 1,020 96,429 $20,689 $0 0.00% 0.00% 0.00Balboa Life Ins. Co. 1,417 9,293 21,830 $19,014 $32,824 172.63% 0.00% 0.00Physicians Mutual Ins. Co. 54 61 598 $18,867 $6,139 32.54% 0.00% 0.00Baltimore Life Ins. Co. 14 146 1,511 $16,709 $31,893 190.87% 0.00% 0.00Reliastar Life Ins. Co. of New York 12 131 1,572 $15,484 $266 1.72% 0.00% 0.00Govt Personnel Mutual Life Ins. Co. 0 44 491 $14,936 $7,588 50.80% 0.00% 0.00Illinois Mutual Life Ins. Co. 4 53 660 $14,693 $18,303 124.57% 0.00% 0.00J.M.I.C. Life Ins. Co. 0 0 0 $14,594 $18,006 123.38% 0.00% 0.00Conseco Senior Health Ins. Co. 13 13 144 $13,196 $123,093 932.81% 0.00% 0.00AIG Premier Ins. Co. 4 28 378 $12,122 $7,588 62.60% 0.00% 0.00Genworth Life & Annuity Ins. Co. 3 3 36 $11,786 $4,381 37.17% 0.00% 0.00Central Sts H & Life Co. of Omaha 13 13 166 $10,720 $3,070 28.64% 0.00% 0.00Bankers Fidelity Life Ins. Co. 20 20 293 $10,361 $2,930 28.28% 0.00% 0.00Riversource Life Ins. Co. 5 5 60 $9,877 $0 0.00% 0.00% 0.00Combined Ins. Co. of America 67 493 3,159 $9,469 $2,288 24.16% 0.00% 0.00Colorado Bankers Life Ins. Co. 4 27 324 $9,465 $723 7.64% 0.00% 0.00Loyal American Life Ins. Co. 41 41 512 $9,382 $1,422 15.16% 0.00% 0.00Kansas City Life Ins. Co. 3 19 210 $8,158 $1,156 14.17% 0.00% 0.00American Sentinel Ins. Co. 1,181 13,992 35,786 $7,086 $4 0.06% 0.00% 0.00Nationwide Life Ins. Co. of America 33 87 809 $5,041 $862 17.10% 0.00% 0.00Allianz Life Ins. Co. of North America 7 33 385 $4,095 $13,428 327.91% 0.00% 0.00Jefferson National Life Ins. Co. 1 1 12 $3,380 $0 0.00% 0.00% 0.00National Benefit Life Ins. Co. 17 17 204 $2,999 $3,296 109.90% 0.00% 0.00Globe Life and Accident Ins. Co. 1 1 23 $2,923 $2,831 96.85% 0.00% 0.00Federal Ins. Co. 1,226 14,712 93,477 $2,792 $19 0.68% 0.00% 0.00American Gen. Life and Acc. Ins. Co. 3 3 48 $2,569 $10,657 414.83% 0.00% 0.00Transamerica Occidental Life Ins. Co. 1 1 12 $2,457 $0 0.00% 0.00% 0.00
Total Group Business Policies Lives Member Months Premium Earned Claims Incurred Loss Ratio Market Share HHI

Total Group Business Policies Lives Member Months Premium Earned Claims Incurred Loss Ratio Market Share HHIBCS Life Ins. Co. 0 0 0 $1,898 $3,756 197.89% 0.00% 0.00Mony Life Ins. Co. 2 3 42 $1,694 $0 0.00% 0.00% 0.00Parker Centennial Assur. Co. 1 0 0 $1,572 $16,412 1044.02% 0.00% 0.00National Casualty Co. 12,781 153,364 16,327 $1,435 $28 1.95% 0.00% 0.00American National Ins. Co. 2 2 24 $934 ($2,890) -309.42% 0.00% 0.00Sentry Ins. A Mutual Co. 89 1,058 3,542 $932 $1 0.11% 0.00% 0.00Reassure America Life Ins. Co. 1 12 100 $835 $1 0.12% 0.00% 0.00MetLife Ins. Co. of Connecticut 0 1 12 $813 $10,968 1349.08% 0.00% 0.00Colonial Penn Life Ins. Co. 8 93 746 $802 $47 5.86% 0.00% 0.00American Pioneer Life Ins. Co. 1 1 12 $690 $160 23.19% 0.00% 0.00American Underwriters Life Ins. Co. 1 1 12 $576 $90 15.63% 0.00% 0.00United Fidelity Life Ins. Co. 1 1 12 $433 $57 13.16% 0.00% 0.00Independence American Ins. Co. 1 1 1 $430 $91 21.16% 0.00% 0.00Great Southern Life Ins. Co. 2 2 24 $407 $2 0.49% 0.00% 0.00Heritage Casualty Ins. Co. 1 24 288 $378 $1 0.26% 0.00% 0.00Protective Life Ins. Co. 0 0 0 $219 $0 0.00% 0.00% 0.00Transamerica Financial Life Ins. Co. 3 14 85 $214 $1 0.47% 0.00% 0.00Teachers Prot. Mutual Life Ins. Co. 1 1 12 $164 $1 0.61% 0.00% 0.00Wilton ReAssur. Life Co. of NY 1 1 12 $127 $0 0.00% 0.00% 0.00Health Net Life Ins. Co. 1 0 0 $105 $622 592.38% 0.00% 0.00Renaissance Life & H Ins. Co. of Amer. 1 1 12 $55 $0 0.00% 0.00% 0.00Markel Ins. Co. 4,580 30,225 1,550 $0 $39 ---- 0.00% 0.00OneBeacon America Ins. Co. 327 1,962 8,986 $0 $2 ---- 0.00% 0.00Anthem Life Ins. Co. 4 48 8 $0 $1 ---- 0.00% 0.00Stonebridge Casualty Ins. Co. 3 36 58 $0 $0 ---- 0.00% 0.00Columbian Mutual Life Ins. Co. 1 25 300 $0 $1,299 ---- 0.00% 0.00USAA Life Ins. Co. 3 24 197 $0 $1 ---- 0.00% 0.00United Family Life Ins. Co. 0 14 168 $0 $0 ---- 0.00% 0.00Central United Life Ins. Co. 5 10 12 $0 $0 ---- 0.00% 0.00Starnet Ins. Co. 4,856 4 23,445 $0 $55 ---- 0.00% 0.00American General Life Ins. Co. 0 0 36 $0 $0 ---- 0.00% 0.00American Int'l Life Assur. Co. of NY 0 0 0 $0 $4,225 ---- 0.00% 0.00Central Benefits National Life Ins. Co. 0 0 0 $0 $769 ---- 0.00% 0.00Lincoln Life & Annuity Co. of New York 0 0 0 $0 $16,497 ---- 0.00% 0.00Lumbermens Mutual Casualty Co. 0 0 0 $0 $164,696 ---- 0.00% 0.00Old Republic Life Ins. Co. 0 0 120 $0 $1 ---- 0.00% 0.00Teachers Ins. & Ann. Assoc. of Amer. 0 0 0 $0 $1,460,061 ---- 0.00% 0.00Union Central Life Ins. Co. 0 0 0 $0 $17,656 ---- 0.00% 0.00Government Employees Ins. Co. 4 48 517 ($4) $4 -100.00% 0.00% 0.00Chesapeak Life Ins. Co. 120 1,399 2,246 ($217) ($126) 58.06% 0.00% 0.00Republic Western Ins. Co. 1 12 18,742 ($1,850) $1 -0.05% 0.00% 0.00Pacificare Life & Health Ins. Co. 1 2 20 ($179,047) ($96,788) 54.06% -0.01% 0.00TOTALS 928,410 9,086,371 33,025,322 $1,440,624,956 $1,532,395,167 106.37% 100.00% 2,051.20
Total Comp. Major Med. (Gr. & Ind.) Policies Lives Member Months Premium Earned Claims Incurred Loss Ratio Market Share HHIHighmark West Virginia, Inc. 54,362 90,393 1,092,812 $369,531,006 $307,935,423 83.33% 49.53% 2,453.11Health Plan of the Upper OH Val 10,698 24,302 295,997 $83,124,773 $76,892,362 92.50% 11.14% 124.13Carelink Health Plans, Inc. 10,019 19,301 245,747 $81,200,063 $63,955,173 78.76% 10.88% 118.45Coventry Health & Life Ins. Co. 12,586 22,668 243,797 $79,739,451 $60,756,856 76.19% 10.69% 114.23United Healthcare Ins. Co. 955 14,730 176,760 $49,499,641 $42,994,447 86.86% 6.63% 44.02Principal Life Ins. Co. 120 3,088 36,652 $11,593,439 $7,898,951 68.13% 1.55% 2.41Consumers Life Ins. Co. 1,534 2,763 28,854 $7,750,219 $8,822,678 113.84% 1.04% 1.08Aetna Life Ins. Co. 466 2,957 35,265 $7,317,426 $6,305,029 86.16% 0.98% 0.96John Alden Life Ins. Co. 990 2,437 27,891 $6,678,939 $2,961,211 44.34% 0.90% 0.80Medical Benefits Mutual Life Ins. Co. 64 1,942 21,420 $6,459,033 $6,320,377 97.85% 0.87% 0.75Time Ins. Co. 1,804 2,986 33,257 $6,381,609 $3,225,771 50.55% 0.86% 0.73Union Security Ins. Co. 111 1,106 14,759 $5,551,645 $3,118,738 56.18% 0.74% 0.55First Health Life & Health Ins. Co. 159 1,033 12,396 $5,319,156 $4,330,100 81.41% 0.71% 0.51Connecticut General Life Ins. Co. 133 2,788 33,456 $5,277,865 $4,104,866 77.78% 0.71% 0.50THP Ins. Co. 934 1,874 20,689 $5,113,779 $4,950,932 96.82% 0.69% 0.47Central Reserve Life Ins. Co. 66 1,401 19,216 $4,332,834 $3,127,053 72.17% 0.58% 0.34Guardian Life Ins. Co. 26 798 12,245 $3,367,756 $2,738,361 81.31% 0.45% 0.20State Farm Mutual Automobile Ins. Co. 1 573 6,935 $2,446,648 $2,552,005 104.31% 0.33% 0.11Federated Mutual Ins. Co. 24 259 2,764 $1,058,290 $490,866 46.38% 0.14% 0.02Unicare Life & Health Ins. Co. 35 186 3,135 $931,653 $636,570 68.33% 0.12% 0.02Standard Security Life Ins. Co. of NY 11 106 1,254 $821,875 $796,626 96.93% 0.11% 0.01Continental General Ins. Co. 60 86 1,249 $658,975 $231,998 35.21% 0.09% 0.01Madison National Life Ins. Co., Inc. 9 73 876 $356,091 $146,039 41.01% 0.05% 0.00American Republic Ins. Co. 33 43 0 $247,126 $231,382 93.63% 0.03% 0.00Mega Life and Health Ins. Co. 70 119 1,275 $234,280 $63,943 27.29% 0.03% 0.00Great-West Life & Annuity Ins. Co. 5 17 264 $218,391 $197,459 90.42% 0.03% 0.00Metropolitan Life Ins. Co. 148 148 1,776 $162,771 $255,143 156.75% 0.02% 0.00American National Ins. Co. 18 30 392 $118,142 $119,073 100.79% 0.02% 0.00Prudential Ins. Co. of America 344 397 4,764 $107,794 $93,195 86.46% 0.01% 0.00AXA Equitable Life Ins. Co. 16 29 468 $101,482 $71,138 70.10% 0.01% 0.00Physicians Mutual Ins. Co. 14 15 180 $79,634 $50,786 63.77% 0.01% 0.00Golden Rule Ins. Co. 7 9 98 $64,797 $374,777 578.39% 0.01% 0.00World Ins. Co. 13 26 385 $56,301 $16,038 28.49% 0.01% 0.00Mid-West Nat. Life Ins. Co. of TN 0 0 745 $54,592 $28,247 51.74% 0.01% 0.00Union Labor Life Ins. Co. 0 0 24 $32,158 $31,660 98.45% 0.00% 0.00American Nat. Life Ins. Co. of TX 3 4 64 $21,146 $6,344 30.00% 0.00% 0.00Kanawha Ins. Co. 4 4 48 $15,812 $4,231 26.76% 0.00% 0.00Mutual of Omaha Ins. Co. 7 15 180 $13,437 ($35,256) -262.38% 0.00% 0.00Lincoln National Life Ins. Co. 8 8 96 $13,434 ($8,242) -61.35% 0.00% 0.00Universal Guaranty Life Ins. Co. 870 870 0 $12,553 $16,151 128.66% 0.00% 0.00Farm Family Life Ins. Co. 6 11 135 $7,156 $6,762 94.49% 0.00% 0.00
Total Comp. Major Med. (Gr. & Ind.) Policies Lives Member Months Premium Earned Claims Incurred Loss Ratio Market Share HHI

Total Comp. Major Med. (Gr. & Ind.) Policies Lives Member Months Premium Earned Claims Incurred Loss Ratio Market Share HHIGuarantee Trust Life Ins. Co. 13 13 51 $6,791 $36 0.53% 0.00% 0.00United Teacher Associates Ins. Co. 0 0 0 $2,582 $0 0.00% 0.00% 0.00American Gen. Life and Acc. Ins. Co. 1 1 12 $2,262 $0 0.00% 0.00% 0.00Bankers Life and Casualty Co. 1 1 16 $1,569 $0 0.00% 0.00% 0.00New England Life Ins. Co. 1 3 36 $1,320 ($73) -5.53% 0.00% 0.00United American Ins. Co. 0 0 0 $1,128 $1,762 156.21% 0.00% 0.00World Corp Ins. Co. 0 0 96 $985 $0 0.00% 0.00% 0.00Washington National Ins. Co. 1 1 12 $851 $356 41.83% 0.00% 0.00National Benefit Life Ins. Co. 2 3 36 $763 $0 0.00% 0.00% 0.00Union Bankers Ins. Co. 1 1 12 $462 $0 0.00% 0.00% 0.00U.S. Life Ins. Co. In the City of NY 2 2 72 $343 $2,381 694.17% 0.00% 0.00Unified Life Ins. Co. 4 4 12 $172 $0 0.00% 0.00% 0.00Wilton Reassurance Life Co. of NY 1 1 12 $127 $0 0.00% 0.00% 0.00Commonwealth Ann. & Life Ins. Co. 1 1 12 $43 $0 0.00% 0.00% 0.00Stonebridge Casualty Ins. Co. 3 36 58 $0 $0 ---- 0.00% 0.00American Community Mutual Ins. 0 0 0 $0 ($20) ---- 0.00% 0.00Chesapeak Life Ins. Co. 0 0 0 $0 ($129) ---- 0.00% 0.00United of Omaha Life Ins. Co. 0 0 0 $0 $12,713 ---- 0.00% 0.00Kansas City Life Ins. Co. 0 0 6 ($112) ($1,408) 1257.14% 0.00% 0.00TOTALS 96,764 199,662 2,378,763 $746,092,458 $616,830,881 82.67% 100.00% 2,863.41
Total Other Med (Non-Comp) Gr. & Ind. Policies Lives Member Months Premium Earned Claims Incurred Loss Ratio Market Share HHIHealth Plan of the Upper OH Val 31,664 31,664 388,602 $56,028,733 $55,733,936 99.47% 75.15% 5,646.92Mega Life and Health Ins. Co. 1,365 2,401 28,575 $5,427,702 $2,046,181 37.70% 7.28% 52.99United American Ins. Co. 1,482 2,116 17,964 $3,524,994 $2,199,313 62.39% 4.73% 22.35American Family Life Assurance Co. 14,938 30,694 337,180 $2,673,333 $1,101,399 41.20% 3.59% 12.86State Farm Mutual Automobile Ins. Co. 5,816 6,757 81,436 $1,985,627 $768,302 38.69% 2.66% 7.09Connecticut General Life Ins. Co. 38 124 1,484 $1,532,249 $1,193,627 77.90% 2.06% 4.22Bankers Life and Casualty Co. 1,929 2,015 23,258 $1,136,093 $831,648 73.20% 1.52% 2.32Continental Assurance Co. 0 0 0 $484,720 $2,696 0.56% 0.65% 0.42Combined Ins. Co. of America 1,056 1,191 13,029 $283,238 ($130,204) -45.97% 0.38% 0.14BCS Ins. Co. 0 38 0 $175,511 $212,655 121.16% 0.24% 0.06Monumental Life Ins. Co. 190 190 2,352 $135,505 $31,745 23.43% 0.18% 0.03Freedom Life Ins. Co. of America 13 25 312 $105,132 $108,615 103.31% 0.14% 0.02Colonial Life & Accident Ins. Co. 269 284 0 $99,710 $54,151 54.31% 0.13% 0.02Mutual of Omaha Ins. Co. 362 428 5,136 $98,657 $65,883 66.78% 0.13% 0.02Symetra Life Ins. Co. 6 125 1,319 $96,074 $78,835 82.06% 0.13% 0.02Mid-West Nat. Life Ins. Co. of TN 19 35 564 $75,297 $29,452 39.11% 0.10% 0.01United Nat. Life Ins. Co. of Amer 157 157 2,045 $68,817 $56,466 82.05% 0.09% 0.01American Gen. Life and Acc. Ins. Co. 945 945 11,790 $62,554 $20,984 33.55% 0.08% 0.01Aetna Life Ins. Co. 86 86 1,295 $42,282 $56,854 134.46% 0.06% 0.00Fidelity Security Life Ins. Co. 1 62 1,260 $38,338 $24,921 65.00% 0.05% 0.00United States Fire Ins. 669 669 1,905 $30,604 $17,596 57.50% 0.04% 0.00Central United Life Ins. Co. 6 7 12 $30,507 $11,207 36.74% 0.04% 0.00Amex Assurance Co. 0 265 3,299 $28,546 ($77) -0.27% 0.04% 0.00Assurity Life Ins. Co. 10 10 204 $25,390 $3,321 13.08% 0.03% 0.00American Income Life Ins. Co. 77 84 1,254 $25,177 $14,105 56.02% 0.03% 0.00Washington National Ins. Co. 112 128 1,746 $23,900 $9,998 41.83% 0.03% 0.00American Heritage Life Ins. Co. 9 126 1,512 $22,641 $860 3.80% 0.03% 0.00Fairmont Specialty Ins. Co. 850 850 8,075 $22,605 $35,308 156.20% 0.03% 0.00Globe Life and Accident Ins. Co. 13 14 162 $21,029 $3,170 15.07% 0.03% 0.00Provident Life and Accident Ins. Co. 11 193 0 $18,487 $174 0.94% 0.02% 0.00United Ins. Co. of America 168 336 4,428 $16,790 $16,322 97.21% 0.02% 0.00Pennsylvania Life Ins. Co. 60 60 756 $15,153 $3,140 20.72% 0.02% 0.00Reliance Standard Life Ins. Co. 3 29 0 $15,091 $12,287 81.42% 0.02% 0.00Guarantee Trust Life Ins. Co. 55 55 534 $14,841 $17,406 117.28% 0.02% 0.00Continental General Ins. Co. 14 18 172 $13,333 $0 0.00% 0.02% 0.00Bankers Fidelity Life Ins. Co. 24 24 341 $12,825 $18,680 145.65% 0.02% 0.00Life Investors Ins. Co. of America 17 18 222 $12,009 $2,102 17.50% 0.02% 0.00Genworth Life & Annuity Ins. Co. 2 2 24 $11,576 $4,381 37.85% 0.02% 0.00Loyal American Life Ins. Co. 74 120 1,538 $11,506 $1,422 12.36% 0.02% 0.00Conseco Senior Health Ins. Co. 29 30 396 $10,187 $3,685 36.17% 0.01% 0.00NY Life Ins. Co. 37 41 492 $9,149 $2,566 28.05% 0.01% 0.00Union Labor Life Ins. Co. 0 37 450 $8,679 $1,450 16.71% 0.01% 0.00Conseco Ins. Co. 36 46 420 $6,549 $11,967 182.73% 0.01% 0.00Professional Ins. Co. 3 3 36 $6,293 $0 0.00% 0.01% 0.00Nationwide Life Ins. Co. of America 31 36 456 $5,415 $899 16.60% 0.01% 0.00MetLife Ins. Co. of Connecticut 18 22 264 $4,764 $154 3.23% 0.01% 0.00Unified Life Ins. Co. 116 116 348 $4,666 $940 20.15% 0.01% 0.00Union Fidelity Life Ins. Co. 33 60 720 $4,543 $0 0.00% 0.01% 0.00Kanawha Ins. Co. 33 39 166 $4,008 $386 9.63% 0.01% 0.00Guardian Life Ins. Co. 3 3 31 $3,831 $1,144 29.86% 0.01% 0.00Prudential Ins. Co. of America 54 57 684 $3,683 $1,981 53.79% 0.00% 0.00Reassure America Life Ins. Co. 42 42 504 $3,674 $1,856 50.52% 0.00% 0.00Pan-American Life Ins. Co. 5 11 76 $3,379 $0 0.00% 0.00% 0.00United Teacher Associates Ins. Co. 26 29 348 $3,070 $121 3.94% 0.00% 0.00Medico Ins. Co. 11 11 132 $3,020 $5,100 168.87% 0.00% 0.00Citizens Security Ins. Co. 28 36 432 $2,913 $778 26.71% 0.00% 0.00American National Ins. Co. 6 6 72 $2,759 $11 0.40% 0.00% 0.00Liberty Life Ins. Co. 199 251 3,144 $2,404 $120 4.99% 0.00% 0.00Allianz Life Ins. Co. of North America 2 21 252 $2,391 $7,840 327.90% 0.00% 0.00Golden Rule Ins. Co. 10 11 133 $2,353 $3,204 136.17% 0.00% 0.00Ord of Utd Comm'l Trav. of Amer.-Frtl 13 16 192 $2,193 $0 0.00% 0.00% 0.00Mony Life Ins. Co. 9 13 156 $2,176 $0 0.00% 0.00% 0.00AIG Life Ins. Co. 4 4 48 $1,477 $0 0.00% 0.00% 0.00Liberty National Life Ins. Co. 9 14 1,512 $1,383 $211 15.26% 0.00% 0.00
Total Other Med (Non-Comp) Gr. & Ind. Policies Lives Member Months Premium Earned Claims Incurred Loss Ratio Market Share HHI

Total Other Med (Non-Comp) Gr. & Ind. Policies Lives Member Months Premium Earned Claims Incurred Loss Ratio Market Share HHITime Ins. Co. 10 11 148 $1,198 $14 1.17% 0.00% 0.00Standard Life & Accident Ins. Co. 15 16 147 $1,045 $0 0.00% 0.00% 0.00AIG Premier Ins. Co. 2 4 54 $904 $187 20.69% 0.00% 0.00Farm Family Life Ins. Co. 10 16 192 $885 $1,451 163.95% 0.00% 0.00National Guardian Life Ins. Co. 5 5 60 $876 $0 0.00% 0.00% 0.00Cincinnati Life Ins. Co. 37 37 444 $849 $137 16.14% 0.00% 0.00Unum Life Ins. Co. of America 0 0 0 $830 $0 0.00% 0.00% 0.00Physicians Mutual Ins. Co. 1 1 12 $605 $259 42.81% 0.00% 0.00Protective Life Ins. Co. 5 5 60 $518 $0 0.00% 0.00% 0.00Paul Revere Life Ins. Co. 9 9 0 $474 $700 147.68% 0.00% 0.00Central Reserve Life Ins. Co. 0 0 8 $416 ($103) -24.76% 0.00% 0.00HM Life Ins. Co. 1 2 24 $371 $0 0.00% 0.00% 0.00National States Ins. Co. 1 1 12 $366 $0 0.00% 0.00% 0.00Jackson National Life Ins. Co. 2 2 24 $281 $10 3.56% 0.00% 0.00Old American Ins. Co. 4 4 60 $197 $118 59.90% 0.00% 0.00New England Life Ins. Co. 2 2 31 $154 ($35) -22.73% 0.00% 0.00Kansas City Life Ins. Co. 1 1 12 $139 $3 2.16% 0.00% 0.00Unity Mutual Life Ins. Co. 1 1 12 $120 $0 0.00% 0.00% 0.00Banner Life Ins. Co. 2 3 36 $113 $0 0.00% 0.00% 0.00Lincoln National Life Ins. Co. 1 1 12 $111 $155 139.64% 0.00% 0.00Jefferson National Life Ins. Co. 1 1 12 $53 $13 24.53% 0.00% 0.00Great American Life Ins. Co. 1 1 12 $42 $0 0.00% 0.00% 0.00Federal Life Ins. Co. (Mutual) 1 1 12 $36 $0 0.00% 0.00% 0.00American Intl Life Assur Co. of NY 1 1 12 $25 $0 0.00% 0.00% 0.00EMC National Life Co. 1 1 12 $5 $0 0.00% 0.00% 0.00Western & Southern Life Ins. Co. 775 775 0 $0 $0 ---- 0.00% 0.00National Casualty Co. 3 4 48 ($2,309) ($21,114) 914.42% 0.00% 0.00TOTALS 64,159 84,205 956,705 $74,559,839 $64,685,069 86.76% 100.00% 5,749.53
Total Spec./Named Disease (Gr. & Ind.) Policies Lives Member Months Premium Earned Claims Incurred Loss Ratio Market Share HHIConseco Health Ins. Co. 25,830 40,439 491,786 $10,358,411 $9,102,013 87.87% 32.64% 1,065.33American Family Life Assurance Co. 28,292 59,220 701,614 $8,634,514 $5,221,677 60.47% 27.21% 740.24United Teacher Associates Ins. Co. 4,181 6,924 80,012 $1,818,834 $664,759 36.55% 5.73% 32.85Combined Ins. Co. of America 4,995 8,250 87,868 $1,528,554 $320,381 20.96% 4.82% 23.20Provident Life and Accident Ins. Co. 4,337 4,337 0 $1,417,041 $291,942 20.60% 4.47% 19.94Monumental Life Ins. Co. 6,276 6,284 75,174 $1,356,774 $337,631 24.88% 4.28% 18.28Colonial Life & Accident Ins. Co. 3,694 3,640 0 $1,180,340 $411,255 34.84% 3.72% 13.83American Heritage Life Ins. Co. 1,340 2,679 31,584 $671,440 $242,095 36.06% 2.12% 4.48American Gen. Life and Acc. Ins. Co. 2,711 2,711 33,618 $663,669 $191,959 28.92% 2.09% 4.37American Income Life Ins. Co. 2,990 4,549 35,178 $609,605 $380,324 62.39% 1.92% 3.69Loyal American Life Ins. Co. 3,004 6,650 82,060 $574,630 $477,478 83.09% 1.81% 3.28American Fidelity Assurance Co. 1,401 2,546 26,395 $561,050 $327,836 58.43% 1.77% 3.13Protective Life Ins. Co. 292 292 3,504 $326,774 $229,516 70.24% 1.03% 1.06Conseco Ins. Co. 711 711 6,498 $245,056 $67,888 27.70% 0.77% 0.60Mutual of Omaha Ins. Co. 1,255 1,546 18,445 $179,372 $131,508 73.32% 0.57% 0.32Reassure America Life Ins. Co. 715 715 8,580 $160,833 $432,608 268.98% 0.51% 0.26Liberty Life Ins. Co. 1,527 2,707 31,722 $155,572 $58,634 37.69% 0.49% 0.24Fam. Heritage Life Ins. Co. of Amer. 176 342 0 $125,229 $31,550 25.19% 0.39% 0.16Freedom Life Ins. Co. of America 293 295 3,798 $121,789 $56,264 46.20% 0.38% 0.15Life Investors Ins. Co. of America 104 118 2,771 $78,912 $8,467 10.73% 0.25% 0.06Mega Life and Health Ins. Co. 341 574 6,661 $78,797 $43,197 54.82% 0.25% 0.06Kanawha Ins. Co. 269 396 4,992 $71,971 $7,166 9.96% 0.23% 0.05United American Ins. Co. 215 368 2,438 $68,076 ($335) -0.49% 0.21% 0.05Conseco Senior Health Ins. Co. 200 200 2,472 $60,158 $146,473 243.48% 0.19% 0.04Reliastar Life Ins. Co. of NY 79 168 2,016 $60,142 $875 1.45% 0.19% 0.04Natl Un Fire Ins. Co. of Pitt, PA 156 156 1,872 $54,533 $858 1.57% 0.17% 0.03Bankers Fidelity Life Ins. Co. 189 189 2,305 $51,931 $24,427 47.04% 0.16% 0.03Central United Life Ins. Co. 72 101 12 $49,492 $207,386 419.03% 0.16% 0.02EMC National Life Co. 61 110 549 $45,363 $749 1.65% 0.14% 0.02Cincinnati Life Ins. Co. 809 809 9,708 $43,206 ($784) -1.81% 0.14% 0.02Assurity Life Ins. Co. 105 105 1,182 $41,308 $41,751 101.07% 0.13% 0.02Physicians Mutual Ins. Co. 197 240 2,262 $34,421 $24,793 72.03% 0.11% 0.01Union Fidelity Life Ins. Co. 148 210 2,520 $24,842 $8,650 34.82% 0.08% 0.01Washington National Ins. Co. 82 320 3,888 $23,245 $14,623 62.91% 0.07% 0.01Zurich American Ins. Co. 1 268 3,216 $22,079 $0 0.00% 0.07% 0.00HM Life Ins. Co. 1 97 1,164 $19,743 $0 0.00% 0.06% 0.00Transamerica Life Ins. Co. 10 35 585 $17,577 $99 0.56% 0.06% 0.00Continental American Ins. Co. 22 22 264 $17,139 $7,491 43.71% 0.05% 0.00Baltimore Life Ins. Co. 13 144 1,474 $16,607 $10,000 60.22% 0.05% 0.00United Nat. Life Ins. Co. of Amer 74 74 872 $16,269 $0 0.00% 0.05% 0.00Continental General Ins. Co. 44 63 775 $15,622 $7,404 47.39% 0.05% 0.00Fidelity Security Life Ins. Co. 0 204 2,460 $15,070 $2,141 14.21% 0.05% 0.00Medico Ins. Co. 201 340 4,080 $14,802 $10,170 68.71% 0.05% 0.00Jackson National Life Ins. Co. 23 23 276 $13,708 $0 0.00% 0.04% 0.00Liberty National Life Ins. Co. 18 27 5,832 $10,907 $1,667 15.28% 0.03% 0.00Guarantee Trust Life Ins. Co. 46 46 416 $10,739 $0 0.00% 0.03% 0.00Bankers Life and Casualty Co. 61 78 1,147 $9,634 $0 0.00% 0.03% 0.00National Teachers Assoc. Life Ins. Co. 35 30 336 $8,632 $55 0.64% 0.03% 0.00American National Ins. Co. 27 46 559 $8,075 $17,864 221.23% 0.03% 0.00Citizens Security Ins. Co. 74 78 936 $7,968 $0 0.00% 0.03% 0.00United Ins. Co. of America 54 108 1,392 $7,235 $483 6.68% 0.02% 0.00Hartford Life & Annuity Ins. Co. 59 59 708 $5,415 $8,181 151.08% 0.02% 0.00American Public Life Ins. Co. 0 0 0 $4,958 $0 0.00% 0.02% 0.00Globe Life and Accident Ins. Co. 87 106 1,287 $3,499 $1,072 30.64% 0.01% 0.00Union Security Ins. Co. 12 12 144 $2,735 $0 0.00% 0.01% 0.00Union Bankers Ins. Co. 129 129 1,548 $2,200 $772 35.09% 0.01% 0.00
Total Spec./Named Disease (Gr. & Ind.) Policies Lives Member Months Premium Earned Claims Incurred Loss Ratio Market Share HHI

Total Spec./Named Disease (Gr. & Ind.) Policies Lives Member Months Premium Earned Claims Incurred Loss Ratio Market Share HHIGenworth Life & Annuity Ins. Co. 11 11 132 $1,848 $0 0.00% 0.01% 0.00Mid-West Nat. Life Ins. Co. of TN 7 10 152 $1,442 $937 64.98% 0.00% 0.00American General Life Ins. Co. 2 2 24 $1,270 $0 0.00% 0.00% 0.00Cont'l Life Ins. Co. of Brentwood, TN 2 2 24 $626 $0 0.00% 0.00% 0.00John Alden Life Ins. Co. 1 1 19 $587 $38 6.47% 0.00% 0.00United of Omaha Life Ins. Co. 37 37 504 $476 $0 0.00% 0.00% 0.00Professional Ins. Co. 14 14 168 $384 $0 0.00% 0.00% 0.00Reliastar Life Ins. Co. 3 3 36 $319 $0 0.00% 0.00% 0.00Pennsylvania Life Ins. Co. 4 4 48 $310 $0 0.00% 0.00% 0.00Lifesecure Ins. Co. 3 3 0 $253 $0 0.00% 0.00% 0.00ING USA Annuity and Life Ins. Co. 4 4 48 $244 $0 0.00% 0.00% 0.00Union Labor Life Ins. Co. 0 12 144 $226 $0 0.00% 0.00% 0.00Old American Ins. Co. 1 1 12 $224 $13 5.80% 0.00% 0.00Nationwide Life Ins. Co. of America 1 1 12 $215 $0 0.00% 0.00% 0.00Unified Life Ins. Co. 22 23 69 $204 $2,475 1213.24% 0.00% 0.00Central Sts H & Life Co. of Omaha 1 1 12 $134 ($44) -32.84% 0.00% 0.00Standard Life & Accident Ins. Co. 5 5 67 $125 $0 0.00% 0.00% 0.00National Guardian Life Ins. Co. 3 3 36 $116 $0 0.00% 0.00% 0.00National Casualty Co. 1 1 12 $113 $0 0.00% 0.00% 0.00Teachers Prot. Mutual Life Ins. Co. 4 4 48 $109 $30,877 28327.52% 0.00% 0.00United Family Life Ins. Co. 1 1 12 $62 $0 0.00% 0.00% 0.00Life Ins. Co. of the Southwest 1 1 12 $38 $0 0.00% 0.00% 0.00New England Life Ins. Co. 0 0 2 $23 ($54) -234.78% 0.00% 0.00World Ins. Co. 2 4 48 $20 $0 0.00% 0.00% 0.00Reliable Life Ins. Co. 0 0 5 $13 $0 0.00% 0.00% 0.00Allianz Life Ins. Co. of North America 1 1 1 $4 $13 325.00% 0.00% 0.00Western & Southern Life Ins. Co. 2,638 1,324 0 $0 $0 ---- 0.00% 0.00Life Ins. Co. of North America 0 0 0 $0 $203,709 ---- 0.00% 0.00Medico Life Ins. Co. 0 0 0 $0 ($5) ---- 0.00% 0.00TOTALS 100,807 162,363 1,794,602 $31,735,882 $19,810,972 62.42% 100.00% 1,935.88
Total Limited Benefit (Gr. & Ind.) Policies Lives Member Months Premium Earned Claims Incurred Loss Ratio Market Share HHIVision Service Plan Ins. Co. 88 48,049 537,659 $3,119,141 $2,341,889 75.08% 52.34% 2,739.68Guardian Life Ins. Co. 179 17,858 149,241 $586,212 $250,836 42.79% 9.84% 96.77Monumental Life Ins. Co. 586 650 7,800 $385,428 $215,346 55.87% 6.47% 41.83National Guardian Life Ins. Co. 2 1,530 20,142 $268,546 $159,214 59.29% 4.51% 20.31Highmark West Virginia, Inc. 141 192 1,297 $222,662 $180,732 81.17% 3.74% 13.96Stonebridge Life Ins. Co. 2,252 3,471 41,652 $185,177 $351,334 189.73% 3.11% 9.66American Family Life Assurance Co. 836 1,149 11,229 $183,741 $60,150 32.74% 3.08% 9.51Standard Security Life Ins. Co. of NY 5 233 0 $157,932 $50,814 32.17% 2.65% 7.02Pan-American Life Ins. Co. 4 195 2,346 $144,329 $131,260 90.94% 2.42% 5.87American Fidelity Assurance Co. 311 555 4,831 $133,196 $34,450 25.86% 2.24% 5.00Ameritas Life Ins. Corporation 18 11,245 134,940 $110,778 $50,582 45.66% 1.86% 3.46Principal Life Ins. Co. 16 985 14,721 $88,178 $44,068 49.98% 1.48% 2.19Central United Life Ins. Co. 170 196 24 $68,383 $126,349 184.77% 1.15% 1.32ACE American Ins. Co. 1 5 66 $51,612 $0 0.00% 0.87% 0.75Individual Assr Co., Life, H & Acc. 2 328 0 $36,249 $9,005 24.84% 0.61% 0.37Union Fidelity Life Ins. Co. 101 119 1,428 $22,435 $13,188 58.78% 0.38% 0.14Bankers Life and Casualty Co. 0 0 0 $21,328 $232,758 1091.33% 0.36% 0.13AIG Life Ins. Co. 6 36 432 $18,971 $1,141 6.01% 0.32% 0.10Fidelity Security Life Ins. Co. 4 352 4,038 $18,299 $8,617 47.09% 0.31% 0.09Security Life Ins. Co. of America 9 141 12 $13,479 $4,048 30.03% 0.23% 0.05Continental American Ins. Co. 22 22 264 $11,667 $5,100 43.71% 0.20% 0.04Allstate Life Ins. Co. 24 68 600 $10,964 $1,352 12.33% 0.18% 0.03Cont'l Life Ins. Co. of Brentwood, TN 34 34 276 $10,057 $1,280 12.73% 0.17% 0.03Mega Life and Health Ins. Co. 28 41 466 $9,935 $1,308 13.17% 0.17% 0.03Kanawha Ins. Co. 34 34 240 $9,600 $0 0.00% 0.16% 0.03American General Life Ins. Co. 4 4 48 $8,977 $10,460 116.52% 0.15% 0.02HM Life Ins. Co. 1 6 72 $7,998 $0 0.00% 0.13% 0.02Chesapeak Life Ins. Co. 4 5 50 $7,911 $7,566 95.64% 0.13% 0.02Washington National Ins. Co. 1 6 72 $7,837 $6,059 77.31% 0.13% 0.02Combined Ins. Co. of America 15 15 180 $6,273 $1,277 20.36% 0.11% 0.01Genworth Life & Annuity Ins. Co. 5 5 60 $4,972 $2,408 48.43% 0.08% 0.01American Republic Ins. Co. 3 3 0 $3,088 $974 31.54% 0.05% 0.00National Benefit Life Ins. Co. 16 16 192 $2,407 $3,286 136.52% 0.04% 0.00Reassure America Life Ins. Co. 36 36 432 $2,228 $2,534 113.73% 0.04% 0.00Gerber Life Ins. Co. 15 15 180 $2,142 $592 27.64% 0.04% 0.00Standard Life & Accident Ins. Co. 4 4 36 $1,825 $2,025 110.96% 0.03% 0.00Horace Mann Life Ins. Co. 0 0 0 $1,806 $1,701 94.19% 0.03% 0.00Transamerica Life Ins. Co. 7 21 243 $1,644 $1,575 95.80% 0.03% 0.00Aetna Life Ins. Co. 1 1 32 $1,628 $100 6.14% 0.03% 0.00Security Life of Denver Ins. Co. 9 9 90 $1,549 $1,339 86.44% 0.03% 0.00Transamerica Financial Life Ins. Co. 9 11 132 $1,346 $0 0.00% 0.02% 0.00Union Security Ins. Co. 1 1 12 $1,263 $3,776 298.97% 0.02% 0.00John Alden Life Ins. Co. 2 3 36 $1,158 $59 5.09% 0.02% 0.00USAA Life Ins. Co. 2 2 24 $1,021 $0 0.00% 0.02% 0.00Companion Life Ins. Co. 1 7 88 $804 $650 80.85% 0.01% 0.00Colonial Penn Life Ins. Co. 1 3 42 $754 $44 5.84% 0.01% 0.00Union Bankers Ins. Co. 14 14 168 $714 $0 0.00% 0.01% 0.00Life Investors Ins. Co. of America 8 18 216 $696 $0 0.00% 0.01% 0.00New England Life Ins. Co. 2 3 36 $549 ($48) -8.74% 0.01% 0.00Time Ins. Co. 4 4 23 $306 $68 22.22% 0.01% 0.00World Ins. Co. 1 1 12 $40 $0 0.00% 0.00% 0.00Reliastar Life Ins. Co. 0 0 0 $11 ($64) -581.82% 0.00% 0.00United Liberty Life Ins. Co. 1 1 12 $1 $0 0.00% 0.00% 0.00Nationwide Life Ins. 0 321 3,152 $0 $0 ---- 0.00% 0.00Markel Ins. Co. 2 200 1,550 $0 $0 ---- 0.00% 0.00Colonial Life & Accident Ins. Co. 1 0 0 $0 $1,223 ---- 0.00% 0.00Reliastar Life Ins. Co. of NY 0 0 0 ($84) ($13) 15.48% 0.00% 0.00TOTALS 5,043 88,223 940,894 $5,959,163 $4,322,412 72.53% 100.00% 2,958.46
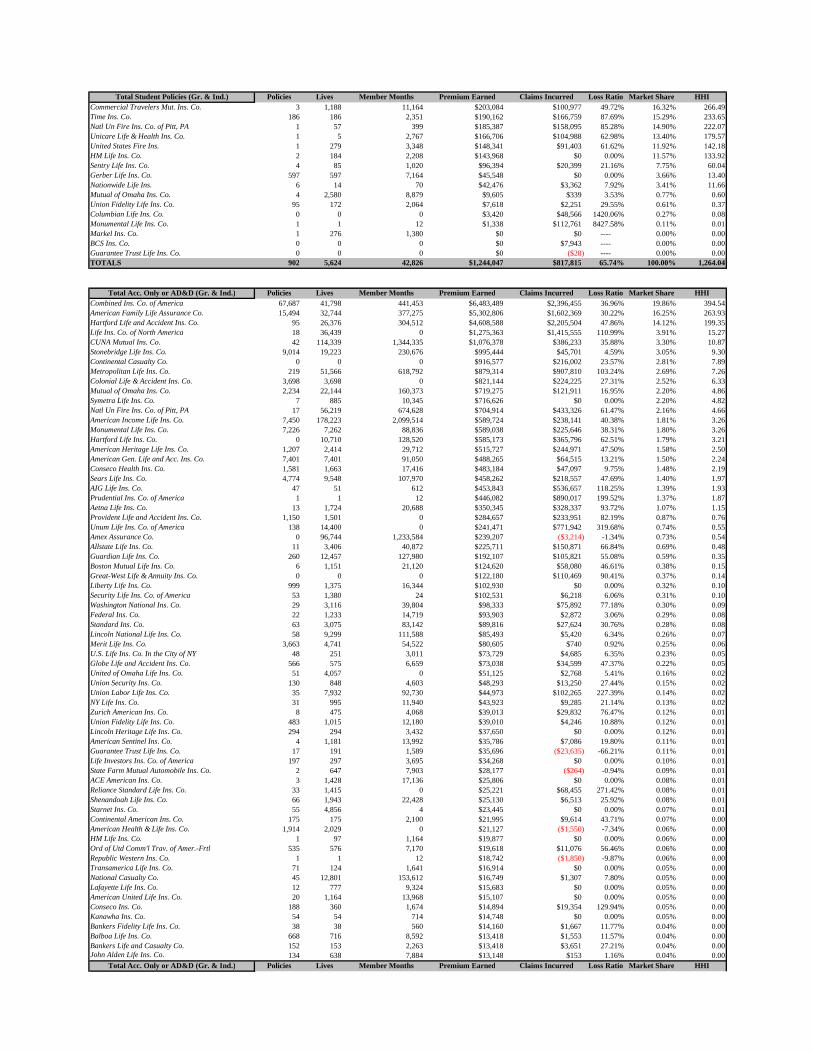
Total Student Policies (Gr. & Ind.) Policies Lives Member Months Premium Earned Claims Incurred Loss Ratio Market Share HHICommercial Travelers Mut. Ins. Co. 3 1,188 11,164 $203,084 $100,977 49.72% 16.32% 266.49Time Ins. Co. 186 186 2,351 $190,162 $166,759 87.69% 15.29% 233.65Natl Un Fire Ins. Co. of Pitt, PA 1 57 399 $185,387 $158,095 85.28% 14.90% 222.07Unicare Life & Health Ins. Co. 1 5 2,767 $166,706 $104,988 62.98% 13.40% 179.57United States Fire Ins. 1 279 3,348 $148,341 $91,403 61.62% 11.92% 142.18HM Life Ins. Co. 2 184 2,208 $143,968 $0 0.00% 11.57% 133.92Sentry Life Ins. Co. 4 85 1,020 $96,394 $20,399 21.16% 7.75% 60.04Gerber Life Ins. Co. 597 597 7,164 $45,548 $0 0.00% 3.66% 13.40Nationwide Life Ins. 6 14 70 $42,476 $3,362 7.92% 3.41% 11.66Mutual of Omaha Ins. Co. 4 2,580 8,879 $9,605 $339 3.53% 0.77% 0.60Union Fidelity Life Ins. Co. 95 172 2,064 $7,618 $2,251 29.55% 0.61% 0.37Columbian Life Ins. Co. 0 0 0 $3,420 $48,566 1420.06% 0.27% 0.08Monumental Life Ins. Co. 1 1 12 $1,338 $112,761 8427.58% 0.11% 0.01Markel Ins. Co. 1 276 1,380 $0 $0 ---- 0.00% 0.00BCS Ins. Co. 0 0 0 $0 $7,943 ---- 0.00% 0.00Guarantee Trust Life Ins. Co. 0 0 0 $0 ($28) ---- 0.00% 0.00TOTALS 902 5,624 42,826 $1,244,047 $817,815 65.74% 100.00% 1,264.04
Total Acc. Only or AD&D (Gr. & Ind.) Policies Lives Member Months Premium Earned Claims Incurred Loss Ratio Market Share HHICombined Ins. Co. of America 67,687 41,798 441,453 $6,483,489 $2,396,455 36.96% 19.86% 394.54American Family Life Assurance Co. 15,494 32,744 377,275 $5,302,806 $1,602,369 30.22% 16.25% 263.93Hartford Life and Accident Ins. Co. 95 26,376 304,512 $4,608,588 $2,205,504 47.86% 14.12% 199.35Life Ins. Co. of North America 18 36,439 0 $1,275,363 $1,415,555 110.99% 3.91% 15.27CUNA Mutual Ins. Co. 42 114,339 1,344,335 $1,076,378 $386,233 35.88% 3.30% 10.87Stonebridge Life Ins. Co. 9,014 19,223 230,676 $995,444 $45,701 4.59% 3.05% 9.30Continental Casualty Co. 0 0 0 $916,577 $216,002 23.57% 2.81% 7.89Metropolitan Life Ins. Co. 219 51,566 618,792 $879,314 $907,810 103.24% 2.69% 7.26Colonial Life & Accident Ins. Co. 3,698 3,698 0 $821,144 $224,225 27.31% 2.52% 6.33Mutual of Omaha Ins. Co. 2,234 22,144 160,373 $719,275 $121,911 16.95% 2.20% 4.86Symetra Life Ins. Co. 7 885 10,345 $716,626 $0 0.00% 2.20% 4.82Natl Un Fire Ins. Co. of Pitt, PA 17 56,219 674,628 $704,914 $433,326 61.47% 2.16% 4.66American Income Life Ins. Co. 7,450 178,223 2,099,514 $589,724 $238,141 40.38% 1.81% 3.26Monumental Life Ins. Co. 7,226 7,262 88,836 $589,038 $225,646 38.31% 1.80% 3.26Hartford Life Ins. Co. 0 10,710 128,520 $585,173 $365,796 62.51% 1.79% 3.21American Heritage Life Ins. Co. 1,207 2,414 29,712 $515,727 $244,971 47.50% 1.58% 2.50American Gen. Life and Acc. Ins. Co. 7,401 7,401 91,050 $488,265 $64,515 13.21% 1.50% 2.24Conseco Health Ins. Co. 1,581 1,663 17,416 $483,184 $47,097 9.75% 1.48% 2.19Sears Life Ins. Co. 4,774 9,548 107,970 $458,262 $218,557 47.69% 1.40% 1.97AIG Life Ins. Co. 47 51 612 $453,843 $536,657 118.25% 1.39% 1.93Prudential Ins. Co. of America 1 1 12 $446,082 $890,017 199.52% 1.37% 1.87Aetna Life Ins. Co. 13 1,724 20,688 $350,345 $328,337 93.72% 1.07% 1.15Provident Life and Accident Ins. Co. 1,150 1,501 0 $284,657 $233,951 82.19% 0.87% 0.76Unum Life Ins. Co. of America 138 14,400 0 $241,471 $771,942 319.68% 0.74% 0.55Amex Assurance Co. 0 96,744 1,233,584 $239,207 ($3,214) -1.34% 0.73% 0.54Allstate Life Ins. Co. 11 3,406 40,872 $225,711 $150,871 66.84% 0.69% 0.48Guardian Life Ins. Co. 260 12,457 127,980 $192,107 $105,821 55.08% 0.59% 0.35Boston Mutual Life Ins. Co. 6 1,151 21,120 $124,620 $58,080 46.61% 0.38% 0.15Great-West Life & Annuity Ins. Co. 0 0 0 $122,180 $110,469 90.41% 0.37% 0.14Liberty Life Ins. Co. 999 1,375 16,344 $102,930 $0 0.00% 0.32% 0.10Security Life Ins. Co. of America 53 1,380 24 $102,531 $6,218 6.06% 0.31% 0.10Washington National Ins. Co. 29 3,116 39,804 $98,333 $75,892 77.18% 0.30% 0.09Federal Ins. Co. 22 1,233 14,719 $93,903 $2,872 3.06% 0.29% 0.08Standard Ins. Co. 63 3,075 83,142 $89,816 $27,624 30.76% 0.28% 0.08Lincoln National Life Ins. Co. 58 9,299 111,588 $85,493 $5,420 6.34% 0.26% 0.07Merit Life Ins. Co. 3,663 4,741 54,522 $80,605 $740 0.92% 0.25% 0.06U.S. Life Ins. Co. In the City of NY 48 251 3,011 $73,729 $4,685 6.35% 0.23% 0.05Globe Life and Accident Ins. Co. 566 575 6,659 $73,038 $34,599 47.37% 0.22% 0.05United of Omaha Life Ins. Co. 51 4,057 0 $51,125 $2,768 5.41% 0.16% 0.02Union Security Ins. Co. 130 848 4,603 $48,293 $13,250 27.44% 0.15% 0.02Union Labor Life Ins. Co. 35 7,932 92,730 $44,973 $102,265 227.39% 0.14% 0.02NY Life Ins. Co. 31 995 11,940 $43,923 $9,285 21.14% 0.13% 0.02Zurich American Ins. Co. 8 475 4,068 $39,013 $29,832 76.47% 0.12% 0.01Union Fidelity Life Ins. Co. 483 1,015 12,180 $39,010 $4,246 10.88% 0.12% 0.01Lincoln Heritage Life Ins. Co. 294 294 3,432 $37,650 $0 0.00% 0.12% 0.01American Sentinel Ins. Co. 4 1,181 13,992 $35,786 $7,086 19.80% 0.11% 0.01Guarantee Trust Life Ins. Co. 17 191 1,589 $35,696 ($23,635) -66.21% 0.11% 0.01Life Investors Ins. Co. of America 197 297 3,695 $34,268 $0 0.00% 0.10% 0.01State Farm Mutual Automobile Ins. Co. 2 647 7,903 $28,177 ($264) -0.94% 0.09% 0.01ACE American Ins. Co. 3 1,428 17,136 $25,806 $0 0.00% 0.08% 0.01Reliance Standard Life Ins. Co. 33 1,415 0 $25,221 $68,455 271.42% 0.08% 0.01Shenandoah Life Ins. Co. 66 1,943 22,428 $25,130 $6,513 25.92% 0.08% 0.01Starnet Ins. Co. 55 4,856 4 $23,445 $0 0.00% 0.07% 0.01Continental American Ins. Co. 175 175 2,100 $21,995 $9,614 43.71% 0.07% 0.00American Health & Life Ins. Co. 1,914 2,029 0 $21,127 ($1,550) -7.34% 0.06% 0.00HM Life Ins. Co. 1 97 1,164 $19,877 $0 0.00% 0.06% 0.00Ord of Utd Comm'l Trav. of Amer.-Frtl 535 576 7,170 $19,618 $11,076 56.46% 0.06% 0.00Republic Western Ins. Co. 1 1 12 $18,742 ($1,850) -9.87% 0.06% 0.00Transamerica Life Ins. Co. 71 124 1,641 $16,914 $0 0.00% 0.05% 0.00National Casualty Co. 45 12,801 153,612 $16,749 $1,307 7.80% 0.05% 0.00Lafayette Life Ins. Co. 12 777 9,324 $15,683 $0 0.00% 0.05% 0.00American United Life Ins. Co. 20 1,164 13,968 $15,107 $0 0.00% 0.05% 0.00Conseco Ins. Co. 188 360 1,674 $14,894 $19,354 129.94% 0.05% 0.00Kanawha Ins. Co. 54 54 714 $14,748 $0 0.00% 0.05% 0.00Bankers Fidelity Life Ins. Co. 38 38 560 $14,160 $1,667 11.77% 0.04% 0.00Balboa Life Ins. Co. 668 716 8,592 $13,418 $1,553 11.57% 0.04% 0.00Bankers Life and Casualty Co. 152 153 2,263 $13,418 $3,651 27.21% 0.04% 0.00John Alden Life Ins. Co. 134 638 7,884 $13,148 $153 1.16% 0.04% 0.00
Total Acc. Only or AD&D (Gr. & Ind.) Policies Lives Member Months Premium Earned Claims Incurred Loss Ratio Market Share HHI

Total Acc. Only or AD&D (Gr. & Ind.) Policies Lives Member Months Premium Earned Claims Incurred Loss Ratio Market Share HHIUnited Ins. Co. of America 155 310 4,188 $12,636 $2,254 17.84% 0.04% 0.00American General Assurance Co. 0 137 1,644 $12,131 $6,483 53.44% 0.04% 0.00United Teacher Associates Ins. Co. 41 53 493 $11,859 $1,514 12.77% 0.04% 0.00Medical Benefits Mutual Life Ins. Co. 57 996 11,554 $11,554 $0 0.00% 0.04% 0.00Mega Life and Health Ins. Co. 32 44 11,783 $10,671 $15,044 140.98% 0.03% 0.00American General Life Ins. Co. 33 33 396 $9,987 $2,102 21.05% 0.03% 0.00Genworth Life & Annuity Ins. Co. 103 103 1,236 $9,481 $1,882 19.85% 0.03% 0.00OneBeacon America Ins. Co. 2 327 1,962 $8,986 $0 0.00% 0.03% 0.00Standard Life & Accident Ins. Co. 351 351 4,288 $6,296 $15 0.24% 0.02% 0.00Continental General Ins. Co. 24 24 329 $6,220 $163 2.62% 0.02% 0.00Fam. Heritage Life Ins. Co. of Amer. 14 18 0 $5,983 $9,022 150.79% 0.02% 0.00Perico Life Ins. Co. 28 36 432 $5,883 $158 2.69% 0.02% 0.00Reassure America Life Ins. Co. 64 64 768 $5,858 $2,111 36.04% 0.02% 0.00Colonial Penn Life Ins. Co. 27 31 420 $4,011 $2,284 56.94% 0.01% 0.00Paul Revere Life Ins. Co. 4 172 0 $3,895 $0 0.00% 0.01% 0.00Sentry Ins. A Mutual Co. 1 88 1,056 $3,518 $0 0.00% 0.01% 0.00Baltimore Life Ins. Co. 99 99 1,201 $3,001 $0 0.00% 0.01% 0.00Standard Security Life Ins. Co. of NY 1 45 0 $2,640 $0 0.00% 0.01% 0.00Chesapeak Life Ins. Co. 3 119 1,398 $2,234 ($244) -10.92% 0.01% 0.00Starmount Life Ins. Co. 37 37 444 $2,136 $0 0.00% 0.01% 0.00Assurity Life Ins. Co. 4 4 42 $2,135 $6 0.28% 0.01% 0.00Alta Health & Life Ins. Co. 0 0 0 $1,926 $1,458 75.70% 0.01% 0.00Commercial Travelers Mut. Ins. Co. 4 18 228 $1,866 $0 0.00% 0.01% 0.00Time Ins. Co. 21 108 1,440 $1,790 $0 0.00% 0.01% 0.00QBE Ins. Corporation 13 0 0 $1,652 $1,004 60.80% 0.01% 0.00Physicians Mutual Ins. Co. 17 19 223 $1,632 ($20,914) -1281.50% 0.00% 0.00Horace Mann Life Ins. Co. 47 47 564 $1,540 ($3) -0.19% 0.00% 0.00Fidelity Security Life Ins. Co. 0 15 174 $1,402 $2,899 206.78% 0.00% 0.00American Home Assurance Co. 8 8 96 $1,071 ($62) -5.79% 0.00% 0.00Unicare Life & Health Ins. Co. 1 50 608 $996 $0 0.00% 0.00% 0.00Government Employees Ins. Co. 8 8 96 $971 ($5) -0.51% 0.00% 0.00Cincinnati Life Ins. Co. 921 921 11,052 $923 $0 0.00% 0.00% 0.00Unified Life Ins. Co. 163 183 549 $816 $0 0.00% 0.00% 0.00Conseco Senior Health Ins. Co. 19 19 228 $781 $0 0.00% 0.00% 0.00American Bankers Life Assurance Co. 0 0 0 $700 $4,882 697.43% 0.00% 0.00Loyal American Life Ins. Co. 4 7 89 $694 $0 0.00% 0.00% 0.00Old American Ins. Co. 37 37 462 $675 $39 5.78% 0.00% 0.00Medico Ins. Co. 0 0 0 $614 ($5) -0.81% 0.00% 0.00Liberty National Life Ins. Co. 13 13 2,028 $577 $24 4.16% 0.00% 0.00Central United Life Ins. Co. 5 5 12 $521 $0 0.00% 0.00% 0.00American Fidelity Assurance Co. 1 1 12 $470 $1,494 317.87% 0.00% 0.00Reliastar Life Ins. Co. 3 44 528 $459 $0 0.00% 0.00% 0.00Pennsylvania Life Ins. Co. 0 0 6 $451 $0 0.00% 0.00% 0.00New England Life Ins. Co. 0 0 0 $422 $0 0.00% 0.00% 0.00Pan-American Life Ins. Co. 1 1 5 $400 $352 88.00% 0.00% 0.00Nationwide Life Ins. Co. of America 3 4 54 $389 $0 0.00% 0.00% 0.00Jefferson National Life Ins. Co. 3 3 36 $365 $89 24.38% 0.00% 0.00Transamerica Financial Life Ins. Co. 5 7 84 $343 $0 0.00% 0.00% 0.00Security Life of Denver Ins. Co. 1 1 10 $316 $0 0.00% 0.00% 0.00Farmers New World Life Ins. 0 0 0 $229 $0 0.00% 0.00% 0.00USAA Life Ins. Co. 1 3 24 $197 $0 0.00% 0.00% 0.00Transamerica Occidental Life Ins. Co. 1 2 26 $190 $0 0.00% 0.00% 0.00American Prog. Life & H Ins. Co. 4 4 48 $153 $0 0.00% 0.00% 0.00Old Republic Life Ins. Co. 14,462 0 0 $120 $316 263.33% 0.00% 0.00American National Ins. Co. 2 2 24 $76 $0 0.00% 0.00% 0.00Central Security Life Ins. Co. 1 1 12 $73 $0 0.00% 0.00% 0.00Stonebridge Casualty Ins. Co. 1 3 36 $58 $0 0.00% 0.00% 0.00Federal Life Ins. Co. (Mutual) 9 9 121 $32 $0 0.00% 0.00% 0.00Brokers National Life Assurance Co. 10 10 120 $16 $0 0.00% 0.00% 0.00Jackson National Life Ins. Co. 3 3 36 $13 $0 0.00% 0.00% 0.00Anthem Life Ins. Co. 1 4 48 $8 $0 0.00% 0.00% 0.00Markel Ins. Co. 39 4,302 28,645 $0 $0 ---- 0.00% 0.00Western & Southern Life Ins. Co. 1,230 1,096 0 $0 $0 ---- 0.00% 0.00Gerber Life Ins. Co. 1 32 384 $0 $0 ---- 0.00% 0.00Individual Assr Co., Life, H & Acc. 0 0 0 $0 ($96) ---- 0.00% 0.00Connecticut General Life Ins. Co. 2 3 35 ($3,180) ($2,794) 87.86% -0.01% 0.00TOTALS 158,853 836,493 8,998,243 $32,640,868 $14,997,043 45.95% 100.00% 956.53

Total Short Term Dis (Gr. & Ind.) Policies Lives Member Months Premium Earned Claims Incurred Loss Ratio Market Share HHIAmerican Family Life Assurance Co. 7,419 7,419 83,229 $3,457,936 $1,421,804 41.12% 15.19% 230.75Combined Ins. Co. of America 8,114 8,329 86,618 $2,121,603 $87,322 4.12% 9.32% 86.86Colonial Life & Accident Ins. Co. 3,707 4,160 0 $1,798,890 $705,489 39.22% 7.90% 62.45Provident Life and Accident Ins. Co. 2,006 2,391 0 $1,593,987 $1,552,817 97.42% 7.00% 49.03Unum Life Ins. Co. of America 588 4,742 0 $1,235,995 $2,040,772 165.11% 5.43% 29.48Metropolitan Life Ins. Co. 70 8,223 98,676 $1,222,021 $1,106,768 90.57% 5.37% 28.82Paul Revere Life Ins. Co. 640 685 0 $1,172,516 $1,719,859 146.68% 5.15% 26.53Guardian Life Ins. Co. 309 4,613 52,578 $1,134,982 $796,356 70.16% 4.99% 24.86Sun Life & Health Ins. Co. (US) 42 1,312 15,744 $1,090,597 $0 0.00% 4.79% 22.95Fort Dearborn Life Ins. Co. 102 2,881 0 $970,769 $643,007 66.24% 4.26% 18.19State Farm Mutual Automobile Ins. Co. 2,691 2,691 33,398 $894,677 $557,276 62.29% 3.93% 15.45Prudential Ins. Co. of America 17 425 5,100 $740,083 $391,520 52.90% 3.25% 10.57Monumental Life Ins. Co. 2,598 2,641 31,696 $614,832 $417,441 67.90% 2.70% 7.29American Fidelity Assurance Co. 23 2,371 21,396 $533,616 $243,567 45.64% 2.34% 5.49Standard Ins. Co. 41 2,286 30,757 $479,008 $386,908 80.77% 2.10% 4.43Union Security Ins. Co. 38 1,645 19,029 $324,490 $170,226 52.46% 1.43% 2.03Reliance Standard Life Ins. Co. 11 948 0 $283,346 $695,715 245.54% 1.24% 1.55Boston Mutual Life Ins. Co. 1 49 3,444 $253,349 $192,298 75.90% 1.11% 1.24Lincoln National Life Ins. Co. 16 1,547 18,564 $249,886 $104,691 41.90% 1.10% 1.21American Bankers Life Assurance Co. 0 0 0 $209,227 ($17,984) -8.60% 0.92% 0.84Eastern Life and Health Ins. Co. 14 970 12,678 $202,210 $130,817 64.69% 0.89% 0.79Sun Life Assurance Co. of Canada (US) 22 2,031 15,144 $187,936 $316,614 168.47% 0.83% 0.68Hartford Life and Accident Ins. Co. 0 103 1,236 $187,784 $135,362 72.08% 0.82% 0.68American United Life Ins. Co. 7 510 6,120 $173,780 $58,533 33.68% 0.76% 0.58Principal Life Ins. Co. 47 760 8,453 $141,456 $90,300 63.84% 0.62% 0.39American Heritage Life Ins. Co. 236 424 4,944 $138,284 $73,189 52.93% 0.61% 0.37Northwestern Mutual Life Ins. Co. 13 309 3,603 $136,747 $20,531 15.01% 0.60% 0.36Hartford Life Ins. Co. 0 138 1,656 $100,219 $62,648 62.51% 0.44% 0.19American General Assurance Co. 23 3,567 0 $90,733 $663,313 731.06% 0.40% 0.16Companion Life Ins. Co. 27 306 3,653 $84,405 $72,827 86.28% 0.37% 0.14Aetna Life Ins. Co. 19 212 2,428 $82,827 $283,518 342.30% 0.36% 0.13Liberty Life Ins. Co. 360 360 4,626 $73,698 $42,282 57.37% 0.32% 0.10United of Omaha Life Ins. Co. 12 292 0 $60,621 $191,063 315.18% 0.27% 0.07Shenandoah Life Ins. Co. 16 287 3,834 $56,418 $24,232 42.95% 0.25% 0.06Farm Family Life Ins. Co. 103 103 1,230 $55,655 $16,426 29.51% 0.24% 0.06Life Ins. Co. of North America 5 244 0 $52,469 $419,983 800.44% 0.23% 0.05Horace Mann Life Ins. Co. 124 163 1,956 $49,030 $9,560 19.50% 0.22% 0.05CUNA Mutual Ins. Co. 13 235 2,842 $46,486 $34,291 73.77% 0.20% 0.04National Guardian Life Ins. Co. 85 85 1,074 $38,090 $37,034 97.23% 0.17% 0.03Ohio National Life Assurance Corp. 26 26 0 $36,457 $0 0.00% 0.16% 0.03Kanawha Ins. Co. 121 121 1,434 $35,069 $28,415 81.03% 0.15% 0.02Transamerica Life Ins. Co. 8 82 735 $30,598 $1,448 4.73% 0.13% 0.02Mega Life and Health Ins. Co. 90 90 1,043 $29,717 $17,700 59.56% 0.13% 0.02AIG Life Ins. Co. 5 76 912 $24,885 $9,146 36.75% 0.11% 0.01Bankers Fidelity Life Ins. Co. 44 44 547 $24,692 $0 0.00% 0.11% 0.01Continental General Ins. Co. 37 37 476 $18,687 $4,301 23.02% 0.08% 0.01Symetra Life Ins. Co. 27 27 0 $18,059 $23,160 128.25% 0.08% 0.01U.S. Life Ins. Co. In the City of NY 15 69 828 $17,257 $3,513 20.36% 0.08% 0.01USAA Life Ins. Co. 14 14 180 $15,561 $0 0.00% 0.07% 0.00Illinois Mutual Life Ins. Co. 4 53 660 $14,693 $18,299 124.54% 0.06% 0.00Great-West Life & Annuity Ins. Co. 0 0 0 $13,451 $12,161 90.41% 0.06% 0.00United Ins. Co. of America 121 121 1,572 $12,821 $30,716 239.58% 0.06% 0.00American Gen. Life and Acc. Ins. Co. 20 20 234 $11,935 $75 0.63% 0.05% 0.00Mutual of Omaha Ins. Co. 20 24 278 $11,404 ($2,467) -21.63% 0.05% 0.00Reliastar Life Ins. Co. 7 38 456 $10,220 $24,512 239.84% 0.04% 0.00Unicare Life & Health Ins. Co. 1 50 608 $9,789 $47,443 484.66% 0.04% 0.00Fidelity Security Life Ins. Co. 2 11 120 $8,537 $0 0.00% 0.04% 0.00John Alden Life Ins. Co. 9 29 359 $8,438 $11,011 130.49% 0.04% 0.00Lafayette Life Ins. Co. 2 30 360 $7,734 $0 0.00% 0.03% 0.00Minnesota Life Ins. Co. 3 110 1,152 $6,862 $19,650 286.36% 0.03% 0.00Ohio National Life Ins. Co. 25 25 0 $6,679 $2,279 34.12% 0.03% 0.00American Public Life Ins. Co. 0 0 0 $5,683 $1,119 19.69% 0.02% 0.00Life Investors Ins. Co. of America 13 13 204 $5,637 ($7,878) -139.76% 0.02% 0.00Medical Benefits Mutual Life Ins. Co. 2 80 1,046 $4,706 $11,596 246.41% 0.02% 0.00NY Life Ins. Co. 1 2 24 $4,276 $2,223 51.99% 0.02% 0.00American States Ins. Co. 0 0 0 $3,609 $6,934 192.13% 0.02% 0.00Kansas City Life Ins. Co. 1 11 132 $3,449 $0 0.00% 0.02% 0.00Humana Ins. Co. 2 9 108 $2,863 $2,887 100.84% 0.01% 0.00Harleysville Life Ins. Co. 1 17 204 $2,232 $396 17.74% 0.01% 0.00Federated Mutual Ins. Co. 6 49 366 $2,198 $278 12.65% 0.01% 0.00Colorado Bankers Life Ins. Co. 7 7 84 $2,059 $0 0.00% 0.01% 0.00American National Ins. Co. 2 2 24 $1,976 ($227) -11.49% 0.01% 0.00American Network Ins. Co. 1 1 12 $1,902 $0 0.00% 0.01% 0.00BCS Life Ins. Co. 0 0 0 $1,898 $3,756 197.89% 0.01% 0.00Conseco Senior Health Ins. Co. 3 3 42 $1,665 $0 0.00% 0.01% 0.00Bankers Life and Casualty Co. 7 7 192 $1,365 $777 56.92% 0.01% 0.00Union Bankers Ins. Co. 23 23 276 $1,322 $7,525 569.21% 0.01% 0.00Pennsylvania Life Ins. Co. 3 3 36 $1,226 $0 0.00% 0.01% 0.00Union Labor Life Ins. Co. 0 2 24 $1,116 $585 52.42% 0.00% 0.00Commercial Travelers Mut. Ins. Co. 38 38 492 $958 $0 0.00% 0.00% 0.00American Income Life Ins. Co. 3 3 42 $932 $0 0.00% 0.00% 0.00Central United Life Ins. Co. 7 7 12 $722 $8,660 1199.45% 0.00% 0.00Old Republic Life Ins. Co. 0 0 0 $565 ($4,735) -838.05% 0.00% 0.00Hartford Life & Annuity Ins. Co. 4 4 48 $481 $727 151.14% 0.00% 0.00EMC National Life Co. 1 1 12 $408 $0 0.00% 0.00% 0.00Great Southern Life Ins. Co. 2 2 24 $407 $0 0.00% 0.00% 0.00American Sentinel Ins. Co. 2 2 24 $405 ($11) -2.72% 0.00% 0.00Heritage Casualty Ins. Co. 1 24 288 $378 $0 0.00% 0.00% 0.00Sentry Life Ins. Co. 0 0 35 $290 $0 0.00% 0.00% 0.00Teachers Prot. Mutual Life Ins. Co. 2 2 24 $222 $0 0.00% 0.00% 0.00
Total Short Term Dis (Gr. & Ind.) Policies Lives Member Months Premium Earned Claims Incurred Loss Ratio Market Share HHI

Total Short Term Dis (Gr. & Ind.) Policies Lives Member Months Premium Earned Claims Incurred Loss Ratio Market Share HHITransamerica Occidental Life Ins. Co. 1 1 12 $218 $0 0.00% 0.00% 0.00Transamerica Financial Life Ins. Co. 1 2 14 $215 $0 0.00% 0.00% 0.00Allianz Life Ins. Co. of North America 1 6 72 $160 $526 328.75% 0.00% 0.00Pan-American Life Ins. Co. 5 11 76 $158 $0 0.00% 0.00% 0.00First Investors Life Ins. Co. 1 1 12 $149 $0 0.00% 0.00% 0.00Baltimore Life Ins. Co. 0 0 1 $102 $17,837 17487.25% 0.00% 0.00Medico Ins. Co. 2 2 24 $70 $1 1.43% 0.00% 0.00Union Fidelity Life Ins. Co. 0 0 0 $67 $0 0.00% 0.00% 0.00Liberty Life Assurance Co. of Boston 0 0 0 $0 $202,147 ---- 0.00% 0.00Connecticut General Life Ins. Co. 3 3 35 ($6,440) ($5,658) 87.86% -0.03% 0.00TOTALS 30,306 71,892 591,681 $22,763,852 $16,399,202 72.04% 100.00% 635.13
Total Long Term Dis. (Gr. & Ind.) Policies Lives Member Months Premium Earned Claims Incurred Loss Ratio Market Share HHIHartford Life and Accident Ins. Co. 87 55,695 668,340 $10,295,554 $8,455,361 82.13% 19.66% 386.43Northwestern Mutual Life Ins. Co. 4,809 7,489 84,429 $5,397,652 $3,151,041 58.38% 10.31% 106.21Unum Life Ins. Co. of America 172 21,171 0 $4,768,173 $6,237,780 130.82% 9.10% 82.88Standard Ins. Co. 177 14,193 164,438 $4,313,210 $2,831,152 65.64% 8.24% 67.82Metropolitan Life Ins. Co. 72 21,081 252,972 $4,029,493 $3,781,151 93.84% 7.69% 59.19Life Ins. Co. of North America 16 14,526 0 $3,123,070 $4,729,189 151.43% 5.96% 35.56Prudential Ins. Co. of America 141 4,286 51,432 $2,155,889 $2,186,275 101.41% 4.12% 16.94Guardian Life Ins. Co. 136 6,627 72,798 $1,460,319 $1,097,276 75.14% 2.79% 7.77Sun Life & Health Ins. Co. (US) 42 1,596 19,152 $1,314,937 $244,494 18.59% 2.51% 6.30Massachusetts Mutual Life Ins. Co. 1,219 994 15,117 $1,186,367 $1,391,614 117.30% 2.27% 5.13Reliastar Life Ins. Co. 40 2,470 29,640 $1,090,211 $588,500 53.98% 2.08% 4.33Lincoln National Life Ins. Co. 241 6,108 73,296 $1,032,307 $1,236,451 119.78% 1.97% 3.88Mutual of Omaha Ins. Co. 404 3,515 42,169 $977,971 $1,442,383 147.49% 1.87% 3.49Union Security Ins. Co. 54 35,013 420,156 $937,452 $691,712 73.79% 1.79% 3.20Sun Life Assurance Co. of Canada (US) 40 7,682 19,692 $891,834 $794,083 89.04% 1.70% 2.90Principal Life Ins. Co. 35 2,357 27,507 $695,517 $240,263 34.54% 1.33% 1.76NY Life Ins. Co. 435 750 9,000 $688,901 $111,102 16.13% 1.32% 1.73Berkshire Life Ins. Co. of America 271 271 3,252 $599,057 ($40,754) -6.80% 1.14% 1.31Professional Ins. Co. 937 937 11,244 $589,067 $480,728 81.61% 1.12% 1.27AXA Equitable Life Ins. Co. 275 275 3,432 $481,075 $936,452 194.66% 0.92% 0.84U.S. Life Ins. Co. In the City of NY 14 489 5,865 $472,419 $416,925 88.25% 0.90% 0.81American Fidelity Assurance Co. 21 2,417 24,977 $456,814 $338,030 74.00% 0.87% 0.76Fort Dearborn Life Ins. Co. 49 2,217 0 $455,968 $202,464 44.40% 0.87% 0.76United of Omaha Life Ins. Co. 37 1,553 0 $453,438 $479,909 105.84% 0.87% 0.75Assurity Life Ins. Co. 735 735 9,360 $414,942 $343,572 82.80% 0.79% 0.63Riversource Life Ins. Co. 338 338 4,056 $280,812 $177,581 63.24% 0.54% 0.29Ohio National Life Assurance Corp. 117 117 0 $241,192 $269,710 111.82% 0.46% 0.21Reassure America Life Ins. Co. 191 191 2,292 $214,709 $328,204 152.86% 0.41% 0.17Reliance Standard Life Ins. Co. 15 1,459 0 $213,813 $1,738,715 813.19% 0.41% 0.17Ohio National Life Ins. Co. 116 116 0 $188,132 $47,090 25.03% 0.36% 0.13Liberty Life Assurance Co. of Boston 3 1,589 19,068 $187,577 $593,137 316.21% 0.36% 0.13Mony Life Ins. Co. 157 158 1,992 $177,174 $94,726 53.46% 0.34% 0.11Aetna Life Ins. Co. 4 1,397 15,527 $175,914 $2,157,724 1226.58% 0.34% 0.11Boston Mutual Life Ins. Co. 8 1,487 27,426 $160,945 $106,497 66.17% 0.31% 0.09Paul Revere Life Ins. Co. 19 205 0 $142,452 $160,204 112.46% 0.27% 0.07CUNA Mutual Ins. Co. 58 540 6,480 $138,646 $17,008 12.27% 0.26% 0.07State Farm Mutual Automobile Ins. Co. 161 161 1,998 $134,132 $366,236 273.04% 0.26% 0.07Companion Life Ins. Co. 24 484 5,824 $129,005 $50,698 39.30% 0.25% 0.06American General Life Ins. Co. 288 288 3,456 $124,215 $117,087 94.26% 0.24% 0.06Minnesota Life Ins. Co. 59 56 702 $111,857 $201,009 179.70% 0.21% 0.05Hartford Life Ins. Co. 0 3,449 41,388 $106,665 $101,937 95.57% 0.20% 0.04Centre Life Ins. Co. 50 50 642 $97,848 ($33,996) -34.74% 0.19% 0.03Horace Mann Life Ins. Co. 77 797 9,554 $97,071 $167,945 173.01% 0.19% 0.03Union Central Life Ins. Co. 38 38 0 $91,759 $17,656 19.24% 0.18% 0.03Federated Life Ins. Co. 82 82 996 $88,031 $0 0.00% 0.17% 0.03Illinois Mutual Life Ins. Co. 108 108 1,236 $83,091 $51,335 61.78% 0.16% 0.03National Life Ins. Co. 168 94 0 $82,319 $558,910 678.96% 0.16% 0.02Farm Family Life Ins. Co. 100 100 1,194 $68,589 $406,780 593.07% 0.13% 0.02Pan-American Life Ins. Co. 25 25 300 $59,731 $26,162 43.80% 0.11% 0.01Lafayette Life Ins. Co. 44 107 792 $57,095 $32,505 56.93% 0.11% 0.01American United Life Ins. Co. 8 342 4,104 $52,218 $73,182 140.15% 0.10% 0.01Pennsylvania Life Ins. Co. 521 521 6,480 $49,441 $111,975 226.48% 0.09% 0.01Continental American Ins. Co. 95 95 1,140 $48,390 $21,151 43.71% 0.09% 0.01Eastern Life and Health Ins. Co. 6 274 4,746 $39,399 $134,945 342.51% 0.08% 0.01Protective Life Ins. Co. 44 44 528 $35,277 $11,911 33.76% 0.07% 0.00MetLife Ins. Co. of Connecticut 45 45 540 $34,103 ($58,634) -171.93% 0.07% 0.00Mutual of America Life Ins. Co. 14 94 1,128 $34,092 $74,637 218.93% 0.07% 0.00Shenandoah Life Ins. Co. 7 275 2,844 $31,483 $110,432 350.77% 0.06% 0.00Bankers Life and Casualty Co. 101 101 1,578 $30,907 $6,743 21.82% 0.06% 0.00John Hancock Life Ins. Co. 27 27 324 $27,948 $0 0.00% 0.05% 0.00Harleysville Life Ins. Co. 4 111 1,332 $26,953 $0 0.00% 0.05% 0.00Crown Life Ins. Co. 23 23 276 $24,481 $72,161 294.76% 0.05% 0.00Monumental Life Ins. Co. 154 154 1,992 $22,507 $29,904 132.87% 0.04% 0.00Erie Family Life Ins. Co. 69 69 864 $21,088 $26,810 127.13% 0.04% 0.00AIG Life Ins. Co. 2 15 180 $17,961 ($523) -2.91% 0.03% 0.00Continental General Ins. Co. 18 18 217 $15,873 $3,017 19.01% 0.03% 0.00Bankers Fidelity Life Ins. Co. 14 14 161 $15,069 $12,634 83.84% 0.03% 0.00Country Life Ins. Co. 11 11 132 $14,544 $23,795 163.61% 0.03% 0.00Connecticut General Life Ins. Co. 12 12 144 $14,133 ($382,010) -2702.96% 0.03% 0.00Indianapolis Life Ins. Co. 16 16 192 $11,411 $4,465 39.13% 0.02% 0.00Penn Mutual Life Ins. Co. 14 14 0 $11,014 ($437,028) -3967.93% 0.02% 0.00Fidelity Security Life Ins. Co. 0 4 48 $10,330 $0 0.00% 0.02% 0.00Provident Life and Accident Ins. Co. 0 12 0 $9,123 $370,142 4057.24% 0.02% 0.00Kanawha Ins. Co. 4 48 576 $8,958 $33,545 374.47% 0.02% 0.00United Teacher Associates Ins. Co. 22 22 264 $7,108 $22,721 319.65% 0.01% 0.00Kansas City Life Ins. Co. 12 13 198 $6,896 $3,284 47.62% 0.01% 0.00
Total Long Term Dis. (Gr. & Ind.) Policies Lives Member Months Premium Earned Claims Incurred Loss Ratio Market Share HHI

Total Long Term Dis. (Gr. & Ind.) Policies Lives Member Months Premium Earned Claims Incurred Loss Ratio Market Share HHIMerit Life Ins. Co. 27 27 252 $6,744 ($4) -0.06% 0.01% 0.00Commercial Travelers Mut. Ins. Co. 1 27 426 $6,160 $0 0.00% 0.01% 0.00Washington National Ins. Co. 15 15 180 $6,021 $2,519 41.84% 0.01% 0.00Great-West Life Assurance Co. 0 0 0 $5,907 $8,276 140.10% 0.01% 0.00Commonwealth Ann. & Life Ins. Co. 8 8 96 $5,171 $8,112 156.87% 0.01% 0.00American Heritage Life Ins. Co. 4 14 168 $4,917 $0 0.00% 0.01% 0.00Jefferson National Life Ins. Co. 4 4 60 $4,898 $1,201 24.52% 0.01% 0.00American General Assurance Co. 0 14 168 $4,023 $0 0.00% 0.01% 0.00Physicians Mutual Ins. Co. 7 7 84 $3,819 $3,739 97.91% 0.01% 0.00American Gen. Life and Acc. Ins. Co. 157 157 1,920 $3,780 $15,333 405.63% 0.01% 0.00Central Reserve Life Ins. Co. 0 0 182 $3,442 $2,753 79.98% 0.01% 0.00Combined Ins. Co. of America 12 12 144 $3,138 $129 4.11% 0.01% 0.00Unified Life Ins. Co. 17 17 51 $3,080 $2,407 78.15% 0.01% 0.00Life Investors Ins. Co. of America 4 4 48 $2,430 $0 0.00% 0.00% 0.00Phoenix Life Ins. Co. 0 0 0 $1,832 $0 0.00% 0.00% 0.00Genworth Life & Annuity Ins. Co. 7 7 84 $1,804 $0 0.00% 0.00% 0.00MTL Ins. 1 1 12 $1,647 $0 0.00% 0.00% 0.00Primerica Life Ins. Co. 6 6 72 $1,589 $40,583 2554.00% 0.00% 0.00Humana Ins. Co. 1 2 24 $1,358 $0 0.00% 0.00% 0.00National Guardian Life Ins. Co. 3 3 42 $1,344 $1,307 97.25% 0.00% 0.00United American Ins. Co. 9 9 107 $1,274 ($1,973) -154.87% 0.00% 0.00Teachers Prot. Mutual Life Ins. Co. 7 7 92 $948 $7,139 753.06% 0.00% 0.00First Allmerica Financial Life Ins. Co. 3 3 36 $564 $0 0.00% 0.00% 0.00Conseco Ins. Co. 2 2 24 $406 $112 27.59% 0.00% 0.00American Pioneer Life Ins. Co. 1 1 12 $385 $5,290 1374.03% 0.00% 0.00Great-West Life & Annuity Ins. Co. 0 0 0 $368 $333 90.49% 0.00% 0.00State Automobile Mutual Ins. Co. 0 0 9 $248 $1,781 718.15% 0.00% 0.00American Income Life Ins. Co. 1 1 12 $189 $0 0.00% 0.00% 0.00Union Fidelity Life Ins. Co. 0 0 0 $163 $0 0.00% 0.00% 0.00Reliastar Life Ins. Co. of NY 0 0 0 $76 $279 367.11% 0.00% 0.00Lifesecure Ins. Co. 5 5 0 $49 $0 0.00% 0.00% 0.00Columbus Life Ins. Co. 9 9 0 $0 $0 ---- 0.00% 0.00Colonial Life & Accident Ins. Co. 0 1 0 $0 $2,237 ---- 0.00% 0.00American Intl Life Assur Co. of NY 0 0 0 $0 $4,225 ---- 0.00% 0.00Lincoln Life & Annuity Co. of NY 0 0 0 $0 $16,497 ---- 0.00% 0.00Lumbermens Mutual Casualty Co. 0 0 0 $0 $164,696 ---- 0.00% 0.00Teachers Ins. & Ann. Assoc. of Amer. 0 0 0 $0 $1,460,061 ---- 0.00% 0.00National Casualty Co. 4 7 36 ($274) $0 0.00% 0.00% 0.00Continental Casualty Co. 0 0 0 ($58,717) $128,244 -218.41% -0.11% 0.01TOTALS 14,267 230,627 2,187,520 $52,373,901 $52,266,548 99.80% 100.00% 804.81
Total Disability (Gr. & Ind.) Policies Lives Member Months Premium Earned Claims Incurred Loss Ratio Market Share HHIHartford Life and Accident Ins. Co. 87 55,798 669,576 $10,483,338 $8,590,723 81.95% 13.95% 194.66Unum Life Ins. Co. of America 760 25,913 0 $6,004,168 $8,278,552 137.88% 7.99% 63.85Northwestern Mutual Life Ins. Co. 4,822 7,798 88,032 $5,534,399 $3,171,572 57.31% 7.37% 54.25Metropolitan Life Ins. Co. 142 29,304 351,648 $5,251,514 $4,887,919 93.08% 6.99% 48.85Standard Ins. Co. 218 16,479 195,195 $4,792,218 $3,218,060 67.15% 6.38% 40.68American Family Life Assurance Co. 7,419 7,419 83,229 $3,457,936 $1,421,804 41.12% 4.60% 21.18Life Ins. Co. of North America 21 14,770 0 $3,175,539 $5,149,172 162.15% 4.23% 17.86Prudential Ins. Co. of America 158 4,711 56,532 $2,895,972 $2,577,795 89.01% 3.85% 14.85Guardian Life Ins. Co. 445 11,240 125,376 $2,595,301 $1,893,632 72.96% 3.45% 11.93Sun Life & Health Ins. Co. (US) 84 2,908 34,896 $2,405,534 $244,494 10.16% 3.20% 10.25Combined Ins. Co. of America 8,126 8,341 86,762 $2,124,741 $87,451 4.12% 2.83% 8.00Colonial Life & Accident Ins. Co. 3,707 4,161 0 $1,798,890 $707,726 39.34% 2.39% 5.73Provident Life and Accident Ins. Co. 2,006 2,403 0 $1,603,110 $1,922,959 119.95% 2.13% 4.55Fort Dearborn Life Ins. Co. 151 5,098 0 $1,426,737 $845,471 59.26% 1.90% 3.61Paul Revere Life Ins. Co. 659 890 0 $1,314,968 $1,880,063 142.97% 1.75% 3.06Lincoln National Life Ins. Co. 257 7,655 91,860 $1,282,193 $1,341,142 104.60% 1.71% 2.91Union Security Ins. Co. 92 36,658 439,185 $1,261,942 $861,938 68.30% 1.68% 2.82Massachusetts Mutual Life Ins. Co. 1,219 994 15,117 $1,186,367 $1,391,614 117.30% 1.58% 2.49Reliastar Life Ins. Co. 47 2,508 30,096 $1,100,431 $613,012 55.71% 1.46% 2.14Sun Life Assurance Co. of Canada (US) 62 9,713 34,836 $1,079,770 $1,110,697 102.86% 1.44% 2.07State Farm Mutual Automobile Ins. Co. 2,852 2,852 35,396 $1,028,809 $923,512 89.77% 1.37% 1.87American Fidelity Assurance Co. 44 4,788 46,373 $990,430 $581,597 58.72% 1.32% 1.74Mutual of Omaha Ins. Co. 424 3,539 42,447 $989,375 $1,439,916 145.54% 1.32% 1.73Principal Life Ins. Co. 82 3,117 35,960 $836,973 $330,563 39.50% 1.11% 1.24NY Life Ins. Co. 436 752 9,024 $693,177 $113,325 16.35% 0.92% 0.85Monumental Life Ins. Co. 2,752 2,795 33,688 $637,339 $447,345 70.19% 0.85% 0.72Berkshire Life Ins. Co. of America 271 271 3,252 $599,057 ($40,754) -6.80% 0.80% 0.64Professional Ins. Co. 937 937 11,244 $589,067 $480,728 81.61% 0.78% 0.61United of Omaha Life Ins. Co. 49 1,845 0 $514,059 $670,972 130.52% 0.68% 0.47Reliance Standard Life Ins. Co. 26 2,407 0 $497,159 $2,434,430 489.67% 0.66% 0.44U.S. Life Ins. Co. In the City of NY 29 558 6,693 $489,676 $420,438 85.86% 0.65% 0.42AXA Equitable Life Ins. Co. 275 275 3,432 $481,075 $936,452 194.66% 0.64% 0.41Assurity Life Ins. Co. 735 735 9,360 $414,942 $343,572 82.80% 0.55% 0.30Boston Mutual Life Ins. Co. 9 1,536 30,870 $414,294 $298,795 72.12% 0.55% 0.30Riversource Life Ins. Co. 338 338 4,056 $280,812 $177,581 63.24% 0.37% 0.14Ohio National Life Assurance Corp. 143 143 0 $277,649 $269,710 97.14% 0.37% 0.14Aetna Life Ins. Co. 23 1,609 17,955 $258,741 $2,441,242 943.51% 0.34% 0.12Eastern Life and Health Ins. Co. 20 1,244 17,424 $241,609 $265,762 110.00% 0.32% 0.10American United Life Ins. Co. 15 852 10,224 $225,998 $131,715 58.28% 0.30% 0.09Reassure America Life Ins. Co. 191 191 2,292 $214,709 $328,204 152.86% 0.29% 0.08Companion Life Ins. Co. 51 790 9,477 $213,410 $123,525 57.88% 0.28% 0.08American Bankers Life Assurance Co. 0 0 0 $209,227 ($17,984) -8.60% 0.28% 0.08Hartford Life Ins. Co. 0 3,587 43,044 $206,884 $164,585 79.55% 0.28% 0.08Ohio National Life Ins. Co. 141 141 0 $194,811 $49,369 25.34% 0.26% 0.07Liberty Life Assurance Co. of Boston 3 1,589 19,068 $187,577 $795,284 423.98% 0.25% 0.06CUNA Mutual Ins. Co. 71 775 9,322 $185,132 $51,299 27.71% 0.25% 0.06Mony Life Ins. Co. 157 158 1,992 $177,174 $94,726 53.46% 0.24% 0.06
Total Disability (Gr. & Ind.) Policies Lives Member Months Premium Earned Claims Incurred Loss Ratio Market Share HHI

Total Disability (Gr. & Ind.) Policies Lives Member Months Premium Earned Claims Incurred Loss Ratio Market Share HHIHorace Mann Life Ins. Co. 201 960 11,510 $146,101 $177,505 121.49% 0.19% 0.04American Heritage Life Ins. Co. 240 438 5,112 $143,201 $73,189 51.11% 0.19% 0.04Farm Family Life Ins. Co. 203 203 2,424 $124,244 $423,206 340.62% 0.17% 0.03American General Life Ins. Co. 288 288 3,456 $124,215 $117,087 94.26% 0.17% 0.03Minnesota Life Ins. Co. 62 166 1,854 $118,719 $220,659 185.87% 0.16% 0.02Centre Life Ins. Co. 50 50 642 $97,848 ($33,996) -34.74% 0.13% 0.02Illinois Mutual Life Ins. Co. 112 161 1,896 $97,784 $69,634 71.21% 0.13% 0.02American General Assurance Co. 23 3,581 168 $94,756 $663,313 700.02% 0.13% 0.02Union Central Life Ins. Co. 38 38 0 $91,759 $17,656 19.24% 0.12% 0.01Federated Life Ins. Co. 82 82 996 $88,031 $0 0.00% 0.12% 0.01Shenandoah Life Ins. Co. 23 562 6,678 $87,901 $134,664 153.20% 0.12% 0.01National Life Ins. Co. 168 94 0 $82,319 $558,910 678.96% 0.11% 0.01Liberty Life Ins. Co. 360 360 4,626 $73,698 $42,282 57.37% 0.10% 0.01Lafayette Life Ins. Co. 46 137 1,152 $64,829 $32,505 50.14% 0.09% 0.01Pan-American Life Ins. Co. 30 36 376 $59,889 $26,162 43.68% 0.08% 0.01Pennsylvania Life Ins. Co. 524 524 6,516 $50,667 $111,975 221.00% 0.07% 0.00Continental American Ins. Co. 95 95 1,140 $48,390 $21,151 43.71% 0.06% 0.00Kanawha Ins. Co. 125 169 2,010 $44,027 $61,960 140.73% 0.06% 0.00AIG Life Ins. Co. 7 91 1,092 $42,846 $8,623 20.13% 0.06% 0.00Bankers Fidelity Life Ins. Co. 58 58 708 $39,761 $12,634 31.77% 0.05% 0.00National Guardian Life Ins. Co. 88 88 1,116 $39,434 $38,341 97.23% 0.05% 0.00Protective Life Ins. Co. 44 44 528 $35,277 $11,911 33.76% 0.05% 0.00Continental General Ins. Co. 55 55 693 $34,560 $7,318 21.17% 0.05% 0.00MetLife Ins. Co. of Connecticut 45 45 540 $34,103 ($58,634) -171.93% 0.05% 0.00Mutual of America Life Ins. Co. 14 94 1,128 $34,092 $74,637 218.93% 0.05% 0.00Bankers Life and Casualty Co. 108 108 1,770 $32,272 $7,520 23.30% 0.04% 0.00Transamerica Life Ins. Co. 8 82 735 $30,598 $1,448 4.73% 0.04% 0.00Mega Life and Health Ins. Co. 90 90 1,043 $29,717 $17,700 59.56% 0.04% 0.00Harleysville Life Ins. Co. 5 128 1,536 $29,185 $396 1.36% 0.04% 0.00John Hancock Life Ins. Co. 27 27 324 $27,948 $0 0.00% 0.04% 0.00Crown Life Ins. Co. 23 23 276 $24,481 $72,161 294.76% 0.03% 0.00Erie Family Life Ins. Co. 69 69 864 $21,088 $26,810 127.13% 0.03% 0.00Fidelity Security Life Ins. Co. 2 15 168 $18,867 $0 0.00% 0.03% 0.00Symetra Life Ins. Co. 27 27 0 $18,059 $23,160 128.25% 0.02% 0.00American Gen. Life and Acc. Ins. Co. 177 177 2,154 $15,715 $15,408 98.05% 0.02% 0.00USAA Life Ins. Co. 14 14 180 $15,561 $0 0.00% 0.02% 0.00Country Life Ins. Co. 11 11 132 $14,544 $23,795 163.61% 0.02% 0.00Great-West Life & Annuity Ins. Co. 0 0 0 $13,819 $12,494 90.41% 0.02% 0.00United Ins. Co. of America 121 121 1,572 $12,821 $30,716 239.58% 0.02% 0.00Indianapolis Life Ins. Co. 16 16 192 $11,411 $4,465 39.13% 0.02% 0.00Penn Mutual Life Ins. Co. 14 14 0 $11,014 ($437,028) -3967.93% 0.01% 0.00Kansas City Life Ins. Co. 13 24 330 $10,345 $3,284 31.74% 0.01% 0.00Unicare Life & Health Ins. Co. 1 50 608 $9,789 $47,443 484.66% 0.01% 0.00John Alden Life Ins. Co. 9 29 359 $8,438 $11,011 130.49% 0.01% 0.00Life Investors Ins. Co. of America 17 17 252 $8,067 ($7,878) -97.66% 0.01% 0.00Connecticut General Life Ins. Co. 15 15 179 $7,693 ($387,668) -5039.23% 0.01% 0.00Commercial Travelers Mut. Ins. Co. 39 65 918 $7,118 $0 0.00% 0.01% 0.00United Teacher Associates Ins. Co. 22 22 264 $7,108 $22,721 319.65% 0.01% 0.00Merit Life Ins. Co. 27 27 252 $6,744 ($4) -0.06% 0.01% 0.00Washington National Ins. Co. 15 15 180 $6,021 $2,519 41.84% 0.01% 0.00Great-West Life Assurance Co. 0 0 0 $5,907 $8,276 140.10% 0.01% 0.00American Public Life Ins. Co. 0 0 0 $5,683 $1,119 19.69% 0.01% 0.00Commonwealth Ann. & Life Ins. Co. 8 8 96 $5,171 $8,112 156.87% 0.01% 0.00Jefferson National Life Ins. Co. 4 4 60 $4,898 $1,201 24.52% 0.01% 0.00Medical Benefits Mutual Life Ins. Co. 2 80 1,046 $4,706 $11,596 246.41% 0.01% 0.00Humana Ins. Co. 3 11 132 $4,221 $2,887 68.40% 0.01% 0.00Physicians Mutual Ins. Co. 7 7 84 $3,819 $3,739 97.91% 0.01% 0.00American States Ins. Co. 0 0 0 $3,609 $6,934 192.13% 0.00% 0.00Central Reserve Life Ins. Co. 0 0 182 $3,442 $2,753 79.98% 0.00% 0.00Unified Life Ins. Co. 17 17 51 $3,080 $2,407 78.15% 0.00% 0.00Federated Mutual Ins. Co. 6 49 366 $2,198 $278 12.65% 0.00% 0.00Colorado Bankers Life Ins. Co. 7 7 84 $2,059 $0 0.00% 0.00% 0.00American National Ins. Co. 2 2 24 $1,976 ($227) -11.49% 0.00% 0.00American Network Ins. Co. 1 1 12 $1,902 $0 0.00% 0.00% 0.00BCS Life Ins. Co. 0 0 0 $1,898 $3,756 197.89% 0.00% 0.00Phoenix Life Ins. Co. 0 0 0 $1,832 $0 0.00% 0.00% 0.00Genworth Life & Annuity Ins. Co. 7 7 84 $1,804 $0 0.00% 0.00% 0.00Conseco Senior Health Ins. Co. 3 3 42 $1,665 $0 0.00% 0.00% 0.00MTL Ins. 1 1 12 $1,647 $0 0.00% 0.00% 0.00Primerica Life Ins. Co. 6 6 72 $1,589 $40,583 2554.00% 0.00% 0.00Union Bankers Ins. Co. 23 23 276 $1,322 $7,525 569.21% 0.00% 0.00United American Ins. Co. 9 9 107 $1,274 ($1,973) -154.87% 0.00% 0.00Teachers Prot. Mutual Life Ins. Co. 9 9 116 $1,170 $7,139 610.17% 0.00% 0.00American Income Life Ins. Co. 4 4 54 $1,121 $0 0.00% 0.00% 0.00Union Labor Life Ins. Co. 0 2 24 $1,116 $585 52.42% 0.00% 0.00Central United Life Ins. Co. 7 7 12 $722 $8,660 1199.45% 0.00% 0.00Old Republic Life Ins. Co. 0 0 0 $565 ($4,735) -838.05% 0.00% 0.00First Allmerica Financial Life Ins. Co. 3 3 36 $564 $0 0.00% 0.00% 0.00Hartford Life & Annuity Ins. Co. 4 4 48 $481 $727 151.14% 0.00% 0.00EMC National Life Co. 1 1 12 $408 $0 0.00% 0.00% 0.00Great Southern Life Ins. Co. 2 2 24 $407 $0 0.00% 0.00% 0.00Conseco Ins. Co. 2 2 24 $406 $112 27.59% 0.00% 0.00American Sentinel Ins. Co. 2 2 24 $405 ($11) -2.72% 0.00% 0.00American Pioneer Life Ins. Co. 1 1 12 $385 $5,290 1374.03% 0.00% 0.00Heritage Casualty Ins. Co. 1 24 288 $378 $0 0.00% 0.00% 0.00Sentry Life Ins. Co. 0 0 35 $290 $0 0.00% 0.00% 0.00State Automobile Mutual Ins. Co. 0 0 9 $248 $1,781 718.15% 0.00% 0.00Union Fidelity Life Ins. Co. 0 0 0 $230 $0 0.00% 0.00% 0.00Transamerica Occidental Life Ins. Co. 1 1 12 $218 $0 0.00% 0.00% 0.00Transamerica Financial Life Ins. Co. 1 2 14 $215 $0 0.00% 0.00% 0.00
Total Disability (Gr. & Ind.) Policies Lives Member Months Premium Earned Claims Incurred Loss Ratio Market Share HHI

Total Disability (Gr. & Ind.) Policies Lives Member Months Premium Earned Claims Incurred Loss Ratio Market Share HHIAllianz Life Ins. Co. of North America 1 6 72 $160 $526 328.75% 0.00% 0.00First Investors Life Ins. Co. 1 1 12 $149 $0 0.00% 0.00% 0.00Baltimore Life Ins. Co. 0 0 1 $102 $17,837 17487.25% 0.00% 0.00Reliastar Life Ins. Co. of NY 0 0 0 $76 $279 367.11% 0.00% 0.00Medico Ins. Co. 2 2 24 $70 $1 1.43% 0.00% 0.00Lifesecure Ins. Co. 5 5 0 $49 $0 0.00% 0.00% 0.00Columbus Life Ins. Co. 9 9 0 $0 $0 ---- 0.00% 0.00American Intl Life Assur Co. of NY 0 0 0 $0 $4,225 ---- 0.00% 0.00Lincoln Life & Annuity Co. of NY 0 0 0 $0 $16,497 ---- 0.00% 0.00Lumbermens Mutual Casualty Co. 0 0 0 $0 $164,696 ---- 0.00% 0.00Teachers Ins. & Ann. Assoc. of Amer. 0 0 0 $0 $1,460,061 ---- 0.00% 0.00National Casualty Co. 4 7 36 ($274) $0 0.00% 0.00% 0.00Continental Casualty Co. 0 0 0 ($58,717) $128,244 -218.41% -0.08% 0.01TOTALS 44,573 302,519 2,779,201 $75,137,753 $68,665,750 91.39% 100.00% 529.00
Total (Tax Qual.) LTC (Gr. & Ind.) Policies Lives Member Months Premium Earned Claims Incurred Loss Ratio Market Share HHIGenworth Life Ins. Co. 4,453 5,512 0 $7,658,088 $4,321,071 56.42% 31.70% 1,004.78Bankers Life and Casualty Co. 1,772 2,213 29,628 $3,038,826 $1,772,647 58.33% 12.58% 158.21Metropolitan Life Ins. Co. 591 2,679 32,148 $2,460,208 $436,428 17.74% 10.18% 103.70Northwestern Long Term Care Ins. Co. 1,066 1,066 11,873 $1,621,385 $416,292 25.68% 6.71% 45.04John Hancock Life Ins. Co. 682 1,301 15,099 $1,536,839 $892,433 58.07% 6.36% 40.47Unum Life Ins. Co. of America 365 6,124 0 $1,179,492 $255,376 21.65% 4.88% 23.84Teachers Ins. & Ann. Assoc. of Amer. 302 302 3,624 $613,224 $513,085 83.67% 2.54% 6.44United Teacher Associates Ins. Co. 520 520 6,156 $575,608 $147,239 25.58% 2.38% 5.68Aetna Life Ins. Co. 39 693 9,719 $563,684 $603,131 107.00% 2.33% 5.44Prudential Ins. Co. of America 249 249 2,892 $526,046 $187,370 35.62% 2.18% 4.74NY Life Ins. Co. 370 392 4,663 $501,634 $268,625 53.55% 2.08% 4.31TIAA-CREF Life Ins. Co. 176 176 2,112 $379,349 $0 0.00% 1.57% 2.47Massachusetts Mutual Life Ins. Co. 108 175 1,262 $360,355 ($154,366) -42.84% 1.49% 2.22Mutual of Omaha Ins. Co. 198 361 4,198 $352,014 $223,169 63.40% 1.46% 2.12Principal Life Ins. Co. 232 232 2,750 $341,135 $228,435 66.96% 1.41% 1.99American Network Ins. Co. 137 137 1,644 $270,042 $43,018 15.93% 1.12% 1.25Continental Casualty Co. 572 635 11,335 $204,833 $956,005 466.72% 0.85% 0.72Provident Life and Accident Ins. Co. 105 118 0 $175,083 $0 0.00% 0.72% 0.53American Family Life Assurance Co. 151 187 2,059 $150,627 $102,599 68.11% 0.62% 0.39Monumental Life Ins. Co. 196 196 2,400 $134,484 $0 0.00% 0.56% 0.31Lincoln Benefit Life Co. 39 39 708 $124,624 $0 0.00% 0.52% 0.27Life Investors Ins. Co. of America 81 81 778 $121,142 $0 0.00% 0.50% 0.25Union Security Ins. Co. 86 86 1,032 $113,992 $0 0.00% 0.47% 0.22Transamerica Occidental Life Ins. Co. 62 62 543 $113,796 $92,738 81.49% 0.47% 0.22John Alden Life Ins. Co. 69 69 828 $109,757 $32 0.03% 0.45% 0.21State Farm Mutual Automobile Ins. Co. 551 551 6,547 $101,935 $212,954 208.91% 0.42% 0.18Great American Life Ins. Co. 84 84 918 $101,600 $0 0.00% 0.42% 0.18Time Ins. Co. 92 92 1,110 $99,786 $208,390 208.84% 0.41% 0.17Medamerica Ins. Co. 28 35 388 $97,978 $0 0.00% 0.41% 0.16Combined Ins. Co. of America 77 86 999 $83,425 $97,212 116.53% 0.35% 0.12Washington National Ins. Co. 33 35 444 $53,296 $78,381 147.07% 0.22% 0.05Berkshire Life Ins. Co. of America 15 15 180 $49,583 $0 0.00% 0.21% 0.04Conseco Senior Health Ins. Co. 24 30 391 $45,386 $54,588 120.27% 0.19% 0.04American Fidelity Assurance Co. 32 32 363 $44,626 $70,862 158.79% 0.18% 0.03United American Ins. Co. 25 32 305 $39,178 $25,077 64.01% 0.16% 0.03Lincoln National Life Ins. Co. 17 17 219 $34,013 $0 0.00% 0.14% 0.02Transamerica Life Ins. Co. 26 33 228 $30,952 $14,625 47.25% 0.13% 0.02Cincinnati Life Ins. Co. 6 6 72 $16,247 $1,718 10.57% 0.07% 0.00Country Life Ins. Co. 6 6 72 $14,978 $0 0.00% 0.06% 0.00United of Omaha Life Ins. Co. 13 13 111 $14,547 $0 0.00% 0.06% 0.00Kanawha Ins. Co. 10 10 126 $14,389 $0 0.00% 0.06% 0.00Genworth Life & Annuity Ins. Co. 33 33 396 $13,148 $26,419 200.94% 0.05% 0.00Continental General Ins. Co. 7 13 120 $11,877 $3,397 28.60% 0.05% 0.00State Life Ins. Co. 9 9 108 $8,938 $5,000 55.94% 0.04% 0.00Connecticut General Life Ins. Co. 3 19 288 $8,021 $1,681 20.96% 0.03% 0.00Reassure America Life Ins. Co. 6 6 90 $7,889 $11,424 144.81% 0.03% 0.00Medico Ins. Co. 3 3 36 $5,701 ($19,708) -345.69% 0.02% 0.00Equitable Life & Casualty Ins. Co. 3 4 45 $5,690 $0 0.00% 0.02% 0.00American Heritage Life Ins. Co. 0 0 0 $5,558 $90,586 1629.83% 0.02% 0.00Allianz Life Ins. Co. of North America 4 4 48 $4,849 $360 7.42% 0.02% 0.00Medico Life Ins. Co. 3 3 36 $4,801 $67 1.40% 0.02% 0.00Genesis Ins. Co. 1 1 12 $3,947 $0 0.00% 0.02% 0.00Loyal American Life Ins. Co. 3 3 25 $2,842 $0 0.00% 0.01% 0.00American Pioneer Life Ins. Co. 2 2 24 $2,098 $0 0.00% 0.01% 0.00Cont'l Life Ins. Co. of Brentwood, TN 1 1 12 $1,288 $0 0.00% 0.01% 0.00Standard Life & Accident Ins. Co. 2 2 24 $1,263 $0 0.00% 0.01% 0.00Pennsylvania Life Ins. Co. 3 3 36 $1,181 $0 0.00% 0.00% 0.00Sentry Ins. A Mutual Co. 1 2 24 $932 $0 0.00% 0.00% 0.00Guarantee Trust Life Ins. Co. 1 1 12 $634 $0 0.00% 0.00% 0.00Unified Life Ins. Co. 3 3 9 $466 $0 0.00% 0.00% 0.00TOTALS 13,748 24,794 161,269 $24,159,309 $12,188,360 50.45% 100.00% 1,416.88

Total (Non-Tax Qual.) LTC (Gr. & Ind.) Policies Lives Member Months Premium Earned Claims Incurred Loss Ratio Market Share HHIRiversource Life Ins. Co. 1,024 1,024 12,288 $1,229,084 $444,345 36.15% 25.96% 674.02Conseco Senior Health Ins. Co. 403 453 5,873 $678,864 $923,719 136.07% 14.34% 205.62American Network Ins. Co. 270 270 3,240 $516,187 $496,648 96.21% 10.90% 118.88Bankers Life and Casualty Co. 394 498 6,672 $463,761 $192,378 41.48% 9.80% 95.96Mutual of Omaha Ins. Co. 281 281 3,402 $399,065 $414,027 103.75% 8.43% 71.06MetLife Ins. Co. of Connecticut 160 160 1,920 $312,044 $266,751 85.49% 6.59% 43.45Allianz Life Ins. Co. of North America 185 212 2,520 $223,959 $78,566 35.08% 4.73% 22.38American Family Life Assurance Co. 160 160 1,761 $180,898 $123,218 68.11% 3.82% 14.60John Hancock Life Ins. Co. 90 682 1,080 $152,536 $123,517 80.98% 3.22% 10.38Continental General Ins. Co. 47 93 862 $137,788 $74,200 53.85% 2.91% 8.47United American Ins. Co. 66 67 762 $81,091 $215,496 265.75% 1.71% 2.93Kanawha Ins. Co. 38 38 438 $53,665 $0 0.00% 1.13% 1.28Physicians Mutual Ins. Co. 35 35 386 $49,848 $22,590 45.32% 1.05% 1.11Life Investors Ins. Co. of America 24 24 261 $40,791 $0 0.00% 0.86% 0.74State Life Ins. Co. 19 19 228 $40,379 $0 0.00% 0.85% 0.73AIG Life Ins. Co. 20 25 300 $39,467 $0 0.00% 0.83% 0.69Standard Life & Accident Ins. Co. 21 27 324 $25,271 $47,045 186.16% 0.53% 0.28NY Life Ins. Co. 18 18 223 $23,094 $33,618 145.57% 0.49% 0.24Lincoln Benefit Life Co. 9 15 180 $18,878 $0 0.00% 0.40% 0.16Reassure America Life Ins. Co. 17 36 444 $17,107 $34,986 204.51% 0.36% 0.13American Fidelity Assurance Co. 1 50 432 $11,802 $4,234 35.88% 0.25% 0.06Transamerica Life Ins. Co. 10 10 120 $9,849 $33,232 337.41% 0.21% 0.04Conseco Health Ins. Co. 3 3 36 $6,108 $1,660 27.18% 0.13% 0.02Union Bankers Ins. Co. 10 10 120 $5,728 $0 0.00% 0.12% 0.01United Nat. Life Ins. Co. of Amer 5 5 60 $4,452 $0 0.00% 0.09% 0.01Transamerica Occidental Life Ins. Co. 2 2 24 $3,785 $23,020 608.19% 0.08% 0.01Old American Ins. Co. 5 5 66 $3,167 $8,225 259.71% 0.07% 0.00Equitable Life & Casualty Ins. Co. 1 1 12 $1,337 $0 0.00% 0.03% 0.00Union Security Ins. Co. 1 1 12 $1,325 $0 0.00% 0.03% 0.00Allstate Life Ins. Co. 0 0 0 $1,089 $0 0.00% 0.02% 0.00Principal Life Ins. Co. 13 13 156 $1,077 $0 0.00% 0.02% 0.00Monumental Life Ins. Co. 1 1 12 $768 $0 0.00% 0.02% 0.00Primerica Life Ins. Co. 0 0 0 ($75) $0 0.00% 0.00% 0.00TOTALS 3,333 4,238 44,214 $4,734,189 $3,561,475 75.23% 100.00% 1,273.29
Total Long Term Care (Gr. & Ind.) Policies Lives Member Months Premium Earned Claims Incurred Loss Ratio Market Share HHIGenworth Life Ins. Co. 4,453 5,512 0 $7,658,088 $4,321,071 56.42% 26.50% 702.49Bankers Life and Casualty Co. 2,166 2,711 36,300 $3,502,587 $1,965,025 56.10% 12.12% 146.95Metropolitan Life Ins. Co. 591 2,679 32,148 $2,460,208 $436,428 17.74% 8.51% 72.50John Hancock Life Ins. Co. 772 1,983 16,179 $1,689,375 $1,015,950 60.14% 5.85% 34.19Northwestern Long Term Care Ins. Co. 1,066 1,066 11,873 $1,621,385 $416,292 25.68% 5.61% 31.49Riversource Life Ins. Co. 1,024 1,024 12,288 $1,229,084 $444,345 36.15% 4.25% 18.10Unum Life Ins. Co. of America 365 6,124 0 $1,179,492 $255,376 21.65% 4.08% 16.66American Network Ins. Co. 407 407 4,884 $786,229 $539,666 68.64% 2.72% 7.40Mutual of Omaha Ins. Co. 479 642 7,600 $751,079 $637,196 84.84% 2.60% 6.76Conseco Senior Health Ins. Co. 427 483 6,264 $724,250 $978,307 135.08% 2.51% 6.28Teachers Ins. & Ann. Assoc. of Amer. 302 302 3,624 $613,224 $513,085 83.67% 2.12% 4.50United Teacher Associates Ins. Co. 520 520 6,156 $575,608 $147,239 25.58% 1.99% 3.97Aetna Life Ins. Co. 39 693 9,719 $563,684 $603,131 107.00% 1.95% 3.81Prudential Ins. Co. of America 249 249 2,892 $526,046 $187,370 35.62% 1.82% 3.31NY Life Ins. Co. 388 410 4,886 $524,728 $302,243 57.60% 1.82% 3.30TIAA-CREF Life Ins. Co. 176 176 2,112 $379,349 $0 0.00% 1.31% 1.72Massachusetts Mutual Life Ins. Co. 108 175 1,262 $360,355 ($154,366) -42.84% 1.25% 1.56Principal Life Ins. Co. 245 245 2,906 $342,212 $228,435 66.75% 1.18% 1.40American Family Life Assurance Co. 311 347 3,820 $331,525 $225,817 68.11% 1.15% 1.32MetLife Ins. Co. of Connecticut 160 160 1,920 $312,044 $266,751 85.49% 1.08% 1.17Allianz Life Ins. Co. of North America 189 216 2,568 $228,808 $78,926 34.49% 0.79% 0.63Continental Casualty Co. 572 635 11,335 $204,833 $956,005 466.72% 0.71% 0.50Provident Life and Accident Ins. Co. 105 118 0 $175,083 $0 0.00% 0.61% 0.37Life Investors Ins. Co. of America 105 105 1,039 $161,933 $0 0.00% 0.56% 0.31Continental General Ins. Co. 54 106 982 $149,665 $77,597 51.85% 0.52% 0.27Lincoln Benefit Life Co. 48 54 888 $143,502 $0 0.00% 0.50% 0.25Monumental Life Ins. Co. 197 197 2,412 $135,252 $0 0.00% 0.47% 0.22United American Ins. Co. 91 99 1,067 $120,269 $240,573 200.03% 0.42% 0.17Transamerica Occidental Life Ins. Co. 64 64 567 $117,581 $115,758 98.45% 0.41% 0.17Union Security Ins. Co. 87 87 1,044 $115,317 $0 0.00% 0.40% 0.16John Alden Life Ins. Co. 69 69 828 $109,757 $32 0.03% 0.38% 0.14State Farm Mutual Automobile Ins. Co. 551 551 6,547 $101,935 $212,954 208.91% 0.35% 0.12Great American Life Ins. Co. 84 84 918 $101,600 $0 0.00% 0.35% 0.12Time Ins. Co. 92 92 1,110 $99,786 $208,390 208.84% 0.35% 0.12Medamerica Ins. Co. 28 35 388 $97,978 $0 0.00% 0.34% 0.11Combined Ins. Co. of America 77 86 999 $83,425 $97,212 116.53% 0.29% 0.08Kanawha Ins. Co. 48 48 564 $68,054 $0 0.00% 0.24% 0.06American Fidelity Assurance Co. 33 82 795 $56,428 $75,096 133.08% 0.20% 0.04Washington National Ins. Co. 33 35 444 $53,296 $78,381 147.07% 0.18% 0.03Physicians Mutual Ins. Co. 35 35 386 $49,848 $22,590 45.32% 0.17% 0.03Berkshire Life Ins. Co. of America 15 15 180 $49,583 $0 0.00% 0.17% 0.03State Life Ins. Co. 28 28 336 $49,317 $5,000 10.14% 0.17% 0.03Transamerica Life Ins. Co. 36 43 348 $40,801 $47,857 117.29% 0.14% 0.02AIG Life Ins. Co. 20 25 300 $39,467 $0 0.00% 0.14% 0.02Lincoln National Life Ins. Co. 17 17 219 $34,013 $0 0.00% 0.12% 0.01Standard Life & Accident Ins. Co. 23 29 348 $26,534 $47,045 177.30% 0.09% 0.01Reassure America Life Ins. Co. 23 42 534 $24,996 $46,410 185.67% 0.09% 0.01Cincinnati Life Ins. Co. 6 6 72 $16,247 $1,718 10.57% 0.06% 0.00Country Life Ins. Co. 6 6 72 $14,978 $0 0.00% 0.05% 0.00United of Omaha Life Ins. Co. 13 13 111 $14,547 $0 0.00% 0.05% 0.00Genworth Life & Annuity Ins. Co. 33 33 396 $13,148 $26,419 200.94% 0.05% 0.00Connecticut General Life Ins. Co. 3 19 288 $8,021 $1,681 20.96% 0.03% 0.00Equitable Life & Casualty Ins. Co. 4 5 57 $7,027 $0 0.00% 0.02% 0.00
Total Long Term Care (Gr. & Ind.) Policies Lives Member Months Premium Earned Claims Incurred Loss Ratio Market Share HHI

Total Long Term Care (Gr. & Ind.) Policies Lives Member Months Premium Earned Claims Incurred Loss Ratio Market Share HHIConseco Health Ins. Co. 3 3 36 $6,108 $1,660 27.18% 0.02% 0.00Union Bankers Ins. Co. 10 10 120 $5,728 $0 0.00% 0.02% 0.00Medico Ins. Co. 3 3 36 $5,701 ($19,708) -345.69% 0.02% 0.00American Heritage Life Ins. Co. 0 0 0 $5,558 $90,586 1629.83% 0.02% 0.00Medico Life Ins. Co. 3 3 36 $4,801 $67 1.40% 0.02% 0.00United Nat. Life Ins. Co. of Amer 5 5 60 $4,452 $0 0.00% 0.02% 0.00Genesis Ins. Co. 1 1 12 $3,947 $0 0.00% 0.01% 0.00Old American Ins. Co. 5 5 66 $3,167 $8,225 259.71% 0.01% 0.00Loyal American Life Ins. Co. 3 3 25 $2,842 $0 0.00% 0.01% 0.00American Pioneer Life Ins. Co. 2 2 24 $2,098 $0 0.00% 0.01% 0.00Cont'l Life Ins. Co. of Brentwood, TN 1 1 12 $1,288 $0 0.00% 0.00% 0.00Pennsylvania Life Ins. Co. 3 3 36 $1,181 $0 0.00% 0.00% 0.00Allstate Life Ins. Co. 0 0 0 $1,089 $0 0.00% 0.00% 0.00Sentry Ins. A Mutual Co. 1 2 24 $932 $0 0.00% 0.00% 0.00Guarantee Trust Life Ins. Co. 1 1 12 $634 $0 0.00% 0.00% 0.00Unified Life Ins. Co. 3 3 9 $466 $0 0.00% 0.00% 0.00Primerica Life Ins. Co. 0 0 0 ($75) $0 0.00% 0.00% 0.00TOTALS 17,081 29,032 205,483 $28,893,498 $15,749,835 54.51% 100.00% 1,072.93
Total Med. Supp. (Std) Gr. & Ind. Policies Lives Member Months Premium Earned Claims Incurred Loss Ratio Market Share HHIUnited Healthcare Ins. Co. 1 32,420 389,040 $41,482,548 $33,050,602 79.67% 37.04% 1,371.78Highmark West Virginia, Inc. 11,466 11,466 141,476 $30,749,256 $22,006,788 71.57% 27.45% 753.74Bankers Life and Casualty Co. 2,124 2,134 28,705 $6,355,380 $3,906,014 61.46% 5.67% 32.20Mutual of Omaha Ins. Co. 2,147 2,147 25,750 $5,922,119 $3,598,826 60.77% 5.29% 27.96United World Life Ins. Co. 3,427 3,427 33,570 $4,485,658 $3,224,915 71.89% 4.01% 16.04United American Ins. Co. 1,291 1,291 16,710 $3,918,712 $2,482,664 63.35% 3.50% 12.24State Farm Mutual Automobile Ins. Co. 1,587 1,587 19,465 $3,430,894 $2,007,573 58.51% 3.06% 9.38Bankers Fidelity Life Ins. Co. 1,200 1,200 15,523 $3,098,978 $1,874,387 60.48% 2.77% 7.66Continental General Ins. Co. 628 628 8,177 $1,397,670 $923,693 66.09% 1.25% 1.56Constitution Life Ins. Co. 645 645 7,740 $1,347,082 $872,759 64.79% 1.20% 1.45United Teacher Associates Ins. Co. 435 435 5,201 $973,646 $662,717 68.07% 0.87% 0.76Life Investors Ins. Co. of America 536 536 6,432 $912,133 $756,557 82.94% 0.81% 0.66Combined Ins. Co. of America 282 337 3,654 $822,436 $523,270 63.62% 0.73% 0.54Standard Life & Accident Ins. Co. 354 354 4,248 $774,435 $585,672 75.63% 0.69% 0.48Physicians Mutual Ins. Co. 234 241 2,545 $722,021 $454,036 62.88% 0.64% 0.42Ord of Utd Comm'l Trav. of Amer.-Frtl 1,028 1,028 7,302 $703,560 $481,319 68.41% 0.63% 0.39Hartford Life Ins. Co. 0 650 7,800 $657,938 $411,281 62.51% 0.59% 0.35Principal Life Ins. Co. 163 165 2,085 $411,655 $299,409 72.73% 0.37% 0.14Provident Amer. Life & H. Ins. Co. 216 216 2,322 $356,760 $242,930 68.09% 0.32% 0.10Golden Rule Ins. Co. 193 193 2,390 $319,378 $234,725 73.49% 0.29% 0.08Washington National Ins. Co. 76 76 1,014 $281,352 $117,691 41.83% 0.25% 0.06Humana Ins. Co. 268 268 2,071 $273,361 $198,653 72.67% 0.24% 0.06American Family Life Assurance Co. 70 70 830 $223,265 $121,546 54.44% 0.20% 0.04USAA Life Ins. Co. 147 147 1,638 $222,420 $167,464 75.29% 0.20% 0.04Sterling Life Ins. Co. 139 139 1,666 $208,493 $154,995 74.34% 0.19% 0.03American Gen. Life and Acc. Ins. Co. 60 60 810 $201,941 $96,201 47.64% 0.18% 0.03Cont'l Life Ins. Co. of Brentwood, TN 119 119 1,344 $198,402 $124,766 62.89% 0.18% 0.03Genworth Life & Annuity Ins. Co. 65 65 780 $196,731 $111,629 56.74% 0.18% 0.03Allianz Life Ins. Co. of North America 20 28 336 $155,752 $4,688 3.01% 0.14% 0.02Lincoln Heritage Life Ins. Co. 48 48 559 $109,325 $73,538 67.27% 0.10% 0.01Shenandoah Life Ins. Co. 89 89 642 $95,983 $35,901 37.40% 0.09% 0.01Union Bankers Ins. Co. 22 22 264 $79,850 $22,308 27.94% 0.07% 0.01Central Reserve Life Ins. Co. 38 38 502 $76,541 $41,733 54.52% 0.07% 0.00NY Life Ins. Co. 28 28 336 $73,241 $50,769 69.32% 0.07% 0.00Pacificare Life & Health Ins. Co. 25 25 408 $72,653 $59,423 81.79% 0.06% 0.00Central Sts H & Life Co. of Omaha 26 26 347 $68,627 $31,913 46.50% 0.06% 0.00Monumental Life Ins. Co. 31 31 378 $68,361 $53,204 77.83% 0.06% 0.00Conseco Ins. Co. 37 37 534 $60,113 $16,653 27.70% 0.05% 0.00Globe Life and Accident Ins. Co. 39 39 442 $54,022 $24,841 45.98% 0.05% 0.00American Republic Ins. Co. 18 18 0 $52,451 $25,231 48.10% 0.05% 0.00Colonial Penn Life Ins. Co. 28 28 360 $39,423 $23,180 58.80% 0.04% 0.00American Pioneer Life Ins. Co. 20 20 240 $38,633 $30,596 79.20% 0.03% 0.00Transamerica Life Ins. Co. 29 29 348 $36,882 $25,130 68.14% 0.03% 0.00United Nat. Life Ins. Co. of Amer 6 6 92 $33,486 $15,493 46.27% 0.03% 0.00Oxford Life Ins. Co. 13 13 24 $29,477 $8,734 29.63% 0.03% 0.00Central Benefits National Life Ins. Co. 11 11 132 $23,563 $11,867 50.36% 0.02% 0.00Unicare Life & Health Ins. Co. 1 1 9 $22,635 ($2,119) -9.36% 0.02% 0.00Medico Life Ins. Co. 6 6 72 $20,992 $22,013 104.86% 0.02% 0.00American Nat. Life Ins. Co. of TX 36 36 306 $20,540 $21,192 103.17% 0.02% 0.00Guarantee Trust Life Ins. Co. 18 18 111 $17,552 $25,000 142.43% 0.02% 0.00Medico Ins. Co. 6 6 72 $16,724 $11,936 71.37% 0.01% 0.00American Income Life Ins. Co. 5 5 66 $15,996 $4,214 26.34% 0.01% 0.00Genworth Life Ins. Co. 8 8 0 $12,327 $3,768 30.57% 0.01% 0.00Marquette National Life Ins. Co. 16 16 192 $8,629 $896 10.38% 0.01% 0.00Equitable Life & Casualty Ins. Co. 3 3 40 $8,088 $7,769 96.06% 0.01% 0.00Conseco Senior Health Ins. Co. 4 4 48 $7,005 $6,552 93.53% 0.01% 0.00Physicians Life Ins. Co. 5 5 60 $6,551 $7,467 113.98% 0.01% 0.00HCC Life Ins. Co. 1 1 12 $4,769 ($717) -15.03% 0.00% 0.00Christian Fidelity Life Ins. Co. 2 2 12 $4,327 $502 11.60% 0.00% 0.00CUNA Mutual Ins. Co. 0 2 24 $3,987 $1,789 44.87% 0.00% 0.00American Prog. Life & H Ins. Co. 13 13 156 $3,695 $29,775 805.82% 0.00% 0.00Jefferson National Life Ins. Co. 1 1 6 $3,417 $837 24.50% 0.00% 0.00National Guardian Life Ins. Co. 2 2 24 $1,852 $3,155 170.36% 0.00% 0.00Time Ins. Co. 0 0 0 $1,586 $0 0.00% 0.00% 0.00Union Labor Life Ins. Co. 1 1 12 $1,506 $150 9.96% 0.00% 0.00Companion Life Ins. Co. 1 1 12 $1,154 $225 19.50% 0.00% 0.00Aetna Life Ins. Co. 1 1 12 $620 $0 0.00% 0.00% 0.00National Benefit Life Ins. Co. 1 1 12 $592 $10 1.69% 0.00% 0.00World Corp Ins. Co. 0 0 0 $24 $0 0.00% 0.00% 0.00World Ins. Co. 3 3 36 $0 $0 ---- 0.00% 0.00American Community Mutual Ins. 0 0 0 $0 ($1,391) ---- 0.00% 0.00Country Life Ins. Co. 0 0 0 $0 $69 ---- 0.00% 0.00TOTALS 29,563 62,716 747,526 $112,001,175 $80,391,376 71.78% 100.00% 2,238.33

Total Med. Supp. (Pre-Std) Gr. & Ind. Policies Lives Member Months Premium Earned Claims Incurred Loss Ratio Market Share HHIUnited Healthcare Ins. Co. 1 13,554 162,648 $17,357,946 $13,829,684 79.67% 63.10% 3,982.01American Network Ins. Co. 885 885 10,620 $2,473,205 $1,652,772 66.83% 8.99% 80.84Hartford Life and Accident Ins. Co. 4 541 6,492 $1,508,975 $708,280 46.94% 5.49% 30.09Bankers Life and Casualty Co. 527 534 7,434 $1,350,847 $768,488 56.89% 4.91% 24.12United American Ins. Co. 384 384 4,986 $1,132,045 $707,998 62.54% 4.12% 16.94State Farm Mutual Automobile Ins. Co. 239 247 3,107 $649,206 $438,892 67.60% 2.36% 5.57American Family Life Assurance Co. 181 181 2,146 $540,839 $335,867 62.10% 1.97% 3.87Unicare Life & Health Ins. Co. 76 76 775 $357,825 $853,285 238.46% 1.30% 1.69Combined Ins. Co. of America 75 89 961 $259,796 $131,008 50.43% 0.94% 0.89Mutual of Omaha Ins. Co. 76 76 912 $237,031 $114,786 48.43% 0.86% 0.74Continental General Ins. Co. 64 64 854 $196,759 $139,830 71.07% 0.72% 0.51Union Fidelity Life Ins. Co. 91 91 1,092 $194,126 $139,224 71.72% 0.71% 0.50American Gen. Life and Acc. Ins. Co. 45 45 594 $178,845 $62,914 35.18% 0.65% 0.42Monumental Life Ins. Co. 83 83 996 $153,038 $119,588 78.14% 0.56% 0.31Life Investors Ins. Co. of America 28 28 336 $130,019 $95,839 73.71% 0.47% 0.22Golden Rule Ins. Co. 27 27 319 $129,727 $76,740 59.15% 0.47% 0.22Physicians Mutual Ins. Co. 28 33 376 $99,227 $45,541 45.90% 0.36% 0.13United Teacher Associates Ins. Co. 26 26 312 $74,753 $31,811 42.55% 0.27% 0.07Union Bankers Ins. Co. 24 24 288 $59,244 $64,754 109.30% 0.22% 0.05Celtic Ins. Co. 18 18 234 $54,974 $30,534 55.54% 0.20% 0.04Conseco Health Ins. Co. 14 14 264 $50,452 $24,512 48.58% 0.18% 0.03Conseco Senior Health Ins. Co. 24 24 294 $42,033 $39,312 93.53% 0.15% 0.02Colonial Penn Life Ins. Co. 17 17 222 $37,306 $42,014 112.62% 0.14% 0.02NY Life Ins. Co. 15 15 180 $37,068 $21,272 57.39% 0.13% 0.02Washington National Ins. Co. 12 12 162 $33,808 $14,142 41.83% 0.12% 0.02New England Life Ins. Co. 28 31 380 $25,703 $92,093 358.30% 0.09% 0.01American Republic Ins. Co. 9 9 0 $21,428 $5,634 26.29% 0.08% 0.01Loyal American Life Ins. Co. 9 9 98 $13,723 $13,646 99.44% 0.05% 0.00Cont'l Life Ins. Co. of Brentwood, TN 4 4 48 $13,596 $0 0.00% 0.05% 0.00Standard Life & Accident Ins. Co. 7 7 72 $13,414 $296 2.21% 0.05% 0.00AIG Premier Ins. Co. 6 8 102 $13,295 $10,486 78.87% 0.05% 0.00World Ins. Co. 5 5 71 $11,383 $3,520 30.92% 0.04% 0.00Unified Life Ins. Co. 36 45 135 $11,071 $30,837 278.54% 0.04% 0.00Jackson National Life Ins. Co. 4 4 48 $8,780 $1,342 15.28% 0.03% 0.00Ord of Utd Comm'l Trav. of Amer.-Frtl 6 6 78 $8,432 $3,907 46.34% 0.03% 0.00American Pioneer Life Ins. Co. 4 4 48 $7,874 $5,826 73.99% 0.03% 0.00Globe Life and Accident Ins. Co. 2 2 35 $5,183 $13,573 261.88% 0.02% 0.00Medico Ins. Co. 3 3 36 $4,348 ($39) -0.90% 0.02% 0.00Gerber Life Ins. Co. 3 3 36 $4,185 $104 2.49% 0.02% 0.00National States Ins. Co. 2 2 24 $2,032 $2,741 134.89% 0.01% 0.00Equitable Life & Casualty Ins. Co. 0 0 7 $1,656 $4,734 285.87% 0.01% 0.00Prudential Ins. Co. of America 1 1 12 $1,351 $1,708 126.42% 0.00% 0.00Old American Ins. Co. 1 1 12 $340 ($12) -3.53% 0.00% 0.00American Capitol Ins. Co. 0 0 1 $196 $0 0.00% 0.00% 0.00Health Net Life Ins. Co. 1 0 0 $105 $622 592.38% 0.00% 0.00World Corp Ins. Co. 0 0 0 $70 $1,646 2351.43% 0.00% 0.00American National Ins. Co. 0 0 0 $0 ($4,076) ---- 0.00% 0.00TOTALS 3,095 17,232 207,847 $27,507,259 $20,677,675 75.17% 100.00% 4,149.37
Total Medicare Supplement (Gr. & Ind.) Policies Lives Member Months Premium Earned Claims Incurred Loss Ratio Market Share HHIUnited Healthcare Ins. Co. 2 45,974 551,688 $58,840,494 $46,880,286 79.67% 42.18% 1,778.90Highmark West Virginia, Inc. 11,466 11,466 141,476 $30,749,256 $22,006,788 71.57% 22.04% 485.81Bankers Life and Casualty Co. 2,651 2,668 36,139 $7,706,227 $4,674,502 60.66% 5.52% 30.51Mutual of Omaha Ins. Co. 2,223 2,223 26,662 $6,159,150 $3,713,612 60.29% 4.41% 19.49United American Ins. Co. 1,675 1,675 21,696 $5,050,757 $3,190,662 63.17% 3.62% 13.11United World Life Ins. Co. 3,427 3,427 33,570 $4,485,658 $3,224,915 71.89% 3.22% 10.34State Farm Mutual Automobile Ins. Co. 1,826 1,834 22,572 $4,080,100 $2,446,465 59.96% 2.92% 8.55Bankers Fidelity Life Ins. Co. 1,200 1,200 15,523 $3,098,978 $1,874,387 60.48% 2.22% 4.93American Network Ins. Co. 885 885 10,620 $2,473,205 $1,652,772 66.83% 1.77% 3.14Continental General Ins. Co. 692 692 9,031 $1,594,429 $1,063,523 66.70% 1.14% 1.31Hartford Life and Accident Ins. Co. 4 541 6,492 $1,508,975 $708,280 46.94% 1.08% 1.17Constitution Life Ins. Co. 645 645 7,740 $1,347,082 $872,759 64.79% 0.97% 0.93Combined Ins. Co. of America 357 426 4,615 $1,082,232 $654,278 60.46% 0.78% 0.60United Teacher Associates Ins. Co. 461 461 5,513 $1,048,399 $694,528 66.25% 0.75% 0.56Life Investors Ins. Co. of America 564 564 6,768 $1,042,152 $852,396 81.79% 0.75% 0.56Physicians Mutual Ins. Co. 262 274 2,921 $821,248 $499,577 60.83% 0.59% 0.35Standard Life & Accident Ins. Co. 361 361 4,320 $787,849 $585,968 74.38% 0.56% 0.32American Family Life Assurance Co. 251 251 2,976 $764,104 $457,413 59.86% 0.55% 0.30Ord of Utd Comm'l Trav. of Amer.-Frtl 1,034 1,034 7,380 $711,992 $485,226 68.15% 0.51% 0.26Hartford Life Ins. Co. 0 650 7,800 $657,938 $411,281 62.51% 0.47% 0.22Golden Rule Ins. Co. 220 220 2,709 $449,105 $311,465 69.35% 0.32% 0.10Principal Life Ins. Co. 163 165 2,085 $411,655 $299,409 72.73% 0.30% 0.09American Gen. Life and Acc. Ins. Co. 105 105 1,404 $380,786 $159,115 41.79% 0.27% 0.07Unicare Life & Health Ins. Co. 77 77 784 $380,460 $851,166 223.72% 0.27% 0.07Provident Amer. Life & H. Ins. Co. 216 216 2,322 $356,760 $242,930 68.09% 0.26% 0.07Washington National Ins. Co. 88 88 1,176 $315,160 $131,833 41.83% 0.23% 0.05Humana Ins. Co. 268 268 2,071 $273,361 $198,653 72.67% 0.20% 0.04USAA Life Ins. Co. 147 147 1,638 $222,420 $167,464 75.29% 0.16% 0.03Monumental Life Ins. Co. 114 114 1,374 $221,399 $172,792 78.05% 0.16% 0.03Cont'l Life Ins. Co. of Brentwood, TN 123 123 1,392 $211,998 $124,766 58.85% 0.15% 0.02Sterling Life Ins. Co. 139 139 1,666 $208,493 $154,995 74.34% 0.15% 0.02Genworth Life & Annuity Ins. Co. 65 65 780 $196,731 $111,629 56.74% 0.14% 0.02Union Fidelity Life Ins. Co. 91 91 1,092 $194,126 $139,224 71.72% 0.14% 0.02Allianz Life Ins. Co. of North America 20 28 336 $155,752 $4,688 3.01% 0.11% 0.01Union Bankers Ins. Co. 46 46 552 $139,094 $87,062 62.59% 0.10% 0.01NY Life Ins. Co. 43 43 516 $110,309 $72,041 65.31% 0.08% 0.01Lincoln Heritage Life Ins. Co. 48 48 559 $109,325 $73,538 67.27% 0.08% 0.01Shenandoah Life Ins. Co. 89 89 642 $95,983 $35,901 37.40% 0.07% 0.00Colonial Penn Life Ins. Co. 45 45 582 $76,729 $65,194 84.97% 0.05% 0.00Central Reserve Life Ins. Co. 38 38 502 $76,541 $41,733 54.52% 0.05% 0.00American Republic Ins. Co. 27 27 0 $73,879 $30,865 41.78% 0.05% 0.00
Total Medicare Supplement (Gr. & Ind.) Policies Lives Member Months Premium Earned Claims Incurred Loss Ratio Market Share HHI

Total Medicare Supplement (Gr. & Ind.) Policies Lives Member Months Premium Earned Claims Incurred Loss Ratio Market Share HHIPacificare Life & Health Ins. Co. 25 25 408 $72,653 $59,423 81.79% 0.05% 0.00Central Sts H & Life Co. of Omaha 26 26 347 $68,627 $31,913 46.50% 0.05% 0.00Conseco Ins. Co. 37 37 534 $60,113 $16,653 27.70% 0.04% 0.00Globe Life and Accident Ins. Co. 41 41 477 $59,205 $38,414 64.88% 0.04% 0.00Celtic Ins. Co. 18 18 234 $54,974 $30,534 55.54% 0.04% 0.00Conseco Health Ins. Co. 14 14 264 $50,452 $24,512 48.58% 0.04% 0.00Conseco Senior Health Ins. Co. 28 28 342 $49,038 $45,864 93.53% 0.04% 0.00American Pioneer Life Ins. Co. 24 24 288 $46,507 $36,422 78.32% 0.03% 0.00Transamerica Life Ins. Co. 29 29 348 $36,882 $25,130 68.14% 0.03% 0.00United Nat. Life Ins. Co. of Amer 6 6 92 $33,486 $15,493 46.27% 0.02% 0.00Oxford Life Ins. Co. 13 13 24 $29,477 $8,734 29.63% 0.02% 0.00New England Life Ins. Co. 28 31 380 $25,703 $92,093 358.30% 0.02% 0.00Central Benefits National Life Ins. Co. 11 11 132 $23,563 $11,867 50.36% 0.02% 0.00Medico Ins. Co. 9 9 108 $21,072 $11,897 56.46% 0.02% 0.00Medico Life Ins. Co. 6 6 72 $20,992 $22,013 104.86% 0.02% 0.00American Nat. Life Ins. Co. of TX 36 36 306 $20,540 $21,192 103.17% 0.01% 0.00Guarantee Trust Life Ins. Co. 18 18 111 $17,552 $25,000 142.43% 0.01% 0.00American Income Life Ins. Co. 5 5 66 $15,996 $4,214 26.34% 0.01% 0.00Loyal American Life Ins. Co. 9 9 98 $13,723 $13,646 99.44% 0.01% 0.00AIG Premier Ins. Co. 6 8 102 $13,295 $10,486 78.87% 0.01% 0.00Genworth Life Ins. Co. 8 8 0 $12,327 $3,768 30.57% 0.01% 0.00World Ins. Co. 8 8 107 $11,383 $3,520 30.92% 0.01% 0.00Unified Life Ins. Co. 36 45 135 $11,071 $30,837 278.54% 0.01% 0.00Equitable Life & Casualty Ins. Co. 3 3 47 $9,744 $12,503 128.31% 0.01% 0.00Jackson National Life Ins. Co. 4 4 48 $8,780 $1,342 15.28% 0.01% 0.00Marquette National Life Ins. Co. 16 16 192 $8,629 $896 10.38% 0.01% 0.00Physicians Life Ins. Co. 5 5 60 $6,551 $7,467 113.98% 0.00% 0.00HCC Life Ins. Co. 1 1 12 $4,769 ($717) -15.03% 0.00% 0.00Christian Fidelity Life Ins. Co. 2 2 12 $4,327 $502 11.60% 0.00% 0.00Gerber Life Ins. Co. 3 3 36 $4,185 $104 2.49% 0.00% 0.00CUNA Mutual Ins. Co. 0 2 24 $3,987 $1,789 44.87% 0.00% 0.00American Prog. Life & H Ins. Co. 13 13 156 $3,695 $29,775 805.82% 0.00% 0.00Jefferson National Life Ins. Co. 1 1 6 $3,417 $837 24.50% 0.00% 0.00National States Ins. Co. 2 2 24 $2,032 $2,741 134.89% 0.00% 0.00National Guardian Life Ins. Co. 2 2 24 $1,852 $3,155 170.36% 0.00% 0.00Time Ins. Co. 0 0 0 $1,586 $0 0.00% 0.00% 0.00Union Labor Life Ins. Co. 1 1 12 $1,506 $150 9.96% 0.00% 0.00Prudential Ins. Co. of America 1 1 12 $1,351 $1,708 126.42% 0.00% 0.00Companion Life Ins. Co. 1 1 12 $1,154 $225 19.50% 0.00% 0.00Aetna Life Ins. Co. 1 1 12 $620 $0 0.00% 0.00% 0.00National Benefit Life Ins. Co. 1 1 12 $592 $10 1.69% 0.00% 0.00Old American Ins. Co. 1 1 12 $340 ($12) -3.53% 0.00% 0.00American Capitol Ins. Co. 0 0 1 $196 $0 0.00% 0.00% 0.00Health Net Life Ins. Co. 1 0 0 $105 $622 592.38% 0.00% 0.00World Corp Ins. Co. 0 0 0 $94 $1,646 1751.06% 0.00% 0.00American Community Mutual Ins. 0 0 0 $0 ($1,391) ---- 0.00% 0.00American National Ins. Co. 0 0 0 $0 ($4,076) ---- 0.00% 0.00Country Life Ins. Co. 0 0 0 $0 $69 ---- 0.00% 0.00TOTALS 32,658 79,948 955,373 $139,508,434 $101,069,051 72.45% 100.00% 2,362.07
Total Dental (Gr. & Ind.) Policies Lives Member Months Premium Earned Claims Incurred Loss Ratio Market Share HHIDelta Dental of West Virginia 76 42,197 473,638 $9,468,939 $6,541,230 69.08% 22.98% 528.25Metropolitan Life Ins. Co. 235 37,023 444,276 $6,710,325 $5,237,706 78.05% 16.29% 265.29Guardian Life Ins. Co. 348 25,488 300,605 $6,524,527 $4,663,106 71.47% 15.84% 250.80United Concordia Ins. Co. 103 16,513 214,573 $4,629,297 $3,101,867 67.01% 11.24% 126.26Ameritas Life Ins. Corporation 47 46,784 561,408 $2,111,844 $1,304,579 61.77% 5.13% 26.28Connecticut General Life Ins. Co. 47 5,961 71,532 $1,400,295 $1,229,649 87.81% 3.40% 11.55American Family Life Assurance Co. 2,503 4,505 51,292 $1,245,793 $233,956 18.78% 3.02% 9.14Aetna Life Ins. Co. 359 5,188 59,833 $1,160,417 $957,536 82.52% 2.82% 7.93Dental Choice, Inc. 2,587 5,170 56,702 $1,046,828 $868,306 82.95% 2.54% 6.46United Healthcare Ins. Co. 179 7,763 93,156 $959,113 $532,735 55.54% 2.33% 5.42Sun Life & Health Ins. Co. (US) 76 1,075 12,900 $773,001 $539,733 69.82% 1.88% 3.52Principal Life Ins. Co. 74 2,772 33,954 $707,864 $439,848 62.14% 1.72% 2.95HumanaDental Ins. Co. 38 3,939 40,752 $650,381 $449,289 69.08% 1.58% 2.49Delta Dental Ins. Co. 747 92,244 1,054,295 $523,570 $287,245 54.86% 1.27% 1.62Union Security Ins. Co. 46 604 5,569 $402,184 $478,385 118.95% 0.98% 0.95Companion Life Ins. Co. 44 794 8,746 $388,731 $229,774 59.11% 0.94% 0.89Shenandoah Life Ins. Co. 21 584 5,880 $271,844 $152,226 56.00% 0.66% 0.44Reliance Standard Life Ins. Co. 8 361 0 $221,714 $143,820 64.87% 0.54% 0.29Brokers National Life Assurance Co. 752 752 9,024 $212,000 $117,000 55.19% 0.51% 0.26Fort Dearborn Life Ins. Co. 79 400 0 $204,828 $112,774 55.06% 0.50% 0.25U.S. Life Ins. Co. In the City of NY 24 412 4,944 $193,671 $122,067 63.03% 0.47% 0.22Securian Life Ins. Co. 6 829 9,822 $154,532 $100,279 64.89% 0.38% 0.14Mega Life and Health Ins. Co. 341 594 6,959 $114,314 $36,183 31.65% 0.28% 0.08First Health Life & Health Ins. Co. 1 228 2,736 $110,346 $78,495 71.14% 0.27% 0.07Lincoln National Life Ins. Co. 1 52 624 $106,881 $208,339 194.93% 0.26% 0.07John Alden Life Ins. Co. 44 311 3,637 $91,558 $37,468 40.92% 0.22% 0.05Compbenefits Ins. Co. 509 911 5,464 $91,527 $53,485 58.44% 0.22% 0.05Citizens Security Ins. Co. 11 408 1,389 $84,919 $48,918 57.61% 0.21% 0.04Standard Ins. Co. 5 141 1,740 $79,952 $57,534 71.96% 0.19% 0.04Eastern Life and Health Ins. Co. 11 152 2,184 $77,324 $27,450 35.50% 0.19% 0.04Security Life Ins. Co. of America 0 120 12 $65,867 $35,036 53.19% 0.16% 0.03AIG Life Ins. Co. 2 103 1,236 $52,193 $15,531 29.76% 0.13% 0.02Time Ins. Co. 55 154 1,046 $47,309 $12,361 26.13% 0.11% 0.01Madison National Life Ins. Co., Inc. 8 31 372 $42,374 $15,854 37.41% 0.10% 0.01Continental General Ins. Co. 56 100 1,357 $40,077 $22,058 55.04% 0.10% 0.01World Ins. Co. 51 51 612 $33,525 $18,107 54.01% 0.08% 0.01Unicare Life & Health Ins. Co. 16 65 1,151 $32,711 $10,059 30.75% 0.08% 0.01BCS Ins. Co. 0 17 0 $31,975 $4,914 15.37% 0.08% 0.01CUNA Mutual Ins. Co. 0 50 628 $20,219 $12,824 63.43% 0.05% 0.00Federated Mutual Ins. Co. 9 94 917 $17,360 $10,396 59.88% 0.04% 0.00Humana Ins. Co. 0 0 1,021 $17,196 $8,453 49.16% 0.04% 0.00
Total Dental (Gr. & Ind.) Policies Lives Member Months Premium Earned Claims Incurred Loss Ratio Market Share HHI

Total Dental (Gr. & Ind.) Policies Lives Member Months Premium Earned Claims Incurred Loss Ratio Market Share HHINational Guardian Life Ins. Co. 2 30 180 $15,506 $7,445 48.01% 0.04% 0.00Physicians Mutual Ins. Co. 46 53 502 $13,515 $6,130 45.36% 0.03% 0.00Colorado Bankers Life Ins. Co. 4 27 324 $9,465 $723 7.64% 0.02% 0.00American Heritage Life Ins. Co. 9 185 2,220 $9,088 $11,445 125.94% 0.02% 0.00Medical Benefits Mutual Life Ins. Co. 1 12 194 $4,942 $3,398 68.76% 0.01% 0.00Central Reserve Life Ins. Co. 3 3 84 $3,485 $1,038 29.78% 0.01% 0.00Renaissance Life & H Ins. Co. of Amer. 6 8 96 $2,857 $1,135 39.73% 0.01% 0.00Mid-West Nat. Life Ins. Co. of TN 15 35 183 $2,808 $269 9.58% 0.01% 0.00Standard Security Life Ins. Co. of NY 16 27 0 $2,506 $564 22.51% 0.01% 0.00Freedom Life Ins. Co. of America 4 6 54 $2,433 $0 0.00% 0.01% 0.00American Public Life Ins. Co. 1 1 12 $2,350 $1,250 53.19% 0.01% 0.00Pan-American Life Ins. Co. 5 11 76 $2,279 $683 29.97% 0.01% 0.00Mutual of Omaha Ins. Co. 11 12 144 $2,108 $645 30.60% 0.01% 0.00Fidelity Security Life Ins. Co. 0 2 126 $1,983 $1,310 66.06% 0.00% 0.00Kansas City Life Ins. Co. 1 6 54 $1,525 $1,155 75.74% 0.00% 0.00American Pioneer Life Ins. Co. 2 2 24 $844 $160 18.96% 0.00% 0.00American Underwriters Life Ins. Co. 1 1 12 $576 $90 15.63% 0.00% 0.00Constitution Life Ins. Co. 2 2 24 $480 $190 39.58% 0.00% 0.00Kanawha Ins. Co. 1 2 24 $311 $472 151.77% 0.00% 0.00Gerber Life Ins. Co. 0 0 0 $125 $0 0.00% 0.00% 0.00United of Omaha Life Ins. Co. 0 0 0 $0 ($23) ---- 0.00% 0.00TOTALS 9,649 305,365 3,550,319 $41,198,511 $28,594,654 69.41% 100.00% 1,251.94
Total Group & Individual Business Policies Lives Member Months Premium Earned Claims Incurred Loss Ratio Market Share HHIHighmark West Virginia, Inc. 87,643 161,313 1,936,895 $618,147,897 $532,319,260 86.12% 29.24% 855.13Health Plan of the Upper OH Val 47,791 61,926 755,255 $188,846,552 $176,881,114 93.66% 8.93% 79.81Connecticut General Life Ins. Co. 1,292 98,841 1,186,146 $156,250,126 $146,974,059 94.06% 7.39% 54.64United Healthcare Ins. Co. 36,542 136,435 1,637,220 $152,252,404 $225,792,154 148.30% 7.20% 51.88Unicare Health Plan of WV, Inc. 75,786 75,786 905,161 $141,231,132 $131,737,566 93.28% 6.68% 44.64Humana Ins. Co. 42,338 42,346 511,130 $101,499,933 $83,785,178 82.55% 4.80% 23.06Carelink Health Plans, Inc. 10,333 19,838 252,319 $82,066,668 $66,636,154 81.20% 3.88% 15.07Coventry Health & Life Ins. Co. 12,616 22,711 244,069 $79,809,985 $60,781,760 76.16% 3.78% 14.25HM Health Ins. Co. 6,052 6,052 67,346 $52,754,019 $40,420,360 76.62% 2.50% 6.23First Health Life & Health Ins. Co. 7,658 8,759 96,994 $33,465,579 $28,208,969 84.29% 1.58% 2.51Aetna Life Ins. Co. 6,500 95,120 1,143,773 $31,348,389 $239,007,787 762.42% 1.48% 2.20American Family Life Assurance Co. 70,044 136,329 1,568,615 $22,593,752 $10,324,585 45.70% 1.07% 1.14Hartford Life and Accident Ins. Co. 189 85,431 1,013,172 $18,591,783 $13,115,801 70.55% 0.88% 0.77Metropolitan Life Ins. Co. 1,804 121,249 1,454,988 $16,875,351 $12,311,538 72.96% 0.80% 0.64Principal Life Ins. Co. 703 11,520 140,166 $15,868,878 $11,129,768 70.14% 0.75% 0.56Highmark Senior Resources, Inc. 12,595 12,595 152,859 $15,157,770 $15,282,945 100.83% 0.72% 0.51American Prog. Life & H Ins. Co. 2,618 2,618 31,416 $14,170,301 $10,603,929 74.83% 0.67% 0.45Guardian Life Ins. Co. 1,250 67,824 715,202 $13,215,099 $9,562,027 72.36% 0.63% 0.39Bankers Life and Casualty Co. 7,067 7,733 100,877 $12,421,559 $7,715,104 62.11% 0.59% 0.35Combined Ins. Co. of America 82,313 60,107 634,906 $11,591,952 $3,426,850 29.56% 0.55% 0.30Conseco Health Ins. Co. 27,428 42,119 509,502 $10,898,155 $9,175,282 84.19% 0.52% 0.27United American Ins. Co. 4,876 5,671 61,932 $10,732,992 $7,103,248 66.18% 0.51% 0.26Mutual of Omaha Ins. Co. 7,135 33,266 271,510 $9,982,737 $7,232,544 72.45% 0.47% 0.22Wellcare Prescription Ins. 1 8,094 97,040 $9,709,477 $7,984,106 82.23% 0.46% 0.21State Farm Mutual Automobile Ins. Co. 11,048 13,214 160,519 $9,671,296 $6,902,974 71.38% 0.46% 0.21Delta Dental of West Virginia 76 42,197 473,638 $9,468,939 $6,541,230 69.08% 0.45% 0.20Golden Rule Ins. Co. 231 3,225 38,732 $8,697,224 $5,528,613 63.57% 0.41% 0.17Great-West Life & Annuity Ins. Co. 185 13,267 169,568 $7,856,781 $7,103,727 90.42% 0.37% 0.14Consumers Life Ins. Co. 1,535 2,780 28,902 $7,759,065 $8,822,762 113.71% 0.37% 0.13Genworth Life Ins. Co. 4,461 5,520 0 $7,670,415 $4,324,839 56.38% 0.36% 0.13Unum Life Ins. Co. of America 1,263 46,437 0 $7,425,961 $9,305,870 125.32% 0.35% 0.12Union Security Ins. Co. 479 39,316 465,316 $7,383,379 $4,476,087 60.62% 0.35% 0.12Pennsylvania Life Ins. Co. 4,884 4,884 59,214 $7,275,386 $5,006,590 68.82% 0.34% 0.12Medical Benefits Mutual Life Ins. Co. 130 4,506 40,542 $7,150,729 $8,600,026 120.27% 0.34% 0.11THP Ins. Co. 4,636 10,316 126,886 $7,115,209 $6,659,106 93.59% 0.34% 0.11Wellcare Health Ins. of Illinois 1 738 7,057 $6,737,073 $3,793,461 56.31% 0.32% 0.10Unicare Life & Health Ins. Co. 4,344 5,943 76,112 $6,610,819 $7,430,020 112.39% 0.31% 0.10Mega Life and Health Ins. Co. 3,123 5,444 75,314 $5,957,972 $2,246,530 37.71% 0.28% 0.08Central Reserve Life Ins. Co. 111 1,745 24,044 $5,712,075 $4,025,022 70.47% 0.27% 0.07Northwestern Mutual Life Ins. Co. 4,822 7,798 88,032 $5,534,399 $3,171,572 57.31% 0.26% 0.07Standard Ins. Co. 286 19,695 280,077 $4,961,986 $3,303,218 66.57% 0.23% 0.06Silverscript Ins. Co. 3,931 3,931 47,907 $4,793,871 $3,409,629 71.12% 0.23% 0.05United Concordia Ins. Co. 103 16,513 214,573 $4,629,297 $3,101,867 67.01% 0.22% 0.05Life Ins. Co. of North America 42 51,212 0 $4,493,102 $6,901,632 153.61% 0.21% 0.05United World Life Ins. Co. 6,427 3,427 33,570 $4,485,658 $3,224,915 71.89% 0.21% 0.05Life Investors Ins. Co. of America 1,024 4,194 54,731 $4,453,535 $2,541,399 57.06% 0.21% 0.04Sun Life & Health Ins. Co. (US) 160 3,983 47,796 $4,342,290 $784,227 18.06% 0.21% 0.04QCC Ins. Co. 4,561 4,561 57,923 $4,274,470 $2,804,778 65.62% 0.20% 0.04CUNA Mutual Ins. Co. 226 133,005 1,570,876 $4,178,604 $1,718,456 41.13% 0.20% 0.04John Alden Life Ins. Co. 382 2,009 24,628 $4,124,945 $1,801,430 43.67% 0.20% 0.04Monumental Life Ins. Co. 17,344 17,982 217,534 $3,970,685 $2,321,741 58.47% 0.19% 0.04Colonial Life & Accident Ins. Co. 11,369 11,783 0 $3,900,084 $1,398,580 35.86% 0.18% 0.03Prudential Ins. Co. of America 463 5,019 60,132 $3,873,134 $3,658,871 94.47% 0.18% 0.03Continental General Ins. Co. 941 1,696 23,395 $3,610,197 $2,152,133 59.61% 0.17% 0.03Provident Life and Accident Ins. Co. 7,609 8,552 0 $3,498,378 $2,449,026 70.00% 0.17% 0.03United Teacher Associates Ins. Co. 5,251 8,009 92,786 $3,464,878 $1,530,882 44.18% 0.16% 0.03American Network Ins. Co. 1,293 1,293 15,516 $3,261,336 $2,192,438 67.23% 0.15% 0.02Bankers Fidelity Life Ins. Co. 1,521 1,521 19,589 $3,223,263 $1,933,978 60.00% 0.15% 0.02Vision Service Plan Ins. Co. 88 48,049 537,659 $3,119,141 $2,341,889 75.08% 0.15% 0.02Pacificare Life & Health Ins. Co. 334 335 4,721 $3,105,519 $1,628,325 52.43% 0.15% 0.02HCC Life Ins. Co. 17 7,963 95,556 $2,785,520 $2,173,948 78.04% 0.13% 0.02ACE American Ins. Co. 37 3,608 39,489 $2,580,584 $2,686,977 104.12% 0.12% 0.01Amer. Medical Security Life Ins. Co. 454 755 10,348 $2,237,082 $1,669,548 74.63% 0.11% 0.01Ameritas Life Ins. Corporation 65 58,029 696,348 $2,222,622 $1,355,161 60.97% 0.11% 0.01Medco Containment Life Ins. Co. 1,532 1,532 23,337 $2,169,736 $1,649,030 76.00% 0.10% 0.01NY Life Ins. Co. 956 2,377 28,490 $2,127,635 $1,273,368 59.85% 0.10% 0.01American Fidelity Assurance Co. 1,792 10,000 101,204 $2,122,108 $1,667,823 78.59% 0.10% 0.01Standard Security Life Ins. Co. of NY 143 2,085 2,598 $2,076,426 $1,293,430 62.29% 0.10% 0.01
Total Group & Individual Business Policies Lives Member Months Premium Earned Claims Incurred Loss Ratio Market Share HHI

Total Group & Individual Business Policies Lives Member Months Premium Earned Claims Incurred Loss Ratio Market Share HHIAmerican Health & Life Ins. Co. 7,729 7,844 0 $1,946,379 $1,238,689 63.64% 0.09% 0.01Companion Life Ins. Co. 102 2,490 28,192 $1,920,590 $1,411,321 73.48% 0.09% 0.01Fort Dearborn Life Ins. Co. 230 5,498 0 $1,631,565 $958,245 58.73% 0.08% 0.01Northwestern Long Term Care Ins. Co. 1,066 1,066 11,873 $1,621,385 $416,292 25.68% 0.08% 0.01American Gen. Life and Acc. Ins. Co. 11,339 11,339 140,016 $1,610,989 $451,981 28.06% 0.08% 0.01Physicians Mutual Ins. Co. 2,547 2,952 28,974 $1,566,773 $859,335 54.85% 0.07% 0.01Reliastar Life Ins. Co. 161 27,395 328,740 $1,550,601 $774,565 49.95% 0.07% 0.01Massachusetts Mutual Life Ins. Co. 1,327 1,169 16,379 $1,546,722 $1,237,248 79.99% 0.07% 0.01Lincoln National Life Ins. Co. 342 17,032 204,399 $1,522,125 $1,546,814 101.62% 0.07% 0.01Riversource Life Ins. Co. 1,362 1,362 16,344 $1,509,896 $621,926 41.19% 0.07% 0.01Hartford Life Ins. Co. 0 15,027 180,324 $1,457,433 $946,311 64.93% 0.07% 0.00Sierra Health and Life Ins. Co., Inc. 46 0 0 $1,407,313 $2,307,656 163.98% 0.07% 0.00American Heritage Life Ins. Co. 2,805 5,842 70,140 $1,402,219 $673,976 48.06% 0.07% 0.00Constitution Life Ins. Co. 647 647 7,764 $1,347,562 $872,949 64.78% 0.06% 0.00Sun Life Assurance Co. of Canada (US) 65 10,232 50,040 $1,342,296 $1,123,085 83.67% 0.06% 0.00Paul Revere Life Ins. Co. 672 1,071 0 $1,319,337 $1,880,763 142.55% 0.06% 0.00World Ins. Co. 369 653 8,751 $1,315,881 $387,803 29.47% 0.06% 0.00Stonebridge Life Ins. Co. 14,552 25,980 311,760 $1,256,130 $420,130 33.45% 0.06% 0.00American Income Life Ins. Co. 10,526 182,865 2,136,066 $1,241,623 $636,784 51.29% 0.06% 0.00Sterling Life Ins. Co. 556 556 6,732 $1,187,481 $946,752 79.73% 0.06% 0.00Gerber Life Ins. Co. 625 1,311 15,732 $1,165,651 $938,147 80.48% 0.06% 0.00United States Fire Ins. 674 5,703 45,371 $1,093,064 $714,444 65.36% 0.05% 0.00Federated Mutual Ins. Co. 41 404 4,075 $1,085,636 $507,893 46.78% 0.05% 0.00Continental Casualty Co. 572 635 11,335 $1,062,693 $1,300,251 122.35% 0.05% 0.00Time Ins. Co. 379 654 7,602 $1,059,638 $1,116,250 105.34% 0.05% 0.00U.S. Life Ins. Co. In the City of NY 115 1,622 20,255 $1,048,318 $756,533 72.17% 0.05% 0.00Dental Choice, Inc. 2,587 5,170 56,702 $1,046,828 $868,306 82.95% 0.05% 0.00Boston Mutual Life Ins. Co. 38 7,163 87,726 $1,023,294 $445,968 43.58% 0.05% 0.00Natl Un Fire Ins. Co. of Pitt, PA 174 56,432 676,899 $944,834 $592,279 62.69% 0.04% 0.00Standard Life & Accident Ins. Co. 816 876 9,869 $906,979 $686,742 75.72% 0.04% 0.00American United Life Ins. Co. 80 4,787 57,444 $884,120 $276,603 31.29% 0.04% 0.00Conseco Senior Health Ins. Co. 706 763 9,744 $846,079 $1,174,329 138.80% 0.04% 0.00American Security Ins. Co. 0 0 0 $840,372 $3,948 0.47% 0.04% 0.00Symetra Life Ins. Co. 40 1,037 11,664 $830,759 $101,995 12.28% 0.04% 0.00Medical Savings Ins. Co. 0 0 4,464 $816,335 $1,770,279 216.86% 0.04% 0.00HM Life Ins. Co. 13 3,256 38,928 $799,823 $1,185,526 148.22% 0.04% 0.00United of Omaha Life Ins. Co. 162 6,332 615 $799,573 $745,374 93.22% 0.04% 0.00Reliance Standard Life Ins. Co. 70 4,212 0 $759,185 $2,658,992 350.24% 0.04% 0.00Perico Life Ins. Co. 35 735 8,820 $756,121 $526,540 69.64% 0.04% 0.00Ord of Utd Comm'l Trav. of Amer.-Frtl 1,582 1,626 14,742 $733,803 $496,302 67.63% 0.03% 0.00Avalon Ins. Co. 1,461 1,461 14,788 $697,515 $983,496 141.00% 0.03% 0.00Protective Life Ins. Co. 1,377 1,377 16,524 $687,057 $540,604 78.68% 0.03% 0.00HumanaDental Ins. Co. 38 3,939 40,752 $650,381 $449,289 69.08% 0.03% 0.00Berkshire Life Ins. Co. of America 286 286 3,432 $648,640 ($40,754) -6.28% 0.03% 0.00AIG Life Ins. Co. 88 511 6,132 $630,142 $561,952 89.18% 0.03% 0.00Fidelity Security Life Ins. Co. 8 1,655 21,858 $616,616 $187,742 30.45% 0.03% 0.00Teachers Ins. & Ann. Assoc. of Amer. 302 302 3,624 $613,224 $1,973,146 321.77% 0.03% 0.00Loyal American Life Ins. Co. 3,094 6,789 83,810 $603,395 $492,546 81.63% 0.03% 0.00Household Life Ins. Co. 4 1,716 21,744 $597,362 $259,375 43.42% 0.03% 0.00Professional Ins. Co. 954 954 11,448 $595,744 $480,728 80.69% 0.03% 0.00Transamerica Life Ins. Co. 163 1,323 20,343 $588,242 $383,120 65.13% 0.03% 0.00Guarantee Trust Life Ins. Co. 152 832 7,010 $565,819 $166,303 29.39% 0.03% 0.00Washington National Ins. Co. 360 3,708 47,310 $527,792 $319,305 60.50% 0.02% 0.00Delta Dental Ins. Co. 747 92,244 1,054,295 $523,570 $287,245 54.86% 0.02% 0.00Assurity Life Ins. Co. 855 857 10,800 $521,025 $3,901,977 748.90% 0.02% 0.00Minnesota Life Ins. Co. 89 4,657 56,682 $517,420 $448,558 86.69% 0.02% 0.00Celtic Ins. Co. 153 214 2,232 $516,341 $134,889 26.12% 0.02% 0.00American Bankers Life Assurance Co. 0 0 0 $515,716 $5,919 1.15% 0.02% 0.00Canada Life Assurance Co. (The) 6 5,530 57,357 $514,001 $401,434 78.10% 0.02% 0.00Merit Life Ins. Co. 7,270 8,610 100,470 $495,214 $137,437 27.75% 0.02% 0.00American Modern Life Ins. Co. 55 2,305 0 $487,247 $288,801 59.27% 0.02% 0.00Continental Assurance Co. 0 0 0 $484,720 $2,696 0.56% 0.02% 0.00AXA Equitable Life Ins. Co. 275 275 3,432 $481,075 $936,452 194.66% 0.02% 0.00Shenandoah Life Ins. Co. 199 3,178 35,628 $480,858 $329,304 68.48% 0.02% 0.00Sears Life Ins. Co. 4,774 9,518 107,970 $458,262 $218,557 47.69% 0.02% 0.00Geisinger Indemnity Ins. Co. 440 440 3,864 $445,325 $402,991 90.49% 0.02% 0.00Reassure America Life Ins. Co. 1,071 1,090 13,110 $412,298 $813,723 197.36% 0.02% 0.00Madison National Life Ins. Co., Inc. 17 1,199 1,248 $405,093 $184,919 45.65% 0.02% 0.00Allianz Life Ins. Co. of North America 213 272 3,229 $387,115 $91,993 23.76% 0.02% 0.00Nationwide Life Ins. 8 672 6,959 $386,567 $6,460 1.67% 0.02% 0.00John Hancock Life Ins. Co. 0 619 6,915 $380,954 ($43,549) -11.43% 0.02% 0.00TIAA-CREF Life Ins. Co. 176 176 2,112 $379,349 $0 0.00% 0.02% 0.00Elder Health Ins. Co. 652 652 5,657 $363,220 $296,886 81.74% 0.02% 0.00Health Net Life Ins. Co. 2 0 0 $360,987 $2,140,101 592.85% 0.02% 0.00Provident Amer. Life & H. Ins. Co. 216 216 2,322 $356,760 $242,930 68.09% 0.02% 0.00MetLife Ins. Co. of Connecticut 223 228 2,736 $351,724 $219,239 62.33% 0.02% 0.00Liberty Life Ins. Co. 3,085 4,693 55,836 $334,604 $101,036 30.20% 0.02% 0.00Alta Health & Life Ins. Co. 9 213 2,707 $327,393 $247,941 75.73% 0.02% 0.00Conseco Ins. Co. 974 1,156 9,150 $327,018 $115,974 35.46% 0.02% 0.00National Guardian Life Ins. Co. 102 1,658 21,558 $326,330 $208,155 63.79% 0.02% 0.00Eastern Life and Health Ins. Co. 31 1,396 19,608 $318,933 $293,212 91.94% 0.02% 0.00Amex Assurance Co. 0 97,417 1,241,976 $316,258 $7,264 2.30% 0.01% 0.00Union Fidelity Life Ins. Co. 951 1,667 20,004 $292,804 $167,559 57.23% 0.01% 0.00Ohio National Life Assurance Corp. 143 143 0 $277,649 $269,710 97.14% 0.01% 0.00Delos Ins. Co. 1 179 1,719 $276,852 $229,577 82.92% 0.01% 0.00Vision Benefits of America 15 7,122 83,739 $240,308 $219,125 91.19% 0.01% 0.00Genworth Life & Annuity Ins. Co. 226 226 2,712 $239,560 $146,719 61.25% 0.01% 0.00USAA Life Ins. Co. 164 166 1,866 $239,199 $167,464 70.01% 0.01% 0.00Allstate Life Ins. Co. 35 3,474 41,472 $237,764 $152,223 64.02% 0.01% 0.00Freedom Life Ins. Co. of America 310 326 4,164 $229,354 $164,879 71.89% 0.01% 0.00BCS Ins. Co. 0 80 0 $226,753 $238,176 105.04% 0.01% 0.00Cont'l Life Ins. Co. of Brentwood, TN 160 160 1,704 $223,969 $126,046 56.28% 0.01% 0.00Kanawha Ins. Co. 564 742 8,710 $212,719 $69,984 32.90% 0.01% 0.00Commercial Travelers Mut. Ins. Co. 46 1,271 12,310 $212,068 $100,977 47.62% 0.01% 0.00
Total Group & Individual Business Policies Lives Member Months Premium Earned Claims Incurred Loss Ratio Market Share HHI

Total Group & Individual Business Policies Lives Member Months Premium Earned Claims Incurred Loss Ratio Market Share HHIBrokers National Life Assurance Co. 762 762 9,144 $212,016 $117,000 55.18% 0.01% 0.00Zurich American Ins. Co. 11 870 8,808 $210,441 $29,832 14.18% 0.01% 0.00Pan-American Life Ins. Co. 45 254 2,879 $210,276 $158,457 75.36% 0.01% 0.00New England Life Ins. Co. 29 29 348 $196,428 $63,065 32.11% 0.01% 0.00Ohio National Life Ins. Co. 141 141 0 $194,811 $49,369 25.34% 0.01% 0.00Liberty Life Assurance Co. of Boston 3 1,589 19,068 $187,577 $795,284 423.98% 0.01% 0.00Security Life Ins. Co. of America 62 1,641 48 $181,877 $45,302 24.91% 0.01% 0.00American Nat. Life Ins. Co. of TX 87 118 1,125 $179,825 $49,220 27.37% 0.01% 0.00Mony Life Ins. Co. 166 171 2,148 $179,350 $94,726 52.82% 0.01% 0.00Globe Life and Accident Ins. Co. 719 736 8,585 $156,771 $77,255 49.28% 0.01% 0.00Securian Life Ins. Co. 6 829 9,822 $154,532 $100,279 64.89% 0.01% 0.00Central United Life Ins. Co. 260 316 72 $149,625 $353,602 236.33% 0.01% 0.00Horace Mann Life Ins. Co. 248 1,007 12,074 $149,447 $179,113 119.85% 0.01% 0.00Union Bankers Ins. Co. 222 222 2,664 $149,058 $95,359 63.97% 0.01% 0.00Lincoln Heritage Life Ins. Co. 342 342 3,991 $146,975 $73,538 50.03% 0.01% 0.00American General Life Ins. Co. 327 327 3,924 $144,449 $129,649 89.75% 0.01% 0.00Lincoln Benefit Life Co. 48 74 888 $143,502 $0 0.00% 0.01% 0.00Mid-West Nat. Life Ins. Co. of TN 66 131 2,037 $135,241 $59,570 44.05% 0.01% 0.00Fam. Heritage Life Ins. Co. of Amer. 190 360 0 $131,212 $40,572 30.92% 0.01% 0.00Farm Family Life Ins. Co. 213 219 2,616 $125,129 $424,657 339.38% 0.01% 0.00Cincinnati Life Ins. Co. 1,836 1,836 22,032 $125,018 $22,877 18.30% 0.01% 0.00United Nat. Life Ins. Co. of Amer 242 242 3,069 $123,024 $71,959 58.49% 0.01% 0.00Compbenefits Ins. Co. 1,099 2,018 13,008 $122,974 $76,752 62.41% 0.01% 0.00Transamerica Occidental Life Ins. Co. 66 67 605 $117,989 $115,758 98.11% 0.01% 0.00American Republic Ins. Co. 1,279 1,282 0 $115,227 $77,223 67.02% 0.01% 0.00Envision Ins. Co. 64 64 622 $112,899 $89,161 78.97% 0.01% 0.00American General Assurance Co. 23 3,718 1,812 $106,887 $756,138 707.42% 0.01% 0.00Great American Life Ins. Co. 85 85 930 $101,642 $0 0.00% 0.00% 0.00Union Labor Life Ins. Co. 38 8,089 95,095 $101,556 $131,508 129.49% 0.00% 0.00Continental American Ins. Co. 314 314 3,768 $99,191 $43,356 43.71% 0.00% 0.00Medamerica Ins. Co. 28 35 388 $97,978 $0 0.00% 0.00% 0.00Centre Life Ins. Co. 50 50 642 $97,848 ($33,996) -34.74% 0.00% 0.00Illinois Mutual Life Ins. Co. 112 161 1,896 $97,784 $69,634 71.21% 0.00% 0.00Sentry Life Ins. Co. 4 85 1,055 $96,684 $20,399 21.10% 0.00% 0.00Citizens Security Ins. Co. 113 522 2,757 $95,800 $49,696 51.87% 0.00% 0.00Fairmont Specialty Ins. Co. 1,183 1,531 13,330 $93,969 $162,217 172.63% 0.00% 0.00Federal Ins. Co. 22 1,229 14,719 $93,903 $2,872 3.06% 0.00% 0.00Union Central Life Ins. Co. 38 38 0 $91,759 $17,656 19.24% 0.00% 0.00Federated Life Ins. Co. 82 82 996 $88,031 $0 0.00% 0.00% 0.00AAA Life Ins. Co. 4 1,476 17,782 $83,179 $77,944 93.71% 0.00% 0.00National Life Ins. Co. 168 94 0 $82,319 $558,910 678.96% 0.00% 0.00Colonial Penn Life Ins. Co. 73 79 1,044 $81,494 $67,522 82.86% 0.00% 0.00Lafayette Life Ins. Co. 58 914 10,476 $80,512 $32,505 40.37% 0.00% 0.00Reliastar Life Ins. Co. of NY 91 299 3,588 $75,626 $1,141 1.51% 0.00% 0.00American Public Life Ins. Co. 1 1 12 $71,578 $22,645 31.64% 0.00% 0.00Central Sts H & Life Co. of Omaha 36 36 467 $70,684 $31,869 45.09% 0.00% 0.00Oxford Life Ins. Co. 16 73 48 $61,275 $8,200 13.38% 0.00% 0.00Old Republic Ins. Co. 94 94 1,116 $58,766 $30,322 51.60% 0.00% 0.00American Pioneer Life Ins. Co. 29 29 348 $49,834 $41,872 84.02% 0.00% 0.00United Ins. Co. of America 498 875 11,580 $49,482 $49,775 100.59% 0.00% 0.00State Life Ins. Co. 28 28 336 $49,317 $5,000 10.14% 0.00% 0.00Medico Ins. Co. 227 366 4,392 $46,711 $22,894 49.01% 0.00% 0.00EMC National Life Co. 63 112 573 $45,776 $749 1.64% 0.00% 0.00Individual Assr Co., Life, H & Acc. 2 328 0 $36,249 $8,909 24.58% 0.00% 0.00American Sentinel Ins. Co. 6 1,183 14,016 $36,191 $7,075 19.55% 0.00% 0.00Mutual of America Life Ins. Co. 14 94 1,128 $34,092 $74,637 218.93% 0.00% 0.00QBE Ins. Corporation 14 99 495 $32,871 $23,357 71.06% 0.00% 0.00Balboa Life Ins. Co. 1,369 1,417 17,004 $30,879 $33,709 109.16% 0.00% 0.00Country Life Ins. Co. 17 17 204 $29,522 $23,864 80.83% 0.00% 0.00Harleysville Life Ins. Co. 5 128 1,536 $29,185 $396 1.36% 0.00% 0.00New England Life Ins. Co. 32 36 449 $26,429 $91,956 347.94% 0.00% 0.00Medico Life Ins. Co. 9 9 108 $25,793 $22,075 85.59% 0.00% 0.00Crown Life Ins. Co. 23 23 276 $24,481 $72,161 294.76% 0.00% 0.00Central Benefits National Life Ins. Co. 11 11 132 $23,563 $12,636 53.63% 0.00% 0.00Starnet Ins. Co. 55 4,856 4 $23,445 $0 0.00% 0.00% 0.00Jackson National Life Ins. Co. 32 32 384 $22,782 $1,352 5.93% 0.00% 0.00Erie Family Life Ins. Co. 69 69 864 $21,088 $26,810 127.13% 0.00% 0.00Unified Life Ins. Co. 357 387 1,161 $20,303 $36,659 180.56% 0.00% 0.00Baltimore Life Ins. Co. 113 244 2,700 $19,710 $31,893 161.81% 0.00% 0.00Republic Western Ins. Co. 1 1 12 $18,742 ($1,850) -9.87% 0.00% 0.00AIG Premier Ins. Co. 9 33 438 $17,301 $11,416 65.98% 0.00% 0.00Equitable Life & Casualty Ins. Co. 7 8 112 $17,167 $12,503 72.83% 0.00% 0.00Govt Personnel Mutual Life Ins. Co. 0 44 491 $14,936 $7,588 50.80% 0.00% 0.00J.M.I.C. Life Ins. Co. 0 0 0 $14,594 $18,006 123.38% 0.00% 0.00National Casualty Co. 53 12,813 153,708 $14,279 ($19,807) -138.71% 0.00% 0.00American National Ins. Co. 39 58 703 $13,820 $10,682 77.29% 0.00% 0.00Liberty National Life Ins. Co. 40 54 9,372 $12,867 $1,902 14.78% 0.00% 0.00Jefferson National Life Ins. Co. 10 10 126 $12,113 $2,140 17.67% 0.00% 0.00Kansas City Life Ins. Co. 15 31 396 $12,009 $4,442 36.99% 0.00% 0.00Colorado Bankers Life Ins. Co. 11 34 408 $11,524 $723 6.27% 0.00% 0.00Indianapolis Life Ins. Co. 16 16 192 $11,411 $4,465 39.13% 0.00% 0.00Penn Mutual Life Ins. Co. 14 14 0 $11,014 ($437,028) -3967.93% 0.00% 0.00Chesapeak Life Ins. Co. 10 127 1,484 $10,208 $7,193 70.46% 0.00% 0.00OneBeacon America Ins. Co. 2 327 1,962 $8,986 $0 0.00% 0.00% 0.00National Teachers Assoc. Life Ins. Co. 30 30 336 $8,632 $55 0.64% 0.00% 0.00Hartford Life & Annuity Ins. Co. 72 72 864 $6,356 $9,603 151.09% 0.00% 0.00Nationwide Life Ins. Co. of America 35 41 522 $6,019 $899 14.94% 0.00% 0.00Great-West Life Assurance Co. 0 0 0 $5,907 $8,276 140.10% 0.00% 0.00Commonwealth Ann. & Life Ins. Co. 8 8 96 $5,171 $8,112 156.87% 0.00% 0.00Renaissance Life & H Ins. Co. of Amer. 9 24 294 $4,988 $1,130 22.65% 0.00% 0.00Old American Ins. Co. 48 48 612 $4,603 $8,383 182.12% 0.00% 0.00Marquette National Life Ins. Co. 16 16 192 $4,475 $4,481 100.13% 0.00% 0.00Sentry Ins. A Mutual Co. 2 90 1,080 $4,450 $0 0.00% 0.00% 0.00Christian Fidelity Life Ins. Co. 2 2 12 $4,327 $502 11.60% 0.00% 0.00
Total Group & Individual Business Policies Lives Member Months Premium Earned Claims Incurred Loss Ratio Market Share HHI
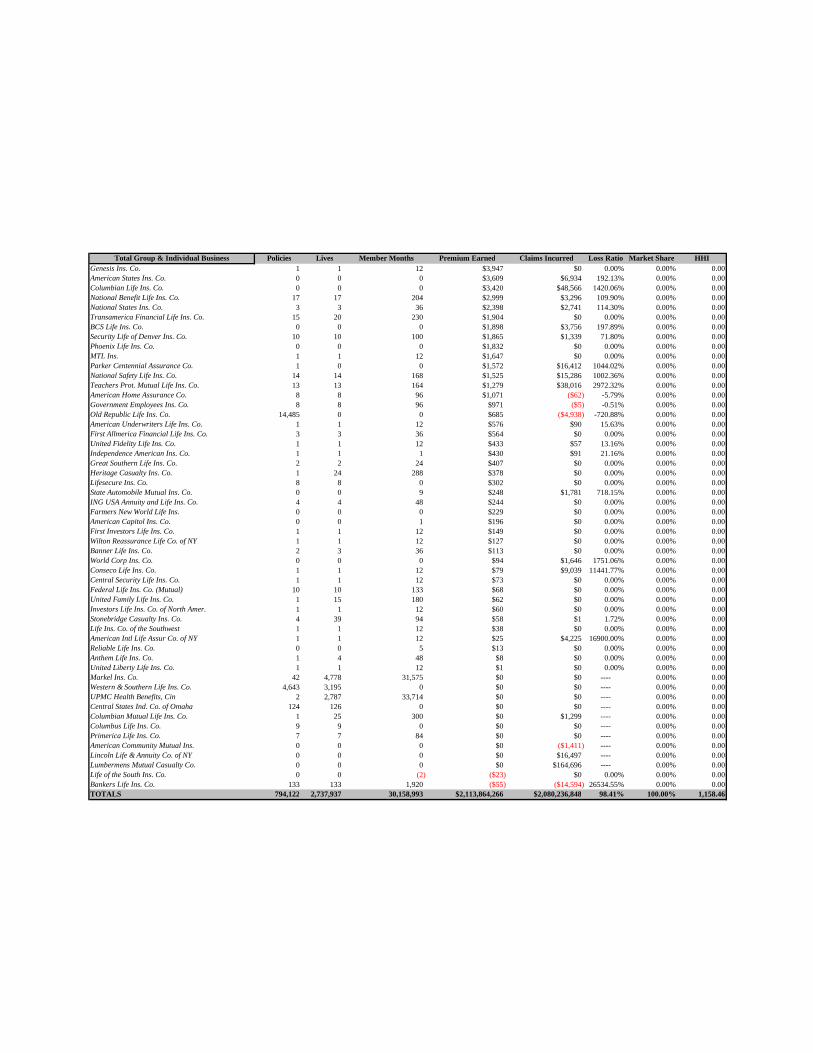
Total Group & Individual Business Policies Lives Member Months Premium Earned Claims Incurred Loss Ratio Market Share HHIGenesis Ins. Co. 1 1 12 $3,947 $0 0.00% 0.00% 0.00American States Ins. Co. 0 0 0 $3,609 $6,934 192.13% 0.00% 0.00Columbian Life Ins. Co. 0 0 0 $3,420 $48,566 1420.06% 0.00% 0.00National Benefit Life Ins. Co. 17 17 204 $2,999 $3,296 109.90% 0.00% 0.00National States Ins. Co. 3 3 36 $2,398 $2,741 114.30% 0.00% 0.00Transamerica Financial Life Ins. Co. 15 20 230 $1,904 $0 0.00% 0.00% 0.00BCS Life Ins. Co. 0 0 0 $1,898 $3,756 197.89% 0.00% 0.00Security Life of Denver Ins. Co. 10 10 100 $1,865 $1,339 71.80% 0.00% 0.00Phoenix Life Ins. Co. 0 0 0 $1,832 $0 0.00% 0.00% 0.00MTL Ins. 1 1 12 $1,647 $0 0.00% 0.00% 0.00Parker Centennial Assurance Co. 1 0 0 $1,572 $16,412 1044.02% 0.00% 0.00National Safety Life Ins. Co. 14 14 168 $1,525 $15,286 1002.36% 0.00% 0.00Teachers Prot. Mutual Life Ins. Co. 13 13 164 $1,279 $38,016 2972.32% 0.00% 0.00American Home Assurance Co. 8 8 96 $1,071 ($62) -5.79% 0.00% 0.00Government Employees Ins. Co. 8 8 96 $971 ($5) -0.51% 0.00% 0.00Old Republic Life Ins. Co. 14,485 0 0 $685 ($4,938) -720.88% 0.00% 0.00American Underwriters Life Ins. Co. 1 1 12 $576 $90 15.63% 0.00% 0.00First Allmerica Financial Life Ins. Co. 3 3 36 $564 $0 0.00% 0.00% 0.00United Fidelity Life Ins. Co. 1 1 12 $433 $57 13.16% 0.00% 0.00Independence American Ins. Co. 1 1 1 $430 $91 21.16% 0.00% 0.00Great Southern Life Ins. Co. 2 2 24 $407 $0 0.00% 0.00% 0.00Heritage Casualty Ins. Co. 1 24 288 $378 $0 0.00% 0.00% 0.00Lifesecure Ins. Co. 8 8 0 $302 $0 0.00% 0.00% 0.00State Automobile Mutual Ins. Co. 0 0 9 $248 $1,781 718.15% 0.00% 0.00ING USA Annuity and Life Ins. Co. 4 4 48 $244 $0 0.00% 0.00% 0.00Farmers New World Life Ins. 0 0 0 $229 $0 0.00% 0.00% 0.00American Capitol Ins. Co. 0 0 1 $196 $0 0.00% 0.00% 0.00First Investors Life Ins. Co. 1 1 12 $149 $0 0.00% 0.00% 0.00Wilton Reassurance Life Co. of NY 1 1 12 $127 $0 0.00% 0.00% 0.00Banner Life Ins. Co. 2 3 36 $113 $0 0.00% 0.00% 0.00World Corp Ins. Co. 0 0 0 $94 $1,646 1751.06% 0.00% 0.00Conseco Life Ins. Co. 1 1 12 $79 $9,039 11441.77% 0.00% 0.00Central Security Life Ins. Co. 1 1 12 $73 $0 0.00% 0.00% 0.00Federal Life Ins. Co. (Mutual) 10 10 133 $68 $0 0.00% 0.00% 0.00United Family Life Ins. Co. 1 15 180 $62 $0 0.00% 0.00% 0.00Investors Life Ins. Co. of North Amer. 1 1 12 $60 $0 0.00% 0.00% 0.00Stonebridge Casualty Ins. Co. 4 39 94 $58 $1 1.72% 0.00% 0.00Life Ins. Co. of the Southwest 1 1 12 $38 $0 0.00% 0.00% 0.00American Intl Life Assur Co. of NY 1 1 12 $25 $4,225 16900.00% 0.00% 0.00Reliable Life Ins. Co. 0 0 5 $13 $0 0.00% 0.00% 0.00Anthem Life Ins. Co. 1 4 48 $8 $0 0.00% 0.00% 0.00United Liberty Life Ins. Co. 1 1 12 $1 $0 0.00% 0.00% 0.00Markel Ins. Co. 42 4,778 31,575 $0 $0 ---- 0.00% 0.00Western & Southern Life Ins. Co. 4,643 3,195 0 $0 $0 ---- 0.00% 0.00UPMC Health Benefits, Cin 2 2,787 33,714 $0 $0 ---- 0.00% 0.00Central States Ind. Co. of Omaha 124 126 0 $0 $0 ---- 0.00% 0.00Columbian Mutual Life Ins. Co. 1 25 300 $0 $1,299 ---- 0.00% 0.00Columbus Life Ins. Co. 9 9 0 $0 $0 ---- 0.00% 0.00Primerica Life Ins. Co. 7 7 84 $0 $0 ---- 0.00% 0.00American Community Mutual Ins. 0 0 0 $0 ($1,411) ---- 0.00% 0.00Lincoln Life & Annuity Co. of NY 0 0 0 $0 $16,497 ---- 0.00% 0.00Lumbermens Mutual Casualty Co. 0 0 0 $0 $164,696 ---- 0.00% 0.00Life of the South Ins. Co. 0 0 (2) ($23) $0 0.00% 0.00% 0.00Bankers Life Ins. Co. 133 133 1,920 ($55) ($14,594) 26534.55% 0.00% 0.00TOTALS 794,122 2,737,937 30,158,993 $2,113,864,266 $2,080,236,848 98.41% 100.00% 1,158.46