Embed Size (px)
Citation preview

Consortium for Research on
Educational Access,
Transitions and Equity
Access, Transitions and Equity in Education in Ghana:
Researching Practice, Problems and Policy
Kwame Akyeampong
Caine Rolleston
Joseph Ghartey Ampiah
Keith M Lewin
CREATE PATHWAYS TO ACCESS
Research Monograph No. 72
January 2012
University of Sussex
Centre for International Education
The Institute of Education,
University of London, UK

The Consortium for Educational Access, Transitions and Equity (CREATE) is a Research Programme
Consortium supported by the UK Department for International Development (DFID). Its purpose is to undertake
research designed to improve access to basic education in developing countries. It seeks to achieve this through
generating new knowledge and encouraging its application through effective communication and dissemination
to national and international development agencies, national governments, education and development
professionals, non-government organisations and other interested stakeholders.
Access to basic education lies at the heart of development. Lack of educational access, and securely acquired
knowledge and skill, is both a part of the definition of poverty, and a means for its diminution. Sustained access
to meaningful learning that has value is critical to long term improvements in productivity, the reduction of
inter-generational cycles of poverty, demographic transition, preventive health care, the empowerment of
women, and reductions in inequality.
The CREATE partners
CREATE is developing its research collaboratively with partners in Sub-Saharan Africa and South Asia. The
lead partner of CREATE is the Centre for International Education at the University of Sussex. The partners are:
The Centre for International Education, University of Sussex: Professor Keith M Lewin (Director)
The Institute of Education and Development, BRAC University, Dhaka, Bangladesh: Dr Manzoor Ahmed
The National University of Educational Planning and Administration, Delhi, India: Professor R Govinda
The Education Policy Unit, University of the Witwatersrand, South Africa: Dr Shireen Motala
The Universities of Education at Winneba and Cape Coast, Ghana: Professor Jerome Djangmah,
Professor Joseph Ghartey Ampiah
The Institute of Education, University of London: Professor Angela W Little
Disclaimer
The research on which this paper is based was commissioned by the Consortium for Research on Educational
Access, Transitions and Equity (CREATE http://www.create-rpc.org). CREATE is funded by the UK
Department for International Development (DFID) for the benefit of developing countries and is coordinated
from the Centre for International Education, University of Sussex. The views expressed are those of the
author(s) and not necessarily those of DFID, the University of Sussex, or the CREATE Team. Authors are
responsible for ensuring that any content cited is appropriately referenced and acknowledged, and that copyright
laws are respected. CREATE papers are peer reviewed and approved according to academic conventions.
Permission will be granted to reproduce research monographs on request to the Director of CREATE providing
there is no commercial benefit. Responsibility for the content of the final publication remains with authors and
the relevant Partner Institutions.
Copyright © CREATE 2012
ISBN: 0-901881-86-4
Address for correspondence:
CREATE,
Centre for International Education, Department of Education
School of Education & Social Work
Essex House, University of Sussex, Falmer BN1 9QQ
United Kingdom
Author email: [email protected]
Website: http://www.create-rpc.org
Email [email protected]

Access, Transitions and Equity in Education in
Ghana:
Researching Practice, Problems and Policy
Kwame Akyeampong
Caine Rolleston
Joseph Ghartey Ampiah
Keith M Lewin
CREATE PATHWAYS TO ACCESS
Research Monograph No 72
January 2012

ii

iii
Contents
Preface....................................................................................................................................... vi
Summary ................................................................................................................................ viii
1. Introduction ............................................................................................................................ 1
2. Policy Context ........................................................................................................................ 4
3. The Community and Schools Survey (ComSS): Research Design ...................................... 7
3.1 Approach and Sample Design .......................................................................................... 7
3.1.1 Mfantesman district ................................................................................................... 7
3.1.2 Savelugu-Nanton district ........................................................................................... 8
3.1.3 Achievement Tests .................................................................................................... 8
3.2 Basic Statistics from ComSS ........................................................................................... 9
4. Access and Exclusion Zones ................................................................................................ 11
4.1 Zone 0: Pre-Schooling .................................................................................................... 11
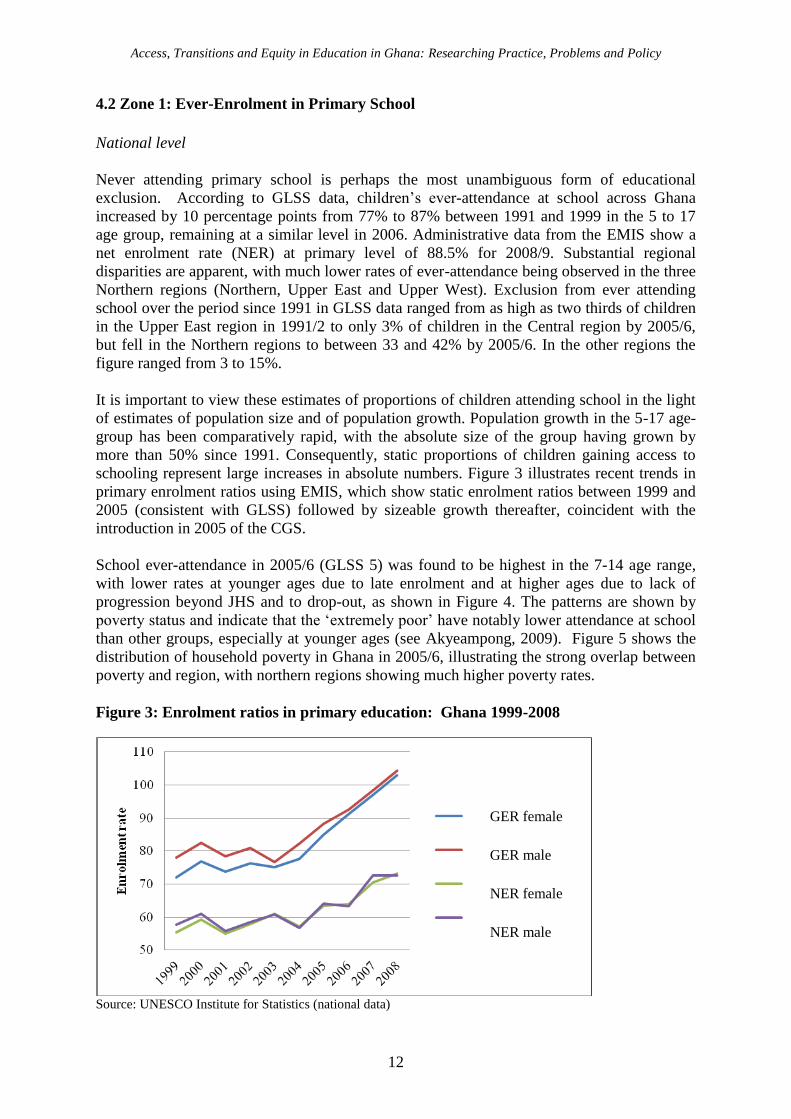
4.2 Zone 1: Ever-Enrolment in Primary School .................................................................. 12
4.3 Zones 2 and 5: Dropping Out ......................................................................................... 15
4.4 Transition, progression and completion (including Zone 4) .......................................... 22
4.4.1 Zone 4: Primary Completion and Transition to JHS .............................................. 23
4.4.2 JHS Completion ....................................................................................................... 25
4.4.3: Post-basic Transition .............................................................................................. 26
4.5: Zones 3 and 6: Meaningful Learning ............................................................................ 26
4.5.1 Attendance and Absence from School ..................................................................... 26
4.5.2 Achievement ............................................................................................................ 32
5. Cross-Cutting Issues of Access ............................................................................................ 38
5.1 Health and Nutrition ....................................................................................................... 38
5.2 Age and enrolment: The national picture ....................................................................... 40
5.3 Overage Enrolment ........................................................................................................ 41
5.4 Private Schooling ........................................................................................................... 45
5.5 Fosterage ........................................................................................................................ 47
5.6 Eliminating costs through Capitation Grants ................................................................. 49
6. Conclusions and Recommendations .................................................................................... 53
References ................................................................................................................................ 57
List of Tables
Table 1: Shares of total participation in public schooling by expenditure quintile ................... 2
Table 2: Summary Statistics on Ever Attendance (Zone 1): Savelugu-Nanton District ............ 9
Table 3 Household Livelihood Activities (per household) North and South .......................... 10
Table 4: Primary Education Enrolment Indicators 2008/9 ...................................................... 15
Table 5: Reasons given by teachers for boys dropping out of school (Mfantesman district) .. 20
Table 6: Final critical events, reasons or decisions cited for dropping out of school .............. 20
Table 7: Comparison of education and background indicators by drop-out status (ComSS) .. 21
Table 8: Achievement in English by drop-out status ............................................................... 21
Table 9: Primary completion rates by age and region (2006) .................................................. 23
Table 10: Primary-secondary transition rates 1999-2008 ........................................................ 23
Table 11: JHS Enrolment Indicators 2008/9 ............................................................................ 24
Table 12: JHS completion rates by age and region (2006) ...................................................... 25
Table 13 Attendance Rates by District and Gender 2007-9 .................................................... 27
Table 14 Absence from School 2007/8 .................................................................................... 29
Table 1: Household and Child Level Characteristics in Household ComSS Data................29

iv
Table 16: Absence from School 2007/8................................................................................... 30
Table 17: Achievement in English 2007/8 ............................................................................... 35
Table 18: Achievement in Maths 2007/8 ................................................................................. 36
Table 19: Progress 207/8-2008/9 ............................................................................................. 37
Table 20: Overage enrolment 1999-2008 ................................................................................ 41
Table 21: Overage Status of Pupils in CREATE Districts (in Years) ..................................... 42
Table 22: Reasons Given by Caregivers for Late Enrolment of Children ............................... 43
Table 23: Teachers‟ perceptions of reasons for over-age enrolment (Savelugu-Nanton) ....... 43
Table 24: Overage Enrolment in CommSS ............................................................................. 45
Table 25 Dropouts by cohort in Mfantseman District ............................................................. 50
List of Figures
Figure 1: The Determination of Educational Access Outcomes ................................................ 3
Figure 2: Attendance at pre-school (all Ghana) 2003-2008 ..................................................... 11
Figure 3: Enrolment ratios in primary education: Ghana 1999-2008……………………….11
Figure 4: School Attendance Rates by Household Poverty Status (GLSS 5)……………......11
Figure 5: Incidence of Poverty in Ghana (2005/6) .................................................................. 14
Figure 6: Evolution of Primary Enrolments 1980-2008 .......................................................... 22
Figure 7: Proportions of Pupils in Ghana Reaching Stages of Progress in Ghana .................. 22
Figure 8: Distribution of English scores (pooled 2007/8 and 2008/9)..................................... 33
Figure 9: Distribution of Maths Scores (pooled 2007/8 and 2008/9) ...................................... 33
Figure 10: Height for age and attendance at school in Ghana (2003-2008) ............................ 38
Figure 11: Prevalence of stunting in Primary 1 in CREATE ComSS Sample ........................ 39
Figure 12: All public primary schools in Ghana age-grade – 2008/09 .................................... 40
Figure 13: All public JSS in Ghana – 2008/09 ........................................................................ 41
Figure 14 Enrolment in Primary Grade 1 by Age (GLSS 5) ................................................... 42
Figure 15: Age at entry to P1 ................................................................................................... 44
Figure 16: Incidence of Private School Enrolment (at age 6-12) by Household Economic
Welfare ..................................................................................................................................... 46
Figure 17: Enrolment by Grade and Gender ............................................................................ 51
List of Boxes
Box 1: The CREATE Model: Zones of Exclusion ................................................................... 2
Box 2: Stories of never-enrolled children in Mfantesman district ........................................... 17
Box 3: Typology of temporary and permanent forms of drop-out in Southern Ghana ........... 19
Box 4: Why Do Low Income Households Use Private Schools? ............................................ 47
v
Acknowledgements
This monograph draws upon the portfolio of research reports and working papers on Ghana
developed by CREATE between 2006 and 2011. The work is based on extensive fieldwork
and analysis of secondary data sources. The Ghana CREATE team at the Universities of
Cape Coast and Winneba was led by Professor Jerome Djangmah and Professor Joseph
Ghartey Ampiah and included the authors of this monograph and the following researchers:
Christopher Kwaah
Dr Christine Adu-Yeboah
Vincent Adzahlie-Mensah
Dr. Seidu Alhassan
Christiana Buxton
Dr. K Ekumah
Dr. Daniel Kweku Baah Inkoom
Dr. Abena Oduro
Dr. Ato Essuman
We gratefully acknowledge the support given to CREATE by DFID and by the Ghana
Ministry of Education.

vi
Preface
Educational access in Ghana remains far from universal, especially if an expanded definition
is adopted that includes enrolment and progression at an appropriate age, regular attendance,
and appropriate levels of achievement. Progress in delivering rights to education up to Grade
9 has been slower than anticipated since 2000. More than 10% of children remain out of
primary school and fewer than 60% successfully complete lower secondary. The reasons are
complex and this research reports a rich tapestry of insights from a large scale programme of
research which is unique in tracking over 2,500 children over three years across two districts
and 29 schools. This major exercise in longitudinal data collection was complemented by
several in depth studies around particular themes designed to illuminate the impact of recent
policy and to explore patterns of causality around different types of educational exclusion.
The findings of the research make disconcerting reading. Disparities in access between the
North and the South persist despite many years of political commitment to their reduction.
Girls remain disadvantaged in parts of the North but much less so in the South. Costs,
especially those related to food and transport, remain high enough to act as a disincentive to
enrolment in poor households. Health indicators suggest that many Ghanaian children are
under nourished and that childhood illness is a common cause of absenteeism. Fosterage
remains common and this often but not always compromises access.
Most of those out of school in most parts of Ghana appear to be those who have enrolled but
who have subsequently dropped out. The research illustrates how drop out is often a process
not a single event, and that there are several characteristic patterns. Both school and
community factors play a role in the process. And drop out is associated with low attendance
and poor performance. In many case study schools average daily attendance is below 65%.
More than a third of children are seriously overage by more than two years. The more they
are over age the less likely they will complete the cycle successfully, especially if they are
girls, and the more likely they will be from poor households.
Though many initiatives have been implemented under Free and Compulsory Basic
Education (FCUBE) their impact has been limited. Thus capitation and decentralisation have
had a transitory impact on participation, but it seems this will not be sufficient to universalise
access. The research leads to the conclusions that concerted action is needed on several
fronts. These include:
Improved early childhood health and nutrition
Lower direct and indirect costs of participation for the poorest
Age appropriate enrolment and promotion practices
Improved public school quality and managed growth of private schools
Community mobilisation to support regular attendance and higher levels of
achievement, and discourage drop out
Effective and regular record keeping of children's achievement and progress and birth
registration etc.
More targeted interventions and subsidies directed towards the poorest districts and
households
There are many other insights in the wealth of data that has been collected and the other
research monographs in this series which use data from the Ghana programme present many
more findings. These will repay close study. Especial thanks are due to Professor Joseph
vii
Ghartey who coordinated the Ghana data collection programme with close support from
Chris Kwaah, to Kwame Akyeampong who coordinated the Ghana research from Sussex, and
to Caine Rolleston who provided technical assistance and field support to the research team
and extensive editorial support for this monograph. Other team members made many
contributions and are listed on the website.

viii
Summary
CREATE‟s research on access to and exclusion from basic education in Ghana since 2007
included a longitudinal data collection exercise in two deprived districts in the Central and
Northern regions of the country alongside a number of primary studies employing qualitative
data and desk studies making use of existing national level statistics. The findings of these
studies are synthesised in this report.
Exclusion from basic education takes a number of inter-related forms which are
conceptualised in the CREATE model in terms of zones of exclusion. The first and perhaps
most serious includes children who never enrol in school. The remaining zones describe
exclusion from pre-schooling, premature drop-out, failure to complete primary and junior
high school and „silent exclusion‟, a situation in which children attend school but make little
or no progress in their learning. The national picture in Ghana in recent years is one of
steadily increasing enrolment, especially in the North. The current rate of progress puts
Ghana among the countries in sub-Saharan Africa with the potential to reach Universal
Primary Education, at least in the minimal sense of initial access. Less encouragingly, there
has been little improvement in completion rates; and progression through basic education
remains highly inequitable. Nonetheless, government initiatives including FCUBE and the
Capitation Grant Scheme have achieved considerable success in reducing cost barriers to
access and in improving gender equity to a position of near equity, according to some basic
education indicators. However, there is evidence that better targeting of fee-free policies
would significantly improve access for the very poor and marginalised population groups.
CREATE findings shed new light on the impact of recent policies including the CGT and
decentralisation; on the lives of out-of-school children and drop-outs; on the growth in low-
cost private school enrolments and the determination of private school choice; and on the
determinants of exclusion. Emerging evidence suggests that issues of public school quality
motivate even the relatively poor to select private schooling in some cases; and data show
that in terms of achievement such schools may produce similar results to their counterparts in
the public system, at considerably lower cost. However, the attraction to „low-fee‟ private
schools in rural areas has been achieved because providers operate pro-poor admission
policies to sustain demand. Some school drop-outs also spoke of poor quality in public
schools, but for most of the never-enrolled and those who dropped out, the costs of schooling
and their work commitments continue to be a dominant access barrier.
Quantitative work showed that exclusion from basic schooling in the broad sense defined by
CREATE is associated with health, poverty, livelihoods (especially farming), gender,
location (especially remote and rural) and with parental education and support. Findings
suggest that exclusion operates through complex, cross-cutting and mutually reinforcing
mechanisms which conspire to limit the access chances of disadvantaged children in evolving
ways over the education life-cycle. For example, two proxy indicators of disadvantage are
fosterage, particularly in Northern Ghana, and over-age status. The latter is especially
significant. Children with stunted growth and/or low BMI (Body Mass Index) are more
likely to enrol late and to progress more slowly through the basic education grades. Late and
delayed enrolment is also found to be strongly associated with poor attendance and with poor
achievement. Even after controlling for health and attendance, over-age effects continue to
exert a further negative influence on achievement. At the same time, the evidence shows that
differences between schools and communities can either reinforce or compensate for

ix
disadvantage due to individual and household characteristics, suggesting that the processes of
exclusion operate contextually and that arresting them will require policies sensitive to the
issues in situ. Overall, the findings of CREATE studies in Ghana suggest the need for
policies and interventions that target poor and marginalised population groups experiencing
particular access challenges. But, at the heart of the problem of access and successful
progression to completion of basic education is the issue of costs, opportunity costs and
quality education. A national campaign to get children into school should include sensitivity
to appropriate age-grade enrolment. Ghana is unlikely to achieve high levels of sustained
access and completion of basic education if appropriate age-grade enrolment is not at the
centre of new policies or strategies to achieve EFA by 2015. CREATE analysis suggests that
a one-size fits all approach to the problems of access in Ghana, such as the introduction of
Capitation Grants, will at best, achieve temporary impact. Clearly missing in Ghanaian
education policy is increased investment that targets the most vulnerable and marginalised
population groups. For these groups, survival needs mean that choosing to go to school must
produce tangible outcomes in terms of completion of basic education and acquisition of
employable or trainable skills, or else demand will fall. In future, it is a new and smart kind
of access policies accompanied by strong implementation strategies that will transform the
educational landscape of Ghana into a high performing one. Anything less, is sure to repeat
the history of high initial enrolment, low progression and achievement and persistent dropout.

x

1
Access, Transitions and Equity in Education in Ghana:
Researching Practice, Problems and Policy
1. Introduction
Basic education lays the foundation for human development and is associated with well-
established social and economic benefits; not least reduced family size and improved health
and welfare. Ghana is one of few countries in sub-Saharan Africa where universal initial
access to primary education can potentially be achieved by 2015, marking an impressive
milestone in educational progress, substantially due to expansion of schooling provision and
to reductions in costs to households. Growth in enrolments since the early 1990s has been
strong, enabled by robust economic growth, increased government revenues, budgetary
reallocation in favour of basic schooling, donor support and a raft of policies aimed more
directly at increasing both supply and demand. In particular, the FCUBE (Free Compulsory
Basic Education) programme and Capitation Grant Scheme (CGS) have been instrumental
(see Akyeampong, 2009). Nonetheless, considerable challenges lie ahead, not least in
reaching vulnerable and marginalised groups for whom investment in education has produced
the least in terms of progression into higher education levels and acquisition of skills and
capabilities for economic development. This is against a backdrop of increasing investment in
education provision. Public spending on Education as a percentage of GDP in Ghana is about
9%, much higher than the sub-Sahara Africa (SSA) average of 4.3% (World Bank 2011).
Thus, Ghana‟s proportionate spending on education is already comparatively high and room
for further spending increases is likely to be tied to the extent of economic growth (see
Rolleston 2010). Quality is an increasing concern and the evidence suggests that even poor
households are becoming disillusioned with public education and opting increasingly for
private sector alternatives as a result, despite relatively high costs in comparison with public
schooling. Moreover, serious issues of inequity surround progression beyond basic education
and the evidence indicates that there has been little improvement in the relative position of
poor and marginalised groups in terms of higher levels of educational access.
CREATE explored the issues surrounding access to basic education in Ghana over a five year
period, beginning in 2005, through a series of studies intended to address the complex nexus
of factors which act to both include and exclude children from a full course of basic
schooling. The CREATE Ghana Country Analytic Report (Akyeampong et al 2007)
identified the key issues of educational access in Ghana, setting the research agenda for the
project. This report summarises the findings of CREATE studies in relation to the project‟s
analytic framework and draws out their implications for education policy. A full list of
CREATE research products is included in the appendix.
„Meaningful access‟ to a full course of basic education, CREATE‟s conceptualisation of the
overall access goal across its study countries, comprises not only timely school enrolment and
appropriate progression, but meaningful learning. Such learning lays the foundation for the
development of productive skills and decent livelihoods, for lifelong learning, civic
participation and for national development and thereby embodies a notion of adequate or
appropriate quality. Full participation in such learning is nonetheless substantially
constrained in Ghana, as in many low income countries, by limitations on both supply and
demand. Most obviously, demand is constrained by household resources, while supply is
limited in terms of both quantity and quality by national and local finances. But resource

Access, Transitions and Equity in Education in Ghana: Researching Practice, Problems and Policy
2
allocation and access to education are also inequitable and arguably inefficient. To illustrate,
Table 1 shows the shares of total participation in public schooling by household expenditure
quintile for 1991 and 2006, calculated by Coulombe and McKay (2007) using national data.
It shows that households in the richest two quintiles shared least in primary school
participation, primarily because of their typically lower numbers of children, and also that
this share declined, indicating improving equity at primary level. By secondary level,
however, the poorest two quintiles shared least, despite having larger numbers of children.
At tertiary level, the richest quintile of households captured more than two thirds of total
participation in Ghana, with much of the remainder being captured by the second richest
quintile. Thus, primary education provision in Ghana may in this sense be considered
relatively pro-poor while secondary and tertiary provision is decidedly pro-rich. This picture
reinforces the claim that CREATE analysis make, that, basic education is failing the poor and
marginalised in terms of access and progression through to successful completion.
Table 2: Shares of total participation in public schooling by expenditure quintile
Source: Coulombe and McKay (2007) calculations using GLSS 3 and 5
CREATE‟s research addressed patterns, trends and causes of access and inclusion with
particular reference to transitions and to equity by reference to seven „exclusion zones‟ as
described below. Fuller considerations of the model and of its application to the Ghana
context are available in Lewin (2007) and Akyeampong et al (2007).
Box 1: The CREATE Model: Zones of Exclusion
Zone 0 Children excluded from pre-schooling
Zone 1 Children never enrolled in school
Zone 2 Children who have dropped out before the end of primary schooling
Zone 3 Those in primary school but who are at risk of dropping out
Zone 4 Those who complete primary education but fail to enter secondary
Zone 5 Those who enter but fail to complete lower secondary school
Zone 6 Those in lower secondary school but who are at risk of dropping out
The mechanisms of educational exclusion operate at and interact across several levels or units
of analysis important for CREATE analyses; as illustrated in Figure 1 below. Individual
children‟s own characteristics are associated with lower levels of access through mechanisms
such as gender discrimination, while household factors such as parental education and
income are key determinants of preferences for education and thereby of educational demand.
Considerable influences are exerted too by schools themselves, including through dimensions
of quality and inclusiveness. Equally, educational access differs widely by community,
according to the nature of supply and to dominant livelihoods and cultural traditions.
CREATE‟s body of research included a longitudinal survey of schools and households in two
deprived districts in Ghana – the Community and Schools Survey (ComSS) alongside

Access, Transitions and Equity in Education in Ghana: Researching Practice, Problems and Policy
3
dedicated qualitative studies of the experiences of drop-outs and never-enrollers and a
number of other studies addressing policy developments, schooling experience, health and
nutrition, costs and finance, national trends in exclusion and equity and the character and
development of private schooling. The principal sources of national-level data employed
include the Ghana Living Standards Surveys (GLSS), the national Education Management
Information System (EMIS) the Core Welfare Indicators Questionnaire (CWIQ) and the
Demographic and Health Surveys (DHS).
Figure 1: The Determination of Educational Access Outcomes

Access, Transitions and Equity in Education in Ghana: Researching Practice, Problems and Policy
4
2. Policy Context
Historically, levels of access to education in Ghana have been high relative to other states in
West Africa. Considerable progress was made as a result of early post-independence
policies; although enrolment growth stalled in the 1970s as a result of economic decline,
recovering again in the late 1980s. Detailed discussion in historical context of the
development of educational access in Ghana and of the policies that shaped it is provided in
Little (2011) and Akyeampong (2010). Important improvements in initial access to basic
education took place in Ghana during the 1990s, and by the end of the Millennium, only
around one in ten children had never been to school. The large gap between the three
Northern regions and the rest of the country in terms of initial access narrowed substantially
over the same period, as did the gender gap, in line with a key policy objective. The
proportion of children who had ever been to school improved, even after controlling for
important changes in socio-economic and demographic indicators, suggesting an effect of
successful expansion in supply of schooling. Equally, household economic welfare levels
improved over the period, although notably less so for the poor.
However, increased educational access and declining absolute poverty in Ghana do not
necessarily suggest an improving position in terms of equity and equality of opportunity. For
the later and more costly stages of education, the advantages afforded to males, urban
residents, those in favourable socio-economic groups and in favourable regions, but most
particularly to those in households with higher economic welfare were very large in 2005/6.
Moreover, despite policies to eliminate fees, the costs of education remain a serious barrier to
access in Ghana among disadvantaged groups, even at the most basic level. Unlike initial
enrolment rates, rates of drop-out and completion do not appear to have improved. Over-age
enrolment may even have worsened in recent years (Akyeampong 2011).
Nonetheless, key policies of the 1990s and after may be credited with notable success. The
Free Compulsory Universal Basic Education (FCUBE) policy was introduced in Ghana in
1996. The policy set out to make “schooling from Basic Stage 1 through 9 free and
compulsory for all school-age children by the year 2005” (GoG 1996) and aimed at
addressing long established deficiencies of quality. The policy was intended to abolish
school fees more decisively than had been achieved in earlier reforms. It provided a
comprehensive sectoral framework for reform in the basic education sector and required
considerable decentralization, aimed at community involvement; alongside seeking to
improve the co-ordination of donor support. Improving gender equity in participation was a
central aim and was supported by the establishment of the Girls Education Unit (GEU) in
1997. In addition, FCUBE focused on the development of curricula, improvement of teacher
deployment and training and the strengthening of school and educational management
structures. The FCUBE policy and its impact are considered in detail in Akyeampong
(2009).
In 2001, The Ghana Education Trust (GET) Fund was established to assist in the financing of
education nationally, deriving its funds from additional hypothecated expenditure taxes in
recognition of the need for increased investment. By 2005, when FCUBE‟s initial ten year
period was drawing to a close, it was apparent that, while there had been substantial
improvements in participation in basic education, the implementation of policy had
nonetheless fallen short in respect of providing for universal access (see Akyeampong et al
2007). GLSS 5 data collected in 2005/6 showed a school attendance rate of around 81 per
cent overall in the 5-17 age group but these rates were much lower for the poor and in
Access, Transitions and Equity in Education in Ghana: Researching Practice, Problems and Policy
5
Northern regions and reduced with age within the age-group of the basic cycle. As
Akyeampong notes,
“One disappointment with FCUBE is that its input did not go far enough to offset the
opportunity costs of schooling for the poorest households by abolishing all forms of
fees and reducing significantly the indirect costs associated with attending school. The
incidence of late entry, overage attendance and poor households' need for child labour
also posed a further threat to the benefits FCUBE promised.”
(Akyeampong, 2009)
Equally, the implementation of FCUBE has done little to silence critics of the quality of
education in Ghana. In 2003, the Core Welfare Indicators Questionnaire (CWIQ) survey had
found that around 25 per cent of children who were not attending school did not do so
because it was „too expensive‟ (GSS 2005). In response to apparent difficulties in raising
attendance among the poor, in spite of FCUBE, the Ghanaian government began a pilot in
2004/5, under a World Bank programmatic scheme, of a capitation grant initiative. The
scheme granted additional funds to schools directly on a per pupil basis and was piloted
initially in 40 schools and then in 53 deprived districts. In 2005/6 the grant amounted to
around 3 US Dollars per pupil and was intended to offset the costs that continued to
discourage universal enrolment. The scheme was initially financed using funds from
international initiatives including the Highly Indebted Poor Countries (HIPC) fund and the
Social Impact Mitigation (SIM) fund. Following the introduction of FCUBE, schooling costs
had been primarily indirect and opportunity costs, but the GES found that schools were
continuing to levy a wide range of fees some of which were unauthorised (GES 2005). Pilot
exercises found the capitation grant to be an effective lever for improving enrolment and the
Capitation Grant Scheme (CGS) was rolled out nationally in 2006 and has been associated
with a recent surge in enrolment in administrative data (see Akyeampong, 2009). However,
as Akyeampong (2011) argues, more careful analysis of the impact of the CGS suggests that
it is sufficient to sustain high enrolments and completion of basic education, and that what is
required are policies and strategies that also make schools capable of dealing with the wide
range learning needs of pupils who re-enrol or enrol for the first time. And that, unless the
CGS is discriminatory, in terms of it targeting the poor who are in most need of support to
access basic education, it is unlikely to achieve sustainable demand from the poor.
It is quite clear from the evidence from CREATE studies in Ghana that, the factors
contributing to educational exclusion are complex and overlapping, so that children suffering
multiple disadvantages may be considered most at risk. The very low levels of access for
fostered girls in rural Northern Ghana (see Rolleston 2011) illustrate the impact of such a
constellation of excluding factors. More generally, CREATE studies have identified strong
linkages between community livelihoods, low parental literacy, poor health and nutrition,
over-age enrolment, poverty, rural habitation and exclusion indicators including poor
attendance and achievement. While „catch-all‟ policy initiatives such as FCUBE and the CGS
have achieved notable success, it may be argued that future interventions will need to attend
more specifically to the complexity of exclusion, through effective targeting, if they are to
improve the access chances of the most marginalised. Quantitative expansion has occurred
under policies such as FCUBE and CGS should be seen as temporary – if quality of public
education to sustain demand does not come at the heel of such expansion, and quickly, much
of the gains will be eroded. Improved quality and efficient delivery of basic education is
critical if Ghana is to achieve universal lower-secondary education, which must be seen as a
precursor to rapid quantitative expansion of secondary education. Any attempt to bypass the

Access, Transitions and Equity in Education in Ghana: Researching Practice, Problems and Policy
6
need to achieve universal completion of lower-secondary and instead invest heavily in senior
secondary is bound to create the kind of inequalities in access which ultimately disadvantage
the poor (see Coulombe & McKay 2007).

Access, Transitions and Equity in Education in Ghana: Researching Practice, Problems and Policy
7
3. The Community and Schools Survey (ComSS): Research Design
CREATE‟s primary data-collection exercise in Ghana, the ComSS study, tracked 2544 pupils
between 2007 and 2010, collecting data from 29 schools and 1386 households. The
methodology was designed to explore issues surrounding meaningful access to basic
education for children by means of a longitudinal study of pupils, their schools and homes.
Pupils in the grades Primary 1, 4, 6 and in JHS 1 were identified as key because of the focus
on transitions and trajectories and formed the sample of pupils within the selected schools. In
addition to the child and class level survey instruments, questionnaires were conducted with
household caregivers of pupils from the selected grades to understand their background and
household conditions. Interviews were conducted with school drop-outs and never-enrollers
identified in the communities. The baseline study of the schools and communities also
involved questionnaires conducted with school principals and teachers. A full consideration
of the ComSS design is available in Akyeampong et al., (2007).
3.1 Approach and Sample Design
Ghana can be divided into three main geographical (ecological) zones: northern (savannah),
middle-belt (forest) and southern (coastal). Typically the coastal region is most advantaged
and the savannah the least. Two districts were purposively selected to represent relatively
poor areas in the northern and southern belts using criteria including a dominance of rural and
peri-urban settlements, a low Gross Enrolment Ratio (GER) within the region and a pattern of
occupational activities that have potential to impact upon educational access. The districts
selected on this basis were Savelugu-Nanton (Northern Region) and Mfantseman (Central
Region). School statistics for the district and school mapping reports were used to aid the
selection of individual schools and their communities in consultation with circuit supervisors
from the District Education Offices. Households with children enrolled in Grades P1, P4, P6
and JSS1 within the selected schools were included in the survey sample. Not all households
could be visited, however, so that the school-based pupil sample is larger (2544 pupils) than
the household-based sample (1473 pupils). The selected schools fell within 6 education
circuits (the administrative level below the district). The circuits typically represent towns or
parts of towns and their satellite villages in urban areas; and villages or groups of villages in
rural areas and are thus able to be interpreted loosely as wider communities beyond the
school-communities defined by the households which contain children attending a particular
school. The design thus permits the examination of individual child, household, school and
community factors as they impact on educational access.
3.1.1 Mfantesman district
Mfantseman District is located in the Central Region of Ghana. It has a total population of
152,264 constituting about 7% of the total population of the region (GSS, 2005). There are
168 settlements in the district with only 2.4% of its population living in urban areas, so that
the district is primarily rural (GSS, 2005). Of the 12 administrative districts in the Central
region, Mfantseman has been identified as one of the poorest with about 60% of its total
population considered to be living below the poverty line (MDA, 2006; GSS, 2000). The
major economic activities are farming and fishing; with the occupational distribution showing
that 51% of households are involved in fishing, 30% in farming and 19% in commerce (GSS,
2005). Farming activities are rain-fed; and owing to a perennial erratic rainfall pattern and to
rudimentary farming practices, many farmers can only produce at a subsistence level. School
attendance is relatively low. Gross enrolment at primary and Junior high school levels stand

Access, Transitions and Equity in Education in Ghana: Researching Practice, Problems and Policy
8
at 70.1% and 67.6% respectively (GSS, 2000). Only 37.9% of adults are considered literate
and around 33% of the adult population has never enrolled in school; the figure being 20%
for those between the ages 6 and14 years. Compared to the other districts in the region,
Mfantseman has the greatest proportion of children of school-going age who have never
enrolled (GSS, 2005). The district nonetheless contains a number of low-cost private
schools. In rural areas, there is typically a single school (either public or run by faith-based
organisations) or occasionally none at all. Communities are predominantly Christian and
engage in monogamous marriages. Semi-urban areas have more basic schools – both public
and private schools and some faith-based schools. Nonetheless, livelihoods are largely similar
to those in rural areas. Outside of the fishing season, some of the fishermen migrate with
their children to other fishing communities elsewhere in Ghana, so that temporary migration,
including of children, is relatively common in the district.
3.1.2 Savelugu-Nanton district
Savelugu-Nanton is an administrative district within the Northern region of Ghana located
close to the regional capital, Tamale. The population was 91,415 according to the 2000
census and population growth is above the Ghana average (3% compared to 2.6% in 2005).
Dagbani is the most widely spoken language, although schooling is mainly in English or
English and Arabic. Islam is the dominant religion. Agriculture engages 97 per cent of the
labour force, mainly in the form of rain-fed subsistence crop farming, including the
cultivation of maize, rice and yam. Incomes are low, especially among women and less than
50 per cent of the population has access to clean water. Of 149 communities, only 17 are
connected to the national grid for electricity and other facilities are limited. For example,
only four doctors were working in the district in 2005. There is migration of both children
and adults to Tamale, and to southern parts of Ghana, especially Kumasi and Accra,
including for menial work as porters, known as kayaye. In 2005, 40 percent of children were
found to have stunted growth (District Directorate of Health Services 2006) and the district
had the highest rate of under-5 mortality in Ghana at 239 deaths per 1000 live births,
according to the DHS. Historically, enrolment in school among the Dagomba has been
particularly low, although in recent years it has increased dramatically. Around one fifth of
household heads could read in 2004 (UNICEF 2010) with a slightly lower proportion being
able to write. Less than ten per cent had ever attended primary school. Unlike in southern
Ghana, where gender gaps are typically relatively small, gender disparities are a particular
issue in Savelugu-Nanton:
“There exists a gender parity gap. The situation emanates from poor retention of the
girl child in school especially at the JSS level. The possible reason for this situation
could be that at the JSS level, the girl child begins performing the multiple domestic
roles... It appears impossible to prevent the girl child from performing the roles. Thus,
the action being pursued is to support the girl child perform domestic roles without
compromising with her education.” (Savelugu-Nanton District Assembly, 2010)
3.1.3 Achievement Tests
Pupils in primary grades 4 and 6 and in Junior High School (JHS) grade 1 were tested in
English language and mathematics to examine their achievement in relation to the norms of
the curriculum in language and mathematics. The same test was administered to all the three
grades on two occasions, with an interval of approximately one year. The test items were
developed by the Centre for Research on Improving Quality of Primary Education in Ghana

Access, Transitions and Equity in Education in Ghana: Researching Practice, Problems and Policy
9
(CRIQPEG) based on topics in the English language and mathematics curriculum in Ghana
for Grade 4.
3.2 Basic Statistics from ComSS
Table 2 reports summary statistics for both case-study districts included in the ComSS. For
Mfantesman, the average (mean) household size was found to be around 5.6 individuals of
whom an average of 2.6 were children aged 6-17; that is just over 1.4 boys and 1.1 girls. In
total an average of 2.4 children per household had ever attended school, constituting 92 per
cent, leaving around 0.2 children or 8 per cent as not having ever attended in this age group.
Households contained on average just over 1.3 boys and 1.1 girls and ever attendance rates
are found to be around 92 per cent for both genders. In Savelugu-Nanton, household size is
clearly much larger, being on average 9.5 members. Households contained 3.8 children of
school age but among these 3.05 had never attended school, on average. This gives an ever-
attendance rate of only 20 per cent, which is dramatically lower than in the Southern case.
Moreover, when compared to figures showing a high level of gender parity in the South, the
Northern data show that 17 percent of girls and 35 percent of boys had ever enrolled,
indicating wide gender disparity.
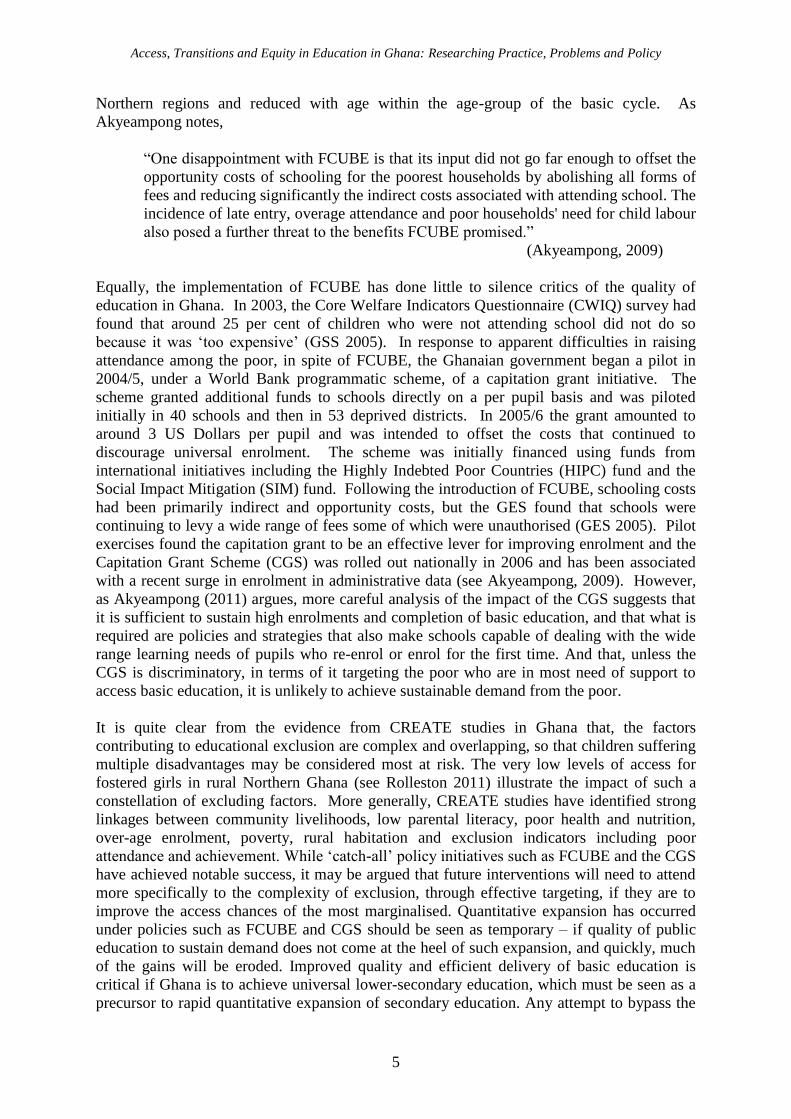
Table 3 reports the data on household livelihood activities for both districts, showing the
percentage of households which derived income from each source. Farming activities
(including fishing) dominated in both sites, with three fifths of households in the South
deriving income from this source and four fifths in the North. A substantial minority of
households also received income from petty businesses (especially trading). Casual labour in
agriculture was a significant source of income in the South, somewhat less so in the North.
Other sources of income were received by only a smaller minority of households, although
sources of income are clearly considerably more diversified in the South than in the North. In
the South, income from wage-labour, while relatively unusual was much more common than
in the North. The same is true of unearned income. Accordingly, the northern site may be
considered considerably more dependent on agriculture, while in the south livelihoods
depend on a range of activities.
Table 3: Summary Statistics on Ever Attendance (Zone 1): Savelugu-Nanton District
Variables (per household) Savelugu-Nanton (North) Mfantesman (South)
Cases Mean Cases Mean
Household Size 709 9.50 663 5.55
Children aged 6-17 709 3.80 663 2.60
Children ever enrolled 709 0.75 663 2.40
Children never enrolled 709 3.05 663 0.20
Boys 709 2.17 663 1.45
Boys never enrolled 709 1.34 663 1.34
Boys ever enrolled 709 0.47 663 0.10
Girls 709 1.70 663 1.15
Girls never enrolled 709 1.62 663 1.06
Girls ever enrolled 709 0.28 663 0.87
Source: ComSS Data
Access, Transitions and Equity in Education in Ghana: Researching Practice, Problems and Policy
10
Table 4: Household Livelihood Activities (per household) North and South
North (Savelugu-Nanton) South (Mfantesman)
Cases % Cases %
Own Farm activities 707 83.9 667 63.3
Casual Labour in
Agriculture
707 11.3 667 28.0
Casual Labour (Non-Agric) 707 7.1 667 9.9
Wage Employment (Agric) 707 1.7 667 6.6
Wage Empl. (Non-Agric) 707 6.6 667 11.5
Petty Business 707 39.3 667 43.0
Major Business 707 7.1 667 18.6
Collection / Foraging 707 5.9 667 12.0
Charity / Alms 707 1.6 666 9.8
Safety Net / Poverty
Schemes
707 2.4 667 4.8
Interest 707 0.7 667 2.4
Public transfers 707 0.8 667 3.0
Remittances 707 2.6 667 8.8
Source: CommSS Data
Access, Transitions and Equity in Education in Ghana: Researching Practice, Problems and Policy
11
4. Access and Exclusion Zones
The following sections summarize the findings of CREATE research in relation to the „zones
of exclusion‟ comprising the project‟s conceptual model of access.
4.1 Zone 0: Pre-Schooling
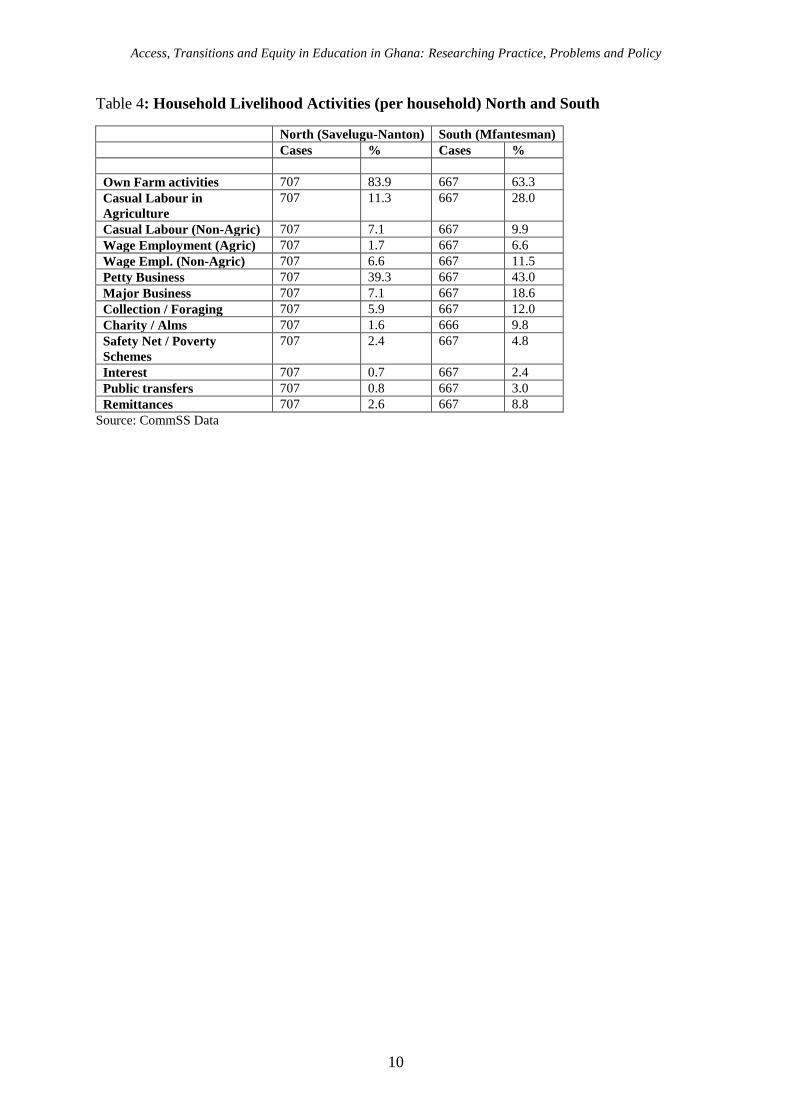
According to the most recent available national data, relatively high proportions of children
are attending some form of pre-schooling in Ghana, following recent increases in enrolment
since pre-schooling was included in the conception of basic education in 2007. Figure 2
below shows that more than half of four and five year olds had attended some form of pre-
schooling in 2008. Attendance at pre-school for some children overlaps with the official
starting age at primary school (6 years); in these cases probably being associated with late
enrolment at primary level, considered further in the discussion of over-age enrolment. In the
ComSS household sample, 93.1% of children aged 6-14 in Mfantesman district and 84.7% in
Savelugu-Nanton were reported to have attended some form of pre-schooling. In both
districts, children attended pre-school on average for just over two years.
Early childhood care and education is often found to exert positive effects on later-life
outcomes, including subsequent educational attainment. Consequently, pre-schooling
indicators were included in analyses of attainment outcomes which are reported in the
sections that follow. Having attended pre-school was found to be positively associated with
attainment in maths and English and negatively associated with a child‟s over-age status –
that is the number of years by which a child is older than the expected age for the grade in
which he or she is enrolled. However, these effects appear to be accounted for to a large
extent by differences between communities, including of course the availability of pre-
schooling, but also other forms of advantage at community level. This evidence supports the
attempts by the government of Ghana to make pre-school education more accessible. Quite
clearly, access to pre-school is an important pre-cursor to sustained access and improved
achievement in basic education.
Figure 2: Attendance at pre-school (all Ghana) 2003-2008
Source: UNICEF (2010) analysis using DHS data
Access, Transitions and Equity in Education in Ghana: Researching Practice, Problems and Policy
12
4.2 Zone 1: Ever-Enrolment in Primary School
National level
Never attending primary school is perhaps the most unambiguous form of educational
exclusion. According to GLSS data, children‟s ever-attendance at school across Ghana
increased by 10 percentage points from 77% to 87% between 1991 and 1999 in the 5 to 17
age group, remaining at a similar level in 2006. Administrative data from the EMIS show a
net enrolment rate (NER) at primary level of 88.5% for 2008/9. Substantial regional
disparities are apparent, with much lower rates of ever-attendance being observed in the three
Northern regions (Northern, Upper East and Upper West). Exclusion from ever attending
school over the period since 1991 in GLSS data ranged from as high as two thirds of children
in the Upper East region in 1991/2 to only 3% of children in the Central region by 2005/6,
but fell in the Northern regions to between 33 and 42% by 2005/6. In the other regions the
figure ranged from 3 to 15%.
It is important to view these estimates of proportions of children attending school in the light
of estimates of population size and of population growth. Population growth in the 5-17 age-
group has been comparatively rapid, with the absolute size of the group having grown by
more than 50% since 1991. Consequently, static proportions of children gaining access to
schooling represent large increases in absolute numbers. Figure 3 illustrates recent trends in
primary enrolment ratios using EMIS, which show static enrolment ratios between 1999 and
2005 (consistent with GLSS) followed by sizeable growth thereafter, coincident with the
introduction in 2005 of the CGS.
School ever-attendance in 2005/6 (GLSS 5) was found to be highest in the 7-14 age range,
with lower rates at younger ages due to late enrolment and at higher ages due to lack of
progression beyond JHS and to drop-out, as shown in Figure 4. The patterns are shown by
poverty status and indicate that the „extremely poor‟ have notably lower attendance at school
than other groups, especially at younger ages (see Akyeampong, 2009). Figure 5 shows the
distribution of household poverty in Ghana in 2005/6, illustrating the strong overlap between
poverty and region, with northern regions showing much higher poverty rates.
Figure 3: Enrolment ratios in primary education: Ghana 1999-2008
Source: UNESCO Institute for Statistics (national data)
GER female
GER male
NER female
NER male

Access, Transitions and Equity in Education in Ghana: Researching Practice, Problems and Policy
13
Results of modelling the determinants of ever attending school show a declining gender
effect at the national level, with boys being more likely to have ever attended school in the
1990s but an almost negligible effect by 2006 (full modelling results for school attendance
and progression outcomes are available in Rolleston 2009). Gender effects remained
important in the North, however. The relationship of a child to the household head was found
in modelling exercises with national data to exert an important negative effect on ever-
enrolment. These effects were particularly large for servants and fostered children who were
considerably less likely to have ever enrolled, controlling for other characteristics. The
relationships between fosterage and educational access in Northern Ghana are considered in
detail in Rolleston (2011). The education and/or occupational class of a child‟s parents were
also found to exert significant effects, consistent with the wider literature. Household welfare
(consumption) levels were also positively associated with a child ever having attended
school, with children in higher welfare households being more likely to have attended.
Regional effects were found to be significant and sizeable. The most positive regional effect
overall was for the Brong Ahafo region whose children were up to 17% more likely, other
things being equal, to have ever enrolled than in the region with the lowest ever-attendance
(Upper East). There appears to have been a general and substantial decrease in the size of
regional effects over time, however, owing substantially to increased provision in the North.
There is also a significant effect on ever-attendance of urban as opposed to rural location at
the national level. Modelling exercises find a general positive effect associated with later time
periods since 1991, reflecting policy interventions to increase supply and possibly increased
preferences for education linked to increasing levels of adult education among other factors.
Figure 4: School Attendance Rates by Household Poverty Status (GLSS 5)
.4.6
.81
Scho
ol A
tte
nd
an
ce R
ate
5 6 7 8 9 10 11 12 13 14 15 16 17 Age in years
Extremely Poor Poor
Not Poor
Source: Computed from GLSS 5

Access, Transitions and Equity in Education in Ghana: Researching Practice, Problems and Policy
14
Figure 5: Incidence of Poverty in Ghana (2005/6)
Source: Computed from GLSS 5
Case Study Districts
Owing to the school-based sampling-frame, CREATE survey data do not provide information
about ever-enrolment at district or community level. Evidence of ever-enrolment patterns is
available, however, from administrative sources (EMIS). Table 4 shows the enrolment
indicators from which inferences about ever-enrolment may be made. Patterns in the two
districts are somewhat different. The NAR (net admission rate) indicates the proportion of
children of the correct age who were enrolled in primary grade 1. In Savelugu-Nanton,
around three quarters of children of age were admitted at primary compared to just over two-
thirds in Mfantesman. A gender gap of eight percentage points is observed in the north while
there is parity in the south. The GAR (gross admission rate) at primary denotes the quotient
of all children enrolled in the first grade and the of-age (6-11) population. This is notably
higher in the south, perhaps because a greater proportion of children were enrolled over-age
in the first grade.
The primary NER indicates the proportion of children of age who were enrolled at primary
level. This shows more than ninety percent enrolment in the south, and less than eighty
percent in the north; again with a sizeable gender disparity in the north only. The difference
between NER and NAR patterns between north and south is largely due to the very dramatic
recent increases in enrolment in the north. Indeed, the primary NAR is found to have
increase threefold since 2004 from a quarter to three quarters in Savelugu-Nanton. The NER
of course takes account of pupils who had enrolled up to six or so years before 2009. The
primary GER is also higher in the south than in the north but the NER/GER difference is
similar, indicating no large difference in the prevalence of over-age enrolment across the
primary education phase between north and south.
Despite a high proportion of pupils being admitted late to primary school in the south, more
than nine in ten pupils of primary school going age were found to be in school so that it may
be inferred that late-enrolment is the main cause of children being overage (rather than drop-
out and re-enrolment). It may be inferred that in the south, at least nine out of ten children
ever attend primary school. For the north, the figure for primary school appears to be around
eight in ten.

Access, Transitions and Equity in Education in Ghana: Researching Practice, Problems and Policy
15
Table 5: Primary Education Enrolment Indicators 2008/9
District Indicator Girls Boys Total
Mfantesman GER 0.968 0.984 0.952
NER 0.925 0.929 0.921
GAR 0.995 1.001 0.989
NAR 0.690 0.690 0.690
Savelugu-Nanton GER 0.832 0.921 0.738
NER 0.781 0.857 0.699
GAR 0.885 0.965 0.805
NAR 0.743 0.818 0.668
Source: EMIS data 2008/9
Ampiah and Adu-Yeboah (2009) conducted interviews with never enrolled children in both
CREATE districts. Their findings suggest that, among their sample, poverty was a primary
reason for never-enrolment. The reasons children gave were often connected to economic
activities (farming and fishing), and their implications for child work and affordability of
schooling. In poor households, pressing economic and basic human needs seemed to compel
parents to opt for child labour rather than education, while the indirect costs of schooling play
an important part in this outcome. In more literate communities, most of the male
parents/guardians in the study were found to have received basic education and to attach
importance to education. Nevertheless, data showed that some children in such families had
also never been enrolled in school, often as a result of family status and events including
single parenthood, remarriage and/or large family size. One of the family background
characteristics found to be important in the North was the prevalence of fosterage, considered
further in section 5.4 and in Rolleston (2011). Examples of the stories of never-enrolled
children from Mfantesman district are summarised in Box 2.
4.3 Zones 2 and 5: Dropping Out
CREATE exclusion zone 2 comprises primary school drop-outs and zone 5 JHS drop-outs.
Between 1991 and 2006 the proportion of children aged 5-17 who were currently attending
school rose from 71 to 81% with rates being substantially lower in the Northern regions,
according to GLSS data. As a percentage of all children in the age range, drop-out affected
between 1 and 10% of the age group according to region, with no clear trend over the time
period. The national figure remained constant over the period at around 6%. Although current
attendance figures are lower for the Northern regions, because ever-attendance is lower in
these regions they represent similar proportions of those who had ever been to school, so that
in the North retention is not dissimilar from the national picture.
The Ghana Core Welfare Indicators Questionnaire (CWIQ) (2003) included questions on
attendance at school and on reasons for non-attendance. Among drop-outs nationally, the
most common reasons for not attending were that school was considered “useless” (27%) or
“too costly” (25%). Modelling exercises using GLSS data (see Rolleston 2009) show that
current attendance (retention) was associated with similar factors to ever-attendance to a
considerable extent, including age and gender; but that children‟s work was found to be more
strongly linked to retention/drop-out than to ever-attendance, as was household size and
composition – particularly the number of young children in the household. However,
household welfare and occupational status were found to be more important in determining
ever-attendance than retention and regional, urban/rural and time effects were much smaller

Access, Transitions and Equity in Education in Ghana: Researching Practice, Problems and Policy
16
for retention. This suggests that the most obvious drivers of exclusion – poverty and the
availability of schooling affect initial enrolment most strongly, while retention depends more
on child characteristics and the household‟s needs for child labour including in relation to
care for younger children. The implications for policy on improving access are profound – it
may be necessary to introduce policies that can have direct or indirect impact on reducing
economic survival needs of poor households, and link this to improved access to quality
education that provides skills that can progressively lift the poor out of poverty over time.
Qualitative work in Mfantesman district conducted by Ananga (see Ananga 2011) identified a
number of forms of temporary and permanent drop-out on the basis of interview data,
shedding light on the complexity of the push and pull factors resulting in incomplete
schooling and their contexts. These are summarised in Box 3. Ananga‟s work gathered
biographical data through interviews with children and their carers; and provides an in-depth
analysis of critical evens which play a role both in dropping-out and in returning to school.

Access, Transitions and Equity in Education in Ghana: Researching Practice, Problems and Policy
17
Box 2: Stories of never-enrolled children in Mfantesman district
Source: Ampiah and Adu-Yeboah (2009)
In addition to issues of poverty, children‟s work and the costs of schooling, Ananga
emphasises the role played by schools themselves in the processes of excluding and including
children. Teacher practice and behaviour, including absenteeism and apparent lack of
support for children with irregular attendance, are found to be linked to drop-out. For
example, children in the study explained:
The story of Kobina Armah, 14 years old
Kobina Armah (14) never enrolled in school because according to him, his parents said he was not
interested in schooling, which is why they did not send him. Again, he thinks that at first, school
fees were high, but fishing was lucrative so everybody was more interested in fishing than in
schooling. His mother had three children from a previous marriage before she married his father
with whom she has 3 more children. Only his two youngest siblings (ages 9 and 12) are in school
in KG and primary 2 respectively. Kobina always goes fishing, except on days when the sea is
rough. His story is similar to that of many of the boys of his age. He sleeps with the older
fishermen at the beach (in a hut) so that when they are going fishing at midnight, they would take
him along. According to him, his share of the fish is always given to his mother who smokes and
sells them. Sometimes, when fishing is not lucrative in his town he migrates to other towns and
settles there for a month or more. In this case, he sells the fish himself and sends some of the
money to his mother. Kobina knows that without education, there would be no job for him in
future, and that an uneducated man is not respected. He cited an example of an uneducated elderly
man who comes to the beach often to beg for fish, food or money, and described the impolite way
he is treated as undeserving for his age. According to him, if the man had been educated this
wouldn‟t have happened to him. Some of Kobina‟s relatives who are educated have contacted him
and the school about going to school, and because fishing is no more lucrative, he claimed that he
would like to be in school. He showed a positive opinion about schooling and learning. However,
he indicated that his mother did not have money to send him to school. As such, although he
expresses the desire to go to school, he also gives a hopeless picture of his mother‟s poverty and
her inability to send him to school.
The story of Donkor, 9 years old
Donkor (9) has never been to school. She lives with her foster mother whose 6 children have all
left/completed school, though it is not known what level of education they attained. She does not
know whether her foster mother has ever been to school. She said her foster mother decided that
she should not go to school. She does not go because she does the cooking in the house and also
assists her mother in smoking fish to sell. As to why her other siblings go to school, she said they
are older so they no longer assist their mother in cooking. Donkor spends the day doing chores
such as sweeping, fetching water, cooking and smoking fish. Asked who she spends most of her
time with, she said her foster mother. She does not earn any money from the commercial activity
she engages in with her mother. She cannot imagine what happens in school. However, she
remembers seeing a pupil caned severely at a school. She knows that if she doesn‟t go to school,
she will not be able to speak English. But apart from this, she does not know the effect that lack of
education will have on her. When asked whether she would like to go to school, she said no, and
explained that her mother would not allow her to, and that she would punish her if she left her
alone to cook and smoke the fish. According to her, her grandmother has spoken to her about
going to school and has promised to send her when she reaches around 12 years. Apart from that,
no one else in her household or the school has ever had contact with a school about her enrolment.
With regard to her opinion about schooling, she said she thinks she would be happy if she went to
school, and yet she did not like what she heard about school, and does not think she would feel safe
at school.

Access, Transitions and Equity in Education in Ghana: Researching Practice, Problems and Policy
18
“There was no teacher for our class, so teachers from other classes came to teach us;
but there were times when we went to school and for three days, no teacher came to
our class to teach – sometimes other teachers came to cane us for making a noise ... It
is just a waste of time and it is better to stay at home and do something else.”
and
“When I went back to school, I didn‟t understand most of the things being taught … I
am just in the class … the teacher teaches over you as if you are not there … When I
couldn‟t take it any longer, I stopped again.”
Ananga considers the importance of actions which may be taken by teachers and schools to
improve retention, including better monitoring, fuller community participation and liaison,
improved „child-friendliness‟ and pedagogical reform. In relation to pedagogy, Ananga
indicates that „multi-grade‟ teaching methods and alternative modes of education provision
which recognise the exigencies of local livelihoods; while fairly seldom employed in Ghana,
have the potential to better recognise the wide range of children‟s ages and educational
experiences within grades as a result of late enrolment and periods of drop-out.
Other CREATE research outputs also addressed the causes of dropping-out, including work
on bullying in schools (Dunne et al 2010), which is found to be correlated with poor
attendance at school, a pre-cursor of drop-out; and work on teacher attitudes and behaviours
In their qualitative study of schools in the Winneba municipality, Alhasan and Adzahlie-
Mensah (2010) found that teachers may be considered to play an important role – potentially
in reducing drop-out, but often in failing to do so. They cite teacher absenteeism, lateness,
misuse of instructional time, use of corporal punishment, poor record-keeping and failure to
support pupils at risk as contributors to drop-out; and refer to the implicit assumption of
within grade pupil homogeneity in the monograde curriculum and organisational structure.
They also consider inadequacies of head teacher supervision and make a number of
recommendations in relation to ways in which schools might more fully discharge a
responsibility to retain and support pupils susceptible to dropping-out. Overall, the evidence
suggests that teachers may be part of the problem and potentially part of the solution to
meaningful access, and yet policies in the past have not targeted teachers as agents of change
in educational access.
CREATE interviews with teachers as part of the ComSS baseline study in the two case-study
districts included questions on reasons for dropping out. The most common reasons cited for
drop-out among boys in Mfantesman district are summarised in Table 5. Teachers perceived
poverty and child labour to be key, along with lack of parental care and poor academic
performance. When asked about girls‟ drop-out, pregnancy was also cited as a key reason.
Teachers did not typically respond, however, that school-based factors such as poor teacher
attendance and use of corporal punishment may also play a role in drop out (see Alhasan and
Adzahlie- Mensah, 2010). In a qualitative study of drop-out in Savelugu-Nanton district,
Ampiah and Adu-Yeboah (2009) examined the final „critical events‟ leading to drop-out.
These are summarised in Table 6. In this study, the need for child labour and the impact of
poverty (on affordability of schooling) emerged overwhelmingly as important precursors to
drop-out. These are clearly inter-related. In the case of girls, parental mortality and fosterage
were found to be important; linked to the traditional domestic roles played by girls in the
district.

Access, Transitions and Equity in Education in Ghana: Researching Practice, Problems and Policy
19
Box 3: Typology of temporary and permanent forms of drop-out in Southern Ghana
Source: Ananga (2010)
Temporary: Sporadic Dropout
For children who have stopped attending school
owing to temporary economic needs, dropout is
a temporary withdrawal from school in the short
term. This can be called „sporadic dropout‟. In
reality, this type of dropout is marked by
intermittent nonattendance. Such temporary
dropout cases can include those at risk of
dropping out permanently and those silently
excluded and learning little. Low- levels of
attendance, where 25% of more of learning time
is lost is a kind of drop out even if the child
remains registered and nominally enrolled. If
linked to temporary economic needs children
will return to school when these ease.
Temporary: Event Dropout
„Event dropout‟ is a response to one or more critical
events in children‟s lives either at school, at home or
both. This type of dropout lasts for about a year. Events
outside school that can lead to dropout include migration
of a child‟s family or the death of one or both parents, or
other household shocks including sickness and
unemployment. Events in school can include conflict
between a child and teachers which can result in
temporary dropout. For example children who refused to
conform to corporal punishment in some case study
schools were given a stern warning not to return to class
until the terms of the punishment had been met. Often
dropout is the result of a combination of two or more
factors which trigger decisions to stop attending for a
period.
Temporary: Long-term Dropout
Some temporary dropout involves prolonged periods out
of school for some children. As a result they acquire
„overage‟ status if they do return to school. Some
children who have been out of school for periods lasting
between 2 and 4 academic years, are as a result older
than 12, the nominal maximum for primary schooling.
These “overage cohorts” have difficulties in completing
primary schooling and may be excluded by school
registration policies. This kind of falling out of a cohort
group can be called „long-term dropout‟. Despite being
over age many of those interviewed hoped to return to
school and in that sense were not permanent drop outs.
Permanent: ‘Unsettled Dropout’
„Unsettled dropouts‟ are generally older
children who do not attend school and are
unlikely to return to complete the cycle. The
doubts these children have about going back to
school are sufficient to discourage them. Often
they have feelings of embarrassment at being
too old for a given grade and of having to attend
class with younger children. They may also
have doubts about what benefits they would
gain from going back to school especially if
they think their chances of graduating are very
low
Permanent: Settled Dropout
A fifth group of dropouts exist where children are settled in an occupation or livelihood. These children are
working directly or learning a trade. Their decision not to go back to school is a reflection of their perception
of the value of more education. Children for whom „dropout‟ is permanent are frequently overage when they
drop out of primary school.

Access, Transitions and Equity in Education in Ghana: Researching Practice, Problems and Policy
20
Table 6: Reasons given by teachers for boys dropping out of school (Mfantesman
district)
Reason 1 Reason 2 Reason 3
Abonko Truancy due to lack of
parental control
Poverty/child labour Poor academic performance
Akobima Migration Poverty Poor academic performance
Holiness Poverty/child labour Truancy Poor academic performance
Kormantse Poverty/child labour Lack of parental care Teacher too hard on them
BMK
Nurudeen
Lack of parental control Lack of interest in school –
work for money
Distance covered to school
Narkwa Poverty/child labour Lack of parental care Transfer
Saltpond Poverty/child labour Transfer Poor academic performance
Smerbu Lack of school fees Lack of table and chair Lack of books/others
Source: CommSS data
CommSS data provide information on whether a child dropped-out of school at any point
during the survey period (2007-2010). Table 7 shows the mean values of relevant education
and background indicators for drop-outs and non-drop-outs alongside the results of a t-test for
the difference between mean values. The results show that on average, pupils who later
dropped-out had performed less well in English and maths and had attended less frequently
and lived in poorer households and in households with lower levels of caregiver literacy.
These findings appear to be largely consistent with teachers‟ and parents‟ perceptions. Drop-
outs were also more overage for their grade. Differences were not significant, however, in
relation to hours spent working or distance travelled to school.
Table 8 compares boys and girls separately by drop-out status on their English test results and
overage status; for those pupils for whom and English test result for 2007/8 was available
only. Boys who later dropped out were almost one year more over-age than those who did
not. Girls who dropped out were around three quarters of a year more over-age. Both boys
and girls who dropped out scored around ten percentage points lower on the 2007/8 English
test.
Table 7: Final critical events, reasons or decisions cited for dropping out of school
Source: Ampiah and Adu-Yeboah (2009)

Access, Transitions and Equity in Education in Ghana: Researching Practice, Problems and Policy
21
Table 8: Comparison of education and background indicators by drop-out status
(ComSS)
Non Drop-
Outs
Drop-Outs T-test
sig at 5%
English Test Score 2007/8 (%) 45.5 35.1 Yes
Maths Test Score 2007/8 (%) 47.0 41.0 Yes
Attendance 2007/8 (%) 83.0 73.4 Yes
Household Portable Asset Score1 -0.26 0.09 Yes
Distance to School (km) 1.55 1.57 No
Hours Spent Working 1.89 2.25 No
Caregiver Literacy Score 8.82 6.67 Yes
Years Overage for Grade 4.03 5.14 Yes
Source: Computed from ComSS data
Table 9: Achievement in English by drop-out status
Variable Observations Mean Std. Dev.
Boys Continuing
English test 596 46.5302 24.96244
Years overage 1197 3.835422 2.018431
Boys Dropped-out
English test 70 35.87143 22.07164
Years overage 146 4.636986 2.283011
Girls Continuing
English test 431 44.16937 24.68954
Years overage 827 3.603386 1.853571
Girls Dropped-out
English test 38 33.63158 24.24249
Years overage 99 4.363636 2.331919
Source: Computed from ComSS data
One striking feature of the evolution of primary enrolments in Ghana is the persistent pattern
of grade transition (and by-grade drop-out) rates observed in using EMIS data. Although
enrolments have increased significantly, this has not been accompanied by improved rates of
transition through the grades, consistent with the static rates of drop-out found in GLSS data.
As Figure 6 shows, dropout between grades 1 and 2 may have slightly increased, while
between other grades it has changed little. In effect, the basic primary grade progression
structure has not altered very much since the 1980s. Absolute numbers of pupils have clearly
increased dramatically, so that, it may be expected that a greater number of more
disadvantaged pupils was attending in 2008 than in 1980, likely a part of the explanation for
apparently rising drop-out in grade 1.
1 Calculated using principal components analysis using indicators for portable assets e.g. television, refrigerator.

Access, Transitions and Equity in Education in Ghana: Researching Practice, Problems and Policy
22
Figure 6: Evolution of Primary Enrolments 1980-2008
Source: EMIS data
4.4 Transition, progression and completion (including Zone 4)
While increases in ever enrolment and attendance at school have been steady and have
favoured disadvantaged regions in Ghana since 1991, access to higher levels of education,
within the basic cycle remains limited and strongly favours advantaged groups.
Figure 7 shows a cross-sectional view of progression in 2005, indicating that while 90% of
children gained initial entry to school, only around two-thirds completed the primary stage.
Of these, most appear to progress to JHS, but only around a half of all children in total
complete it. Considerably fewer are entered for and pass the end of basic education
examination, the BECE, which may be considered an indicator of realised basic education
skills. According to a view of access to basic education which incorporates a notion of
completion to examination standard, as many as two-thirds of Ghanaian children may be
considered excluded.
Figure 7: Proportions of Pupils in Ghana Reaching Stages of Progress in Ghana
Sources: EMIS (2006) and GLSS 5 (2005/6)

Access, Transitions and Equity in Education in Ghana: Researching Practice, Problems and Policy
23
4.4.1 Zone 4: Primary Completion and Transition to JHS
Overall, at the national level, completion rates for the primary phase of education did not
improve between 1991 and 2006. According to GLSS data, in 2006, 73% of 17 year olds had
completed primary school, compared with 74% in 1991. Table 9 shows the percentages of
children aged 13 and 17 who had attended school that had completed primary school in 2006.
If it is assumed that the vast majority of children who will complete primary school will do so
by age 17, then the data suggest that between one tenth and two fifths of children who had
ever attended school in Ghana never completed their primary education, varying notably by
region with considerable disadvantage in the North. At age 13, figures are markedly lower,
indicating a high prevalence of over-age enrolment in all regions.
Table 10: Primary completion rates by age and region (2006)
Age 13 Age 17
Primary Completion
Western 0.26 0.80
Central 0.30 0.75
Greater Accra 0.46 0.84
Eastern 0.28 0.79
Volta 0.33 0.87
Ashanti 0.35 0.87
Brong Ahafo 0.26 0.66
Northern 0.10 0.31
Upper West 0.10 0.43
Upper East 0.15 0.46
Total 0.28 0.73
Source: Computed from GLSS 5
CREATE exclusion zone 4 comprises pupils who complete primary education but do not
progress to JHS. As shown in Figure 7, this zone affects relatively few children in Ghana as
a whole. Table 10 reports in detail the transition to JHS rates for primary completers from
1999 to 2008 using UIS data taken from EMIS. Figures show no particular trend of change,
but transition to JHS is found to be high, at 92.7% in 2007. It may be inferred that completing
primary school is an important milestone in a child‟s education career in Ghana, which, if
reached, leads to transition to lower-secondary school in the vast majority of cases. It is
important to remember that basic education in Ghana comprises primary and JHS, with no
selection examination between the two. This could explain the high transition from primary
to JHS.
Table 11: Primary-secondary transition rates 1999-2008
Year 1999 2000 2001 2002 2003 2004 2005 2006 2007 2008
Transition from primary
to lower secondary (%) 92.6 82.1 90.0 86.8 ... ... ... ... 92.7 ...
Source: UNESCO Institute for Statistics (UIS)
Table 11 shows the enrolment indicators taken from EMIS and from which inferences about
ever-enrolment at JHS level may be made for the two CREATE districts for 2008/9. Patterns
in the two districts are somewhat different. The JHS NAR indicates the proportion of
children of the „correct‟ age who were enrolled in grade 7 (or JHS 1). The following
differences are notable:
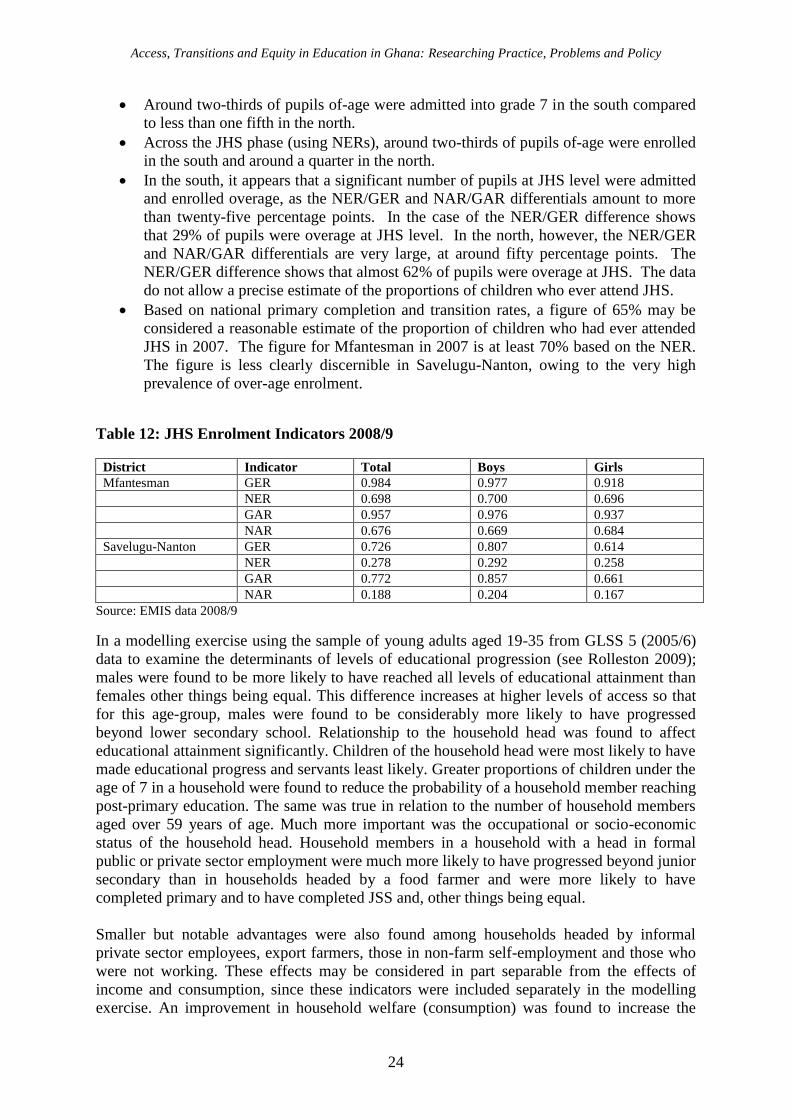
Access, Transitions and Equity in Education in Ghana: Researching Practice, Problems and Policy
24
Around two-thirds of pupils of-age were admitted into grade 7 in the south compared
to less than one fifth in the north.
Across the JHS phase (using NERs), around two-thirds of pupils of-age were enrolled
in the south and around a quarter in the north.
In the south, it appears that a significant number of pupils at JHS level were admitted
and enrolled overage, as the NER/GER and NAR/GAR differentials amount to more
than twenty-five percentage points. In the case of the NER/GER difference shows
that 29% of pupils were overage at JHS level. In the north, however, the NER/GER
and NAR/GAR differentials are very large, at around fifty percentage points. The
NER/GER difference shows that almost 62% of pupils were overage at JHS. The data
do not allow a precise estimate of the proportions of children who ever attend JHS.
Based on national primary completion and transition rates, a figure of 65% may be
considered a reasonable estimate of the proportion of children who had ever attended
JHS in 2007. The figure for Mfantesman in 2007 is at least 70% based on the NER.
The figure is less clearly discernible in Savelugu-Nanton, owing to the very high
prevalence of over-age enrolment.
Table 12: JHS Enrolment Indicators 2008/9
District Indicator Total Boys Girls
Mfantesman GER 0.984 0.977 0.918
NER 0.698 0.700 0.696
GAR 0.957 0.976 0.937
NAR 0.676 0.669 0.684
Savelugu-Nanton GER 0.726 0.807 0.614
NER 0.278 0.292 0.258
GAR 0.772 0.857 0.661
NAR 0.188 0.204 0.167
Source: EMIS data 2008/9
In a modelling exercise using the sample of young adults aged 19-35 from GLSS 5 (2005/6)
data to examine the determinants of levels of educational progression (see Rolleston 2009);
males were found to be more likely to have reached all levels of educational attainment than
females other things being equal. This difference increases at higher levels of access so that
for this age-group, males were found to be considerably more likely to have progressed
beyond lower secondary school. Relationship to the household head was found to affect
educational attainment significantly. Children of the household head were most likely to have
made educational progress and servants least likely. Greater proportions of children under the
age of 7 in a household were found to reduce the probability of a household member reaching
post-primary education. The same was true in relation to the number of household members
aged over 59 years of age. Much more important was the occupational or socio-economic
status of the household head. Household members in a household with a head in formal
public or private sector employment were much more likely to have progressed beyond junior
secondary than in households headed by a food farmer and were more likely to have
completed primary and to have completed JSS and, other things being equal.
Smaller but notable advantages were also found among households headed by informal
private sector employees, export farmers, those in non-farm self-employment and those who
were not working. These effects may be considered in part separable from the effects of
income and consumption, since these indicators were included separately in the modelling
exercise. An improvement in household welfare (consumption) was found to increase the

Access, Transitions and Equity in Education in Ghana: Researching Practice, Problems and Policy
25
likelihood that a household member had progressed educationally, particularly to the end of
lower secondary school or beyond, being associated with a notably greater probability of
accessing post-lower secondary education. Urban residence was also found to positively
affect the probability of progression to the end of lower secondary school and beyond.
Regional effects were found in some cases to be extremely large. Those in the Ashanti
region, for example were found to be considerably more likely than those in the North to
have accessed or completed primary school. A similar pattern is observed for lower
secondary schooling. Other regions with strong positive effects included the Western,
Central, Brong Ahafo and Greater Accra regions. It is notable that with regard to educational
access beyond junior secondary schooling, regional effects are smaller. This may suggest that
at these levels of schooling, the effect of regional level supply is balanced by very large
effects of affordability and socio-economic factors, since welfare effects increase
substantially at higher levels of access.
When the modelling exercise was repeated for individual survey rounds (from GLSS 3 in
1991/2), results showed decreasing regional effects over time, perhaps due to improvements
in schooling provision, especially in the less advantaged northern regions. Consequently,
school availability issues appear to be giving way to affordability issues as the drivers of
exclusion.
4.4.2 JHS Completion
With regard to lower secondary school completion, rates remained static over the period
1991-2006 according to GLSS data, with around half having completed by age 20 in both
1991 and 2006. The figure for 2008/9 according to EMIS is consistent with this pattern of no
change, at 47.8%. Table 12 shows JHS completion rates at ages 15 and 20 for all Ghana in
2005/6. By age 20, between a quarter (in the North) and seven tenths (in Accra) had
completed, while at age 15 the figure was 15% or less, except in Accra. JHS completion was
very low in the North and all regions show a high prevalence of over-age completion.
Table 13: JHS completion rates by age and region (2006)
Age 15 Age 20
Western 0.08 0.57
Central 0.09 0.58
Greater Accra 0.29 0.70
Eastern 0.04 0.50
Volta 0.15 0.56
Ashanti 0.12 0.66
Brong Ahafo 0.06 0.53
Northern 0.02 0.27
Upper West 0.04 0.23
Upper East 0.01 0.24
Total 0.11 0.53
Source: Computed from GLSS 5
Modelling results using GLSS data suggest that completing JHS, when compared to having
completed primary education as the highest completed level, is associated with male gender,
higher household welfare (consumption), higher parental education and residence in southern
regions in GLSS 5. However, the gender effect has declined notably since GLSS 3.
Access, Transitions and Equity in Education in Ghana: Researching Practice, Problems and Policy
26
4.4.3: Post-basic Transition
The end of basic education marks a key transition in education in Ghana, since it is post-basic
education which is associated with substantial and increasing economic returns to schooling
and with selection into more lucrative occupations, especially wage-employment in both the
public and private sectors. The transition, however, benefits a privileged few. Modelling
results (see Rolleston 2009) which examine the characteristics of JHS completers in the 25-
35 age-group who do not progress with those who had completed a level of post-basic
education show that the effect of male gender is large, but also declining over time, while
urban location, household welfare and parents‟ education and occupations have dramatic
effects. Regional effects (net of other factors) are found to be in decline so that, by GLSS 5,
those in northern regions are not found to be disadvantaged by location alone, perhaps due to
increasing physical access owing to supply expansion. But nonetheless, the concentration of
poverty in the north and of low adult education and food-farming as an occupation are major
causes of low progression beyond the basic phase in those regions.
4.5: Zones 3 and 6: Meaningful Learning
Children who meet the challenge of initial enrolment and who continue in school without
dropping out may nonetheless suffer various forms of „silent exclusion‟ resulting in poor
achievement and progress. CREATE zone 3 comprises pupils suffering silent exclusion at
primary level and zone 6 comprises those at JHS level. While poor attainment may be
considered a consequence of silent exclusion, poor attendance may be a consequence but is at
the same time a cause, since poor attendance is likely to contribute to poor engagement with
schooling. Both attendance and achievement may be examined in the CREATE case-study
districts using ComSS data. Silent exclusion is likely to be associated with the characteristics
of (i) pupils (ii) their households and communities and (iii) the education provision they have
access to. An important factor which may lead to and result from poor attendance and
performance and to incomplete schooling is grade repetition. However this was found to be
relatively rare in Ghana and is not found to have a significant effect on outcomes. However,
modelling exercises included a measure of over-age enrolment, which in a small proportion
of cases is linked to repetition. This indicator is strongly linked to achievement as considered
below.
4.5.1 Attendance and Absence from School
Attendance data for the period of two academic years – 2007/8 and 2008/9 were available for
a maximum of 2418 pupils who were observed throughout the study. Table 13 reports the
annual average attendance rates for these pupils by gender and district over the period. It
shows that attendance rates are very similar for boys and for girls and in the northern and
southern sites. Average attendance overall was found to be approximately 82 per cent,
equating to slightly less than one day of absence per week or almost twenty percent of
learning time. When the data are examined at school level, wider variation is apparent.
Rates are found to vary from approximately 92 per cent at an urban JHS in the South and an
urban Roman Catholic JHS in the North to 69 per cent at a remote rural JHS in the North.
The difference equates to more than one day a week of schooling.

Access, Transitions and Equity in Education in Ghana: Researching Practice, Problems and Policy
27
Table 14: Attendance Rates by District and Gender 2007-9
Source: ComSS data
To examine the factors associated with attendance at or absence from school, a number of
regression models were fitted. Table 14 shows the results of three models to estimate the
correlates of absence from school in 2007/8 – an ordinary least squares model, which takes
no account of circuit and school-level factors, a circuit fixed effects (CFE) and a school fixed
effects model (SFE). The last two models compare attendance within sample circuits and
schools respectively to control for unobserved community and school factors. The dependent
variable was transformed to produce a variable with a normal distribution by taking the
natural logarithm of the proportion of school days on which a pupil was absent. Results are
reported for 2007/8 owing to the larger sample size for that year, but are similar for 2008/9.
The co-efficients on explanatory variables may be interpreted in terms of percentage effects
on the proportion of absence of a one unit change in the independent variable concerned. The
models use data collected at schools only, owing to the smaller size of the household sample,
so do not account for the full range of determining factors relating to absence at household
level.
In the OLS model which pools pupils across all schools and circuits (column 1), the
following are worth noting:
Male gender is associated with higher absence levels, greater age is associated with
lower absence levels and the number of years by which a pupil is overage is positively
associated with absence from school.
The interaction effect between age and overage status is also positive, indicating that
being overage is associated with greater absence levels for older pupils. All
associations are significant at the 1 or 5 percent levels.
Columns 2 and 3 adjust for the (fixed) effects of schools and circuits. In these
models, the associations with gender, age and overage status are not altered
substantially. Overall, male gender is associated with a 12 to 15 percent increase in
absence2, a year of age with a 15-17 percent decrease in absence and a year of being
overage with a 7-12 percent increase. The mean level of absence is around 18 percent
so that these effects appear to be relatively small; for example a 10 percent increase in
absence equates to just less than 2 percentage points. However, taking into account
the interaction effect between age and overage status, larger differences may be 2 The ComSS sample selected children in school who are more often boys. Owing to positive selection effects
with regard to ever-enrolment for boys, the sample of girls may be more advantaged since more disadvantaged
girls do not attend school.
District Female Male Total
Mfantseman Mean 82.3 80.7 81.4
S.D. 15.2 14.9 15.1
N 449 551 1000
Savelugu-Nanton Mean 83.3 81.8 82.4
S.D. 14.0 13.8 13.8
N 509 909 1418
Total Mean 82.9 81.4 82.0
S.D. 14.5 14.2 14.4
N 958 1460 2418

Access, Transitions and Equity in Education in Ghana: Researching Practice, Problems and Policy
28
observed. For example, consider a pupil aged 12 who is 3 years overage. The effect
of being 3 years overage is a 21-36 percent increase in absence (depending on
specification) but the interaction effect, using the lowest value for this co-efficient is
an additional 12*3*0.005 = 18%. In combination with the overage effect, the result is
an absence rate for the overage pupil which is at least 39 per cent higher than that of a
pupil in the correct age for his or her grade at age 12.
Concerning the reported circuit effects in column 2, Circuit F, a rural area in the South with
the highest predicted absence rates is used as the reference circuit. Most other circuits have a
negative association with absence equivalent to lowering it by 20-40 percent when compared
to Circuit F, while the association in Circuit A (a town in the South and the most advantaged
site), is larger, reducing it compared to the reference circuit by 60 percent. When „school
effects‟ were estimated (not reported) using the school with the highest predicted absence as
the reference category (a rural JHS in the North); out of 28 schools, 25 had significant
negative effects on absence equivalent to decreasing absence by 50 percent or more. The two
largest effects were for a Methodist primary in the South and a private primary school in the
North.
In order to better model the causal determination of absence from school, models were fitted
to include data collected at household level for a sub-sample of the tracked children (60% of
the total). The available indicators in the data are summarised below in Table 15. It was
hypothesised that household education levels and economic status may affect a pupil‟s
attendance and absence through a variety of channels, including through decisions relating to
work versus schooling, the affordability of schooling and household preferences for
education. Available variables were grouped into indicators of household education and the
household economy and additional indicators of the child‟s status which may be relevant for
school attendance. Modelling results are reported in Table 16.

Access, Transitions and Equity in Education in Ghana: Researching Practice, Problems and Policy
29
Table 15: Absence from School 2007/8
VARIABLES OLS Circuit Fixed Effects School Fixed Effects
Sex (male) 0.152 0.123 0.140
(3.78)*** (3.10)*** (3.69)***
Age -0.158 -0.155 -0.169
(-12.77)*** (-12.55)*** (-12.62)***
Years overage 0.077 0.079 0.124
(2.14)** (2.19)** (3.47)***
Age-overage interaction 0.009 0.009 0.007
(3.73)*** (3.68)*** (3.07)***
Circuit A (South urban) -0.617
(-8.16)***
Circuit B (South rural) -0.227
(-2.68)***
Circuit: C (North peri-urban) -0.337
(-4.82)***
Circuit: D (North peri-urban) -0.328
(-4.32)***
Circuit: E (North rural) -0.381
(-3.62)***
Constant -0.955 -0.638 -0.888
(-6.33)*** (-4.05)*** (-5.69)***
Observations 2285 2285 2285
R-squared 0.13 0.15 0.12
Number of schools/circuits 5 29
t-statistics in parentheses
*** p<0.01, ** p<0.05, * p<0.1
Table 16: Household and Child Level Characteristics in Household ComSS Data
Child Characteristics Household Economy Household Education
Biological or fostered child Distance to school Caregiver‟s literacy level
Number of years of pre-schooling Distance to source of water Source of light available for
homework
Age at entry to school Engaged in farming
Receiving private tuition at home Engaged in casual labour
Growth stunting Engaged in wage employment
Running a business
Engaged in collection/foraging
In receipt of charity/safety net
In receipt of remittances
Household assets

Access, Transitions and Equity in Education in Ghana: Researching Practice, Problems and Policy
30
Table 17: Absence from School 2007/8
VARIABLES OLS
Household
Education
CFE
Household
Education
SFE Household
Education
OLS
Household
Economy
CFE
Household
Economy
SFE Household
Economy
OLS Both (8) (9)
Sex (Male) 0.107 0.098 0.149 0.111 0.108 0.151 0.101 0.098 0.144
(1.97)** (1.80)* (2.88)*** (2.02)** (1.97)** (2.89)*** (1.86)* (1.81)* (2.76)***
Age -0.103 -0.103 -0.145 -0.112 -0.115 -0.143 -0.099 -0.101 -0.141
(-5.80)*** (-5.77)*** (-7.34)*** (-6.39)*** (-6.52)*** (-7.29)*** (-5.54)*** (-5.61)*** (-7.00)***
Years overage 0.033 0.028 0.091 0.097 0.081 0.128 0.040 0.031 0.096
(0.64) (0.53) (1.78)* (1.88)* (1.54) (2.48)** (0.78) (0.59) (1.85)*
Age-overage (Int.) 0.007 0.007 0.006 0.005 0.006 0.004 0.006 0.007 0.006
(1.86)* (1.96)** (1.74)* (1.32) (1.56) (1.30) (1.73)* (1.88)* (1.59)
Distance (school) 0.025 0.024 0.027 0.031 0.031 0.030 0.026 0.026 0.026
(1.83)* (1.77)* (1.97)** (2.31)** (2.28)** (2.19)** (1.91)* (1.89)* (1.89)*
Distance (water) 0.062 0.048 0.059 0.063 0.051 0.054
(2.87)*** (2.09)** (2.57)** (2.90)*** (2.22)** (2.34)**
Farming 0.173 0.133 0.065 0.183 0.123 0.055
(2.69)*** (1.83)* (0.88) (2.86)*** (1.70)* (0.75)
Household assets -0.042 -0.040 -0.044 -0.021 -0.021 -0.020
(-2.33)** (-2.12)** (-2.47)** (-1.11) (-1.01) (-0.99)
Age at entry 0.057 0.063 0.049 0.056 0.058 0.048
(3.86)*** (4.13)*** (3.20)*** (3.77)*** (3.79)*** (3.14)***
Private tuition -0.145 -0.131 -0.029 -0.125 -0.120 -0.020
(-4.03)*** (-3.46)*** (-0.73) (-3.38)*** (-3.15)*** (-0.51)
Light source -0.163 -0.154 -0.214 -0.129 -0.127 -0.184
(-2.77)*** (-2.63)*** (-3.77)*** (-2.07)** (-2.02)** (-3.00)***
Constant -1.577 -1.440 -1.266 -1.681 -1.403 -1.298 -1.989 -1.727 -1.502
(-6.27)*** (-5.48)*** (-4.73)*** (-7.43)*** (-5.71)*** (-5.32)*** (-7.27)*** (-5.97)*** (-5.26)***
Observations 1129 1129 1129 1144 1144 1144 1128 1128 1128
R-squared 0.13 0.14 0.14 0.13 0.14 0.13 0.15 0.16 0.15
Number of schools 29 29 29
t-statistics in parentheses
*** p<0.01, ** p<0.05, * p<0.1

Access, Transitions and Equity in Education in Ghana: Researching Practice, Problems and Policy
31
The following emerge as important findings:
No significant effects on absence were found in relation to child fosterage or pre-
school education.
Children who entered school later were found to have higher absence rates, with rates
rising by 5-7 percent per additional year of late entry. Late entry is not the only
reason for a pupil being over-age (others include repetition and periods of absence),
so that with the inclusion of this variable, overage and age-overage interaction effects
were reduced but remained significant. The relatively small separate effect of late-
entry is nonetheless fairly constant across the models and years.
The gender, age and age/grade effects were found to be fairly robust to model
specification and also to year of data employed (results are shown for 2007/8). In the
case of (male) gender, the effect is very robust, increasing absence by 14-15 percent
in all models regardless of the set of controls included. This indicates that the effect
of gender appears to be very much an individual level effect. There are, however,
sample-selection issues as, especially in the North, a higher proportion of boys attend
school so that the group of boys may be considered potentially more disadvantaged
than the girls, with the most disadvantaged girls being more likely to have never-
enrolled.
The effect of an additional year of age is to reduce absence by 8-15 percent with
household controls included and with school fixed effects, significant at the 1 percent
level. An additional year of overage status increases absence by 6-13 percent and the
size of the interaction effect is similar to that in the models without household
controls, being reduced only slightly. Taking the overage and interaction effects
together in the presence of all controls, the individual level effect may be summarised
as an increase in absence of 7-10 percent per year overage plus an additional 2.5-7.5
percent per year depending on age in the age-range 6-15.
The receipt of private tuition outside the home is associated with a reduction in absence rates
in the OLS and CFE models, but not in the SFE models, indicating that the receipt of private
tuition is possibly clustered at school level. This was confirmed by examining the data.
While in most schools few children or none received such tuition, in a few most received it,
and these were typically school with slightly lower absence rates.
Anthropometric data were available for a sub-sample of children. When the
modelling was applied to this sub-sample (results not shown), being stunted or
severely stunted compared to not stunted, was found to increase absence from school
by around 17 per cent in the SFE model. Stunting is known to affect cognitive
development and learning capacity. It may consequently also reduce the net benefits
of school attendance.
No significant effects on absence were found in relation to the household caregiver‟s
literacy levels. Those pupils who lived in a home with a „light source for homework‟
had lower absence levels in all models, especially in the SFE models, so that
differences between pupils within school on this variable had notable effects on
attendance. In the presence of controls for household economy and education factors,
having a light source for homework was associated with an 18-19 percent decrease in

Access, Transitions and Equity in Education in Ghana: Researching Practice, Problems and Policy
32
absence rates. However, since no specific control is included to capture connection to
mains electricity, this variable may reflect the more general economic and educational
benefits of access to an electricity supply and other correlated unobserved indicators
of household advantage.
Those who lived further from the school attended and further from a water supply had
higher absence rates, with similar values for coefficients in all models for both years.
These effects were found to be small but significant, at 2-3 percent greater absence
per additional kilometre to school and 5-6 percent per additional kilometre to water.
Pupils in households with more assets had lower absence rates in the household
economy models, but asset ownership effects were not significant when household
education indicators were included, indicating a likely correlation between household
assets and education levels. Living in a household engaged in farming was found to
be associated with significantly higher absence rates in the first two models, but not
when including school effects. Farming households are, however, unsurprisingly
clustered at school level and also to some extent at circuit levels, making the effects of
farming livelihoods difficult to disentangle from other community factors. The
introduction of household economy and/or education indicators typically reduces the
size of circuit effects, suggesting that these factors are somewhat clustered at circuit
level more generally. In the presence of the full set of controls, only Circuit A (an
urban southern site) when compared to Circuit F (with the highest absence rates) is
associated with significantly lower absence in 2007/8 (circuit effects not shown),
although four circuits had significant effects in terms of lower absence in 2008/9.
When school effects were estimated in the presence of the full set of controls (not
shown), 13 schools (or school-communities) had apparent effects on absence which
were significant at the 5 percent level in both years when compared to the school with
the highest absence rates. These were typically equivalent to decreasing absence by
more than 50 percent relative to the reference school. The effects were largest and
most consistent in a urban Methodist Primary in the South, an urban Roman Catholic
in the North and an urban English-Arabic school in the North. However, confounding
issues of pupil sorting by school (school choice) cannot be ruled out, especially in
more urban areas where there is a choice of school. Indeed, the schools with the
largest apparent effects in reducing absence were in more advantaged urban areas
with a choice of school.
4.5.2 Achievement
Achievement in English
The distributions of test scores on the CREATE English achievement test across the three
grades in which the test was administered are shown in Figure 8. The distribution exhibits a
strong negative skew in P4 and a positive skew in JSS1. Results are approximately normally
distributed in P6. Apparently, relatively few pupils had mastered the P4 grade curriculum in
P4 but most had in JSS1. The data are not longitudinal, however, so that the groups reflect
different cohorts. Nonetheless, in general it may be suggested that the pattern in P6 indicates
what might have been expected in P4 if the test had been matched to average pupil learning
rather than to normative curriculum expectations. Thus the test specification and the

Access, Transitions and Equity in Education in Ghana: Researching Practice, Problems and Policy
33
curriculum (to the extent that the two were accurately matched) over-estimates learning in the
years up to P4 in English.
Figure 8: Distribution of English scores (pooled 2007/8 and 2008/9)
P4 P6 JHS1
0
.01
.02
.03
Den
sity
0 20 40 60 80achievment english test 2007/08 in percentage
0
.005
.01
.015
.02
Den
sity
0 20 40 60 80 100achievment english test 2007/08 in percentage
0
.005
.01
.015
.02
.025
Den
sity
0 20 40 60 80 100achievment english test 2007/08 in percentage
Source: ComSS data
Table 17 reports the results of exercises to model achievement in English for 2007/8. Strong
effects of age and overage status are found, while no consistent effect of gender emerged. As
might be expected, an additional year of age is positively associated with attainment, to the
tune of 8-10 percentage points. Being overage by an additional year is found to have a
comparable negative effect, however. This is unsurprising perhaps, since one additional year
of over-age status often represents a reduction in educational experience relative to of-age
pupils of the same chronological age. Attendance is clearly an important determinant of
achievement in school and the variable for absence from school shows a fairly consistent
negative effect except in the school fixed effects models, which indicates that absenteeism is
concentrated at school level and may be rather a school or school-community related issue.
A similar pattern is found in relation to farming in that while farming as a household
occupation is associated with lower attainment in the OLS model using household economy
variables, the effect disappears when school effects are included. The apparent negative
associations between other sources of income and attainment – safety net payments and
incomes from petty trading are less clustered by community but are not significant when
school effects and controls for both household economy and education are included. Receipt
of remittances by the household is associated with higher attainment in all models and may
be an indicator of the availability of additional resources for meeting educational costs, since
supporting relatives‟ educations is a common reason for sending remittances in Ghana.
Attendance at preschool is associated with higher attainment only in the OLS models, most
likely because the availability of pre-schooling is dependent on the community and tends to
be linked with community advantage. A similar finding applies to the receipt of private
tuition. The literacy level of the primary caregiver has important effects when school effects
are included so that attainment is being compared between children attending the same
school. This seems to suggest that the effect is an important household level influence.
When circuit and school effects were examined (not shown), these were found to be
significant and sizeable in a number of cases. Positive effects on attainment in English were
found for urban circuits and particularly for schools in the south, especially one low-cost
private school and two urban public schools. Clearly, the possibility of pupil-sorting is an
issue at school level, but circuits effects are likely less susceptible to this form of bias.

Access, Transitions and Equity in Education in Ghana: Researching Practice, Problems and Policy
34
Achievement in Maths
In maths, the pattern of attainment scores (shown in Figure 9) by grade was less distinct than
in English, while the distribution remained left-skewed in Primary 4, where a significant
number of pupils scored zero. By P6, the distribution is close to normal, again apparently
indicating that the P4 curriculum may be better matched to actual achievement two grades
later.
Figure 9: Distribution of Maths Scores (pooled 2007/8 and 2008/9)
P4 P6 JHS1
05
10
15
20
Pe
rcent
0 20 40 60 80 100achievment maths test 2007/08 in percentage
05
10
15
Pe
rcent
0 20 40 60 80 100achievment maths test 2007/08 in percentage
05
10
15
Pe
rcent
20 40 60 80 100achievment maths test 2007/08 in percentage
Source: ComSS data
Table 18 reports the results of exercises to model achievement in maths. Similar results are
found to those for English in relation to the absence of a gender effect and to the consistent
effects of age and over-age enrolment. The effect of absence from school and of caregiver
literacy are possibly weaker than for English, while the effect of private tuition is possibly
stronger. There is considerable consistency between the results for the two subjects,
however, given the relatively small sample size.
Achievement Progress
Since testing was conducted twice with around one year in between, it is possible to examine
the patterns of progress made by pupils in English and maths over time using ComSS data.
Regression models were used to examine the effects of the first test score, gender, age, over-
age status and absence from school. Results are reported in Table 19. Higher initial test
scores are found to be negatively associated with progress. Absence from school was also
found to be negatively associated with progress, in both subjects, controlling for school
effects. Male gender is associated with higher progress in maths and younger age with
progress in English, with controls for school effects. When examining individual school
effects (not shown) urban schools in the south were typically associated with better progress,
along with one urban English-Arabic school in the North. JHS schools were associated with
more progress than primary schools. While the findings are not conclusive, there was
evidence that pupils who spent more time in school made more progress, and those in schools
in advantaged areas were also found to make more progress.

Access, Transitions and Equity in Education in Ghana: Researching Practice, Problems and Policy
35
Table 18: Achievement in English 2007/8
t-statistics in parentheses
*** p<0.01, ** p<0.05, * p<0.1
VARIABLES
OLS
Household
Education
CFE
Household
Education
SFE
Household
Education
OLS
Household
Economy
CFE
Household
Economy
SFE
Household
Economy
OLS Both CFE Both SFE Both
Sex (Male) 1.623 3.004 2.733 2.171 3.366 3.424 1.974 3.086 2.697
(0.81) (1.57) (1.42) (1.17) (1.87)* (1.89)* (1.03) (1.64) (1.47)
Age 8.938 9.649 10.199 8.714 9.123 9.205 8.784 9.286 9.145
(11.66)*** (13.04)*** (8.76)*** (12.25)*** (12.96)*** (8.52)*** (11.85)*** (12.45)*** (7.95)***
Years overage -9.317 -10.718 -10.914 -9.032 -10.097 -10.191 -8.998 -9.971 -9.932
(-10.74)*** (-12.44)*** (-9.02)*** (-11.25)*** (-12.26)*** (-8.70)*** (-10.54)*** (-11.26)*** (-8.11)***
Absence (log) -2.015 -2.040 -1.238 -2.285 -2.244 -1.459 -1.817 -2.015 -1.366
(-1.85)* (-1.97)** (-1.11) (-2.29)** (-2.30)** (-1.39) (-1.72)* (-1.94)* (-1.28)
Farming -11.552 -3.771 -0.776 -10.869 -3.975 -0.731
(-5.76)*** (-1.65)* (-0.31) (-5.21)*** (-1.64) (-0.29)
Safety net -18.052 -12.526 -10.118 -20.390 -14.899 -9.719
(-3.50)*** (-2.41)** (-1.67)* (-3.83)*** (-2.77)*** (-1.61)
Remittances 9.919 7.483 12.975 9.781 7.829 12.892
(2.26)** (1.76)* (2.93)*** (2.22)** (1.83)* (2.91)***
Years preschool 2.017 0.472 0.707 1.610 0.797 0.774
(2.62)*** (0.61) (0.86) (2.13)** (1.04) (0.97)
Private tuition 3.436 1.505 0.666 2.857 1.676 1.201
(2.72)*** (1.23) (0.48) (2.34)** (1.37) (0.90)
PCG Literacy 0.085 0.126 0.134 0.091 0.152 0.163
(1.40) (2.02)** (2.15)** (1.47) (2.27)** (2.50)**
Constant -63.148 -68.518 -64.760 -43.622 -58.660 -52.893 -49.019 -59.120 -51.610
(-6.53)*** (-7.17)*** (-5.20)*** (-5.24)*** (-6.78)*** (-4.66)*** (-5.02)*** (-5.92)*** (-4.23)***
Observations 471 471 471 514 514 514 470 470 505
R-squared 0.29 0.39 0.21 0.35 0.41 0.23 0.38 0.43 0.25
No. of
schools/circuits 5 28 5 28 5 28

Access, Transitions and Equity in Education in Ghana: Researching Practice, Problems and Policy
36
Table 19: Achievement in Maths 2007/8
(1) (2) (3) (4) (5) (6) (7) (8) (9)
VARIABLES
OLS
Household
Education
CFE
Household
Education
SFE
Household
Education
OLS
Household
Economy
CFE
Household
Economy
SFE
Household
Economy
OLS Both CFE Both SFE Both
Sex (Male) -1.377 0.015 0.010 -0.509 0.539 0.886 -0.952 0.009 0.728
(-0.83) (0.01) (0.01) (-0.34) (0.37) (0.61) (-0.60) (0.01) (0.50)
Age 7.554 7.829 8.211 7.643 7.901 8.391 7.461 7.802 7.883
(12.05)*** (13.16)*** (8.73)*** (13.10)*** (13.87)*** (9.61)*** (12.16)*** (12.73)*** (8.50)***
Years overage -7.355 -8.050 -8.458 -7.246 -7.900 -8.632 -7.332 -7.949 -8.169
(-10.15)*** (-11.45)*** (-8.70)*** (-10.84)*** (-11.74)*** (-9.18)*** (-10.21)*** (-10.83)*** (-8.33)***
Absence (log) -1.341 -1.343 -0.404 -1.464 -1.328 -0.535 -1.206 -1.292 -0.451
(-1.52) (-1.63) (-0.46) (-1.81)* (-1.70)* (-0.65) (-1.40) (-1.55) (-0.54)
Farming -9.707 -2.412 -0.029 -10.518 -3.648 -0.222
(-5.82)*** (-1.30) (-0.01) (-6.02)*** (-1.84)* (-0.11)
Safety net Payments -11.182 -6.704 -3.766 -11.368 -7.114 -3.341
(-2.71)*** (-1.63) (-0.81) (-2.63)*** (-1.65)* (-0.72)
Remittances 7.182 5.220 8.512 6.700 5.183 7.741
(1.93)* (1.46) (2.35)** (1.79)* (1.44) (2.14)**
Private tuition 3.303 1.872 2.238 3.018 2.047 2.476
(3.33)*** (1.95)* (2.03)** (3.07)*** (2.10)** (2.36)**
PCG Literacy 0.063 0.059 0.059 0.088 0.104 0.099
(1.23) (1.16) (1.16) (1.71)* (1.89)* (1.88)*
Constant -47.173 -47.917 -41.832 -31.673 -45.792 -43.104 -35.274 -43.444 -37.969
(-5.94)*** (-6.20)*** (-4.14)*** (-4.77)*** (-6.76)*** (-4.71)*** (-4.39)*** (-5.35)*** (-3.87)***
Observations 500 500 500 544 544 544 499 499 536
R-squared 0.29 0.41 0.20 0.35 0.42 0.21 0.38 0.43 0.23
No.of circuits/schools 5 29 5 29 5 29
t-statistics in parentheses
*** p<0.01, ** p<0.05, * p<0.1
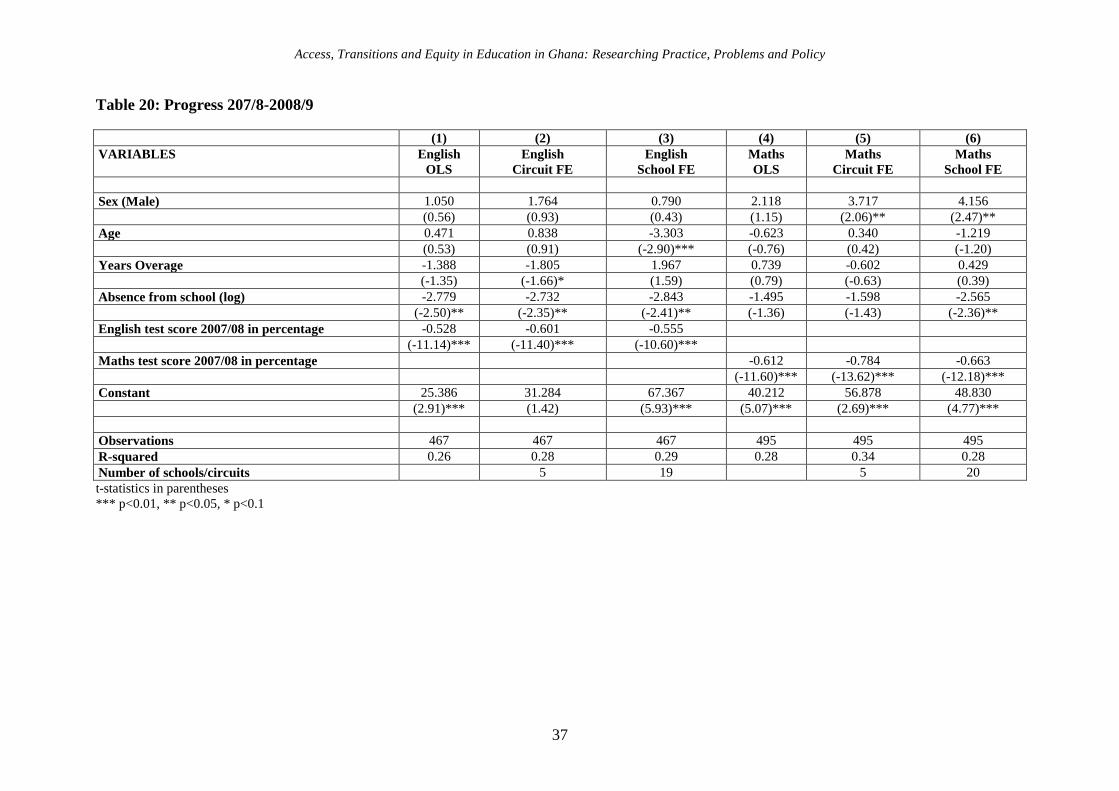
Access, Transitions and Equity in Education in Ghana: Researching Practice, Problems and Policy
37
Table 20: Progress 207/8-2008/9
(1) (2) (3) (4) (5) (6)
VARIABLES English
OLS
English
Circuit FE
English
School FE
Maths
OLS
Maths
Circuit FE
Maths
School FE
Sex (Male) 1.050 1.764 0.790 2.118 3.717 4.156
(0.56) (0.93) (0.43) (1.15) (2.06)** (2.47)**
Age 0.471 0.838 -3.303 -0.623 0.340 -1.219
(0.53) (0.91) (-2.90)*** (-0.76) (0.42) (-1.20)
Years Overage -1.388 -1.805 1.967 0.739 -0.602 0.429
(-1.35) (-1.66)* (1.59) (0.79) (-0.63) (0.39)
Absence from school (log) -2.779 -2.732 -2.843 -1.495 -1.598 -2.565
(-2.50)** (-2.35)** (-2.41)** (-1.36) (-1.43) (-2.36)**
English test score 2007/08 in percentage -0.528 -0.601 -0.555
(-11.14)*** (-11.40)*** (-10.60)***
Maths test score 2007/08 in percentage -0.612 -0.784 -0.663
(-11.60)*** (-13.62)*** (-12.18)***
Constant 25.386 31.284 67.367 40.212 56.878 48.830
(2.91)*** (1.42) (5.93)*** (5.07)*** (2.69)*** (4.77)***
Observations 467 467 467 495 495 495
R-squared 0.26 0.28 0.29 0.28 0.34 0.28
Number of schools/circuits 5 19 5 20
t-statistics in parentheses
*** p<0.01, ** p<0.05, * p<0.1
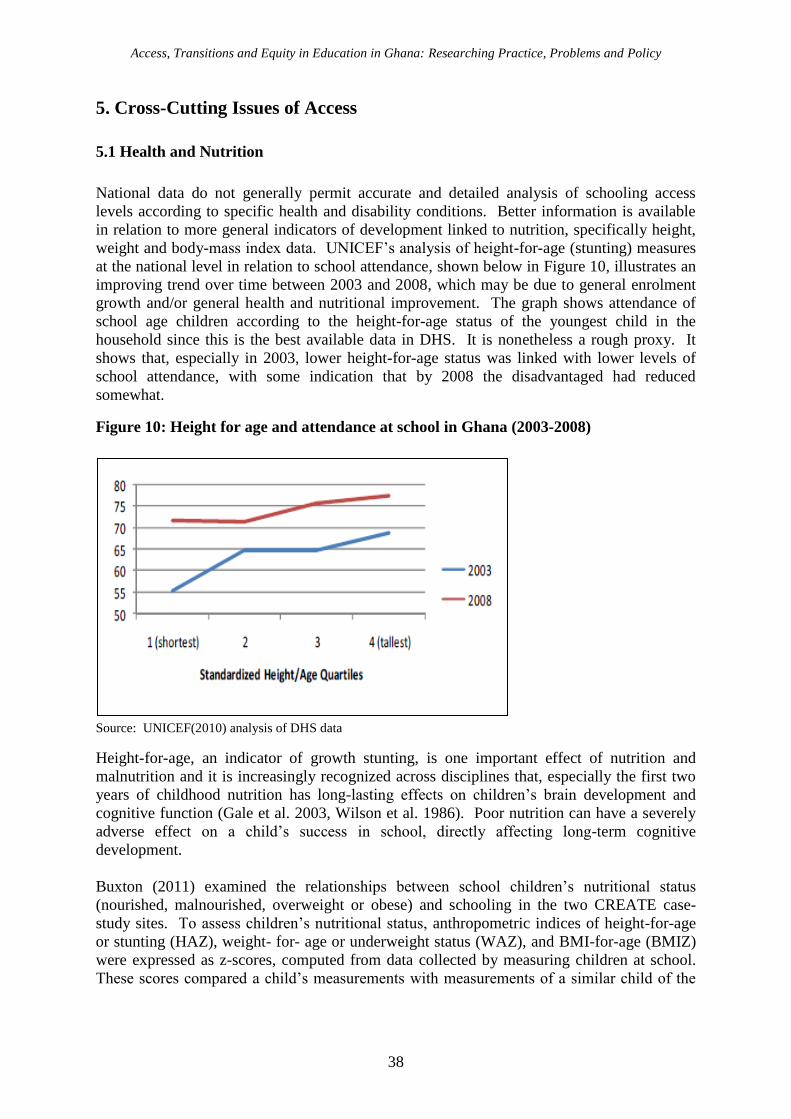
Access, Transitions and Equity in Education in Ghana: Researching Practice, Problems and Policy
38
5. Cross-Cutting Issues of Access
5.1 Health and Nutrition
National data do not generally permit accurate and detailed analysis of schooling access
levels according to specific health and disability conditions. Better information is available
in relation to more general indicators of development linked to nutrition, specifically height,
weight and body-mass index data. UNICEF‟s analysis of height-for-age (stunting) measures
at the national level in relation to school attendance, shown below in Figure 10, illustrates an
improving trend over time between 2003 and 2008, which may be due to general enrolment
growth and/or general health and nutritional improvement. The graph shows attendance of
school age children according to the height-for-age status of the youngest child in the
household since this is the best available data in DHS. It is nonetheless a rough proxy. It
shows that, especially in 2003, lower height-for-age status was linked with lower levels of
school attendance, with some indication that by 2008 the disadvantaged had reduced
somewhat.
Figure 10: Height for age and attendance at school in Ghana (2003-2008)
Source: UNICEF(2010) analysis of DHS data
Height-for-age, an indicator of growth stunting, is one important effect of nutrition and
malnutrition and it is increasingly recognized across disciplines that, especially the first two
years of childhood nutrition has long-lasting effects on children‟s brain development and
cognitive function (Gale et al. 2003, Wilson et al. 1986). Poor nutrition can have a severely
adverse effect on a child‟s success in school, directly affecting long-term cognitive
development.
Buxton (2011) examined the relationships between school children‟s nutritional status
(nourished, malnourished, overweight or obese) and schooling in the two CREATE case-
study sites. To assess children‟s nutritional status, anthropometric indices of height-for-age
or stunting (HAZ), weight- for- age or underweight status (WAZ), and BMI-for-age (BMIZ)
were expressed as z-scores, computed from data collected by measuring children at school.
These scores compared a child‟s measurements with measurements of a similar child of the

Access, Transitions and Equity in Education in Ghana: Researching Practice, Problems and Policy
39
same age in a reference healthy population and assessed how much and in which direction the
child deviated from expected the growth standards.
Findings suggest that school boys in both regions were more likely to be stunted than girls,
indicating deficits in nutrition in early life. Girls were more likely to be overweight or obese
than boys. Comparisons of BMIs between the two genders showed higher prevalence of
thinness-for-age in boys than girls. Low BMI, or severe thinness was found more prevalent
in primary school children than those in junior high school. Low height and low weight for
age cases were found to be more prevalent among older student populations than younger.
Severe stunting was found to be significantly higher among rural children than urban children
for all years and in both districts. Of the 16 schools studied in the Mfantseman district, a high
prevalence of severe stunting was found in 4 schools; with a mean stunting prevalence of
17.5% over three years. The district mean prevalence was 14.1%. In Savelugu-Nanton
district severe stunting was found to be very prevalent in 5 of the 13 schools studied, with a
mean stunting rate of 27.24%. The district prevalence was 15.4%. There is significantly
higher prevalence of severe thinness and thinness for age among children in Savelugu-
Nanton, when compared with Mfantseman. Figure 11 shows the prevalence of stunting in
both districts for children in Primary 1 only, indicating that while severe stunting was more
common in the northern district, stunting in general was slightly more common in the South
at entry to primary school.
Figure 11: Prevalence of stunting in Primary 1 in CREATE ComSS Sample
Source: Buxton (2011)
Children who are affected by physical growth retardation appear to be more likely to find
themselves in zones 1, 2 and 3 of the CREATE zones of exclusion model, where they either
never enroll in school, drop out before completing primary education or are in school but are
attending and attaining poorly, putting them at higher risk of dropping-out. One key reason
for this appears to be the link between nutrition and over-age enrolment, given the
correlations found between stunting, and BMI and the age of enrolling into primary school
(see 5.2 below). These results in turn suggest that early childhood malnutrition (decrease in
growth in stature and weight) is a potential cause of delayed enrolment in both districts, with
consequences for later access and exclusion outcomes.

Access, Transitions and Equity in Education in Ghana: Researching Practice, Problems and Policy
40
5.2 Age and enrolment: The national picture
The primary school age-grade distribution in Ghana is exceptionally wide especially from
grade 3 (see figure 12). Regional profiles of age in grade at primary level closely mirror the
national profile. It is important to stress that severe age in grade slippage has consequences
that will prevent achievement of MDG and EFA goals.
Figure 12: All public primary schools in Ghana age-grade – 2008/09
0
.05
.1.1
5.2
.25
De
nsi
ty
5 10 15 20age
P1 P2
P3 P4
P5 P6
Source: EMIS data
As a result of late entry into primary school, most of the population of 12-14 year olds
expected to be in junior secondary are still in primary school. This is also reflected in the
wide age-grade distribution of junior secondary pupils (see Figure 13). The 2008/09 school
census data show that nationally about 60% of primary 6 pupils are between the ages of 12 to
14 – the official age group for junior secondary. Only about a third of this age group who
complete primary school enrol in junior secondary, and for girls, only about a fifth enrols.
This suggests that the chances of entering secondary are closely linked to the age at which
children complete primary education. According to evidence from yearly EMIS data, there
has been a steady rise in gross admission rates in JSS1. However, the net admission rate has
been persistently low. To improve transition from primary 6 to JSS1, primary completion at
the correct age must improve.
The risk of not continuing to junior secondary after completing primary is significantly
higher for primary pupils in the 15 to17 age group (see Akyeampong et al., 2007). From the
2008/09 EMIS data, nationally, about a quarter (24 percent) of primary 6 pupils and 85
percent of JSS3 pupils are between the ages of 15 to 17 years – the age group for senior
secondary.

Access, Transitions and Equity in Education in Ghana: Researching Practice, Problems and Policy
41
Figure 13: All public JSS in Ghana – 2008/09
Source: EMIS data
5.3 Overage Enrolment
The overall prevalence of overage enrolment nationally varies according to the data source
and definition, but in UIS data gathered from EMIS and shown in Table 20, there is some
indication of an increasing trend in recent years in Ghana. Figure 14 shows the distribution
of pupils‟ ages in Primary 1 using GLSS 5 data (2006). While 6 is the nominal starting age, it
is clear that a sizeable proportion of pupils begin at ages 7-10.
Table 21: Overage enrolment 1999-2008
Year 1999 2000 2001 2002 2003 2004 2005 2006 2007 2008
Over-age enrolment ratio. 16.0 17.0 17.8 19.0 13.1 20.9 20.8 26.9 24.6 29.4
Source: UNESCO Institute for Statistics (UIS)
0
1
Density
10 12 14 16 18 Age
JSS1 JSS2 JSS3
2
3
4
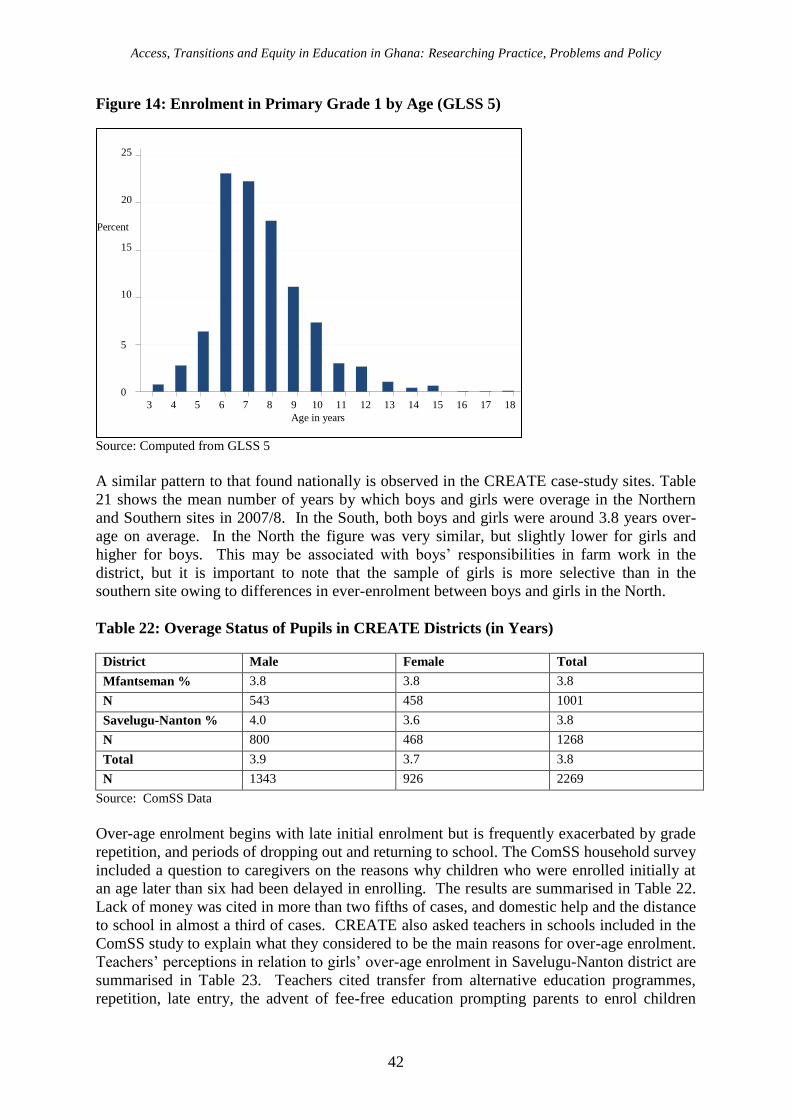
Access, Transitions and Equity in Education in Ghana: Researching Practice, Problems and Policy
42
Figure 14: Enrolment in Primary Grade 1 by Age (GLSS 5)
Source: Computed from GLSS 5
A similar pattern to that found nationally is observed in the CREATE case-study sites. Table
21 shows the mean number of years by which boys and girls were overage in the Northern
and Southern sites in 2007/8. In the South, both boys and girls were around 3.8 years over-
age on average. In the North the figure was very similar, but slightly lower for girls and
higher for boys. This may be associated with boys‟ responsibilities in farm work in the
district, but it is important to note that the sample of girls is more selective than in the
southern site owing to differences in ever-enrolment between boys and girls in the North.
Table 22: Overage Status of Pupils in CREATE Districts (in Years)
District Male Female Total
Mfantseman % 3.8 3.8 3.8
N 543 458 1001
Savelugu-Nanton % 4.0 3.6 3.8
N 800 468 1268
Total 3.9 3.7 3.8
N 1343 926 2269
Source: ComSS Data
Over-age enrolment begins with late initial enrolment but is frequently exacerbated by grade
repetition, and periods of dropping out and returning to school. The ComSS household survey
included a question to caregivers on the reasons why children who were enrolled initially at
an age later than six had been delayed in enrolling. The results are summarised in Table 22.
Lack of money was cited in more than two fifths of cases, and domestic help and the distance
to school in almost a third of cases. CREATE also asked teachers in schools included in the
ComSS study to explain what they considered to be the main reasons for over-age enrolment.
Teachers‟ perceptions in relation to girls‟ over-age enrolment in Savelugu-Nanton district are
summarised in Table 23. Teachers cited transfer from alternative education programmes,
repetition, late entry, the advent of fee-free education prompting parents to enrol children
0
5
10
15
20
25
Percent
3 4 5 6 7 8 9 10 11 12 13 14 15 16 17 18 Age in years

Access, Transitions and Equity in Education in Ghana: Researching Practice, Problems and Policy
43
who had previously been out of school due to lack of money for fees, child labour and
poverty among the reasons for pupils being over-age.
Table 23: Reasons Given by Caregivers for Late Enrolment of Children
Variable Obs % Caregivers citing
reason
Helping at home 1105 29.5
Lack of money 1219 42.3
Distance to school 1222 31.5
Illness 1102 11.1
Other 1198 25.0
Source: ComSS Data
Table 24: Teachers’ perceptions of reasons for over-age enrolment (Savelugu-Nanton)
Reason 1 Reason 2 Reason 3
Free education -capitation grant Admission of School for Life
graduates3
Poverty
Admission of School for Life
graduates
Late enrolment into school Child labour
Repetition and poor performance Late enrolment into school Inadequate knowledge of their ages
Repetition Drop out and re-enrolment Poor performance
Late enrolment into school Admission of School for Life
graduates
Child labour
Single parenthood Repetition for poor performance Lack of parental care
Disregard for the importance of
girl child education initially
- -
Source: Ampiah and Kwaah, (2010b)
Overage enrolment is clearly very prevalent in both the northern and southern data. It is
useful to consider to what extent in these samples, overage enrolment was due to late entry to
the first grade. Figure 15 below shows the distribution of pupils‟ ages at entry to P1 using the
ComSS household data. While six was the most common age to enter, very many pupils are
older, especially in the age range 7-10, in common with national data. The mean age at entry
was 7.5 (1.5 years late) with relatively little variation by sex and by district. However,
variation on the mean number of years by which pupils entered school late by educational
circuit was found to be extensive, with means ranging from 0.2 to 2.8 years, although some
sample sizes were fairly small. In the data collected at school, the number of years by which
children were overage for their grade ranged by circuit and gender from 3.1 to 5.4 years, with
an overall mean of 4.1 years (4.4 for the household data subset). While the figures are not
directly comparable, the data appear to indicate that at least half of the number of years by
which pupils are overage cannot be accounted for by late entry. Since repetition is relatively
uncommon, it may be suggested that „age-grade slippage‟ due to temporary drop-out and
subsequent re-enrolment is a key reason for over-age enrolment, especially for older pupils.
3 School for Life is an NGO supported basic education programme
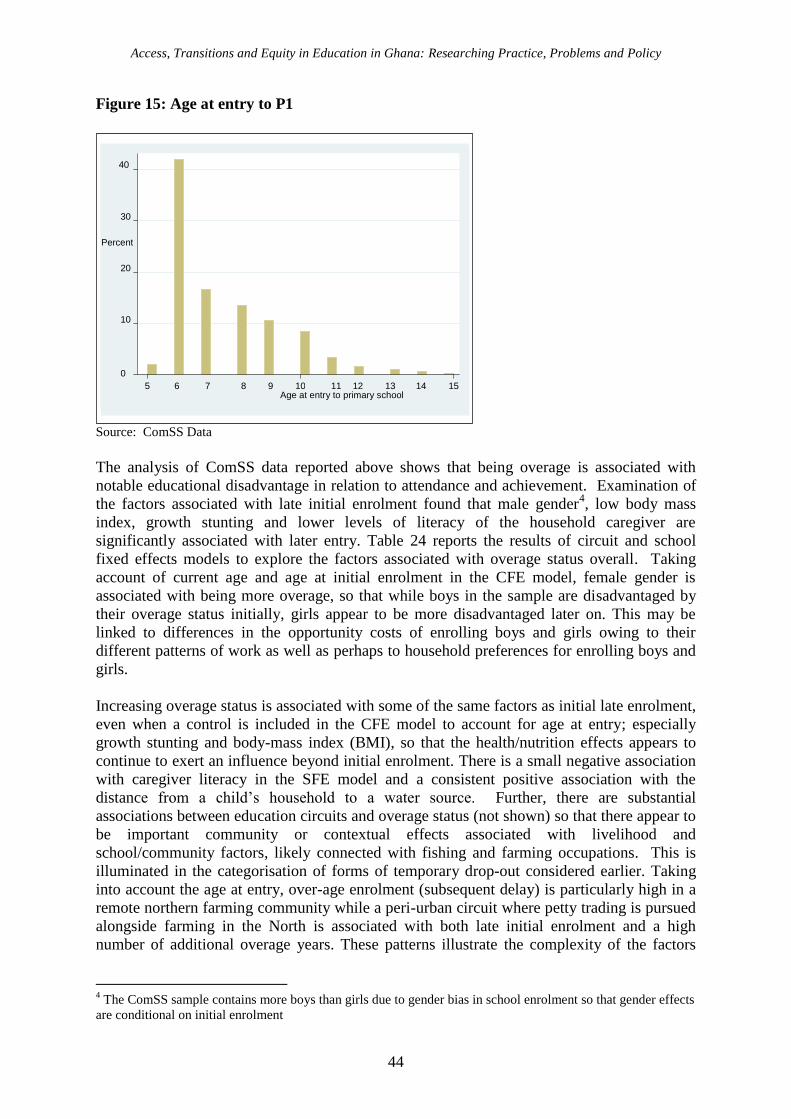
Access, Transitions and Equity in Education in Ghana: Researching Practice, Problems and Policy
44
Figure 15: Age at entry to P1
Source: ComSS Data
The analysis of ComSS data reported above shows that being overage is associated with
notable educational disadvantage in relation to attendance and achievement. Examination of
the factors associated with late initial enrolment found that male gender4, low body mass
index, growth stunting and lower levels of literacy of the household caregiver are
significantly associated with later entry. Table 24 reports the results of circuit and school
fixed effects models to explore the factors associated with overage status overall. Taking
account of current age and age at initial enrolment in the CFE model, female gender is
associated with being more overage, so that while boys in the sample are disadvantaged by
their overage status initially, girls appear to be more disadvantaged later on. This may be
linked to differences in the opportunity costs of enrolling boys and girls owing to their
different patterns of work as well as perhaps to household preferences for enrolling boys and
girls.
Increasing overage status is associated with some of the same factors as initial late enrolment,
even when a control is included in the CFE model to account for age at entry; especially
growth stunting and body-mass index (BMI), so that the health/nutrition effects appears to
continue to exert an influence beyond initial enrolment. There is a small negative association
with caregiver literacy in the SFE model and a consistent positive association with the
distance from a child‟s household to a water source. Further, there are substantial
associations between education circuits and overage status (not shown) so that there appear to
be important community or contextual effects associated with livelihood and
school/community factors, likely connected with fishing and farming occupations. This is
illuminated in the categorisation of forms of temporary drop-out considered earlier. Taking
into account the age at entry, over-age enrolment (subsequent delay) is particularly high in a
remote northern farming community while a peri-urban circuit where petty trading is pursued
alongside farming in the North is associated with both late initial enrolment and a high
number of additional overage years. These patterns illustrate the complexity of the factors
4 The ComSS sample contains more boys than girls due to gender bias in school enrolment so that gender effects
are conditional on initial enrolment
0
10
20
30
40
Percent
5 10 15 Age at entry to primary school
8 7 6 9 14 13 12 11
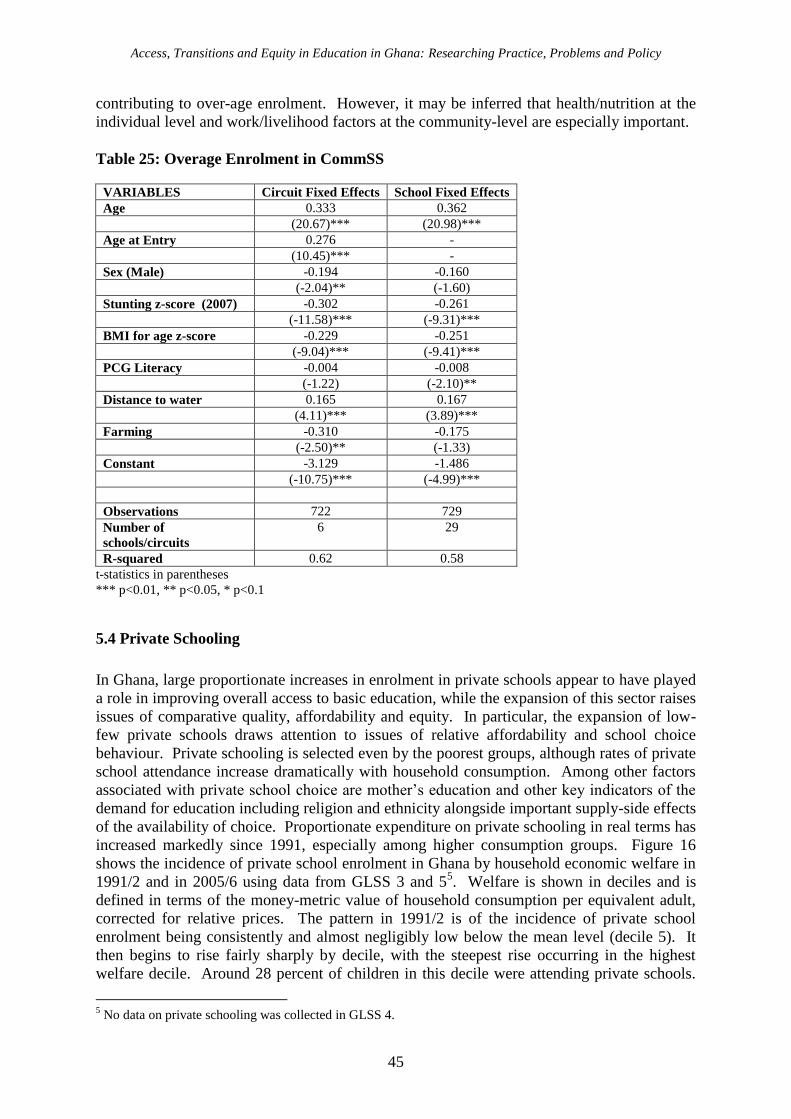
Access, Transitions and Equity in Education in Ghana: Researching Practice, Problems and Policy
45
contributing to over-age enrolment. However, it may be inferred that health/nutrition at the
individual level and work/livelihood factors at the community-level are especially important.
Table 25: Overage Enrolment in CommSS
VARIABLES Circuit Fixed Effects School Fixed Effects
Age 0.333 0.362
(20.67)*** (20.98)***
Age at Entry 0.276 -
(10.45)*** -
Sex (Male) -0.194 -0.160
(-2.04)** (-1.60)
Stunting z-score (2007) -0.302 -0.261
(-11.58)*** (-9.31)***
BMI for age z-score -0.229 -0.251
(-9.04)*** (-9.41)***
PCG Literacy -0.004 -0.008
(-1.22) (-2.10)**
Distance to water 0.165 0.167
(4.11)*** (3.89)***
Farming -0.310 -0.175
(-2.50)** (-1.33)
Constant -3.129 -1.486
(-10.75)*** (-4.99)***
Observations 722 729
Number of
schools/circuits
6 29
R-squared 0.62 0.58
t-statistics in parentheses
*** p<0.01, ** p<0.05, * p<0.1
5.4 Private Schooling
In Ghana, large proportionate increases in enrolment in private schools appear to have played
a role in improving overall access to basic education, while the expansion of this sector raises
issues of comparative quality, affordability and equity. In particular, the expansion of low-
few private schools draws attention to issues of relative affordability and school choice
behaviour. Private schooling is selected even by the poorest groups, although rates of private
school attendance increase dramatically with household consumption. Among other factors
associated with private school choice are mother‟s education and other key indicators of the
demand for education including religion and ethnicity alongside important supply-side effects
of the availability of choice. Proportionate expenditure on private schooling in real terms has
increased markedly since 1991, especially among higher consumption groups. Figure 16
shows the incidence of private school enrolment in Ghana by household economic welfare in
1991/2 and in 2005/6 using data from GLSS 3 and 55. Welfare is shown in deciles and is
defined in terms of the money-metric value of household consumption per equivalent adult,
corrected for relative prices. The pattern in 1991/2 is of the incidence of private school
enrolment being consistently and almost negligibly low below the mean level (decile 5). It
then begins to rise fairly sharply by decile, with the steepest rise occurring in the highest
welfare decile. Around 28 percent of children in this decile were attending private schools.
5 No data on private schooling was collected in GLSS 4.

Access, Transitions and Equity in Education in Ghana: Researching Practice, Problems and Policy
46
The pattern in 2005/6 is somewhat different. The incidence rises across all deciles at a steeper
rate and is markedly higher overall than in 1991/2, reaching around fifty percent in the
highest welfare decile.
Figure 16: Incidence of Private School Enrolment (at age 6-12) by Household Economic
Welfare
0
0.1
0.2
0.3
0.4
0.5
0.6
1 2 3 4 5 6 7 8 9 10
Deciles of Welfare
2005/6 1991/2
Source: Computed from GLSS 3 and 5
CREATE research in Mfantesman District (see Akaguri 2010) found that households with
children in low-fee private schools incurred significantly higher costs per child than those
who had children in a fee-free public school. These costs were also a significantly higher
proportion of household income for poorer families. Akaguri found that although the costs
were much higher overall, low fee private schools were adopting targeting strategies to
induce demand from households. In one low-fee private school fees were reduced for every
additional child enrolled from a particular household. A fourth child enrolled paid no fees.
Two low-fee private schools were willing to enrol children between the ages of three and five
for free into their pre-schools; providing a stock of children ready to enter the fee-paying
stream in subsequent years. Households which made prompt payments sometimes received a
fee discount of 10 to 15%. Such practices ensured that the low-fee private schools were able
to recruit from relatively poor households. Interview findings in Akaguri (2010) suggest that
a common view among households was that public schools were insensitive to their concerns
about poor performance, and that generally supervision of children‟s work was poor in these
schools, indicating that part of the demand for private schooling stems from perceptions of
the failings of the public system. Consistent with this analysis, caregivers with children in
low-fee private schools often reported that these schools operated with a clearer vision of
improving pupil learning and achievement. In particular, they referred to the speaking and
writing proficiency of children in private schools in the English language, as an indicator of
quality and achievement. Box 4 summarises the issues addressed by Akaguri (2010).

Access, Transitions and Equity in Education in Ghana: Researching Practice, Problems and Policy
47
Box 4: Why Do Low Income Households Use Private Schools?
Source: Akaguri (2010)
5.5 Fosterage
Cultural factors play an important role in influencing access to education while these vary
considerably between ethnic groups in Ghana. In the context of Savelugu-Nanton, Dagomba
practices of child fostering are of notable significance. Fosterage is an important cultural
institution which serves to strengthen kinship solidarity among a range of other functions
including meeting needs for child labour. Its effects on education are ambiguous but a study
by Rolleston (2011) finds these effects to be more often negative than positive. The effects
of fosterage on schooling depend somewhat on the circumstances of the sending and
receiving homes, the reason for fostering children between them and the extent to which the
two homes cooperate to provide for access to education. Nonetheless, fostered children do
typically experience lower levels of access to meaningful education. This is partly because
they tend to live in areas and attend schools where meaningful access is lower, but the
individual „Cinderella effect‟ of fosterage is found to be palpable, especially for girls, so that
being fostered, even to a more economically advantaged households does not typically
CREATE research in Mfantesman District (Southern Ghana) found that households with
children in low-fee private schools incurred significantly higher costs per child than those
who had children in a fee free public school. These costs were also a significantly higher
proportion of household income for poorer families. So why are some of the poorest
households opting for the low-fee private schools?
We found that although the costs were much higher, low fee private schools were adopting
strategies that induced demand from households. In one low-fee private school fees were
reduced for every additional child enrolled. A fourth child enrolled paid no fees. Two low-
fee private schools were willing to enrol children between the ages of three and five for free
in their pre-schools. What this did was to ensure that they had a stock of children ready to
enter the fee-paying stream. Households who made prompt payments sometimes received a
fee discount of 10 to 15%. Such practices ensured that the low-fee private schools were able
to recruit from poor households. On the other hand, the fee-free public schools made no
such effort to induce demand. The general view among households was that public schools
were insensitive to their concerns about poor performance, and that generally supervision of
children‟s work was poor.
Households with children in the low-fee private schools felt the schools operated with a
clearer vision of improving pupil learning and achievement. In particular, they referred to
the speaking and writing proficiency of children in private schools in the English language,
as an indication of their quality and success. For them, the low-fee private schools stood for
something they were prepared to buy into – the evidence of success was tangible, whereas
for the fee-free public schools they felt there was less commitment to this goal.

Access, Transitions and Equity in Education in Ghana: Researching Practice, Problems and Policy
48
benefit the foster child educationally and on balance is associated with a worsening of their
educational access. Fostered children on average enrol in school less often, drop out more
often and achieve less in school, especially when compared to biological children in the same
home rather than to children in homes which host no foster children (see Rolleston 2011).
The increased availability and importance of public schooling has, arguably, emphasised
some of the negative effects of fosterage, perhaps most significantly because of a potential
conflict between the „reciprocal‟ nature of the fosterage relationship and the requirements of
schooling, especially the costs. In interviews conducted in Savelugu-Nanton, caregivers of
fostered children made it clear that meeting educational costs was frequently a struggle.
Many explained that they faced difficult choices:
“We face a lot of problems. Sometimes we sell the little food we have to buy the
children‟s school needs and when we are faced with starvation we sell the few sheep
and goats that we rear and that‟s how we continue to exist” (Interview with
caregiver).
Moreover, where a family is unable to send all children to school, it may be foster children
who are excluded. Education professionals tended to cast the implications of fosterage for
education in a negative light:
“Sometimes a child comes to school but they are slipping and the school asks why are
you coming in late and the child says “oh I am not staying with my parents I am
staying with my auntie or this and that and early in the morning before I come to
school I have to do this, do this, do this or have to work late at night that‟s why I am
always sleeping in school. So the school will know that the child is not actually with
the parents but they don‟t have records for that” (Interview with education
professional).
Caregivers, however, more often emphasised the benefits of fostering, including in terms of
education:
“there are advantages for fostering these children for us and for the children. We get
the opportunity to send them to school so they can learn. Sometimes with their
biological parents they are not able to go to school” (Interview with caregiver).
Both sets of interviewees, nonetheless, agreed that some foster parents treat foster children
unequally when compared to biological children. However, some foster parents cited a lack
of support from biological parents as a major barrier in respect of providing for a foster
child‟s education. One education professional explained the approach taken in his own case:
“When...she [his sister] came to take the child I told her, „no, I want the girl to go to
school. You don‟t live here, you live somewhere and if I give the girl to you she will
become a liability‟. But we are looking at the children as assets so that she will come
and work for you, so if you want financial help, come to me and I will help you but
this girl I want her to go to school and I want to keep her there.”
This example illustrates the point that to some extent at least, the disadvantage suffered by
fostered children may be alleviated through co-operation between foster and biological
parents. Interview findings suggest that while some cases of fosterage are educationally
beneficial to the fostered child, in many, kinship obligations are the main reason for the foster
arrangement and these may result in a considerable burden on already poor families in respect
of additional educational expenses.

Access, Transitions and Equity in Education in Ghana: Researching Practice, Problems and Policy
49
Referring to the CREATE conceptual model of „zones of exclusion‟, data analysis in
Rolleston (2011) provides some specific evidence in relation to fostered children in the
context of northern Ghana and Savelugu-Nanton. Concerning „zone 0‟ – exclusion from
access to pre-schooling; analysis showed that in the Savelugu-Nanton sample, fostered
children received on average one third of a year less pre-schooling, which remained when
taking account of their backgrounds. While the reasons for this and its effects were not
addressed specifically, the relationships between early childhood education and later
educational progress established in the literature provide reason to expect that this early
disadvantage may contribute to later inequities between fostered and non-fostered children,
including in terms of their exclusion outcomes. Fostered children in the Northern Region
generally were also found to be excluded in „zone 1‟ (never enrolling in primary school)
more often, being 19% less likely to ever enrol and even less likely to enrol when compared
to biological children living in the same household (where there was intra-household
variation).
Fostered children in the region were found to have drop-out rates at basic school level twice
as high as the non-fostered in the 6-18 age-group (exclusion zones 2, 4 and 5) and indications
from national-level analysis are that fostered children typically progress considerably less
often to primary and junior high school completion. In Savelugu-Nanton district, ComSS data
indicate that drop-out among fostered girls is particularly high and that fostered children
appear to make the transition to junior high school less frequently. With regard to „silent
exclusion‟ (zones 3 and 6) in the forms of poor attendance and achievement which reduce
„meaningful access‟ to education, analysis of ComSS data did not find a difference between
fostered and non-fostered children‟s attendance, but did find that fostered children attained
less, particularly in English, including when taking account of their backgrounds and the
schools they attended.
5.6 Eliminating costs through Capitation Grants
As part of fieldwork activities in Ghana, CREATE collected student attendance data from
2005, when CGS was introduced. Using a small sample of schools, the aim was to
investigate whether there has been a positive stabilisation of attendance throughout the school
cycle that might be due to the CGS. CREATE tracked pupil attendance in grades 1, 4, 6, &
JHS1 in selected schools in two districts for three years. In the Mfantseman district, out of
the total of 1069 pupils tracked about 17% had dropped out by 2009/2010, with the highest
dropout occurring in primary 1 and 4 - 19% and 18.8% respectively (see Table 25 below).
Overall dropout in Savelugu-Nanton was not much different to that of Mfantseman - about
16% out of 1470 tracked pupils (see Table 26). The primary 6 cohort registered the highest
dropout rate (about 31%) and the JHS1 cohort dropout rate was about half that of the
Mfantsiman JHS1 cohort. It is important to notice that after about two years of capitation i.e.
2007/08, schools in our sample were still registering relatively high dropout (highest in
2007/08 for Mfantsiman district and highest in 2008/09 in Savelugu-Nanton). Three years
attendance data revealed no consistent downward trend in dropout.

Access, Transitions and Equity in Education in Ghana: Researching Practice, Problems and Policy
50
Table 26: Dropouts by cohort in Mfantseman District
Cohort Grade Starting
Enrolment
Dropouts
2006/07 2007/08 2008/09 2009/10 Total %
Primary 1 cohort 331 15 14 34 63 19.0
Primary 4 cohort 292 29 7 19 55 18.8
Primary 6 cohort 221 8 5 18 31 14.0
JHS1 cohort 225 27 1 0 28 12.4
Total 1069 79 27 71 177 16.6
Source: Ampiah et al., (2011)
Table 27: Dropouts by cohort in Savelugu-Nanton District
Cohort Grade Starting
Enrolment
Dropouts
2006/07 2007/08 2008/09 2009/10 Total %
Primary 1 cohort 474 13 31 16 60 12.7
Primary 4 cohort 368 10 34 11 55 14.9
Primary 6 cohort 335 26 54 23 103 30.7
JHS1 cohort 293 8 12 0 20 6.8
Total 1470 57 131 50 238 16.2
Source: Ampiah et al., (2011)
Data on attendance by grade for all the participating schools by gender starting in 2005/06
was plotted and the patterns are revealed in figure 17. First of all, it shows that enrolments
have not stabilised and there is a consistent pattern of dropout and drop-in right as pupils‟
progress from the year capitation was introduced. There is a slight downward trend in
enrolment for girls in Savelugu-Nanton whereas for boys there is more stability – for boys
primary 1 enrolment kept up and primary 2 it actually increased. For girls in Mfantsiman,
there was a drop in enrolment for the cohort in the first three grades - in other words,
enrolment after four years was much lower than at the start. The enrolment trend for boys in
Mfantsiman was generally better than for girls. These erratic enrolment trends since the
introduction of capitation are suggestive of the inability of school system to retain pupils, but
more importantly, they suggests that capitation is not delivering improved internal efficiency
through effective use of the grants to improve quality. The enrolment patterns by grade and
gender also show that boys have fared slightly better than girls in terms of consistent
enrolment. The patterns are consistent with the dropout figures captured in Tables 25 and 26.
They suggest that besides capitation there will have to be other measures that will stimulate
and sustain demand in a targeted way. These findings are also consistent with the World
Bank‟s assessment of the capitation grant policy:
“By 2008 … growth in enrolment and in gender parity levelled out and by this time,
dropout and even some learning outcomes had started to decline as the first post-
Capitation Grant generations started to reach 3rd
and then 4th
grade. This was the
result of the large influx of poor students whose parents started to feel negative
economic consequences, and overage students, who have had some difficulty staying
in school. There has been some slowdown in initial admissions and inflation has also

Access, Transitions and Equity in Education in Ghana: Researching Practice, Problems and Policy
51
started to erode the value of the Capitation Grant. In 2008, the Government increased
the Capitation Grant to 4.5Ghc.”
(World Bank 2011, p 118)
Figure 17: Enrolment by Grade and Gender
Boys-Mfantseman Girls-Mfantseman
Girls – Savelugu-Nanton Boys-Savelugu-Nanton
Source: ComSS data
As other evaluation studies of the Capitation Grant indicate, increasing the amount is not
necessarily the solution – it is whether schools get the funds in good time, and all of it, so that
they can fulfil the goals set in their school improvement plans. Also, schools need to be
much more aware of the backgrounds of children who are returning to school after dropping
out, and those who have never enrolled as these two groups have different learning needs and
aspirations. As Ananga (2011) notes, it would be irresponsible, impossible and a waste of
resources to pursue any intervention aimed at facilitating the rehabilitation of dropouts into
the education system without first reaching an understanding of how their daily experiences
in and out of school shape their aspirations in terms of education, work and economic well-
being” (p 8).
What CG achieved was to attract back into school a large pool of dropouts. Added to those
who have never attended school, the challenges teachers face in teaching this mixed group is
compounded. Research also suggests that poor school environment (e.g. lack of toilet
facilities) and classroom conditions affect girls learning and participation in education than
boys (Glick & Sahn 2000). Also, the erratic picture of enrolment in the CREATE ComSS

Access, Transitions and Equity in Education in Ghana: Researching Practice, Problems and Policy
52
study sample may be the effect of over-age attendance interacting with seasonal economic
activity, which then leads to dropout.
Sabates et al (2010) investigated the interaction between over age status and school
attendance using attendance data from the Mfantsiman ComSS sample. The study tested
whether there is a differential association on school performance over time for children who
are over age but attend school as compared to children who are not over age but also attend
school. The results showed that a relationship exists between over age status and school
attendance, whereby children in their correct age-in-grade attend school more regularly than
over age children. Coupled with Ananga‟s (2011) finding that irregular attendance is a
precursor to eventual or permanent dropout, over-age enrolment requires urgent policy
response if the initial positive impact of the CGS is to be sustained to produce high
attendance and completion rates.

Access, Transitions and Equity in Education in Ghana: Researching Practice, Problems and Policy
53
6. Conclusions and Recommendations
Initial access to basic education in Ghana has expanded considerably in recent years, and yet
up to 10% of children remain excluded nationally. For them, the costs associated with
schooling, poverty, livelihoods in farming, location in the North and in rural areas and
fosterage are among some of the key factors which inhibit access. While enrolment rates have
continued to expand since the introduction of the CGS, the most marginalised groups require
more targeted interventions if they are to enrol massively and complete basic education. This
group includes those for whom school remains difficult to access physically due to distance
or disability, those for whom indirect costs such as food, materials and transportation are
prohibitive, and those whose labour remains essential for family livelihoods. Thus, targeting
has to take into account context specific characteristics and include strong school-community
involvement
The evidence from CREATE analysis suggests that less progress has been made in relation to
rates of drop-out and completion in the basic education phase and progression to JHS remains
much lower in the North. Tackling dropout remains paramount if high completion rates are to
be achieved. What is clear is that, dropout is influenced by both school and community level
factors. Overall, the evidence is that, drop-out is associated with poor attendance and
performance, caregiver illiteracy, income and schooling costs, household composition and
children‟s work. At the school level, it depends on complex patterns of temporary periodic
absence as well as permanent cessation of schooling. Progression depends particularly
strongly on household livelihoods and welfare beyond the basic phase, although the vast
majority of those who reach primary completion do progress to JHS except in the North.
Another important finding is the association of drop-out with a child being more over-age.
Indeed, late enrolment and overage progression are very prevalent in Ghana and are also
associated with silent exclusion in the forms of poor attendance and achievement. One
important explanation of over-age enrolment is growth stunting due to poor nutrition,
emphasising the importance of early intervention where health and nutrition are concerned.
Absence from school is high among disadvantaged groups and the relatively poor. But large
differences between schools and communities are also important and perhaps indicative that
variation in preferences for education and in local level policies and practices may be
important vectors where meaningful access is concerned. This finding also supports the
recommendation that context sensitivity is an important concern in future policy formulation.
Overall, the findings of CREATE studies in Ghana suggest the need for policies and
interventions that target poor and marginalised population groups experiencing particular
access challenges. But, at the heart of the problem of access and successful progression to
completion of basic education is the issue of costs, opportunity costs and quality education.
A national campaign to get children into school should include sensitivity to appropriate age-
grade enrolment. Ghana is unlikely to achieve high levels of sustained access and completion
of basic education if appropriate age-grade enrolment is not at the heart of new policies or
strategies to achieve EFA by 2015. CREATE analysis suggests that a one-size fit all approach
to the problems of access in Ghana, such as the introduction of Capitation Grants, will at best,
achieve temporary impact. Clearly missing in Ghanaian education policy is increased
investment that targets the most vulnerable and marginalised population groups. For these
groups, other survival needs means that choosing to go to school must produce tangible
outcomes in terms of completion of basic education and acquisition of employable or
trainable skills, or else demand will fall. In future, it is a new and smart kind of access
policies accompanied by strong implementation strategies that will transform the educational
Access, Transitions and Equity in Education in Ghana: Researching Practice, Problems and Policy
54
landscape of Ghana into a high performing one. Anything less, is sure to repeat the history of
high initial enrolment, low progression and achievement and persistent dropout.
In summary, key achievements in Ghana include: (1) large increases in spending on basic
education; (2) expansion in supply and demand for schooling in recent years which means
that many more children attend basic school; (3) efforts to reduce costs through fee-free
education policies appears to have played an important role in increasing enrolment. These
achievements notwithstanding, there remain challenges which should direct the attention on
the next set of access policies to ensure that all Ghanaian children have a good chance of
accessing and completing basic education.
Challenges and potential solutions
Poor nutrition and health remain prevalent – it is important that the Ghanaian education
establishment liaises with local health authorities to ensure all children have health
records that indicate their health status. This record should be linked to educational data
at district level. The introduction of school feeding programmes should target
particularly rural areas ensuring that the meals have good nutritional value and served
right from pre-school level.
Indirect costs remain a barrier – many poor households still rate costs as a factor in
explaining why children do not attend or attend late. Social protection schemes
including conditional cash transfer, already in use in the country, should be extended to
areas where demand for schooling is noted to be low, and attendance is particularly poor.
Overage enrolment and age-grade slippage very prevalent – this is perhaps one of the
greatest challenges facing Ghana in terms of achieving high enrolment, achievement and
completion of basic education. It will require medium to long term planning to eradicate
this persistent problem. The way to address this might be through district education
sensitisation campaigns and resources for teachers and head-teachers to embark on
enrolment drives by going out into communities to identify non-attenders especially
those ready for Grade 1 and encourage enrolment. If schools are to take up this
additional responsibility they will need funding support
Use of private schools appears to be motivated by poor quality in the public system.
Arresting the decline in quality in public school system should therefore be a matter of
national priority. Improving the management of schools and introducing standardised
school level assessments in literacy and basic mathematics that pupils take in grades 1, 3
and 6 will help to identify children who are at risk of dropping out due to poor
achievement. Poor attendance is common in some areas, especially among marginalised
groups – Good attendance is an important determinant of achievement in school.
Starting at conception, the avoidance of stunting through adequate mother and child
nutrition may be considered a priority where stunting is prevalent. By age six, timely
enrolment in school appears to be the most significant step towards good attendance in a
child‟s school career. Maintaining timely progress remains very important thereafter.
Keeping track of attendance and identifying children whose attendance drops below an
acceptable level should be the responsibility of both school and the district. Regular
attendance is crucial for pupils to make good progress and complete basic education.
Currently, there is little incentive for schools to track children who are not attending or

Access, Transitions and Equity in Education in Ghana: Researching Practice, Problems and Policy
55
doing so irregularly. This is an area where schools and their local communities can work
together to ensure that during school hours no child should be found engaged in work.
Poor achievement common among marginalised groups – If demand from poor and
marginalised groups is to improve, then a high premium should be placed on improving
the quality of public schools in these communities. Anything short of this will in the long
run stifle any initiative to improve access (e.g. through capitation).
Inequality is persistent in relation to progression and transition. A key indicator of
progress in access is that inequality associated with progression and transition narrows.
Again, this requires vigilance in identifying the causes of this especially at school level
for action to address the causes.
Completion rates have remained static. High enrolment which does not lead to high
completion rates suggests gross inefficiencies in the school system, which may be linked
to poor learning outcomes right from the early stages of basic education. Policy attention
must shift towards improved school management efficiency. The situation where
children arrive in later grades with poor reading and numeracy skills should be tackled
through measures which aim to identify children who are falling behind for remedial
action. This may require hiring for example, senior high school completers, as teaching
assistants to help children who are struggling with school work, especially in literacy and
numeracy areas.
Other measures for local level policy consideration might include the following:
A focus on children between the age of 8-14 years (50% should be girls)
Communities with complementary schools providing their own teachers or facilitators
Facilitators should be residents from the community who volunteer to do the work
and are literate in the language of the community
Use of mother tongue as both literacy language and medium of instruction
Sensitisation of communities about the status of access and their role in helping to
improve access and quality
Sizeable effects on absence appear to be associated with circuits, communities and
schools. These are associated with livelihood activities which are clustered by village
or other geographic unit. There is an association between farming and casual labour
and higher absence and between collection/foraging activities and lower absence at
community level. Consideration should be given to flexible school calendar or hours
adapted to communities where seasonal agriculture and/or fishing is a crucial
livelihood activity – for example nine months starting from October; 3 hours every
afternoon, generally 2 to 5 pm; and, 5 days a week- two off days are typically the
market day and Friday or Sunday depending on major day of worship.
Allowing children to maintain daily duties and to contribute to everyday activities in
the communities
Use of primary school classrooms in the afternoon or other suitable places for
remedial schooling for children at risk of dropping out, or who have dropped out and
are being prepared to re-enrol.
As a percentage of unit cost per pupil Capitation Grant (CG) needs to represent a
more significant proportion if it is to have sustained effect on persistence in schooling
and the quality of provision.

Access, Transitions and Equity in Education in Ghana: Researching Practice, Problems and Policy
56
Remove or reduce CG to wealthier groups and channel the savings into improving
access and quality education in low-income areas, especially districts that are known
to experience chronic poverty and deprivation.
It is important that the parameters and indicators for measuring progress in
educational access include improved participation and progression across the basic
school cycle. This should be used as the real measure of progress. To this end, special
attention should be given to transition from Primary 1 to 2. Investments into
improving quality education in early primary schooling should be given priority. In
public schools, the best teachers should teach in the early grades and should be
incentivised to achieve improved learning and high transition from lower to upper
primary.
Promote sensitisation campaigns on the demerits of over-age enrolment especially in
rural areas.
Develop a database which links registration of births with expected year of school
enrolment. This will require collaboration between district health and education
authorities. At the beginning of each academic year, this data can be used to help
identify who has enrolled, not enrolled, or moved out of the catchment area of the
school. This could be piloted in areas which have a history of poor enrolments.
Consider the introduction of conditional cash transfers linked to timely enrolment and
progression in areas with high incidence of poverty, and where livelihoods are fragile.
Focus enrolment drives on timely enrolment and progression, particularly in the first
two years.
Increase and target CG on classroom level inputs. Implement ring-fenced capitation
that goes directly to classroom level inputs to improve quality.
Finally, introduce a monitoring system that can effectively monitor school attendance
for both pupils and teachers. A first step is to ensure that schools have enrolment and
attendance records that can be held electronically at district level. Circuit supervisors
on regular visits to schools should monitor and update these records (this can be easily
done using a digital camera). Regular inspection of school attendance records will
help to identify children at risk of dropping out, or who have dropped out, so that the
necessary action at school level to reduce this risk.
CREATE studies have shown that there are a number of factors outside the domain and
influence of the education system that impact on access for the poor. In the long term,
investing in the development of deprived districts would lead to improvements in the welfare
of inhabitants and have a positive knock-on positive effect on household attitudes and
investments into basic education.

Access, Transitions and Equity in Education in Ghana: Researching Practice, Problems and Policy
57
References
Akaguri L., (2010) Public and Private Schooling in Rural Ghana: Are the Poor Being
Served? CREATE Ghana Policy Brief 3, Centre for International Education, University
of Sussex, Brighton.
Akyeampong K Djangmah, J, Seidu A, Oduro, A & Hunt, F. (2007) Access to Basic
Education in Ghana: The Evidence and the Issues, CREATE Country Analytic Review,
University of Sussex, Brighton.
Akyeampong, K., (2009) Revisiting Free Compulsory Universal Basic Education (FCUBE)
in Ghana, Comparative Education, Vol. 45, no.2.
Akyeampong, K., (2010a), 50 Years of Educational Progress and Challenge in Ghana,
CREATE Pathways to Access Research Monograph No. 33, Centre for International
Education, University of Sussex, Brighton.
Akyeampong K. (2010b) “Government policy and teacher education in Ghana” in Elliott,
Fourali & Issler (Eds), Education and Social Change – Connecting Local and Global
Perspectives, pps 162-174. Continuum.
Alhasan, S and Adzahlie- Mensah, V., (2010), Teachers and Access to Schooling in Ghana,
CREATE Pathways to Access Research Monograph No. 43, University of Winneba,
Ghana.
Ampiah, J. G., and Adu Yeboah, C., (2009) Mapping the incidence of school dropouts: a case
study of communities in Northern Ghana, Comparative Education, Vol. 45, no.2.
Ampiah, J., G., and Kwaa, C., (2010a) CREATE Ghana ComSS Report Mfantesman District,
University of Cape Coast, Ghana.
Ampiah, J., G., and Kwaa, C., (2010b) CREATE Ghana ComSS Report Savelugu-Nanton
District, University of Cape Coast, Ghana.
Ananga, E., (2010) Typologies of Drop Out in Southern Ghana, CREATE Ghana Policy
Brief 1, Centre for International Education, University of Sussex, Brighton.
Arkorful, K., (2010) Complementary Education and Access to Primary Schooling in
Northern Ghana, CREATE Ghana Policy Brief 2, Centre for International Education,
University of Sussex, Brighton.
Boakye-Yiadom, L., (forthcoming) Basic Education and Issues of Costs, Access and Equity –
Evidence from Ghana (1991-2006) CREATE Pathways to Access Research
Monograph, Centre for International Education, University of Sussex, Brighton.
Buxton, C., (2011) The Relationship between malnutrition and educational achievement
among school children in Ghana, CREATE Pathways to Access Research Monograph
No. 68, Brighton / Cape Coast: University of Sussex / University of Cape Coast.

Access, Transitions and Equity in Education in Ghana: Researching Practice, Problems and Policy
58
Coulombe, H. and McKay, A. (2007), Growth with Selective Poverty Reduction-Ghana in
the 1990s. World Bank Working Paper 79(9).
Dunne, M., Bosumtwi-Sam, C., Sabates, R., and Owusu, A., (2010), Bullying and School
Attendance: A Case Study of Senior High School Students in Ghana, CREATE
Pathways to Access Research Monograph No. 42, Centre for International Education,
University of Sussex, Brighton.
Gale, R. Catharine, F. J., O'callaghan, Keith, M. G., Law, C. M., & Martyn, C. N., (2003).
Critical Periods of Brain Growth and Cognitive Function of Children. Brain, 127(2),
321-329.
Ghana Statistical Service (GSS) (2000a) Ghana Living Standards Survey Report on the
Fourth Round (GLSS 4) GSS, Accra, Ghana.
Ghana Statistical Service (GSS) (2005) Ghana Population Data Analysis Report. GSS, Accra,
Ghana.
Glick P. and Sahn D.E. 2000. Schooling of Girls and Boys in a West African Country: the
Effects of Parental Education, Income and Household Structure, Economics of
Education Review, 19 (1), pp.63-87.
Lewin, K. M., (2007) Improving Access, Equity and Transitions in Education: Creating a
Research Agenda. CREATE Pathways to Access Research Monograph No. 1. Brighton:
University of Sussex.
Little, A., (2010), Access to Basic Education in Ghana: Politics, Policies and Progress,
CREATE Pathways to Access Research Monograph No. 42, Institute of Education,
London.
Rolleston, C. And Oketch, M., (2008), Educational Expansion in Ghana: Economic
Assumptions and Expectations, International Journal of Educational Development,
Vol. 28, pp. 320-339.
Rolleston, C., (2009a) Consumption, Poverty, Educational Access and Attainment: An
Analysis of Ghana in the 1990s, CREATE Pathways to Access Research Monograph
No. 22, Institute of Education, London.
Rolleston, C., (2009b) The determination of exclusion: evidence from the Ghana Living
Standards Surveys 1991–2006 Comparative Education, Vol. 45, no.2.
Rolleston, C., (2010) Fosterage and Educational Access Among the Dagomba of Savelugu-
Nanton, Ghana, CREATE Ghana Policy Brief 4, Centre for International Education,
University of Sussex, Brighton.
Savelugu-Nanton District Assembly (2010) Profile of Savelugu Nanton District accessed at:
http://www.ghanadistricts.com/districts/?r=6&_=87&sa=2383
UNICEF (2010) An Analysis of Out of School Children in Ghana: Demographic and
Household Surveys (GDHS) 2003-2008. UNICEF, Accra.

Access, Transitions and Equity in Education in Ghana: Researching Practice, Problems and Policy
59
Wilson, M., Darell, L. D., Hammer, P. D., Sanford, M., Dornbusch, P., R., Hintz, R., Gross,
R.& Rosenfeld, R., (1986). Growth and Intellectual Development. Paediatrics, 78 (4):
646- 650.
World Bank 2011 ―Education in Ghana: Improving Equity, Efficiency and Accountability
of Education Service Delivery‖ AFTED – Africa Region. Report No. 59755-GH.
World Bank, Washington DC.
All CREATE monographs and other publications are available on the CREATE
website: www.create-rpc.org
CREATE in Ghana is coordinated through the University of Cape Coast, Ghana. To contact
the CREATE team in Ghana email Professor Joseph Ghartey Ampiah at
[email protected]. To contact the CREATE team in the UK email

Report summary: This monograph summarises CREATE‟s research on access to and exclusion from basic education in Ghana
using longitudinal data collected from 2,500 students and 1,400 households in two deprived districts in the
Central and Northern regions over three years. This data is complemented by empirical studies using qualitative
data and the analysis of existing national data sets. The research sheds new light on access and late entry and
over age progression, poor attendance, low achievement, the impact of capitation and decentralisation; the lives
of out-of-school children and drop-outs; the growth in low-cost private school enrolments; and the significance
of fostering, and poor health and nutrition. Smarter policies on access are needed that target those who remain
excluded along with more effective implementation strategies.
Author notes: Dr. Kwame Akyeampong is a Senior Policy Analyst at UNESCO. He is also a Reader in International
Education at the University of Sussex. He has written extensively on education and development in sub-
Saharan Africa and has consulted for DFID, JICA, the World Bank and ministries of education in Ghana and
Rwanda.
Dr. Caine Rolleston is an Education Researcher at the University of Oxford, working on Young Lives. He was
at the Institute of Education, London as part of the CREATE team. His PhD was on education and poverty
reduction in Ghana and has written on financing, private schooling, skills, and the economic benefits of
education.
Professor Joseph Ghartey Ampiah is Professor of Education at the University of Cape Coast, Ghana. He
managed the fieldwork undertaken by CREATE in Ghana. His research interests include curriculum and
methodological issues in primary and secondary education.
Professor Keith Lewin is the Director of the CREATE research partnership. He has extensive experience of
school systems in sub-Saharan Africa, South and South-East Asia and China. His research interests include the
economics of education, education finance, educational policy, planning for EFA, teacher education, science
education policy and aid to education.
Address for Correspondence:
CREATE, Centre for International Education
Department of Education, School of Education & Social Work
Essex House, University of Sussex, Falmer, BN1 9QQ, UK.
Website: http://www.create-rpc.org / Email: [email protected]