Embed Size (px)
Citation preview

Level 2, 53 Blackall Street
Barton ACT 2600
02 6260 3733
www.regionalaustralia.org.au
Access to Finance Growing SMEs in regional Western Australia
June 2015

Access to Finance, June 2015 P a g e | i

Access to Finance, June 2015 P a g e | ii
The Regional Australia Institute
Independent and informed by both research and ongoing dialogue with the community, the
Regional Australia Institute (RAI) develops policy and advocates for change to build a stronger
economy and better quality of life in regional Australia – for the benefit of all Australians.
Disclaimer and Copyright
This research report translates and analyses findings of research to enable an informed public
discussion of regional issues in Australia. It is intended to assist people to think about their
perspectives, assumptions and understanding of regional issues. No responsibility is accepted
by RAI Limited, its Board or its funders for decisions made by others based on the information
presented in this publication.
Unless otherwise specified, the contents of this report remain the property of the Regional
Australia Institute. Reproduction for non-commercial purposes with attribution of authorship is
permitted.
RAI Research and Policy
Project researchers: Annemarie Ashton-Wyatt, Senior Researcher
Chrissy Peters, Research Assistant
Project supervisor: Jack Archer, Deputy Chief Executive Officer
Contributing to analysis, editorial and review:
Su McCluskey, Chief Executive Officer All RAI research is informed by the expertise of the RAI Research Advisory Committee. Members in 2014/15 are:
Professor Sandra Harding, James Cook University (Chair)
Professor Andrew Beer, University of Adelaide
Professor Graeme Hugo, University of Adelaide
Professor John Tomaney, University College of London
Tim Shackleton, Director, Virtual Health, and Director, Regional Australia Institute
Su McCluskey, Chief Executive Officer, Regional Australia Institute

Access to Finance, June 2015 P a g e | iii
Research Partnership Structure
Executive Reference Group:
Tim Shackleton, Regional Development Council of Western Australia
Mike Rowe, Department of Regional Development, Western Australia
Su McCluskey, Regional Australia Institute
Project Steering Committee:
Ken King, Pilbara Development Commission (until February 2015) (Chair)
Bruce Manning, Great Southern Development Commission
Grant Arthur, Wheatbelt Development Commission
Richard Hancock, Pilbara Development Commission
John Acres, Department of Regional Development
Denis O’Donovan, Department of Regional Development
Jack Archer, Regional Australia Institute
Acknowledgements
The RAI thanks the following people and organisations who have contributed information,
feedback and ideas during the development of this report:
Steven Münchenberg, Australian Bankers’ Association
John Stamolis, Australian Bankers’ Association
Collin Brady, Bendigo Bank
Russell Pritchard, Great Southern Development Commission
John Burn, Many Rivers Microfinance Limited
Catherine Lim, Many Rivers Microfinance Limited
Claudia Rayne, Many Rivers Microfinance Limited
Busselton Chamber of Commerce and Industry

Access to Finance, June 2015 P a g e | iv
Table of Contents
Executive Summary ...................................................................................................................................... v
Profiting from Potential: Access to Finance and SMEs in Regional Western Australia .................. 1
SMEs in Regional Western Australia ....................................................................................................... 3
The Economic Environment for SMEs in Western Australia ............................................................. 5
Investigating Access to Finance ................................................................................................................ 9
Types of Finance .................................................................................................................................. 10
Access to Finance for Australian SMEs ............................................................................................. 11
Factors Contributing to Access to Finance ........................................................................................ 12
Bank Lending ............................................................................................................................................. 15
Postcode Lending Systems .................................................................................................................. 22
Proximity to Financial Institutions ....................................................................................................... 23
Importance of the Business Relationship ........................................................................................... 29
Case Study 1: Bendigo Bank and Mobile Lending in Regional Areas ........................................... 30
Non-Bank Lending .................................................................................................................................... 32
Business Credit ...................................................................................................................................... 32
Venture Capital and Angel Investment ............................................................................................ 33
Case Study 2: Angel Investment in Regional Business in Western Australia ................................ 35
Other Non-Bank Lending .................................................................................................................... 36
Case Study 3: Many Rivers Microfinance .......................................................................................... 38
The Importance of Non-Bank Funding for Enabling Innovation ................................................... 40
Conclusion ................................................................................................................................................... 41
Appendix A: Lists of Figures and Tables .............................................................................................. 43
Contacts and Further Information .......................................................................................................... 44
References and End Notes ...................................................................................................................... 45
Access to Finance, June 2015 P a g e | v
Executive Summary
The perception that poor access to finance is a constraint on local business and regional
growth is a long-standing feature of the regional development discussion in Australia.
The Regional Australia Institute (RAI) has consulted with regional groups, banks and other
stakeholders, to investigate the financing environment for small and medium enterprises (SMEs)
in regional Western Australia.
Overall, it is clear that regional SMEs in Western Australia face many of the same constraints
on access to finance that have been identified for SMEs nationally. Reviews, such as the recent
Financial System Inquiry, draw attention to some of the challenges in assessing the worth of
SMEs and understanding the variation across different industries or geographical areas.
The RAI analysis finds limited evidence to suggest that additional, widespread access to
finance issues exist for regional SMEs in Western Australia. Instead, regional businesses usually
have many of the factors associated with successful access to finance. These factors include
good availability of collateral, sufficient size of employment or turnover, a well-established
trading history or credit record, good financial literacy, and being in industries which are well-
understood by banks.
There is a high rate of successful access to finance in regional Western Australia. This is most
likely due to the dominance of the agriculture sector, with land assets that can be used as
collateral for lending. Good availability of industry-specific data and agri-business lending
specialists helps to inform decision-making in financial institutions. This makes it more likely that
applications will be successful where the individual business case is also strong.
Other SMEs in regional Western Australia, such as those in the mining and manufacturing
sectors, have utilised different pathways to access finance in recent times. The mining industry
is a high user of equity finance, which is sought through capital markets or joint venture
agreements. Similarly, manufacturing SMEs may be able to secure debt-funding using supply
contracts to larger companies as collateral.
Continued access to capital for SMEs in each of these industries is important for regional
Western Australia’s economy, particularly given the capital intensity and need for continual
investment in some sectors.
Despite the generally strong picture across regional Western Australia, there is evidence that
some regional SMEs may face difficulties in accessing finance, particularly when compared to
similar businesses in metropolitan areas. These SMEs are more likely to be in industries where
their collateral is based on ideas or activities, such as the knowledge sector or the services
delivery sector. The growth of knowledge-based industries and service industries in regional
areas is important, as these are growing markets within the Australian economy.
Access to Finance, June 2015 P a g e | vi
Barriers preventing viable businesses from accessing finance often reflect the thinner markets
and limited information on the performance of similar business in regional Western Australia.
Each of these factors helps banks to assess the business income growth potential and identify
any potential risks for lending. SMEs with higher risk profiles due to a lack of available data
are likely to face increased costs when borrowing from financial institutions or may even be
unable to secure finance, despite being a sound and viable business.
The RAI’s investigation into access to finance revealed that bank finance is the most commonly
used means of funding for regional SMEs, but the use of non-bank finance is growing. While
leasing and debt-financing facilities are currently the most commonly used forms of non-bank
finance, market potential is growing in other pathways.
New forms of finance available to regional SMEs include online avenues to venture capital
and angel investment, crowd funding, peer to peer lending, and guarantor loan schemes.
These finance options may offer more potential to fund growth for SMEs in regional areas,
particularly for business start-ups or for knowledge-based and service-delivery businesses.
At present, non-bank forms of finance are more readily available in Perth or other Australian
capital cities, but are relatively rare in regional Western Australia. However, many types of
non-bank finance are now being delivered completely through online portals, which enables
wider regional access.
While there is certainly no case for substantial government intervention in this area, some
measured policy responses may be usefully considered to support improved access to finance
for regional SMEs:
Improved data about regional business and business performance will increase the
understanding of regional potential and help to reduce the risks of banks or others
rejecting applications from good businesses;
Strategies to build business confidence will be vital for supporting the growth of SMEs
in regional communities and encouraging banks to invest in regional business;
Improving availability of supports for regional businesses to improve their financial
literacy skills; and
Building greater awareness of non-bank lending options, and encouraging
engagement with entrepreneurial regional business. Growth in the scale and frequency
of equity funding through angel networks or venture capital could help to increase the
dynamism and sophistication of regional finance in Western Australia.
These strategies will be vital to offset the challenges of the slowdown in the resources sector,
and also to grow the knowledge and service sectors which are under-represented in regional
areas. Investing in the growth and capacity of SMEs will help to broaden local economic
capacity in the longer term and help to reduce many communities vulnerability to changes in
external markets.

Access to Finance, June 2015 P a g e | 1
Profiting from Potential: Access to Finance and
SMEs in Regional Western Australia
Small to medium enterprises (SMEs) have been identified as a major driver of economic
growth in Australia, as they are a substantial source of both employment and innovation.1
An active and profitable local business sector adds diversity to many regional economies.
It also provides services to meet the needs of local populations and industry.
Businesses need access to finance in order to grow, whether through expansion of production
capacity, entry into new markets, or new business start-ups. Difficulties in accessing finance are
considered to have inhibited the growth of SMEs across the Asia-Pacific region.2 Banks in
Australia have indicated that loan application decline rates are more than twice as high for
business start-ups compared to established businesses.3 This presents a substantial barrier to
growth, which may be particularly to the disadvantage of business in regional areas.
The global financial crisis (GFC) in 2008 led to a general tightening of bank lending criteria
and requirements for greater capital and liquidity, under the Basel III Agreement, which has
created flow-on effects across the world’s economies.4 In Australia, some of the effects of the
GFC are reduced business confidence and a more restricted lending market.
The Basel lll Agreement came into effect in Australia at the start of 2014. Prior to this, bank-
imposed restrictions, such as reduced loan to valuation ratios, had already made credit harder
to obtain and also more expensive. These factors, combined with a soft economic environment,
has led to a business focus on consolidation and survival rather than growth, which further
inhibits economic recovery.5
In Australia, businesses have been obtaining funds needed for survival through non-bank
sources, profit reinvestment, or sale of assets rather than through finance applications.6 While
this may be suitable for survival in challenging economic times, such strategies are unlikely to
realise the level of capital required to foster business growth.
Bank loans have been perceived as less desirable in recent years, despite low interest rates,
due to perceptions that the Australian economy is facing tough times ahead. Fears about the
potential for future interest rate rises are heightened for small business owners, as they also
have concerns that high debt levels with banks may limit their autonomy over the future of the
business.7
Financial commentators have noted that a general deterioration in trust in the relationships
between business and the banks seems to be inhibiting economic growth.8

Access to Finance, June 2015 P a g e | 2
“Growth in the Australian economy will not only be largely determined by the
willingness of businesses to borrow but by banks being prepared to lend to them.
Both sides are likely to show considerable caution in the current economic
environment. Banks will also need to improve their relationship with business — as
shown by the much lower satisfaction levels when compared to their retail customers
— if they are going to retain and attract good business customers.”9
Evidence of this deterioration includes small business continuing to having very low satisfaction
rates with the big four banks, due to increased fees and charges, and the introduction of
centralised operating models which are perceived to reduce understanding of business needs
and strengths at a local level.10
Technological advances have also changed the way that businesses access finance. While
automated application procedures for finance may enable easier access for businesses without
a local bank branch, it may also result in exclusion due to poor recognition of asymmetric
information across different sectors or regions.11 Asymmetry of information12, alongside
volatility of revenue and higher levels of default risk, is also a factor in the higher cost of
finance for many SMEs.13
Despite the challenging economic times, regional SMEs in Australia may be better placed for
growth than metropolitan SMEs. Recent research indicates that 69 per cent of SMEs in regional
centres are optimistic about potential growth in their business, compared to 65 per cent of
capital city SMEs and 57 per cent of rural SMEs.14
This paper investigates whether access to finance is more challenging for regional businesses
compared to metropolitan businesses in Western Australia. It also seeks to identify any factors
associated with access to finance which may promote the growth of regions by enabling the
development of new or expanded SMEs.
Regional SMEs in different
industries all need access to
finance to grow, but some may
have easier access than others
Knowledge-based Service-based
Agriculture-based Mining/manufacturing based

Access to Finance, June 2015 P a g e | 3
SMEs in Regional Western Australia
SMEs can be defined by number of employees or by size of annual turnover.15 The Australian
Bureau of Statistics (ABS) defines a small business as having less than 20 employees, and a
medium-sized business as having 20 or more employees but less than 200 employees.16 Small
business finance in Australia is defined by the Reserve Bank of Australia (RBA) as loans of
under $2 million.17
SMEs are important sources of employment in many regional areas, and are often found in
labour intensive industries, such as food services.18 SMEs are most common in agriculture and
are less common in those businesses requiring very large capital investment, such as mining or
manufacturing.19
Regional areas in Western Australia had almost 56,000 SMEs as at June 2012, which is
approximately 25 per cent of all Western Australian SMEs.20 These SMEs were most likely to
be in the agriculture, forestry and fishing industry, followed by the construction industry, and
then the rental, hiring and real estate services industry (Figure 1).
Figure 1: SMEs in Western Australia to June 2012 by regional or metropolitan location 21
0.0
5.0
10.0
15.0
20.0
25.0
30.0
Perc
ent
ag
e
Regional Metropolitan

Access to Finance, June 2015 P a g e | 4
Over two thirds of all SMEs in Western Australia are sole person operations with no
employees. Despite this, SMEs in regional areas were more likely to have employees than
those in the Perth metropolitan area (39 per cent of all regional SMEs compared to 36 per
cent of Perth SMEs).22 This is similar to the national level for SMEs, which sits at 39 per cent.
The SME group identified as having the highest likelihood of growth is a business with one to
four employees (Figure 2).23 There were 12,399 SMEs of this size in regional Western
Australia, which is approximately 22 per cent of all regional SMEs.24
Regional SMEs are also highly engaged in adopting new business practices enabled through
technology. Research indicates small businesses in regional Western Australia were more likely
to generate a proportion of their income through online sales compared to small businesses in
the Perth metropolitan area.25
Figure 2: Key characteristics of SMEs in Western Australia 26
Access to Finance, June 2015 P a g e | 5
The Economic Environment for SMEs in Western Australia
The economic environment affects how SMEs do business. Growth in a business depends on the
opportunities available, its capacity to realise those opportunities, and the conditions of the
general economic environment, particularly those affecting business income and access to
finance.
Managing periods of economic uncertainty has been identified as a key priority for many
businesses in Western Australia.27 SMEs in Western Australia have been impacted by
economic events in both external and local markets, such as shifts in resources and commodities
markets, changes in government spending patterns, tightening lending markets, and low levels
of consumer confidence.
SMEs in different industries and/or regions will experience different levels of impact. This can
be due to a higher level of exposure to the external changes, but also reflect the level of
resilience within the business itself.
The Impact of Changes in External Markets
SMEs in regions with a high level of dependence upon single industries have more sensitivity to
changes in external markets. They can experience high demand for their goods and services
when economic conditions are positive, and may need access to finance to quickly grow their
capacity and capitalise on available opportunities.
SMEs can also lose vital sources of income when corrections or slowdowns occur in external
markets. Some may need access to finance to survive a period of lower business income while
new markets or opportunities to diversify are identified.
Slowdowns can also present vital opportunities for SMEs to invest in development of the
business. New goods, services, or market opportunities may have been identified during a
period of peak demand, but not acted upon. While some businesses may have reserves of
capital to invest in research and development, others will need access to finance to bring a
longer term growth strategy to fruition.
An example of how changes in external markets can impact on small business is evident in the
flow on impacts in the Goldfields-Esperance region from changes in the gold price. Gold is a
large export earner for the region; the value of mining and mineral production was over
$9 billion in 2012-13.28 Since early 2013, a lower price trend, combined with fluctuations in
the value of the Australian dollar, has substantially affected the profit margin for gold
producers.

Access to Finance, June 2015 P a g e | 6
Mining companies’ responses to lowering commodity prices can include strategies such as
stock-piling of ore, reduced production rates, workforce redundancies, and reductions in
discretionary or capital expenditure.29 This creates flow-on effects in local economies, as
changes in larger companies’ expenditure on wages and goods or services will have direct
impacts on local SMEs who depend upon these sources for business income.
Changes in external markets require a shift in business focus for SMEs from growth strategies
to survival strategies. If the downturn is prolonged, local SMEs may then make reductions in
staffing, which then contributes to higher local unemployment. Evidence of this type of impact
can be seen in the Goldfields-Esperance regional economy, where unemployment rates in
LGAs with high gold mining activity have increased during a period of relatively low gold
prices (Figure 3).
As employment markets contract in the region, two flow-on effects on population mobility will
likely become evident:
A slowing of inward migration; and
An increase in outward migration.
One of the first indicators of such trends is slowing of demand for rental accommodation,
leading to higher vacancy rates and lower rents. Median rental rates in Kalgoorlie-Boulder
declined by 15.4 per cent between September 2013 and September 2014.30
Higher rates of outward migration and lower inward migration can reduce the revenue
opportunities for SMEs due to the smaller size of the local market. This can create further stress
on cash flow, forcing additional reduction in business overheads if not offset by new business
growth.
This situation will create challenges for many SMEs in the region in the 2014-15 financial year
and beyond. SMEs which are highly dependent upon revenue from the regional resources
sector will be particularly affected. Owners and operators of any SMEs experiencing a
slowdown in revenue will need to adapt to survive and grow their business through
diversification.
Consultation with local business owners in Kalgoorlie highlighted an important issue in
managing slowdowns in the resources industry. While they may have to cut business
expenditure to survive, too much reduction in capacity would inhibit their ability to react to the
potential resurgence in business when commodity markets cycle upwards again. Therefore,
retention of staff during slower periods was a priority for many business owners.

Access to Finance, June 2015 P a g e | 7
Figure 3: Smoothed unemployment rates in LGAs with high employment in gold mining for the Goldfields/Esperance region31
The identification of new external markets outside of the region or new products/services for
inside the region will be fundamental to economic growth. Slower local market conditions can
also offer the opportunity for SMEs to invest time into developing new products, methods or
services which have been identified, but not acted upon because of the priority need to meet
the high levels of demand during the boom time.
SMEs Growing Through New Market Opportunities
A number of positive trends are also evident in the Western Australian economy. The
slowdown in the resources sector is easing some pressures on labour and input costs which can
provide an advantage to SMEs in other industries. New market opportunities are also
emerging in other areas, such as the knowledge sector, tourism, and agribusiness, which may
create opportunities for SMEs in Western Australia to grow.32
The latest survey of business expectations indicated the following positive trends for SME
business growth in Western Australia:33
Labour scarcity which constricted the growth of some SMEs during the resources boom
has eased making recruitment less difficult;
Staff retention has also become easier for SMEs;
0
2
4
6
8
10
12
14
Dec-12 Mar-13 Jun-13 Sep-13 Dec-13 Mar-14 Jun-14
Kalgoorlie/Boulder (C) Laverton (S) Leonora (S) Menzies (S) Ngaanyatjarraku (S)
Unemployment starts to rise as the gold price declinestarts in April/May 2013
Unemployment starts to plateau at 13 per cent

Access to Finance, June 2015 P a g e | 8
Wages costs have decreased;
Non-wages production input costs remained stable or eased in many sectors;
Business operating conditions generally improved, despite continued falls in sales
activity; and
Capital expenditure growth was more likely in the services sector than other industries.
Other signs of positive economic conditions in Western Australia include a 2.6 per cent
increase in lending activity in the six months to September 2014, and a 2.7 per cent increase
in building approvals in the quarter ending September 2014.34 This likely indicates that
growth is occurring in areas unaffected by shifts in the resources sector. Highest growth in
median sale prices over the 12 months to September 2014 occurred in the Busselton,
Mandurah-Murray, Albany, and Bunbury urban areas.
Access to finance was a top three issue for 16 per cent of businesses surveyed in Western
Australia.35 This indicates that some SMEs in Western Australia continue to need access to
funds to take advantage of growth opportunities, to develop greater capacity to respond to
changing markets, and to invest in innovation.
New market
opportunities are
emerging in regional
Western Australia
Tourism
Knowledge
Agri-business

Access to Finance, June 2015 P a g e | 9
Investigating Access to Finance
SMEs usually need access to capital funds or other sources of finance to enable growth to
occur. Research indicates that SMEs tend to use different sources of finance depending on the
needs of the business. The different business needs vary across the business lifetime and may
include:
Capital for business start-up;
Flexible access to finance for ongoing cash flow management;
Finance to enable the growth of business (i.e. to meet increased demand, to take advantage of new business opportunities, or to diversify into new markets);
Investment to enable development of the business and its workforce; and
Funds to enable survival of the business due to changes in internal or external business environments.36
While some businesses may simply not be a viable prospect for finance, economic growth is
impaired when good businesses are unable to access the finance they need for growth. There
is evidence that access to finance is mostly impaired for younger and smaller businesses, and
high growth businesses, which are all perceived to be a higher financial risk under post-GFC
assessment practices.37
While it is easy to measure the use of financial services, it is less easy to measure whether all
businesses have equal access.38 Some businesses are an unviable proposition for finance,
others may be excluded from access due to factors of market imbalance.39 Such imbalances
and gaps are hard to measure. Unsuccessful finance applications will not fully reflect levels of
exclusion, as barriers can also work as a deterrent to others, who may decide not to apply in
the first place.
The issue for regional businesses is whether their geographical location is a factor enabling or
inhibiting access to finance, or are barriers due to other factors such as type of industry, size
of business, financial literacy, or availability of documentation? Access to finance for SMEs is
especially important in Western Australia, due to the need to encourage economic growth and
diversify local and regional economies following the slowdown of the resources sector.
The growth of regional SMEs will be an important contributor to the long term expansion of
regional cities in Western Australia. This is important as Western Australia (like Queensland
and the Northern Territory) faces development challenges from a comparatively low density
of population across very large geographic areas. SMEs will also be essential to widening the
base of local economies in smaller settlements, particularly where those economies have a high
level of vulnerability to changes in external markets.

Access to Finance, June 2015 P a g e | 10
Types of Finance
Types of finance available to businesses for funding growth can be classified in three
categories: capital funding, grants funding and debt finance. Different types of funding within
these categories are available from different sources:
Capital funding exchanges a stake or share in the business for an injection of funds.
Investors received a share in business profits, and the capital investment is a tangible
asset that can be sold. Providers of capital funding may be informal (such as family or
friends) or through formal sources (e.g. angel investment, venture capital lenders,
investment banks, or securities exchanges).
Grants funding may be sourced from government or philanthropic sources. The funds
are tied to agreed terms and conditions, but do not create a debt to be repaid or
require any security. Grants are usually tied to a contractual set of obligations or
progress towards an agreed outcome.
Debt finance creates an obligation on the business to repay the amount of loaned
finance, plus an amount of interest and/or other fees and charges. Such finance
includes:
o Business loans from banks and other financial institutions for a fixed amount to
be repaid over a specified term. Such loans are often secured against other
assets (e.g. real estate or personal property) but may be unsecured or subject
to a guarantor arrangement (where another party agrees to pay the debt in
the case of default);
o Debt finance raised against unpaid invoices, which are used as a tradeable
asset for the business and can improve cash-flow;
o Lease agreements for equipment or vehicles through financial services or
vendor finance arrangements; and
o Flexible or ongoing debt-finance, such as trade or store accounts, credit cards,
or overdraft facilities.
Industries may vary in their use of the different types or sources of finance. The agriculture
industry, for example, would be likely to use debt finance secured against property, as land is
a core commodity in agriculture. In contrast, the mining industry tends to use equity finance
through joint ventures and funds raised in capital markets. Research and development,
particularly for medical, ICT, and technology industries, has a higher use of grant funding.
In 2013, the Australian small businesses most likely to have sought external finance were in the
agriculture, forestry and fishing industry and the transport and warehousing industry.40 The
small businesses least likely to have sought external finance were in the rental, hiring and real
estate industry and the retail trade industry.41

Access to Finance, June 2015 P a g e | 11
Access to Finance for Australian SMEs
Different surveys of business in Australia conducted in 2012 and 2013 reveal variable levels
of concern about access to finance; from 11 per cent 42 to 23 per cent of SMEs.43 In each case
access to finance was of more concern to those SMEs with existing plans for growth over the
next year.
Recent research in Australia indicates approximately half of all small businesses with turnover
of less than $5 million do not have access to any source of formal finance beyond a credit
card (Table 2).44 Furthermore, almost a third have no source of bank finance at all.45
The use of banking products is not homogenous across all types of industry. Research in
Australia indicates that agriculture, transport, mining and accommodation/food services are
the four highest users of financial products.46 The communications, health,
arts/culture/recreation, and education industries were the lowest users of financial products.47
As regional areas in Australia tend to be dominated by agricultural, mining and tourism
industries, this may mean that access to finance is even more important for growth in regional
economies. This is reflected in the data as small businesses in regional areas do have a higher
proportion of usage for financial services, with 78 per cent compared to 67 per cent in
metropolitan areas.48
Table 1 Estimated access to finance for small business in Australia
Finance type Estimated percentage of small businesses in
Australia using this product
Credit cards 51%
Lease finance 35%
Overdraft 28%
Long term loans 15%
Property mortgage 14%
Line of credit 9%
Data source: Australian Bankers Association and Council of Small Business Australia (2013)49

Access to Finance, June 2015 P a g e | 12
Factors Contributing to Access to Finance
Both macro and micro forces contribute to variable levels of access to finance. International
trends can include world economic factors, reduced supply or increased cost in wholesale
markets and changing perceptions of risk.
Macro factors also work at a national level of influence, including government economic
policies, and the level of competitiveness in the domestic banking environment. Lending
policies, business strategies and the use of new technology may also change the lending
environment within individual financial institutions. Different lending environments affect both
the funds available and the selection of customers who obtain access to them.
At the micro level, businesses vary in their level of viability for expansion, the potential risk for
non-return of investment, and financial literacy of the business owners. Some businesses are
simply not a viable option for investors, but overall economic growth is inhibited when viable
businesses cannot access the funds they need for expansion at a reasonable level of cost.
For SMEs in Western Australia, the macroeconomic forces associated with the resources
slowdown may increase perceptions of risk for lending funds to support SME expansion. This
comes at a time when regional SME expansion is most needed, particularly to diversify the
smaller or more resource-dependent regional economies. This could present a potential barrier
to regional development in Western Australia.
Changes in Supply and Demand
Lenders of finance are concerned with achieving the optimum return on funds loaned and the
relative level of risk involved in making the loan.50 When the demand for credit availability
exceeds the supply of funds available for loan, financial institutions will use interest rates,
collateral requirements, lending criteria and quantity restraints as a means of controlling the
flow of finance and limiting their level of exposure in the marketplace.51
International research by the Asian Development Bank and the OECD notes that ongoing gaps
between supply and demand for finance, particularly for SMEs, requires a broadening of the
finance model from traditional bank finance pathways to include non-banking sources of funds
and capital markets.52 53
International research also reveals that access to finance for business improves with a higher
level of competitiveness in the banking sector within a country.54 Places with a few very large
banks tended to have higher rates and more restrictive lending criteria, which worked to
restrict access to finance for smaller businesses.55
Access to Finance, June 2015 P a g e | 13
Risk Assessment and Lending Policies
Lending policies and practices of lending institutions shape access to finance. Risk assessment is
a necessary factor in containing the costs of finance. International research consistently finds
that the likelihood of obtaining finance increases for businesses with higher turnover, more
employees, and a longer history of operation.56 57 International research also finds that access
to finance is easier for those with substantial existing wealth in income and/or assets.58
Despite this, lending criteria and assessments of relative risk are not consistent across all banks
and lending institutions. Adverse selection occurs when these filtering processes inadvertently
reduce the number of low risk businesses and increase the number of high risk businesses in the
pool of potential loan recipients.59 In other words, groups of businesses or industries may be
disadvantaged if they are located in geographic spaces or industry sectors where banks
perceive it is harder to weed out the high risk applicants from low risk applicants.60
It is likely that this is occurring in regional and rural access to finance. Effectively, the thinner
markets and lower levels of data available on regions makes it harder for banks and lending
institutions to easily and fairly compare apples with apples. Comparisons to the denser
markets of metropolitan Perth would likely result in a negative assessment of SMEs in regional
Western Australia, simply due to the smaller size of markets in many regions and variations in
population density. Furthermore, SMEs in the remote and very remote regions of Western
Australia would face substantial disadvantage under such a system.
Such a system would require SMEs to work harder to bypass standard lending policy barriers
and assessment processes. They would need to engage directly with assessors to convince them
of the value and potential of their business and growth plans. It is likely that this process works
as a substantial disincentive to SMEs in many regional areas and industry sectors in Western
Australia from even applying for finance.
Essentially, the lack of available information on regional areas creates a market failure which
may need to be redressed through policy action to improve data availability on regional
areas. In this case, the public good created by enabling greater financial growth in regions
works to offset the cost of collecting more data to help potential lenders better understand the
potential that exists within regional markets for different industry types.
Financial Literacy
Education is a big factor in improving the chances of success in business, and this is recognised
by lenders. Studies in the USA indicate that people with a higher level of education tend to
have better communication and planning skills, which may contribute to higher success rates in
obtaining access to finance.61 These studies have found a strong, positive relationship between
education and entrepreneurship, where both the numbers of entrepreneurs and the level of
business success are higher.

Access to Finance, June 2015 P a g e | 14
Business planning is an important factor in successful identification of financial needs and in
successfully obtaining funds. Business plans provide a rational, verifiable case for growth
prospects for the SME. They provide financial institutions with insight into the strengths of the
business and detail how the growth of the business will be achieved. SMEs with better business
plans are more likely to be successful because they reduce the level of risk assessed by the
bank. SMEs with incomplete information are more likely to be assessed as being a higher risk
of default.
Financial literacy is also important as a demand generator as it improves awareness of
available sources of finance.62 SMEs need to educate themselves on the types of products
offered by different lenders and find the best match for their business needs. Yet, there is also
a role for government and the private sector in supporting the development of financial
literacy skills in regional areas, particularly through the expansion of business incubation and
start-ups support services which are mostly limited to the Perth metropolitan area at present.
Research in Australia reveals that while 68 per cent of SMEs surveyed in 2012 in Australia
had prepared a business plan, only 42 per cent did so on an annual basis.63 Businesses with
more employees were more likely to complete a formal business plan.64 This is identified as an
area needing improvement, as higher financial literacy is associated with better success in
business and in higher success rates for obtaining access to finance.
Reducing perceptions of risk improves access to finance and lowers the cost of lending
Business plans
Evidence on the business history
Evidence on the
market potential

Access to Finance, June 2015 P a g e | 15
Bank Lending
Small businesses in Australia overwhelmingly use bank finance rather than non-banking
sources. Research identifies that 90 per cent of all small business using finance only use bank
sources, three per cent only use non-bank sources, and seven per cent use a mix of non-bank
and bank sources for finance needs.65
Research in Australia is consistent with international findings which indicates a strong, positive
relationship between likelihood of obtaining finance and SME attributes, such as the size of
turnover, number of employees, and the length of time a business has been operating.66
Businesses which are bigger or older have a lower risk profile, due to their skills base,
established assets, and trading relationships. Effectively, this inhibits growth in regions, as new
or small businesses can be an important source of employment growth in regional communities.
Evidence presented to the Senate Economics References Committee 2010 Inquiry into Access of
Small Business to Finance stated that centralisation of lending processes by financial institutions
had led to circumstances where some regional branches were unable to assess or approve
loans, which was considered to be a substantial barrier in access to finance.67
While the final report of the Financial System Inquiry (FSI) did not detail issues of regional
finance, the interim report identified a number of factors that contributed to a differential
level of access to finance for SMEs in Australia compared to other users (i.e. large businesses
and personal finance applicants):
Costs of borrowing are usually higher for SMEs, reflecting asymmetric information
barriers and higher levels of risk;
High collateral requirements can lead to businesses with the best collateral getting
finance, rather than SMEs with better business prospects;
SMEs may bear an unfair level of burden from banking regulation, such as non-
monetary default clauses in loan contracts;
The $1 million loan threshold for defining retail (lower cost and regulation
requirements) from corporate loans (higher costs and banking regulation requirements)
acts as a disincentive for growth of SMEs; and
SMEs face substantial barriers in raising funds directly from capital markets. 68
However, neither the final nor the interim FSI report find any evidence of reductions in the
supply of funds potentially available for loan to SMEs from financial institutions.69 The FSI
noted that while the rural sector was certainly affected by other trends in access to finance,
there was no evidence of any significant issues related specifically to rural finance.70
The final report of the FSI did note the disadvantage to small business created by the
tightening of trade credit (wholesale money) markets in the post-GFC period.71 The FSI makes
a number of recommendations to improve access to finance for SMEs in Australia including:

Access to Finance, June 2015 P a g e | 16
The reform of regulation currently inhibiting small business from seeking finance for
start-ups and innovations through innovative sources of finance, particularly crowd-
funding;
The extension of unfair contract protections to include small business, preventing
discriminatory practices in loan contracts; and
Improved sharing of credit data and the use of personal credit history to inform
lending to reduce barriers for new business and smaller businesses. 72
Research by the Australian Bankers’ Association (ABA) indicates that issues regarding access to
finance affects 11 per cent of small businesses in Australia.73 There is some variation between
states, ranging from nine per cent of small businesses in South Australia/Northern Territory to
12 per cent in Queensland. In Western Australia, 90 per cent of small businesses stated that
access to finance or capacity to finance further growth was not an issue for the business
(Figure 4).
Figure 4: Variation in importance of access to finance by state or territory 74
0
1
2
3
4
5
6
7
8
NSW/ACT VIC/TAS QLD WA SA/NT
Perc
ent
ag
e
Access to Finance' or 'Capacity to Finance Further Growth in the Business' is one of the issues facing their business(Business has a loan)
Access to Finance' or 'Capacity to Finance Further Growth in the Business' is one of the issues facing theirbusinesse (Business has no loan, but may have credit card)

Access to Finance, June 2015 P a g e | 17
Interestingly, businesses with an existing loan were more likely to identify access to finance or
capacity to finance further growth in the business as a problem than businesses with no loan
(Figure 4). This pattern was consistent across all states and territories, but least variation
between the groups occurred in Western Australia. This may reflect the fact that some small
businesses may have capital reserves or cash flow sufficient to meet needs for growth. Some
small businesses may also have no plans for expansion, and therefore have no need for
additional finance.
There is a very small trend for access to finance to be less important for businesses in regional
areas compared to businesses in metropolitan areas (Figure 5). This is evident across all
categories of existing loan or credit card use. This may be related for the tendency for
agriculture to have better access to finance, and the dominance of agriculture for SMEs in
regional areas. Further exploration of this trend would be informative.
Figure 5: Variation in importance of access to finance for small businesses by existing credit use and location
0
2
4
6
8
10
12
14
Metropolitanbusinesses withexisting loans
Regionalbusinesses withexisting loans
Metropolitanbusinesses withcredit card only
Regionalbusinesses withcredit card only
Metropolitanbusinesses with no
credit card orloan
Regionalbusinesses with no
credit card orloan
Perc
ent
ag
e
Metropolitan businesses with existing loans Regional businesses with existing loans
Metropolitan businesses with credit card only Regional businesses with credit card only
Metropolitan businesses with no credit card or loan Regional businesses with no credit card or loan

Access to Finance, June 2015 P a g e | 18
Businesses with an existing loan were no more likely to identify access to finance or capacity
to finance further growth in the business as a problem than businesses with no loan in the
subset of data for small businesses in Western Australia (Figure 6). Data limitations prevented
analysis of this sub-set at a regional/metropolitan level.
Overall consideration of this data indicates no evidence of widespread disadvantage to
regional small business owners compared to metropolitan small business owners. However, this
data does not assess any impact of barriers preventing small business start-ups or assess any
factors contributing to the failure of businesses due to difficulties in accessing finance. It also
does not assess any difference between the accessibility of finance for businesses in large
regional centres compared to the accessibility for small businesses in small or remote regional
areas. Further research in each of these areas, incorporating new data collection or analysis
of non-publicly available data on current bank lending patterns, would likely prove to be
highly beneficial.
Literature searching of other international and Australian research suggests that factors such as
industry, age of business, size of business and access to collateral may be stronger factors
than simply a regional or metropolitan address. Still, further research is recommended in this
area to fully resolve this issue, particularly given the relatively recent changes in technology,
banking practices and global economic conditions, which may be impacting upon access to
finance and capacity of small business to achieve growth.
Figure 6: Variation in importance of access to finance for small businesses by existing credit use for businesses in Western Australia
0
10
20
30
40
50
60
70
80
90
100
WA businesses with existingloans
WA businesses with credit cardonly
WA businesses with no creditcard or loan
Perc
ent
ag
e
'Access to Finance' or 'Capacity to Finance Further Growth in the Business' is one of the issuesfacing their business
'Access to Finance' or 'Capacity to Finance Further Growth in the Business' is NOT one of theissues facing their business

Access to Finance, June 2015 P a g e | 19
The ABA has provided the RAI with additional detail on their previously published research, to
help identify the differences between metropolitan and regional small businesses use of
finance. This data is drawn from DBM Consultancy surveys of over 20,000 businesses in
Australia.75
1. Use of business lending products by small businesses is higher in regional areas compared to metropolitan areas.
When credit cards are included, 78 per cent of regional small businesses have a business
lending product, but this drops to 62 per cent when credit cards are excluded from
consideration (Figure 7). This reflects the number of SMEs whose credit card is their only
financial product. Only 22 per cent of all small businesses in regional Australia do not
have any lending product, compared to 33 per cent of metropolitan small businesses.
Figure 7: Comparison of metropolitan and regional small business use of business lending products 76
0
10
20
30
40
50
60
70
80
90
Uses a business lendingproduct, including use of
credit cards
Uses a business lendingproduct, not including use
of credit cards
Does not use businesslending product at all
Does not use a businesslending product other
than a credit card
Perc
ent
ag
e
Metropolitan small businesses in Australia Regional small businesses in Australia
All small businesses in Australia

Access to Finance, June 2015 P a g e | 20
2. Small businesses in regional areas are more likely to have a bigger loan than small businesses in metropolitan areas.
Small businesses in regional areas have a higher proportion of loans in every category
from $50,000 upwards (Figure 8). This pattern is consistent for small businesses with and
without credit cards being included for consideration.
Figure 8: Comparison of metropolitan and regional small business amount of loan 77
0
5
10
15
20
25
More than$0 butunder
$10,000
$10,000 toless than$50,000
$50,000 toless than
$100,000
$100,000to less than$500,000
$500,000to less than
$1M
$1M to lessthan $2M
$2M to lessthan $5M
$5M ormore
Perc
ent
ag
e
Loan amount
Metropolitan small businesses (incl credit card) Regional small businesses (incl credit card)
Metropolitan small businesses (no credit card) Regional small businesses (no credit card)
All small businesses in Australia (incl credit card) All small businesses in Australia (no credit card)

Access to Finance, June 2015 P a g e | 21
3. There are few differences between small businesses in regional areas compared to metropolitan areas for the amount of loan outstanding.
Regional areas have a higher proportion of loan outstanding values in only three out of
eight categories (Figure 9). As indicated in the preceding graphs, regional small businesses
do have a higher proportion of activity in each category of loan above $50,000, but this
does not translate into corresponding levels of outstanding debt. This could reflect
variations in rates of repayment or longer timelines since loan establishment (i.e. older
loans tend to have more of the capital amount repaid).
In contrast, regional small businesses also have twice the level of representation in the
$5 million or more outstanding debt category compared to metropolitan small businesses.
This level of difference is greater than Figure 8 previously, where rates of participation in
this category were equal. This indicates that regional small businesses may be slower to
repay very high loans or that these loans are more recently established with little capital
reduction.
Figure 9: Comparison of metropolitan and regional small business amount of loan outstanding
0
5
10
15
20
25
30
35
More than$0 butunder
$10,000
$10,000 toless than$50,000
$50,000 toless than
$100,000
$100,000to less than$500,000
$500,000to less than
$1M
$1M to lessthan $2M
$2M to lessthan $5M
$5M ormore
Perc
ent
ag
e
Loan outstanding
Metropolitan small businesses (incl credit card) Regional small businesses (incl credit card)
Metropolitan small businesses (no credit card) Regional small businesses (no credit card)
All small businesses in Australia (incl credit card) All small businesses in Australia (no credit card)
Access to Finance, June 2015 P a g e | 22
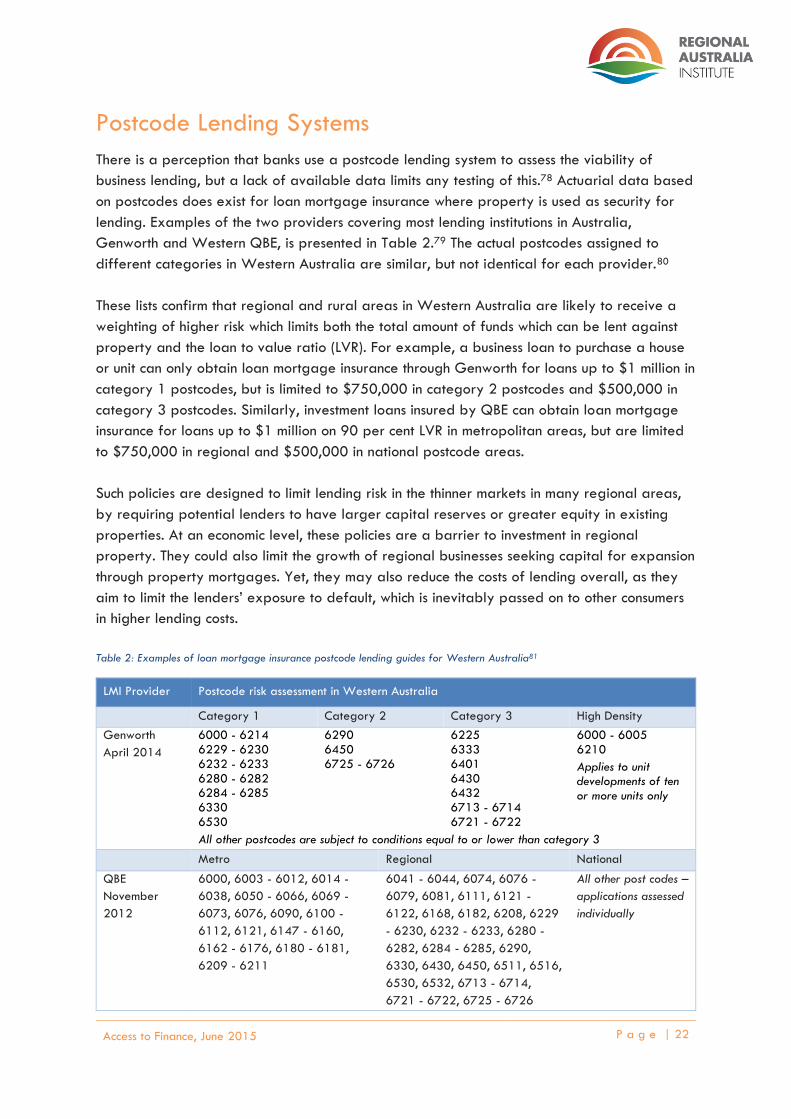
Postcode Lending Systems
There is a perception that banks use a postcode lending system to assess the viability of
business lending, but a lack of available data limits any testing of this.78 Actuarial data based
on postcodes does exist for loan mortgage insurance where property is used as security for
lending. Examples of the two providers covering most lending institutions in Australia,
Genworth and Western QBE, is presented in Table 2.79 The actual postcodes assigned to
different categories in Western Australia are similar, but not identical for each provider.80
These lists confirm that regional and rural areas in Western Australia are likely to receive a
weighting of higher risk which limits both the total amount of funds which can be lent against
property and the loan to value ratio (LVR). For example, a business loan to purchase a house
or unit can only obtain loan mortgage insurance through Genworth for loans up to $1 million in
category 1 postcodes, but is limited to $750,000 in category 2 postcodes and $500,000 in
category 3 postcodes. Similarly, investment loans insured by QBE can obtain loan mortgage
insurance for loans up to $1 million on 90 per cent LVR in metropolitan areas, but are limited
to $750,000 in regional and $500,000 in national postcode areas.
Such policies are designed to limit lending risk in the thinner markets in many regional areas,
by requiring potential lenders to have larger capital reserves or greater equity in existing
properties. At an economic level, these policies are a barrier to investment in regional
property. They could also limit the growth of regional businesses seeking capital for expansion
through property mortgages. Yet, they may also reduce the costs of lending overall, as they
aim to limit the lenders’ exposure to default, which is inevitably passed on to other consumers
in higher lending costs.
Table 2: Examples of loan mortgage insurance postcode lending guides for Western Australia81
LMI Provider Postcode risk assessment in Western Australia
Category 1 Category 2 Category 3 High Density
Genworth
April 2014
6000 - 6214 6229 - 6230 6232 - 6233 6280 - 6282 6284 - 6285 6330 6530
6290 6450 6725 - 6726
6225 6333 6401 6430 6432 6713 - 6714 6721 - 6722
6000 - 6005 6210
Applies to unit developments of ten or more units only
All other postcodes are subject to conditions equal to or lower than category 3
Metro Regional National
QBE
November
2012
6000, 6003 - 6012, 6014 -
6038, 6050 - 6066, 6069 -
6073, 6076, 6090, 6100 -
6112, 6121, 6147 - 6160,
6162 - 6176, 6180 - 6181,
6209 - 6211
6041 - 6044, 6074, 6076 -
6079, 6081, 6111, 6121 -
6122, 6168, 6182, 6208, 6229
- 6230, 6232 - 6233, 6280 -
6282, 6284 - 6285, 6290,
6330, 6430, 6450, 6511, 6516,
6530, 6532, 6713 - 6714,
6721 - 6722, 6725 - 6726
All other post codes –
applications assessed
individually

Access to Finance, June 2015 P a g e | 23
Proximity to Financial Institutions
Access to banking and financial services using local branches was historically important for
improving competitiveness and meeting the service needs of residential and business
populations. Many rural and regional communities reported substantial negative impacts on
communities and business due to the closure of bank branches, which reached a peak with
14 per cent of all regional bank branches in Australia closing between 1993 and 1996.82
The number of financial institutions in a local government area (LGA) is now closely associated
with population density in regional Western Australia, with a high positive correlation of 0.89.
The greatest concentrations of financial institutions occur in the highly populated regional
service centres of Bunbury, Mandurah, Geraldton, Busselton, Kalgoorlie-Boulder and Albany
(Figure 10).
Figure 10: Number of financial institutions and usual resident population in regional Western Australia in 2011 83
-5
0
5
10
15
20
25
30
35
0 10000 20000 30000 40000 50000 60000 70000 80000
Num
ber
of
fina
ncia
l in
stitut
ions
in
LGA
Population
Bunbury
Greater GeraldtonMandurah
Busselton
Kalgoorlie/Boulder
Albany
HarveyEsperanceChittering
RoebourneMurray
Serpentine-Jarrahdale

Access to Finance, June 2015 P a g e | 24
Proximity to financial institutions has essentially become a proxy measure for the density and
complexity of the local economy, rather than an effective measure of access to finance. The
presence of financial institutions is relevant to competitiveness because it is an indicator of
when a location has reached the level of economic development that makes it commercially
viable to support one or a number of banks or other financial institutions.
Technological improvements have substantially changed the delivery of banking and financial
services, and this will require new means of measurement. Telephone and internet-based
banking and lending services are now commonplace across the industry. Accordingly, the
regional marketplace is no longer restricted to the big four banks and small, local credit
unions.
Technology offers the means to lessen the effect of spatial proximity as a driver of business
growth in regional communities. Yet, it may also be that other service providers, such as
Australia Post and Bendigo Bank mobile services, have moved in at a local level to meet the
need for financial services provision in regional communities.
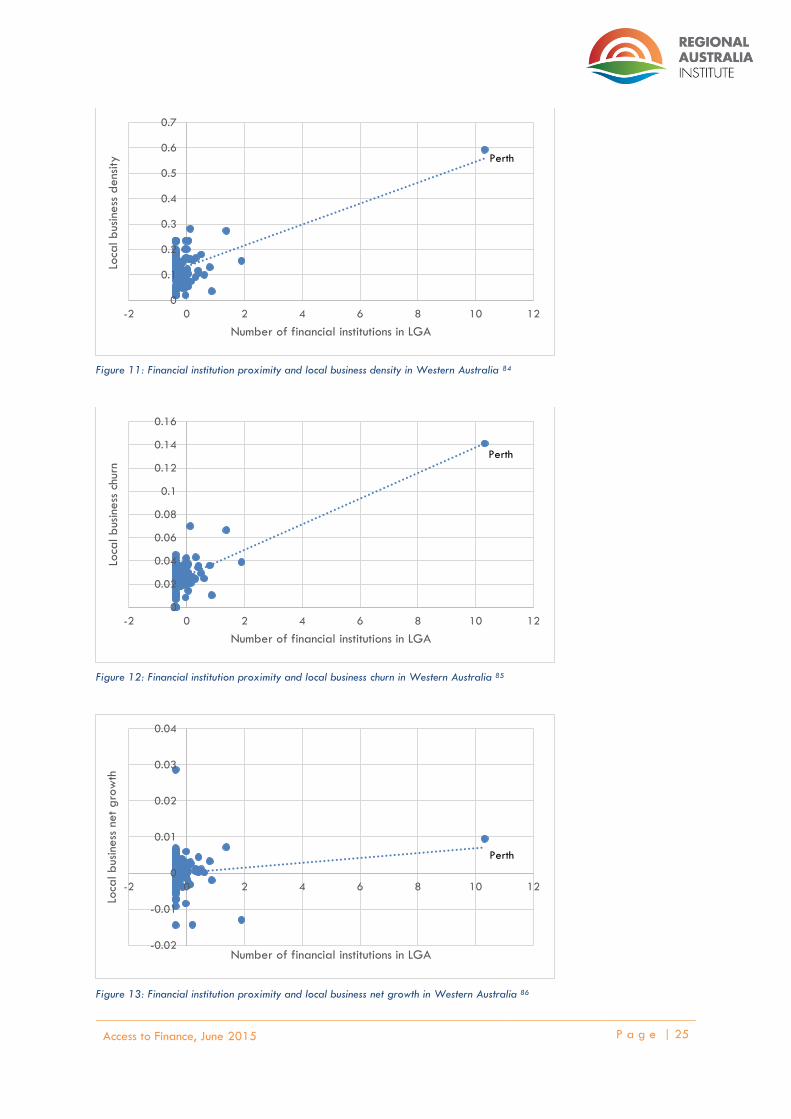
Analysis of all LGAs in Western Australia reveals a strongly Perth-centric pattern in access to
financial institutions. This reflects the high population density in the State capital, but also the
general trend for financial services to congregate within a central business district location.
At the whole of State comparison, there is a moderate positive correlation (0.56) between
access to financial institutions and local business density. There is also a high positive
correlation (0.73) between access to financial institutions and the rate of local business churn
(entries plus exits) which indicates a high degree of mobility in the local business market. In
contrast, there is only a slight correlation (0.14) between access to financial institutions and net
local business growth.
The reason for these figures is evident in scatter analysis, where it is clear that the heavy
concentration of financial institutions and local businesses in the City of Perth LGA is creating a
very strong outlier effect which drags the trend line in an upward direction (Figures 11 to 13).
This means that these trends reflect factors of population density rather than business growth,
as population is strongly associated with the distribution of financial institutions. When
population is controlled for, there is little to no evidence of a relationship between the density
of financial institutions and growth in local business. This tells us that regional businesses do not
necessary need to be in close proximity to a financial institution premises to obtain services.
Access to Finance, June 2015 P a g e | 25
Figure 11: Financial institution proximity and local business density in Western Australia 84
Figure 12: Financial institution proximity and local business churn in Western Australia 85
Figure 13: Financial institution proximity and local business net growth in Western Australia 86
0
0.1
0.2
0.3
0.4
0.5
0.6
0.7
-2 0 2 4 6 8 10 12
Loca
l b
usin
ess
dens
ity
Number of financial institutions in LGA
Perth
0
0.02
0.04
0.06
0.08
0.1
0.12
0.14
0.16
-2 0 2 4 6 8 10 12
Loca
l b
usin
ess
chu
rn
Number of financial institutions in LGA
Perth
-0.02
-0.01
0
0.01
0.02
0.03
0.04
-2 0 2 4 6 8 10 12
Loca
l b
usin
ess
net g
row
th
Number of financial institutions in LGA
Perth
Access to Finance, June 2015 P a g e | 26
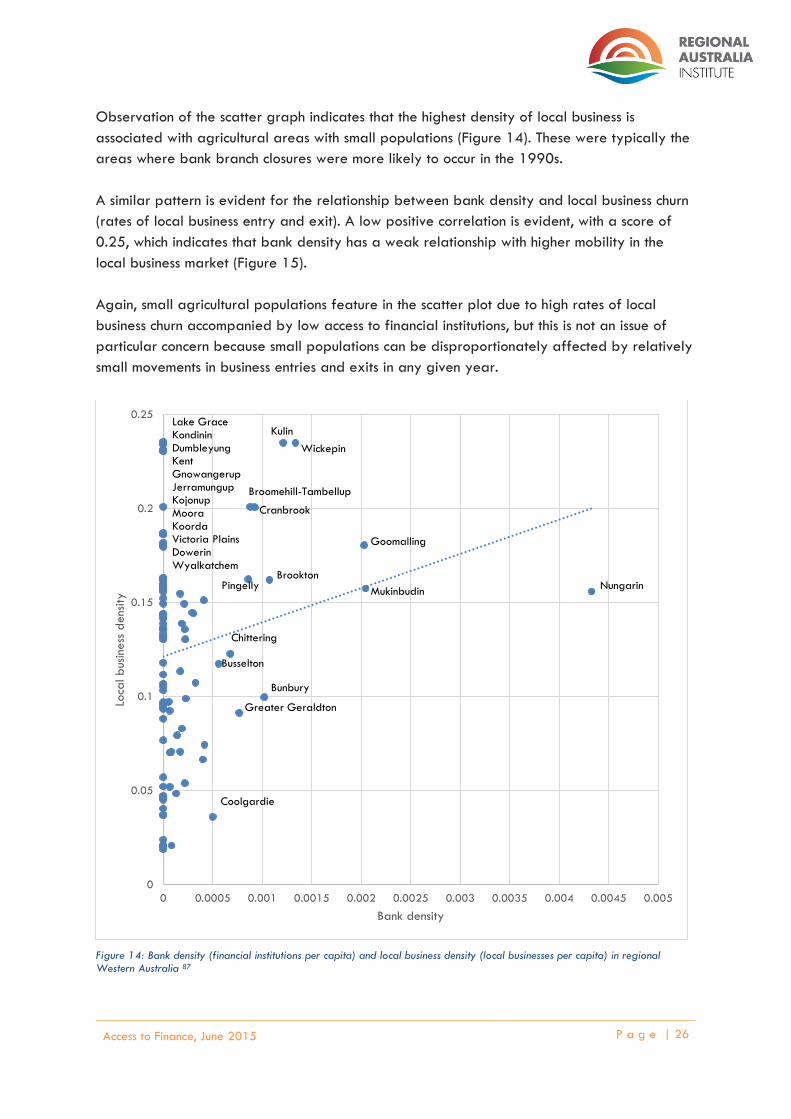
Observation of the scatter graph indicates that the highest density of local business is
associated with agricultural areas with small populations (Figure 14). These were typically the
areas where bank branch closures were more likely to occur in the 1990s.
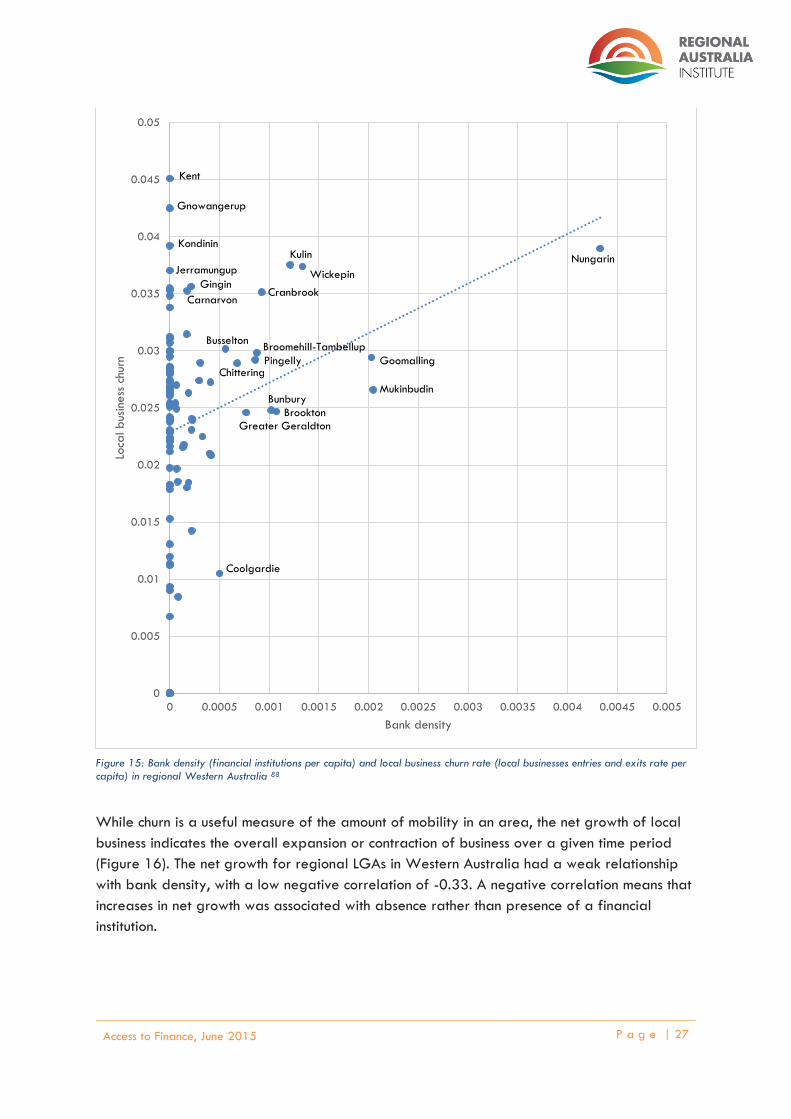
A similar pattern is evident for the relationship between bank density and local business churn
(rates of local business entry and exit). A low positive correlation is evident, with a score of
0.25, which indicates that bank density has a weak relationship with higher mobility in the
local business market (Figure 15).
Again, small agricultural populations feature in the scatter plot due to high rates of local
business churn accompanied by low access to financial institutions, but this is not an issue of
particular concern because small populations can be disproportionately affected by relatively
small movements in business entries and exits in any given year.
Figure 14: Bank density (financial institutions per capita) and local business density (local businesses per capita) in regional Western Australia 87
0
0.05
0.1
0.15
0.2
0.25
0 0.0005 0.001 0.0015 0.002 0.0025 0.003 0.0035 0.004 0.0045 0.005
Loca
l b
usin
ess
dens
ity
Bank density
Lake GraceKondininDumbleyungKentGnowangerupJerramungupKojonupMooraKoordaVictoria PlainsDowerinWyalkatchem
Kulin
Wickepin
Broomehill-Tambellup
Cranbrook
Goomalling
PingellyBrookton
MukinbudinNungarin
Chittering
Busselton
Bunbury
Greater Geraldton
Coolgardie
Access to Finance, June 2015 P a g e | 27
Figure 15: Bank density (financial institutions per capita) and local business churn rate (local businesses entries and exits rate per capita) in regional Western Australia 88
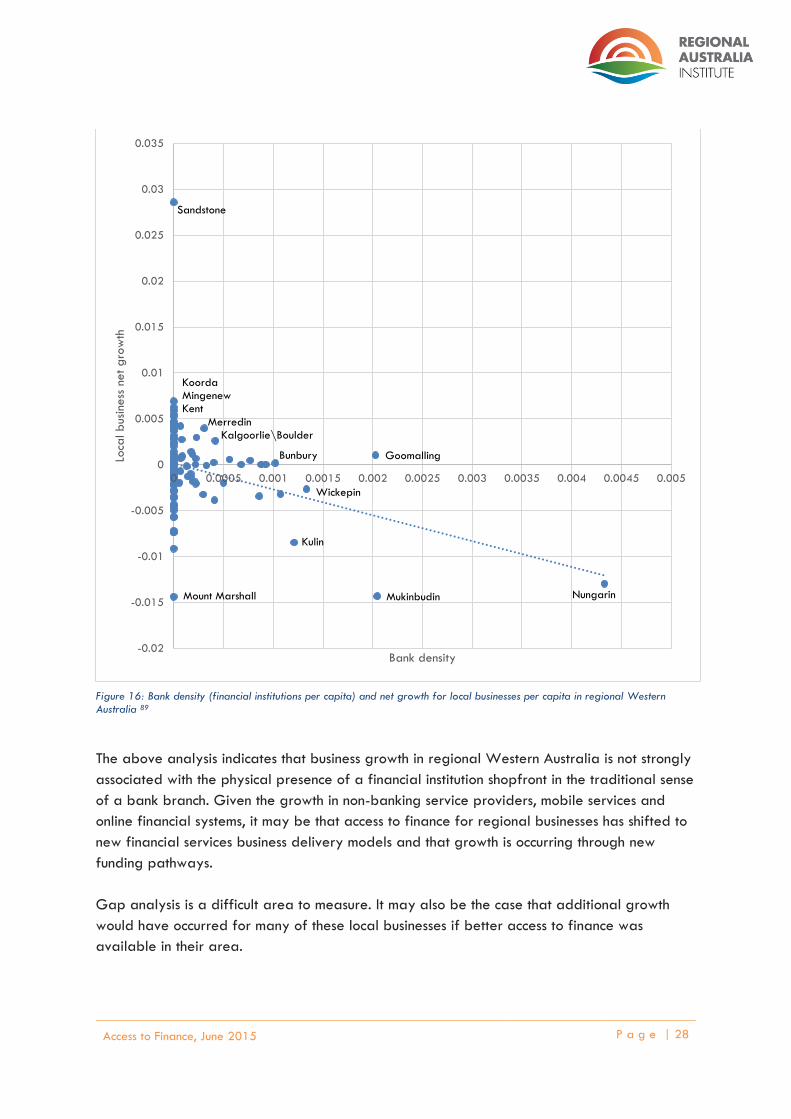
While churn is a useful measure of the amount of mobility in an area, the net growth of local
business indicates the overall expansion or contraction of business over a given time period
(Figure 16). The net growth for regional LGAs in Western Australia had a weak relationship
with bank density, with a low negative correlation of -0.33. A negative correlation means that
increases in net growth was associated with absence rather than presence of a financial
institution.
0
0.005
0.01
0.015
0.02
0.025
0.03
0.035
0.04
0.045
0.05
0 0.0005 0.001 0.0015 0.002 0.0025 0.003 0.0035 0.004 0.0045 0.005
Loca
l b
usin
ess
chu
rn
Bank density
Kent
Gnowangerup
Kondinin
Jerramungup
Gingin
CarnarvonCranbrook
Wickepin
Kulin Nungarin
BusseltonBroomehill-Tambellup
PingellyChittering
Goomalling
Mukinbudin
Brookton
Bunbury
Greater Geraldton
Coolgardie
Access to Finance, June 2015 P a g e | 28
Figure 16: Bank density (financial institutions per capita) and net growth for local businesses per capita in regional Western Australia 89
The above analysis indicates that business growth in regional Western Australia is not strongly
associated with the physical presence of a financial institution shopfront in the traditional sense
of a bank branch. Given the growth in non-banking service providers, mobile services and
online financial systems, it may be that access to finance for regional businesses has shifted to
new financial services business delivery models and that growth is occurring through new
funding pathways.
Gap analysis is a difficult area to measure. It may also be the case that additional growth
would have occurred for many of these local businesses if better access to finance was
available in their area.
-0.02
-0.015
-0.01
-0.005
0
0.005
0.01
0.015
0.02
0.025
0.03
0.035
0 0.0005 0.001 0.0015 0.002 0.0025 0.003 0.0035 0.004 0.0045 0.005
Loca
l b
usin
ess
net g
row
th
Bank density
Sandstone
KoordaMingenewKent
MerredinKalgoorlie\Boulder
GoomallingBunbury
Wickepin
Kulin
Mount Marshall Mukinbudin Nungarin

Access to Finance, June 2015 P a g e | 29
Importance of the Business Relationship
Evidence in Australia suggests that business relationships with financial institutions are seen as
more important by micro businesses and small businesses than for medium and large
businesses.90 Yet, less than two per cent of the 984 businesses in one recent research sample
indicated that they attended a branch for consultations regarding loans or other financial
products and services.91
A fundamental shift has occurred towards the use of online banking facilities by both business
and individuals in Australia. Tools such as internet banking and electronic payment transfers,
such as PAYPAL and EFTPOS systems, have almost completely displaced the petty cash and
business chequebook systems of the past. The growth of electronic banking systems have been
used as a rationale for the reduction in need for the high street bank branches that used to
feature in every small town in Australia.
Yet, this created a gap in the market as effective lending practices still required a business
relationship between the customer and the lending institution to enable effective assessment of
every application that did not fit the pro forma profile of the perfect applicant. This has seen
many banks steadily reduce their frontline business staff and lose a share of the lending
market to the small, community banks with micro branches and networks of mobile lenders who
have stepped in to meet the continuing demand from SMEs.
Relationships between lenders and business are important and productive. International
research indicates that relationship banking increases the competitive advantage of small
businesses access to finance, providing both a higher success rate for applications and
reduced costs for the borrower (e.g. waived or reduced fees and lower interest rates).92 The
greater local knowledge and networks available to community based banks are associated
with successful finance relationships with small business.93 In recognition of this, some banks in
Australia are now pursuing an expansion strategy to redress this situation.94
The establishment and rapid growth of the Bendigo Bank is testament to the value of business
and personal banking markets in regional Australia. The following case study examines the
role of Bendigo Bank as a provider of financial services to SMEs in regional Western
Australia.
Access to Finance, June 2015 P a g e | 30
Case Study 1: Bendigo Bank and Mobile Lending in
Regional Areas
Bendigo Bank established its Community Bank program in 1998. This program was initiated in
response to the closure of 29 per cent of Australia’s bank branches by other banks between
1993 and 2000. These closures left many regional businesses and communities without access
to any branch banking facilities.
Bendigo Bank with its affiliates, the Community Bank and the Rural Bank, offer banking to those
in regional Australia, with products and services specific to the needs of individuals and
businesses in these areas.95 A Community Bank is a locally owned and operated company
which functions as a franchise of Bendigo Bank.96 It is set up by local communities to meet their
needs and helps keep local capital in the region, but is supported by the Bendigo Bank
infrastructure and services systems.
The Rural Bank is a fully owned subsidiary of Bendigo Bank and provides specialist banking
services to regional Australia from assistance for large agribusinesses to personal money
management for small rural producers and SMEs.97 Products and services offered through
Rural Bank are easy to access through affiliate relationships with Elders Rural Services
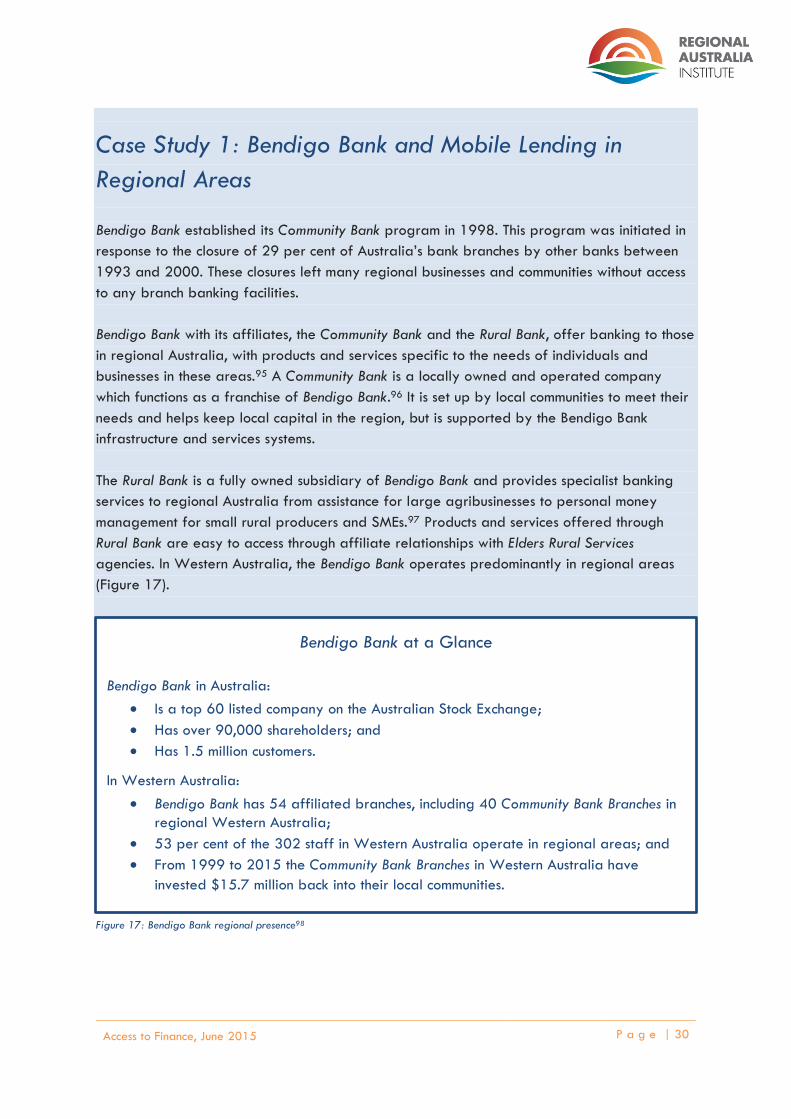
agencies. In Western Australia, the Bendigo Bank operates predominantly in regional areas
(Figure 17).
Figure 17: Bendigo Bank regional presence98
Bendigo Bank at a Glance
Bendigo Bank in Australia:
Is a top 60 listed company on the Australian Stock Exchange;
Has over 90,000 shareholders; and
Has 1.5 million customers.
In Western Australia:
Bendigo Bank has 54 affiliated branches, including 40 Community Bank Branches in
regional Western Australia;
53 per cent of the 302 staff in Western Australia operate in regional areas; and
From 1999 to 2015 the Community Bank Branches in Western Australia have
invested $15.7 million back into their local communities.

Access to Finance, June 2015 P a g e | 31
Benefits for SMEs
Bendigo Bank’s expansion was enabled by the gap in the market for regional specific banking
and business options resulting from the withdrawal of the ‘big four’ banks99 from regional
Australia. Bendigo Bank and its affiliates are driven by a philosophy of active engagement
with regional communities, as well as offering financial services for businesses in regional
areas. This increases commercial confidence and facilitates local economic development.
Banks that are run by locals or that have a specific focus on regional Australia allow for
specialised understanding of the needs of and issues facing local business. They also have a
greater flexibility to offer tailor-made programs and solutions. These factors both facilitate
access to finance for regional SMEs.
Financial products can also be developed that better meet the needs of regional SMEs. For
example, long-term and short-term financing options that consider the often unpredictable and
cyclic nature of regional life. Such options allow regional businesses to forward plan, enable
growth and have the flexibility to adapt to short term changes in external markets. The
development of a more responsive financial system aims to improve the understanding of
regional businesses to achieve long term sustainability and help grow more economically
stable communities.
The Rural Bank specifically aims to develop a more nuanced and detailed understanding of
regional businesses through its Relationship Managers. These are people with farming
expertise who can visit their clients on site to enhance their understanding of each particular
business. This allows the bank to more accurately assess the merits and risks of each business
and offer access to services that better meet individual business needs and capacity.
Relationship banking helps to reduce the risk profile for the lender, but also improves
knowledge spillover as the Relationship Manager builds a network through the local
community, potentially creating more opportunities for economic growth. Furthermore, this
knowledge spillover supports the growth of local knowledge by providing access to external
expertise in Bendigo Bank, and, in turn, informs the Bank’s understanding of regional financial
needs.

Access to Finance, June 2015 P a g e | 32
Non-Bank Lending
As SMEs often have limited capacity to realise funding through equity markets, they are more
likely to access debt funding sources from banking institutions to finance growth. Even though
this is the dominant trend, a minority of businesses do access other means of funding, both
debt and equity based.
Research in Australia reveals that approximately 10 per cent of all small businesses currently
access non-banking sources of finance.100 A larger trend for SMEs is to enable growth through
access to business credit, such as leases and short-term credit facilities.101
Business Credit
Small businesses tend to have a high use of business credit facilities, particularly equipment
and vehicle leasing services, and short term trade credit facilities provided by suppliers.102
These can be used as a means of business survival, but can also be important ways to realise
opportunities for business growth. The attractiveness of these options is that they free up cash
flow, do not tie up assets, and generally require less paperwork than bank funding.
Other unsecured funding can be realised through invoice factoring and discounting, where a
company can realise cash by selling unpaid invoices.103 This is a growing industry in Australia
worth approximately $64 billion in the year to March 2014 and used by almost 4,500
businesses.104 Factoring and discounting services are now provided by most of the major banks
in Australia and a number of smaller finance firms.
These services reached a peak of $70 billion per annum in the year ending March 2009, in
the post-GFC period. Businesses in Western Australia represented approximately 10 per cent
of the funds realised through invoice factoring and discounting in 2014.105 Biggest users of
these services were the wholesale trade sector and manufacturing industry. The agricultural
and mining industries collectively represented only four per cent of receivables in the quarter
to March 2014.106
Bootstrapping refers to very small business start-ups with very low overheads who build
business turnover quickly by relying on credit cards, trade credit, equipment leasing or
advances from customers.107 Bootstrapping businesses typically have a single operator or
small multi-skilled team.108 They also rely on extensive use of personal and social media
networks to build their business and customer base and take advantage of market
opportunities.109 Bootstrap businesses are usually too small to attract venture capital and are
perceived as high risk by banks, restricting their access to business finance products (other than
credit cards).

Access to Finance, June 2015 P a g e | 33
Venture Capital and Angel Investment
Venture capital is a formal investment process where a large amount of capital funding
(usually several million dollars) is provided in exchange for equity in a specific company or
project. Venture capital relationships are usually sourced at a national or international level.
Managers of venture capital funds provide a range of services to assist investors and work as
mentors for loan recipients, but have relatively high management fees which creates a barrier
for many SMEs.110
Venture capital availability and usage varies greatly by industry. The Commonwealth funded
Innovation Investment Fund (IIF) had a higher level of investment in the biotechnology and ICT
sectors between 1997 and 2009, when compared to private venture capital/private equity
projects in Australia in the same period.111 The return on IIF investments followed the
international pattern with a small number of projects providing a very high return on
investment and the majority providing only a partial return, and approximately a third having
a negative return on investment.112
Consultations by the RBA indicates that rates of access to venture capital by small business
may be very low in Australia, as anecdotal evidence suggests that very few small businesses
have achieved successful venture capital funding.113 The Financial Systems Inquiry identified
that the small scale of the Australian market limits the potential for development of a bigger
venture capital market.114 The FIS final report suggests that gaps in the venture capital market
for small business may be better met through improving access to innovative finance, such as
crowd-funding.115
In Western Australia, venture capital is most commonly associated with the mining industry.
Further research is required to assess the extent of its use in other industries and particularly in
the SME sector.
Angel Investment
In contrast to the formality and highly regulated environment for venture capital
arrangements, angel investment works on a smaller and more localised scale. Angel investors
provide valuable assistance both financially and through mentoring for entrepreneurs and
fledgling businesses. They bridge the gap between formal investors such as venture capital
funds and informal investors such as family and friends. Some angel investors invest as a
syndicate, but most invest alone.
Angel investment is an established and extensive activity overseas, particularly in the USA.
Angel investors invest in a broad range of businesses, often specialising in an area where they
have personal expertise.116 A number of investor groups or associations have been
established in many international countries, often forming syndicates to spread risk, and
typically investing from USD$25,000 to USD$500,000 in each project or business.117
Access to Finance, June 2015 P a g e | 34
Funding from angel investors is usually provided at an early stage, such as seed funding for a
project or start-up funds to establish a business. These businesses are often high risk, due to
small size, lack of established trading history, or a lack of tangible assets, but each business
has an idea or knowledge base that is potentially viable and attractive to the individual
angel investor.118 As angel investors are investing their own money they have more freedom
than other financial institutions to invest in businesses where they see potential.
Unlike informal lending from family and friends, angel investors will usually have no personal
connection to the entrepreneur, but may provide a mentoring role to help develop the project
or business.119 The angel investor typically works within a relatively small spatial area, either
locally or within an accessible regional boundary, maximising their advantage of local
knowledge and industry expertise.120
Research suggests that angel investors also support a wider range of businesses in terms of
both industry sectors and geographical area compared to traditional venture capital firms121.
In addition to financial assistance, angel investors can bring knowledge and expertise to a
business. Angel investors are often successful business people with significant business
experience, resources and social capital. The provision of information, strategic advice and
mentoring is considered highly useful by entrepreneurs and often considered more valuable
than the financial assistance the angel investors provide122.
Angel investment in SMEs, particularly in regional areas, will likely offer benefits to the wider
community as well as for individual businesses. The flexibility and local knowledge inherent in
the angel investment model can overcome some of the institutional barriers preventing access
to finance for regional small businesses at present. Business start-ups and high growth early in
the business life can be important for generation of local jobs and help to provide new goods
and services to regional communities in Western Australia.
Data on angel investment is very limited in Australia. While some angel investor networks exist
in regional areas such as the Hunter Valley and Gold Coast, most angel investment is focused
around capital cities.123 The websites of angel investment networks often have quite limited
information about their active angel investors or the businesses they have helped, as privacy
of the investor and recipient seems to be a key characteristic of many operations.
In addition, anecdotal information suggests that other individuals in Australia may work
independently to invest and foster business growth in their local area and not be part of an
angel investment network. Further research into the activities of angel investors in Australia
would offer insight into the extent and success of these networks. Available evidence suggests
that there is a likely gap in the availability of angel investment in regional Western Australia.
This is explored through the following case study.
Access to Finance, June 2015 P a g e | 35
Case Study 2: Angel Investment in Regional Business in
Western Australia
The Western Australian Angel Investors Inc. (WAAI) is the only angel investor network that
could be identified as currently active in Western Australia. The WAAI was established in
2010 and specialises in early stage companies in the technology sector in Perth.124 The
guidelines for investment criteria require recipient businesses to be located in Western
Australia, and offer substantial equity in return for capital investment.125
Returns on investment are anticipated to be better than 10 times the original investment and
occur within a four to eight year timeframe.126 Successful projects funded through WAAI are
described as highly innovative, backed by proven science, and with high commercialisation
prospects.127 Projects receiving funding also need to have a strategy to capture more than a
fifth of the target market where that market is valued at more than $100 million.128
Projects may attract investment from individual WAAI members or from a syndicate of
members. The typical investment through WAAI is from $25,000 to $100,000 for individuals,
and up to $500,000 for a syndicate investment.129 Investors may limit themselves to a purely
financial transaction or provide mentoring based on industry knowledge and entrepreneurship
skills related to business start-ups.130
The WAAI is sponsored by the Chamber of Commerce and Industry Western Australia (CCIWA)
and Business Foundations.131 The Regional Chambers of Commerce and Industry WA network,
affiliated with CCIWA, offers potential for the development of greater angel investment
activity in regional areas.132 The expansion of Business Foundations’ business incubation
services and activities supporting entrepreneurial activity into regional areas of Western
Australia could also be used to facilitate greater access to angel investment for regional
SMEs.133
Available information suggests that a gap may exist in access to angel investment finance for
regional SMEs. Better availability of angel investment is likely to support innovation and
entrepreneurship for those SMEs in regional Western Australia who have potential to offer the
returns high required by angel investment, but experience difficulty accessing finance through
traditional avenues.134
Growing the awareness of angel investment as a potential option for SMEs to access finance
may be beneficial, as consultation indicates that a lack of information on financing options also
limits the growth of regional SMEs in Western Australia.135 The trend for angel investors to
invest in local areas, combined with the need for greater awareness of this investment option,
makes the development of regional networks a priority.

Access to Finance, June 2015 P a g e | 36
Other Non-Bank Lending
SMEs in regional areas may be more likely to obtain funding through non-bank lending
systems. These systems often offer more flexible funding pathways and less restrictive
assessment criteria than institutional lenders. Many of these systems are highly accessible to
regional SMEs as they are delivered through online portals.
Crowdfunding
A relatively new source of finance involves crowdfunding. This process uses internet based
crowdfunding resource websites usually accompanied by intensive social media or marketing
campaigns to obtain small amounts of individual funding from many investors/donors.
Crowdfunding schemes are most often associated with business start-ups and with social or
charitable causes. Crowdfunding websites offer two main benefits. Firstly the SME can access
a wide pool of potential investors. Secondly, the exposure on the website can help to build a
customer base to support the launch of a new business. These factors are important to regional
SMEs as they can offset the challenge of thinner markets in many areas of Western Australia.
Investment schemes may offer equity in the business, a monetary return on a loan, or other
tangible goods and services as rewards in return for funds received.136 Other crowdfunding
schemes may simply collect donations, usually for some kind of charitable activity or social
cause. Businesses can collect donations to support growth and innovation activity, but this may
have tax implications. Donations may be considered as revenue for tax purposes or be liable
for GST, particularly if some type of reward or tangible benefit is offered to donors.137
Recognising the impact that social media was having on financial practices and its importance
as a potential enabler of economic growth, the Australian Government began a consultation
process into crowd-sourced equity funding in December 2014.138 Crowdfunding equity raising
schemes in Australia are covered by laws administered by the Australian Securities and
Investment Commission.139 The consultation paper notes a number of regulatory barriers
preventing the growth of crowdfunding in return for small equity in businesses in Australia.140
Cost of regulatory compliance when undertaking public offers of equity is identified as a
critical issue for SMEs.141
Data is limited on the adoption of crowdfunding equity schemes by SMEs in Western Australia.
Expansion of equity based crowdfunding platforms is happening at a national level, with
activity on Australian-based websites such as VentureCrowd, OzCrowd, Crowdfund It, and
Equitise indicating a level of existing demand in the market. The online nature of crowdfunding
makes it an accessible resource for start-ups in regional areas, which offers potential
additional access to finance pathways for SMEs in regional Western Australia.
Access to Finance, June 2015 P a g e | 37
Peer to Peer Lending
Peer to peer companies work as online intermediaries to match lenders of finance directly with
borrowers.142 A number of peer to peer operators exist in Australia, including Society One,
Ratesetter, and Lending Hub. Opportunities in the Australian market have also attracted the
expansion of the UK company, ThinCats, which specifically targets SMEs with insufficient assets
to offer as security for bank finance.143
Peer to peer companies receive fees from both lenders and borrowers in return for applicant
screening, financial management and contractual services, including loan insurance and debt
collection services if required. Peer to peer systems can offer lower rates and fees than
traditional financial institutions, due to the lower overheads enabled by a network system.144
Lenders receive interest on the loan, which is for an agreed time and at an agreed rate.
Lenders still carry the risk if borrowers fail to repay funds, but the peer to peer company may
spread the full investment amount across a number of borrowers to reduce risk.145
At present, there is no data on the extent of peer to peer lending in Australia. Like
crowdfunding, the online nature of these businesses enable easy access for SMEs in regional
areas, and offers potential additional access to finance pathways for SMEs in regional
Western Australia.
Guarantor and Loan Schemes
SMEs with limited or no assets may be able to obtain a business loan if they have a guarantor.
Guarantors commit to repaying the loan in full plus administrative costs if the debtor
defaults.146 Some international schemes provide government guarantees to the lender, such as
the Enterprise Finance Guarantee scheme in the United Kingdom.147 Such schemes seek to
promote innovation and business start-ups where the risk is deemed too high to attract
commercial lenders.
The Financial System Inquiry report notes that while government guarantor and loan schemes
would improve access to finance for SMEs in Australia, the potential cost to taxpayers could
be substantially greater than potential benefit from stimulus to growth.148 This is due to issues
of adverse selection (where higher risk SMEs are refused finance by financial institutions make
up a disproportionate component of participants within a government scheme).
Guarantor and loan schemes may also work to assist particular groups or industries, such as
the Canadian government schemes to assist specific regional areas and cultural groups.149 This
is also the case for Many Rivers Microfinance Limited, a not-for-profit organisation working in
regional Western Australia to assist business start-ups, as detailed in the following case study.
Access to Finance, June 2015 P a g e | 38
Case Study 3: Many Rivers Microfinance
Many Rivers Microfinance Limited is a not-for-profit organisation established in 2007 to
support aspiring business owners with microenterprise development support and access to
finance150. Many Rivers has a particular focus on assisting Australians who wish to start or
expand a business but have been financially and/or socially excluded from doing so,
particularly Indigenous Australians.
Many Rivers offers financial and other business support to their clients. This is enabled through
partnerships with philanthropic donors and foundations, corporate companies, Indigenous
corporations, and varied sources of government funding, such as the Small Business
Development Corporation in Western Australia.
Many Rivers works in both regional communities and metropolitan cities. It has 15 field officers
working in various regions across Western Australia, New South Wales and Queensland. In
Western Australia, offices are located in Perth, the Pilbara, East Kimberley, and West
Kimberley regions. Another four field officers are planned for Western Australia in 2015/16.
Field officers offer one-on-one mentoring and a number of other services to facilitate business
readiness. These services can include setting up an ABN, registering a business name, opening
up a business bank account, teaching clients how to manage their business finances, supporting
clients in business meetings, helping clients to source the most suitable insurance, or arranging
for pro-bono legal assistance or advice through the support of Many Rivers’ partners.
Field officers are also able to recommend the approval of microfinance business loans, which
are provided with subsidised interest rates. This access to finance is supported primarily
through a strategic alliance with Westpac. Many Rivers acts as a guarantor for the loan and
carries the default risk.
Clients obtain the support of Many Rivers by contacting the organisation directly or can be
referred to by existing clients and also by funder and partner organisations such as the Small
Business Development Corporation in Western Australia.
Since 2010, Many Rivers has helped establish 206 new businesses and expanded 42 existing
businesses in Western Australia (Table 3). The majority of business support activity has been in
regional areas.
Currently, over 90 per cent of the loans in Western Australia have been repaid and 74 per
cent of businesses supported have achieved business sustainability.151 Both loan repayment
rates and business sustainability levels are higher in Western Australia compared to the
national average.

Access to Finance, June 2015 P a g e | 39
The work of Many Rivers has numerous benefits for regional communities. In addition to the
economic gains realised by the growth of new business, important work is undertaken to
increase human capital by improving the financial literacy and business knowledge of
individuals. Benefits for the community include the provision of goods and services and the
creation of local jobs. Overall, this can contribute to decreased welfare dependency and
increased stability in local communities.
Access to finance in the more remote areas of Western Australia has been identified as
problematic for many SMEs.152 This has been attributed to the inability of these businesses to
meet loan conditions such as collateral requirements.153 Many Rivers’ alliance with Westpac
extends access to finance for people who would not meet ordinary business loan criteria, and
supports success through ongoing mentoring, support and assistance in improving financial
literacy. In addition, clients who repay their loans are also able to build a favourable credit
history with a major bank, which provides an ongoing benefit in the longer term.
Many Rivers has identified that significant funding gaps exist in Western Australia, and are
only able to operate in regional areas with support from State and Federal government and
through philanthropic donations.154 This limits their current capacity, but offers potential for
expansion if awareness can be raised regarding the economic and social value of their
operations. The expansion of such operations offers a likely benefit to the development of
SMEs across other regional areas in Western Australia, particularly those with people
experiencing long term disadvantage.
Table 3: Many Rivers' program results as of March 2015 in Western Australia
Regional Western
Australia
Percentage in regional Western
Australia Total for Western
Australia
New businesses established 155 75% 206
Existing businesses expanded 36 86% 42
Number of loans provided 110 71% 156
Total value of loans made $547,675 70% $770,475
Non-financial support provided 107 86% 124
Number of business owners assisted 227 79% 287
Number of business owners who are Indigenous people
170 89% 190
Data sourced from: Many Rivers (2014) http://www.manyrivers.org.au/our-program/program-results/

Access to Finance, June 2015 P a g e | 40
The Importance of Non-Bank Funding for Enabling
Innovation
Non-bank funding sources are particularly important for growth related to innovation.
Research in Australia indicates that the larger the business, the easier it is to access to funds to
enable innovation and further grow the size of the business. Large businesses (200 employees
or more) have greater success with access to funding for innovation, with under 15 per cent
reporting this as a barrier to growth.155 In contrast, a quarter of medium sized businesses (20-
199 employees) and more than a third of micro businesses (zero to four employees) in
Australia identified inability to access finance as a barrier to growth.156
In Western Australia, these trends would suggest that difficulty in accessing finance to fund
innovation could act as a barrier to growth for an estimated 6,000 regional SMEs. The barrier
to development of innovation is of specific concern to general economic growth.
Furthermore, research indicates that the highest potential for small business growth occurs in
businesses with one to four employees.157 There were 12,399 SMEs with one to four
employees in Western Australia in 2012. If these smaller regional businesses have additional
barriers in accessing finance, this creates multiple levels of disadvantage which would likely
discourage investment in innovation within these SMEs. This would further inhibit the growth of
regional economies in the longer term.
Large business
•200 or more employees
• 15 per cent can't access to funds for innovation
Medium business
•20 to 199 employees
• 25 per cent can't access funds for innovation
Small business
•Less than 20 employees
• 30 per cent can't access funds for innovation

Access to Finance, June 2015 P a g e | 41
Conclusion
Factors in the post-GFC lending environment have contributed to a more restricted availability
of finance for SMEs in Australia. National trends include more conservative assessments of risk,
a reduced level of competition for business loans, and restrictions in loan supply to give banks
greater control over levels of market exposure (as imposition of higher interest rates risk
adverse selection occurring). The wider financial environment has led to a general slowdown in
most parts of the Australian economy; this leads businesses to focus on survival which further
inhibits growth.
Analysis of available regional data in Western Australia indicates that regional areas do not
necessarily face additional barriers when compared to metropolitan regions in accessing
finance. This may reflect industry factors, due to the dominance of agriculture and mining in
many regional areas. Agriculture is a high user of debt finance with established lending
relationships (creating a high level of known information to inform bank assessment of risk)
and an established pattern of using land as collateral for loan funds. In contrast, mining is a
high user of equity finance. This finance is sought through capital markets rather than banks, or
through joint ventures in exchange for equity in the project.
Yet, there is evidence of potential gaps and additional barriers for some SMEs in obtaining
access to finance. This can be either from being in a higher risk group or from issues of
information asymmetry. Such groups may include:
Start-ups with limited credit history;
Business proposals that are highly innovative;
Small businesses with lower levels of existing turnover or limited local market demand;
SMEs without substantial assets for collateral;
SMEs with limited financial literacy; and
SME with intangible collateral assets, e.g. based on intellectual property or specialist
service delivery, such as ICT, technology, education, scientific or professional services.
Banks in Australia have indicated that loan application decline rates are more than twice as
high for business start-ups compared to established businesses.158 Thinner markets in many
regional areas are likely to add to the disadvantage perceived by financial institutions when
assessing applications for loans to grow business for regional SMEs. This creates the potential
situation that those in most need of funding are least likely to receive support, and be a likely
disincentive for regional businesses to even apply for funds. In combination, these factors
would likely work as a barrier to the growth of regional business.
Access to Finance, June 2015 P a g e | 42
SMEs which are perceived to be in a higher risk group also usually face increased costs when
borrowing. Higher costs are an appropriate market response when there are greater levels of
risk associated with lending. That said, inequity occurs in markets when differential access to
finance and higher costs of lending result from asymmetric information. This inhibits growth by
working as a disincentive to applying for finance, or by placing additional stress on the
business to meet higher payments while also reducing the cash flow available for expansion
and consolidation. In a worst case scenario higher interest costs may contribute to a higher risk
of business failure.
Improved data about regional business is an essential need. The Western Australian
Department of Regional Development’s business survey will help to identify some of the needs
and barriers faced by regional businesses in Western Australia. While some of these issues
are likely to reflect the national trends identified in this paper, it will be valuable to close the
existing knowledge gap about how regional status can benefit or challenge the growth of
different types of SMEs. Further research into the growth potential of regional business is also
recommended.
The reports of the Financial Services Inquiry159 confirm that some SMEs face structural barriers
which inhibit growth, particularly in higher lending costs, greater collateral requirements and
limitations in potential for market size. However, it found no evidence of specific barriers
related to rural businesses. This may be related to a lack of data rather than the lack of a
problem for regional SMEs.
The RAI’s analysis indicates that while there is no evidence of a generalised market failure for
the majority of SMEs in regional Western Australia, some groups may be facing additional
barriers or substantially higher costs in accessing finance due to the nature of their business
type or asymmetric information issues. Of specific concern are the barriers affecting business
start-ups and inhibiting the development of a larger knowledge-based industry in regional
Western Australia. These are critical factors for the future growth and creation of economic
diversity in regional areas. Regional policy options need to be considered to address these
gaps and facilitate the growth of regional business.
Access to Finance, June 2015 P a g e | 43
Appendix A: Lists of Figures and Tables
List of Tables
Table 1 Estimated access to finance for small business in Australia .................................................................................. 11
Table 2: Examples of loan mortgage insurance postcode lending guides for Western Australia ............................. 22
Table 3: Many Rivers' program results as of March 2015 in Western Australia ........................................................... 39
List of Figures
Figure 1: SMEs in Western Australia to June 2012 by regional or metropolitan location ............................................ 3
Figure 2: Key characteristics of SMEs in Western Australia .................................................................................................. 4
Figure 3: Smoothed unemployment rates in LGAs with high employment in gold mining for the
Goldfields/Esperance region ........................................................................................................................................................ 7
Figure 4: Variation in importance of access to finance by state or territory ................................................................. 16
Figure 5: Variation in importance of access to finance for small businesses by existing credit use and location ... 17
Figure 6: Variation in importance of access to finance for small businesses by existing credit use for businesses in
Western Australia ......................................................................................................................................................................... 18
Figure 7: Comparison of metropolitan and regional small business use of business lending products ..................... 19
Figure 8: Comparison of metropolitan and regional small business amount of loan .................................................... 20
Figure 9: Comparison of metropolitan and regional small business amount of loan outstanding............................... 21
Figure 10: Number of financial institutions and usual resident population in regional Western Australia in 2011
.......................................................................................................................................................................................................... 23
Figure 11: Financial institution proximity and local business density in Western Australia ......................................... 25
Figure 12: Financial institution proximity and local business churn in Western Australia ............................................ 25
Figure 13: Financial institution proximity and local business net growth in Western Australia .................................. 25
Figure 14: Bank density (financial institutions per capita) and local business density (local businesses per capita) in
regional Western Australia ....................................................................................................................................................... 26
Figure 15: Bank density (financial institutions per capita) and local business churn rate (local businesses entries
and exits rate per capita) in regional Western Australia .................................................................................................. 27
Figure 16: Bank density (financial institutions per capita) and net growth for local businesses per capita in
regional Western Australia ....................................................................................................................................................... 28
Figure 17: Bendigo Bank regional presence .......................................................................................................................... 30

Access to Finance, June 2015 P a g e | 44
Contacts and Further Information
To discuss this research report please contact:
Jack Archer
Deputy CEO
Regional Australia Institute (RAI)
(02) 6260 3733
Level 2, 53 Blackall Street
Barton ACT 2600
Further information on the work of the RAI can be found at www.regionalaustralia.org.au
Access to Finance, June 2015 P a g e | 45
References and End Notes
1 This report uses the ABS definition that small businesses employ less than 20 people and medium businesses employ 20 to 200 people. Source: ABS (2002) Small business in Australia Cat. No. 1321.0 http://www.abs.gov.au/ausstats/[email protected]/mf/1321.0
Australian Government The Treasury (2014) Financial systems inquiry. Interim report. Canberra: Commonwealth of Australia http://fsi.gov.au/files/2014/07/FSI_Report_Final_Reduced20140715.pdf
Berger, A. and Udell, G. (1995) Universal banking and the future of small business lending. Working paper 95-17. New York: The Wharton Financial Institutions Center. 2 Asian Development Bank (2013) ADB–OECD study on enhancing financial accessibility for SMEs: Lessons from recent crises. Mandaluyong City, Philippines: Asian Development Bank http://www.oecd.org/cfe/smes/adb-oecd-study-enhancing-financial-accessibility-smes.pdf 3 The Treasury (2014) Crowd-sourced equity funding. Canberra: Commonwealth of Australia http://www.treasury.gov.au/~/media/Treasury/Consultations%20and%20Reviews/Consultations/2014/Crowd%20Sourced%20Equity%20Funding/Downloads/PDF/CSEF%20Discussion%20Paper.ashx 4 Asian Development Bank (2013) ADB–OECD study on enhancing financial accessibility for SMEs: Lessons from recent crises. Mandaluyong City, Philippines: Asian Development Bank http://www.oecd.org/cfe/smes/adb-oecd-study-enhancing-financial-accessibility-smes.pdf 5 RSM Bird Cameron (2013) Think big 2013. Perth: RSM Bird Cameron http://www.rsmi.com.au/news_/special_reports/thinkbig_2013.html 6 RSM Bird Cameron (2013) Think big 2013. Perth: RSM Bird Cameron http://www.rsmi.com.au/news_/special_reports/thinkbig_2013.html 7 RSM Bird Cameron (2013) Think big 2013. Perth: RSM Bird Cameron http://www.rsmi.com.au/news_/special_reports/thinkbig_2013.html
8 Kehoe, J. (2013) Small businesses slam big banks in satisfaction survey. Australian Financial Review 29 July
2013; RSM Bird Cameron (2013) Think big 2013. Perth: RSM Bird Cameron http://www.rsmi.com.au/news_/special_reports/thinkbig_2013.html 9 Morris, N. (2015) Business confidence declines in April. Roy Morgan Research http://www.roymorgan.com/findings/6227-business-confidence-declines-april-201505070133 10 Kehoe, J. (2013) Small businesses slam big banks in satisfaction survey. Australian Financial Review 29 July 2013; Morris, N. (2015) Business confidence declines in April. Roy Morgan Research http://www.roymorgan.com/findings/6227-business-confidence-declines-april-201505070133 11 World Bank (2014) Financial inclusion: Importance, key facts, and drivers. Chapter one in Global financial development report 2014 http://econ.worldbank.org/WBSITE/EXTERNAL/EXTDEC/EXTGLOBALFINREPORT/0,,contentMDK:23489639~pagePK:64168182~piPK:64168060~theSitePK:8816097,00.html 12 Asymmetry of information in finance refers to the imbalance in transactions where one party to a contract has access to greater information which places the second party at a disadvantage. Issues of asymmetry across financial markets can devalue the worth of a person or business, affecting even those who offer good prospects for loans. Stiglitz, J. and Weiss, A. (1981) Credit rationing in markets with imperfect information. The American economic review, 71, 3, 393-410 13 Australian Government The Treasury (2014) Financial systems inquiry. Interim report. Canberra: Commonwealth of Australia http://fsi.gov.au/files/2014/07/FSI_Report_Final_Reduced20140715.pdf 14 RSM Bird Cameron (2013) Think big 2013. Perth: RSM Bird Cameron http://www.rsmi.com.au/news_/special_reports/thinkbig_2013.html 15 Connolly, E., Norman, D., and West, T. (2012) Small business: An economic overview Paper presented to Small Business Finance Roundtable, May 2012, Reserve Bank of Australia. http://www.abs.gov.au/websitedbs/d3310114.nsf/4a256353001af3ed4b2562bb00121564/d291d673c4c5aab4ca257a330014dda2/$FILE/RBA%20Small%20Business%20An%20economic%20Overview%202012.pdf 16 ABS (2001) Small business in Australia ABS Cat No. 1321.0 http://www.abs.gov.au/ausstats/[email protected]/mf/1321.0

Access to Finance, June 2015 P a g e | 46
17 Connolly, E., Norman, D., and West, T. (2012) Small business: An economic overview Paper presented to Small Business Finance Roundtable, May 2012, Reserve Bank of Australia. http://www.abs.gov.au/websitedbs/d3310114.nsf/4a256353001af3ed4b2562bb00121564/d291d673c4c5aab4ca257a330014dda2/$FILE/RBA%20Small%20Business%20An%20economic%20Overview%202012.pdf 18 Connolly, E., Norman, D., and West, T. (2012) Small business: An economic overview Paper presented to Small Business Finance Roundtable, May 2012, Reserve Bank of Australia. http://www.abs.gov.au/websitedbs/d3310114.nsf/4a256353001af3ed4b2562bb00121564/d291d673c4c5aab4ca257a330014dda2/$FILE/RBA%20Small%20Business%20An%20economic%20Overview%202012.pdf 19 Connolly, E., Norman, D., and West, T. (2012) Small business: An economic overview Paper presented to Small Business Finance Roundtable, May 2012, Reserve Bank of Australia. http://www.abs.gov.au/websitedbs/d3310114.nsf/4a256353001af3ed4b2562bb00121564/d291d673c4c5aab4ca257a330014dda2/$FILE/RBA%20Small%20Business%20An%20economic%20Overview%202012.pdf 20 RAI calculations based on ABS (2013) Counts of Australian Businesses, including Entries and Exits, Jun 2008 to
Jun 2012. ABS Cat No 8165.0. SMEs are defined as businesses with less than 200 employees. Businesses by industry division by SA2 by employment size ranges, June 2012. Released 12 July 2013. 21 RAI calculations based on ABS (2013) Counts of Australian Businesses, including Entries and Exits, Jun 2008 to Jun 2012. ABS Cat No 8165.0. SMEs are defined as businesses with less than 200 employees. Businesses by industry division by SA2 by employment size ranges, June 2012. Released 12 July 2013. 22 RAI calculations based on ABS (2013) Counts of Australian Businesses, including Entries and Exits, Jun 2008 to Jun 2012. ABS Cat No 8165.0. SMEs are defined as businesses with less than 200 employees. Businesses by industry division by SA2 by employment size ranges, June 2012. Released 12 July 2013. 23 Connolly, E., Norman, D., and West, T. (2012) Small business: An economic overview Paper presented to Small Business Finance Roundtable, May 2012, Reserve Bank of Australia. http://www.abs.gov.au/websitedbs/d3310114.nsf/4a256353001af3ed4b2562bb00121564/d291d673c4c5aab4ca257a330014dda2/$FILE/RBA%20Small%20Business%20An%20economic%20Overview%202012.pdf 24 RAI calculations based on ABS (2013) Counts of Australian Businesses, including Entries and Exits, Jun 2008 to Jun 2012. ABS Cat No 8165.0. SMEs are defined as businesses with less than 200 employees. Businesses by industry division by SA2 by employment size ranges, June 2012. Released 12 July 2013. 25 Small Business Development Corporation (2014) 2014 State of small business survey http://www.smallbusiness.wa.gov.au/2014-state-of-small-business-survey/ 26 ABS (2013) Counts of Australian businesses, including entries and exits. Businesses by industry division by statistical area level 2 by employment size ranges, June 2012. Cat. No. 8165.0 released 12 July 2013 Small Business Development Corporation (2014) 2014 State of small business survey http://www.smallbusiness.wa.gov.au/2014-state-of-small-business-survey/ 27 Nicolaou, J. (2014) WA business confidence approaching GFC levels. Statement on findings of the Westpac-CCI Survey of Business Expectations. WA Chamber of Commerce and Industry 23 December 2014 http://cciwa.com/docs/default-source/media/business-expectations-dec-2014-media-statement.pdf?sfvrsn=2 accessed 08/01/14 28 Department of Regional Development (2014) Goldfields-Esperance: A region in profile 2014. Perth: Government of Western Australia http://www.drd.wa.gov.au/Publications/Documents/A_region_in_profile_2014_Goldfields_Esperance.pdf 29 RAI consultation with regional business and regional development organisations. Fitzgerald, B. and de Landgrafft, T. (2014 Low gold price could threaten the future of Australian industry if global slump continues. ABC Rural. 5 November 2014 http://www.abc.net.au/news/2014-11-05/gold-low-threatens-australian-production/5867794 30 REIWA (2014) Property market indicators http://reiwa.com.au/The-WA-Market-Indicators/ accessed 06/01/2015 31 RAI calculations based on SALM smoothed unemployment rates December 2012 to June 2014 by LGA 32 RAI (2015) Cities Beyond Perth Canberra: The Regional Australia Institute. Analysis Report http://www.regionalaustralia.org.au/wp-content/uploads/2015/01/Cities-Beyond-Perth_ANALYSIS-REPORT.pdf Profiles Report http://www.regionalaustralia.org.au/wp-content/uploads/2015/01/Cities-Beyond-Perth_PROFILES-REPORT.pdf

Access to Finance, June 2015 P a g e | 47
33 Westpac-CCI (2014) Survey of business expectations. December quarter 2014. WA businesses remain pessimistic, despite relief from high costs. http://cciwa.com/docs/default-source/economics/sbe-results-december-2014_web.pdf?sfvrsn=2 Small Business Development Corporation (2014) 2014 State of small business survey http://www.smallbusiness.wa.gov.au/2014-state-of-small-business-survey/ 34 Westpac- CCI (2014) Leading index of WA economic activity. Leading index suggests WA economy sound heading into 2015. http://cciwa.com/docs/default-source/economics/leading-index-sep-2014.pdf?sfvrsn=2 35 Westpac-CCI (2014) Survey of business expectations. December quarter 2014. WA businesses remain pessimistic, despite relief from high costs. http://cciwa.com/docs/default-source/economics/sbe-results-december-2014_web.pdf?sfvrsn=2 36 Dermirguc-Kunt, A., Beck, T., and Honohan, P. (2008) Finance for all? Policies and pitfalls in expanding access. Washington: World Bank. World Bank (2014) Financial inclusion: Importance, key facts, and drivers. Chapter one in Global financial development report 2014 http://econ.worldbank.org/WBSITE/EXTERNAL/EXTDEC/EXTGLOBALFINREPORT/0,,contentMDK:23489639~pagePK:64168182~piPK:64168060~theSitePK:8816097,00.html RSM Bird Cameron (2013) Think big. www.rsmi.com.au 37 Berger, A. and Udell, G. (1995) Universal banking and the future of small business lending. Working paper 95-17. New York: The Wharton Financial Institutions Center.
CPA Australia (2012) SME access to finance: Recent experiences of SMEs in accessing finance. Southbank: CPA Finance. www.cpaaustralia.com.au/smallbusinessfinance 38 World Bank (2014) Financial inclusion: Importance, key facts, and drivers. Chapter one in Global financial development report 2014 http://econ.worldbank.org/WBSITE/EXTERNAL/EXTDEC/EXTGLOBALFINREPORT/0,,contentMDK:23489639~pagePK:64168182~piPK:64168060~theSitePK:8816097,00.html 39 World Bank (2014) Financial inclusion: Importance, key facts, and drivers. Chapter one in Global financial development report 2014 http://econ.worldbank.org/WBSITE/EXTERNAL/EXTDEC/EXTGLOBALFINREPORT/0,,contentMDK:23489639~pagePK:64168182~piPK:64168060~theSitePK:8816097,00.html 40 CPA Australia (2013) The CPA Australia Asia-Pacific small business survey 2013: Australia, Hong Kong, Indonesia, Malaysia, New Zealand and Singapore. www.cpaaustralia.com.au 41 CPA Australia (2013) The CPA Australia Asia-Pacific small business survey 2013: Australia, Hong Kong, Indonesia, Malaysia, New Zealand and Singapore. www.cpaaustralia.com.au 42 Australian Bankers’ Association and Council of Small Business Australia (2013) Small businesses: Access to finance report. Year to March 2013 www.bankers.asn.au/small_business_access_to_finance 43 RSM Bird Cameron (2013) Think big 2013. Perth: RSM Bird Cameron http://www.rsmi.com.au/news_/special_reports/thinkbig_2013.html 44 Australian Bankers’ Association and Council of Small Business Australia (2013) Small businesses: Access to finance report. Year to March 2013 www.bankers.asn.au/small_business_access_to_finance 45 Australian Bankers’ Association and Council of Small Business Australia (2013) Small businesses: Access to finance report. Year to March 2013 www.bankers.asn.au/small_business_access_to_finance 46 Australian Bankers’ Association and Council of Small Business Australia (2013) Small businesses: Access to finance report. Year to March 2013 www.bankers.asn.au/small_business_access_to_finance 47 Australian Bankers’ Association and Council of Small Business Australia (2013) Small businesses: Access to finance report. Year to March 2013 www.bankers.asn.au/small_business_access_to_finance 48 Australian Bankers’ Association and Council of Small Business Australia (2013) Small businesses: Access to finance report. Year to March 2013 www.bankers.asn.au/small_business_access_to_finance 49 Australian Bankers’ Association and Council of Small Business Australia (2013) Small businesses: Access to finance report. Year to March 2013 www.bankers.asn.au/small_business_access_to_finance 50 Stiglitz, J. and Weiss, A. ((1981) Credit rationing in markets with imperfect information. The American economic review, 71, 3, 393-410 51 Stiglitz, J. and Weiss, A. ((1981) Credit rationing in markets with imperfect information. The American economic review, 71, 3, 393-410 52 Asian Development Bank (2013) ADB–OECD study on enhancing financial accessibility for SMEs: Lessons from recent crises. Mandaluyong City, Philippines: Asian Development Bank http://www.oecd.org/cfe/smes/adb-oecd-study-enhancing-financial-accessibility-smes.pdf 53 OECD (2011) Financing high-growth firms: The role of angel investors. OECD Publishing http://dx.doi.org/10.1787/9789264118782-en

Access to Finance, June 2015 P a g e | 48
54 Love, I. and Martinez Peria, M. (2012) How bank competition affects firms’ access to finance. Policy research working paper 6163. World Bank http://www.g20dwg.org/documents/pdf/view/218/ 55 Berger, A. and Udell, G. (1995) Universal banking and the future of small business lending. Working paper 95-17. New York: The Wharton Financial Institutions Center. 56 Doms, M., Lewis, E., and Robb, A. (2010) Local labor force education, new business characteristics, and firm performance. Journal of urban economics, 67, 61-77 57 Berger, A. and Udell, G. (1995) Universal banking and the future of small business lending. Working paper 95-17. New York: The Wharton Financial Institutions Center. 58 Jaumotte, F., Lall, S., and Papageorgiou (2008) Rising income inequality: Technology, or trade and financial globalization? International monetary fund. IMF WP/08/185 59 Stiglitz, J. and Weiss, A. (1981) Credit rationing in markets with imperfect information. The American economic review, 71, 3, 393-410 60 Stiglitz, J. and Weiss, A. (1981) Credit rationing in markets with imperfect information. The American economic review, 71, 3, 393-410 61 Doms, M., Lewis, E., and Robb, A. (2010) Local labor force education, new business characteristics, and firm performance. Journal of urban economics, 67, 61-77 62 World Bank (2014) Financial inclusion: Importance, key facts, and drivers. Chapter one in Global financial development report 2014 http://econ.worldbank.org/WBSITE/EXTERNAL/EXTDEC/EXTGLOBALFINREPORT/0,,contentMDK:23489639~pagePK:64168182~piPK:64168060~theSitePK:8816097,00.html 63 RSM Bird Cameron (2013) Think big 2013. Perth: RSM Bird Cameron http://www.rsmi.com.au/news_/special_reports/thinkbig_2013.html 64 RSM Bird Cameron (2013) Think big 2013. Perth: RSM Bird Cameron http://www.rsmi.com.au/news_/special_reports/thinkbig_2013.html 65 Australian Bankers’ Association and Council of Small Business Australia (2013) Small businesses: Access to finance report. Year to March 2013 www.bankers.asn.au/small_business_access_to_finance 66 Australian Bankers’ Association and Council of Small Business Australia (2013) Small businesses: Access to finance report. Year to March 2013 www.bankers.asn.au/small_business_access_to_finance 67 The Senate Economics References Committee (2010) Access of small business to finance. Canberra: Commonwealth of Australia http://www.aph.gov.au/~/media/wopapub/senate/committee/economics_ctte/completed_inquiries/2008_10/small_business_10/report/report_pdf.ashx 68 Australian Government The Treasury (2014) Financial systems inquiry. Interim report. Canberra: Commonwealth of Australia http://fsi.gov.au/files/2014/07/FSI_Report_Final_Reduced20140715.pdf 69 Australian Government The Treasury (2014) Financial systems inquiry. Interim report. Canberra: Commonwealth of Australia http://fsi.gov.au/files/2014/07/FSI_Report_Final_Reduced20140715.pdf 70 Australian Government The Treasury (2014) Financial systems inquiry. Interim report. Canberra: Commonwealth of Australia http://fsi.gov.au/files/2014/07/FSI_Report_Final_Reduced20140715.pdf 71 Australian Government The Treasury (2014) Financial systems inquiry. Final report. November 2014. Canberra: Commonwealth of Australia http://fsi.gov.au/files/2014/12/FSI_Final_Report_Consolidated20141210.pdf 72 Australian Government The Treasury (2014) Financial systems inquiry. Final report. November 2014. Canberra: Commonwealth of Australia http://fsi.gov.au/files/2014/12/FSI_Final_Report_Consolidated20141210.pdf 73 RAI calculations based on analysis completed by Australian Bankers’ Association for RAI based on DBM survey dataset, year to March 2013 74 Analysis completed by Australian Bankers’ Association for RAI based on DBM survey dataset, year to March 2013. Sample size:
TOTAL
LOCATION STATE
Metro Non-Metro NSW/ACT VIC/TAS QLD WA SA/NT
Unweighted Base (n=) 14,715 9,547 5,168 5,049 4,010 3,006 1,434 1,216
75 Full description of the sample and methodology is published in Australian Bankers’ Association and Council of Small Business Australia (2013) Small businesses: Access to finance report. Year to March 2013 www.bankers.asn.au/small_business_access_to_finance
Access to Finance, June 2015 P a g e | 49
76 Analysis completed by Australian Bankers’ Association for RAI based on DBM survey dataset, year to March 2013 77 Analysis completed by Australian Bankers’ Association for RAI based on DBM survey dataset, year to March 2013 78 RAI consultation with WA Small Business Development Corporation, WA Department of Commerce, and WA Department of Regional Development, regional development organisations, policy, industry and business groups in Western Australia 79 Genworth Financial Mortgage Insurance Pty Ltd. (2014) Security location guide Australia April 2014 http://genworth.com.au/docs/tools/security-location-guide-(australia)-slga0514v02.pdf?Status=Master QBE (2012) LMI location guide Australia November 2012 http://www.qbelmi.com/Uploads/Documents/2ad73cc8-40af-4c51-b0a9-6565e8a913d8.pdf 80 Each schedule is currently in use as at 7th January 2015, but have different data release dates: Genworth in April 2014 and QBE in November 2012 81 Data sourced from Genworth Financial Mortgage Insurance Pty Ltd. (2014) Security location guide Australia April 2014 http://genworth.com.au/docs/tools/security-location-guide-(australia)-slga0514v02.pdf?Status=Master; and QBE (2012) LMI location guide Australia November 2012 http://www.qbelmi.com/Uploads/Documents/2ad73cc8-40af-4c51-b0a9-6565e8a913d8.pdf 82 Beal, D. and Ralston, D. (1998) Economic and social impacts of the closure of the only bank branch in rural communities. Toowoomba: Centre for Australian Financial Institutions, University of Southern Queensland http://www.pc.gov.au/__data/assets/pdf_file/0019/33544/sub071attachment3.pdf 83 RAI calculations based on [In]Sight access to finance data on number of banks/financial institutions within 50 km compared to population of LGA in 2011 from ABS (2011) Census of Population and Housing 84 RAI calculations based on [In]Sight access to finance data on number of banks/financial institutions within 50 km compared to number of locally registered and active businesses in LGA in 2010-2011 from ABS 1379.0.55.001 - National Regional Profile, 2007 to 2011 85 RAI calculations based on [In]Sight access to finance data on number of banks/financial institutions within 50 km compared to number of business entries and exits in LGA in 2010-2011 from ABS 1379.0.55.001 - National Regional Profile, 2007 to 2011 86 RAI calculations based on [In]Sight access to finance data on number of banks/financial institutions within 50 km compared to number of business entries minus exits in LGA in 2010-2011 from ABS 1379.0.55.001 - National Regional Profile, 2007 to 2011 87 RAI calculations based on [In]Sight access to finance data on number of banks/financial institutions within 50 km divided by population of LGA in 2011 from ABS (2011) Census of Population and Housing compared to number of locally registered and active businesses in LGA in 2010-2011 from ABS 1379.0.55.001 - National Regional Profile, 2007 to 2011 88 RAI calculations based on [In]Sight access to finance data on number of banks/financial institutions within 50 km divided by population of LGA in 2011 from ABS (2011) Census of Population and Housing compared to number of business entries and exits in in LGA in 2010-2011 from ABS 1379.0.55.001 - National Regional Profile, 2007 to 2011 89 RAI calculations based on [In]Sight access to finance data on number of banks/financial institutions within 50 km divided by population of LGA in 2011 from ABS (2011) Census of Population and Housing compared to number of business entries minus business exits in in LGA in 2010-2011 from ABS 1379.0.55.001 - National Regional Profile, 2007 to 2011 90 East and Partners (2014) Business banking and the branch: Seeking reinvention. Research note Australasia. February 2014 http://east.com.au/uploads/files/research-notes/2014/2014-02_Australasia_Research _Note.htm 91 East and Partners (2014) Business banking and the branch: Seeking reinvention. Research note Australasia. February 2014 http://east.com.au/uploads/files/research-notes/2014/2014-02_Australasia_Research _Note.htm 92 Berger, A. and Udell, G. (1995) Universal banking and the future of small business lending. Working paper 95-17. New York: The Wharton Financial Institutions Center 93 Berger, A. and Udell, G. (1995) Universal banking and the future of small business lending. Working paper 95-17. New York: The Wharton Financial Institutions Center 94 Yeates, C. (2015) NAB banking on increasing its business lending SMH online 27 January 2015 http://www.smh.com.au/business/banking-and-finance/nab-banking-on-increasing-its-business-lending-20150127-12vxti.html accessed 30/01/15 95 Bendigo Bank Website - http://www.bendigobank.com.au/public/community/community-banking/about-community-bank

Access to Finance, June 2015 P a g e | 50
96 http://www.croydonparkbusiness.com.au/wp-content/uploads/2013/11/Setting-up-a-Community-Bank.pdf 97 Rural Bank website http://www.ruralbank.com.au/for-farmers/backing-farmers 98 Bendigo and Adelaide Bank (2015) http://www.bendigoadelaide.com.au/public/ 99 The ‘big four’ commonly refers to ANZ, Commonwealth Bank, NAB, and Westpac 100 Australian Bankers’ Association and Council of Small Business Australia (2013) Small businesses: Access to finance report. Year to March 2013 www.bankers.asn.au/small_business_access_to_finance 101 Department of Industry, Innovation, Science, Research and Tertiary Education (2012) Australian small business: Key statistics and analysis. Canberra: DIISRTE 102 Department of Industry, Innovation, Science, Research and Tertiary Education (2012) Australian small business: Key statistics and analysis. Canberra: DIISRTE 103 “Invoice discounting simply involves a business turning its unpaid invoices into cash. The business literally sells its unpaid invoices to the discounter. Factoring involves the sale of a business’s unpaid invoices as with discounting, but in addition the sales accounting functions may be provided by the factor, who manages the sales ledger and collection of accounts.” Definition sourced from the Debtor and Invoice Finance Association (2014) Brief definitions http://difa.asn.au/features/brief-definitions/ 104 Debtor and Invoice Finance Association (2014) DIFA update: DIFA statistics March Quarter 2014 http://difa.asn.au/wp-content/uploads/2014/05/DIFA_Statistical_Update_March_2014.pdf 105 Debtor and Invoice Finance Association (2014) DIFA update: DIFA statistics March Quarter 2014 http://difa.asn.au/wp-content/uploads/2014/05/DIFA_Statistical_Update_March_2014.pdf 106 Debtor and Invoice Finance Association (2014) DIFA update: DIFA statistics March Quarter 2014 http://difa.asn.au/wp-content/uploads/2014/05/DIFA_Statistical_Update_March_2014.pdf 107 Business Victoria (2014) Sources of finance http://www.business.vic.gov.au/money-profit-and-accounting/raising-funds-for-your-business/sources-of-finance 108 Business Victoria (2014) Sources of finance http://www.business.vic.gov.au/money-profit-and-accounting/raising-funds-for-your-business/sources-of-finance 109 Business Victoria (2014) Sources of finance http://www.business.vic.gov.au/money-profit-and-accounting/raising-funds-for-your-business/sources-of-finance 110 Australian Government The Treasury (2014) Financial systems inquiry. Interim report. Canberra: Commonwealth of Australia http://fsi.gov.au/files/2014/07/FSI_Report_Final_Reduced20140715.pdf 111 Murray, G., Cowling, M., and Liu, W. (2010) An Independent Econometric Analysis of the “Innovation Investment Fund” Programme (IIF) of the Australian Commonwealth Government: Findings and Implications. Canberra: Commonwealth of Australia http://www.industry.gov.au/industry/VentureCapital/Documents/IndependentEconometricAnalysisofIIF.rtf 112 Murray, G., Cowling, M., and Liu, W. (2010) An Independent Econometric Analysis of the “Innovation Investment Fund” Programme (IIF) of the Australian Commonwealth Government: Findings and Implications. Canberra: Commonwealth of Australia http://www.industry.gov.au/industry/VentureCapital/Documents/IndependentEconometricAnalysisofIIF.rtf 113 Reserve Bank of Australia (2012) Small Business Finance Roundtable: Summary of Discussion, Bulletin, June Quarter 2012, 91-94 114 Australian Government The Treasury (2014) Financial systems inquiry. Interim report. Canberra: Commonwealth of Australia http://fsi.gov.au/files/2014/07/FSI_Report_Final_Reduced20140715.pdf 115 Australian Government The Treasury (2014) Financial systems inquiry. Final report. November 2014. Canberra: Commonwealth of Australia http://fsi.gov.au/files/2014/12/FSI_Final_Report_Consolidated20141210.pdf 116 OECD (2011) Financing high growth firms: The role of angel investors http://www.keepeek.com/Digital-Asset-Management/oecd/industry-and-services/financing-high-growth-firms_9789264118782-en#page1 117 OECD (2011) Financing high growth firms: The role of angel investors http://www.keepeek.com/Digital-Asset-Management/oecd/industry-and-services/financing-high-growth-firms_9789264118782-en#page1 118 OECD (2011) Financing high growth firms: The role of angel investors http://www.keepeek.com/Digital-Asset-Management/oecd/industry-and-services/financing-high-growth-firms_9789264118782-en#page1 119 OECD (2011) Financing high growth firms: The role of angel investors http://www.keepeek.com/Digital-Asset-Management/oecd/industry-and-services/financing-high-growth-firms_9789264118782-en#page1 120 OECD (2011) Financing high growth firms: The role of angel investors http://www.keepeek.com/Digital-Asset-Management/oecd/industry-and-services/financing-high-growth-firms_9789264118782-en#page1 121 OECD. (2011). Financing High-Growth Firms: The Role of Angel Investors. OECD Publishing. Retrieved from http://dx.doi.org/10.1787/9789264118782-en

Access to Finance, June 2015 P a g e | 51
122 OECD. (2011). Financing High-Growth Firms: The Role of Angel Investors. OECD Publishing. Retrieved from http://dx.doi.org/10.1787/9789264118782-en 123 Vitale, M., Everingham, B., & Butler, R. (2006). Study of Business Angel Market in Australia . Department of Industry, Tourism and Resources. 124 Western Australian Angel Investors Inc. (2015) About us – background http://www.waai.net.au/background.html accessed 02/02/2015 125 Western Australian Angel Investors Inc. (2015) Submit a deal http://www.waai.net.au/submit-a-deal.html accessed 02/02/2015 126 Western Australian Angel Investors Inc. (2015) Submit a deal http://www.waai.net.au/submit-a-deal.html accessed 02/02/2015 127 Western Australian Angel Investors Inc. (2015) Investment criteria http://www.waai.net.au/investment-criteria.html accessed 02/02/2015 128 Western Australian Angel Investors Inc. (2015) Investment criteria http://www.waai.net.au/investment-criteria.html accessed 02/02/2015 129 Western Australian Angel Investors Inc. (2015) About angel investing http://www.waai.net.au/about-angel-investing.html accessed 02/02/2015 130 Western Australian Angel Investors Inc. (2015) About angel investing http://www.waai.net.au/about-angel-investing.html accessed 02/02/2015 131 Western Australian Angel Investors Inc. (2015) Our sponsors http://www.waai.net.au/sponsors.html accessed 02/02/2015 132 RCCIWA (2015) http://www.regionalchamberswa.com.au/ 133 Western Australian Angel Investors Inc. (2015) Our sponsors http://www.waai.net.au/sponsors.html accessed 02/02/2015 134 RAI consultation with WA Small Business Development Corporation, WA Department of Commerce, and WA
Department of Regional Development, regional development organisations, policy, industry and business groups
in Western Australia 135 RAI consultation with WA Small Business Development Corporation, WA Department of Commerce, and WA Department of Regional Development, regional development organisations, policy, industry and business groups in Western Australia 136 Business Victoria (2014) Planning successful crowdfunding http://www.business.vic.gov.au/money-profit-and-accounting/raising-funds-for-your-business/crowdfunding-in-australia 137 Business Victoria (2014) Planning successful crowdfunding http://www.business.vic.gov.au/money-profit-and-accounting/raising-funds-for-your-business/crowdfunding-in-australia 138 The Treasury (2014) Crowd-sourced equity funding. Canberra: Commonwealth of Australia http://www.treasury.gov.au/~/media/Treasury/Consultations%20and%20Reviews/Consultations/2014/Crowd%20Sourced%20Equity%20Funding/Downloads/PDF/CSEF%20Discussion%20Paper.ashx 139 Business Victoria (2014) Planning successful crowdfunding http://www.business.vic.gov.au/money-profit-and-accounting/raising-funds-for-your-business/crowdfunding-in-australia 140 The Treasury (2014) Crowd-sourced equity funding. Canberra: Commonwealth of Australia http://www.treasury.gov.au/~/media/Treasury/Consultations%20and%20Reviews/Consultations/2014/Crowd%20Sourced%20Equity%20Funding/Downloads/PDF/CSEF%20Discussion%20Paper.ashx 141 The Treasury (2014) Crowd-sourced equity funding. Canberra: Commonwealth of Australia http://www.treasury.gov.au/~/media/Treasury/Consultations%20and%20Reviews/Consultations/2014/Crowd%20Sourced%20Equity%20Funding/Downloads/PDF/CSEF%20Discussion%20Paper.ashx 142 Smarta Business School (2014) Business finance: Three ideas alternative business finance http://www.smarta.com/advice/business-finance/start-up-finance/three-ideas-alternative-business-finance 143 Eyers, J. (2014) UK peer-to-peer lender targets Australian businesses. Australian Financial Review 01 December 2014 http://www.afr.com/p/technology/uk_peer_to_peer_lender_targets_australian_28LDjCMVbEBcjpE9xQTYZI 144 Finder.com (2015) Peer to peer lending guide http://www.finder.com.au/peer-to-peer-lending accessed 02/02/2015 145 Zopa (2014) How safe is my money? http://help.zopa.com/customer/portal/articles/1103742-how-safe-is-my-money- 146 Westpac (2014) Business loans: Do I need a guarantor for my business loan? http://www.westpac.com.au/business-banking/business-loans/read-up-on/business-loan-guarantor/ 147 Department for Business, Innovation and Skills (2014) Understanding the Enterprise Finance Guarantee https://www.gov.uk/understanding-the-enterprise-finance-guarantee

Access to Finance, June 2015 P a g e | 52
148 Australian Government The Treasury (2014) Financial systems inquiry. Interim report. Canberra: Commonwealth of Australia http://fsi.gov.au/files/2014/07/FSI_Report_Final_Reduced20140715.pdf This issue is not further addressed in the final report. 149 Canada Business Network (2014) Loan guarantees http://www.canadabusiness.ca/eng/page/2736/ 150 Many Rivers website http://www.manyrivers.org.au/ 151 Many Rivers CEO Presentation for Western Australia, October 2014 152 RAI consultation with WA Small Business Development Corporation, WA Department of Commerce, and WA Department of Regional Development, regional development organisations, policy, industry and business groups in Western Australia 153 RAI consultation with WA Small Business Development Corporation, WA Department of Commerce, and WA Department of Regional Development, regional development organisations, policy, industry and business groups in Western Australia 154 Many Rivers Website http://www.manyrivers.org.au/wp-content/uploads/2012/09/WA-Business-News-August-2012.pdf 155 Department of Industry, Innovation, Science, Research and Tertiary Education (2012) Australian small business: Key statistics and analysis. Canberra: DIISRTE, analysis based on ABS Cat. No. 8158.0, Data Cube 6, Table 1 156 Department of Industry, Innovation, Science, Research and Tertiary Education (2012) Australian small business: Key statistics and analysis. Canberra: DIISRTE, analysis based on ABS Cat. No. 8158.0, Data Cube 6, Table 1 157 Connolly, E., Norman, D., and West, T. (2012) Small business: An economic overview Paper presented to Small Business Finance Roundtable, May 2012, Reserve Bank of Australia. http://www.abs.gov.au/websitedbs/d3310114.nsf/4a256353001af3ed4b2562bb00121564/d291d673c4c5aab4ca257a330014dda2/$FILE/RBA%20Small%20Business%20An%20economic%20Overview%202012.pdf 158 The Treasury (2014) Crowd-sourced equity funding. Canberra: Commonwealth of Australia http://www.treasury.gov.au/~/media/Treasury/Consultations%20and%20Reviews/Consultations/2014/Crowd%20Sourced%20Equity%20Funding/Downloads/PDF/CSEF%20Discussion%20Paper.ashx 159 Australian Government The Treasury (2014) Financial systems inquiry. Interim report. Canberra: Commonwealth of Australia http://fsi.gov.au/files/2014/07/FSI_Report_Final_Reduced20140715.pdf; and Australian Government The Treasury (2014) Financial systems inquiry. Final report. November 2014. Canberra: Commonwealth of Australia http://fsi.gov.au/files/2014/12/FSI_Final_Report_Consolidated20141210.pdf