Embed Size (px)
Citation preview

Access and Mobility of Wireless PDA Users
Marvin McNett Geoffrey M. [email protected] [email protected]
Department of Computer Science and EngineeringUniversity of California, San Diego, CA
In this paper, we analyze the mobility patterns of users of wireless hand-held PDAs in acampus wireless network using an eleven week trace of wireless network activity. Our studyhas two goals. First, we characterize the high-level mobility and access patterns of hand-held PDA users and compare these characteristics to previous workload mobility studiesfocused on laptop users. Second, we develop two wireless network topology models for usein wireless mobility studies: an evolutionary topology model based on user proximity and acampus waypoint model that serves as a trace-based complement to the random waypointmodel. We use our evolutionary topology model as a case study for preliminary evaluationof three ad hoc routing algorithms on the network topologies created by the access andmobility patterns of users of modern wireless PDAs. Based upon the mobility characteristicsof our trace-based campus waypoint model, we find that commonly parameterized syntheticmobility models have overly aggressive mobility characteristics for scenarios where usermovement is limited to walking. Mobility characteristics based on realistic models canhave significant implications for evaluating systems designed for mobility. When evaluatedusing our evolutionary topology model, for example, popular ad hoc routing protocols werevery successful at adapting to user mobility, and user mobility was not a key factor in theirperformance.
I. Introduction
As wireless access proliferates, understanding userbehavior and wireless network performance has be-come crucial as a basis for developing and evaluatingnew applications. Such applications include: context-aware applications, new network infrastructure, suchas middleware support for public-area networks, andnew wireless communication architectures, such as adhoc networking.
Over the past few years there have been a number ofwireless workload studies characterizing user behav-ior and network performance in a variety of settings,including metropolitan networks [1], university cam-puses [2, 3, 4, 5], conferences [6, 7], and corporatenetworks [8]. The goals of these studies include de-veloping low-level radio signal and error models [9],network installation and maintenance issues [6], andcharacterizing user workload models, network perfor-mance, and mobility of laptop users [4].
In this paper, we extend previous wireless stud-ies by characterizing the mobility patterns of users ofwireless hand-held PDAs in a campus wireless net-work, and propose two new mobility models for use inwireless network simulation. We use a trace of wire-less network access by 275 freshmen with HP Jornada
PDAs over the course of the Fall 2002 term at the Uni-versity of California, San Diego. A key aspect of ourtrace is the focus on hand-held PDA users. Even moreso than laptop users, we expect hand-held PDA usersto exhibit high degrees of both casual and extendedwireless access and mobility.
Our study has two goals. First, we characterize thehigh-level mobility and access patterns of hand-heldPDA users, and then compare these characteristics toprevious workload mobility studies focused on laptopusers.
Second, we develop two wireless network topol-ogy models for use in wireless mobility studies. Pre-vious work frequently uses synthetic models of usermobility patterns, such as the popular “random way-point” model [10], to derive wireless network topolo-gies that change due to user mobility. To comple-ment these synthetic models, we derive two new mod-els of network topologies that incorporate user mobil-ity patterns from our traces. Our evolutionary topol-ogy model represents connectivity among users solelybased on observed network proximity: an edge con-nects two nodes if two users can reasonably “hear”each other. In this model, the network topologyevolves over time as nodes and edges appear and dis-appear based upon user connections, disconnections,
40 Mobile Computing and Communications Review, Volume 9, Number 2

and movements observed in our trace. Our campuswaypoint model serves as a trace-based analog of therandom waypoint model. In this model, we asso-ciate users with geographic locations on campus, andmodel their mobility vectors and potential interactionsas they access the wireless network over time. How-ever, rather than choosing user locations, speeds, anddirections using random distributions, we instead usethe access and mobility patterns of users in our trace.
We use the evolutionary network topology modelto perform a preliminary evaluation of three ad hocrouting algorithms in a realistic setting. Ad hoc rout-ing has been a popular research topic for some time,and many protocols have been proposed and evalu-ated in the literature (e.g., [11, 12, 13, 14]). Surpris-ingly, however, very few have been evaluated in real-istic user settings [15] under realistic mobility mod-els. Recently, two efforts have evaluated ad hoc rout-ing implementations in a small conference setting [7]and random synthetic outdoor environment [16], butneither explore the impact of mobility on the routingalgorithms. As a result, we know little about the trade-offs and applicability of these algorithms to common,expected mobility situations. Since groups of userswith hand-held PDAs have often been used as a moti-vating setting for ad hoc networking, we use our traceto perform a preliminary evaluation of popular ad hocrouting algorithms on the network topologies createdby the access and mobility patterns of users of modernwireless PDAs.
The remainder of this paper is organized as fol-lows. Section II discusses related work. Section IIIdescribes our user population and trace methodology.Section IV characterizes the access and mobility pat-terns of the users in our trace. Section V describesthe two mobility models we create based upon ourtrace, and evaluates ad hoc routing algorithms usingthe evolutionary topology model. Finally, Section VIsummarizes our results and concludes.
II. Related Work
In this section, we first discuss previous trace basedstudies of wireless network user behavior. We thendiscuss various mobility models that have been pro-posed and studied in the literature. Note that relatedstudies of 802.11 wireless networks typically use ac-cess point associations to track user mobility. In ourstudy, we extend this technique to use signal strengthinformation for all access points detected by the de-vice at a particular time.
II.A. Trace Studies
Three early studies on wireless network usage wereperformed at Stanford University [17, 1, 18]. Lai etal. [17] study a small set of eight users for an eightday period. In their trace, laptop users switch be-tween wired and wireless networks. The wide areawireless network used in their study covered an entiremetropolitan area and is intrinsically different fromthe 802.11b wireless network used in our study. Theirfocus was on how often users switched between thewired and wireless networks, how often users changedposition geographically, latency in the wireless net-work, and optimizations for improving wireless net-work performance. The granularity of geographic lo-cation was limited by the large, half mile radius of thewireless radios used.
Tang et al. [1] use the same wireless network in-frastructure as the Lai et al. [17] study. However, theyobserved 24,773 users over a 7-week period to studyuser mobility and network access properties. Thesegoals are similar to our own, but were for a muchwider area with a larger audience, using a very dif-ferent network configuration. Due to the dates of thetrace period, we also assume that most of the users inthe trace were laptop users.
The last Stanford study [18] focused on local areawireless network activity of 74 users in the StanfordComputer Science Department over a 12-week period.In that study, they analyzed data polled from accesspoints using SNMP, subnet router tcpdump data, andan authentication log to characterize network access,network loads, and network traffic types.
A number of subsequent studies characterizing uni-versity campus wireless networks followed the Stan-ford research. Kotz and Essien [4] extended the studyby Tang and Baker [18] to an entire campus widewireless network at Dartmouth College. They col-lected data from 1706 users across 476 access pointsover an 11-week period in Fall 2001. Their study fo-cused on a more general population of wireless users.However, their trace data did not allow for them to dis-tinguish among device types (PDA, laptop, etc.), nordid they focus on modeling mobility. Subsequently,Henderson et al. [3] repeated the earlier Dartmouthstudy in Fall 2003 and Winter 2004 after the campushad matured and wireless usage on campus becamemore prevalent. They focused on application and mo-bility characteristics, and in this study found more us-age of embedded devices such as PDAs and that, aswith our results, embedded devices had more mobilitythan laptops. Chinchilla et al. [2] record wireless Webworkloads and user AP associations for over a month
Mobile Computing and Communications Review, Volume 9, Number 2 41

in 2003 at the University of North Carolina at ChapelHill. They study the locality of wireless user Web ac-cess and implications on caching, and how user mo-bility impacts that locality. They also develop an an-alytic model for predicting the next AP association ofmobile users. Finally, Schwab and Hunt [5] recorded aweek-long trace in early 2003 of the wireless networkdeployed at the University of Saskatchewan. Theyalso analyzed the application, network, and mobilitycharacteristics of the users of their wireless network.
Other studies have characterized wireless networksin different settings, large conference venues and cor-porate wireless LANs. Balachandran et al. [6] cap-tured and analyzed a workload from a wireless LANat the 2001 ACM SIGCOMM conference. Their goalwas to characterize user behavior in this setting to fa-cilitate the planning and deployment of wireless net-works. Since the network was confined to a largeauditorium for the conference, the mobility charac-teristics of the users in the trace were very limited.Balazinska and Castro [8] analyzed a corporate wire-less LAN workload of 1366 users across 177 accesspoints. Again, they collected data using SNMP toperiodically poll all access points involved. In theirstudy, Balazinska and Castro compare their resultswith results from the previous studies to distinguishuser behavior among the various user groups and iden-tify factors which contribute to these differences.
Finally, two recent trace studies investigate the per-formance of implementations of popular ad hoc rout-ing algorithms on deployed 802.11 ad hoc networks.Ramachandran et al. [7] developed a distributed ar-chitecture for monitoring multi-hop mobile networkscalled DAMON, and used this architecture to monitoran ad hoc network at the 58th IETF meeting at the endof 2003. The study focused on the experience of usingthe AODV routing protocol in the network, however,and the number of users (seven) and trace duration (12minutes) did not make mobility characterization inter-esting. Gray et al. [16] compare the performance offour ad hoc routing algorithms in an outdoor deploy-ment of 33 nodes. Nodes were stationary and there-fore did not incorporate mobility into the algorithmevaluation, but they found that (1) the choice of algo-rithm had a significant impact on packet delivery, and(2) some algorithms that performed well indoors didnot outdoors, and vice versa.
II.B. Mobility Models
Numerous mobility models have been proposed foruse in simulation and evaluation of ad hoc routing pro-tocols. A recent survey presents a number of these
models divided into entity and group mobility mod-els [19]. The survey also presents simulation resultsfrom these models to emphasize the importance ofproperly choosing a mobility model for research sim-ulations. They show that the choice of mobility modelgreatly impacts the performance of various ad hocrouting protocols.
Perhaps the most widely used mobility model hasbeen the random waypoint model [10]; this is in partdue to its implementation in the popular NetworkSimulator, ns2 [20]. In this model, each node be-gins a simulation stationary for pause time seconds,then randomly chooses a destination in the simulationspace and moves to that location with a speed betweenspeedmin and speedmax (chosen from a uniform dis-tribution). Once a node reaches its destination, theprocess repeats. Aside from being far from realis-tic user behavior in most settings [21], random way-point creates non-uniform [22] and fluctuating [23]node densities within the simulation area, as well asdecreases the average nodal speed over time [24, 25].
Recently, there have been a number of mobilitymodels proposed as alternatives to the standard ran-dom waypoint model (e.g., [26, 27, 19, 28, 29, 21, 30,25]). In general, the goal of these models is to increasethe realism of random waypoint in particular settings.For example, Hong et al. [28] propose a group mo-bility model called Reference Point Group Mobility(RPGM). RPGM calculates node velocity vectors asthe sum of a group center velocity vector and a ran-dom motion vector for each node. Such a modelcould be used for group movement in disaster recov-ery where teams work and move together throughouta disaster area, or to model movement of conventionattendees moving from room to room between projectdemonstrations. Johansson et al. [30] propose threemovement models: conference, event coverage, anddisaster area (a common theme, but with many differ-ing models). New to these models was the incorpora-tion of obstacles through which neither users nor radiosignals could pass. Bettstetter [27] proposes a mobil-ity model with smooth, rather than sudden, changesin both velocity and direction. A “Mobility VectorModel” is proposed by Hong et al [29] which is sim-ilar to the model in [28]. However, [29] introducesan “acceleration factor” which, when properly cho-sen, also generates smoother node trajectories. Bai etal. [26] propose “Freeway” and “Manhattan” mobilitymodels. These models restrict movement to paths de-fined prior to simulation. In addition, node movementdepends upon the node’s previous velocity and the ve-locity of nearby nodes considered to be in the same
42 Mobile Computing and Communications Review, Volume 9, Number 2

lane.Finally, Yoon et al. [25] show that any mobility
model in which speed and destination are chosen in-dependently suffers from average speed decay. Theypropose a framework in which any given mobilitymodel can be transformed to eliminate variations inaverage node speed as simulation time progresses. Fi-nally, Jardosh et al. [21] propose a mobility model thatincorporates both obstacles and paths. Node move-ment is not only restricted to paths, but follows ashortest path route to the node’s randomly chosendestination. In addition, node transmissions do notpass through obstacles. This framework was used tomodel student movement between buildings on a col-lege campus.
Each of the above mentioned works test various adhoc routing protocols using their mobility models. Al-though protocol performance results vary from modelto model, results indicate that a few key characteristicsof the mobility models play major roles in the effec-tiveness of the ad hoc protocol under study. For exam-ple, average link lifetime and link change frequencywhich result from the model are key characteristicswhich affect the performance of the protocol.
Until now, these synthetic models have been theonly means of specifying user movement for ad hocrouting protocol testing. Our study provides muchneeded data to complement, as well as validate, thesynthetic models in use today.
III. Trace Methodology
In this section, we describe the procedure used to col-lect the trace data and our data analysis methods. Westart by defining a few key terms used in the remainderof this paper.
• User: A UCSD freshman in the Sixth College,or a trace software developer,1 equipped with aJornada 548 or 568 which uploaded data to ourdatabase during the 11-week trace period.
• AP Session: A contiguous time period in whicha user PDA is associated with a particular accesspoint.
• User Session: A contiguous time period in whicha user PDA is powered on and able to detectnearby access points. User sessions include theirmobility among APs.
1There were three development PDAs which uploaded dataduring the trace period.
III.A. Data Collection
We collected trace data from approximately 275 fresh-men PDA users for an 11-week period between Sep-tember 22, 2002 and December 8, 2002. The fresh-men were the initial students in the new “Sixth col-lege” at UCSD. Each of our colleges has a particularacademic theme and defines graduation requirementsfor students in the college. However, the colleges areindependent of major and have students representingall majors on campus. Each PDA was equipped with aSymbol Wireless Networker 802.11b Compact Flashcard. The trace PDAs consisted of 97 Jornada 548sand 185 Jornada 568s running the Windows PocketPC 2000 and 2002 operating systems, respectively.2 .We identify users according to their registered wire-less card MAC address, and assume that there is afixed one-to-one mapping between users and wirelesscards. The mapping is anonymous; we have no map-ping of MAC address to user names.
The UCSD campus has extensive 802.11b cover-age in which students can roam. The students inour trace resided at the Sixth College housing facil-ity, an approximately 130m x 130m square area nearthe southeast corner of the UCSD campus with com-plete 802.11b coverage. Overall wireless activity wasextensive: students associated with over 400 uniqueAPs in our trace.
We developed a background data collection toolcalled WTD (Wireless Topology Discovery) and in-stalled the tool on each PDA prior to distribution. Forour trace, WTD periodically recorded the followinginformation:
• Access point (AP) signal strength (for each APdetected)
• AP MAC address (for each AP detected)
• Current AP association
• WTD program version number
• Device type (Jornada 548 or 568)
• Power state (on AC or battery power)
Note that WTD recorded the AP signal strength andMAC address for all APs that it could sense across allfrequencies for each time interval, not just the AP thewireless card was associated with at the time. Record-ing all APs provides much richer topology informa-tion than just the associated AP.
As a trade-off between the granularity of samplesand the resource and power overhead of collecting the
2The slight discrepancy in the number of total users and num-ber of total trace PDAs is due to a few network cards — likelydevelopers’ cards — moving between a 548 and 568
Mobile Computing and Communications Review, Volume 9, Number 2 43
data, we used a sampling period of twenty seconds.Once the local data file reached a critical size or amaximum data file age, WTD contacted a server toupload its sample collection in bulk at the next op-portunity with connectivity. A practical feature of theWTD software is its ability to periodically check ourdatabase for new releases and bug fixes. Once de-tected, it automatically downloads a new version tothe device and relaunches. This feature has made itstraightforward to add functionality to the data collec-tion software or adapt to unexpected problems.
III.B. Preliminary Data Analysis
A key aspect of our data analysis involved determin-ing when and where a sample was taken, in addition todefining a user session and its duration. This informa-tion enabled us to reconstruct the necessary topologyinformation for later experiments, as well as describedevice usage patterns.
Since all PDAs maintained their own clocks, weneeded a method for resolving the time in which asample was taken. Our approach compared the sam-ple upload time according to the PDA with the sampleupload time according to our database server. We cal-culate the clock skew between the PDA and our serverand add the offset to the sample timestamp recordedwhen the PDA took the sample. We decided not tosynchronize clocks among PDAs so as not to interferewith user settings.
We determined user geographic locations usingthe locator software from the UCSD ActiveCampusproject [31]. This software uses trilateration based onrecorded AP signal strengths (for all APs detected inthe sample) along with empirical corrections to calcu-late user locations on campus.
One difficulty encountered during initial data analy-sis was determining the boundaries of a session. Weobserved that many sessions occurred on the edgeof AP radio signal range. This caused a single ses-sion to appear to be several very short sessions asthe AP signal fluctuated between detected and unde-tected. In addition, users who were mobile during asession may have briefly stepped into an uncoveredarea during a sample period. To account for thesefluctuations, we used a simple heuristic requiring 1.5minutes between sessions in which session bound-ary signal strengths were adequate (> RSSIMAX/3),and 4 minutes between sessions where session bound-ary signal strengths were low (< RSSIMAX/3). Al-though a simple flag attached to each sample wouldhave solved this problem, we did not discover the is-sue until well into the data collection phase.
Finally, we observed a steady decline in user pop-ulation over the trace period. Though not unforeseen,the dropout rate was higher than expected. Althoughit would be impossible to say what the exact causewas for the decline, we attribute the decline to threefactors. First is declining novelty and interest. Ratherthan purchasing the PDAs for an explicit need (e.g.,as with laptops), students were simply given the de-vices for being Sixth College freshmen, independentof whether students wanted the device. Because theseusers are from a variety of different majors and in-terests, it is likely that some opted to stop using thedevice after an initial trial. We have also heard of thisdevice abandonment trend in other studies in whichdevices were simply given to the user population [32].This trend raises the interesting question of the extentto which students, usually considered early adopters,actually have a strong demand for current hand-heldPDA technology.
A second possible contribution to user decline wasdrained batteries. A complete depletion of battery re-sults in a device hard reset, which occurred more of-ten than initially expected. Since our tracing moduleresided in soft state on the PDAs, a hard reset per-manently removed all pre-installed software (includ-ing WTD). This situation may have also contributedto students abandoning their devices. After losingall their personal data and settings, some users mayhave opted to cease using their PDA out of frustration.Since the Jornada 568s possessed a small, replaceablebackup battery, this problem was more prevalent inthe Jornada 548s, where only 23 devices (22 percentof 548s) recorded data the final week of the trace, asopposed to 64 Jornada 568s (33 percent of 568s). Dueto complicated issues involved with the PDA distrib-ution, there was no means for recalling and/or restor-ing devices once they were in the student’s possession.These issues were, unfortunately, out of our control.
Finally, it may be that some users, although happywith their new PDA, found little use for the wirelessnetwork card. The card awkwardly protrudes from thetop of the device and depletes the device battery inabout half it’s typical time. A lack of PDA-aware Webservers and network applications may have led manyusers to simply remove their 802.11b cards from theirdevices.
IV. User Behavior
In this section, we study user behavior based uponour trace data. First, we characterize overall activityof our PDA users, focusing on daily usage patterns.
44 Mobile Computing and Communications Review, Volume 9, Number 2

(a)
(b)
Figure 1: User locations (dark circled ’x’) across theUCSD campus at noon (a) and 1PM (b) on September24, 2002. The dense areas at the lower right are theSixth College student housing buildings (still labeled“Roosevelt” on this map).
Next, we discuss user mobility focusing on movementamong access points on campus. Finally, we discussuser access to the wireless network, analyzing userand AP session counts and length. Where appropri-ate, we compare and contrast our results with previ-ous trace studies. For most measurements, we provideempirical cumulative distribution function graphs andexplicitly quantify the max, mean, median, 80th per-centile, 90th percentile and standard deviation statis-tics.
09/22 09/29 10/06 10/13 10/20 10/27 11/03 11/10 11/17 11/24 12/01 12/080
20
40
60
80
100
120
Hour (12:00 AM of date indicated)
Num
ber
of A
ctiv
e U
sers
Figure 2: Number of active users each hour over studyduration. The shallow decline indicates user dropout,a result of device abandonment or loss of trace mod-ule.
Sun Mon Tue Wed Thu Fri Sat Sun0
10
20
30
40
50
60
70
80
90
Hour (12:00 AM of day indicated)
Num
ber
of A
ctiv
e U
sers
Figure 3: Number of active users each hour for firstweek of trace.
IV.A. Activity
We start by illustrating the location of wireless activityon campus, and then quantify overall user PDA activ-ity during our trace period. Figure 1 shows snapshotsof user locations taken at noon and 1 PM on Septem-ber 24. The majority of activity takes place at the stu-dent housing facility in the lower right hand corner ofthe map. This was the case throughout the duration ofthe trace. Other locations of moderate activity werelecture halls where a large number of undergraduatecourses are taught.
In terms of overall user PDA activity, Figure 2shows the number of active users per hour across the11 weeks of the trace, and Figure 3 shows the numberof active users per hour for just the first full week of
Mobile Computing and Communications Review, Volume 9, Number 2 45

1 2 3 4 5 6 7 8 9 10 1115
20
25
30
35
40
45
Week No.
Ave
rage
Num
ber
of A
ctiv
e U
sers
per
Hou
r
Figure 4: Average number of active users per hourfor each week of trace. Week ten was Thanksgivingbreak.
the trace (the most active week). These graphs exhibita number of high-level characteristics of the user pop-ulation in our trace. First, device usage and networkaccess follow regular diurnal patterns, with peak us-age typically between 1–2 PM and minimum usagebetween 5–6 AM. Activity during the week is signif-icantly higher than the weekend: weekdays have anaverage of 33 percent more users per hour than week-ends. We also found that student usage of PDAs isrelatively bursty, likely reflecting the ease with whichusers can carry and activate their PDAs as well asthe constraints of using PDAs for extended periods oftime.
The extended time span of low usage around 11/30corresponds to the Thanksgiving weekend. The peakon 10/16 corresponds to a day in which many usersparticipated in a psychological experiment for a SixthCollege class.
Second, as mentioned in Section III.B, the graphshows a decline in recorded user activity over the traceperiod. To quantify this decline, Figure 4 shows theaverage number of users per hour for each week ofthe trace. We make a linear least squares fit to the datato highlight the user activity decline trend. The tracestarts with an average of 40 users per hour for the firstweek and ends with 21, a loss of nearly 2 active usersper hour each week.
Third, there are always active user devices. Even inthe early morning, there are typically between ten andfifteen users active. We assume that these are PDAsleft on over night and sitting in their cradles. This as-sumption is based on their typically long session dura-tions, the fact that the devices were on AC power, and
0 100 200 300 400 500 600 700 8000
0.1
0.2
0.3
0.4
0.5
0.6
0.7
0.8
0.9
1
Number of Sessions
CD
F
max = 767mean = 128.92median = 77std = 145.58
0 200 400 600 8000
10
20
30
No. Sessions
No.
Use
rs
Figure 5: Empirical CDF of session counts. Inset ishistogram of the same using 200 bins. Half the usersinitiated more than 77 sessions over the trace. A fewvery active users initiated over 700 sessions.
that these devices were immobile during these peri-ods.
The Dartmouth [4] and IBM [8] traces also showclear diurnal patterns of usage. The decline in useractivity only appears in our trace due to the reasonsdiscussed above.
Next we study user access to the wireless networkin terms of user and access point session counts andsession durations.
IV.A.1. Session counts
Figure 5 shows the CDF of the number of user ses-sions. Note that 50 percent of the users initiated morethan 77 sessions over the trace period. In other words,the median user initiated an average of one sessionper day over the trace period. Clearly, many of thestudents were not relying upon their device in theirdaily activities. Still, 20 percent of the users did ini-tiate over 231 sessions (roughly three times per day),and 10 percent initiated over 335 (roughly four timesper day).
IV.B. Access
To study user activity on a day to day basis, Figure 6presents a CDF of the number of days the users hadturned on their PDAs. From Figure 6 we can see thathalf the users turned on their devices less than 21 daysduring the trace. This is lower than the median num-ber of days from the Dartmouth study [4] in whichlaptop users connected a median of 28 days over their77-day trace. Furthermore, the distribution of numberof days in which a user used their device was nearly
46 Mobile Computing and Communications Review, Volume 9, Number 2

0 10 20 30 40 50 60 70 800
0.1
0.2
0.3
0.4
0.5
0.6
0.7
0.8
0.9
1
Number of Days Used
CD
F
max = 77mean = 25.66median = 21std = 20.89
0 20 40 60 800
5
10
15
20
No. Days Used
No.
Use
rs
Figure 6: Empirical CDF of the number of days theusers powered on their devices during the trace. Insetis histogram of the same using 77 bins. Half the userspowered up their PDA more than 21 days during thetrace. A few users used their PDA nearly every day.
uniform in the Dartmouth study. The inset graph ofFigure 6 shows that the PDA users do not have thisbehavior. The graph shows that there were twentyusers who only used their PDAs one day during ourtrace period. The number of users per number of ac-tive days tends to drop from there, further indicationof user dropout during our trace period.
Figures 5 and 6 indicate that some users did findtheir PDA useful. Over 20% used their PDAs morethan 46 days (60% of the 77 days), and 10% used themmore than 58 days (75% of the 77 days). A few en-thusiastic adopters used their PDAs nearly every day.
IV.B.1. Session durations
Figure 7 shows the heavy-tailed distribution of usersession lengths. Recall from Section III that a usersession is the time duration in which a user PDA ispowered on and able to detect nearby access points.The extremely long sessions are likely PDAs left run-ning in their cradles; one session lasted 333 hours(nearly two weeks). The median session duration,or the time a PDA remains connected to the wire-less network, was only 6.25 minutes compared to 16.6minutes for laptop users [4]. Further, only 16 percentof all sessions are at least one hour, compared to 29percent for laptop users. However, for both PDA andlaptop users, 27 percent of sessions were under oneminute. Still, a substantial number of sessions werelong: 20 percent of user sessions were 41 minutes orlonger, and 10 percent were 121 minutes or longer.
From the perspective of the access point, Figure 8contains the distribution of number of AP sessions for
0 0.2 0.4 0.6 0.8 1 1.2 1.4 1.6 1.8 2
x 104
0
0.1
0.2
0.3
0.4
0.5
0.6
0.7
0.8
0.9
1
Session Length (minutes)
CD
F
max = 19967mean = 56.73median = 6.25std = 306.57
0 10 20 30 40 50 60 70 80 900
0.10.20.30.40.50.60.70.80.9
1
Session Len (min)
CD
F
Figure 7: Empirical CDF of session lengths. Insetshows data for sessions less than 90 minutes in du-ration. Nearly half of all sessions were less than sixminutes. Extremely long sessions are likely PDAs leftrunning in their cradles.
0 1000 2000 3000 4000 5000 60000
0.1
0.2
0.3
0.4
0.5
0.6
0.7
0.8
0.9
1
Number of Sessions at an AP
Fra
ctio
n of
AP
s
max = 5152mean = 192.57median = 14std = 666.02
0 50 100 150 200 250 3000
0.2
0.4
0.6
0.8
1
No. Sessions
CD
F
Figure 8: Empirical CDF of AP session counts. Insetshows data for APs with fewer than 300 sessions.
the set of APs recorded in our trace. Recall from Sec-tion III that an AP session is the contiguous time pe-riod in which a user PDA associates with an accesspoint. This heavy-tailed distribution makes it diffi-cult to see that there was a median of 14 sessions atan AP. This heavy tail indicates that a few APs wereused very frequently and account for a large portionof the total number of AP sessions, while many of theAPs from our trace account for only a few, infrequentsessions. Around 20% of the APs account for 120 ormore sessions, 10% account for 304 or more sessions,and just 10 different APs account for 50% of all APsessions in our trace. Not surprisingly, these AP werelocated at the student housing facility, the hotspot ofPDA activity in our trace.
Figure 9 shows the CDF of AP session lengths,
Mobile Computing and Communications Review, Volume 9, Number 2 47

0 500 1000 1500 2000 2500 3000 3500 40000
0.1
0.2
0.3
0.4
0.5
0.6
0.7
0.8
0.9
1
Session Length (minutes)
CD
Fmax = 3735mean = 22.83median = 1.85std = 87.76
0 10 20 30 40 50 60 70 80 900
0.10.20.30.40.50.60.70.80.9
1
Session Len (min)
CD
F
Figure 9: Empirical CDF of AP session durations. In-set shows data sessions less than 90 minutes.
again a heavy-tailed distribution. Interestingly, APsessions had a median of only 1.85 minutes in length.This short session duration indicates that there wassignificant roaming during user sessions, where themedian was 6.25 minutes in length. This result isnot surprising considering that multiple APs were de-tected in most samples, and our cards periodicallyscan for the AP with the highest signal strength. Ifthe device detects an AP with a higher signal strength,it will re-associate unless the card is explicitly config-ured not to do so. Since signal strengths can vary sig-nificantly from one moment to the next at the same lo-cation, even stationary users experience re-associationwhen their devices detect two or more APs with sim-ilar signal strengths. As further evidence, the maxi-mum AP session length was only 62 hours comparedto a 333-hour user session length. Finally, 20 percentof all AP sessions were 15.7 minutes or longer, and 10percent were 45 minutes or longer.
IV.C. Mobility
In this section, we characterize overall user mobilityfrom two perspectives: (1) the distribution of the num-ber of access points with which users associate and thenumber which they detect, and (2) the distribution ofnumber of users which associate with particular ac-cess points. Intuitively, the first captures how widelyusers in the trace roam across campus and the secondcaptures how concentrated this roaming is.
We find that students are relatively mobile and usetheir PDAs in many locations. Figure 10 shows thecumulative distribution of the number of unique ac-cess points that users associate with throughout thetrace (the inset graph shows the distribution histogram
0 10 20 30 40 50 60 70 80 90 100 110 120 130 140 1500
0.1
0.2
0.3
0.4
0.5
0.6
0.7
0.8
0.9
1
Number of Unique AP Associations
CD
F
max = 142mean = 30.40median = 21std = 29.01
0 50 100 1500
10
20
30
40
50
No. Associations
No.
Use
rs
Figure 10: Number of access points with which usersassociate over the entire trace. Inset is histogram ofthe same with 50 bins.
0 10 20 30 40 50 60 70 800
0.1
0.2
0.3
0.4
0.5
0.6
0.7
0.8
0.9
1
Number of Unique AP Associations
CD
Fmax = 75mean = 15.11median = 10std = 16.51
0 20 40 60 800
10
20
30
40
50
No. Associations
No.
Use
rs
Figure 11: Empirical CDF of number of access pointswith which users associate during the first week. Insetis histogram of the same with 50 bins.
with 50 bins). From the graph, we see that 50% of theusers visit 21 APs or more, 20% visit 56 APs or more,and 10% visit 71 APs or more during the entire trace.In extreme cases, some students associated with over130 APs. Compared to the laptop users in the Dart-mouth study [4], we find that the typical wireless PDAuser is over twice as mobile as the typical laptop userin terms of the number of access points with whichthe user associates. Although factors such as variationin wireless network infrastructure and campus geog-raphy will effect this metric, this result suggests thatusers tend to operate PDAs in a larger number of lo-cations than their laptop counterparts.
Figures 11 and 12 show CDF plots of the userAP association counts for just the first week and firstMonday (9/23/2002) of the trace, respectively. Thesegraphs provide a finer-grained view of user activity,
48 Mobile Computing and Communications Review, Volume 9, Number 2

0 10 20 30 40 500
0.1
0.2
0.3
0.4
0.5
0.6
0.7
0.8
0.9
1
Number of Unique AP Associations
CD
F
max = 47mean = 6.28median = 3std = 7.98
0 10 20 30 40 500
10
20
30
40
No. Associations
No.
Use
rs
Figure 12: Empirical CDF of number of access pointswith which users associate on first Monday of thetrace (9/23/2002). Inset is histogram of the same with50 bins.
0 20 40 60 80 100 120 140 160 180 2000
0.1
0.2
0.3
0.4
0.5
0.6
0.7
0.8
0.9
1
Number of APs Sighted
CD
F
max = 197mean = 49.94median = 39std = 42.94
0 50 100 150 2000
5
10
15
20
25
No. APs Sighted
No.
Use
rs
Figure 13: Number of access points which a users de-tects over entire trace. Inset is histogram of the samewith 50 bins.
and demonstrate that users are quite active. Withinthe first week, 225 users had associated with an ac-cess point, half of which had already associated with10 or more different APs. Again, we find substan-tially more mobility in the PDA users in our trace —an average of 15 visited APs per user for the first weekin our workload versus three visited APs in the weeklong Schwab [5] workload. Note from Figure 12 that142 users were active on the first Monday. A few veryactive users associated with over 30 APs on that dayalone.
Figure 13 is similar to Figure 10, except that itshows the cumulative distribution of the number ofaccess points that users could have associated withthroughout the trace, i.e., the set of APs detected, butnot necessarily associated with during the trace. Re-
0 2 4 6 8 10 12 140
0.1
0.2
0.3
0.4
0.5
0.6
0.7
0.8
0.9
1
Number of APs Detected
CD
F
Samples:max = 14mean = 2.04median = 2std = 1.12
Sessions:max = 77mean = 3.13median = 2std = 4.11
Samples
Sessions
Figure 14: Empirical CDFs of APs detected in a sam-ple and APs seen during a session. Many sessions sawsignificantly more APs than any single sample in thesession, indicating user mobility during sessions.
0 20 40 60 80 100 120 140 160 1800
0.1
0.2
0.3
0.4
0.5
0.6
0.7
0.8
0.9
1
Number of Distinct Visitors
CD
F
max = 164mean = 20.74median = 6std = 29.51
0 20 40 60 80 1001201401601800
50
100
150
No. Visitors
No.
AP
s
Figure 15: Empirical CDF of number of distinct visi-tors to an AP. Inset is histogram of the same with 90bins.
call that our wireless monitor records all access pointssensed by the 802.11 wireless card, not just the APwith which the card associated. Comparing the graphsin Figures 10 and 13, we find that users see many moreaccess points than they associate with: 50% of theusers see 39 APs or more, 20% see 86 APs or more,and 10% see 107 APs or more.
Figure 14 compares the distributions of number ofAPs detected per sample with the number of APs seenduring a user session. Overall, users detect an averageof two access points in a sample. Note that 60% ofall samples detected multiple access points and 10%of all samples saw 4 or more APs. Such overlappingwireless network deployments provides useful oppor-tunities for location determination and load balancing.In addition, we see that a substantial number of user
Mobile Computing and Communications Review, Volume 9, Number 2 49

sessions see significantly more APs than are detectedin any one sample, indicating that many sessions in-volve user mobility. Such mobility is more difficultwith a laptop, where users are typically immobile dur-ing a session.
Looking at user mobility from the opposite perspec-tive, Figure 15 shows the empirical cumulative distri-bution of distinct PDA users seen across the accesspoints for the entire trace (the inset graph shows theraw distribution histogram using 90 bins). Many ac-cess points only see a few users: 50% of the APs see6 users or less. However, a significant fraction of ac-cess points see a large number of users: 20% see 41or more users, and 10% see 60 or more.
V. Trace-Based Mobility Models
Evaluations of mobile systems frequently use syn-thetic models of user mobility patterns, such as thepopular random waypoint model [10] and its numer-ous refinements (e.g., [19, 21, 24]), to derive wirelessnetwork topologies that change due to user mobility.Synthetic mobility models have a number of advan-tages, including the ability to arbitrarily scale the var-ious parameters of the model to exercise the systemacross a wide range of scenarios.
However, synthetic mobility models have the obvi-ous limitation that they are synthetic. Without basingits mobility patterns on realistic, observed device mo-bility, the extent to which a synthetic model representshow a mobile system would behave and perform in thereal world remains unclear. As a result, we argue thatevaluations of mobile systems need to also include theuse of mobility models derived from real, measuredmobility patterns.
To complement synthetic models, we propose twonew models of network topologies that incorporateuser mobility patterns from our traces. These mod-els represent the indoor and outdoor mobility of peo-ple with hand-held PDAs. As such they only repre-sent a particular mobility scenario, but one that is verycommon in applications of mobile systems. Further,since these models are derived from traces others canuse these traces for repeatability, for their own experi-ments, and for developing new models. For these pur-poses, we have made our traces available to other re-searchers [33].
V.A. Evolutionary topology model
The evolutionary topology model is a constructivemodel based upon the mobility of the users in ourtrace as well as the wireless connectivity of the
802.11b devices they used. We call it “evolutionary”because we derive the network topology from the net-work proximity of the users, and the topology natu-rally evolves over time as users move about as well aswhen they join and leave the network.
A compelling feature of the model is that it incorpo-rates the wireless connectivity and propagation char-acteristics of 802.11. Consequently, it naturally cap-tures and models the range, interference, and obstruc-tion properties of 802.11 that are challenging to realis-tically model using analytic approaches. For example,rather than determining whether two nodes can com-municate with each other based on a range parameter,the evolutionary topology model bases connectivityon the ability of users’ 802.11 devices to communi-cate in a particular location at a particular time. Ourexperience is that this feature is critical for improvingthe realism of the network topology used in simula-tion (see discussion below of Figure 16). As a result,we consider this model to be particularly realistic forwireless mobility scenarios using 802.11 devices, themost common scenario evaluated using wireless sim-ulators [20, 34]. Note that this model intimately tiestogether user mobility and network topology, tradingoff realism with generality. Our second model belowremoves the dependency on the use of 802.11 wire-less, albeit at some expense of realism.
The evolutionary topology model represents con-nectivity among users solely based on observed net-work proximity. For each time slot, we create a nodein the topology for each active user in our trace andcreate edges to connect nodes if users’ wireless de-vices could reasonably communicate with each otherat that location and time in the trace. Note that topol-ogy changes occur at the beginning of a time slot. Nochanges occur until the current time slot has expiredand the next begins. Since our sampling granularitywas twenty seconds, a time slot shorter than ten sec-onds, the average minimum session length, does notmake sense.
Ideally, the topology would have an edge betweentwo nodes if the users’ wireless devices sensed eachother in the trace. Recall, though, that in our trace werecorded all of the access points that each user couldsense (not just the AP with which the user was asso-ciated). Our original goal was to detect all 802.11bdevices, both user and AP, but device limitations pre-vented user-user detection. As a result, we approx-imate connectivity between two users by creating anedge between two nodes if the intersection of the set ofAPs sensed by their PDAs is non-empty, and removethe edge if the intersection of APs becomes empty
50 Mobile Computing and Communications Review, Volume 9, Number 2

0 20 40 60 80 100 1200
20
40
60
80
100
120
Distance (m)
Dis
tanc
e (m
)
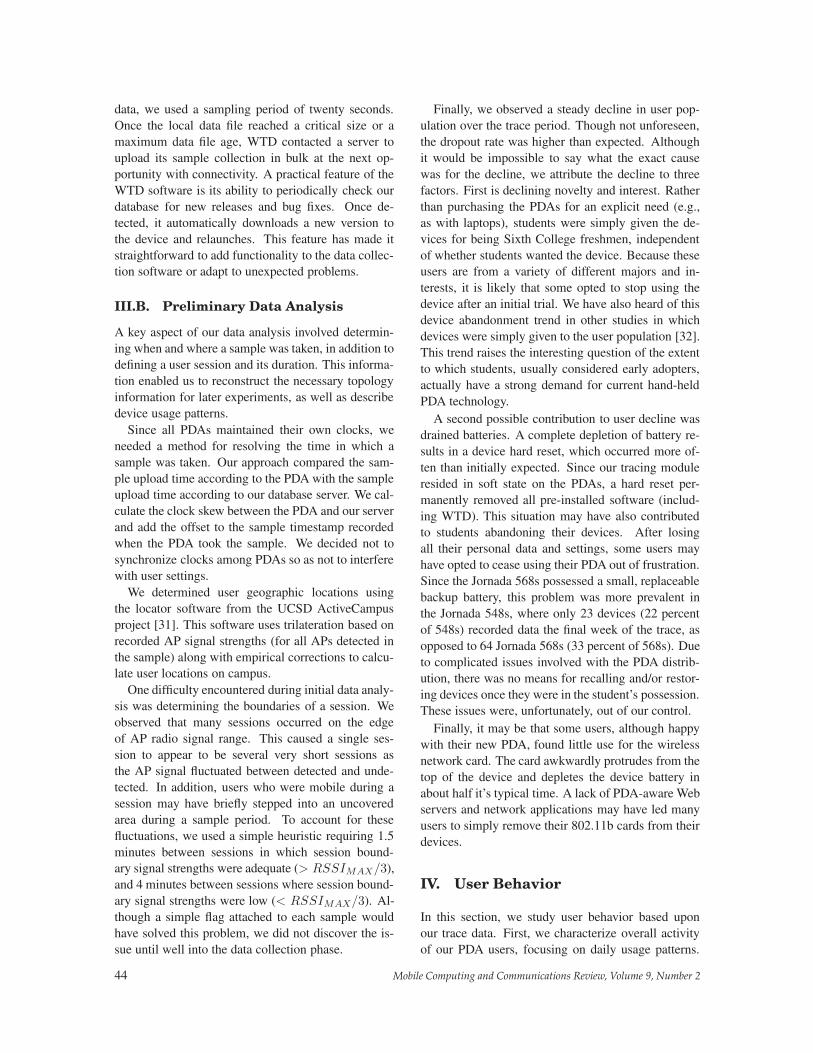
22 users81 links7.4 links/node average
N
Figure 16: Snapshot of the evolutionary topologymodel at noon on Monday, September 23, 2002 atSixth College student housing.
again. In other words, we create an edge between twonodes representing users in the topology if those userscould sense at least one AP in common during thattime slot. This approximation will have errors, sincetwo users sensing the same AP does not necessarilymean that they can potentially communicate directlywith each other. However, as discussed below, webelieve that this simplifying assumption is acceptableconsidering the behavior of current radio models, andthat the resulting topology is considerably more real-istic. In effect, we are generating a topology very nearto the actual topology.
Logically, we recreate this topology for each timeslot in the trace. As a result, the network topologynaturally evolves to model the mobility patterns ofusers and radio propagation characteristics over time.Nodes and edges appear and disappear based uponPDA on/off events and user movements observed inour trace. In practice, we only explicitly record thenode and edge changes in the topology over time forefficient representation.
Figure 16 shows an example time slice of our evolu-tionary topology model at noon on Monday, Septem-ber 23, 2002, in the Sixth College part of campus. Thenodes in the topology represent 22 users, with eachnode having an average degree of 7.4 for a total of81 edges. The evolutionary model also emphasizesthe limitation of the popular two-ray ground reflec-tion model for radio propagation in an environmentcontaining obstacles. This radio propagation model isoften used in wireless networking simulations to de-
Metric Min Max Avg MedianNodes 6 48 18 18Links 2 532 41 35Degree 1 22 4 4
Table 1: High-level characteristics of the evolutionarytopology model for the first week of the trace withinSixth College student housing.
termine when nodes are within communication rangeby calculating the strength of the received signal(s).Figure 16 shows that the evolutionary model accountsfor obstacles to generate a more realistic connectivitygraph than the two-ray ground model. For this geo-graphic setting, the two-ray ground model would cre-ate a completely connected graph under typical radiosettings.
Overall, from our trace we found that the evolu-tionary topology model results in interesting topolo-gies only within the Sixth College location of cam-pus. This part of campus is home to users with thedeployed PDAs. Once these users move throughoutcampus, they create numerous islands of disconnectedgraphs; the campus waypoint model described nextbetter captures and takes advantage of this extended,outdoor mobility. Focusing on the mobility patternsand topology of users within the Sixth College, Ta-ble 1 shows the high-level characteristics of the re-sulting evolutionary topology for the first week of ourtrace. In Section V.C, we use this evolutionary topol-ogy model to evaluate the performance of popular adhoc routing algorithms.
V.B. Campus waypoint model
The campus waypoint model serves as a trace-basedanalog to the random waypoint model. In this model,we associate users with geographic locations on cam-pus and model their mobility vectors and potential in-teractions as they access the wireless network overtime. However, rather than choosing user locations,speeds, and directions using random or other syntheticdistributions and models, we instead use the accessand mobility patterns of users in our trace. In this sec-tion we describe the model and compare its character-istics to common synthetic models.
In the campus waypoint model, the campus geog-raphy with 802.11 wireless coverage serves as the ge-ographic region in which nodes roam. This region isroughly a 1400m by 1700m rectangle. For each timestep in the model, we determine user location basedupon the set of APs that each user senses in that timeslot and the known geographic locations of those APs
Mobile Computing and Communications Review, Volume 9, Number 2 51

relative to the campus geography. For each user, weestimate user location via trilateration among the lo-cations of sensed APs.
We model user mobility over time based upon (1)the evolving set of sensed APs, and (2) the disappear-ance and reappearance of users at different AP loca-tions on campus assuming reasonable velocities. Auser always appears in the model when connected tothe wireless network. For each time slot, we updatea user’s location whenever their set of sensed APschanges. The location of a continuously connecteduser over time determines the mobility rate, direction,and pause time of that user. The mobility patternsfrom these kinds of users generally represent roamingwithin a building or within building clusters.
A user may appear in the model depending uponits wandering status. A user wanders when it disas-sociates from the network and re-associates at a dif-ferent location; these mobility patterns generally rep-resent outdoor roaming among buildings across cam-pus. We model wandering direction simply as thevector between the locations of disassociation and re-association. We model wandering speed by comput-ing the geographic distance between locations and di-viding by the time between associations. To ignoresituations where users wander far off a straight line(i.e., disappear for a long period of time and reappearat another location), we impose a minimum speed of0.5 mph on wandering speeds along a straight line.Depending upon the scenario being simulated, anyspeed below this threshold either causes a user to dis-appear and reappear in the network or move to thenew location at a speed of 0.5 mph and remain im-mobile there until a new destination is discovered. Asa result, wandering users can optionally appear, disap-pear, and re-appear in the model depending upon theexperimenter’s desire. Although in our trace users dis-associated from the network, ad hoc routing simula-tions, for example, can still take advantage of wander-ing users to model scenarios that assume users keeptheir devices active while wandering.
We make three significant observations when com-paring the mobility characteristics in our campus way-point model to those used in typical synthetic mod-els. First, unlike node mobility in typical parameter-izations of synthetic simulations, we find that only asmall percentage of users – 11 percent on average forthe first, most active week of trace – are actually inmotion at the same time. In contrast, typical para-meterizations for synthetic scenarios, independent ofthe complexity of the mobility model, result in mostnodes being mobile. Second, given that our users are
walking, users move in the campus waypoint model atan average speed of 2.2 mph, or roughly a meter persecond. For comparison, typical node speeds for adhoc routing in ns2 wireless scenarios are drawn froma uniform distribution between zero and twenty me-ters per second. Lastly, users appear and disappearfrom the network. This behavior, absent in most docu-mented simulations, can and does have drastic effectson network topology and connectivity. Perhaps thereason for the absence of this behavior in most simu-lations is in part due to the fact that node on/off eventsare not currently implemented in ns2. We have, how-ever, extended ns2 to model these events for the pro-tocol evaluations of Section V.C.
From our observations, we conclude that parame-terizations of mobility models commonly used to eval-uate mobile systems represent overly aggressive mo-bility scenarios. Such scenarios indeed stress the abil-ity of systems to deal with mobility, but at the expenseof realism. For scenarios where user movement islimited to walking, at least, our results suggest thatcommonly parameterized synthetic mobility modelsare too aggressive.
V.C. Preliminary routing evaluation
Groups of users with hand-held PDAs have frequentlybeen used as a motivating setting for ad hoc network-ing. As an example of using our mobility models, weevaluate popular ad hoc routing algorithms on the net-work topologies formed among users of modern wire-less PDAs. We focus on the performance of the rout-ing algorithms on the evolutionary topology model.We did not evaluate the campus waypoint model basedon our trace because the results would be trivial. Theonly location on campus with significant user densitywas the area encompassing student housing. In thecampus waypoint model for this scenario, all userswould be in direct range of each other using the pop-ular two-ray ground radio propagation model. Theresulting topology would then be a fully-connectedgraph.
We used ns2 version 2.1b8 to simulate and com-pare the performance of the DSR, DSDV, and AODVad hoc routing protocols on the evolutionary topol-ogy model. Our study focused on the Sixth Collegestudent housing area from noon to 1pm on Monday,September 23, 2002. Recall that this area consists ofeight buildings laid out in approximately a 130m x130m square area (lower right corner of Figures 1(a)and 1(b)). This area and time corresponds to a sce-nario where users establish an ad hoc network amonga cluster of nearby buildings, with mobility both in-
52 Mobile Computing and Communications Review, Volume 9, Number 2

side individual buildings as well as among buildings.Though node numbers fluctuated, there were at least30 PDAs active during the hour of simulated commu-nication. We used a granularity of one minute timeslots as the rate of evolution in the network topology.
Using the default ns2 wireless constant bit rate(CBR) traffic of 4 packets/sec, 512 byte packets, weran simulations with a random 10, 25, and 50 percentof the nodes communicating at any one time. The sim-ulation results indicate that all three protocols wereroughly equivalent in performance; the packet deliv-ery ratios for all protocols were within 2–4% of eachother across the various workload scenarios. Evenwith nodes appearing and disappearing, all three pro-tocols were able to quickly adapt to find new routesbetween senders and receivers, and user mobility wasnot a key factor in the performance of the protocols.
These results reflect the low rate of change of thenetwork topology: for the topology we simulated,the topology changes at the rate of only eleven linkchanges per minute. Students moved around in thenetwork during the hour, but the rate of movement waslow compared to the ability of the routing protocols toquickly adapt. Although dependent on our trace sce-nario, these results again suggest that many ad hocrouting simulations are overly aggressive in their pa-rameter choices for speed (up to 20 m/sec) and mobil-ity. Such choices emphasize topological change and,consequently, perhaps place too much emphasis on anuncommon case. For our scenario, the basic routingprotocols perform well and do not appear to requiresubstantial additional optimization — a topic that hasbeen the source of considerable effort in ad hoc rout-ing research.
We do not claim that these results are representa-tive of all interesting user mobility scenarios. How-ever, we argue (1) that the results are more indica-tive of protocol behavior in a compelling deploymentscenario than synthetic models with aggressive mobil-ity, and (2) they underscore the importance of linkingmodels to realistic scenarios and parameterizations.
VI. Conclusion
In this paper, we study the access and mobility char-acteristics of an 11-week trace of wireless PDA userson a university campus. Our study has two goals.
First, we characterized the high-level mobility andaccess patterns of hand-held PDA users. Comparedto previous studies focused on laptop users, we founda much wider variation in wireless network usageamong PDA users. Furthermore, we found that the
PDA users were about twice as mobile as laptop usersin terms of the number of access points they associ-ated with in the same time period.
Second, we develop two wireless network topol-ogy models for use in wireless mobility studies: anevolutionary topology model based upon the mobil-ity of the users in our trace as well as the wirelessconnectivity of the 802.11b devices they used, and acampus waypoint model that serves as a trace-basedanalog to the random waypoint model. We comparedthe characteristics of these trace-based models basedupon realistic user mobility patterns and wireless con-nectivity with default parameterizations of syntheticmodels. The evolutionary topology model overcomesthe limitations of the popular two-ray ground reflec-tion model for radio propagation in an environmentcontaining obstacles. For our geographic setting, thetwo-ray ground model would create a completely con-nected graph under typical radio settings, whereas ourmodel reflects a much more realistic network topol-ogy. The campus waypoint model contrasts sharplywith typical synthetic models in terms of percentageof nodes mobile at a time as well as average nodespeed in a campus scenario. The typical parameteri-zations of synthetic models are significantly more ag-gressive than what we found in practice.
We use the evolutionary network topology model asa case study to evaluate ad hoc routing algorithms ina realistic setting. The preliminary simulation resultsindicate that all three protocols were roughly equiva-lent in performance for our scenario, and that user mo-bility was not a key factor in their performance. Therate of topology change due to user mobility from thetrace was relatively low compared with the ability ofthe protocols to adapt to those changes. This resultunderscores the importance of linking models to real-istic scenarios and parameterizations.
Acknowledgments
The authors would like to thank John Bellardo forhis assistance with Firebird database issues and theFirebird client port to Windows CE. We thank StevenBrown and Bill Griswold for the use of their geoloca-tion software to resolve user locations from our trace.Finally, we thank Stefan Savage for useful discussionsand feedback throughout the course of this study.
We would also like to thank Hewlett-Packard fortheir HP University Mobile Technology Solutions giftwhich provided 2/3 of the PDAs, and the Califor-nia Institute for Telecommunications and InformationTechnology (Calit2) which provided the remaining
Mobile Computing and Communications Review, Volume 9, Number 2 53

1/3 of the PDAs.
References
[1] Diane Tang and Mary Baker. Analysis of ametropolitan-area wireless network. In ACMMobiCom, pages 13–23, 1999.
[2] Francisco Chinchilla, Mark Lindsey, and MariaPapadopouli. Analysis of wireless informationlocality and association patterns in a campus. InIEEE INFOCOM, March 2004.
[3] T. Henderson, D. Kotz, and I. Abyzov. Thechanging usage of a mature campus-wide wire-less network. In ACM MobiCom, September2004.
[4] David Kotz and Kobby Essien. Analysis of acampus-wide wireless network. In ACM Mobi-Com, 2002.
[5] David Schwab and Rick Bunt. Characterizingthe use of a campus wireless network. In IEEEINFOCOM, March 2004.
[6] A. Balachandran, G. Voelker, P. Bahl, andP. Rangan. Characterizing user behavior and net-work performance in a public wireless lan. InACM Sigmetrics, 2002.
[7] K. Ramachandran, E. Belding-Royer, andK. Almeroth. Damon: A distributed archi-tecture for monitoring multi-hop mobile net-works. In IEEE International Conference onSensor and Ad hoc Communications and Net-works (SECON), October 2004.
[8] Magdalena Balazinska and Paul Castro. Charac-terizing mobility and network usage in a corpo-rate wireless local-area network. In ACM Mo-biSys, 2003.
[9] D. Eckardt and P. Steenkiste. Measurement andanalysis of the error characteristics of an in-building wireless network. In ACM SIGCOMM,1996.
[10] Josh Broch, David A. Maltz, David B. Johnson,Yih-Chun Hu, and Jorjeta Jetcheva. A perfor-mance comparison of multi-hop wireless ad hocnetwork routing protocols. In ACM MobiCom,pages 85–97, 1998.
[11] David B Johnson and David A Maltz. Dy-namic source routing in ad hoc wireless net-works. In Imielinski and Korth, editors, ACM
MobiCom, volume 353. Kluwer Academic Pub-lishers, 1996.
[12] Vincent D. Park and M. Scott Corson. A highlyadaptive distributed routing algorithm for mo-bile wireless networks. In IEEE INFOCOM (3),pages 1405–1413, 1997.
[13] Charles Perkins and Pravin Bhagwat. Highlydynamic destination-sequenced distance-vectorrouting (DSDV) for mobile computers. In ACMSIGCOMM, pages 234–244, 1994.
[14] Charles E. Perkins and Elizabeth M. Royer. Adhoc on-demand distance vector routing. In IEEEWMCSA, pages 90–100, 1999.
[15] David A. Maltz, Josh Broch, and David B.Johnson. Experiences designing and buildinga multi-hop wireless ad hoc network testbed.Technical Report CMU-CS-99-116, School ofComputer Science, Carnegie Mellon University,March 1999.
[16] R. S. Gray, D. Kotz, C. Newport, N. Dubrovsky,A. Fiske, J. Liu, C. Masone, S. McGrath, andY. Yuan. Outdoor experimental comparison offour ad hoc routing algorithms. In MSWiM, Oc-tober 2004.
[17] Kevin Lai, Mema Roussopoulos, Diane Tang,Xinhua Zhao, and Mary Baker. Experienceswith a mobile testbed. In Proceedings of TheSecond International Conference on WorldwideComputing and its Applications (WWCA’98),March 1998.
[18] Diane Tang and Mary Baker. Analysis of a local-area wireless network. In ACM MobiCom, pages1–10, 2000.
[19] T. Camp, J. Boleng, and V. Davies. A surveyof mobility models for ad hoc network research.Wireless Communications and Mobile Comput-ing (WCMC): Special issue on Mobile Ad HocNetworking: Research, Trends and Applications,2(5):483–502, 2002.
[20] The network simulator - ns-2. http://www.isi.edu/nsnam/ns/, 2003.
[21] Amit Jardosh, Elizabeth Belding-Royer, KevinAlmeroth, and Subhash Suri. Towards realisticmobility models for mobile ad hoc networks. InACM MobiCom, pages 217–229, 2003.
54 Mobile Computing and Communications Review, Volume 9, Number 2

[22] Christian Bettstetter, Hannes Hartenstein, andXavier Perez-Costa. Stochastic properties of therandom waypoint mobility model: epoch length,direction distribution, and cell change rate. InACM MSwiM, 2002.
[23] E. Royer, P. Melliar-Smith, and L. Moser. Ananalysis of the optimum node density for ad hocmobile networks. In IEEE International Confer-ence on Communication, pages 857–861, 2001.
[24] Jungkeun Yoon, Mingyan Liu, and Brian Noble.Random waypoint considered harmful. In IEEEINFOCOM, pages 1312–1321, 2003.
[25] Jungkeun Yoon, Mingyan Liu, and Brian No-ble. Sound mobility models. In ACM MobiCom,pages 205–216, 2003.
[26] F. Bai, N. Sadagopan, and A. Helmy. Important:a framework to systematically analyze the im-pact of mobility on performance of routing pro-tocols for adhoc networks. In IEEE INFOCOM,2003.
[27] Christian Bettstetter. Smooth is better thansharp: A random mobility model for simulationof wireless networks. In ACM MSWiM, 2001.
[28] X. Hong, M. Gerla, G. Pei, and C. Chiang. Agroup mobility model for ad hoc wireless net-works. In ACM/IEEE MSWiM, pages 53–60,1999.
[29] Xiaoyan Hong, Taek Jin Kwon, Mario Gerla,Daniel Lihui Gu, and Guangyu Pei. A mobilityframework for ad hoc wireless networks. Lec-ture Notes in Computer Science, 1987, 2001.
[30] P. Johansson, T. Larsson, N. Hedman, B. Miel-czarek, and M. Degermark. Scenario-based per-formance analysis of routing protocols for mo-bile ad-hoc networks. In ACM MobiCom, pages195–206, 1999.
[31] Ezekiel S. Bhasker, Steven W. Brown, andWilliam G. Griswold. Employing user feedbackfor fast, accurate, low-maintenance geolocation-ing. In PerCom, March 2004.
[32] David Kotz. Personal Communication.
[33] Wireless topology discovery. http://ramp.ucsd.edu/wtd/, 2002.
[34] Xiang Zeng, Rajive Bagrodia, and Mario Gerla.Glomosim: A library for parallel simulation oflarge-scale wireless networks. In Workshop onParallel and Distributed Simulation, pages 154–161, 1998.
Mobile Computing and Communications Review, Volume 9, Number 2 55