Embed Size (px)
Citation preview
Access Across America: Transit 2019
Final Report
Prepared by:
Andrew OwenBrendan Murphy
Accessibility ObservatoryCenter for Transportation Studies
University of Minnesota
CTS 20-09

Technical Report Documentation Page 1. Report No. 2. 3. Recipients Accession No. CTS 20-09
4. Title and Subtitle 5. Report Date Access Across America: Transit 2019 October 2020
6.
7. Author(s) 8. Performing Organization Report No. Andrew Owen and Brendan Murphy 9. Performing Organization Name and Address 10. Project/Task/Work Unit No. Accessibility Observatory University of Minnesota Minneapolis, MN 55455 United States
CTS 2016016 11. Contract (C) or Grant (G) No.
12. Sponsoring Organization Name and Address 13. Type of Report and Period Covered Center for Transportation Studies University of Minnesota University Office Plaza, Suite 440 2221 University Avenue SE Minneapolis, MN 55414
Final Report 14. Sponsoring Agency Code
15. Supplementary Notes http://ao.umn.edu/publications/ http://www.cts.umn.edu/Publications/ResearchReports/ 16. Abstract (Limit: 250 words) Accessibility is the ease and feasibility of reaching valued destinations. It can be measured for a wide array of transportation modes, to different types of destinations, and at different times of day. There are a variety of ways to measure accessibility, but the number of destinations reachable within a given travel time is the most comprehensible and transparent as well as the most directly comparable across cities.
This study estimates the accessibility to jobs by transit and walking for each of the United States’ 11 million census blocks and analyzes these data in 49 of the 50 largest (by population) metropolitan areas. Transit is used for an estimated 5 percent of commuting trips in the United States, making it the second most widely used commute mode after driving. Travel times by transit are calculated using detailed pedestrian networks and full transit schedules for the 7:00 – 9:00 a.m. period. The calculations include all components of a transit journey, including “last-mile” access and egress walking segments and transfers, and account for minute-by-minute variations in service frequency.
This report presents detailed accessibility values for each metropolitan area, as well as block-level maps that illustrate the spatial patterns of accessibility within each area. A separate publication, Access Across America: Transit 2019 Methodology, describes the data and methodology used in this evaluation.
17. Document Analysis/Descriptors 18. Availability Statement accessibility, transit, commuting, work trips, land use, travel time, travel behavior, urban transportation
No restrictions. Document available from: National Technical Information Services, Alexandria, Virginia 22312
19. Security Class (this report) 20. Security Class (this page) 21. No. of Pages 22. Price Unclassified Unclassified 172

Access Across America: Transit 2019
Final Report
Prepared by:
Andrew OwenBrendan Murphy
Accessibility ObservatoryCenter for Transportation Studies
University of Minnesota
October 2020
Published by:
Center for Transportation StudiesUniversity of Minnesota
University Office Plaza, Suite 4402221 University Avenue SE
Minneapolis, Minnesota 55414
This report represents the results of research conducted by the authors and does not necessarily reflect the official views or policy of the Center for Transportation Studies or the University of Minnesota.

AuthorsAndrew OwenDirector, Accessibility ObservatoryUniversity of Minnesota
Brendan MurphyLead Researcher, Accessibility ObservatoryUniversity of Minnesota
AcknowledgementsThe development of this report was made possible by sponsorship from:
• Arkansas State Highway and Transportation Department
• California Department of Transportation
• District Department of Transportation
• Federal Highway Administration
• Florida Department of Transportation
• Illinois Department of Transportation
• Iowa Department of Transportation
• Maryland Department of Transportation
• Massachusetts Department of Transportation
• Minnesota Department of Transportation
• North Carolina Department of Transportation
• Tennessee Department of Transportation
• Virginia Department of Transportation
• Washington State Department of Transportation
Executive SummaryAccessibility is the ease and feasibility of reaching valuable destinations. Accessibility can be measuredfor a wide array of transportation modes, to different types of destinations, and at different times of day.There are a variety of ways to de ne accessibility, but the number of destinations reachable within agiven travel time is the most comprehensible and transparent—as well as the most directly comparablebetween cities, and other geographic areas. This report focuses on accessibility to jobs by transit. Jobsare the most signi cant non-home destination, and job accessibility is an important consideration inthe attractiveness and usefulness of a place or area. Transit is used for an estimated 5% of commutingtrips in the United States nationwide, making it the second most widely used commute mode afterdriving.
This study estimates the accessibility to jobs by transit and walking for each of the United States’11 million census blocks, and analyzes these data in the 50 largest (by population) metropolitan areas.Travel times by transit are calculated using detailed pedestrian networks and full transit schedules forthe 7:00 – 9:00 AMperiod. The calculations include all components of a transit journey, including “lastmile” access and egress walking segments and transfers, and account for minute-by-minute variationsin service frequency.
Rankings are determined by a weighted average of accessibility, with a higher weight given to closer,easier to access jobs. Jobs reachable within ten minutes are weighted most heavily, and jobs are givendecreasing weights as travel time increases up to 60minutes. Based on this measure, the 10metropolitanareas with the greatest accessibility to jobs by transit are:
1. New York
2. San Francisco
3. Chicago
4. Los Angeles
5. Boston
6. Washington, D.C.
7. Philadelphia
8. Seattle
9. San Jose
10. Denver
Additionally, rankings based on 1-year changes in weighted average accessibility are also provided,comparing the results of Access Across America: Transit 2018 with the results of the 2019 study. The 10metropolitan areas with the greatest 1-year relative gains in accessibility to jobs by transit are:
1. Phoenix

2. Raleigh
3. Los Angeles
4. Las Vegas
5. Riverside
6. Jacksonville
7. San Diego
8. San Antonio
9. Atlanta
10. Orlando
This report presents detailed accessibility values for each metropolitan area, as well as block-levelmaps that illustrate the spatial patterns of accessibility within each area. A separate publication, AccessAcross America: Transit 2019 Methodology, describes the data and methodology used in this evaluation.
This analysis uses the same tools, techniques and study scale as the Access Across America: Transit2015, 2016, 2017, 2018 reports. GTFS data are now su ciently consistent to allow for year to yearcomparisons of transit accessibility, and federal jobs and federal worker data are included in U.S. CensusBureau datasets in both data year 2018 and data year 2019. As a result, comparisons between 2018and 2019 accessibility results allow for meaningful inferences in changes in employment, land use, andtransportation networks.
4

Contents1 Introduction 1
2 Accessibility to Jobs by Transit 32.1 Metropolitan Area Rankings . . . . . . . . . . . . . . . . . . . . . . . . . . . 52.2 Longitudinal Analyses . . . . . . . . . . . . . . . . . . . . . . . . . . . . . . 7
3 Discussion 103.1 Transit Service Effects . . . . . . . . . . . . . . . . . . . . . . . . . . . . . . . 103.2 Land Use Effects . . . . . . . . . . . . . . . . . . . . . . . . . . . . . . . . . . 113.3 Comparisons With 2018 Data . . . . . . . . . . . . . . . . . . . . . . . . . . 123.4 Conclusions . . . . . . . . . . . . . . . . . . . . . . . . . . . . . . . . . . . . 12
4 Metropolitan Area Data and Maps 14

1 IntroductionAccessibility is the ease and feasibility of reaching valuable destinations. It combines the simpler metricof mobility with the understanding that travel is driven by a desire to reach destinations. Accessibilitycan be measured for a wide range of transportation modes, to different types of destinations, and atdifferent times of day. There are a variety of ways to de ne accessibility, but the number of destinationsreachable within a given travel time is the most comprehensible and transparent—as well as the mostdirectly comparable across cities. This report focuses on accessibility to jobs by transit. Jobs are themost signi cant non-home destination, and economic accessibility is an important consideration inthe attractiveness and usefulness of a place or area. Transit is used for an estimated 5% of commutingtrips in the United States, making it the second most widely used commute mode after driving.1 Thecommute mode share of transit can be higher in individual metropolitan areas: 31% in the New Yorkmetropolitan area; 11% in Chicago; 8% in Seattle.2
Accessibility is not a new idea.3 Historically, however, implementations of accessibility evalua-tion have typically focused on individual cities or metropolitan areas. Recent work has demonstratedthe feasibility and value of systematically evaluating accessibility across multiple metropolitan areas byauto,4 and by transit.5
This study estimates the accessibility to jobs by transit and walking for each of the United States’11 million census blocks, and analyzes these data in the 50 largest (by population) metropolitan areasusing transit schedules from 2019. Table 1 lists the included metropolitan areas, ordered by the totalemployment within each.
Travel times by transit are calculated using detailed pedestrian networks and full transit schedules forthe 7:00 – 9:00 AMperiod. The calculations include all components of a transit journey, including “lastmile” access and egress walking segments and transfers, and account for minute-by-minute variationsin service frequency.
Section 2 presents the accessibility values for the included metropolitan areas and ranks metropoli-tan areas by accessibility. Section 3 discusses these results and their implications, and Section 4 providesdata and maps describing patterns of accessibility in individual metropolitan areas. A separate docu-ment, Access Across America: Transit 2019 Methodology, describes the data and detailed methodologyused in the evaluation.
1McKenzie (2014)2American Community Survey 2012 5-year estimates3See Hansen (1959) for its origins, and Geurs and Van Eck (2001) and Handy and Niemeier (1997) for reviews.4Levinson (2013) Levine et al. (2012)5Ramsey and Bell (2014), Tomer et al. (2011)
1
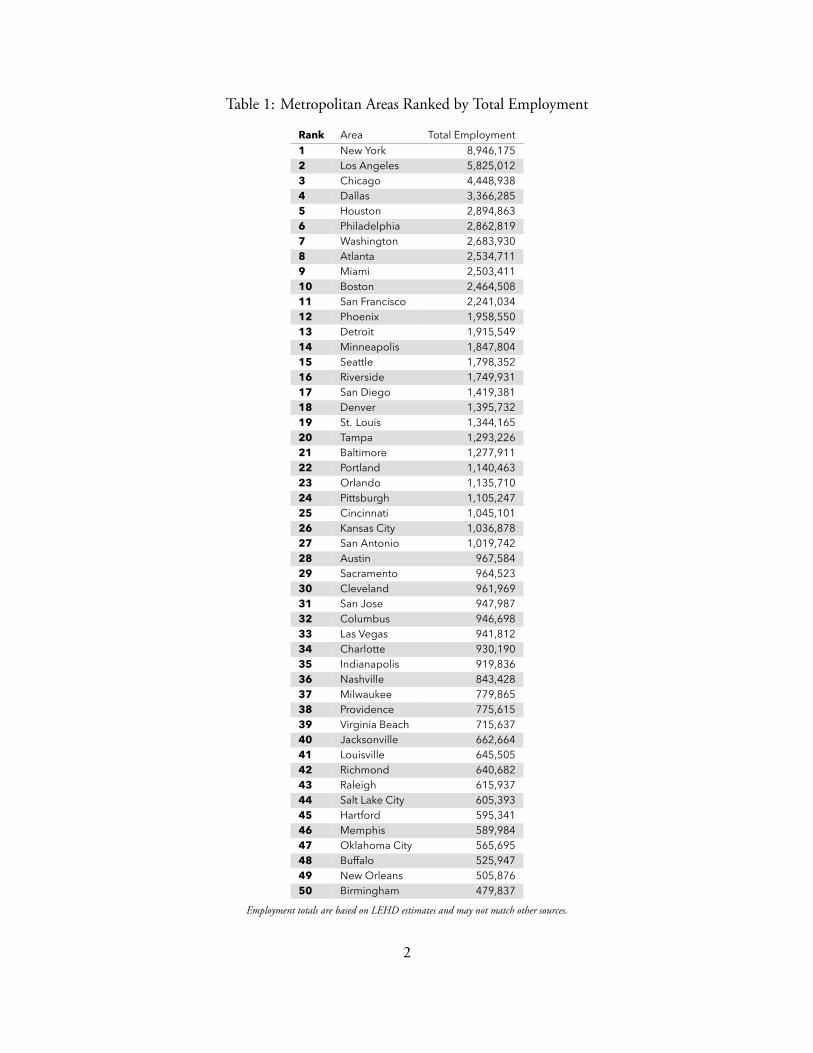
Table 1: Metropolitan Areas Ranked by Total Employment
Rank Area Total Employment1 New York 8,946,1752 Los Angeles 5,825,0123 Chicago 4,448,9384 Dallas 3,366,2855 Houston 2,894,8636 Philadelphia 2,862,8197 Washington 2,683,9308 Atlanta 2,534,7119 Miami 2,503,41110 Boston 2,464,50811 San Francisco 2,241,03412 Phoenix 1,958,55013 Detroit 1,915,54914 Minneapolis 1,847,80415 Seattle 1,798,35216 Riverside 1,749,93117 San Diego 1,419,38118 Denver 1,395,73219 St. Louis 1,344,16520 Tampa 1,293,22621 Baltimore 1,277,91122 Portland 1,140,46323 Orlando 1,135,71024 Pittsburgh 1,105,24725 Cincinnati 1,045,10126 Kansas City 1,036,87827 San Antonio 1,019,74228 Austin 967,58429 Sacramento 964,52330 Cleveland 961,96931 San Jose 947,98732 Columbus 946,69833 Las Vegas 941,81234 Charlotte 930,19035 Indianapolis 919,83636 Nashville 843,42837 Milwaukee 779,86538 Providence 775,61539 Virginia Beach 715,63740 Jacksonville 662,66441 Louisville 645,50542 Richmond 640,68243 Raleigh 615,93744 Salt Lake City 605,39345 Hartford 595,34146 Memphis 589,98447 Oklahoma City 565,69548 Buffalo 525,94749 New Orleans 505,87650 Birmingham 479,837
Employment totals are based on LEHD estimates and may not match other sources.
2

2 Accessibility to Jobs by TransitTable 2 gives the accessibility values for each metropolitan area, in alphabetical order, based on January,2019 transit schedules. The columns represent the number of jobs that a typical worker residing in thecity can reach within 10, 20, 30, 40, 50, and 60 minutes of travel, between 7:00 and 9:00 AM, bytransit and walking.
3
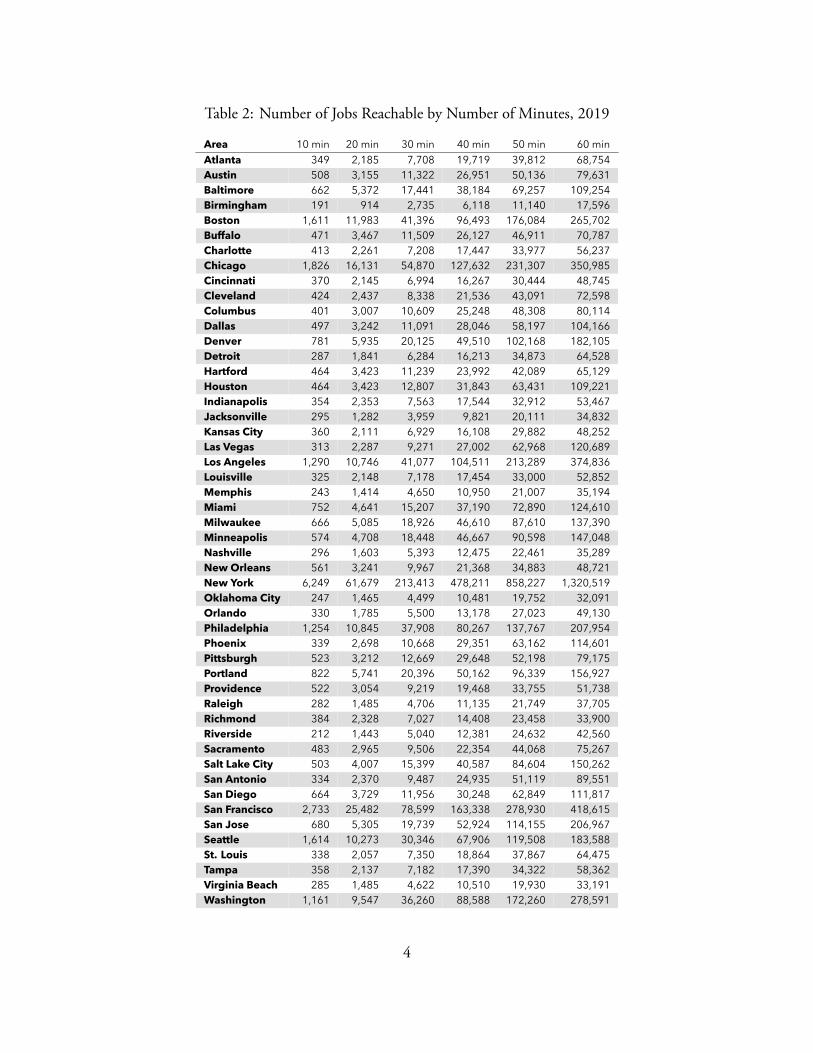
Table 2: Number of Jobs Reachable by Number of Minutes, 2019
Area 10 min 20 min 30 min 40 min 50 min 60 minAtlanta 349 2,185 7,708 19,719 39,812 68,754Austin 508 3,155 11,322 26,951 50,136 79,631Baltimore 662 5,372 17,441 38,184 69,257 109,254Birmingham 191 914 2,735 6,118 11,140 17,596Boston 1,611 11,983 41,396 96,493 176,084 265,702Buffalo 471 3,467 11,509 26,127 46,911 70,787Charlotte 413 2,261 7,208 17,447 33,977 56,237Chicago 1,826 16,131 54,870 127,632 231,307 350,985Cincinnati 370 2,145 6,994 16,267 30,444 48,745Cleveland 424 2,437 8,338 21,536 43,091 72,598Columbus 401 3,007 10,609 25,248 48,308 80,114Dallas 497 3,242 11,091 28,046 58,197 104,166Denver 781 5,935 20,125 49,510 102,168 182,105Detroit 287 1,841 6,284 16,213 34,873 64,528Hartford 464 3,423 11,239 23,992 42,089 65,129Houston 464 3,423 12,807 31,843 63,431 109,221Indianapolis 354 2,353 7,563 17,544 32,912 53,467Jacksonville 295 1,282 3,959 9,821 20,111 34,832Kansas City 360 2,111 6,929 16,108 29,882 48,252Las Vegas 313 2,287 9,271 27,002 62,968 120,689Los Angeles 1,290 10,746 41,077 104,511 213,289 374,836Louisville 325 2,148 7,178 17,454 33,000 52,852Memphis 243 1,414 4,650 10,950 21,007 35,194Miami 752 4,641 15,207 37,190 72,890 124,610Milwaukee 666 5,085 18,926 46,610 87,610 137,390Minneapolis 574 4,708 18,448 46,667 90,598 147,048Nashville 296 1,603 5,393 12,475 22,461 35,289New Orleans 561 3,241 9,967 21,368 34,883 48,721New York 6,249 61,679 213,413 478,211 858,227 1,320,519Oklahoma City 247 1,465 4,499 10,481 19,752 32,091Orlando 330 1,785 5,500 13,178 27,023 49,130Philadelphia 1,254 10,845 37,908 80,267 137,767 207,954Phoenix 339 2,698 10,668 29,351 63,162 114,601Pittsburgh 523 3,212 12,669 29,648 52,198 79,175Portland 822 5,741 20,396 50,162 96,339 156,927Providence 522 3,054 9,219 19,468 33,755 51,738Raleigh 282 1,485 4,706 11,135 21,749 37,705Richmond 384 2,328 7,027 14,408 23,458 33,900Riverside 212 1,443 5,040 12,381 24,632 42,560Sacramento 483 2,965 9,506 22,354 44,068 75,267Salt Lake City 503 4,007 15,399 40,587 84,604 150,262San Antonio 334 2,370 9,487 24,935 51,119 89,551San Diego 664 3,729 11,956 30,248 62,849 111,817San Francisco 2,733 25,482 78,599 163,338 278,930 418,615San Jose 680 5,305 19,739 52,924 114,155 206,967Seattle 1,614 10,273 30,346 67,906 119,508 183,588St. Louis 338 2,057 7,350 18,864 37,867 64,475Tampa 358 2,137 7,182 17,390 34,322 58,362Virginia Beach 285 1,485 4,622 10,510 19,930 33,191Washington 1,161 9,547 36,260 88,588 172,260 278,591
4

2.1 Metropolitan Area RankingsThe rankings of accessibility across U.S. cities for 2019 are shown in Table 3. The ranking is basedon a weighted average, where the jobs reachable within each threshold are given a decreasing weight astravel time increases. A job reachable within 10 minutes counts more toward the ranking than a jobreachable within 20, and so on. The 10 metro areas where workers can, on average, reach the most jobsare listed below. Within the speci c time thresholds, the rankings vary.
1. New York
2. San Francisco
3. Chicago
4. Los Angeles
5. Boston
6. Washington, D.C.
7. Philadelphia
8. Seattle
9. San Jose
10. Denver
5

Table 3: Rank of Accessibility by Metropolitan Area, 2019
Rank WeightedAverage
10 min 20 min 30 min 40 min 50 min 60 min
1 New York New York New York New York New York New York New York2 San Francisco San Francisco San Francisco San Francisco San Francisco San Francisco San Francisco3 Chicago Chicago Chicago Chicago Chicago Chicago Los Angeles4 Los Angeles Seattle Boston Boston Los Angeles Los Angeles Chicago5 Boston Boston Philadelphia Los Angeles Boston Boston Washington6 Washington Los Angeles Los Angeles Philadelphia Washington Washington Boston7 Philadelphia Philadelphia Seattle Washington Philadelphia Philadelphia Philadelphia8 Seattle Washington Washington Seattle Seattle Seattle San Jose9 San Jose Portland Denver Portland San Jose San Jose Seattle10 Denver Denver Portland Denver Portland Denver Denver11 Portland Miami Baltimore San Jose Denver Portland Portland12 Minneapolis San Jose San Jose Milwaukee Minneapolis Minneapolis Salt Lake City13 Milwaukee Milwaukee Milwaukee Minneapolis Milwaukee Milwaukee Minneapolis14 Salt Lake City San Diego Minneapolis Baltimore Salt Lake City Salt Lake City Milwaukee15 Baltimore Baltimore Miami Salt Lake City Baltimore Miami Miami16 Miami Minneapolis Salt Lake City Miami Miami Baltimore Las Vegas17 San Diego New Orleans San Diego Houston Houston Houston Phoenix18 Houston Pittsburgh Buffalo Pittsburgh San Diego Phoenix San Diego19 Phoenix Providence Houston San Diego Pittsburgh Las Vegas Baltimore20 Dallas Austin Hartford Buffalo Phoenix San Diego Houston21 Las Vegas Salt Lake City Dallas Austin Dallas Dallas Dallas22 Pittsburgh Dallas New Orleans Hartford Las Vegas Pittsburgh San Antonio23 Austin Sacramento Pittsburgh Dallas Austin San Antonio Columbus24 Buffalo Buffalo Austin Phoenix Buffalo Austin Austin25 Columbus Houston Providence Columbus Columbus Columbus Pittsburgh26 San Antonio Hartford Columbus New Orleans San Antonio Buffalo Sacramento27 Hartford Cleveland Sacramento Sacramento Hartford Sacramento Cleveland28 Sacramento Charlotte Phoenix San Antonio Sacramento Cleveland Buffalo29 Cleveland Columbus Cleveland Las Vegas Cleveland Hartford Atlanta30 New Orleans Richmond San Antonio Providence New Orleans Atlanta Hartford31 Providence Cincinnati Indianapolis Cleveland Atlanta St. Louis Detroit32 Atlanta Kansas City Richmond Atlanta Providence New Orleans St. Louis33 St. Louis Tampa Las Vegas Indianapolis St. Louis Detroit Tampa34 Charlotte Indianapolis Charlotte St. Louis Indianapolis Tampa Charlotte35 Tampa Atlanta Atlanta Charlotte Louisville Charlotte Indianapolis36 Indianapolis Phoenix Louisville Tampa Charlotte Providence Louisville37 Louisville St. Louis Cincinnati Louisville Tampa Louisville Providence38 Detroit San Antonio Tampa Richmond Cincinnati Indianapolis Orlando39 Cincinnati Orlando Kansas City Cincinnati Detroit Cincinnati Cincinnati40 Kansas City Louisville St. Louis Kansas City Kansas City Kansas City New Orleans41 Richmond Las Vegas Detroit Detroit Richmond Orlando Kansas City42 Orlando Nashville Orlando Orlando Orlando Riverside Riverside43 Riverside Jacksonville Nashville Nashville Nashville Richmond Raleigh44 Nashville Detroit Raleigh Riverside Riverside Nashville Nashville45 Raleigh Virginia Beach Virginia Beach Raleigh Raleigh Raleigh Memphis46 Memphis Raleigh Oklahoma City Memphis Memphis Memphis Jacksonville47 Virginia Beach Oklahoma City Riverside Virginia Beach Virginia Beach Jacksonville Richmond48 Oklahoma City Memphis Memphis Oklahoma City Oklahoma City Virginia Beach Virginia Beach49 Jacksonville Riverside Jacksonville Jacksonville Jacksonville Oklahoma City Oklahoma City50 Birmingham Birmingham Birmingham Birmingham Birmingham Birmingham Birmingham
6

2.2 Annual Accessibility ChangeThe 1-year relative gains and losses of weighted transit accessibility across U.S. cities between 2018and 2019 are shown in Table 4, and the ranking of metropolitan areas by the 1-year relative change inweighted transit accessibility is shown in Table 5. The differences detailed here are relative percentagechanges in weighted accessibility. Following are the 10metro areas which saw the largest gains in relativetransit accessibility over 2018 are as follows.
1. Phoenix
2. Raleigh
3. Los Angeles
4. Las Vegas
5. Riverside
6. Jacksonville
7. San Diego
8. San Antonio
9. Atlanta
10. Orlando
Additional details about each metropolitan area, including block-level maps of accessibility, arepresented in Section 4.
7
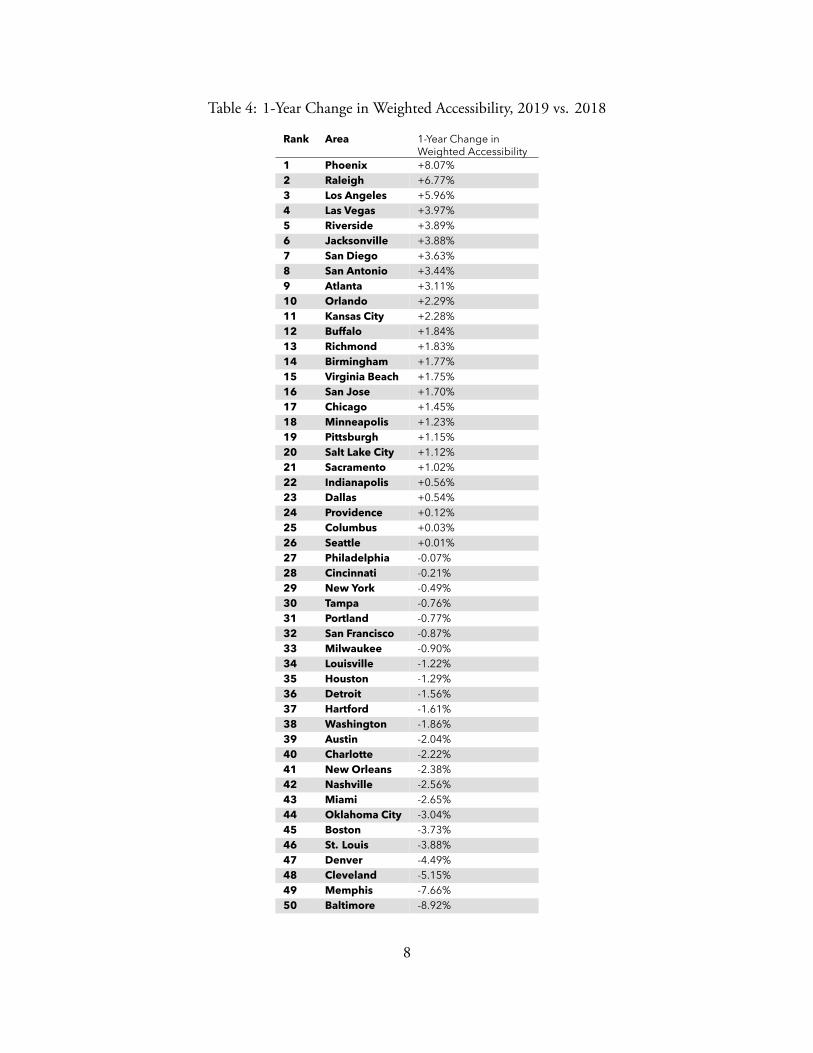
Table 4: 1-Year Change in Weighted Accessibility, 2019 vs. 2018
Rank Area 1-Year Change inWeighted Accessibility
1 Phoenix +8.07%2 Raleigh +6.77%3 Los Angeles +5.96%4 Las Vegas +3.97%5 Riverside +3.89%6 Jacksonville +3.88%7 San Diego +3.63%8 San Antonio +3.44%9 Atlanta +3.11%10 Orlando +2.29%11 Kansas City +2.28%12 Buffalo +1.84%13 Richmond +1.83%14 Birmingham +1.77%15 Virginia Beach +1.75%16 San Jose +1.70%17 Chicago +1.45%18 Minneapolis +1.23%19 Pittsburgh +1.15%20 Salt Lake City +1.12%21 Sacramento +1.02%22 Indianapolis +0.56%23 Dallas +0.54%24 Providence +0.12%25 Columbus +0.03%26 Seattle +0.01%27 Philadelphia -0.07%28 Cincinnati -0.21%29 New York -0.49%30 Tampa -0.76%31 Portland -0.77%32 San Francisco -0.87%33 Milwaukee -0.90%34 Louisville -1.22%35 Houston -1.29%36 Detroit -1.56%37 Hartford -1.61%38 Washington -1.86%39 Austin -2.04%40 Charlotte -2.22%41 New Orleans -2.38%42 Nashville -2.56%43 Miami -2.65%44 Oklahoma City -3.04%45 Boston -3.73%46 St. Louis -3.88%47 Denver -4.49%48 Cleveland -5.15%49 Memphis -7.66%50 Baltimore -8.92%
8
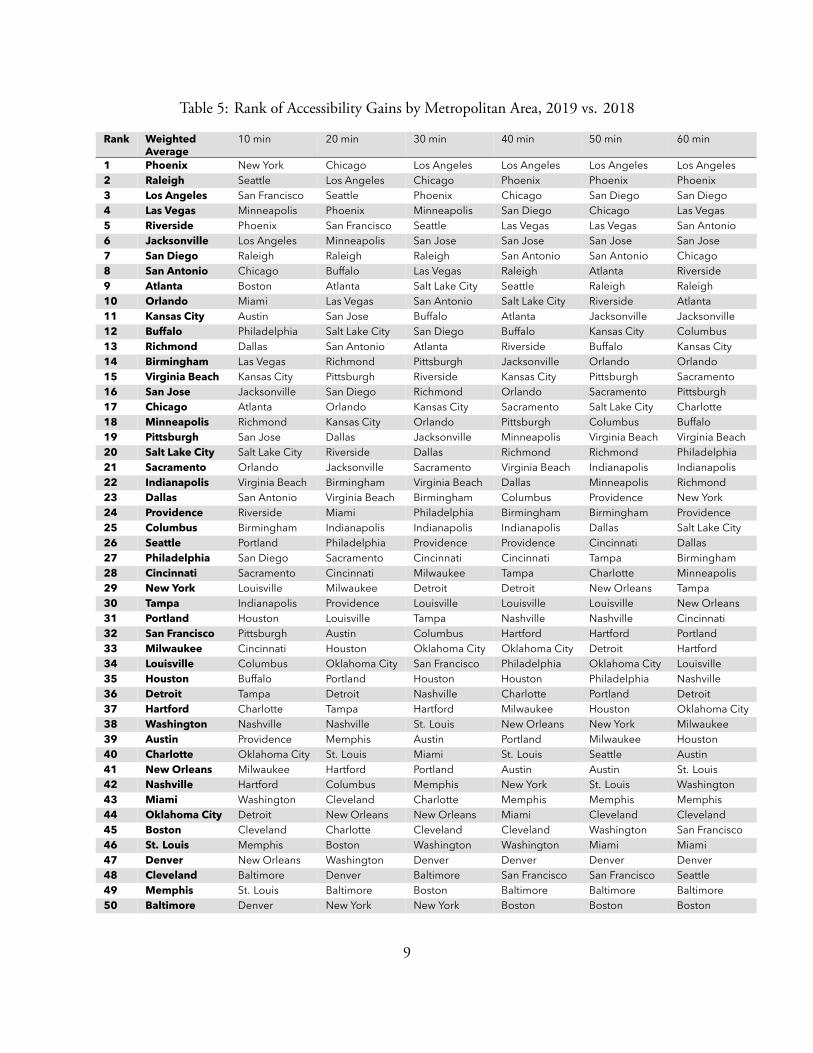
Table 5: Rank of Accessibility Gains by Metropolitan Area, 2019 vs. 2018
Rank WeightedAverage
10 min 20 min 30 min 40 min 50 min 60 min
1 Phoenix New York Chicago Los Angeles Los Angeles Los Angeles Los Angeles2 Raleigh Seattle Los Angeles Chicago Phoenix Phoenix Phoenix3 Los Angeles San Francisco Seattle Phoenix Chicago San Diego San Diego4 Las Vegas Minneapolis Phoenix Minneapolis San Diego Chicago Las Vegas5 Riverside Phoenix San Francisco Seattle Las Vegas Las Vegas San Antonio6 Jacksonville Los Angeles Minneapolis San Jose San Jose San Jose San Jose7 San Diego Raleigh Raleigh Raleigh San Antonio San Antonio Chicago8 San Antonio Chicago Buffalo Las Vegas Raleigh Atlanta Riverside9 Atlanta Boston Atlanta Salt Lake City Seattle Raleigh Raleigh10 Orlando Miami Las Vegas San Antonio Salt Lake City Riverside Atlanta11 Kansas City Austin San Jose Buffalo Atlanta Jacksonville Jacksonville12 Buffalo Philadelphia Salt Lake City San Diego Buffalo Kansas City Columbus13 Richmond Dallas San Antonio Atlanta Riverside Buffalo Kansas City14 Birmingham Las Vegas Richmond Pittsburgh Jacksonville Orlando Orlando15 Virginia Beach Kansas City Pittsburgh Riverside Kansas City Pittsburgh Sacramento16 San Jose Jacksonville San Diego Richmond Orlando Sacramento Pittsburgh17 Chicago Atlanta Orlando Kansas City Sacramento Salt Lake City Charlotte18 Minneapolis Richmond Kansas City Orlando Pittsburgh Columbus Buffalo19 Pittsburgh San Jose Dallas Jacksonville Minneapolis Virginia Beach Virginia Beach20 Salt Lake City Salt Lake City Riverside Dallas Richmond Richmond Philadelphia21 Sacramento Orlando Jacksonville Sacramento Virginia Beach Indianapolis Indianapolis22 Indianapolis Virginia Beach Birmingham Virginia Beach Dallas Minneapolis Richmond23 Dallas San Antonio Virginia Beach Birmingham Columbus Providence New York24 Providence Riverside Miami Philadelphia Birmingham Birmingham Providence25 Columbus Birmingham Indianapolis Indianapolis Indianapolis Dallas Salt Lake City26 Seattle Portland Philadelphia Providence Providence Cincinnati Dallas27 Philadelphia San Diego Sacramento Cincinnati Cincinnati Tampa Birmingham28 Cincinnati Sacramento Cincinnati Milwaukee Tampa Charlotte Minneapolis29 New York Louisville Milwaukee Detroit Detroit New Orleans Tampa30 Tampa Indianapolis Providence Louisville Louisville Louisville New Orleans31 Portland Houston Louisville Tampa Nashville Nashville Cincinnati32 San Francisco Pittsburgh Austin Columbus Hartford Hartford Portland33 Milwaukee Cincinnati Houston Oklahoma City Oklahoma City Detroit Hartford34 Louisville Columbus Oklahoma City San Francisco Philadelphia Oklahoma City Louisville35 Houston Buffalo Portland Houston Houston Philadelphia Nashville36 Detroit Tampa Detroit Nashville Charlotte Portland Detroit37 Hartford Charlotte Tampa Hartford Milwaukee Houston Oklahoma City38 Washington Nashville Nashville St. Louis New Orleans New York Milwaukee39 Austin Providence Memphis Austin Portland Milwaukee Houston40 Charlotte Oklahoma City St. Louis Miami St. Louis Seattle Austin41 New Orleans Milwaukee Hartford Portland Austin Austin St. Louis42 Nashville Hartford Columbus Memphis New York St. Louis Washington43 Miami Washington Cleveland Charlotte Memphis Memphis Memphis44 Oklahoma City Detroit New Orleans New Orleans Miami Cleveland Cleveland45 Boston Cleveland Charlotte Cleveland Cleveland Washington San Francisco46 St. Louis Memphis Boston Washington Washington Miami Miami47 Denver New Orleans Washington Denver Denver Denver Denver48 Cleveland Baltimore Denver Baltimore San Francisco San Francisco Seattle49 Memphis St. Louis Baltimore Boston Baltimore Baltimore Baltimore50 Baltimore Denver New York New York Boston Boston Boston
9
3 DiscussionThis report builds on the work begun in Access Across America: Transit 2014 and continued in AccessAcross America: Transit 2015 through Access Across America: Transit 2018, which introduced a newmethodology and datasets to enable inter-metropolitan comparisons of accessibility by transit in a waythat is clearly understood and explainable, tracks with our experience and the available evidence, andincorporates the many factors that determine the usefulness of a transit system. Additionally, in 2015the work expanded its scope to become fully national – accessibility data are calculated for every censusblock in the U.S.; data are aggregated and summarized within CBSAs for this report. In 2016, theuniform methodology across years allowed for direct comparison, and the beginning of longitudinalanalysis of accessibility. However, beginning in data year 2018 federal jobs and worker data were nolonger included in U.S. Census Bureau datasets, making year-to-year comparisons before and after2018 less accurate in places with larger shares of federal jobs. Comparisons between data year 2018and data year 2019 are meaningful and consistent.
Not all jobs are the same. Some jobs are higher paying, some are lower skilled, and they exist in avariety of industries. Given su cient data, one could differentiate accessibility by breaking down jobsby type and get different results. Accessibility to non-work locations (shopping, health care, education,etc.) is also important. Regardless of trip purpose, people who experience higher accessibility tend totravel shorter distances because origins and destinations are closer together.
But accessibility to jobs is not the only thing that people care about. If it were, cities would besituated on a minimum amount of space so people could live immediately adjacent to their jobs, oreveryone would work from home. Measuring (and then valuing) accessibility to other opportunities andconsidering the trade-off between accessibility and living space are central problems of urban economics,regional science, and transportation and land use planning. While being more accessible is generallybetter, there are costs as well as bene ts associated with accessibility. If land is more valuable, its priceis higher, and purchasers can afford less. Streets in places with more activities are inherently morecrowded, and trips are less peaceful.
Accessibility is a function of both transportation networks and land use decisions, which has impor-tant policy implications. There are two broad avenues to increasing accessibility: improving transporta-tion systems, and altering land use patterns. Neither of these things can be easily shifted overnight, butover time they do change—both through direct plans and action and through market forces.
It is important to recognize that aggregate metrics such as these are also affected simply by the sizeof the areas being studied. For example, residents of central Minneapolis enjoy greater accessibilitythan those of central Milwaukee, but the expansive Minneapolis–Saint Paul metropolitan area, whichis over four times as large in land area, includes far more suburban and exurban areas (with little or notransit service) than does the Milwaukee area.
3.1 Transit Service EffectsTransit transportation improvements within existing infrastructure take the form of speed increases orfrequency increases. Speed improvements increase accessibility by making destinations reachable in lesstime, but they are often di cult to achieve for transit vehicles operating in mixed tra c. Frequencyimprovements reduce the average amount of time spent waiting for transit vehicles at stops, leaving
10

more time for travel toward valuable destinations. Speed and frequency are also linked: as averagespeeds increase, a xed number of transit vehicles can serve the same route length with increasingfrequency.6 Improvements involving construction of new transit infrastructure (additional bus stops,rail line extensions, or entirely new transit lines) also can heavily in uence accessibility by transit, byproviding transit-based access to job centers and destinations previously unreachable. New transit lineswhich serve already-served areas do not expand the set of reachable valuable destinations, but couldserve to increase service frequency in aggregate.
This evaluation re ects the impact of transit service frequency bymaking the assumption that all de-parture times are equally valuable to users, and it includes full waiting times before each trip. This is animportant difference relative to earlier national evaluations of transit accessibility, which typically use asingle departure time and/or a xed wait time.7 This approach provides two important bene ts. First,it avoids the assumptions that transit service with 30-minute frequency is as valuable as service with10-minute frequency, and that users suffer no inconvenience from adjusting their personal schedules tomatch transit schedules. Second, it allows more meaningful comparisons with accessibility evaluationsfor other transportation modes such as driving,8 which typically use average speeds over time periods—implicitly assuming an equal value of departure times. As a result of this methodological choice, theaccessibility results presented here are far more sensitive to service frequency effects than those of ear-lier transit accessibility evaluations. Cities with robust transit coverage but low service frequency aregenerally ranked lower than cities with comparable networks but higher frequencies.
3.2 Land Use EffectsLand use-based approaches to improving transit accessibility revolve around proximity and density forboth origins and destinations. Proximity to transit service is critical in overcoming both the low speed ofpedestrian access to and from stops and stations, and the decrease inmotivation tomake the walking tripwith greater distance. Density is the manifestation of the increasing value of more accessible locations.As residential areas become denser, more residents experience the local accessibility; as employmentareas become denser, more jobs can be accessed through the same transit system.
Density is not determined solely by accessibility, however: land use policies can restrict densitywhere it would otherwise be high or encourage density where it might otherwise be low. Perhaps themost famous examples of such policies are Oregon’s urban growth boundary laws, which encouragedensity by restricting the amount of land available for urban development, and the Height of BuildingsAct of 1910, which restricts density in the District of Columbia by limiting building heights. Othernotable areas with urban growth boundary laws in the U.S. include Seattle, San Jose, and Boulder;additionally, Boston limits building heights near its Common central park. Between these most salientexamples lie a range of density-focused urban policies, typically embedded in zoning codes, which helpenable (and hinder) each city’s transit accessibility performance. In general, areas with higher residentialand employment density can achieve greater transit accessibility given the same level of transit service.
At lower accessibility thresholds, and especially at the 10-minute threshold, the job accessibilityexperienced by a typical worker is determined primarily by local employment density and only secon-
6Walker (2012) provides a detailed and accessible exploration of transit service fundamentals.7e.g. Tomer et al. (2011), Ramsey and Bell (2014)8e.g. Levinson (2013), Levine et al. (2012)
11

darily, if at all, by transit service. With a 10-minute travel time budget, reaching a stop, waiting for avehicle, and walking to the destination after alighting leave little time available for actually traveling ona transit vehicle. It is likely that most jobs within this threshold are reached solely by walking and donot involve a transit vehicle at all. The results presented in Table 3 for the 10-minute threshold lookmuch like a ranking by employment and residential density. As the travel time threshold increases, sodoes the relative contribution of transit service and coverage to the rankings.
3.3 Comparisons With 2018 DataThis analysis uses the same tools, techniques and study scale as the Access Across America: Transit 2015–2018 reports. GTFS data are now su ciently consistent to allow for year to year comparisons of transitaccessibility, and federal jobs and federal worker data are included in U.S. Census Bureau datasets inboth data year 2018 and data year 2019. As a result, comparisons between 2018 and 2019 accessi-bility results allow for meaningful inferences in changes in employment, land use, and transportationnetworks.
This update of datasource, in combination with increased GTFS consistency, allows observation ofsigni cant land use changes (namely, job growth and mixed-use densi cation in certain metropolitanareas), and the impact of land use on how accessible a city will turn out to be. The precise disentan-glement of accessibility changes due to land use mix or transit improvements (and determining relativepercentage apportionment) requires a signi cant increase in the amount of accessibility computations,but the relative impacts can be estimated by computing accessibility using multiple years of LEHDdata (see methodology explanation in Access Across America: Transit 2019 Methodology).
Among the metropolitan areas with the most signi cant positive changes, Phoenix and Los Ange-les showed a mix of positive accessibility changes from both transit investments and land use; Raleighshowed accessibility increases primarily due to job growth and relocation. Among the metropolitanareas with signi cant negative changes, Baltimore implemented the BaltimoreLink service redesign,which went into effect around February 4, 2018; Memphis’ MATA implemented bus service changesin 2018; Cleveland’s GCRTA experienced budget cuts in 2018; and Oklahoma City experienced em-ployment changes leading to lower accessibility.
3.4 ConclusionsThe cities that make up the top 10 transit accessibility ranks all exhibit a combination of high densityland use and fast, frequent transit service. However, there is still signi cant variation within this group.In New York, San Francisco, Washington, and Chicago, fast heavy rail systems connect both urbanand suburban areas with a highly employment-dense core. It is instructive to compare these cities toAtlanta, which has a similar, but smaller, rail system but a much more decentralized job and populationdistribution, and lower accessibility. Seattle and Denver both have rapidly expanding light rail systems,supported by extensive and frequent bus networks. Though Portland is famous for its streetcar service,this covers only a small part of the city, and operates mostly in mixed tra c with very little accessto proprietary right-of-way, limiting its service speed. Its urban growth boundary, combined withfrequent bus service throughout core areas and light rail connections to suburban areas, likely plays amore important role in providing high accessibility: by encouraging both residents and employers to
12
locate in parts of the city already well served by transit, each new resident enjoys high accessibility butimposes only a small marginal burden on the transit system’s existing resources.
Additionally, the scope of this report’s focus toward analyzing accessibility for every census block intheU.S. affords a look at what impact public transit has on a national scale. The vast majority of the U.S.land mass is quite sparsely-populated outside of metropolitan areas, and the contained metropolitanareas are in many cases very far apart. Also, the type of transit service included in the analysis is strictlylimited to public transit, most commonly found in urban areas—inter-city bus and rail services, such asMegabus, Greyhound, or Jefferson, and Amtrak, respectively, are not included. Further, such servicesoperate on time-scales greater than the travel times involved in this analysis. Given that mostly urban-centric systems are included, only a very small geographical area of the country enjoys mass transitservices, and thus the total area experiencing transit accessibility bene ts is quite small.
Transportation and land use systems are both dynamic, and this report presents the fourth annualnational evaluation, following those detailed in Access Across America: Transit 2015 through Access AcrossAmerica: Transit 2018. In constantly evolving systems like these, it is critical to monitor changes overtime. A city that adopts a goal of increasing transit accessibility should be evaluated based on how effec-tively it advances that goal relative to a baseline. Access Across America: Transit 2014 served as a startingframework for inter-city accessibility evaluation, and Access Across America: Transit 2015 expanded thescope and data availability to allow direct year-to-year comparisons, which began in Access Across Amer-ica: 2016 ; this report adds 2019 transit accessibility data, and continues the process of monitoring howaccessibility in these metropolitan areas evolves in response to transportation investments and land usedecisions.
13

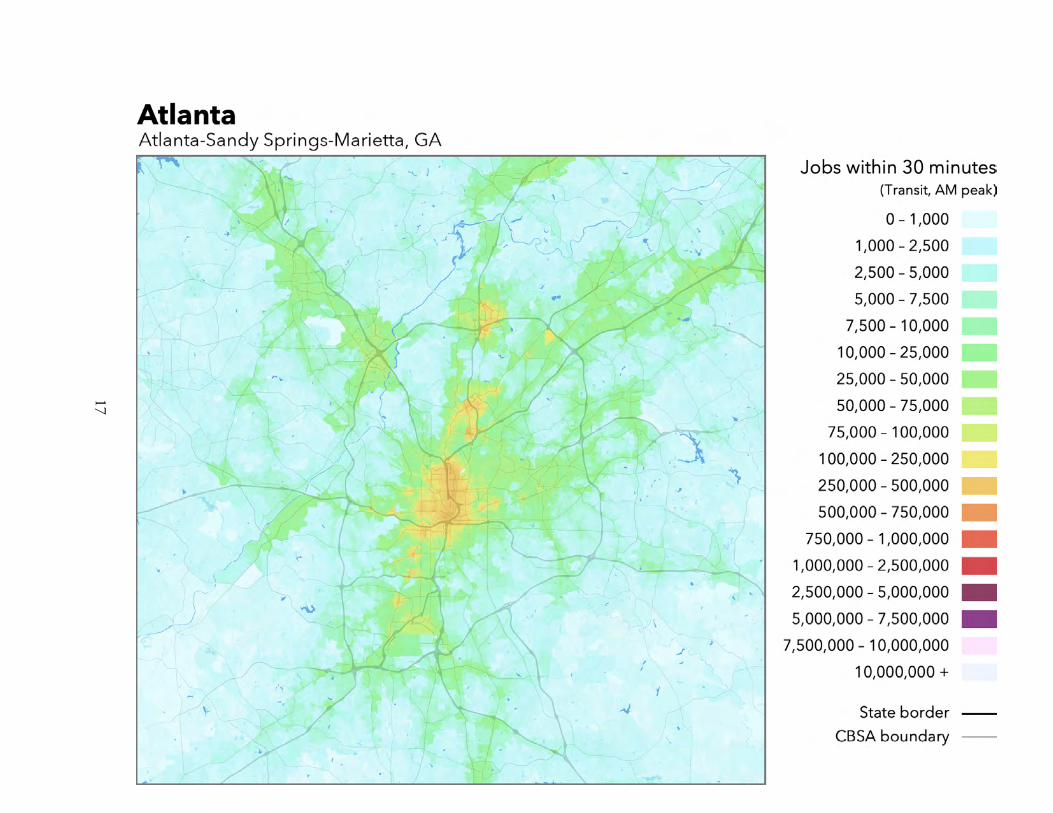
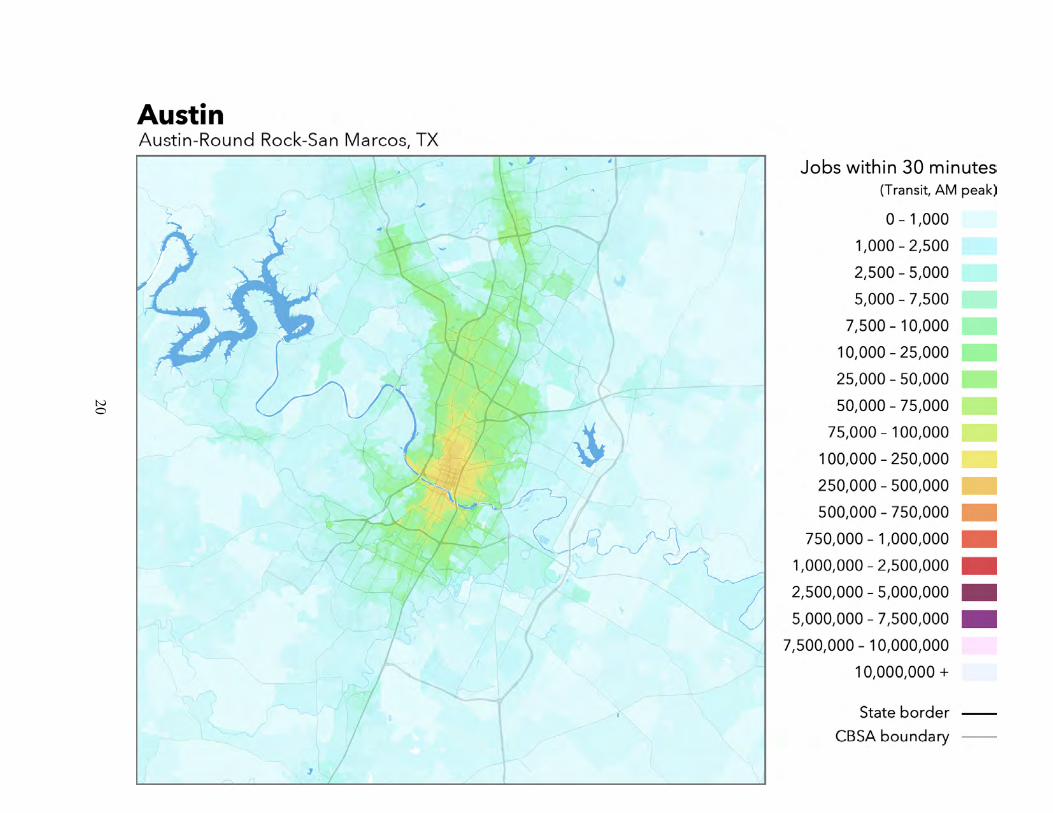
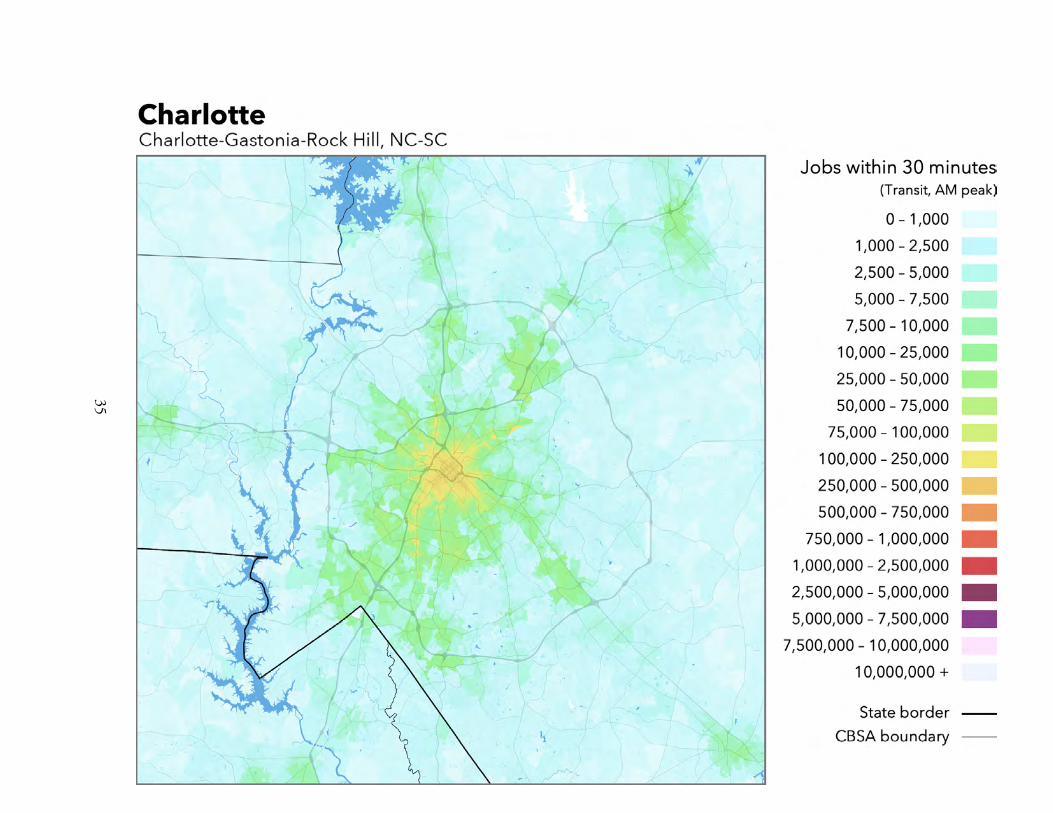
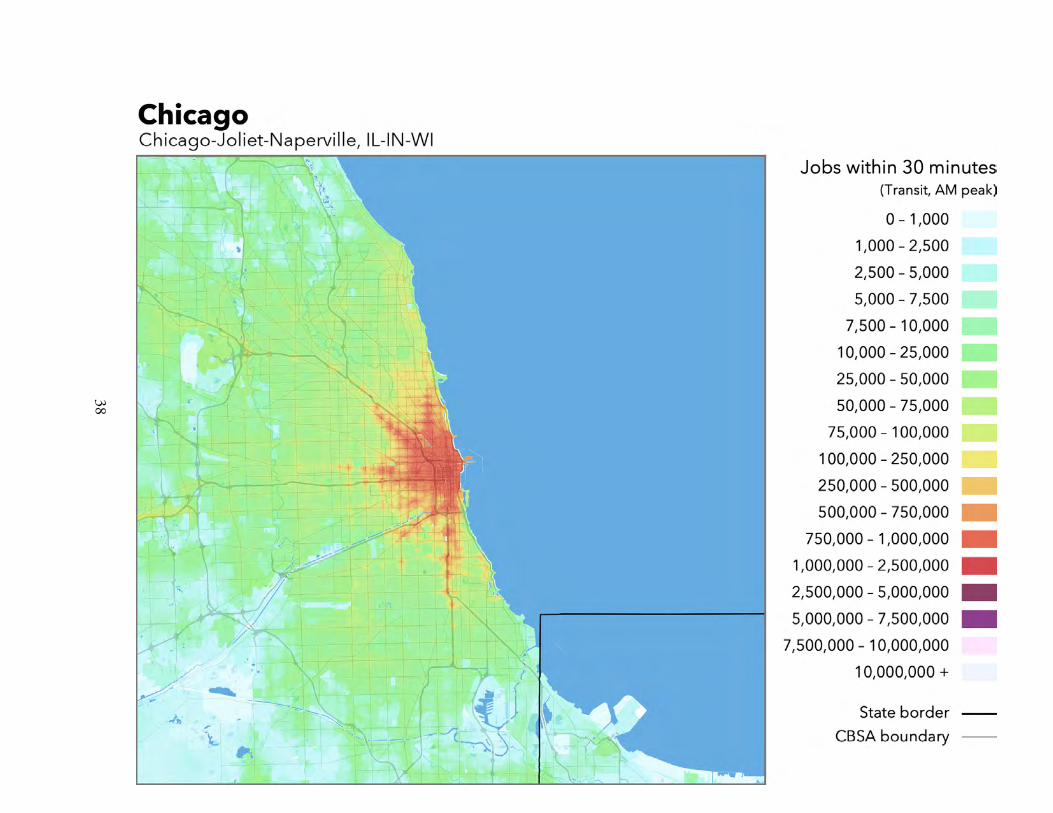
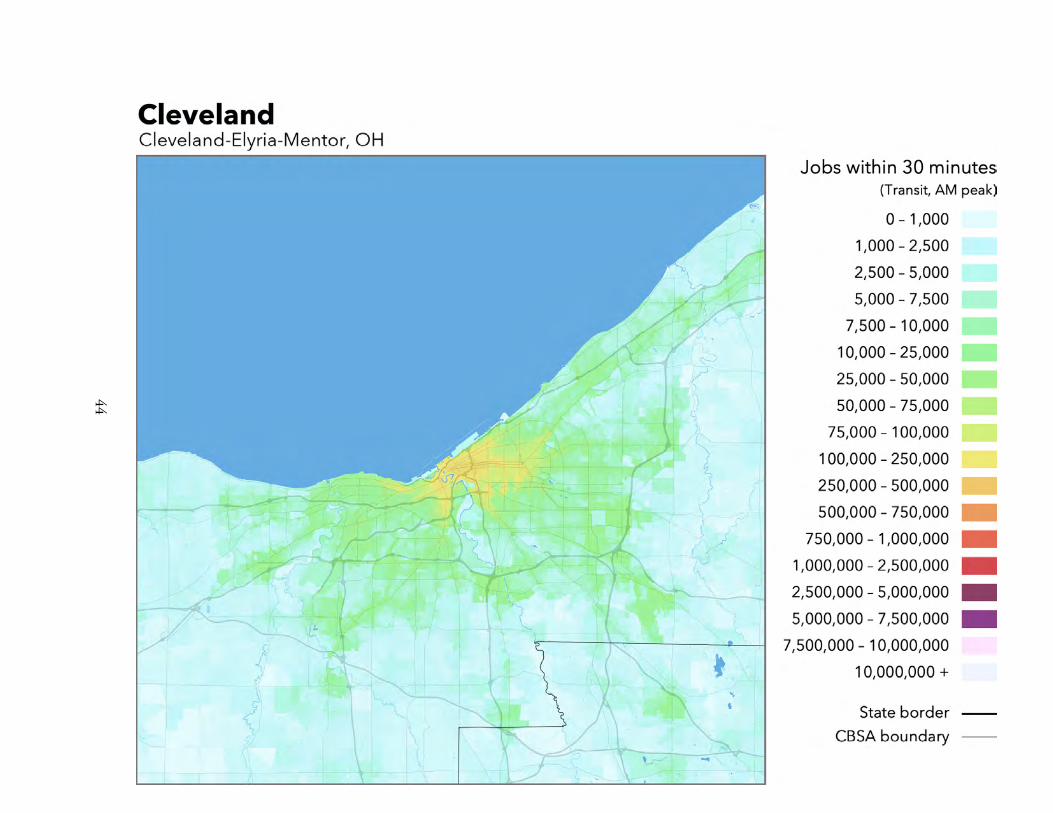
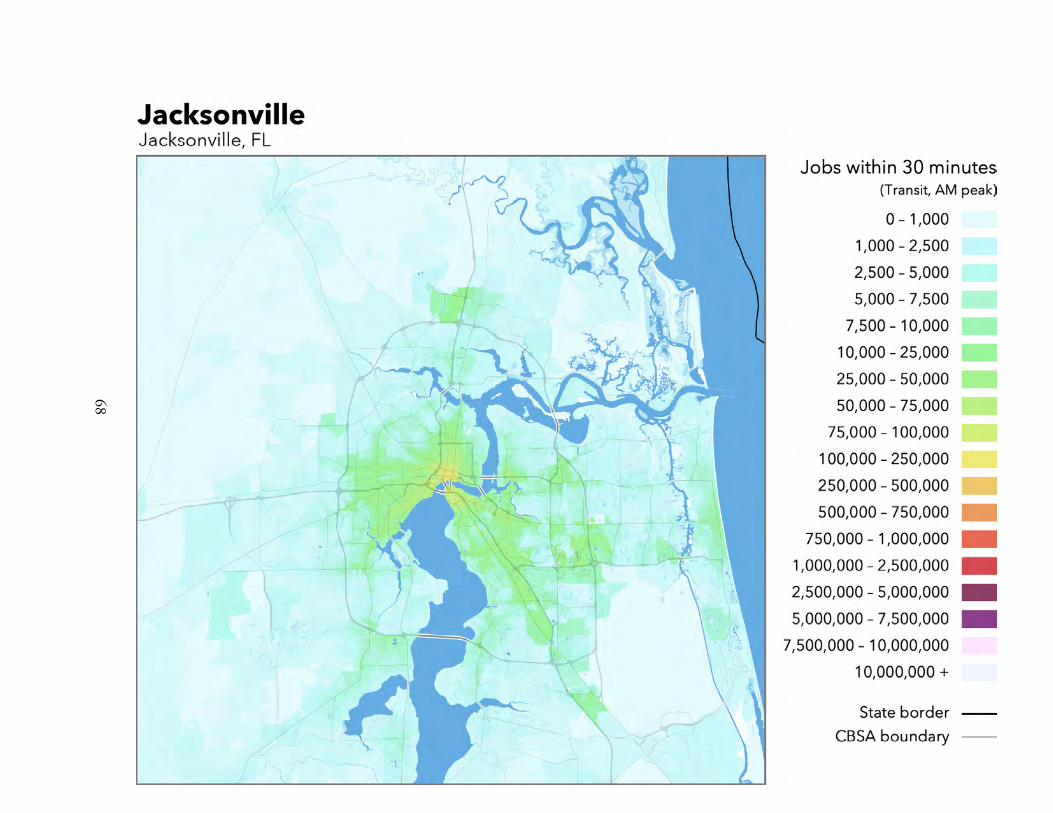
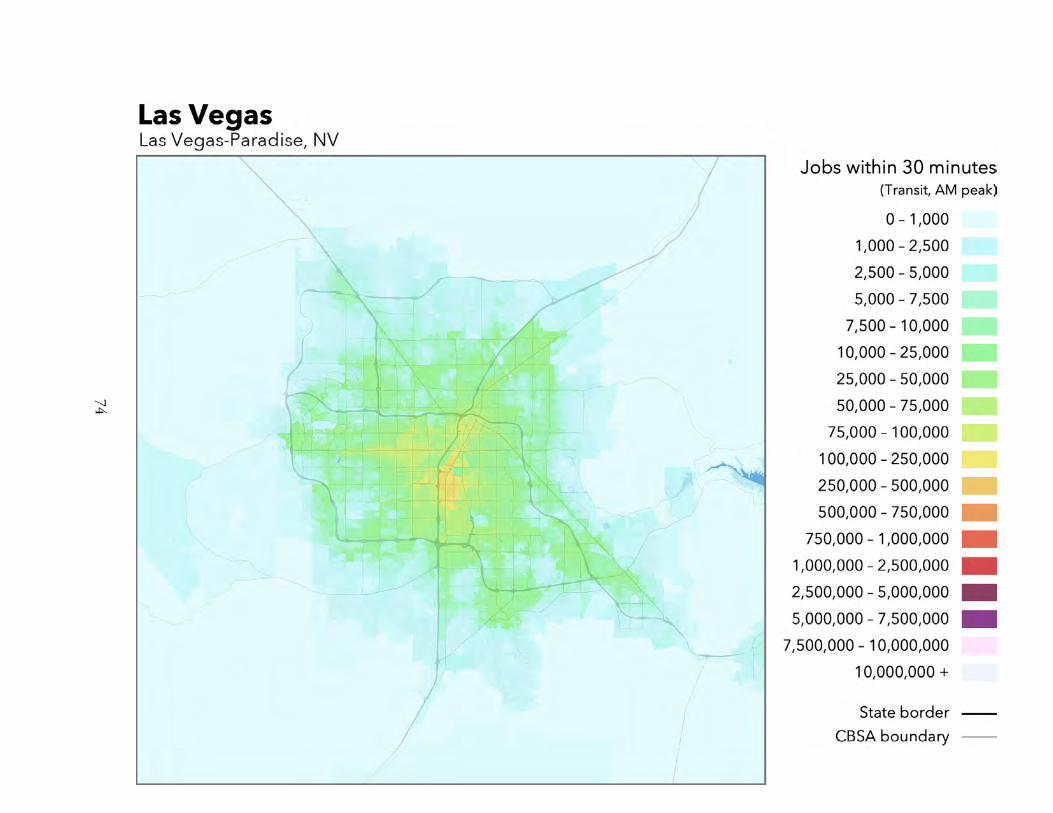
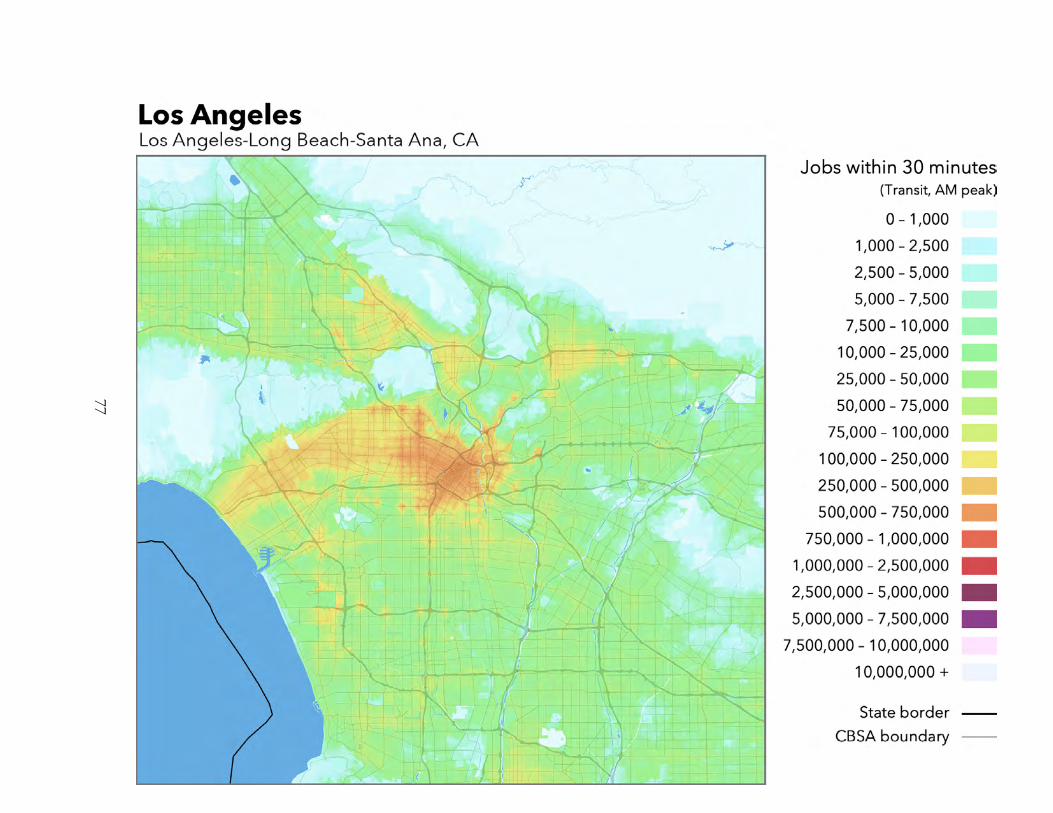
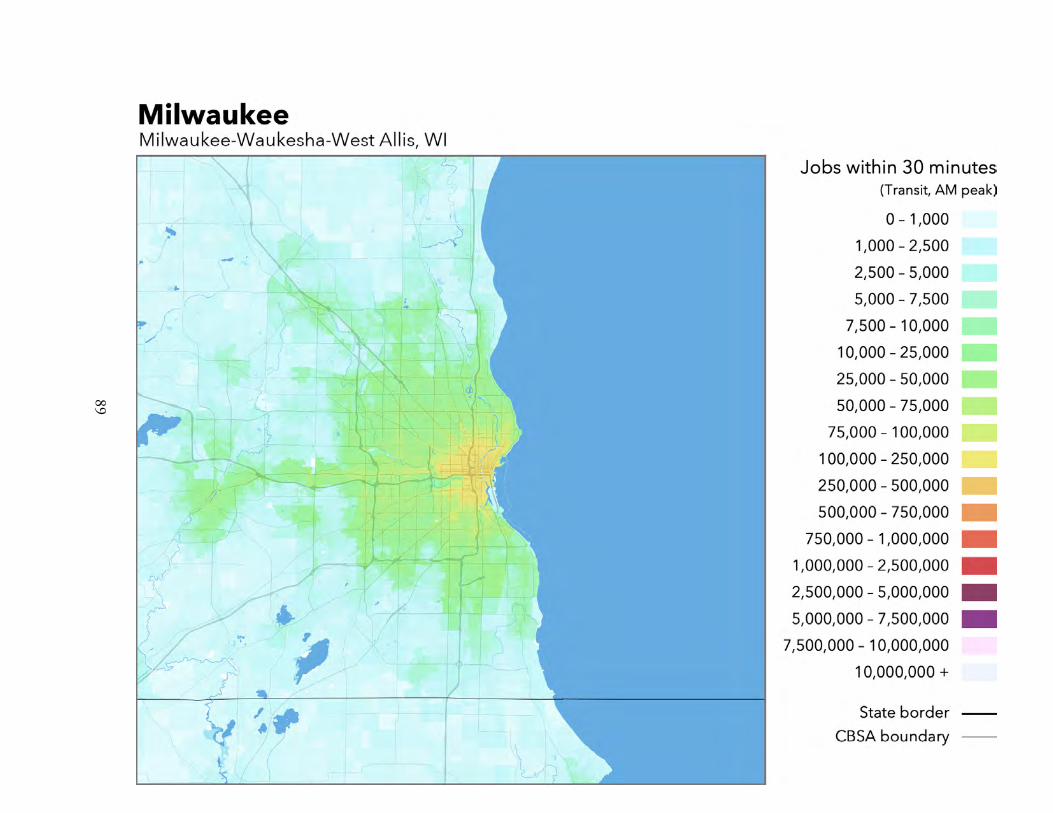
4 Metropolitan Area Data and MapsThe following pages present summary accessibility data andmaps for each of the 50 includedmetropoli-tan areas. Metropolitan areas are presented in alphabetical order. The maps show 30-minute accessi-bility values at the Census block level, averaged between 7:00 and 9:00 AM. On the data summarypages, two different chart scales are used to accommodate the wide range of accessibility values acrossmetropolitan areas. All charts using the same scale are plotted in the same color.
14

AtlantaAtlanta-Sandy Springs-Marietta, GA
Rank by Weighted Accessibility 32Rank by Total Employment 8Rank by 1-Year Change in Weighted Accessibility 91-Year Change in Weighted Accessibility +3.11%1-Year Change in Weighted Accessibility Rank +1Total Jobs 2,637,483Average Job Density (per km2) 122Total Workers 2,534,711Average Worker Density (per km2) 117Job and worker totals are based on LEHD estimates and may not match other sources.
Job Accessibility by Travel Time Threshold
10 min 20 min 30 min 40 min 50 min 60 min
100,000
200,000
300,000
400,000
349 2,185 7,708 19,719 39,81268,754
1-Year Change in Weighted Accessibility by Travel Time Threshold
10 min 20 min 30 min 40 min 50 min 60 min -20,000
-10,000
0
10,000
20,000
+11 +83 +248 +591 +1,174 +1,769
15

Transit Schedules IncludedAgency DatesCobbLinc September 30, 2016 – September 30, 2018Gwinnett County Transit June 11, 2018 – January 1, 2021Metropolitan Atlanta Rapid Transit Authority December 8, 2018 – April 12, 2019SRTA January 14, 2019 – April 14, 2019
16
17
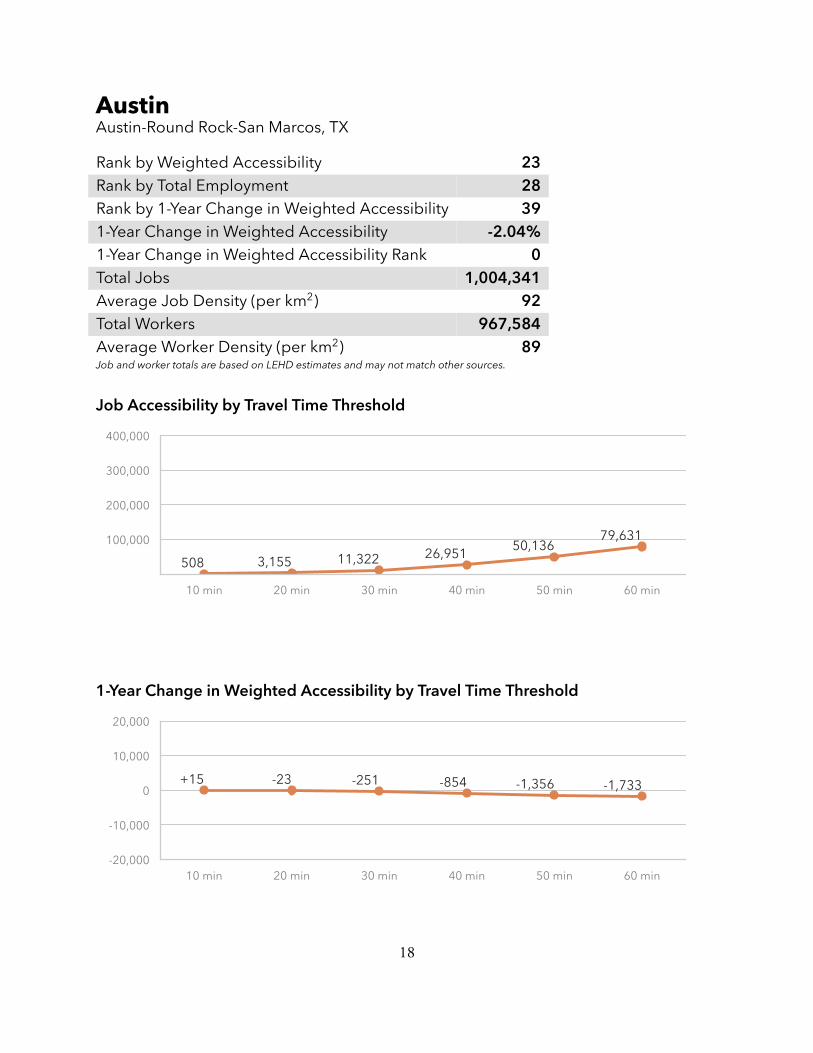
AustinAustin-Round Rock-San Marcos, TX
Rank by Weighted Accessibility 23Rank by Total Employment 28Rank by 1-Year Change in Weighted Accessibility 391-Year Change in Weighted Accessibility -2.04%1-Year Change in Weighted Accessibility Rank 0Total Jobs 1,004,341Average Job Density (per km2) 92Total Workers 967,584Average Worker Density (per km2) 89Job and worker totals are based on LEHD estimates and may not match other sources.
Job Accessibility by Travel Time Threshold
10 min 20 min 30 min 40 min 50 min 60 min
100,000
200,000
300,000
400,000
508 3,155 11,322 26,95150,136
79,631
1-Year Change in Weighted Accessibility by Travel Time Threshold
10 min 20 min 30 min 40 min 50 min 60 min -20,000
-10,000
0
10,000
20,000
+15 -23 -251 -854 -1,356 -1,733
18

Transit Schedules IncludedAgency DatesCapital Metro January 6, 2019 – June 15, 2019
19
20
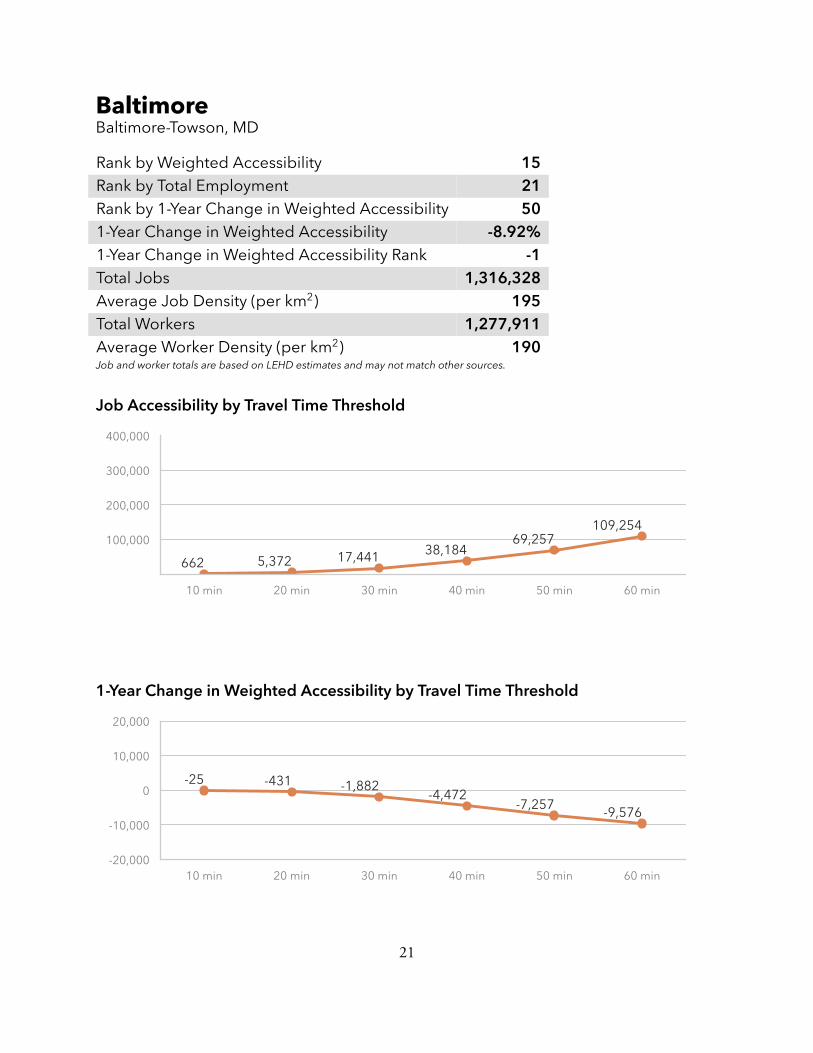
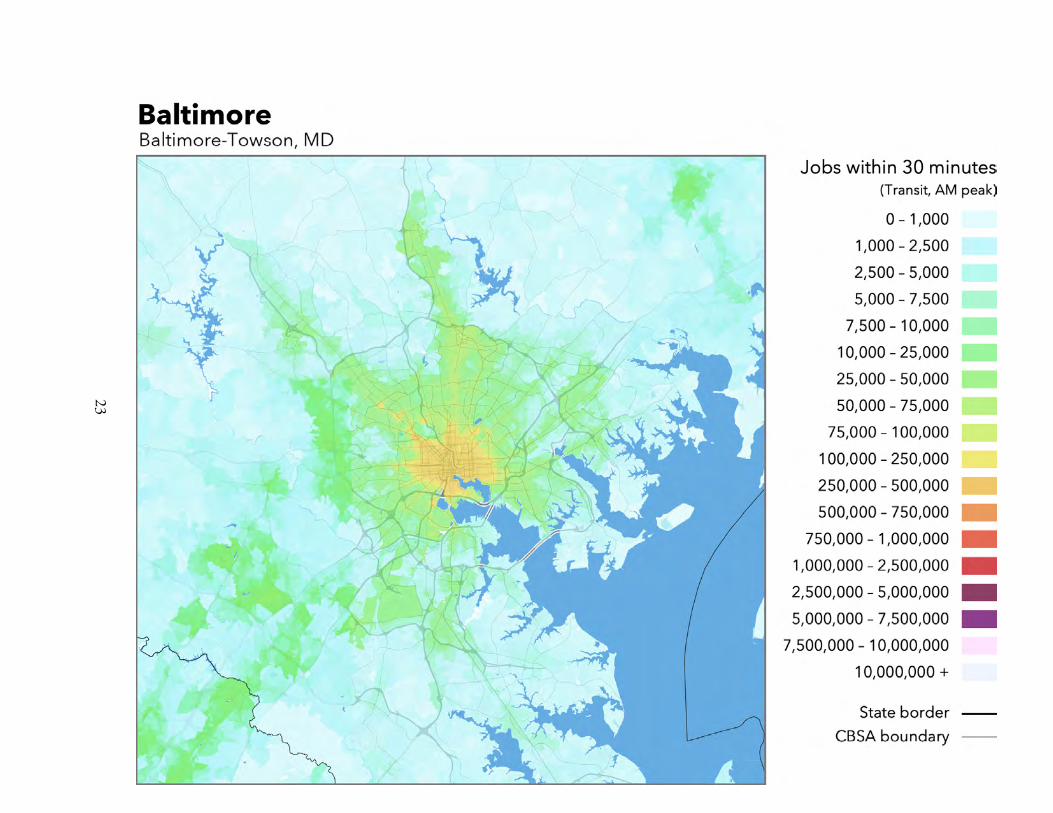
BaltimoreBaltimore-Towson, MD
Rank by Weighted Accessibility 15Rank by Total Employment 21Rank by 1-Year Change in Weighted Accessibility 501-Year Change in Weighted Accessibility -8.92%1-Year Change in Weighted Accessibility Rank -1Total Jobs 1,316,328Average Job Density (per km2) 195Total Workers 1,277,911Average Worker Density (per km2) 190Job and worker totals are based on LEHD estimates and may not match other sources.
Job Accessibility by Travel Time Threshold
10 min 20 min 30 min 40 min 50 min 60 min
100,000
200,000
300,000
400,000
662 5,372 17,441 38,18469,257
109,254
1-Year Change in Weighted Accessibility by Travel Time Threshold
10 min 20 min 30 min 40 min 50 min 60 min -20,000
-10,000
0
10,000
20,000
-25 -431 -1,882-4,472
-7,257-9,576
21

Transit Schedules IncludedAgency DatesBWI Thurgood Marshall Airport December 17, 2018 – December 31, 2022Carroll Transit System January 1, 2019 – January 31, 2022Charm City Circulator May 1, 2016 – February 28, 2020Delmarva Community Transit September 23, 2015 – February 28, 2022Harford Transit LINK October 1, 2018 – June 1, 2019Maryland Transit Administration September 2, 2018 – February 2, 2019Queen Anne’s County Ride September 3, 2017 – February 28, 2019Rabbit Transit December 7, 2018 – December 7, 2019Regional Transportation Agency of Central Maryland May 5, 2019 – August 10, 2019WMATA November 30, 2018 – May 28, 2019
22
23

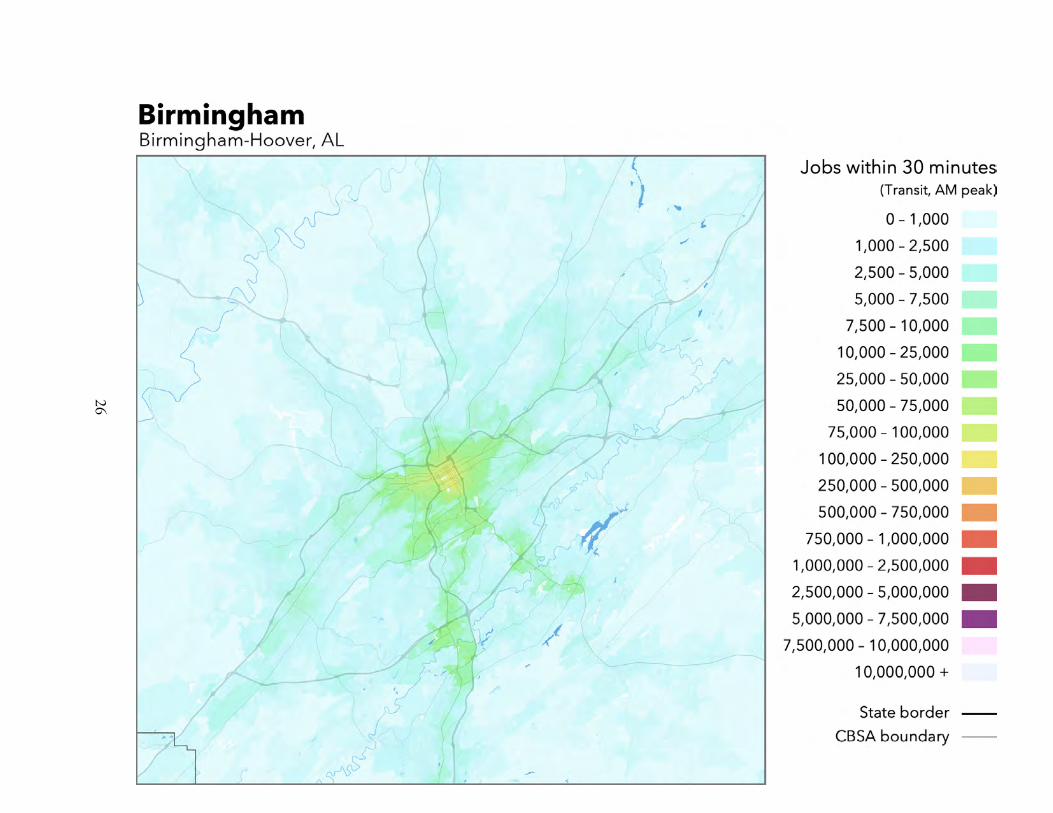
BirminghamBirmingham-Hoover, AL
Rank by Weighted Accessibility 50Rank by Total Employment 50Rank by 1-Year Change in Weighted Accessibility 141-Year Change in Weighted Accessibility +1.77%1-Year Change in Weighted Accessibility Rank 0Total Jobs 510,537Average Job Density (per km2) 37Total Workers 479,837Average Worker Density (per km2) 35Job and worker totals are based on LEHD estimates and may not match other sources.
Job Accessibility by Travel Time Threshold
10 min 20 min 30 min 40 min 50 min 60 min
100,000
200,000
300,000
400,000
191 914 2,735 6,118 11,140 17,596
1-Year Change in Weighted Accessibility by Travel Time Threshold
10 min 20 min 30 min 40 min 50 min 60 min -20,000
-10,000
0
10,000
20,000
+5 +25 +56 +91 +130 +198
24

Transit Schedules IncludedAgency DatesBirmingham Jefferson County Transit Authority February 1, 2017 – December 31, 2018
25
26

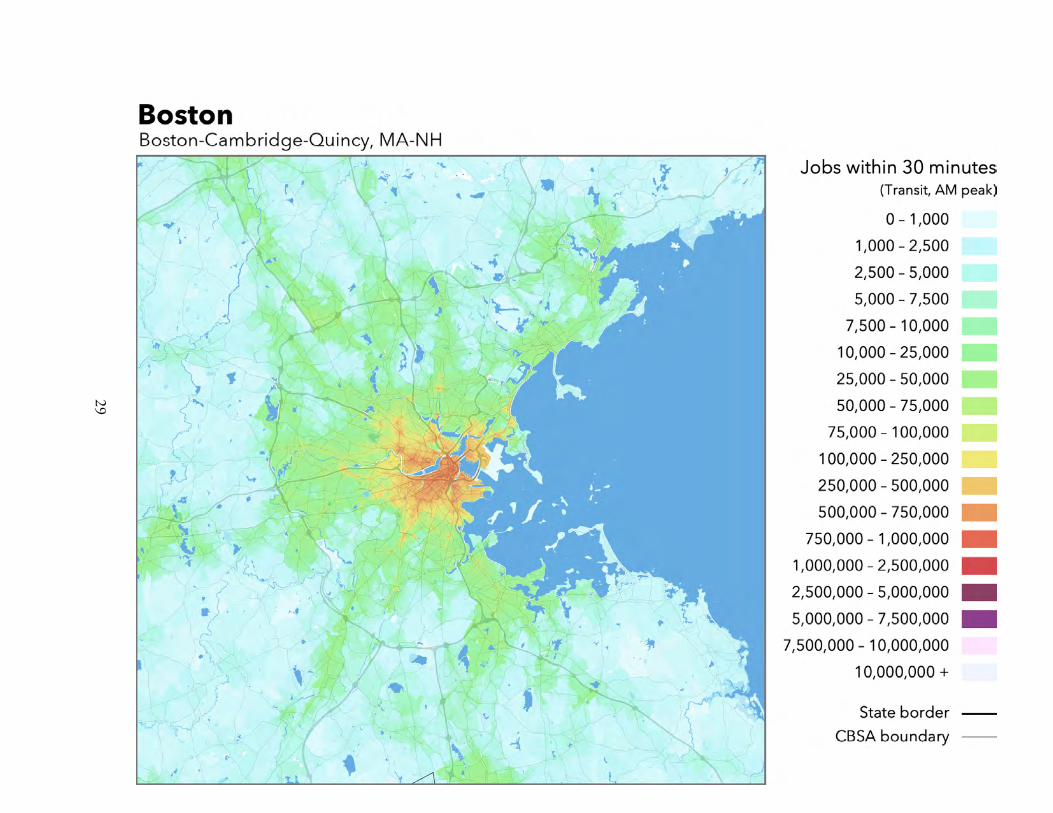
BostonBoston-Cambridge-Quincy, MA-NH
Rank by Weighted Accessibility 5Rank by Total Employment 10Rank by 1-Year Change in Weighted Accessibility 451-Year Change in Weighted Accessibility -3.73%1-Year Change in Weighted Accessibility Rank 0Total Jobs 2,682,278Average Job Density (per km2) 297Total Workers 2,464,508Average Worker Density (per km2) 273Job and worker totals are based on LEHD estimates and may not match other sources.
Job Accessibility by Travel Time Threshold
10 min 20 min 30 min 40 min 50 min 60 min
100,000
200,000
300,000
400,000
1,611 11,98341,396
96,493
176,084
265,702
1-Year Change in Weighted Accessibility by Travel Time Threshold
10 min 20 min 30 min 40 min 50 min 60 min -20,000
-10,000
0
10,000
20,000
+19 -220 -1,946-4,911
-7,734 -9,603
27
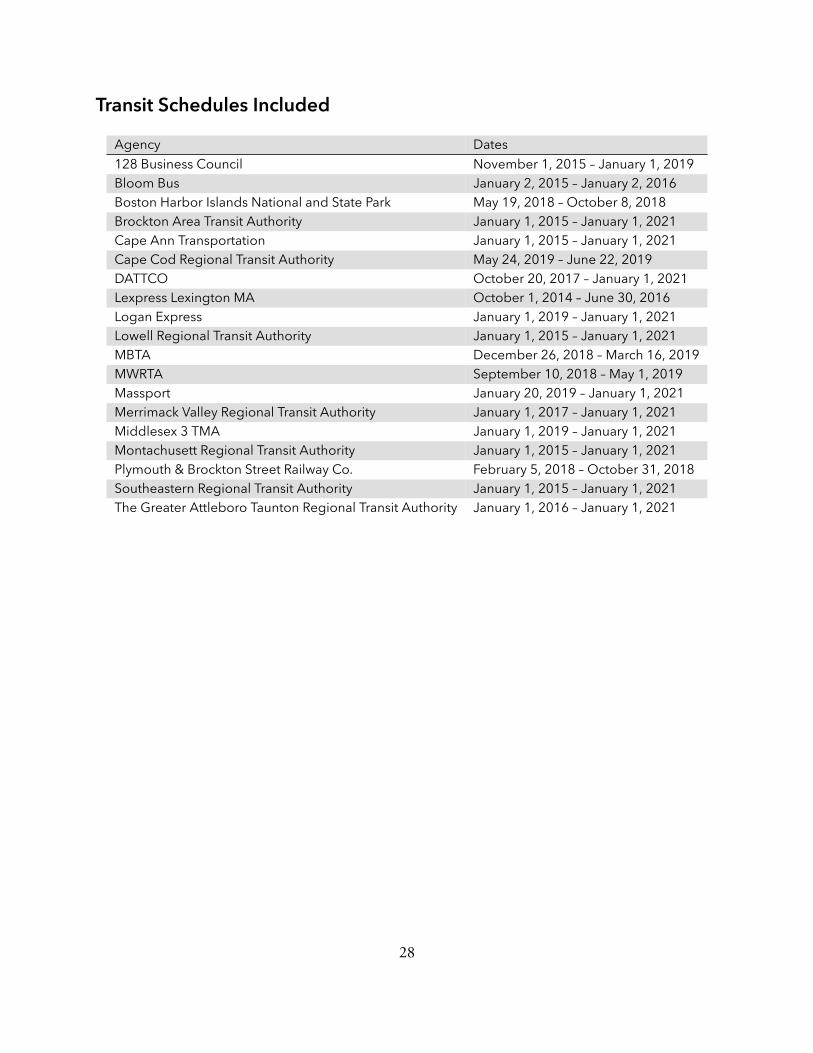
Transit Schedules IncludedAgency Dates128 Business Council November 1, 2015 – January 1, 2019Bloom Bus January 2, 2015 – January 2, 2016Boston Harbor Islands National and State Park May 19, 2018 – October 8, 2018Brockton Area Transit Authority January 1, 2015 – January 1, 2021Cape Ann Transportation January 1, 2015 – January 1, 2021Cape Cod Regional Transit Authority May 24, 2019 – June 22, 2019DATTCO October 20, 2017 – January 1, 2021Lexpress Lexington MA October 1, 2014 – June 30, 2016Logan Express January 1, 2019 – January 1, 2021Lowell Regional Transit Authority January 1, 2015 – January 1, 2021MBTA December 26, 2018 – March 16, 2019MWRTA September 10, 2018 – May 1, 2019Massport January 20, 2019 – January 1, 2021Merrimack Valley Regional Transit Authority January 1, 2017 – January 1, 2021Middlesex 3 TMA January 1, 2019 – January 1, 2021Montachusett Regional Transit Authority January 1, 2015 – January 1, 2021Plymouth & Brockton Street Railway Co. February 5, 2018 – October 31, 2018Southeastern Regional Transit Authority January 1, 2015 – January 1, 2021The Greater Attleboro Taunton Regional Transit Authority January 1, 2016 – January 1, 2021
28
29
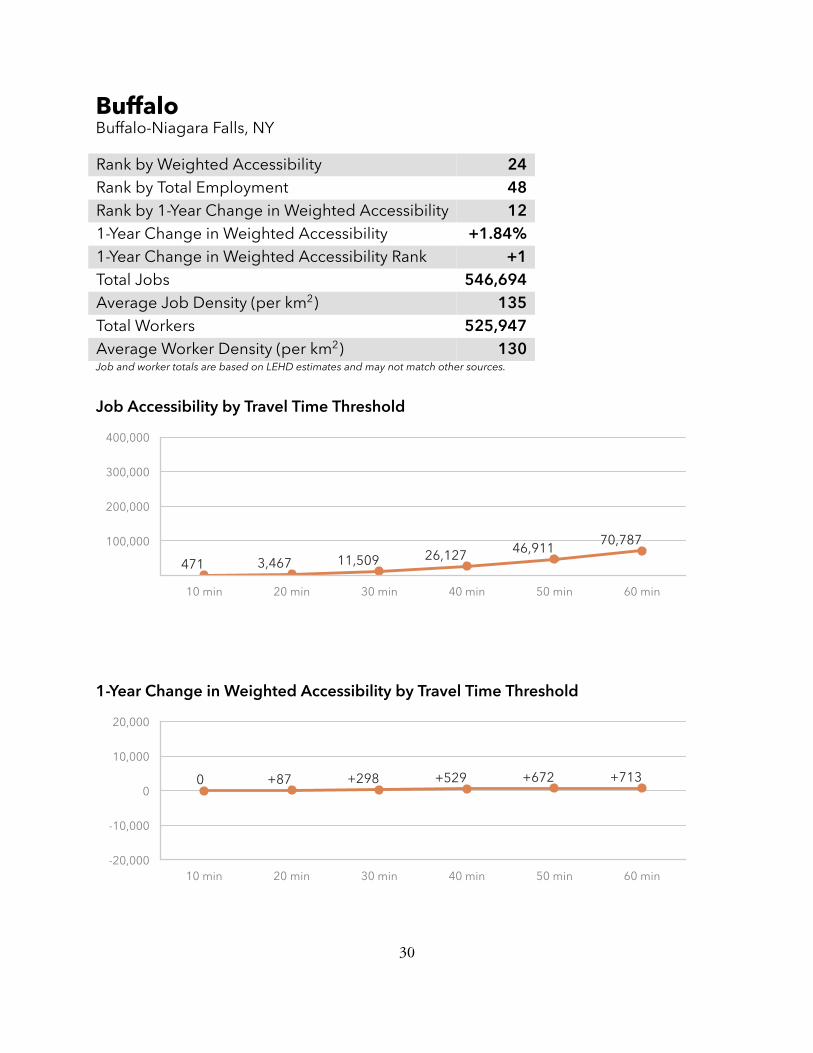
BuffaloBuffalo-Niagara Falls, NY
Rank by Weighted Accessibility 24Rank by Total Employment 48Rank by 1-Year Change in Weighted Accessibility 121-Year Change in Weighted Accessibility +1.84%1-Year Change in Weighted Accessibility Rank +1Total Jobs 546,694Average Job Density (per km2) 135Total Workers 525,947Average Worker Density (per km2) 130Job and worker totals are based on LEHD estimates and may not match other sources.
Job Accessibility by Travel Time Threshold
10 min 20 min 30 min 40 min 50 min 60 min
100,000
200,000
300,000
400,000
471 3,467 11,509 26,127 46,91170,787
1-Year Change in Weighted Accessibility by Travel Time Threshold
10 min 20 min 30 min 40 min 50 min 60 min -20,000
-10,000
0
10,000
20,000
0 +87 +298 +529 +672 +713
30

Transit Schedules IncludedAgency DatesNFTA - Metro November 27, 2018 – March 2, 2019
31

32

CharlotteCharlotte-Gastonia-Rock Hill, NC-SC
Rank by Weighted Accessibility 34Rank by Total Employment 34Rank by 1-Year Change in Weighted Accessibility 401-Year Change in Weighted Accessibility -2.22%1-Year Change in Weighted Accessibility Rank 0Total Jobs 1,037,014Average Job Density (per km2) 130Total Workers 930,190Average Worker Density (per km2) 116Job and worker totals are based on LEHD estimates and may not match other sources.
Job Accessibility by Travel Time Threshold
10 min 20 min 30 min 40 min 50 min 60 min
100,000
200,000
300,000
400,000
413 2,261 7,208 17,447 33,977 56,237
1-Year Change in Weighted Accessibility by Travel Time Threshold
10 min 20 min 30 min 40 min 50 min 60 min -20,000
-10,000
0
10,000
20,000
-3 -130 -392 -562 -299 +843
33

Transit Schedules IncludedAgency DatesCATS July 1, 2019 – October 6, 2019Concord Kannapolis Area Transit January 1, 2016 – January 1, 2021
34
35

ChicagoChicago-Joliet-Naperville, IL-IN-WI
Rank by Weighted Accessibility 3Rank by Total Employment 3Rank by 1-Year Change in Weighted Accessibility 171-Year Change in Weighted Accessibility +1.45%1-Year Change in Weighted Accessibility Rank 0Total Jobs 4,559,884Average Job Density (per km2) 245Total Workers 4,448,938Average Worker Density (per km2) 239Job and worker totals are based on LEHD estimates and may not match other sources.
Job Accessibility by Travel Time Threshold
10 min 20 min 30 min 40 min 50 min 60 min
100,000
200,000
300,000
400,000
1,826 16,13154,870
127,632
231,307
350,985
1-Year Change in Weighted Accessibility by Travel Time Threshold
10 min 20 min 30 min 40 min 50 min 60 min -20,000
-10,000
0
10,000
20,000
+22 +427 +888 +1,806 +2,708 +2,566
36

Transit Schedules IncludedAgency DatesChicago Transit Authority November 6, 2018 – January 31, 2019Metra January 1, 2018 – December 31, 2019Northern Indiana Commuter Transportation District January 1, 2012 – December 31, 2020PACE August 12, 2018 – August 10, 2019
37
38
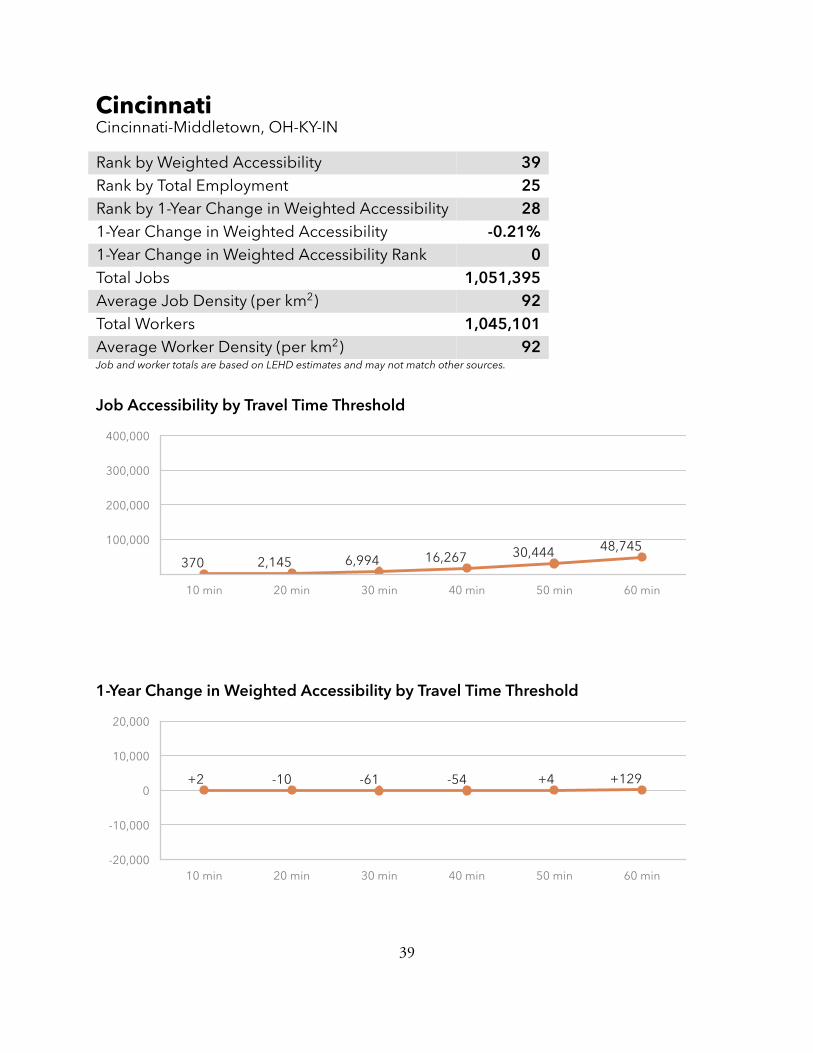
CincinnatiCincinnati-Middletown, OH-KY-IN
Rank by Weighted Accessibility 39Rank by Total Employment 25Rank by 1-Year Change in Weighted Accessibility 281-Year Change in Weighted Accessibility -0.21%1-Year Change in Weighted Accessibility Rank 0Total Jobs 1,051,395Average Job Density (per km2) 92Total Workers 1,045,101Average Worker Density (per km2) 92Job and worker totals are based on LEHD estimates and may not match other sources.
Job Accessibility by Travel Time Threshold
10 min 20 min 30 min 40 min 50 min 60 min
100,000
200,000
300,000
400,000
370 2,145 6,994 16,267 30,444 48,745
1-Year Change in Weighted Accessibility by Travel Time Threshold
10 min 20 min 30 min 40 min 50 min 60 min -20,000
-10,000
0
10,000
20,000
+2 -10 -61 -54 +4 +129
39

Transit Schedules IncludedAgency DatesSouthwest Ohio Regional Transit Authority December 2, 2018 – March 2, 2019Transit Authority of Northern Kentucky August 4, 2018 – November 2, 2019
40

41

ClevelandCleveland-Elyria-Mentor, OH
Rank by Weighted Accessibility 29Rank by Total Employment 30Rank by 1-Year Change in Weighted Accessibility 481-Year Change in Weighted Accessibility -5.15%1-Year Change in Weighted Accessibility Rank 0Total Jobs 1,023,177Average Job Density (per km2) 198Total Workers 961,969Average Worker Density (per km2) 186Job and worker totals are based on LEHD estimates and may not match other sources.
Job Accessibility by Travel Time Threshold
10 min 20 min 30 min 40 min 50 min 60 min
100,000
200,000
300,000
400,000
424 2,437 8,338 21,536 43,09172,598
1-Year Change in Weighted Accessibility by Travel Time Threshold
10 min 20 min 30 min 40 min 50 min 60 min -20,000
-10,000
0
10,000
20,000
-17 -118 -582 -1,322 -2,256 -3,225
42

Transit Schedules IncludedAgency DatesCuyahoga Valley Scenic Railroad April 1, 2018 – October 28, 2018Greater Cleveland Regional Transit Authority December 2, 2018 – March 9, 2019Laketran January 1, 2016 – January 1, 2021METRO July 11, 2019 – July 10, 2020
43
44
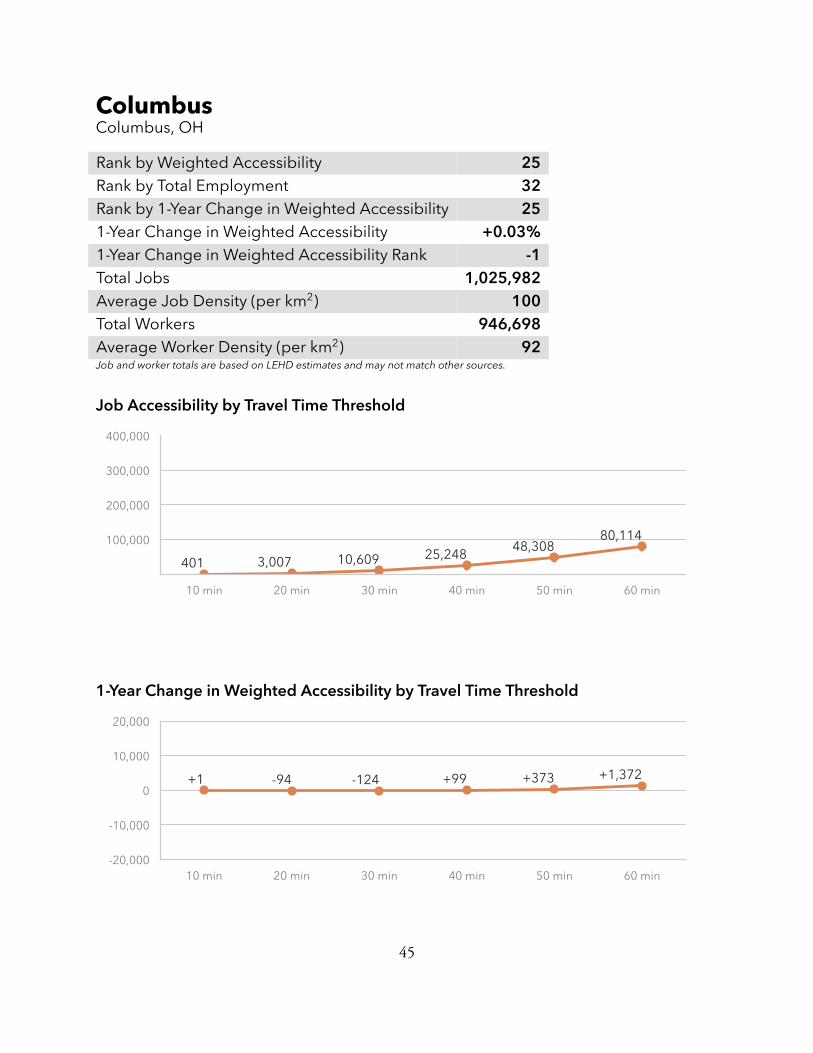
ColumbusColumbus, OH
Rank by Weighted Accessibility 25Rank by Total Employment 32Rank by 1-Year Change in Weighted Accessibility 251-Year Change in Weighted Accessibility +0.03%1-Year Change in Weighted Accessibility Rank -1Total Jobs 1,025,982Average Job Density (per km2) 100Total Workers 946,698Average Worker Density (per km2) 92Job and worker totals are based on LEHD estimates and may not match other sources.
Job Accessibility by Travel Time Threshold
10 min 20 min 30 min 40 min 50 min 60 min
100,000
200,000
300,000
400,000
401 3,007 10,609 25,24848,308
80,114
1-Year Change in Weighted Accessibility by Travel Time Threshold
10 min 20 min 30 min 40 min 50 min 60 min -20,000
-10,000
0
10,000
20,000
+1 -94 -124 +99 +373 +1,372
45

Transit Schedules IncludedAgency DatesCentral Ohio Transit Authority May 6, 2019 – September 1, 2019Delaware Area Transit Agency June 28, 2019 – July 1, 2020Delaware County Transit June 28, 2019 – July 1, 2020
46

47

DallasDallas-Fort Worth-Arlington, TX
Rank by Weighted Accessibility 20Rank by Total Employment 4Rank by 1-Year Change in Weighted Accessibility 231-Year Change in Weighted Accessibility +0.54%1-Year Change in Weighted Accessibility Rank -1Total Jobs 3,546,551Average Job Density (per km2) 153Total Workers 3,366,285Average Worker Density (per km2) 146Job and worker totals are based on LEHD estimates and may not match other sources.
Job Accessibility by Travel Time Threshold
10 min 20 min 30 min 40 min 50 min 60 min
100,000
200,000
300,000
400,000
497 3,242 11,091 28,04658,197
104,166
1-Year Change in Weighted Accessibility by Travel Time Threshold
10 min 20 min 30 min 40 min 50 min 60 min -20,000
-10,000
0
10,000
20,000
+13 +31 +90 +131 +85 +215
48

Transit Schedules IncludedAgency DatesDALLAS AREA RAPID TRANSIT August 27, 2018 – March 24, 2019Denton County Transportation Authority August 26, 2018 – January 1, 2020Grapevine Visitors Shuttle May 5, 2019 – September 21, 2019STAR Transit January 1, 2016 – December 31, 2020Trinity Metro December 30, 2018 – April 20, 2019
49

50
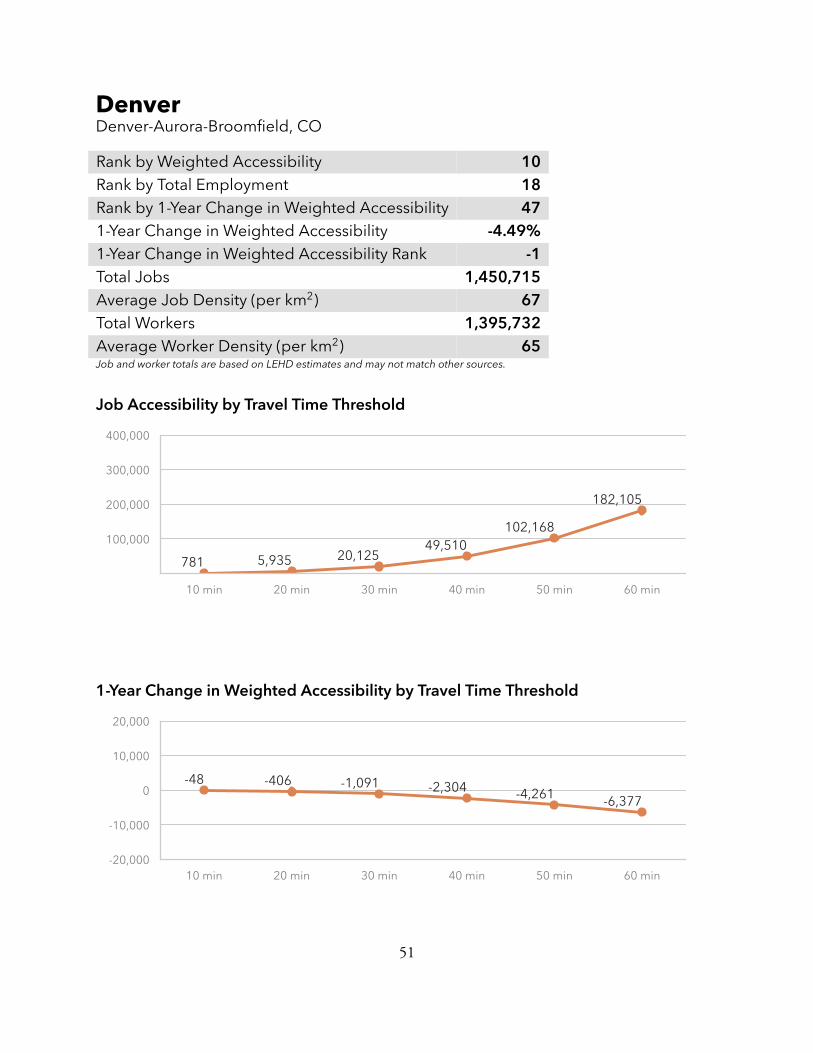
DenverDenver-Aurora-Broomfield, CO
Rank by Weighted Accessibility 10Rank by Total Employment 18Rank by 1-Year Change in Weighted Accessibility 471-Year Change in Weighted Accessibility -4.49%1-Year Change in Weighted Accessibility Rank -1Total Jobs 1,450,715Average Job Density (per km2) 67Total Workers 1,395,732Average Worker Density (per km2) 65Job and worker totals are based on LEHD estimates and may not match other sources.
Job Accessibility by Travel Time Threshold
10 min 20 min 30 min 40 min 50 min 60 min
100,000
200,000
300,000
400,000
781 5,935 20,12549,510
102,168
182,105
1-Year Change in Weighted Accessibility by Travel Time Threshold
10 min 20 min 30 min 40 min 50 min 60 min -20,000
-10,000
0
10,000
20,000
-48 -406 -1,091 -2,304 -4,261 -6,377
51

Transit Schedules IncludedAgency DatesBustang August 15, 2018 – January 1, 2020Regional Transportation District January 13, 2019 – May 18, 2019
52

53

DetroitDetroit-Warren-Livonia, MI
Rank by Weighted Accessibility 38Rank by Total Employment 13Rank by 1-Year Change in Weighted Accessibility 361-Year Change in Weighted Accessibility -1.56%1-Year Change in Weighted Accessibility Rank -1Total Jobs 1,934,459Average Job Density (per km2) 192Total Workers 1,915,549Average Worker Density (per km2) 190Job and worker totals are based on LEHD estimates and may not match other sources.
Job Accessibility by Travel Time Threshold
10 min 20 min 30 min 40 min 50 min 60 min
100,000
200,000
300,000
400,000
287 1,841 6,284 16,213 34,87364,528
1-Year Change in Weighted Accessibility by Travel Time Threshold
10 min 20 min 30 min 40 min 50 min 60 min -20,000
-10,000
0
10,000
20,000
-15 -42 -94 -207 -470 -800
54

Transit Schedules IncludedAgency DatesAnn Arbor Area Transportation Authority August 27, 2017 – January 27, 2018Detroit Department of Transportation August 31, 2017 – February 26, 2018SMART January 2, 2017 – April 2, 2017
55

56

HartfordHartford-West Hartford-East Hartford, CT
Rank by Weighted Accessibility 27Rank by Total Employment 45Rank by 1-Year Change in Weighted Accessibility 371-Year Change in Weighted Accessibility -1.61%1-Year Change in Weighted Accessibility Rank -1Total Jobs 637,565Average Job Density (per km2) 163Total Workers 595,341Average Worker Density (per km2) 152Job and worker totals are based on LEHD estimates and may not match other sources.
Job Accessibility by Travel Time Threshold
10 min 20 min 30 min 40 min 50 min 60 min
100,000
200,000
300,000
400,000
464 3,423 11,239 23,992 42,08965,129
1-Year Change in Weighted Accessibility by Travel Time Threshold
10 min 20 min 30 min 40 min 50 min 60 min -20,000
-10,000
0
10,000
20,000
-13 -93 -240 -350 -463 -449
57

Transit Schedules IncludedAgency Dates9 Town Transit September 1, 2016 – December 31, 2020CTTransit - New Britain June 24, 2018 – July 30, 2020CTTransit - Waterbury-Meriden February 19, 2018 – May 25, 2019CTTransit- Hartford December 2, 2018 – May 25, 2019PVTA January 2, 2019 – September 2, 2019Shore Line East October 29, 2018 – October 28, 2019
58

59
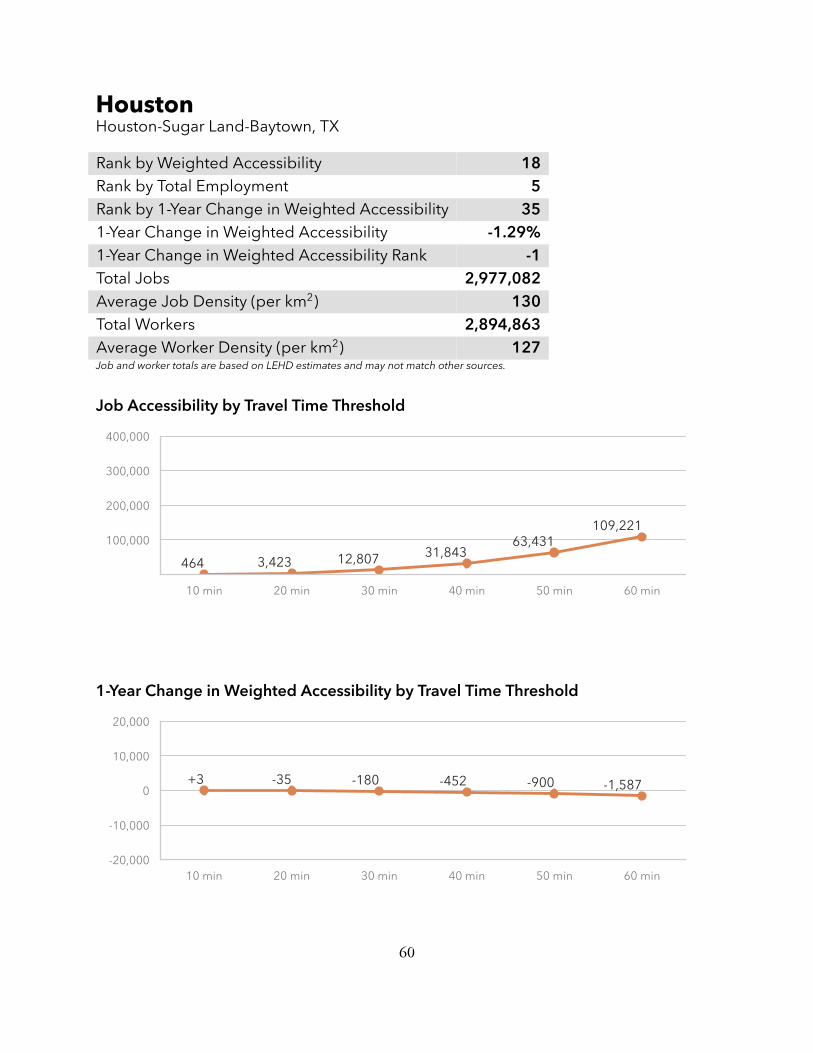
HoustonHouston-Sugar Land-Baytown, TX
Rank by Weighted Accessibility 18Rank by Total Employment 5Rank by 1-Year Change in Weighted Accessibility 351-Year Change in Weighted Accessibility -1.29%1-Year Change in Weighted Accessibility Rank -1Total Jobs 2,977,082Average Job Density (per km2) 130Total Workers 2,894,863Average Worker Density (per km2) 127Job and worker totals are based on LEHD estimates and may not match other sources.
Job Accessibility by Travel Time Threshold
10 min 20 min 30 min 40 min 50 min 60 min
100,000
200,000
300,000
400,000
464 3,423 12,807 31,84363,431
109,221
1-Year Change in Weighted Accessibility by Travel Time Threshold
10 min 20 min 30 min 40 min 50 min 60 min -20,000
-10,000
0
10,000
20,000
+3 -35 -180 -452 -900 -1,587
60

Transit Schedules IncludedAgency DatesMetropolitan Transit Authority of Harris County August 26, 2018 – February 23, 2019
61

62
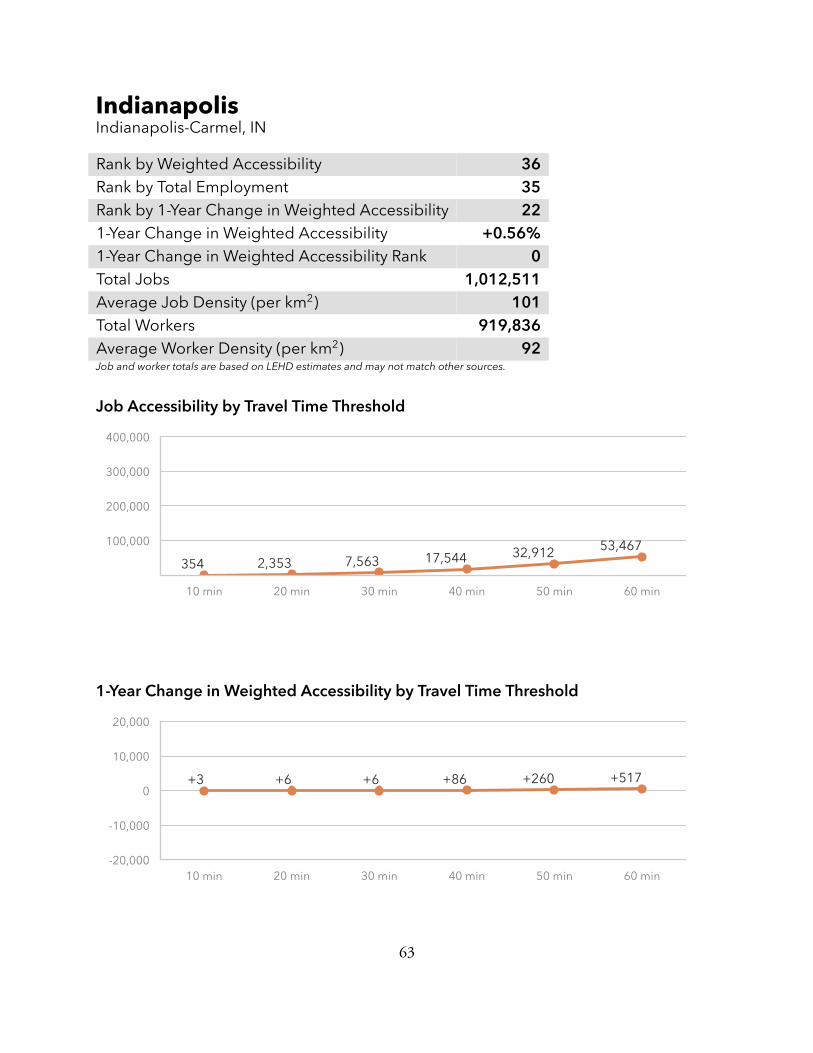
IndianapolisIndianapolis-Carmel, IN
Rank by Weighted Accessibility 36Rank by Total Employment 35Rank by 1-Year Change in Weighted Accessibility 221-Year Change in Weighted Accessibility +0.56%1-Year Change in Weighted Accessibility Rank 0Total Jobs 1,012,511Average Job Density (per km2) 101Total Workers 919,836Average Worker Density (per km2) 92Job and worker totals are based on LEHD estimates and may not match other sources.
Job Accessibility by Travel Time Threshold
10 min 20 min 30 min 40 min 50 min 60 min
100,000
200,000
300,000
400,000
354 2,353 7,563 17,544 32,912 53,467
1-Year Change in Weighted Accessibility by Travel Time Threshold
10 min 20 min 30 min 40 min 50 min 60 min -20,000
-10,000
0
10,000
20,000
+3 +6 +6 +86 +260 +517
63

Transit Schedules IncludedAgency DatesCentral Indiana Regional Transportation Authority July 18, 2014 – December 31, 2019IndyGo August 12, 2018 – February 9, 2019
64
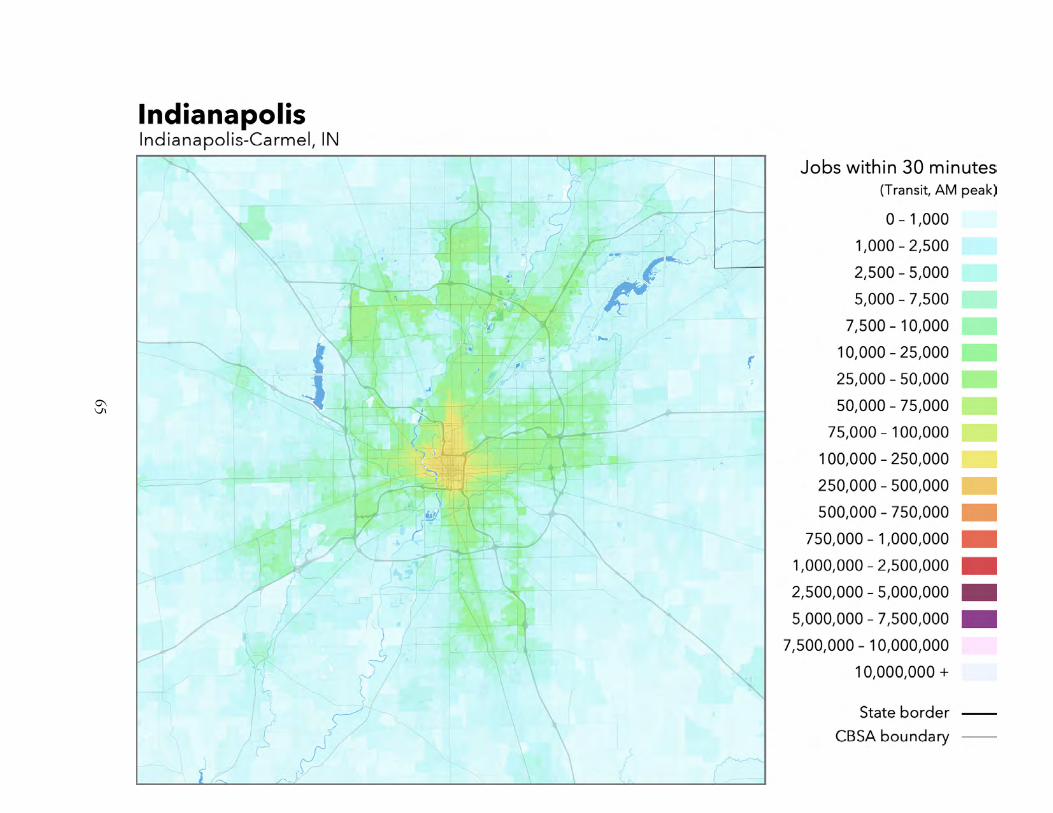
65

JacksonvilleJacksonville, FL
Rank by Weighted Accessibility 49Rank by Total Employment 40Rank by 1-Year Change in Weighted Accessibility 61-Year Change in Weighted Accessibility +3.88%1-Year Change in Weighted Accessibility Rank 0Total Jobs 694,925Average Job Density (per km2) 84Total Workers 662,664Average Worker Density (per km2) 80Job and worker totals are based on LEHD estimates and may not match other sources.
Job Accessibility by Travel Time Threshold
10 min 20 min 30 min 40 min 50 min 60 min
100,000
200,000
300,000
400,000
295 1,282 3,959 9,821 20,111 34,832
1-Year Change in Weighted Accessibility by Travel Time Threshold
10 min 20 min 30 min 40 min 50 min 60 min -20,000
-10,000
0
10,000
20,000
+13 +31 +108 +364 +881 +1,565
66

Transit Schedules IncludedAgency DatesJacksonville Transportation Authority December 3, 2018 – August 4, 2019Sunshine Bus Company July 1, 2015 – January 1, 2021
67
68

Kansas CityKansas City, MO-KS
Rank by Weighted Accessibility 40Rank by Total Employment 26Rank by 1-Year Change in Weighted Accessibility 111-Year Change in Weighted Accessibility +2.28%1-Year Change in Weighted Accessibility Rank 0Total Jobs 1,059,744Average Job Density (per km2) 52Total Workers 1,036,878Average Worker Density (per km2) 51Job and worker totals are based on LEHD estimates and may not match other sources.
Job Accessibility by Travel Time Threshold
10 min 20 min 30 min 40 min 50 min 60 min
100,000
200,000
300,000
400,000
360 2,111 6,929 16,108 29,882 48,252
1-Year Change in Weighted Accessibility by Travel Time Threshold
10 min 20 min 30 min 40 min 50 min 60 min -20,000
-10,000
0
10,000
20,000
+13 +35 +115 +331 +728 +1,328
69

Transit Schedules IncludedAgency DatesKCATA January 6, 2019 – March 30, 2019The JO January 1, 2013 – May 31, 2019
70

71

Las VegasLas Vegas-Paradise, NV
Rank by Weighted Accessibility 21Rank by Total Employment 33Rank by 1-Year Change in Weighted Accessibility 41-Year Change in Weighted Accessibility +3.97%1-Year Change in Weighted Accessibility Rank +1Total Jobs 956,530Average Job Density (per km2) 47Total Workers 941,812Average Worker Density (per km2) 46Job and worker totals are based on LEHD estimates and may not match other sources.
Job Accessibility by Travel Time Threshold
10 min 20 min 30 min 40 min 50 min 60 min
100,000
200,000
300,000
400,000
313 2,287 9,271 27,00262,968
120,689
1-Year Change in Weighted Accessibility by Travel Time Threshold
10 min 20 min 30 min 40 min 50 min 60 min -20,000
-10,000
0
10,000
20,000
+13 +77 +331 +1,024 +2,503 +4,762
72

Transit Schedules IncludedAgency DatesRegional Transportation Commission of Southern Nevada March 10, 2019 – March 7, 2020
73
74

Los AngelesLos Angeles-Long Beach-Santa Ana, CA
Rank by Weighted Accessibility 4Rank by Total Employment 2Rank by 1-Year Change in Weighted Accessibility 31-Year Change in Weighted Accessibility +5.96%1-Year Change in Weighted Accessibility Rank 0Total Jobs 6,249,699Average Job Density (per km2) 498Total Workers 5,825,012Average Worker Density (per km2) 464Job and worker totals are based on LEHD estimates and may not match other sources.
Job Accessibility by Travel Time Threshold
10 min 20 min 30 min 40 min 50 min 60 min
100,000
200,000
300,000
400,000
1,290 10,74641,077
104,511
213,289
374,836
1-Year Change in Weighted Accessibility by Travel Time Threshold
10 min 20 min 30 min 40 min 50 min 60 min -40,000
-20,000
0
20,000
40,000
+28 +347 +1,885 +6,397+14,111
+24,512
75

Transit Schedules IncludedAgency DatesAnaheim Resort Transportation October 18, 2018 – January 1, 2020Avalon Transit April 2, 2019 – September 15, 2019Big Blue Bus September 16, 2018 – March 16, 2019Burbank Bus April 30, 2018 – June 15, 2020Culver CityBus September 17, 2018 – January 6, 2019Duarte Transit January 1, 2016 – January 1, 2020Eastern Sierra Transit Authority January 2, 2015 – May 27, 2030El Monte Transit July 25, 2017 – January 1, 2021Foothill Transit July 3, 2018 – February 2, 2019Glendale Beeline July 6, 2018 – July 1, 2020Kern Transit January 1, 2017 – January 1, 2020LADOT May 1, 2018 – December 25, 2019Laguna Beach Transit January 1, 2013 – January 1, 2021Long Beach Transit August 26, 2018 – February 9, 2019Metro - Los Angeles - Bus January 26, 2019 – June 22, 2019Metro - Los Angeles - Rail January 31, 2019 – February 14, 2019Metrolink Trains September 1, 2017 – December 31, 2017Norwalk Transit System May 13, 2018 – January 1, 2021OMNITRANS January 7, 2019 – September 1, 2019Orange County Transportation Authority June 10, 2018 – February 10, 2019Palos Verdes Peninsula Transit Authority January 2, 2015 – January 1, 2021Pasadena Transit March 10, 2019 – December 31, 2020Riverside Transit Agency January 13, 2019 – May 11, 2019Simi Valley Transit October 1, 2017 – January 1, 2021Spirit Bus January 1, 2016 – January 1, 2019TORRANCE TRANSIT SYSTEM January 6, 2019 – April 13, 2019Thousand Oaks Transit January 1, 2016 – January 1, 2021Ventura County Transportation Commission January 14, 2019 – May 10, 2019
76
77

LouisvilleLouisville/Jefferson County, KY-IN
Rank by Weighted Accessibility 37Rank by Total Employment 41Rank by 1-Year Change in Weighted Accessibility 341-Year Change in Weighted Accessibility -1.22%1-Year Change in Weighted Accessibility Rank +1Total Jobs 668,246Average Job Density (per km2) 63Total Workers 645,505Average Worker Density (per km2) 61Job and worker totals are based on LEHD estimates and may not match other sources.
Job Accessibility by Travel Time Threshold
10 min 20 min 30 min 40 min 50 min 60 min
100,000
200,000
300,000
400,000
325 2,148 7,178 17,454 33,000 52,852
1-Year Change in Weighted Accessibility by Travel Time Threshold
10 min 20 min 30 min 40 min 50 min 60 min -20,000
-10,000
0
10,000
20,000
+3 -17 -111 -296 -442 -589
78

Transit Schedules IncludedAgency DatesTransit Authority of River City June 9, 2019 – August 10, 2019
79

80

MemphisMemphis, TN-MS-AR
Rank by Weighted Accessibility 46Rank by Total Employment 46Rank by 1-Year Change in Weighted Accessibility 491-Year Change in Weighted Accessibility -7.66%1-Year Change in Weighted Accessibility Rank -2Total Jobs 615,157Average Job Density (per km2) 52Total Workers 589,984Average Worker Density (per km2) 50Job and worker totals are based on LEHD estimates and may not match other sources.
Job Accessibility by Travel Time Threshold
10 min 20 min 30 min 40 min 50 min 60 min
100,000
200,000
300,000
400,000
243 1,414 4,650 10,950 21,007 35,194
1-Year Change in Weighted Accessibility by Travel Time Threshold
10 min 20 min 30 min 40 min 50 min 60 min -20,000
-10,000
0
10,000
20,000
-19 -66 -373 -1,069 -1,993 -2,983
81

Transit Schedules IncludedAgency DatesMemphis Area Transit Authority December 9, 2018 – June 8, 2019
82

83
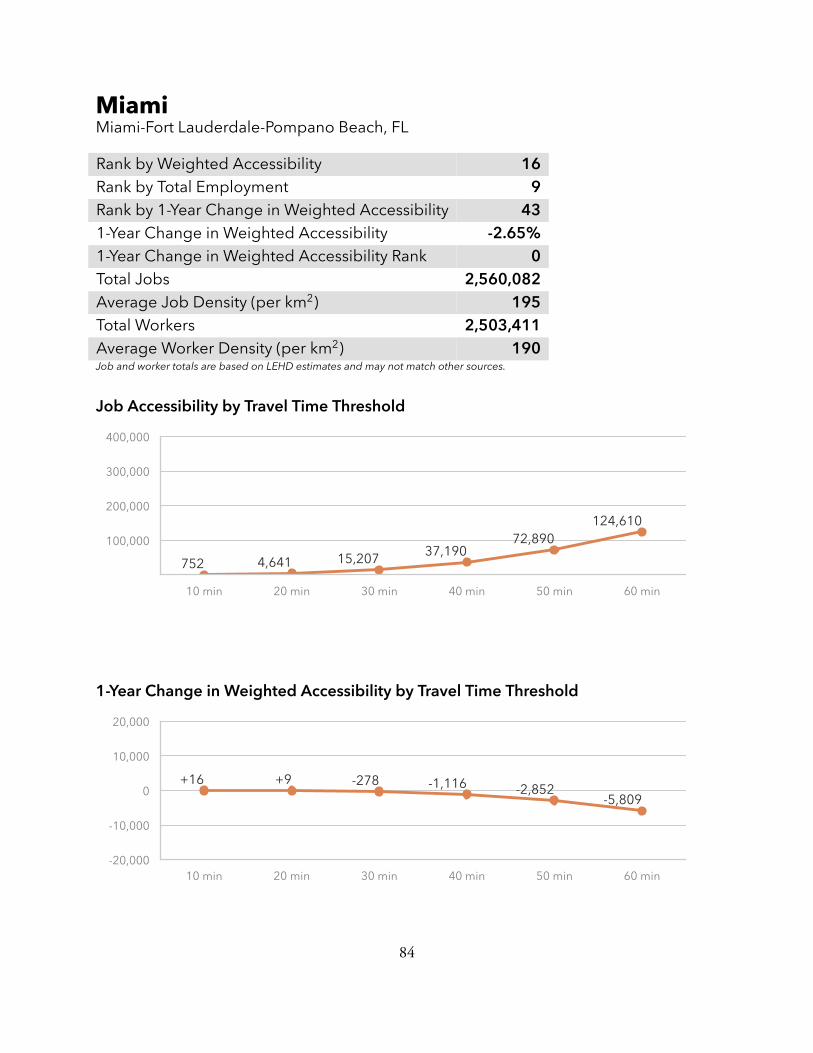
MiamiMiami-Fort Lauderdale-Pompano Beach, FL
Rank by Weighted Accessibility 16Rank by Total Employment 9Rank by 1-Year Change in Weighted Accessibility 431-Year Change in Weighted Accessibility -2.65%1-Year Change in Weighted Accessibility Rank 0Total Jobs 2,560,082Average Job Density (per km2) 195Total Workers 2,503,411Average Worker Density (per km2) 190Job and worker totals are based on LEHD estimates and may not match other sources.
Job Accessibility by Travel Time Threshold
10 min 20 min 30 min 40 min 50 min 60 min
100,000
200,000
300,000
400,000
752 4,641 15,207 37,19072,890
124,610
1-Year Change in Weighted Accessibility by Travel Time Threshold
10 min 20 min 30 min 40 min 50 min 60 min -20,000
-10,000
0
10,000
20,000
+16 +9 -278 -1,116 -2,852-5,809
84

Transit Schedules IncludedAgency DatesBroward County Transit January 14, 2018 – September 8, 2018Miami-Dade Transit March 11, 2018 – July 28, 2018Palm Tran January 24, 2019 – January 24, 2020SFRTA/Tri-Rail April 20, 2012 – December 31, 2024
85

86
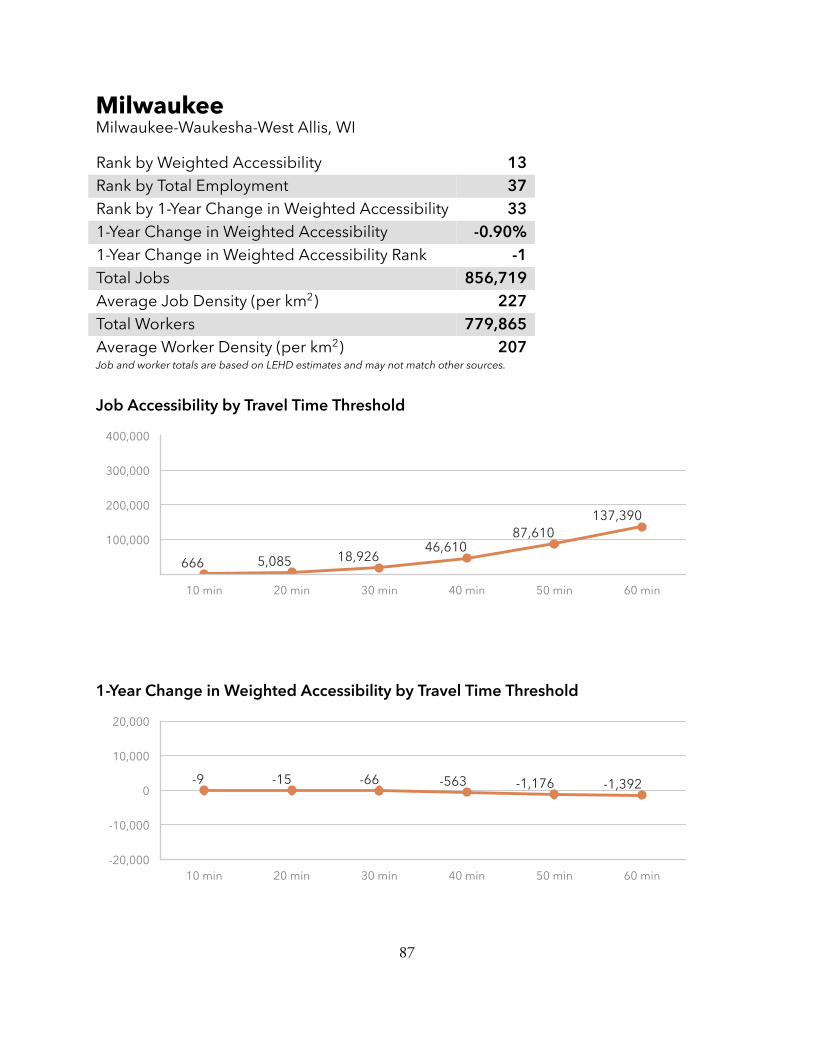
MilwaukeeMilwaukee-Waukesha-West Allis, WI
Rank by Weighted Accessibility 13Rank by Total Employment 37Rank by 1-Year Change in Weighted Accessibility 331-Year Change in Weighted Accessibility -0.90%1-Year Change in Weighted Accessibility Rank -1Total Jobs 856,719Average Job Density (per km2) 227Total Workers 779,865Average Worker Density (per km2) 207Job and worker totals are based on LEHD estimates and may not match other sources.
Job Accessibility by Travel Time Threshold
10 min 20 min 30 min 40 min 50 min 60 min
100,000
200,000
300,000
400,000
666 5,085 18,92646,610
87,610137,390
1-Year Change in Weighted Accessibility by Travel Time Threshold
10 min 20 min 30 min 40 min 50 min 60 min -20,000
-10,000
0
10,000
20,000
-9 -15 -66 -563 -1,176 -1,392
87

Transit Schedules IncludedAgency DatesMilwaukee County Transit System December 30, 2018 – March 3, 2019Waukesha County Transit January 1, 2017 – December 31, 2021
88
89

MinneapolisMinneapolis-St. Paul-Bloomington, MN-WI
Rank by Weighted Accessibility 12Rank by Total Employment 14Rank by 1-Year Change in Weighted Accessibility 181-Year Change in Weighted Accessibility +1.23%1-Year Change in Weighted Accessibility Rank +1Total Jobs 1,901,603Average Job Density (per km2) 122Total Workers 1,847,804Average Worker Density (per km2) 118Job and worker totals are based on LEHD estimates and may not match other sources.
Job Accessibility by Travel Time Threshold
10 min 20 min 30 min 40 min 50 min 60 min
100,000
200,000
300,000
400,000
574 4,708 18,44846,667
90,598147,048
1-Year Change in Weighted Accessibility by Travel Time Threshold
10 min 20 min 30 min 40 min 50 min 60 min -20,000
-10,000
0
10,000
20,000
+32 +178 +414 +272 +203 +181
90

Transit Schedules IncludedAgency DatesAirport (MAC) December 29, 2018 – March 8, 2019MVTA December 3, 2018 – February 15, 2019Maple Grove December 3, 2018 – March 8, 2019Metro November 2, 2018 – February 15, 2019Metro Bus July 1, 2019 – September 7, 2019Metro Red Line May 10, 2018 – June 29, 2018Metro Transit December 29, 2018 – March 8, 2019Mystic November 2, 2018 – February 15, 2019Northstar Link December 1, 2018 – March 8, 2019Plymouth October 29, 2018 – March 8, 2019SouthWest Transit October 29, 2018 – March 8, 2019University of Minnesota October 27, 2018 – March 8, 2019
91

92

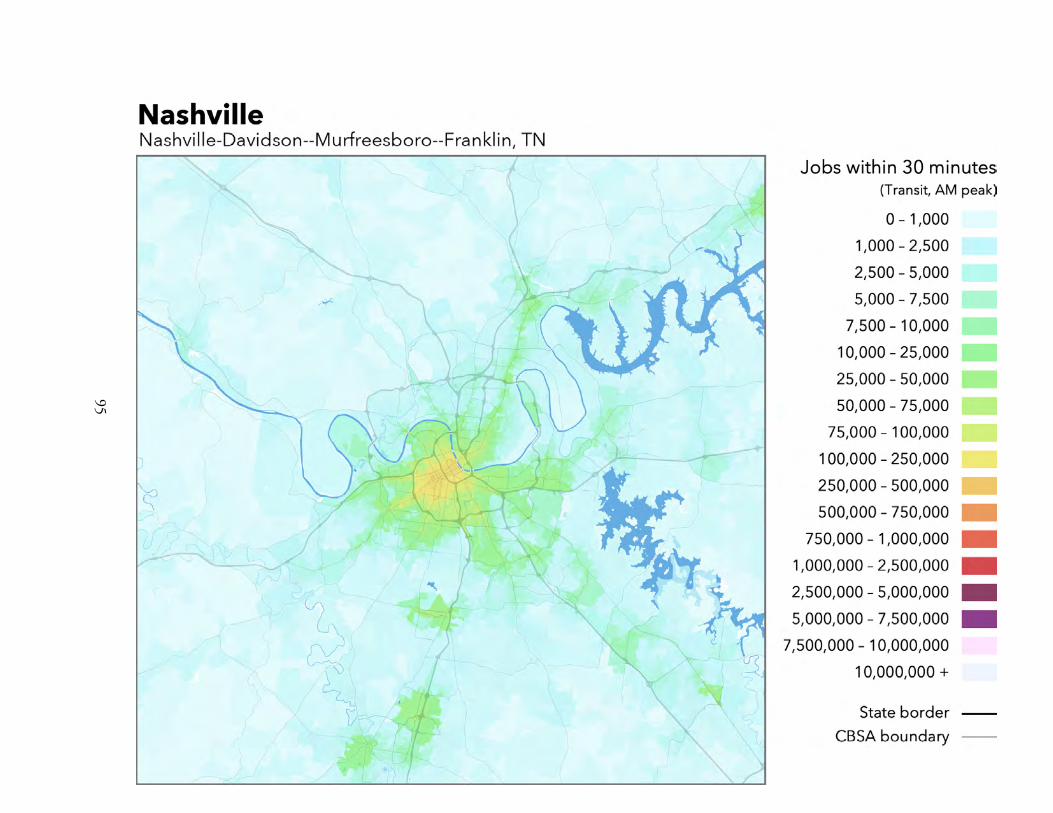
NashvilleNashville-Davidson–Murfreesboro–Franklin, TN
Rank by Weighted Accessibility 44Rank by Total Employment 36Rank by 1-Year Change in Weighted Accessibility 421-Year Change in Weighted Accessibility -2.56%1-Year Change in Weighted Accessibility Rank -1Total Jobs 922,352Average Job Density (per km2) 63Total Workers 843,428Average Worker Density (per km2) 57Job and worker totals are based on LEHD estimates and may not match other sources.
Job Accessibility by Travel Time Threshold
10 min 20 min 30 min 40 min 50 min 60 min
100,000
200,000
300,000
400,000
296 1,603 5,393 12,475 22,461 35,289
1-Year Change in Weighted Accessibility by Travel Time Threshold
10 min 20 min 30 min 40 min 50 min 60 min -20,000
-10,000
0
10,000
20,000
-3 -58 -200 -307 -455 -728
93

Transit Schedules IncludedAgency DatesMetropolitan Transit Authority August 12, 2018 – April 6, 2019Regional Transportation Authority of Middle Tennessee April 7, 2019 – October 5, 2019
94
95
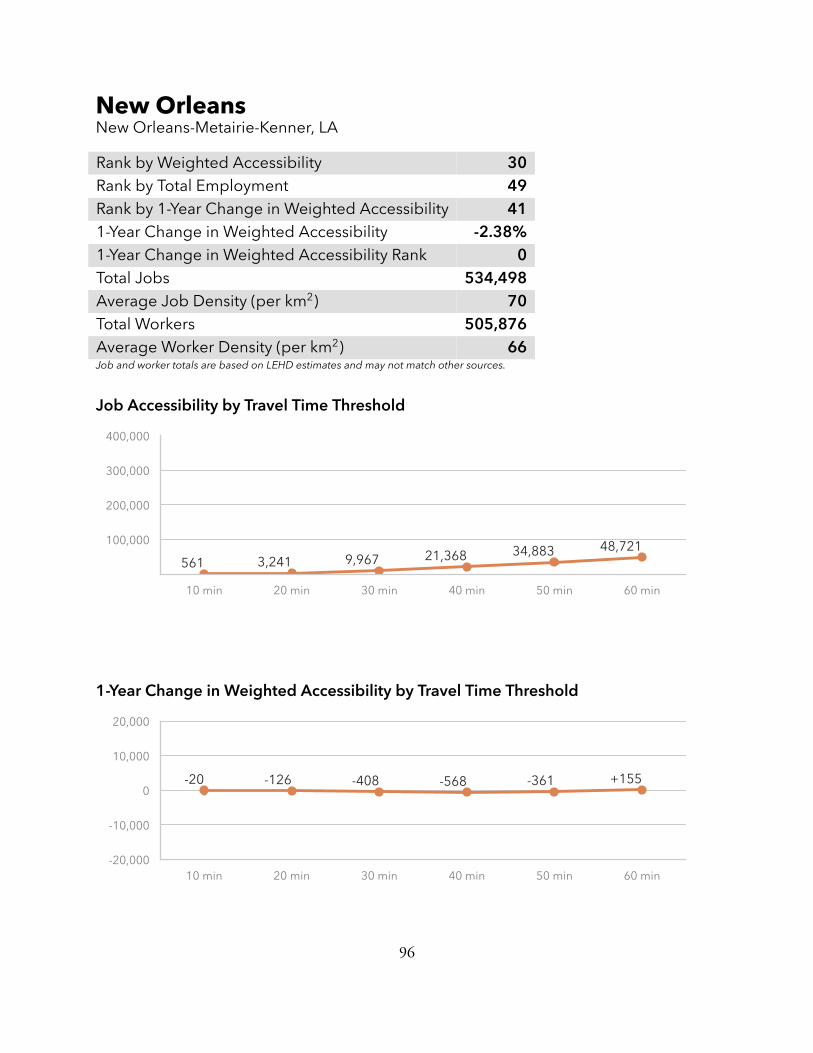
New OrleansNew Orleans-Metairie-Kenner, LA
Rank by Weighted Accessibility 30Rank by Total Employment 49Rank by 1-Year Change in Weighted Accessibility 411-Year Change in Weighted Accessibility -2.38%1-Year Change in Weighted Accessibility Rank 0Total Jobs 534,498Average Job Density (per km2) 70Total Workers 505,876Average Worker Density (per km2) 66Job and worker totals are based on LEHD estimates and may not match other sources.
Job Accessibility by Travel Time Threshold
10 min 20 min 30 min 40 min 50 min 60 min
100,000
200,000
300,000
400,000
561 3,241 9,967 21,368 34,883 48,721
1-Year Change in Weighted Accessibility by Travel Time Threshold
10 min 20 min 30 min 40 min 50 min 60 min -20,000
-10,000
0
10,000
20,000
-20 -126 -408 -568 -361 +155
96

Transit Schedules IncludedAgency DatesNew Orleans RTA January 6, 2019 – December 31, 2019
97

98

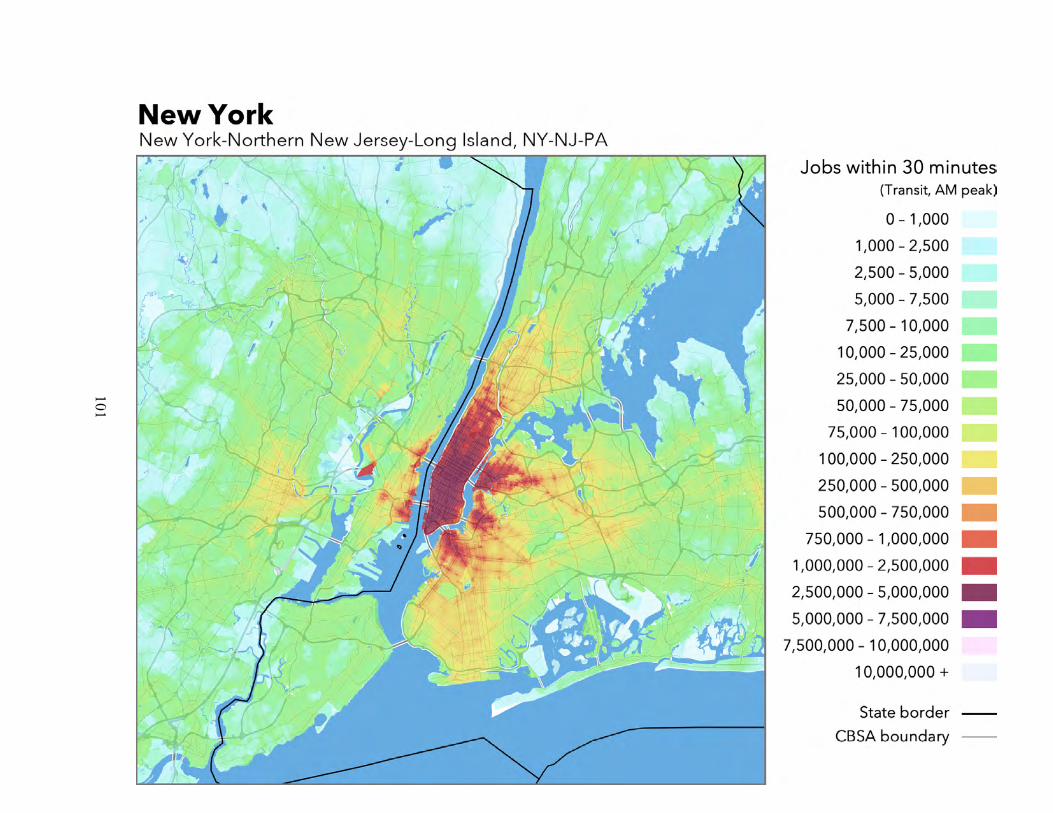
New YorkNew York-Northern New Jersey-Long Island, NY-NJ-PA
Rank by Weighted Accessibility 1Rank by Total Employment 1Rank by 1-Year Change in Weighted Accessibility 291-Year Change in Weighted Accessibility -0.49%1-Year Change in Weighted Accessibility Rank 0Total Jobs 9,159,786Average Job Density (per km2) 529Total Workers 8,946,175Average Worker Density (per km2) 517Job and worker totals are based on LEHD estimates and may not match other sources.
Job Accessibility by Travel Time Threshold
10 min 20 min 30 min 40 min 50 min 60 min
500,000
1,000,000
1,500,000
6,249 61,679213,413
478,211
858,227
1,320,519
The plot scales have been changed to accommodate themuch larger number of jobswithin New York City.
1-Year Change in Weighted Accessibility by Travel Time Threshold
10 min 20 min 30 min 40 min 50 min 60 min -20,000
-10,000
0
10,000
20,000
+97 -1,238 -1,999 -868 -1,150 +394
99
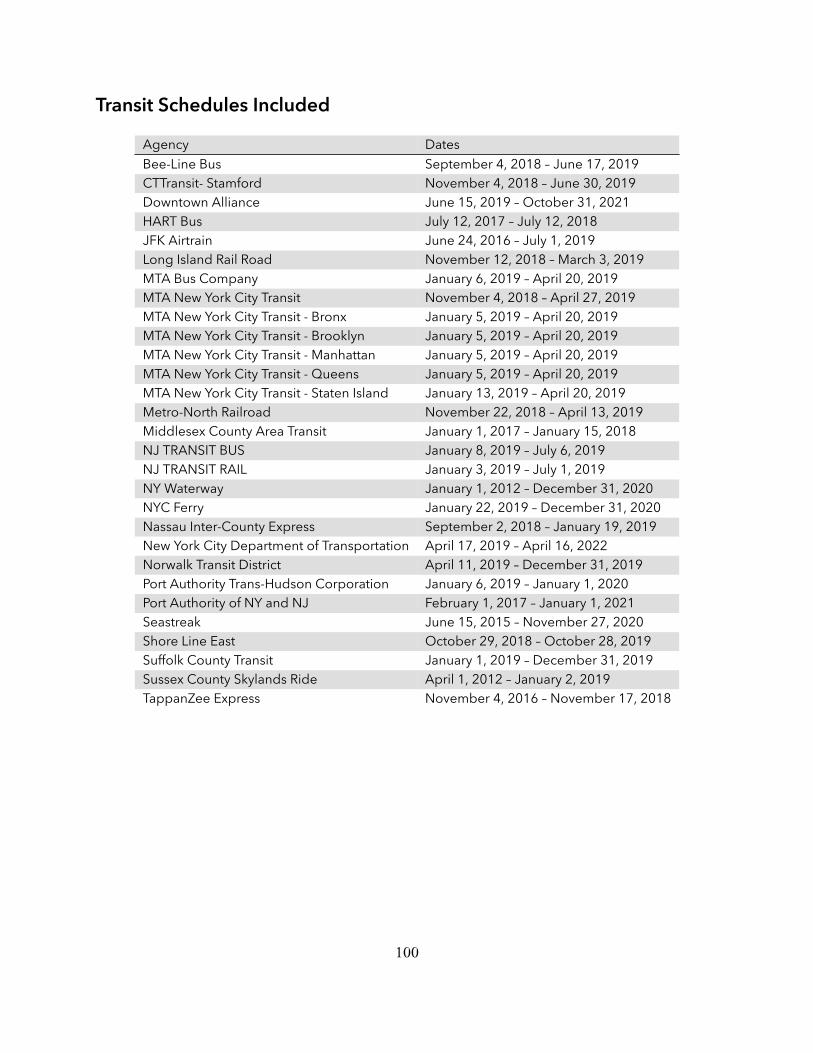
Transit Schedules IncludedAgency DatesBee-Line Bus September 4, 2018 – June 17, 2019CTTransit- Stamford November 4, 2018 – June 30, 2019Downtown Alliance June 15, 2019 – October 31, 2021HART Bus July 12, 2017 – July 12, 2018JFK Airtrain June 24, 2016 – July 1, 2019Long Island Rail Road November 12, 2018 – March 3, 2019MTA Bus Company January 6, 2019 – April 20, 2019MTA New York City Transit November 4, 2018 – April 27, 2019MTA New York City Transit - Bronx January 5, 2019 – April 20, 2019MTA New York City Transit - Brooklyn January 5, 2019 – April 20, 2019MTA New York City Transit - Manhattan January 5, 2019 – April 20, 2019MTA New York City Transit - Queens January 5, 2019 – April 20, 2019MTA New York City Transit - Staten Island January 13, 2019 – April 20, 2019Metro-North Railroad November 22, 2018 – April 13, 2019Middlesex County Area Transit January 1, 2017 – January 15, 2018NJ TRANSIT BUS January 8, 2019 – July 6, 2019NJ TRANSIT RAIL January 3, 2019 – July 1, 2019NY Waterway January 1, 2012 – December 31, 2020NYC Ferry January 22, 2019 – December 31, 2020Nassau Inter-County Express September 2, 2018 – January 19, 2019New York City Department of Transportation April 17, 2019 – April 16, 2022Norwalk Transit District April 11, 2019 – December 31, 2019Port Authority Trans-Hudson Corporation January 6, 2019 – January 1, 2020Port Authority of NY and NJ February 1, 2017 – January 1, 2021Seastreak June 15, 2015 – November 27, 2020Shore Line East October 29, 2018 – October 28, 2019Suffolk County Transit January 1, 2019 – December 31, 2019Sussex County Skylands Ride April 1, 2012 – January 2, 2019TappanZee Express November 4, 2016 – November 17, 2018
100
101

Oklahoma CityOklahoma City, OK
Rank by Weighted Accessibility 48Rank by Total Employment 47Rank by 1-Year Change in Weighted Accessibility 441-Year Change in Weighted Accessibility -3.04%1-Year Change in Weighted Accessibility Rank -2Total Jobs 595,050Average Job Density (per km2) 42Total Workers 565,695Average Worker Density (per km2) 40Job and worker totals are based on LEHD estimates and may not match other sources.
Job Accessibility by Travel Time Threshold
10 min 20 min 30 min 40 min 50 min 60 min
100,000
200,000
300,000
400,000
247 1,465 4,499 10,481 19,752 32,091
1-Year Change in Weighted Accessibility by Travel Time Threshold
10 min 20 min 30 min 40 min 50 min 60 min -20,000
-10,000
0
10,000
20,000
-6 -40 -145 -355 -653 -995
102

Transit Schedules IncludedAgency DatesEMBARK January 27, 2019 – January 25, 2020
103

104

OrlandoOrlando-Kissimmee-Sanford, FL
Rank by Weighted Accessibility 42Rank by Total Employment 23Rank by 1-Year Change in Weighted Accessibility 101-Year Change in Weighted Accessibility +2.29%1-Year Change in Weighted Accessibility Rank 0Total Jobs 1,262,313Average Job Density (per km2) 140Total Workers 1,135,710Average Worker Density (per km2) 126Job and worker totals are based on LEHD estimates and may not match other sources.
Job Accessibility by Travel Time Threshold
10 min 20 min 30 min 40 min 50 min 60 min
100,000
200,000
300,000
400,000
330 1,785 5,500 13,178 27,023 49,130
1-Year Change in Weighted Accessibility by Travel Time Threshold
10 min 20 min 30 min 40 min 50 min 60 min -20,000
-10,000
0
10,000
20,000
+8 +47 +111 +288 +619 +1,062
105

Transit Schedules IncludedAgency DatesCentral Florida Regional Transit Authority January 11, 2019 – April 27, 2019Florida Department of Transportation July 30, 2018 – December 31, 2020I-RIDE Trolley January 1, 2018 – December 31, 2019Lake County April 24, 2017 – April 20, 2020Lakeland October 27, 2018 – September 30, 2019Polk County Transit Services July 3, 2015 – December 31, 2015Sanford Community Redevelopment Agency November 20, 2018 – June 1, 2019Winter Haven Area Transit July 3, 2015 – December 31, 2015
106

107
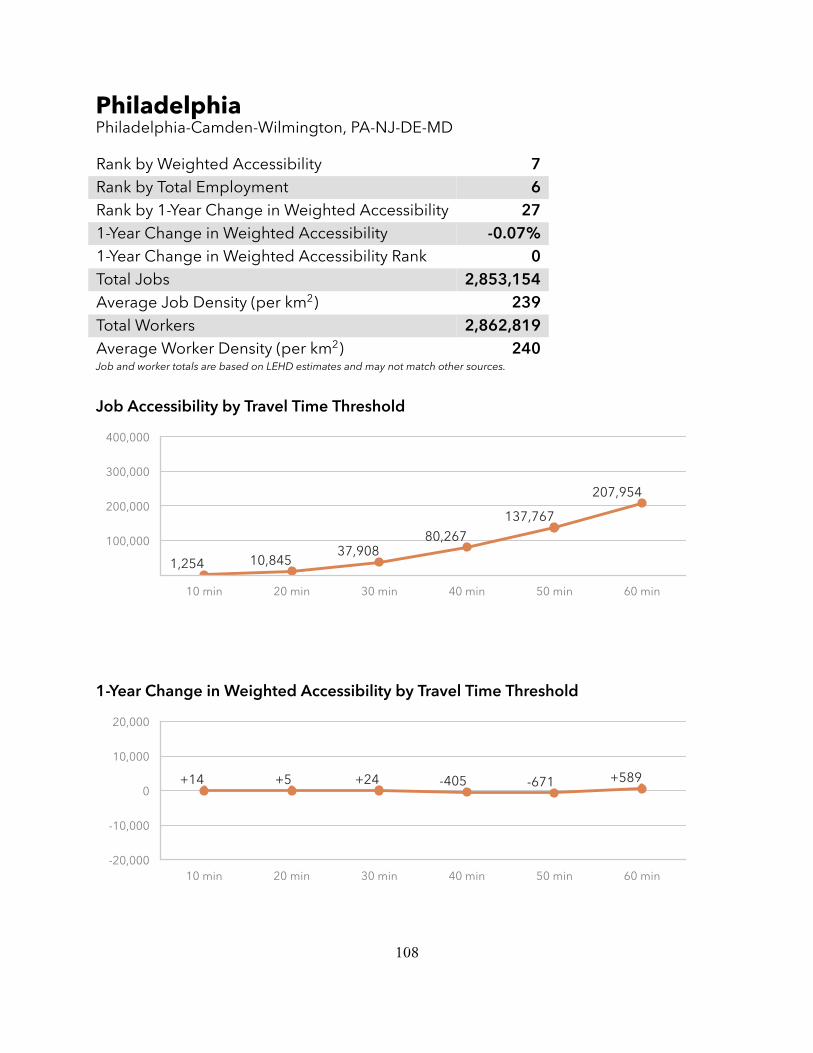
PhiladelphiaPhiladelphia-Camden-Wilmington, PA-NJ-DE-MD
Rank by Weighted Accessibility 7Rank by Total Employment 6Rank by 1-Year Change in Weighted Accessibility 271-Year Change in Weighted Accessibility -0.07%1-Year Change in Weighted Accessibility Rank 0Total Jobs 2,853,154Average Job Density (per km2) 239Total Workers 2,862,819Average Worker Density (per km2) 240Job and worker totals are based on LEHD estimates and may not match other sources.
Job Accessibility by Travel Time Threshold
10 min 20 min 30 min 40 min 50 min 60 min
100,000
200,000
300,000
400,000
1,254 10,84537,908
80,267
137,767
207,954
1-Year Change in Weighted Accessibility by Travel Time Threshold
10 min 20 min 30 min 40 min 50 min 60 min -20,000
-10,000
0
10,000
20,000
+14 +5 +24 -405 -671 +589
108
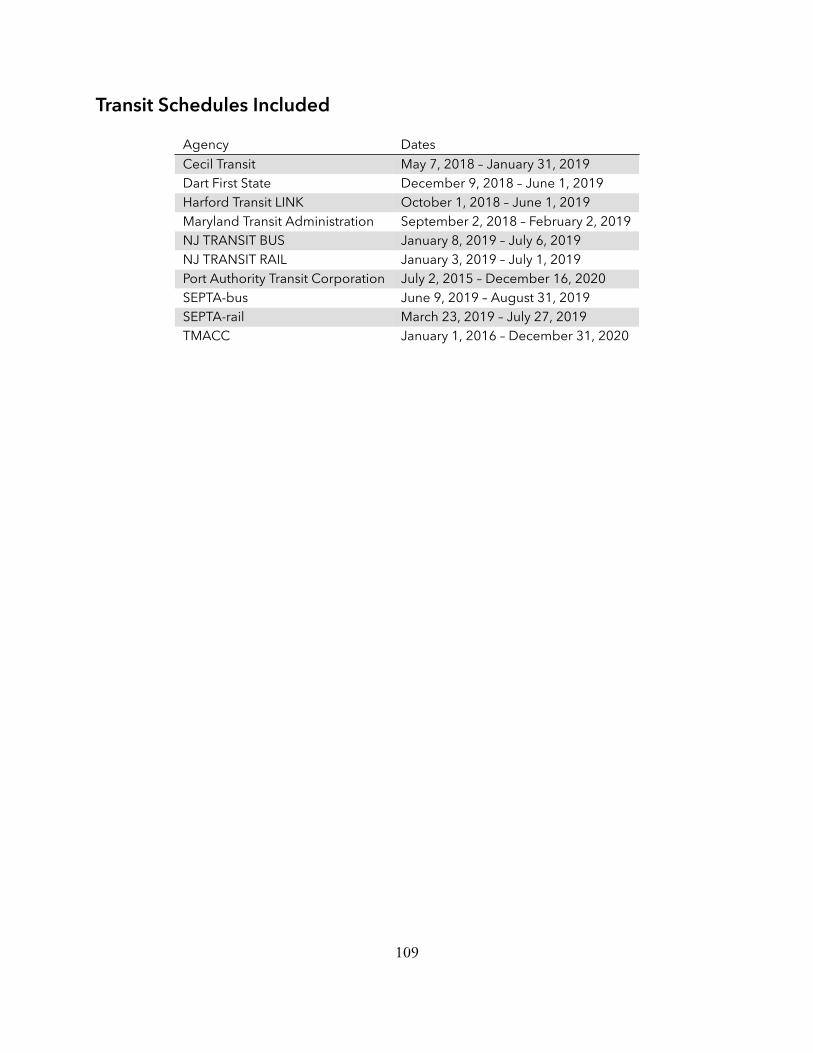
Transit Schedules IncludedAgency DatesCecil Transit May 7, 2018 – January 31, 2019Dart First State December 9, 2018 – June 1, 2019Harford Transit LINK October 1, 2018 – June 1, 2019Maryland Transit Administration September 2, 2018 – February 2, 2019NJ TRANSIT BUS January 8, 2019 – July 6, 2019NJ TRANSIT RAIL January 3, 2019 – July 1, 2019Port Authority Transit Corporation July 2, 2015 – December 16, 2020SEPTA-bus June 9, 2019 – August 31, 2019SEPTA-rail March 23, 2019 – July 27, 2019TMACC January 1, 2016 – December 31, 2020
109

110

PhoenixPhoenix-Mesa-Glendale, AZ
Rank by Weighted Accessibility 19Rank by Total Employment 12Rank by 1-Year Change in Weighted Accessibility 11-Year Change in Weighted Accessibility +8.07%1-Year Change in Weighted Accessibility Rank +2Total Jobs 2,007,240Average Job Density (per km2) 53Total Workers 1,958,550Average Worker Density (per km2) 52Job and worker totals are based on LEHD estimates and may not match other sources.
Job Accessibility by Travel Time Threshold
10 min 20 min 30 min 40 min 50 min 60 min
100,000
200,000
300,000
400,000
339 2,698 10,668 29,35163,162
114,601
1-Year Change in Weighted Accessibility by Travel Time Threshold
10 min 20 min 30 min 40 min 50 min 60 min -20,000
-10,000
0
10,000
20,000
+29 +224 +811 +2,148+4,535
+8,384
111

Transit Schedules IncludedAgency DatesValley Metro October 23, 2017 – January 21, 2018
112

113
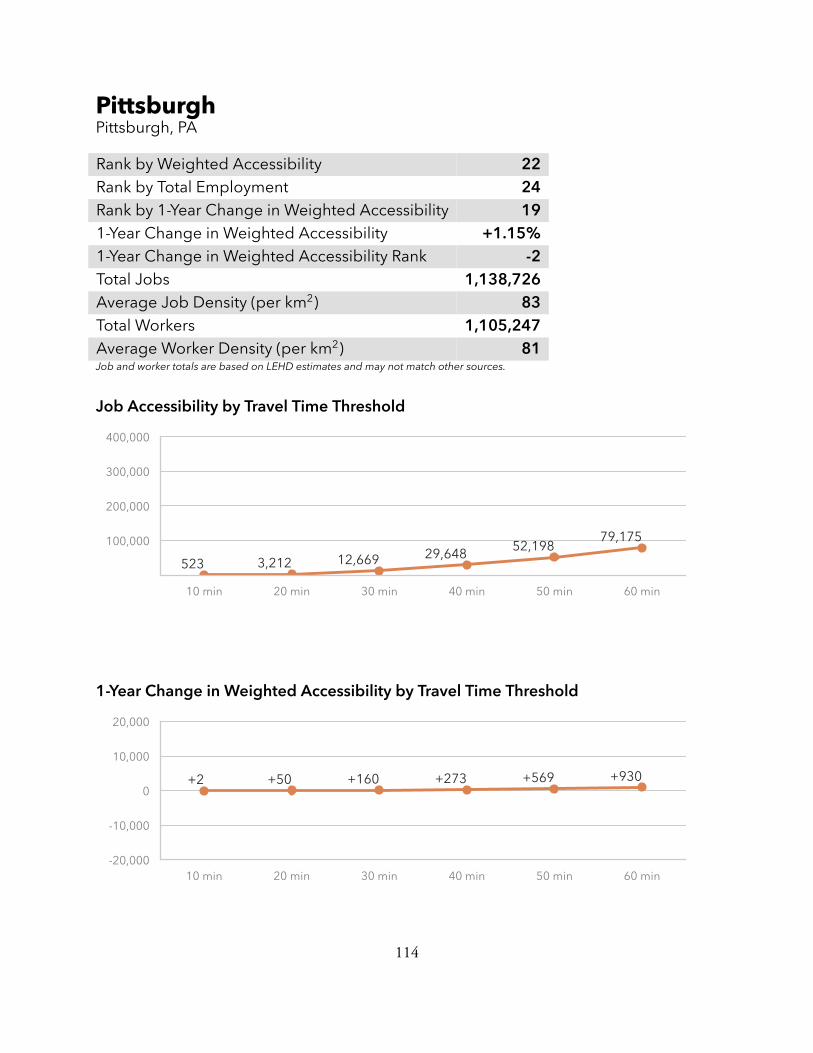
PittsburghPittsburgh, PA
Rank by Weighted Accessibility 22Rank by Total Employment 24Rank by 1-Year Change in Weighted Accessibility 191-Year Change in Weighted Accessibility +1.15%1-Year Change in Weighted Accessibility Rank -2Total Jobs 1,138,726Average Job Density (per km2) 83Total Workers 1,105,247Average Worker Density (per km2) 81Job and worker totals are based on LEHD estimates and may not match other sources.
Job Accessibility by Travel Time Threshold
10 min 20 min 30 min 40 min 50 min 60 min
100,000
200,000
300,000
400,000
523 3,212 12,669 29,648 52,19879,175
1-Year Change in Weighted Accessibility by Travel Time Threshold
10 min 20 min 30 min 40 min 50 min 60 min -20,000
-10,000
0
10,000
20,000
+2 +50 +160 +273 +569 +930
114

Transit Schedules IncludedAgency DatesMountain Line Transit Authority February 20, 2019 – May 31, 2020Port Authority of Allegheny County November 18, 2018 – March 16, 2019
115
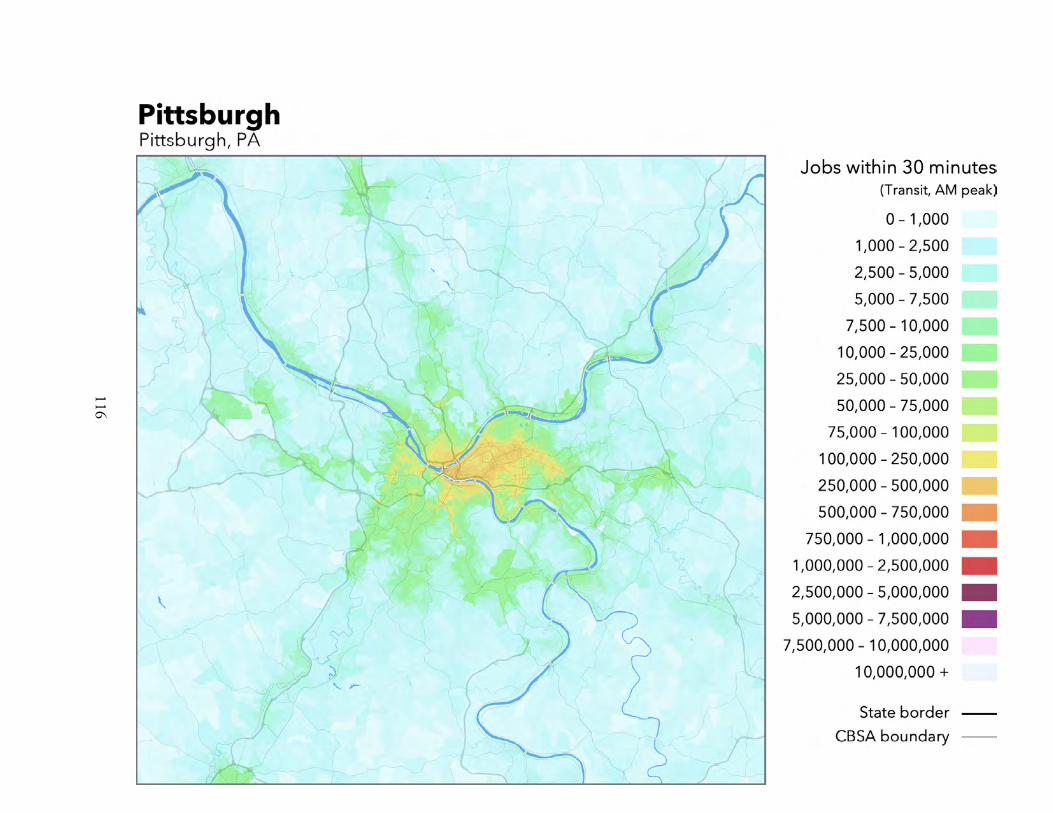
116

PortlandPortland-Vancouver-Hillsboro, OR-WA
Rank by Weighted Accessibility 11Rank by Total Employment 22Rank by 1-Year Change in Weighted Accessibility 311-Year Change in Weighted Accessibility -0.77%1-Year Change in Weighted Accessibility Rank 0Total Jobs 1,165,042Average Job Density (per km2) 67Total Workers 1,140,463Average Worker Density (per km2) 66Job and worker totals are based on LEHD estimates and may not match other sources.
Job Accessibility by Travel Time Threshold
10 min 20 min 30 min 40 min 50 min 60 min
100,000
200,000
300,000
400,000
822 5,741 20,39650,162
96,339
156,927
1-Year Change in Weighted Accessibility by Travel Time Threshold
10 min 20 min 30 min 40 min 50 min 60 min -20,000
-10,000
0
10,000
20,000
+4 -42 -290 -698 -722 +17
117

Transit Schedules IncludedAgency DatesBlue Star Bus January 1, 2013 – January 1, 2021C-TRAN January 6, 2019 – May 31, 2019CCC Xpress September 24, 2018 – June 15, 2019Canby Area Transit January 1, 2014 – January 1, 2021Caravan Airport Transportation October 1, 2019 – January 1, 2021Cascades POINT January 2, 2018 – January 1, 2020Central Oregon Breeze January 1, 2014 – January 1, 2021Cherriots July 15, 2018 – January 5, 2019City2City Shuttle January 1, 2015 – January 1, 2019Columbia Area Transit June 17, 2019 – January 1, 2020Columbia County Rider January 1, 2012 – January 1, 2020Columbia Gorge Express May 25, 2018 – September 1, 2019Groome Transportation May 31, 2019 – January 1, 2021Mt. Hood Express June 1, 2017 – January 1, 2020NorthWest POINT May 21, 2018 – January 1, 2020Port of Portland April 7, 2020 – August 29, 2020Portland Aerial Tram December 3, 2018 – June 1, 2019Portland Streetcar December 2, 2018 – June 1, 2019Ride Connection January 1, 2015 – January 1, 2022Sandy Area Metro December 1, 2014 – January 1, 2021Skamania County Public Transit (Gorge WET Bus) April 1, 2018 – January 1, 2021South Clackamas Transportation District November 1, 2015 – January 1, 2020South Metro Area Regional Transit January 1, 2013 – January 1, 2020Sunset Empire Transportation District January 1, 2018 – January 1, 2020Swan Island TMA January 1, 2013 – January 1, 2019Tillamook County Transportation District January 1, 2012 – January 1, 2020TriMet December 2, 2018 – June 1, 2019Washington Park Shuttle May 1, 2018 – October 31, 2019Yamhill County Transit Area January 1, 2015 – January 1, 2020
118

119

ProvidenceProvidence-New Bedford-Fall River, RI-MA
Rank by Weighted Accessibility 31Rank by Total Employment 38Rank by 1-Year Change in Weighted Accessibility 241-Year Change in Weighted Accessibility +0.12%1-Year Change in Weighted Accessibility Rank 0Total Jobs 689,902Average Job Density (per km2) 168Total Workers 775,615Average Worker Density (per km2) 189Job and worker totals are based on LEHD estimates and may not match other sources.
Job Accessibility by Travel Time Threshold
10 min 20 min 30 min 40 min 50 min 60 min
100,000
200,000
300,000
400,000
522 3,054 9,219 19,468 33,755 51,738
1-Year Change in Weighted Accessibility by Travel Time Threshold
10 min 20 min 30 min 40 min 50 min 60 min -20,000
-10,000
0
10,000
20,000
-5 -15 -3 +47 +167 +359
120

Transit Schedules IncludedAgency DatesBlock Island Ferry January 7, 2019 – January 5, 2020Bloom Bus January 2, 2015 – January 2, 2016Brockton Area Transit Authority January 1, 2015 – January 1, 2021Cuttyhunk Ferry Co. October 16, 2017 – April 12, 2019DATTCO October 20, 2017 – January 1, 2021MBTA December 26, 2018 – March 16, 2019Rhode Island Public Transit Authority January 19, 2019 – June 21, 2019Seastreak June 15, 2015 – November 27, 2020Southeastern Regional Transit Authority January 1, 2015 – January 1, 2021The Greater Attleboro Taunton Regional Transit Authority January 1, 2016 – January 1, 2021Vineyard Fast Ferry June 7, 2018 – October 9, 2018
121

122

RaleighRaleigh-Cary, NC
Rank by Weighted Accessibility 45Rank by Total Employment 43Rank by 1-Year Change in Weighted Accessibility 21-Year Change in Weighted Accessibility +6.77%1-Year Change in Weighted Accessibility Rank +2Total Jobs 677,938Average Job Density (per km2) 124Total Workers 615,937Average Worker Density (per km2) 112Job and worker totals are based on LEHD estimates and may not match other sources.
Job Accessibility by Travel Time Threshold
10 min 20 min 30 min 40 min 50 min 60 min
100,000
200,000
300,000
400,000
282 1,485 4,706 11,135 21,749 37,705
1-Year Change in Weighted Accessibility by Travel Time Threshold
10 min 20 min 30 min 40 min 50 min 60 min -20,000
-10,000
0
10,000
20,000
+23 +117 +338 +727 +1,153 +1,907
123

Transit Schedules IncludedAgency DatesGoCary November 23, 2018 – November 27, 2019GoDurham December 26, 2018 – December 24, 2020GoRaleigh August 1, 2019 – November 25, 2020GoTriangle September 4, 2018 – September 4, 2020NCSU Wolfline November 26, 2018 – August 13, 2019
124
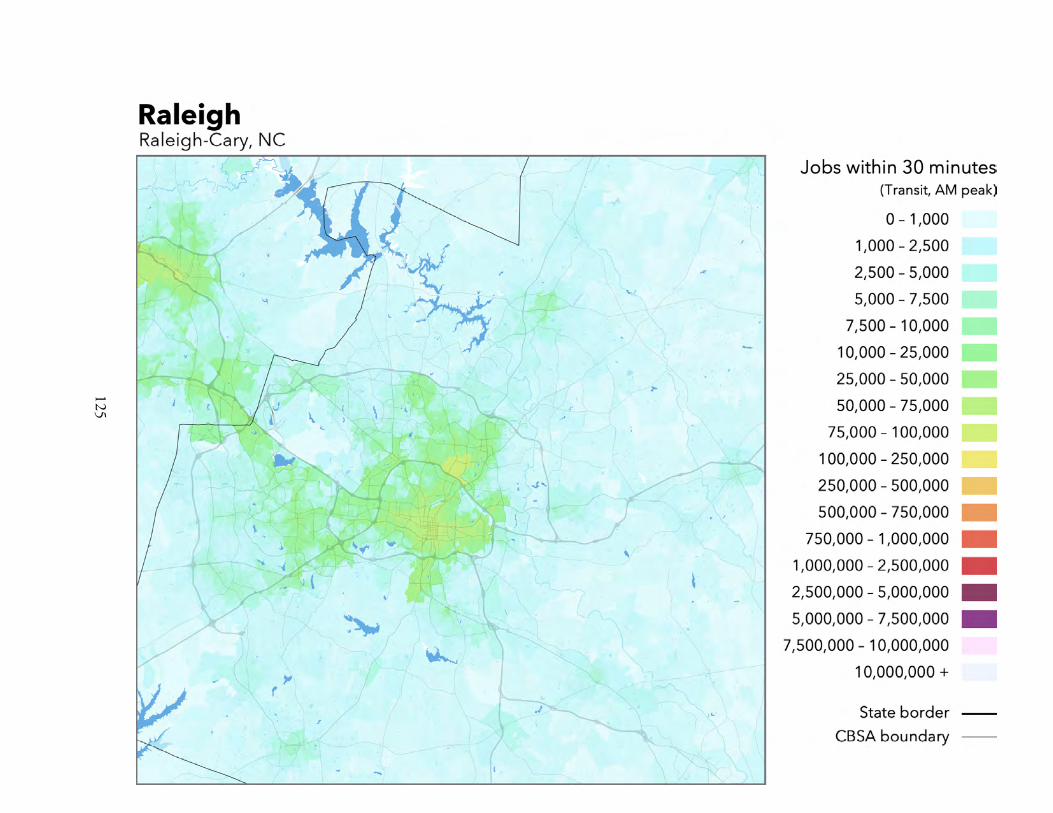
125

RichmondRichmond, VA
Rank by Weighted Accessibility 41Rank by Total Employment 42Rank by 1-Year Change in Weighted Accessibility 131-Year Change in Weighted Accessibility +1.83%1-Year Change in Weighted Accessibility Rank 0Total Jobs 659,862Average Job Density (per km2) 45Total Workers 640,682Average Worker Density (per km2) 44Job and worker totals are based on LEHD estimates and may not match other sources.
Job Accessibility by Travel Time Threshold
10 min 20 min 30 min 40 min 50 min 60 min
100,000
200,000
300,000
400,000
384 2,328 7,027 14,408 23,458 33,900
1-Year Change in Weighted Accessibility by Travel Time Threshold
10 min 20 min 30 min 40 min 50 min 60 min -20,000
-10,000
0
10,000
20,000
+10 +51 +144 +230 +339 +462
126

Transit Schedules IncludedAgency DatesGRTC Transit System May 14, 2017 – August 19, 2017
127

128
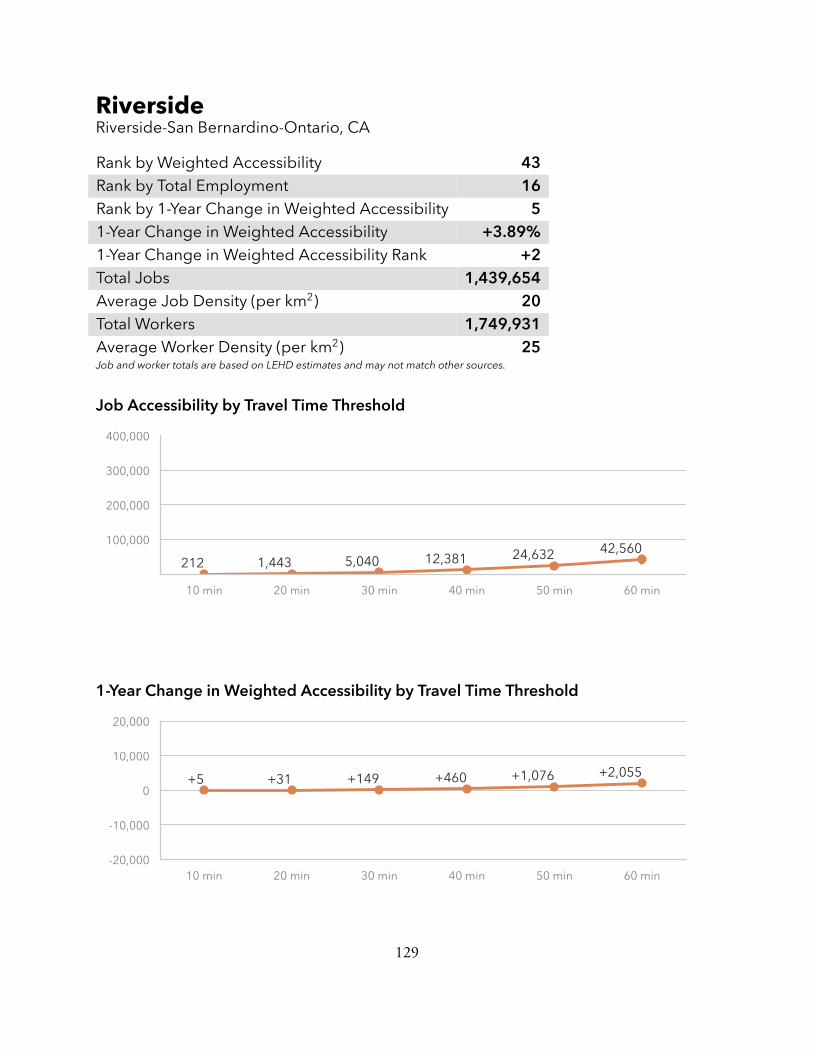
RiversideRiverside-San Bernardino-Ontario, CA
Rank by Weighted Accessibility 43Rank by Total Employment 16Rank by 1-Year Change in Weighted Accessibility 51-Year Change in Weighted Accessibility +3.89%1-Year Change in Weighted Accessibility Rank +2Total Jobs 1,439,654Average Job Density (per km2) 20Total Workers 1,749,931Average Worker Density (per km2) 25Job and worker totals are based on LEHD estimates and may not match other sources.
Job Accessibility by Travel Time Threshold
10 min 20 min 30 min 40 min 50 min 60 min
100,000
200,000
300,000
400,000
212 1,443 5,040 12,381 24,632 42,560
1-Year Change in Weighted Accessibility by Travel Time Threshold
10 min 20 min 30 min 40 min 50 min 60 min -20,000
-10,000
0
10,000
20,000
+5 +31 +149 +460 +1,076 +2,055
129

Transit Schedules IncludedAgency DatesBeaumont Pass Transit January 1, 2013 – January 1, 2020Beaumont Transit January 1, 2016 – January 1, 2021Corona Cruiser January 1, 2013 – January 1, 2021Foothill Transit July 3, 2018 – February 2, 2019Metrolink Trains September 1, 2017 – December 31, 2017Mountain Transit January 1, 2014 – January 1, 2021OMNITRANS January 7, 2019 – September 1, 2019Orange County Transportation Authority June 10, 2018 – February 10, 2019Palo Verde Valley Transit Agency January 1, 2013 – January 1, 2021Riverside Transit Agency January 13, 2019 – May 11, 2019SunLine Transit Agency January 6, 2019 – May 4, 2019Victor Valley Transit Authority January 1, 2016 – January 1, 2020
130

131
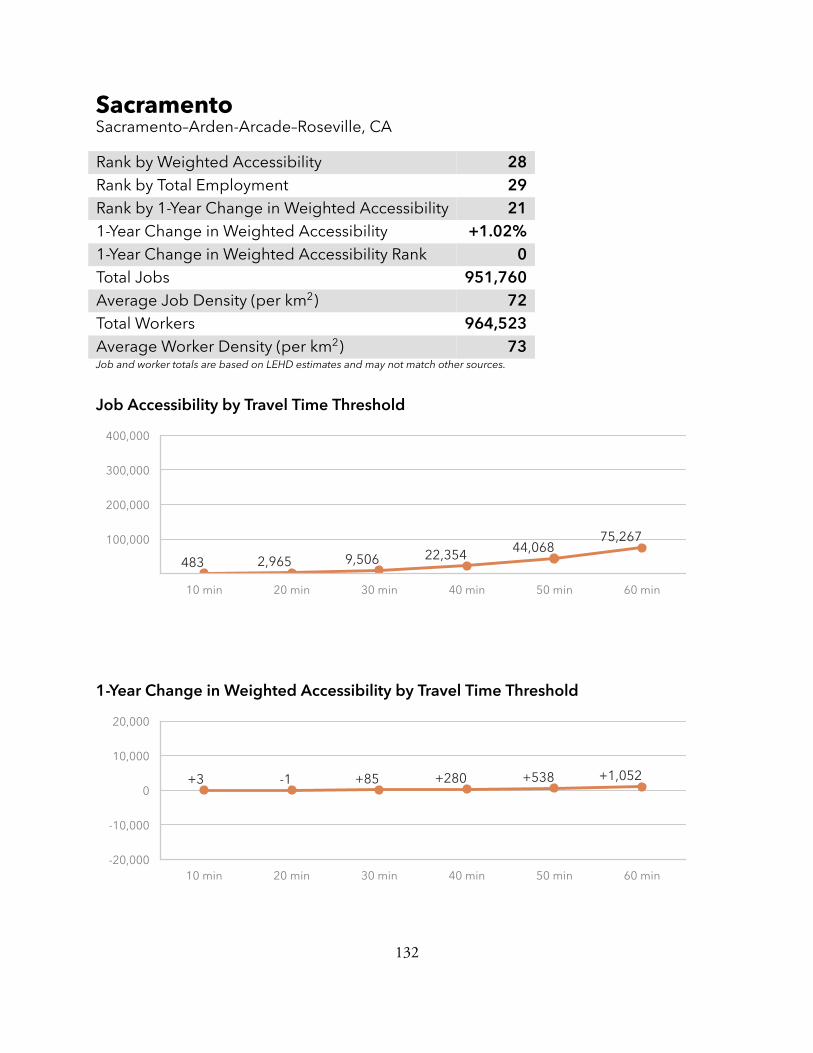
SacramentoSacramento–Arden-Arcade–Roseville, CA
Rank by Weighted Accessibility 28Rank by Total Employment 29Rank by 1-Year Change in Weighted Accessibility 211-Year Change in Weighted Accessibility +1.02%1-Year Change in Weighted Accessibility Rank 0Total Jobs 951,760Average Job Density (per km2) 72Total Workers 964,523Average Worker Density (per km2) 73Job and worker totals are based on LEHD estimates and may not match other sources.
Job Accessibility by Travel Time Threshold
10 min 20 min 30 min 40 min 50 min 60 min
100,000
200,000
300,000
400,000
483 2,965 9,506 22,354 44,06875,267
1-Year Change in Weighted Accessibility by Travel Time Threshold
10 min 20 min 30 min 40 min 50 min 60 min -20,000
-10,000
0
10,000
20,000
+3 -1 +85 +280 +538 +1,052
132
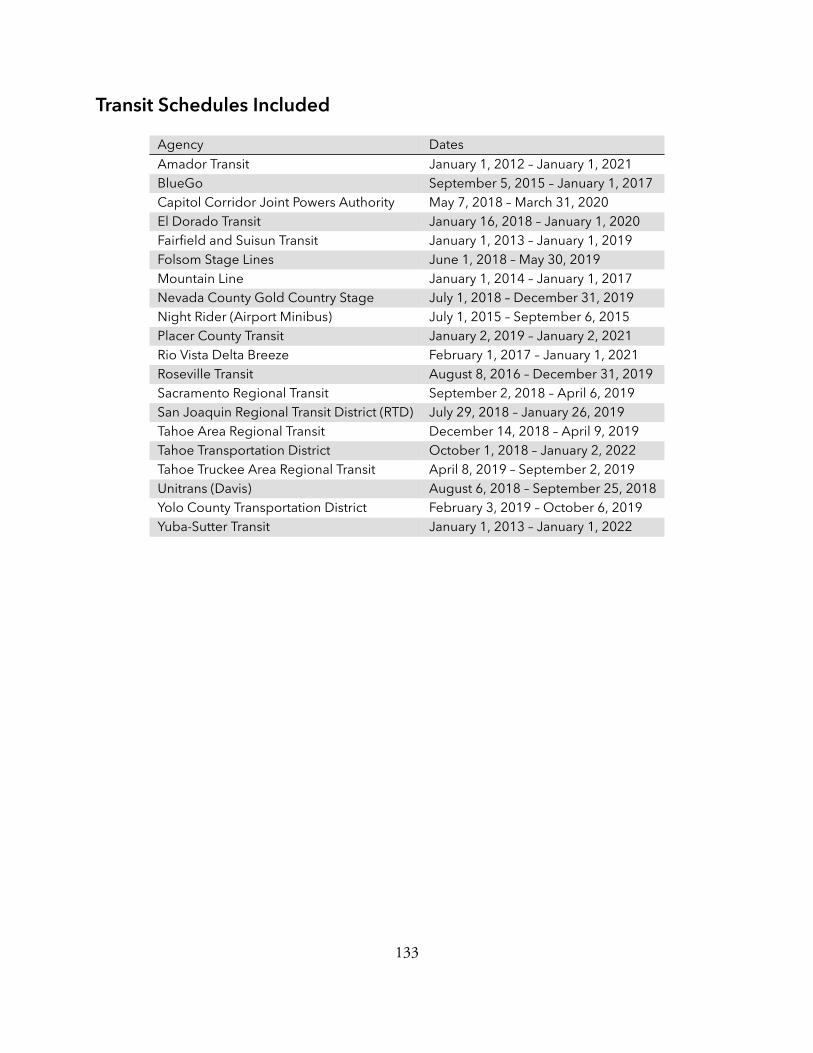
Transit Schedules IncludedAgency DatesAmador Transit January 1, 2012 – January 1, 2021BlueGo September 5, 2015 – January 1, 2017Capitol Corridor Joint Powers Authority May 7, 2018 – March 31, 2020El Dorado Transit January 16, 2018 – January 1, 2020Fairfield and Suisun Transit January 1, 2013 – January 1, 2019Folsom Stage Lines June 1, 2018 – May 30, 2019Mountain Line January 1, 2014 – January 1, 2017Nevada County Gold Country Stage July 1, 2018 – December 31, 2019Night Rider (Airport Minibus) July 1, 2015 – September 6, 2015Placer County Transit January 2, 2019 – January 2, 2021Rio Vista Delta Breeze February 1, 2017 – January 1, 2021Roseville Transit August 8, 2016 – December 31, 2019Sacramento Regional Transit September 2, 2018 – April 6, 2019San Joaquin Regional Transit District (RTD) July 29, 2018 – January 26, 2019Tahoe Area Regional Transit December 14, 2018 – April 9, 2019Tahoe Transportation District October 1, 2018 – January 2, 2022Tahoe Truckee Area Regional Transit April 8, 2019 – September 2, 2019Unitrans (Davis) August 6, 2018 – September 25, 2018Yolo County Transportation District February 3, 2019 – October 6, 2019Yuba-Sutter Transit January 1, 2013 – January 1, 2022
133

134
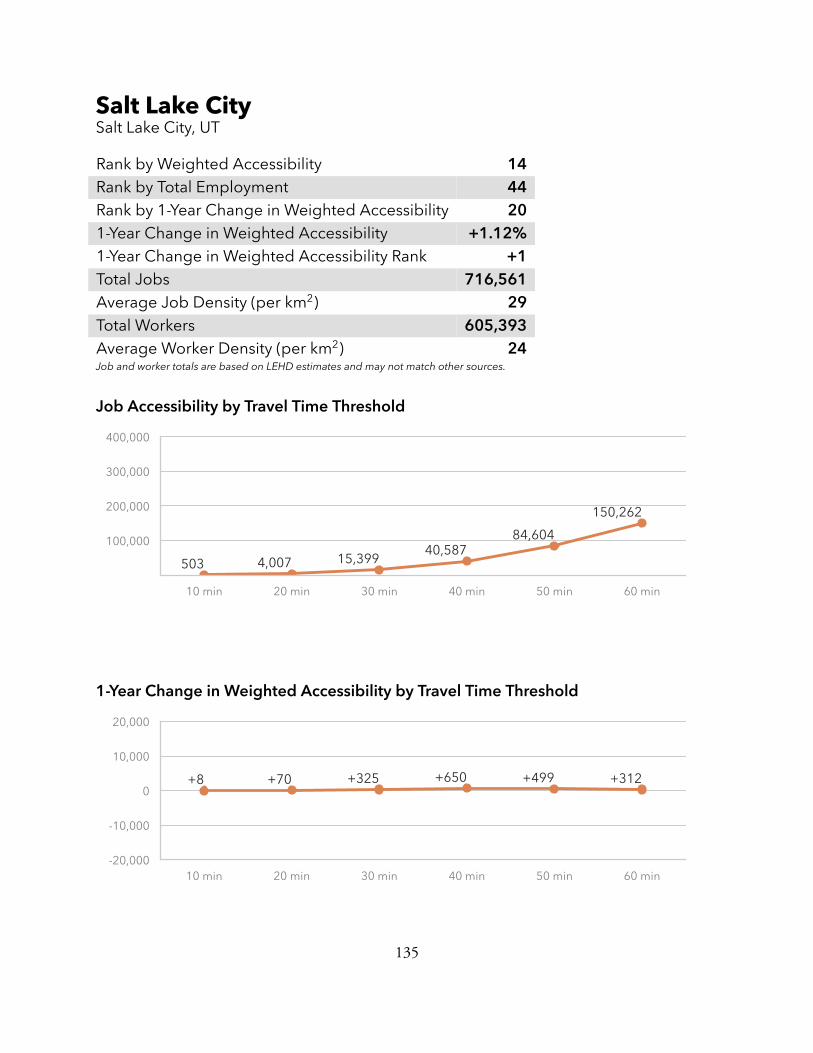
Salt Lake CitySalt Lake City, UT
Rank by Weighted Accessibility 14Rank by Total Employment 44Rank by 1-Year Change in Weighted Accessibility 201-Year Change in Weighted Accessibility +1.12%1-Year Change in Weighted Accessibility Rank +1Total Jobs 716,561Average Job Density (per km2) 29Total Workers 605,393Average Worker Density (per km2) 24Job and worker totals are based on LEHD estimates and may not match other sources.
Job Accessibility by Travel Time Threshold
10 min 20 min 30 min 40 min 50 min 60 min
100,000
200,000
300,000
400,000
503 4,007 15,39940,587
84,604
150,262
1-Year Change in Weighted Accessibility by Travel Time Threshold
10 min 20 min 30 min 40 min 50 min 60 min -20,000
-10,000
0
10,000
20,000
+8 +70 +325 +650 +499 +312
135

Transit Schedules IncludedAgency DatesElevated Transit November 20, 2014 – January 1, 2019Utah Transit Authority August 12, 2018 – April 6, 2019
136
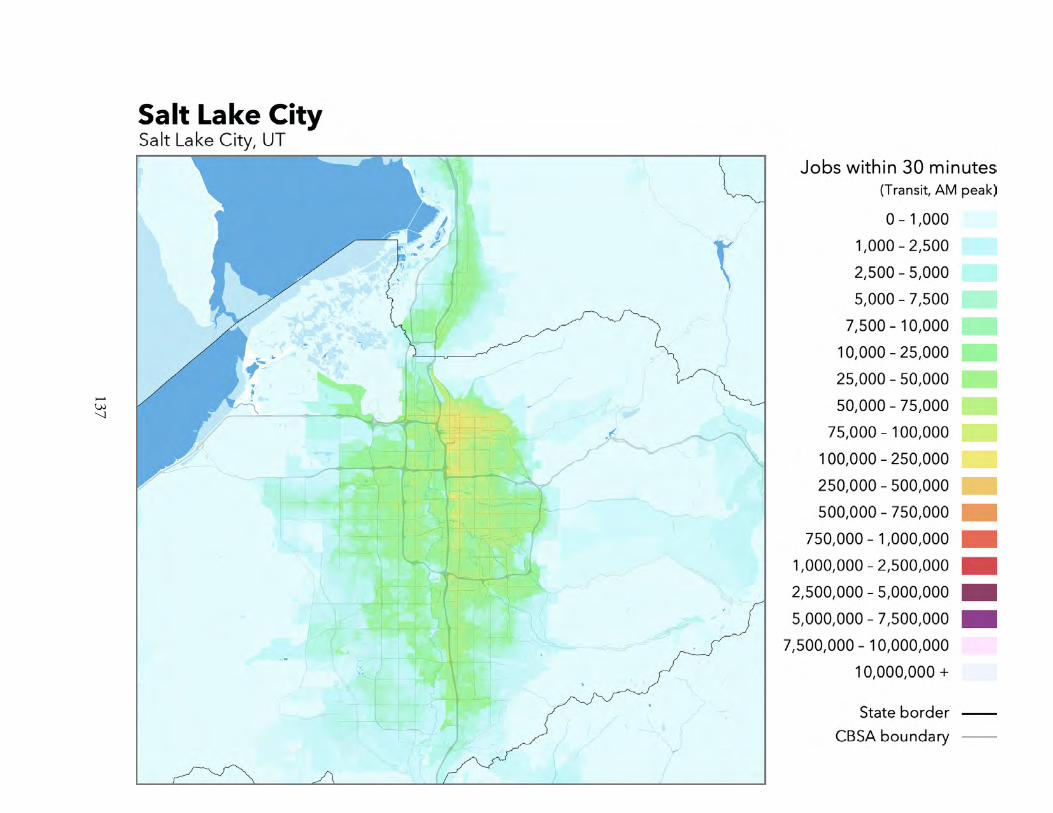
137
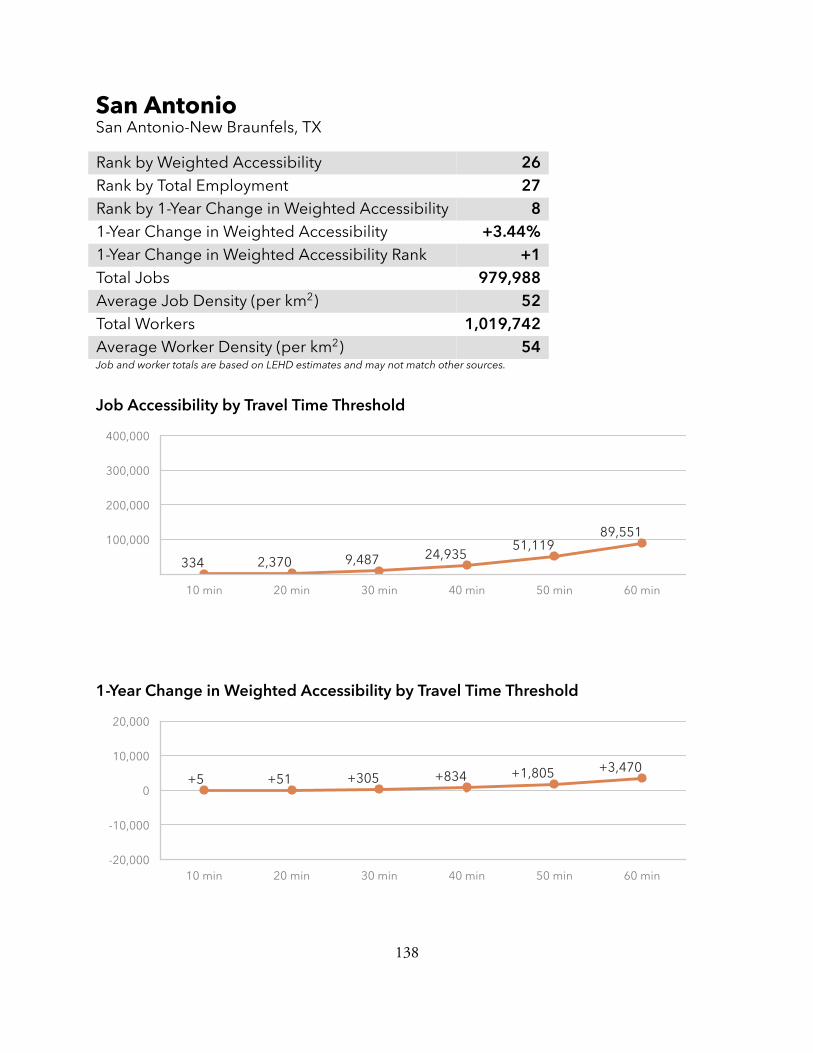
San AntonioSan Antonio-New Braunfels, TX
Rank by Weighted Accessibility 26Rank by Total Employment 27Rank by 1-Year Change in Weighted Accessibility 81-Year Change in Weighted Accessibility +3.44%1-Year Change in Weighted Accessibility Rank +1Total Jobs 979,988Average Job Density (per km2) 52Total Workers 1,019,742Average Worker Density (per km2) 54Job and worker totals are based on LEHD estimates and may not match other sources.
Job Accessibility by Travel Time Threshold
10 min 20 min 30 min 40 min 50 min 60 min
100,000
200,000
300,000
400,000
334 2,370 9,487 24,93551,119
89,551
1-Year Change in Weighted Accessibility by Travel Time Threshold
10 min 20 min 30 min 40 min 50 min 60 min -20,000
-10,000
0
10,000
20,000
+5 +51 +305 +834 +1,805 +3,470
138

Transit Schedules IncludedAgency DatesVIA Metropolitan Transit January 7, 2019 – May 5, 2019
139

140

San DiegoSan Diego-Carlsbad-San Marcos, CA
Rank by Weighted Accessibility 17Rank by Total Employment 17Rank by 1-Year Change in Weighted Accessibility 71-Year Change in Weighted Accessibility +3.63%1-Year Change in Weighted Accessibility Rank +1Total Jobs 1,403,191Average Job Density (per km2) 129Total Workers 1,419,381Average Worker Density (per km2) 130Job and worker totals are based on LEHD estimates and may not match other sources.
Job Accessibility by Travel Time Threshold
10 min 20 min 30 min 40 min 50 min 60 min
100,000
200,000
300,000
400,000
664 3,729 11,956 30,24862,849
111,817
1-Year Change in Weighted Accessibility by Travel Time Threshold
10 min 20 min 30 min 40 min 50 min 60 min -20,000
-10,000
0
10,000
20,000
+3 +48 +273 +1,179 +2,851+5,386
141
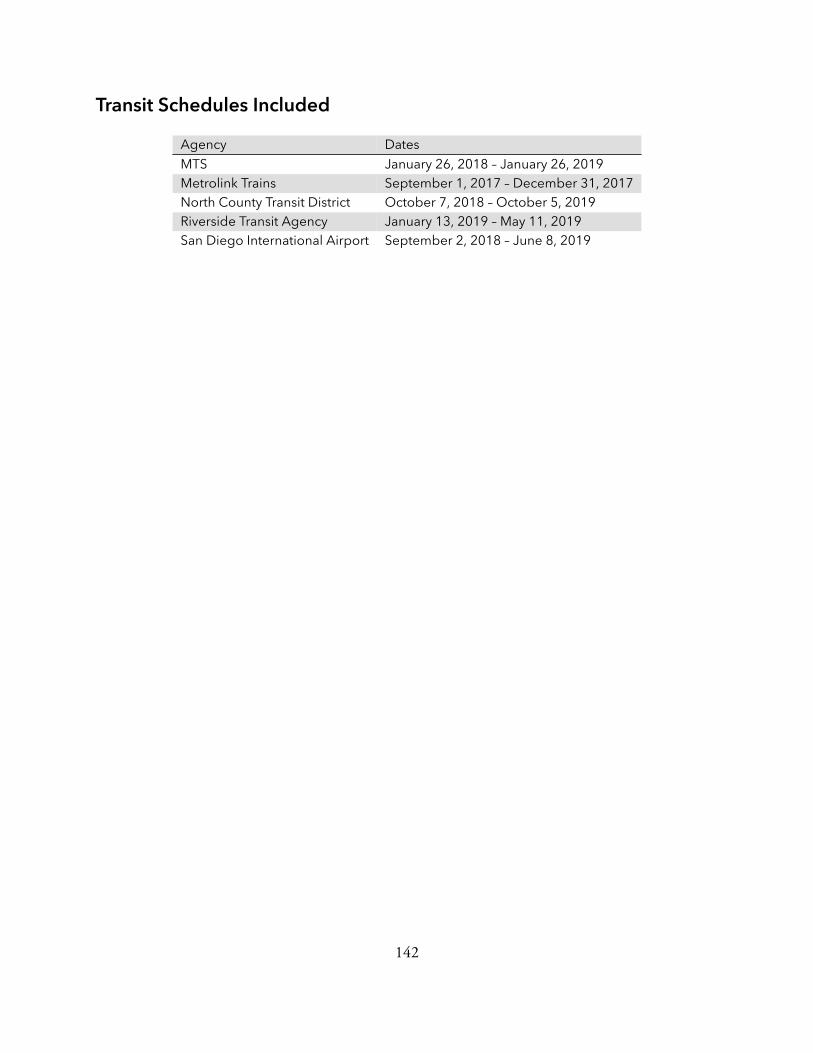
Transit Schedules IncludedAgency DatesMTS January 26, 2018 – January 26, 2019Metrolink Trains September 1, 2017 – December 31, 2017North County Transit District October 7, 2018 – October 5, 2019Riverside Transit Agency January 13, 2019 – May 11, 2019San Diego International Airport September 2, 2018 – June 8, 2019
142

143
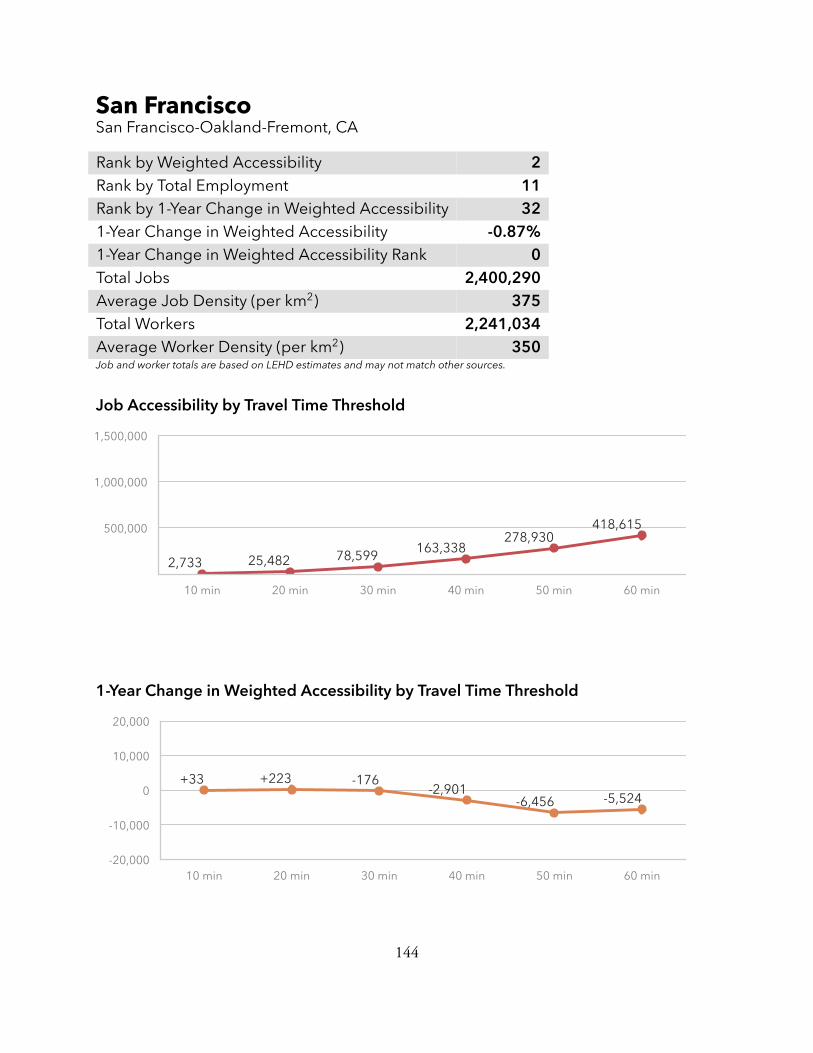
San FranciscoSan Francisco-Oakland-Fremont, CA
Rank by Weighted Accessibility 2Rank by Total Employment 11Rank by 1-Year Change in Weighted Accessibility 321-Year Change in Weighted Accessibility -0.87%1-Year Change in Weighted Accessibility Rank 0Total Jobs 2,400,290Average Job Density (per km2) 375Total Workers 2,241,034Average Worker Density (per km2) 350Job and worker totals are based on LEHD estimates and may not match other sources.
Job Accessibility by Travel Time Threshold
10 min 20 min 30 min 40 min 50 min 60 min
500,000
1,000,000
1,500,000
2,733 25,482 78,599 163,338278,930
418,615
1-Year Change in Weighted Accessibility by Travel Time Threshold
10 min 20 min 30 min 40 min 50 min 60 min -20,000
-10,000
0
10,000
20,000
+33 +223 -176-2,901
-6,456 -5,524
144

Transit Schedules IncludedAgency DatesAC Transit December 22, 2018 – March 16, 2019ACE Altamont Corridor Express March 11, 2013 – May 19, 2019Alameda County Clean Commute Program January 1, 2015 – December 1, 2019Bay Area Rapid Transit September 10, 2018 – September 10, 2019Bear Transit - UC Berkeley Shuttle January 7, 2015 – January 31, 2018Caltrain October 2, 2017 – October 6, 2019Capitol Corridor Joint Powers Authority May 7, 2018 – March 31, 2020County Connection August 12, 2018 – March 9, 2019Dumbarton Express Consortium June 17, 2019 – August 9, 2019Emery Go-Round November 30, 2018 – December 31, 2020Fairfield and Suisun Transit January 1, 2013 – January 1, 2019Golden Gate Ferry June 21, 2019 – September 7, 2019Golden Gate Transit December 9, 2018 – March 9, 2019Livermore Amador Valley Transit Authority October 1, 2018 – May 31, 2019Marin Transit June 10, 2018 – October 31, 2019Mission Bay TMA September 10, 2018 – January 1, 2021Modesto Area Express January 1, 2018 – January 1, 2020Napa April 30, 2019 – April 29, 2020Rio Vista Delta Breeze February 1, 2017 – January 1, 2021SamTrans January 20, 2019 – June 8, 2019San Francisco Bay Ferry October 29, 2018 – January 1, 2020San Francisco Municipal Transportation Agency January 22, 2018 – March 8, 2019San Joaquin Regional Transit District (RTD) July 29, 2018 – January 26, 2019SolTrans July 1, 2018 – January 18, 2020Sonoma County Transit August 14, 2018 – January 1, 2020Sonoma Marin Area Rail Transit August 25, 2017 – December 31, 2020Stanford Marguerite Shuttle May 29, 2017 – October 1, 2019Stanislaus Regional Transit August 22, 2016 – January 1, 2021Tideline Marine Group Inc August 14, 2018 – April 18, 2020Tri Delta Transit June 19, 2019 – December 31, 2020Union City Transit January 1, 2019 – December 31, 2019VTA January 14, 2019 – April 7, 2019WestCat (Western Contra Costa) June 1, 2016 – January 1, 2021
145
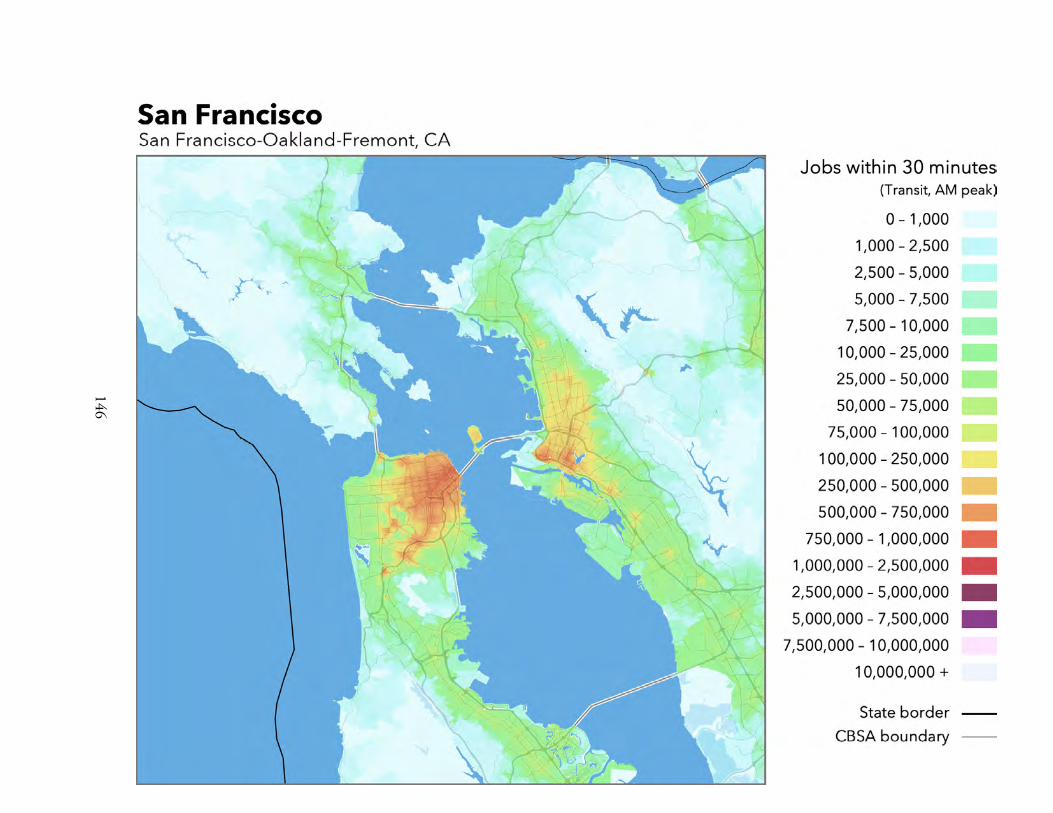
146
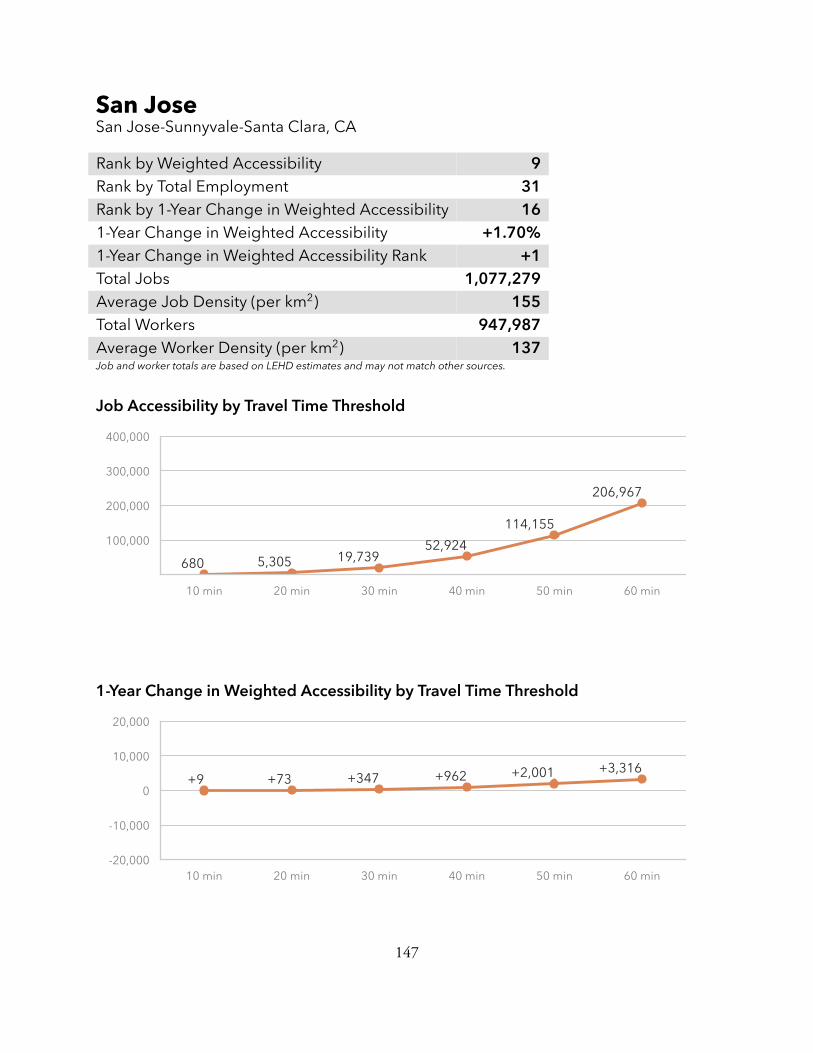
San JoseSan Jose-Sunnyvale-Santa Clara, CA
Rank by Weighted Accessibility 9Rank by Total Employment 31Rank by 1-Year Change in Weighted Accessibility 161-Year Change in Weighted Accessibility +1.70%1-Year Change in Weighted Accessibility Rank +1Total Jobs 1,077,279Average Job Density (per km2) 155Total Workers 947,987Average Worker Density (per km2) 137Job and worker totals are based on LEHD estimates and may not match other sources.
Job Accessibility by Travel Time Threshold
10 min 20 min 30 min 40 min 50 min 60 min
100,000
200,000
300,000
400,000
680 5,305 19,73952,924
114,155
206,967
1-Year Change in Weighted Accessibility by Travel Time Threshold
10 min 20 min 30 min 40 min 50 min 60 min -20,000
-10,000
0
10,000
20,000
+9 +73 +347 +962 +2,001 +3,316
147
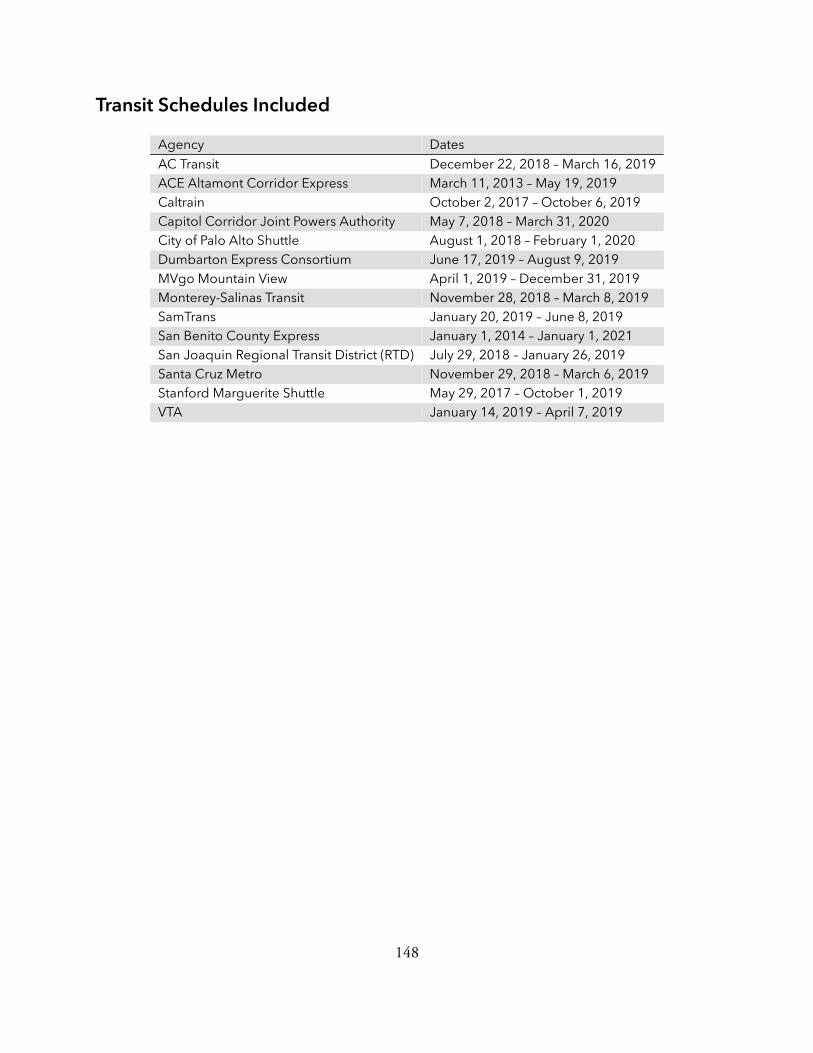
Transit Schedules IncludedAgency DatesAC Transit December 22, 2018 – March 16, 2019ACE Altamont Corridor Express March 11, 2013 – May 19, 2019Caltrain October 2, 2017 – October 6, 2019Capitol Corridor Joint Powers Authority May 7, 2018 – March 31, 2020City of Palo Alto Shuttle August 1, 2018 – February 1, 2020Dumbarton Express Consortium June 17, 2019 – August 9, 2019MVgo Mountain View April 1, 2019 – December 31, 2019Monterey-Salinas Transit November 28, 2018 – March 8, 2019SamTrans January 20, 2019 – June 8, 2019San Benito County Express January 1, 2014 – January 1, 2021San Joaquin Regional Transit District (RTD) July 29, 2018 – January 26, 2019Santa Cruz Metro November 29, 2018 – March 6, 2019Stanford Marguerite Shuttle May 29, 2017 – October 1, 2019VTA January 14, 2019 – April 7, 2019
148

149

SeattleSeattle-Tacoma-Bellevue, WA
Rank by Weighted Accessibility 8Rank by Total Employment 15Rank by 1-Year Change in Weighted Accessibility 261-Year Change in Weighted Accessibility +0.01%1-Year Change in Weighted Accessibility Rank 0Total Jobs 1,919,635Average Job Density (per km2) 126Total Workers 1,798,352Average Worker Density (per km2) 118Job and worker totals are based on LEHD estimates and may not match other sources.
Job Accessibility by Travel Time Threshold
10 min 20 min 30 min 40 min 50 min 60 min
100,000
200,000
300,000
400,000
1,614 10,273 30,34667,906
119,508
183,588
1-Year Change in Weighted Accessibility by Travel Time Threshold
10 min 20 min 30 min 40 min 50 min 60 min -20,000
-10,000
0
10,000
20,000
+62 +236 +383 +657 -1,209
-7,629
150

Transit Schedules IncludedAgency DatesCity of Seattle November 29, 2018 – June 14, 2019Community Transit December 19, 2018 – March 23, 2019Everett Transit September 16, 2018 – March 16, 2019Intercity Transit March 5, 2018 – March 2, 2023Island Transit August 20, 2014 – May 31, 2015Kingcounty Marine Divison December 11, 2018 – June 14, 2019Kitsap Transit November 1, 2018 – January 1, 2020Metro Transit November 29, 2018 – June 14, 2019Pierce Transit September 17, 2018 – September 22, 2019Seattle Children’s Hospital September 17, 2018 – December 31, 2019SeattleCenterMonorail May 1, 2019 – April 30, 2020The Victoria Clipper January 1, 2018 – February 28, 2019Washington State Ferries December 27, 2018 – March 30, 2019
151
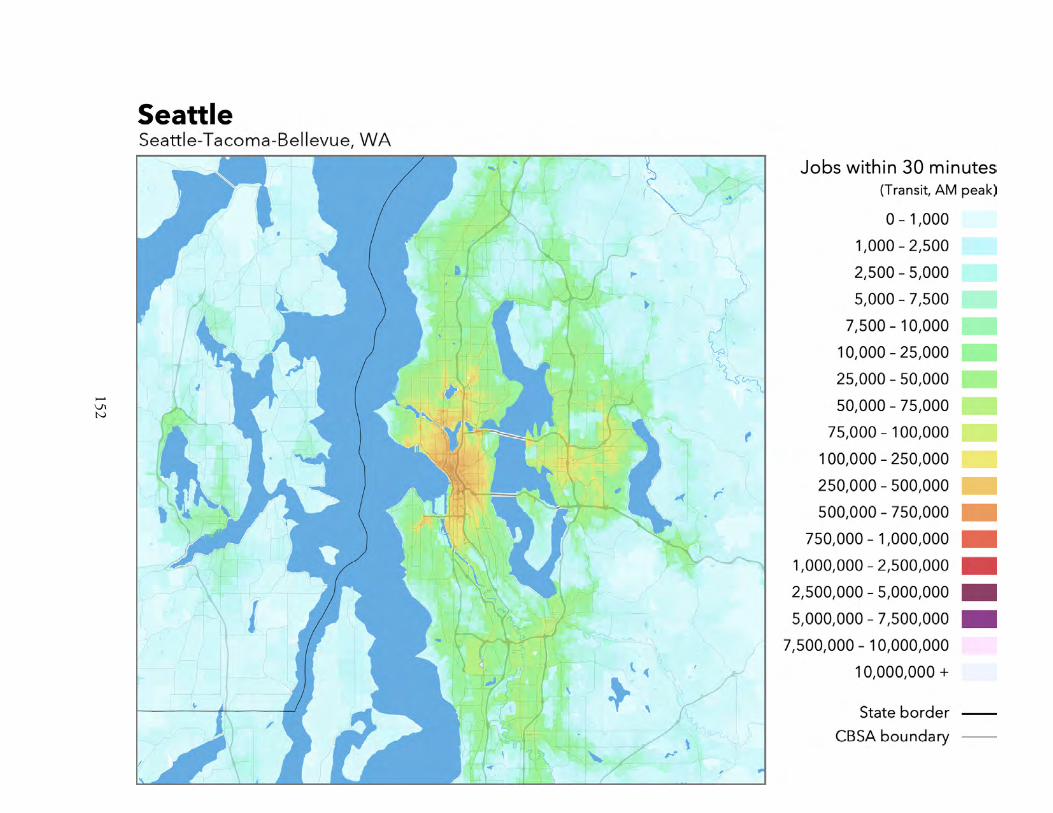
152

St. LouisSt. Louis, MO-IL
Rank by Weighted Accessibility 33Rank by Total Employment 19Rank by 1-Year Change in Weighted Accessibility 461-Year Change in Weighted Accessibility -3.88%1-Year Change in Weighted Accessibility Rank -1Total Jobs 1,363,165Average Job Density (per km2) 61Total Workers 1,344,165Average Worker Density (per km2) 60Job and worker totals are based on LEHD estimates and may not match other sources.
Job Accessibility by Travel Time Threshold
10 min 20 min 30 min 40 min 50 min 60 min
100,000
200,000
300,000
400,000
338 2,057 7,350 18,864 37,86764,475
1-Year Change in Weighted Accessibility by Travel Time Threshold
10 min 20 min 30 min 40 min 50 min 60 min -20,000
-10,000
0
10,000
20,000
-34 -81 -247 -789 -1,495 -2,287
153

Transit Schedules IncludedAgency DatesMadison County Transit January 13, 2019 – August 10, 2019Metro St. Louis September 10, 2018 – March 10, 2019
154
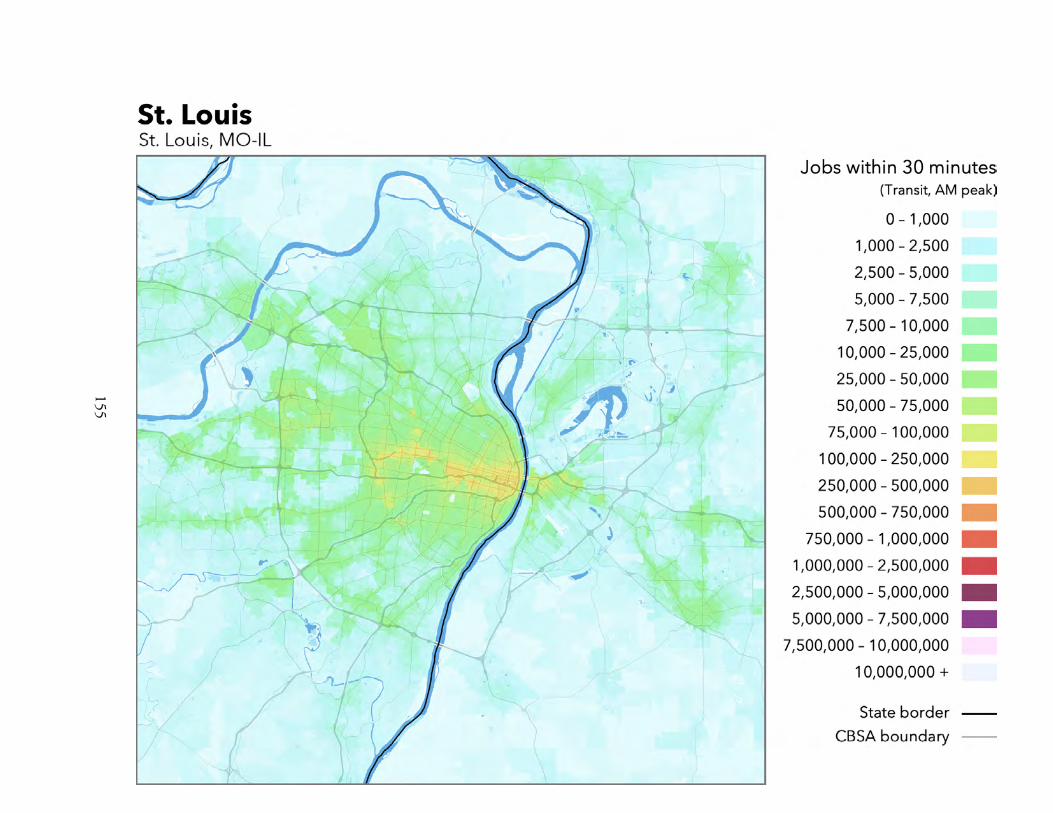
155
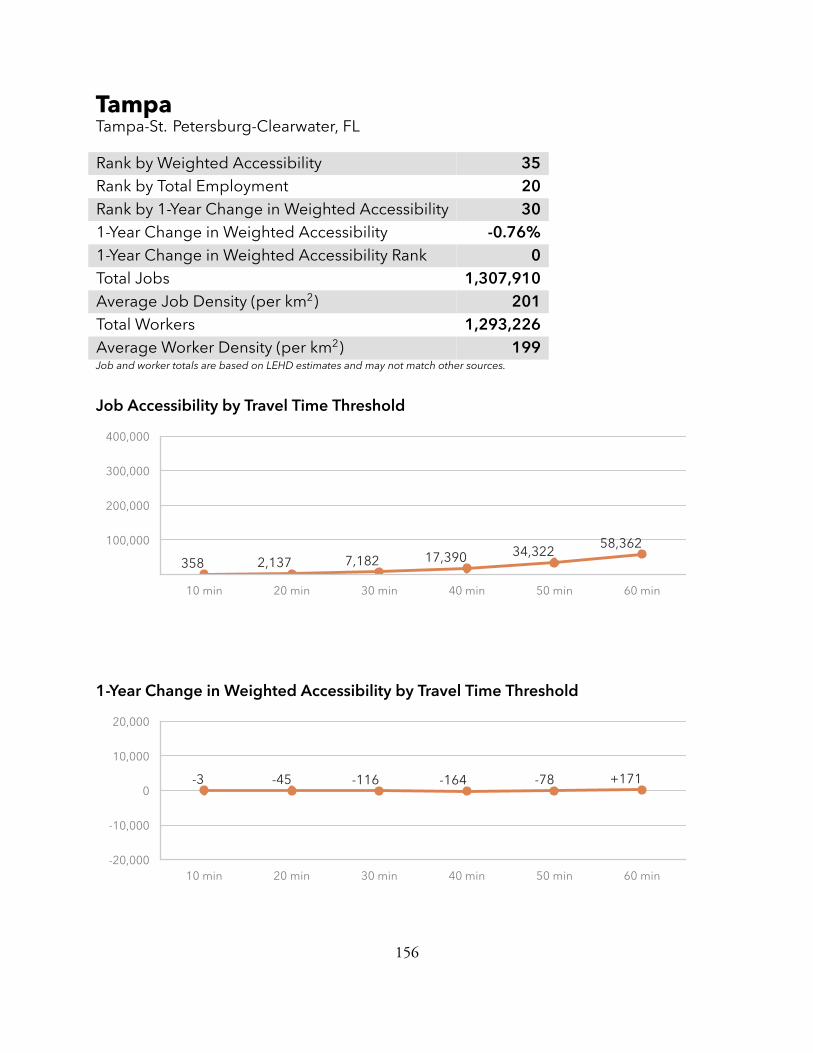
TampaTampa-St. Petersburg-Clearwater, FL
Rank by Weighted Accessibility 35Rank by Total Employment 20Rank by 1-Year Change in Weighted Accessibility 301-Year Change in Weighted Accessibility -0.76%1-Year Change in Weighted Accessibility Rank 0Total Jobs 1,307,910Average Job Density (per km2) 201Total Workers 1,293,226Average Worker Density (per km2) 199Job and worker totals are based on LEHD estimates and may not match other sources.
Job Accessibility by Travel Time Threshold
10 min 20 min 30 min 40 min 50 min 60 min
100,000
200,000
300,000
400,000
358 2,137 7,182 17,390 34,32258,362
1-Year Change in Weighted Accessibility by Travel Time Threshold
10 min 20 min 30 min 40 min 50 min 60 min -20,000
-10,000
0
10,000
20,000
-3 -45 -116 -164 -78 +171
156

Transit Schedules IncludedAgency DatesHillsborough Area Regional Transit April 21, 2018 – July 13, 2019Lakeland October 27, 2018 – September 30, 2019Manatee County Area Transit April 15, 2017 – January 1, 2020Pasco County Public Transportation December 18, 2017 – January 1, 2021Pinellas Suncoast Transit Authority October 7, 2018 – June 1, 2019The Hernando Express January 1, 2015 – January 1, 2017USF Bull Runner January 1, 2015 – December 31, 2020
157
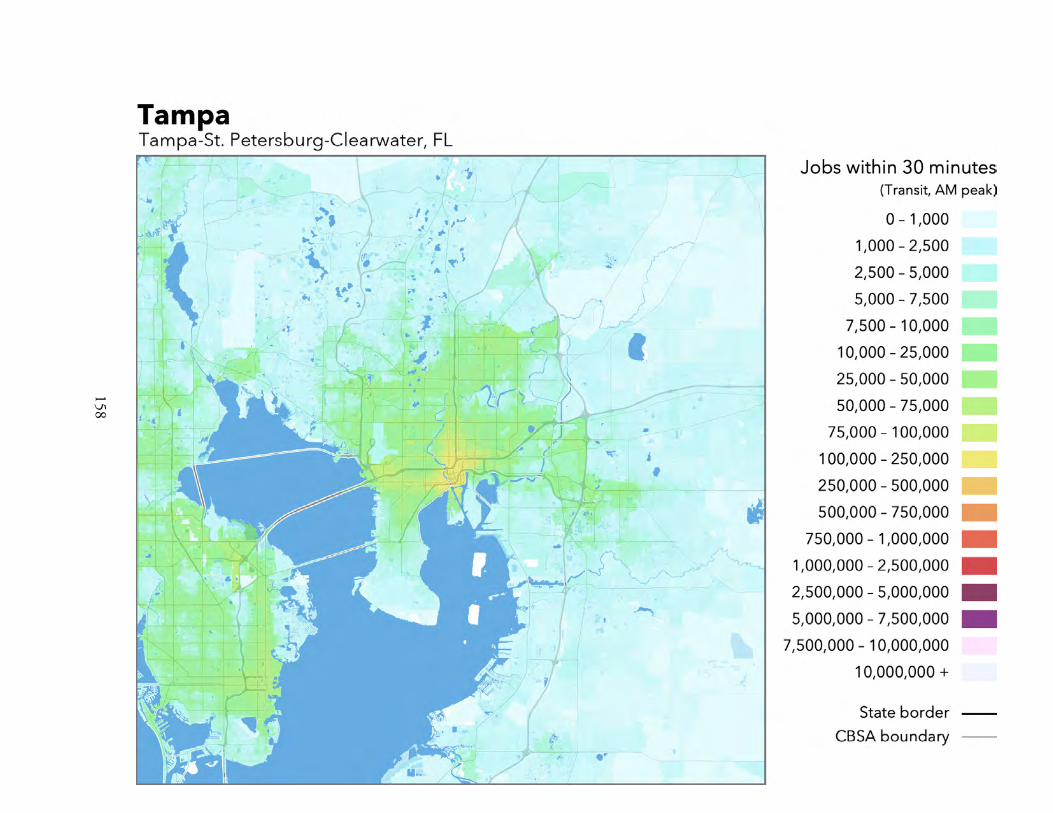
158

Virginia BeachVirginia Beach-Norfolk-Newport News, VA-NC
Rank by Weighted Accessibility 47Rank by Total Employment 39Rank by 1-Year Change in Weighted Accessibility 151-Year Change in Weighted Accessibility +1.75%1-Year Change in Weighted Accessibility Rank +1Total Jobs 711,408Average Job Density (per km2) 104Total Workers 715,637Average Worker Density (per km2) 105Job and worker totals are based on LEHD estimates and may not match other sources.
Job Accessibility by Travel Time Threshold
10 min 20 min 30 min 40 min 50 min 60 min
100,000
200,000
300,000
400,000
285 1,485 4,622 10,510 19,930 33,191
1-Year Change in Weighted Accessibility by Travel Time Threshold
10 min 20 min 30 min 40 min 50 min 60 min -20,000
-10,000
0
10,000
20,000
+7 +24 +66 +159 +368 +638
159

Transit Schedules IncludedAgency DatesHampton Roads Transit (HRT) July 15, 2018 – April 30, 2019WATA October 19, 2018 – January 19, 2019
160

161
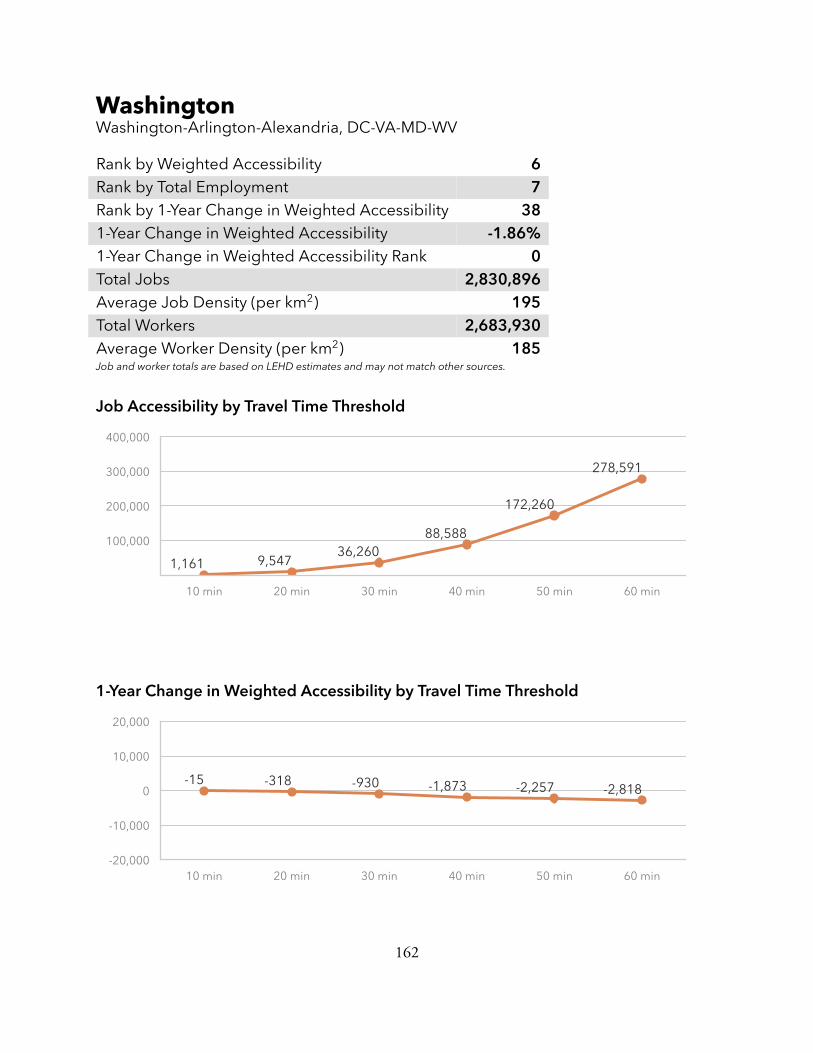
WashingtonWashington-Arlington-Alexandria, DC-VA-MD-WV
Rank by Weighted Accessibility 6Rank by Total Employment 7Rank by 1-Year Change in Weighted Accessibility 381-Year Change in Weighted Accessibility -1.86%1-Year Change in Weighted Accessibility Rank 0Total Jobs 2,830,896Average Job Density (per km2) 195Total Workers 2,683,930Average Worker Density (per km2) 185Job and worker totals are based on LEHD estimates and may not match other sources.
Job Accessibility by Travel Time Threshold
10 min 20 min 30 min 40 min 50 min 60 min
100,000
200,000
300,000
400,000
1,161 9,54736,260
88,588
172,260
278,591
1-Year Change in Weighted Accessibility by Travel Time Threshold
10 min 20 min 30 min 40 min 50 min 60 min -20,000
-10,000
0
10,000
20,000
-15 -318 -930 -1,873 -2,257 -2,818
162

Transit Schedules IncludedAgency DatesAlexandria Transit Company (DASH) March 30, 2018 – March 30, 2023Arlington Transit December 16, 2018 – December 31, 2020Calvert County Public Transportation August 1, 2014 – December 31, 2018Charles County VanGo December 24, 2017 – August 26, 2021D.C. Circulator April 1, 2019 – December 31, 2019DASH August 25, 2018 – January 31, 2019DC Streetcar December 1, 2018 – January 1, 2021Fairfax CUE January 1, 2000 – December 31, 2099Fairfax Connector December 4, 2017 – December 4, 2018Maryland Transit Administration September 2, 2018 – February 2, 2019Montgomery County MD Ride On September 17, 2017 – May 12, 2018OMNIRIDE December 17, 2018 – May 26, 2019Potomac and Rappahannock Transportation Commission December 17, 2018 – April 14, 2019Prince George’s County TheBus December 20, 2018 – December 31, 2020Regional Transportation Agency of Central Maryland May 5, 2019 – August 10, 2019St. Mary’s Transit System August 1, 2014 – December 31, 2018TransIT Services of Frederick County January 1, 2009 – May 1, 2020Virginia Railway Express January 22, 2019 – January 9, 2020WMATA November 30, 2018 – May 28, 2019
163

164

ReferencesGeurs, K. and Van Eck, J. (2001). Accessibility measures: Review and applications. Technical Report408505 006, National Institute of Public Health and the Environment.
Handy, S. L. and Niemeier, D. A. (1997). Measuring accessibility: An exploration of issues and alter-natives. Environment and planning A, 29(7):1175–1194.
Hansen, W. (1959). How accessibility shapes land use. Journal of the American Institute of Planners,25(2):73–76.
Levine, J., Grengs, J., Shen, Q., and Shen, Q. (2012). Does accessibility require density or speed? Acomparison of fast versus close in getting where you want to go in U.S. metropolitan regions. Journalof the American Planning Association, 78(2):157–172.
Levinson, D. M. (2013). Access across America. Technical Report CTS 13-20, Univer-sity of Minnesota Center for Transportation Studies, http://www.cts.umn.edu/Publications/ResearchReports/pdfdownload.pl?id=2334.
McKenzie, B. (2014). Modes less traveled — bicycling and walking to work in the United States:2008–2012. Technical Report ACS-25, U.S. Census Bureau.
Ramsey, K. and Bell, A. (2014). The smart location database: A nationwide data resource characterizingthe built environment and destination accessibility at the neighborhood scalement and destinationaccessibility at the neighborhood scale. Cityscape: A Journal of Policy Development and Research,16(2).
Tomer, A., Kneebone, E., Puentes, R., and Berube, A. (2011). Missed opportunity:Transit and jobs in metropolitan america. Technical report, Brookings Institution,http://www.brookings.edu/~/media/research/files/reports/2011/5/12%20jobs%20and%20transit/0512_jobs_transit.pdf.
Walker, J. (2012). Human Transit. Island Press.
165