Embed Size (px)
Citation preview

ACCEPTED. TO APPEAR IN IEEE TRANSACTIONS ON IMAGE PROCESSING, VOL. 16, NO. 8, AUGUST 2007. 1
Image denoising by sparse 3D transform-domaincollaborative �ltering
Kostadin Dabov, Alessandro Foi, Vladimir Katkovnik, and Karen Egiazarian, Senior Member, IEEE
Abstract�We propose a novel image denoising strategy basedon an enhanced sparse representation in transform domain. Theenhancement of the sparsity is achieved by grouping similar2D image fragments (e.g. blocks) into 3D data arrays whichwe call "groups". Collaborative �ltering is a special proceduredeveloped to deal with these 3D groups. We realize it using thethree successive steps: 3D transformation of a group, shrinkageof the transform spectrum, and inverse 3D transformation. Theresult is a 3D estimate that consists of the jointly �ltered groupedimage blocks. By attenuating the noise, the collaborative �lteringreveals even the �nest details shared by grouped blocks andat the same time it preserves the essential unique features ofeach individual block. The �ltered blocks are then returned totheir original positions. Because these blocks are overlapping,for each pixel we obtain many different estimates which need tobe combined. Aggregation is a particular averaging procedurewhich is exploited to take advantage of this redundancy. Asigni�cant improvement is obtained by a specially developedcollaborative Wiener �ltering. An algorithm based on this noveldenoising strategy and its ef�cient implementation are presentedin full detail; an extension to color-image denoising is alsodeveloped. The experimental results demonstrate that this com-putationally scalable algorithm achieves state-of-the-art denoisingperformance in terms of both peak signal-to-noise ratio andsubjective visual quality.
Index Terms�image denoising, sparsity, adaptive grouping,block-matching, 3D transform shrinkage.
I. INTRODUCTION
PLENTY of denoising methods exist, originating fromvarious disciplines such as probability theory, statistics,
partial differential equations, linear and nonlinear �ltering,spectral and multiresolution analysis. All these methods relyon some explicit or implicit assumptions about the true (noise-free) signal in order to separate it properly from the randomnoise.In particular, the transform-domain denoising methods typ-
ically assume that the true signal can be well approximatedby a linear combination of few basis elements. That is, thesignal is sparsely represented in the transform domain. Hence,by preserving the few high-magnitude transform coef�cientsthat convey mostly the true-signal energy and discarding therest which are mainly due to noise, the true signal canbe effectively estimated. The sparsity of the representationdepends on both the transform and the true-signal's properties.The multiresolution transforms can achieve good sparsity
for spatially localized details, such as edges and singularities.
This work was supported by the Academy of Finland, project No. 213462(Finnish Centre of Excellence program 2006 � 2011).All authors are with the Institute of Signal Processing, Tampere Uni-
versity of Technology, P. O. Box 553, 33101 Tampere, Finland (e-mail:�rstname.lastname@tut.�)
Because such details are typically abundant in natural imagesand convey a signi�cant portion of the information embeddedtherein, these transforms have found a signi�cant applicationfor image denoising. Recently, a number of advanced denois-ing methods based on multiresolution transforms have beendeveloped, relying on elaborate statistical dependencies be-tween coef�cients of typically overcomplete (e.g. translation-invariant and multiply-oriented) transforms. Examples of suchimage denoising methods can be seen in [1], [2], [3], [4].Not limited to the wavelet techniques, the overcomplete
representations have traditionally played an important rolein improving the restoration abilities of even the most basictransform-based methods. This is manifested by the sliding-window transform-domain image denoising methods [5], [6]where the basic idea is to apply shrinkage in local (windowed)transform domain. There, the overlap between successive win-dows accounts for the overcompleteness, while the transformitself is typically orthogonal, e.g. the 2D DCT.However, the overcompleteness by itself is not enough
to compensate for the ineffective shrinkage if the adoptedtransform cannot attain a sparse representation of certainimage details. For example, the 2D DCT is not effectivein representing sharp transitions and singularities, whereaswavelets would typically perform poorly for textures andsmooth transitions. The great variety in natural images makesimpossible for any �xed 2D transform to achieve good sparsityfor all cases. Thus, the commonly used orthogonal transformscan achieve sparse representations only for particular imagepatterns.The adaptive principal components of local image patches
was proposed by Muresan and Parks [7] as a tool to overcomethe mentioned drawbacks of standard orthogonal transforms.This approach produces good results for highly-structuredimage patterns. However, the computation of the correct PCAbasis is essentially deteriorated by the presence of noise.With similar intentions, the K-SVD algorithm [8] by Eladand Aharon utilizes highly overcomplete dictionaries obtainedvia a preliminary training procedure. A shortcoming of thesetechniques is that both the PCA and learned dictionariesimpose a very high computational burden.Another approach [9] is to exploit a shape-adaptive trans-
form on neighborhoods whose shapes are adaptive to salientimage details and thus contain mostly homogeneous signal.The shape-adaptive transform can achieve a very sparse rep-resentation of the true signal in these adaptive neighborhoods.Recently, an elaborate adaptive spatial estimation strategy,
the non-local means, was introduced [10]. This approachis different from the transform domain ones. Its basic idea
ACCEPTED. TO APPEAR IN IEEE TRANSACTIONS ON IMAGE PROCESSING, VOL. 16, NO. 8, AUGUST 2007. 2
is to build a pointwise estimate of the image where eachpixel is obtained as a weighted average of pixels centered atregions that are similar to the region centered at the estimatedpixel. The estimates are non-local as in principle the averagescan be calculated over all pixels of the image. A signi�cantextension of this approach is the exemplar-based estimator[11], which exploits pairwise hypothesis testing to de�neadaptive non-local estimation neighborhoods and achievesresults competitive to the ones produced by the best transform-based techniques.In this paper, we propose a novel image denoising strategy
based on an enhanced sparse representation in transform-domain. The enhancement of the sparsity is achieved by group-ing similar 2D fragments of the image into 3D data arrayswhich we call �groups�. Collaborative �ltering is a specialprocedure developed to deal with these 3D groups. It includesthree successive steps: 3D transformation of a group, shrinkageof transform spectrum, and inverse 3D transformation. Thus,we obtain the 3D estimate of the group which consists of anarray of jointly �ltered 2D fragments. Due to the similaritybetween the grouped blocks, the transform can achieve ahighly sparse representation of the true signal so that thenoise can be well separated by shrinkage. In this way, thecollaborative �ltering reveals even the �nest details sharedby grouped fragments and at the same time it preserves theessential unique features of each individual fragment.An image denoising algorithm based on this novel strat-
egy is developed and described in detail. It generalizesand improves our preliminary algorithm introduced in [12].A very ef�cient algorithm implementation offering effectivecomplexity/performance trade-off is developed. Experimentalresults demonstrate that it achieves outstanding denoisingperformance in terms of both peak signal-to-noise ratio andsubjective visual quality, superior to the current state-of-the-art. Extension to color-image denoising based on [13] is alsopresented.The paper is organized as follows. We introduce the group-
ing and collaborative �ltering concepts in Section II. Thedeveloped image denoising algorithm is described in SectionIII. An ef�cient and scalable realization of this algorithmcan be found in Section IV and its extension to color-imagedenoising is given in Section V. Experimental results are pre-sented in Section VI. Section VII gives an overall discussionof the developed approach and Section VIII contains relevantconclusions.
II. GROUPING AND COLLABORATIVE FILTERING
We denominate grouping the concept of collecting simi-lar d-dimensional fragments of a given signal into a d+1-dimensional data structure that we term �group�. In the caseof images for example, the signal fragments can be arbitrary2D neighborhoods (e.g. image patches or blocks). There, agroup is a 3D array formed by stacking together similar imageneighborhoods. If the neighborhoods have the same shape andsize, the formed 3D array is a generalized cylinder. The impor-tance of grouping is to enable the use of a higher-dimensional�ltering of each group, which exploits the potential similarity
(correlation, af�nity, etc.) between grouped fragments in orderto estimate the true signal in each of them. This approach wedenominate collaborative �ltering.
A. GroupingGrouping can be realized by various techniques; e.g., K-
means clustering [14], self-organizing maps [15], fuzzy clus-tering [16], vector quantization [17], and others. There exist avast literature on the topic; we refer the reader to [18] for adetailed and systematic overview of these approaches.Similarity between signal fragments is typically computed
as the inverse of some distance measure. Hence, a smallerdistance implies higher similarity. Various distance measurescan be employed, such as the `p-norm of the difference be-tween two signal fragments. Other examples are the weightedEuclidean distance (p = 2) used in the non-local meansestimator [10], and also the normalized distance used in theexemplar-based estimator [11]. When processing complex oruncertain (e.g. noisy) data it might be necessary to �rst extractsome features from the signal and then to measure the distancefor these features only [18].
B. Grouping by matchingGrouping techniques such as vector quantization or K-
means clustering are essentially based on the idea of parti-tioning. It means that they build groups or clusters (classes)which are disjoint, in such a way that each fragment belongsto one and only one group. Constructing disjoint groupswhose elements enjoy high mutual similarity typically requiresrecursive procedures and can be computationally demanding[18]. Furthermore, the partitioning causes unequal treatmentof the different fragments because the ones that are close tothe centroid of the group are better represented than those farfrom it. This happens always, even in the special case whereall fragments of the signal are equidistantly distributed.A much simpler and effective grouping of mutually sim-
ilar signal fragments can be realized by matching, wherein contrast to the above partitioning methods, the formedgroups are not necessarily disjoint. Matching is a methodfor �nding signal fragments similar to a given reference one.That is achieved by pairwise testing the similarity betweenthe reference fragment and candidate fragments located atdifferent spatial locations. The fragments whose distance (i.e.dissimilarity) from the reference one is smaller than a giventhreshold are considered mutually similar and are subsequentlygrouped. The similarity plays the role of the membershipfunction for the considered group and the reference fragmentcan be considered as some sort of �centroid� for the group.Any signal fragment can be used as a reference one and thusa group can be constructed for it.We remark that for most distance measures, establishing a
bound on the distance between the reference fragment and allof the matched ones means that the distance between any twofragments in that group is also bounded. Roughly speaking,this bound is the diameter of the group. While for an arbitrarydistance measure such a statement may not hold precisely,
ACCEPTED. TO APPEAR IN IEEE TRANSACTIONS ON IMAGE PROCESSING, VOL. 16, NO. 8, AUGUST 2007. 3
Fig. 1. Illustration of grouping blocks from noisy natural images corrupted by white Gaussian noise with standard deviation 15 and zero mean. Each fragmentshows a reference block marked with �R�and a few of the blocks matched to it.
for the case of metrics (e.g., `p-norms) it is just a directconsequence of the triangle inequality.Block-matching (BM) is a particular matching approach
that has been extensively used for motion estimation in videocompression (MPEG 1, 2, and 4, and H.26x). As a particularway of grouping, it is used to �nd similar blocks, whichare then stacked together in a 3D array (i.e. a group). Anillustrative example of grouping by block-matching for imagesis given in Figure 1, where we show a few reference blocksand the ones matched as similar to them.
C. Collaborative �lteringGiven a group of n fragments, the collaborative �ltering of
the group produces n estimates, one for each of the groupedfragments. In general, these estimates can be different. Theterm �collaborative� is taken literally, in the sense that eachgrouped fragment collaborates for the �ltering of all others,and vice versa.Let us consider an illustrative example of collaborative
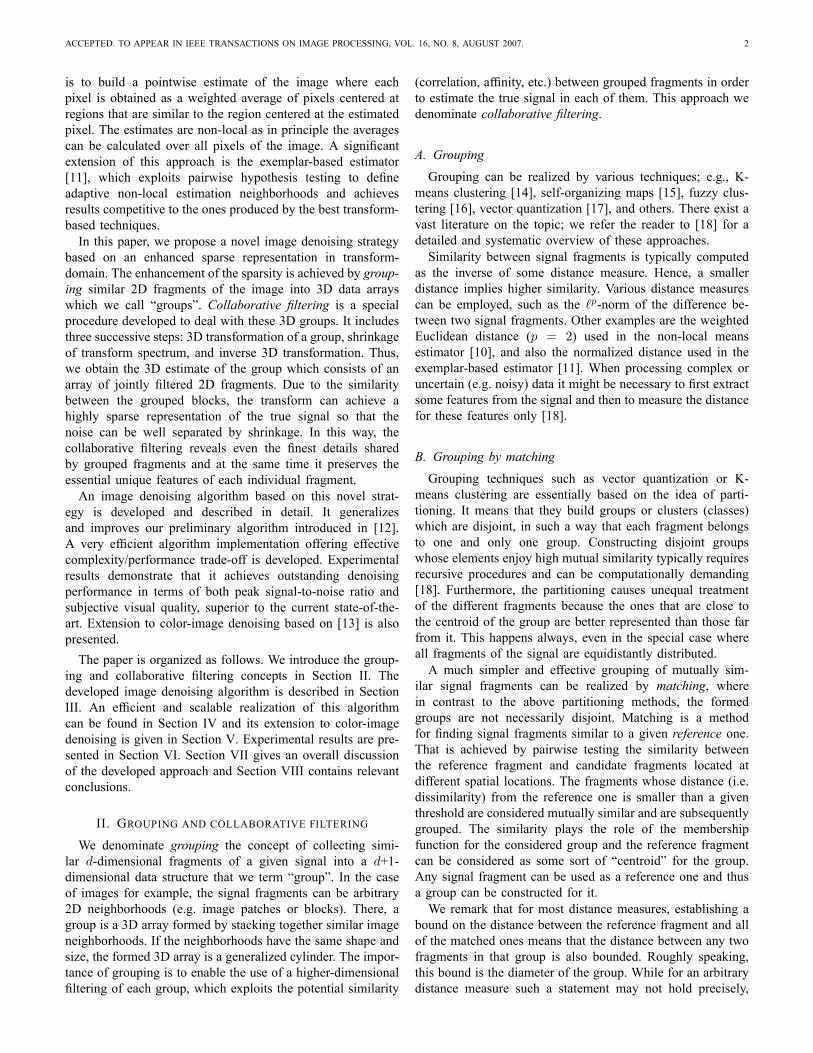
�ltering for the estimation of the image in Figure 2 froman observation (not shown) corrupted by additive zero-meanindependent noise. In particular, let us focus on the alreadygrouped blocks shown in the same �gure. These blocksexhibit perfect mutual similarity, which makes the elementwiseaveraging (i.e. averaging between pixels at the same relativepositions) a suitable estimator. Hence, for each group, this col-laborative averaging produces estimates of all grouped blocks.Because the corresponding noise-free blocks are assumed tobe identical, the estimates are unbiased. Therefore, the �nalestimation error is due only to the residual variance which isinversely proportional to the number of blocks in the group.Regardless of how complex the signal fragments are, we canobtain very good estimates provided that the groups contain alarge number of fragments.However, perfectly identical blocks are unlikely in natural
images. If non-identical fragments are allowed within thesame group, the estimates obtained by elementwise averagingbecome biased. The bias error can account for the largest share
Fig. 2. A simple example of grouping in an arti�cial image, where for eachreference block (with thick borders) there exist perfectly similar ones.
of the overall �nal error in the estimates, unless one uses anestimator that allows for producing a different estimate of eachgrouped fragment. Therefore, a more effective collaborative�ltering strategy than averaging should be employed.
D. Collaborative �ltering by shrinkage in transform domainAn effective collaborative �ltering can be realized as shrink-
age in transform domain. Assuming d+1-dimensional groupsof similar signal fragments are already formed, the collabora-tive shrinkage comprises of the following steps.� Apply a d+1-dimensional linear transform to the group.� Shrink (e.g. by soft- and hard-thresholding or Wiener�ltering) the transform coef�cients to attenuate the noise.
� Invert the linear transform to produce estimates of allgrouped fragments.
This collaborative transform-domain shrinkage can be par-ticularly effective when applied to groups of natural imagefragments, e.g. the ones in Figure 1. These groups are char-acterized by both:� intra-fragment correlation which appears between thepixels of each grouped fragment � a peculiarity of naturalimages;
� inter-fragment correlation which appears between thecorresponding pixels of different fragments � a result of
ACCEPTED. TO APPEAR IN IEEE TRANSACTIONS ON IMAGE PROCESSING, VOL. 16, NO. 8, AUGUST 2007. 4
the similarity between grouped fragments.The 3D transform can take advantage of both kinds of cor-relation and thus produce a sparse representation of the truesignal in the group. This sparsity makes the shrinkage veryeffective in attenuating the noise while preserving the featuresof the signal.Let us give a simple illustration of the bene�t of this
collaborative shrinkage by considering the grouped imageblocks shown in Figure 1. Let us �rst consider the casewhen no collaborative �ltering is performed but instead a 2Dtransform is applied separately to each individual block in agiven group of n fragments. Since these grouped blocks arevery similar, for any of them we should get approximatelythe same number, say �, of signi�cant transform coef�cients.It means that the whole group of n fragments is representedby n� coef�cients. In contrast, in the case of collaborative�ltering, in addition to the 2D transform, we apply a 1Dtransform across the grouped blocks (equivalent to applyinga separable 3D transform to the whole group). If this 1Dtransform has a DC-basis element, then because of the highsimilarity between the blocks, there are approximately1 only �signi�cant coef�cients that represent the whole group insteadof n�. Hence, the grouping enhances the sparsity, whichincreases with the number of grouped blocks.
As Figure 1 demonstrates, a strong similarity between smallimage blocks at different spatial locations is indeed verycommon in natural images. It is a characteristic of blocksthat belong to uniform areas, edges, textures, smooth intensitygradients, etc. Therefore, the existence of mutually similarblocks can be taken as a very realistic assumption whenmodeling natural images, which strongly motivates the useof grouping and collaborative �ltering for an image denoisingalgorithm.
III. ALGORITHM
In the proposed algorithm, the grouping is realized by block-matching and the collaborative �ltering is accomplished byshrinkage in a 3D transform domain. The used image frag-ments are square blocks of �xed size. The general procedurecarried out in the algorithm is as follows. The input noisyimage is processed by successively extracting reference blocksfrom it and for each such block:� �nd blocks that are similar to the reference one (block-matching) and stack them together to form a 3D array(group);
� perform collaborative �ltering of the group and returnthe obtained 2D estimates of all grouped blocks to theiroriginal locations.
After processing all reference blocks, the obtained blockestimates can overlap and thus there are multiple estimates foreach pixel. We aggregate these estimates to form an estimateof the whole image.
1This is just a qualitative statement because the actual number of signi�cantcoef�cients depends on the normalization of the transforms and on thethresholds used for the 2D and 3D cases.
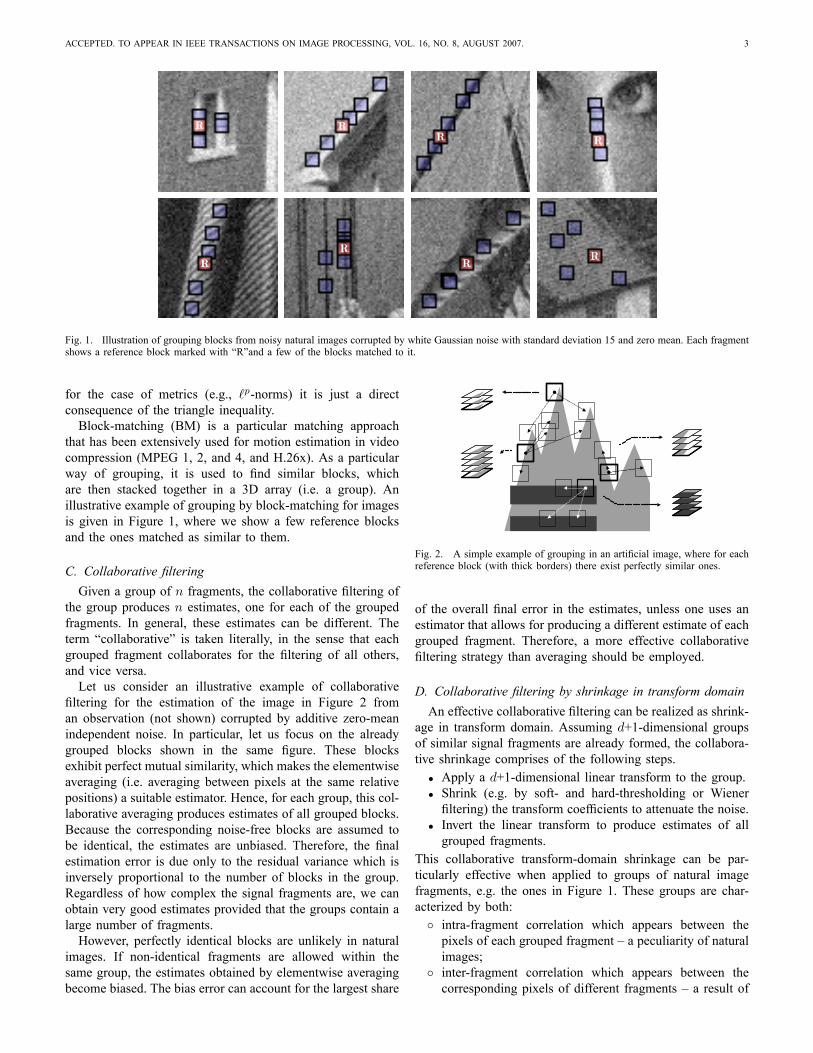
This general procedure is implemented in two differentforms to compose a two-step algorithm. This algorithm isillustrated in Figure 3 and proceeds as follows:Step 1. Basic estimate.
a) Block-wise estimates. For each block in the noisyimage, do the following.i) Grouping. Find blocks that are similar to thecurrently processed one and then stack themtogether in a 3D array (group).
ii) Collaborative hard-thresholding. Apply a 3Dtransform to the formed group, attenuate thenoise by hard-thresholding of the transformcoef�cients, invert the 3D transform to produceestimates of all grouped blocks, and returnthe estimates of the blocks to their originalpositions.
b) Aggregation. Compute the basic estimate of thetrue-image by weighted averaging all of the ob-tained block-wise estimates that are overlapping.
Step 2. Final estimate: using the basic estimate, perform im-proved grouping and collaborative Wiener �ltering.a) Block-wise estimates. For each block, do the fol-lowing.i) Grouping. Use BM within the basic estimate to�nd the locations of the blocks similar to thecurrently processed one. Using these locations,form two groups (3D arrays), one from thenoisy image and one from the basic estimate.
ii) Collaborative Wiener �ltering. Apply a 3Dtransform on both groups. Perform Wiener�ltering on the noisy one using the energyspectrum of the basic estimate as the true(pilot) energy spectrum. Produce estimates ofall grouped blocks by applying the inverse 3Dtransform on the �ltered coef�cients and returnthe estimates of the blocks to their originalpositions.
b) Aggregation. Compute a �nal estimate of the true-image by aggregating all of the obtained localestimates using a weighted average.
There are two signi�cant motivations for the second step inthe above algorithm:� using the basic estimate instead of the noisy image allowsto improve the grouping by block-matching;
� using the basic estimate as the pilot signal for the empir-ical Wiener �ltering is much more effective and accuratethan the simple hard-thresholding of the 3D spectrum ofthe noisy data.
Observation model and notationWe consider a noisy image z : X ! R of the form
z (x) = y (x) + � (x) , x 2 X ,
where x is a 2D spatial coordinate that belongs to the imagedomain X � Z2, y is the true image, and � is i.i.d. zero-mean Gaussian noise with variance �2, � (�) � N
�0; �2
�.
ACCEPTED. TO APPEAR IN IEEE TRANSACTIONS ON IMAGE PROCESSING, VOL. 16, NO. 8, AUGUST 2007. 5
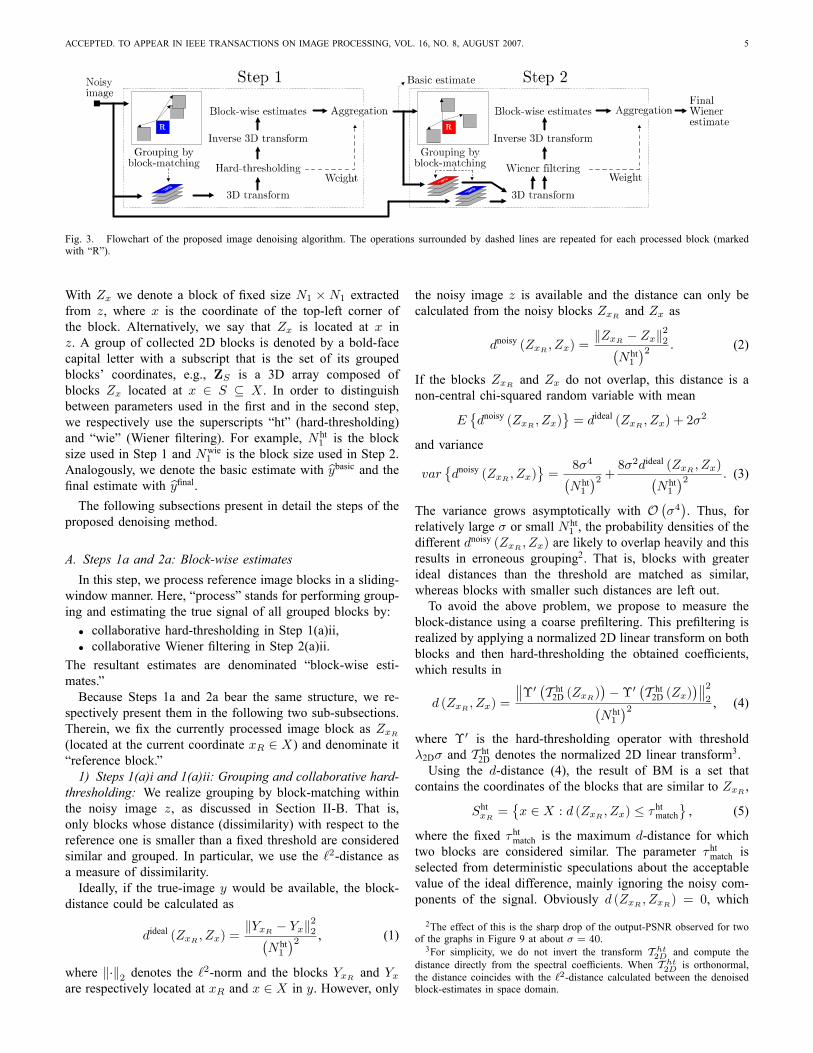
Fig. 3. Flowchart of the proposed image denoising algorithm. The operations surrounded by dashed lines are repeated for each processed block (markedwith �R�).
With Zx we denote a block of �xed size N1 � N1 extractedfrom z, where x is the coordinate of the top-left corner ofthe block. Alternatively, we say that Zx is located at x inz. A group of collected 2D blocks is denoted by a bold-facecapital letter with a subscript that is the set of its groupedblocks' coordinates, e.g., ZS is a 3D array composed ofblocks Zx located at x 2 S � X . In order to distinguishbetween parameters used in the �rst and in the second step,we respectively use the superscripts �ht� (hard-thresholding)and �wie� (Wiener �ltering). For example, N ht
1 is the blocksize used in Step 1 and Nwie
1 is the block size used in Step 2.Analogously, we denote the basic estimate with bybasic and the�nal estimate with by�nal.The following subsections present in detail the steps of the
proposed denoising method.
A. Steps 1a and 2a: Block-wise estimatesIn this step, we process reference image blocks in a sliding-
window manner. Here, �process� stands for performing group-ing and estimating the true signal of all grouped blocks by:� collaborative hard-thresholding in Step 1(a)ii,� collaborative Wiener �ltering in Step 2(a)ii.
The resultant estimates are denominated �block-wise esti-mates.�Because Steps 1a and 2a bear the same structure, we re-
spectively present them in the following two sub-subsections.Therein, we �x the currently processed image block as ZxR(located at the current coordinate xR 2 X) and denominate it�reference block.�1) Steps 1(a)i and 1(a)ii: Grouping and collaborative hard-
thresholding: We realize grouping by block-matching withinthe noisy image z, as discussed in Section II-B. That is,only blocks whose distance (dissimilarity) with respect to thereference one is smaller than a �xed threshold are consideredsimilar and grouped. In particular, we use the `2-distance asa measure of dissimilarity.Ideally, if the true-image y would be available, the block-
distance could be calculated as
dideal (ZxR ; Zx) =kYxR � Yxk
22�
N ht1
�2 , (1)
where k�k2 denotes the `2-norm and the blocks YxR and Yxare respectively located at xR and x 2 X in y. However, only
the noisy image z is available and the distance can only becalculated from the noisy blocks ZxR and Zx as
dnoisy (ZxR ; Zx) =kZxR � Zxk
22�
N ht1
�2 : (2)
If the blocks ZxR and Zx do not overlap, this distance is anon-central chi-squared random variable with mean
E�dnoisy (ZxR ; Zx)
= dideal (ZxR ; Zx) + 2�
2
and variance
var�dnoisy (ZxR ; Zx)
=
8�4�N ht1
�2 + 8�2dideal (ZxR ; Zx)�N ht1
�2 : (3)
The variance grows asymptotically with O��4�. Thus, for
relatively large � or small N ht1 , the probability densities of the
different dnoisy (ZxR ; Zx) are likely to overlap heavily and thisresults in erroneous grouping2. That is, blocks with greaterideal distances than the threshold are matched as similar,whereas blocks with smaller such distances are left out.To avoid the above problem, we propose to measure the
block-distance using a coarse pre�ltering. This pre�ltering isrealized by applying a normalized 2D linear transform on bothblocks and then hard-thresholding the obtained coef�cients,which results in
d (ZxR ; Zx) =
�0 �T ht2D (ZxR)���0 �T ht2D (Zx)� 22�N ht1
�2 , (4)
where �0 is the hard-thresholding operator with threshold�2D� and T ht2D denotes the normalized 2D linear transform3.Using the d-distance (4), the result of BM is a set that
contains the coordinates of the blocks that are similar to ZxR ,
ShtxR =�x 2 X : d (ZxR ; Zx) � � htmatch
, (5)
where the �xed � htmatch is the maximum d-distance for whichtwo blocks are considered similar. The parameter � htmatch isselected from deterministic speculations about the acceptablevalue of the ideal difference, mainly ignoring the noisy com-ponents of the signal. Obviously d (ZxR ; ZxR) = 0, which
2The effect of this is the sharp drop of the output-PSNR observed for twoof the graphs in Figure 9 at about � = 40.3For simplicity, we do not invert the transform T ht2D and compute the
distance directly from the spectral coef�cients. When T ht2D is orthonormal,the distance coincides with the `2-distance calculated between the denoisedblock-estimates in space domain.

ACCEPTED. TO APPEAR IN IEEE TRANSACTIONS ON IMAGE PROCESSING, VOL. 16, NO. 8, AUGUST 2007. 6
implies that��ShtxR �� � 1, where
��ShtxR �� denotes the cardinalityof ShtxR . After obtaining S
htxR , a group is formed by stacking
the matched noisy blocks Zx2ShtxR to form a 3D array of sizeN ht1 �N ht
1 ���ShtxR ��, which we denote ZShtxR . The matched blocks
can in general overlap. We do not restrict the ordering, whichis discussed in Section IV-B.The collaborative �ltering of ZShtxR is realized by hard-
thresholding in 3D transform domain. The adopted normalized3D linear transform, denoted T ht3D, is expected to take advan-tage of the two types of correlation, discussed in Section II-D,and attain good sparsity for the true signal group YShtxR
. Thisallows for effective noise attenuation by hard-thresholding,followed by inverse transform that yields a 3D array of block-wise estimatesbYht
ShtxR= T ht
�1
3D
���T ht3D
�ZShtxR
���, (6)
where � is a hard-threshold operator with threshold �3D�. Thearray bYht
ShtxRcomprises of
��ShtxR �� stacked block-wise estimatesbY ht,xRx , 8x 2 ShtxR . In bY ht,xRx , the subscript x denotes thelocation of this block-estimate and the superscript xR indicatesthe reference block.2) Steps 2(a)i and 2(a)ii: Grouping and collaborative
Wiener �ltering: Given the basic estimate bybasic of the trueimage obtained in Step 1b, the denoising can be improved byperforming grouping within this basic estimate and collabora-tive empirical Wiener �ltering.Because the noise in bybasic is assumed to be signi�cantly
attenuated, we replace the thresholding-based d-distance (4)with the normalized squared `2-distance computed within thebasic estimate. This is a close approximation of the idealdistance (1). Hence, the coordinates of the matched blocksare the elements of the set
SwiexR =
8><>:x 2 X :
bY basicxR � bY basicx
22�
Nwie1
�2 < �wiematch
9>=>; . (7)
We use the set SwiexR in order to form two groups, one from thebasic estimate and one from the noisy observation:� bYbasic
SwiexRby stacking together the basic estimate blocksbY basicx2SwiexR;
� ZSwiexRby stacking together the noisy blocks Zx2SwiexR .
We de�ne the empirical Wiener shrinkage coef�cients fromthe energy of the 3D transform coef�cients of the basicestimate group as
WSwiexR=
���T wie3D
�bYbasicSwiexR
����2���T wie3D
�bYbasicSwiexR
����2 + �2 . (8)
Then the collaborative Wiener �ltering of ZSwiexR is realizedas the element-by-element multiplication of the 3D transformcoef�cients T wie3D
�ZSwiexR
�of the noisy data with the Wiener
shrinkage coef�cientsWSwiexR. Subsequently, the inverse trans-
form T wie�13D produces the group of estimatesbYwieSwiexR
= T wie�1
3D
�WSwiexR
T wie3D
�ZSwiexR
��. (9)
This group comprises of the block-wise estimates bY wie;xRx
located at the matched locations x 2 SwiexR .
B. Steps 1b and 2b: Global estimate by aggregationEach collection of block-wise estimates bY ht,xR
x2ShtxRandbY wie,xR
x2SwiexR, 8xR 2 X , obtained respectively in Steps 1a and 2a,
is an overcomplete representation of the true-image becausein general the block-wise estimates can overlap. In addition,more than one block-estimate can be located at exactly thesame coordinate, e.g. bY ht,xaxb
and bY ht,xbxbare both located at xb
but obtained while processing the reference blocks at xa andxb, respectively. One can expect substantially overcompleterepresentation of the signal in regions where there are plentyof overlapping block-wise estimates, i.e. where a block ismatched (similar) to many others. Hence, the redundancy ofthe method depends on the grouping and therefore also on theparticular image.To compute the basic and the �nal estimates of the true-
image in Steps 1b and 2b, respectively, we aggregate the cor-responding block-wise estimates bY ht,xR
x2ShtxRand bY wie,xR
x2SwiexR, 8xR 2
X . This aggregation is performed by a weighted averagingat those pixel positions where there are overlapping block-wise estimates. The selection of weights is discussed in thefollowing sub-section.1) Aggregation weights: In general, the block-wise esti-
mates are statistically correlated, biased, and have differentvariance for each pixel. However, it is quite demanding to takeinto consideration all these effects. Similarly to [6] and [9],we found that a satisfactory choice for aggregation weightswould be ones that are inversely proportional to the total sam-ple variance of the corresponding block-wise estimates. Thatis, noisier block-wise estimates should be awarded smallerweights. If the additive noise in the groups ZShtxR and ZSwiexRis independent, the total sample variance in the correspondinggroups of estimates (6) and (9) is respectively equal to �2NxR
har
and �2 WSwiexR
22, where NxR
har is the number of retained (non-zero) coef�cients after hard-thresholding and WSwiexR
are theWiener �lter coef�cients (8). Based on this, in Step 1b foreach xR 2 X , we assign the weight
whtxR =
(1
�2NxRhar; if NxR
har � 11; otherwise
(10)
for the group of estimates bY ht,xRx2ShtxR
. Similarly, in Step 2b foreach xR 2 X , we assign the weight
wwiexR = ��2 WSwiexR
�22, (11)
for the group of estimates bY wie,xRx2SwiexR
.We remark that independence of the noise in a group is
only achieved when the noisy blocks that build this groupdo not overlap each other. Therefore, on the one hand, thecost of ensuring independence would constitute a severerestriction for the BM, i.e. allowing matching only among non-overlapping blocks. On the other hand, if the possible overlapsare considered, the computation of the individual variance of

ACCEPTED. TO APPEAR IN IEEE TRANSACTIONS ON IMAGE PROCESSING, VOL. 16, NO. 8, AUGUST 2007. 7
each transform coef�cient in T ht3D�ZShtxR
�or T wie3D
�ZSwiexR
�be-
comes a prohibitive complication that requires considering thecovariance terms in the corresponding transform coef�cients.In our algorithm we use overlapping blocks but do not considerthe covariances. Hence, the proposed weights (10) and (11) areonly loosely inversely proportional to the corresponding totalsample variances.2) Aggregation by weighted average: The global basic
estimate bybasic is computed by a weighted average of the block-wise estimates bY ht,xR
x2ShtxRobtained in Step 1a, using the weights
whtxR de�ned in (10), i.e.
bybasic (x) =P
xR2X
Pxm2ShtxR
whtxRbY ht,xRxm (x)P
xR2X
Pxm2ShtxR
whtxR�xm (x);8x 2 X; (12)
where �xm : X ! f0; 1g is the characteristic function ofthe square support of a block located at xm 2 X , and theblock-wise estimates bY ht,xRxm are zero-padded outside of theirsupport.The global �nal estimate by�nal is computed by (12), wherebybasic, bY ht,xRxm , ShtxR , and w
htxR are replaced respectively by by�nal,bY wie,xRxm , SwiexR , and w
wiexR .
IV. FAST AND EFFICIENT REALIZATIONA straightforward implementation of the method presented
in the previous section is highly computationally demanding.In order to realize a practical and ef�cient algorithm, weimpose constraints and exploit certain expedients which wepresent in the following list.Reduce the number of processed blocks.� Rather than sliding by one pixel to every next referenceblock, use a step of Nstep 2 N pixels in both horizontaland vertical directions. Hence, the number of referenceblocks is decreased from approximately jXj to jXj
N2step.
Reduce the complexity of grouping.� Restrict the maximum size of a group by setting an upperbound N2 2 N on the number of grouped blocks; i.e.ensuring jSxR2X j � N2.
� Search for candidate matching blocks in a local neigh-borhood of restricted size NS � NS centered about thecurrently processed coordinate xR 2 X .
� To further speed-up the BM, we use predictive search,i.e. the search neighborhoods are non-rectangular anddepend on the previously matched blocks. We form sucha neighborhood as the union of NPR � NPR (whereNPR � NS) ones centered at the previous matchedcoordinates correspondingly shifted by Nstep in the direc-tion of processing the image, e.g. in horizontal directionfor raster scan. For every NFS-th processed block, wenevertheless perform an exhaustive-search BM in thelarger NS � NS neighborhood. In particular, NFS = 1implies that only exhaustive-search in NS �NS is used.
Reduce the complexity of applying transforms.� Restrict the transforms T ht3D and T wie3D to the class ofseparable transforms and use respectively T ht2D and T wie2D
across the matched blocks and a 1D transform, T1D, alongthe third dimension of a group, along which the blocksare stacked.
� The spectra T ht2D (Zx), T wie2D (Zx), and T wie2D
�bY basicx
�are
pre-computed for each block in a neighborhood NS�NSaround the currently processed coordinate. Later, theseare reused for subsequent reference blocks whose NS �NS neighborhoods overlap the current one. Thus, thesetransforms are computed exactly once for each processedcoordinate; e.g. they are not re-computed each time in(4). In addition, in (6), (8), and (9), we compute theforward T ht3D and T wie3D transforms simply by applying T1Dacross pre-computed T ht2D- and T wie2D -transformed blocks,respectively.
Realize ef�ciently the aggregation.� First, in Steps 1(a)ii and 2(a)ii, the obtained block-wiseestimates are weighted and accumulating in a buffer (withthe size of the image). At the same time, the correspond-ing weights are accumulated at the same locations inanother buffer. Then, in Steps 1b and 2b, the aggregation(12) is �nally realized by a simple element-wise divisionbetween the two buffers.
Reduce the border effects.� Use a N1�N1 Kaiser window (with parameter �) as partof the weights in (12) in order to reduce border effectswhich can appear when certain 2D transforms (e.g. the2D DCT, the 2D DFT, or periodized wavelets) are used.
A. Complexity
The time complexity of the algorithm is O (jXj) andthus depends linearly on the size of the input image, as allparameters are �xed.Given the restrictions introduced in the previous subsection,
without exploiting predictive-search BM, the number of oper-ations per pixel is approximately
3CT2D +2�N21 +N2
�N2S
N2step
+3�N2CT2D +N2
1 CT1D�
N2step
;
where for simplicity we omit the superscripts �ht� and �wie�from the parameters/operators, and where:� the �rst addend is due to pre-computing T2D for eachsliding block (within a NS �NS neighborhood),
� the second is due to grouping by exhaustive-search BMin a NS �NS neighborhood, and
� the third addend is due to the transforms T3D that is aseparable composition of T2D and T1D.
Above, CT denotes the number of arithmetic operations re-quired for a transform T ; it depends on properties such asavailability of fast algorithms, separability, etc. For example,the DFT can be computed ef�ciently by a fast Fourier trans-form algorithm and a dyadic wavelet decomposition can berealized ef�ciently using iterated �lterbanks.By exploiting fast separable transforms and the predictive-
search BM, we can signi�cantly reduce the complexity of thealgorithm.

ACCEPTED. TO APPEAR IN IEEE TRANSACTIONS ON IMAGE PROCESSING, VOL. 16, NO. 8, AUGUST 2007. 8
TABLE IPARAMETER SETS FOR THE FAST AND NORMAL PROFILES.
Fast NormalPro�le Pro�le
� � 40 � > 40
Approx. exec. time for a256�256 grayscale image 0.7 sec 4.1 sec 5.8 secon 1.5 GHz Celeron M
T ht2D 2D-Bior1.5 2D-Bior1.5 2D-DCTNht1 8 8 12
Nht2 16 16 16
Nhtstep 6 3 4
Parameters NhtS 25 39 39
for Step 1 NhtFS 6 1 1
(ht) NhtPR 3 - -
�ht 2.0 2.0 2.0�2D 0 0 2.0�3D 2.7 2.7 2.8� htmatch 2500 2500 5000T wie2D 2D-DCT 2D-DCT 2D-DCTNwie1 8 8 11
Nwie2 16 32 32
Parameters Nwiestep 5 3 6
for Step 2 NwieS 25 39 39
(wie) NwieFS 5 1 1
NwiePR 2 - -
�wiematch 400 400 3500�wie 2.0 2.0 2.0
Common T1D 1D-Haar 1D-Haar 1D-Haar
B. Parameter selectionWe studied the proposed algorithm using various transforms
and parameters. As a results, we propose sets of parametersthat are categorized in two pro�les, �Normal� and �Fast�,presented in Table I. The main characteristics of these pro�lesare as follows.� Normal Pro�le. This pro�le offers a reasonable compro-mise between computational complexity and denoisingperformance. It is divided in two cases depending on thelevel of noise:� � 40 the noise is not too severe to affect the correctness
of the grouping, hence the thresholding in the d-distance (4) is disabled by setting �2D = 0 andrelatively small block sizes are used, N ht
1 ; Nwie1 = 8.
� > 40 corresponds to high level of noise, hence �2D = 2is used to improve the correctness of the groupingand larger block sizes are used, N ht
1 = 12 andNwie1 = 11.
� Fast Pro�le. Provides lower computational complexity atthe cost of decreased denoising performance. It exploitsthe proposed fast predictive-search BM (unlike the Nor-mal Pro�le, which uses only the exhaustive-search BM).
The bene�t of using thresholding (�2D = 2) for the d-distanceand larger block sizes when � > 40 is illustrated in Figure 9and discussed in Section VI.To show how the denoising performance depends on the
choice of the transforms T ht2D, T wie2D , and T1D, we present someexperimental results in Table II. As already stated, the 3Dtransforms T ht3D and T wie3D used in Steps 1 and 2 of our methodare formed by a separable composition of T ht2D and T wie2D ,
TABLE IIDEPENDENCY OF THE OUTPUT PSNR (DB) ON THE USED TRANSFORMS.THE COLUMNS CORRESPONDING TO T ht2D CONTAIN PSNR RESULTS OF
THE BASIC ESTIMATE bybasic AND ALL OTHER COLUMNS CONTAIN RESULTSOF THE FINAL ESTIMATE by�nal . THE NOISE IN THE OBSERVATIONS HAD
� = 25.
Transform Boats LenaT ht2D T wie2D T1D T ht2D T wie2D T1D
Haar 29.31 29.84 29.91 31.24 31.93 32.08Db2 29.22 29.83 29.90 31.19 31.97 32.06Db4 29.34 29.88 29.89 31.31 32.01 32.06Db6 29.30 29.86 29.89 31.28 31.98 32.06Bior1.3 29.42 29.87 29.90 31.35 31.96 32.06Bior1.5 29.43 29.88 29.90 31.37 31.97 32.06WHT 29.22 29.84 29.88 31.24 32.00 32.07DCT 29.35 29.91 29.88 31.42 32.08 32.07DST 29.33 29.91 29.79 31.36 31.97 31.92DC+rand 29.07 29.75 29.88 31.06 31.88 32.06DC-only - - 28.03 - - 30.65
respectively, with T1D. Furthermore, both T ht2D and T wie2D areseparable compositions of 1D transforms such as the onesspeci�ed in the table. The following normalized transformswere used in our experiment:� DST, DCT: the discrete sine and cosine transforms,� WHT: the Walsh-Hadamard transform, and� a few full dyadic wavelet decompositions using:
� Dbp: the Daubechies wavelet with p vanishing mo-ments, where p = 1; 2; 4; 6; when p = 1, it coincideswith the Haar wavelet,
� Bior1:Nr: a bi-orthogonal spline wavelet, where thevanishing moments of the decomposing and thereconstructing wavelet functions are 1 and Nr, re-spectively,
� DC+rand: an orthonormal transform that has a DC basiselement and the rest of its basis elements have randomnature, i.e. obtained by orthonormalization of realizationsof a white Gaussian process.
In addition, only for T1D, we experimented with elementwiseaveraging, i.e. preserving only the DC in the third dimension(and discarding all other transform coef�cients), hence itsname �DC-only�. For this case, all grouped blocks are esti-mated by elementwise averaging, exactly as in the illustrativeexample of Section II-C.In Table II, we present results corresponding to various T ht2D,
T wie2D , and T1D. There, the Normal Pro�le parameters wereused in all cases, where only the transform correspondingto a particular table column was changed. Boldface resultcorrespond to the best performing transform. We observe thatthe choice of T ht2D and T wie2D does not have a signi�cant impacton the denoising performance. Even the �DC+rand� transform,whose basis elements except for the DC are random, showsonly a modest PSNR decrease in the range 0.1 � 0.4 dB. Thiscan be explained by the fact that the collaborative �lteringdepends mainly on T1D for exploiting the inter-fragment cor-relation among grouped blocks. The estimation ability doesnot signi�cantly depend on the energy compaction capabilitiesof T ht2D and T wie2D . In this sense, the inter-fragment correlationappears as a much more important feature than the intra-

ACCEPTED. TO APPEAR IN IEEE TRANSACTIONS ON IMAGE PROCESSING, VOL. 16, NO. 8, AUGUST 2007. 9
fragment correlation.
Let us now focus on the results corresponding to thevarious T1D transforms in Table II. One can distinguish themoderately worse performance of the DST as compared withnot only the other standard transforms but also with the�DC+rand�. We argue that the reason for this is the lack ofDC basis element in the DST � in contrast with all othertransforms, which have this element. Why is the DC of T1Dimportant? Roughly speaking, this is so because the DC basiselement captures the similarity between elements along the 3rddimension of a group. Since the grouped blocks are similar, soare their corresponding 2D spectra and the DC terms re�ectthis similarity.
However, as it has been discussed in Section II, the existenceof perfectly matching blocks is unlikely. In order to avoidtrivial groups containing only the reference block, a strictlypositive threshold is used in Equations (5) and (7). Addition-ally, as follows from Equation (3), the accuracy of the block-distance is affected by the noise. In practice this means thatwithin a group there can be blocks for which the underlyingtrue signal Yx is much farther from YxR than � htmatch. Therefore,the sole DC element is not able to capture the potentialdifferences between grouped blocks. This is con�rmed by thepoor results of the �DC-only� for T1D. The availability ofadditional basis elements in any of the other transforms, eventhe random ones in �DC+rand�, results in big performanceimprovement over the �DC-only�.
We experimentally found that the ordering of blocks in thegroup does not have a signi�cant effect on the estimationability of the algorithm. This is con�rmed by the results ofthe �DC+rand� for T1D which achieves the same results as anyof the other (structured, non-random) orthogonal transforms.For this transform, the ordering is irrelevant for the DC andis relevant only for the other basis elements which howeverare generated randomly. Hence, we may conclude that theordering of the blocks in the groups does not in�uence the�nal results. Given this and because in our implementationthe BM already produces a collection of blocks ordered bytheir block-distance, we resort to using exactly this ordering.Naturally, �rst in a group is always the reference block as thedistance to itself is trivially equal to zero.
Note that even though a group is constructed based on thesimilarity with respect to a given reference block, this doesnot imply that this block is better represented by the groupthan any of the others. For example, it can happen that allthe matched blocks (except the reference block) are quitedissimilar from the reference one but tightly similar to eachother. Such a group could be termed as �unbalanced.�
We choose the Haar full dyadic decomposition for T1Dbecause it can be ef�ciently implemented with iterated �l-terbanks using 2-tap analysis/synthesis �lters. To apply suchan orthonormal full dyadic decomposition, the transform sizemust be a power of 2. We enforced this requirement byrestricting the number of elements of both Shtx (5) and Swiex(7) to be the largest power of 2 smaller than or equal to theoriginal number of elements in Shtx and Swiex , respectively.
V. EXTENSION TO COLOR-IMAGE DENOISING
We consider a natural RGB image with additive i.i.d. zero-mean Gaussian noise in each of its channels. Let a luminance-chrominance transformation be applied on such a noisy image,where the luminance channel is denoted with Y and thechrominance channels are denoted with U and V. Prominentexamples of such transformations are the YCbCr and theopponent color transformations, whose transform matrices arerespectively
AYCbCr=
24 0:30 0:59 0:11�0:17�0:33 0:500:50�0:42�0:08
35, Aopp=264
13
13
13
1p6
0 �1p6
13p2�p2
31
3p2
375. (13)Due to properties of the underlying natural color image, suchas high correlation between its R, G, and B channels, thefollowing observations can be made:� Y has higher SNR than U and V (decorrelation of the R,G, and B channels);
� Y contains most of the valuable information (edges,shades, objects, texture patterns, etc.);
� U and V contain mostly low-frequency information (veryoften these channels come from undersampled data);
� iso-luminant regions with variation only in U and V areunlikely.
A straightforward extension of the developed grayscaledenoising method for color-image denoising would be to applyit separately on each of the Y, U, and V channels. Thisnaive approach however would suffer from the lower SNRin the chrominances since the grouping is sensitive to thelevel of noise. Because a proper grouping is essential forthe effectiveness of our method, we propose to perform thegrouping only once for the luminance Y and reuse exactly thesame grouping when applying collaborative �ltering on thechrominances U and V. That is, the sets of grouped blocks'coordinates from Eq. (5) and (7) are found for Y, respectivelyin Steps 1(a)i and 2(a)i, and reused for both U and V; usingthese sets, the collaborative �ltering (Steps 1(a)ii and 2(a)ii)and the aggregation (Steps 1b and 2b) are performed separatelyon each of the three channels. The grouping constraint onthe chrominances is based on the assumption that if theluminances of two blocks are mutually similar, then theirchrominances are also mutually similar. Furthermore, giventhat grouping by block-matching takes approximately half ofthe execution time of the BM3D, the grouping constraintenables a computational reduction of approximately one thirdas compared to applying the grayscale BM3D separately onthe three channels.
VI. RESULTS
In this section we present and discuss the experimentalresults obtained by the developed algorithms; the grayscaleversion is denominated Block-Matching and 3D �ltering(BM3D) and the color version is accordingly abbreviatedC-BM3D. For all experiments we used the Matlab codesavailable at http://www.cs.tut.fi/~foi/GCF-BM3D. Atthis website we also provide further results and the original and

ACCEPTED. TO APPEAR IN IEEE TRANSACTIONS ON IMAGE PROCESSING, VOL. 16, NO. 8, AUGUST 2007. 10
denoised test images used in our experiments. Unless speci�edotherwise, we use the parameters of the �Normal Pro�le� fromTable I for both the BM3D and the C-BM3D.
A. Grayscale-image denoisingThe output PSNR results of the BM3D algorithm for a
standard set of grayscale images are given in Table III. ThePSNR of an estimate by of a true image y, is computedaccording to the standard formula
PSNR (by) = 10 log10
2552
jXj�1P
x2X (y (x)� by (x))2!.
In Figure 4, we compare the output PSNR results of theproposed BM3D with those of the state-of-the-art techniquesBLS-GSM [3], FSP+TUP BLS-GSM [4], exemplar-based [11],K-SVD [8], Pointwise SA-DCT [9]; for the K-SVD method[8] we report its best results, which are those obtained withan adaptive dictionary trained on the noisy image. It can beseen from the �gure that the proposed BM3D demonstrates thebest performance and uniformly outperforms all of the othertechniques. In particular, a signi�cant improvement is observedfor House and Barbara since these images contain structuredobjects (edges in House and textures in Barbara) which enablea very effective grouping and collaborative �ltering.In Figure 5, we show a noisy (� = 25) House image
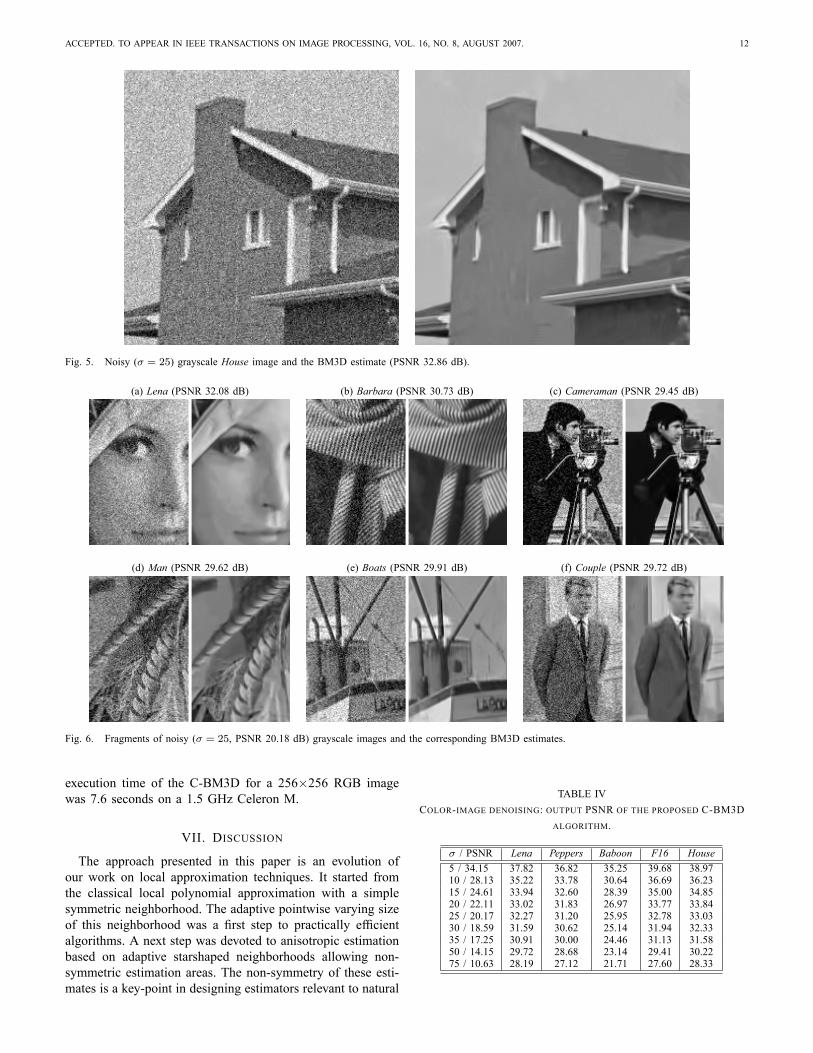
and the corresponding BM3D estimate. In this test image,similarity among neighboring blocks is easy to perceive inthe uniform regions and along the regular-shaped structures,some of which are illustrated in Figure 1. Hence, such detailsare well-preserved in the estimate.The denoising performance of the BM3D algorithm is
further illustrated in Figure 6, where we show fragments ofa few noisy (� = 25) test images and fragments of thecorresponding denoised ones. The denoised images show goodpreservation of:� uniform areas and smooth intensity transitions (cheeks ofLena, and the backgrounds of the other images),
� textures and repeating patterns (the scarf in Barbara), and� sharp edges and singularities (borders of objects in Cam-eraman and Boats).
A denoising example for an extreme level of noise such as� = 100 is shown in Figure 7. Given that the original imageis almost completely buried into noise, the produced estimateshows reasonable detail preservation. In particular, repeatedpatterns such as the stripes on the clothes are faithfullyreconstructed.Regarding the subjective visual quality, we �nd that various
image details are well preserved and at the same time veryfew artifacts are introduced; one can observe this in Figures6, 7, and 8. The state-of-the-art subjective visual quality ofour algorithm is con�rmed by the result of the psycho-visualexperiment carried out by Vansteenkiste et al. [19]. There,35 evaluators classi�ed the preliminary version [12] of theBM3D algorithm as the best among 8 evaluated state-of-the-art techniques. The criteria in this evaluation were perceivednoisiness, perceived blurriness, and overall visual quality.Furthermore, we consider the subjective visual quality of the
current BM3D algorithm to be signi�cantly better (in termsof detail preservation) than that of its preliminary versionevaluated in [19]. In Figure 8 we show images denoised bythe current and by the preliminary versions of the BM3Dalgorithm. A close inspection reveals that the images denoisedby the current BM3D have both fewer ringing artifacts andbetter preservation of details.We show the PSNR performance of the Fast and Normal
BM3D Pro�les in Figure 9. The two cases of the NormalPro�le from Table I are considered separately for � 2 [10; 75]in order to show the sharp PSNR drop of the �� � 40� graphat about � = 40 due to erroneous grouping. On the otherhand, for the �� > 40� graph, where the thresholding-basedd-distance (4) is used with a relatively large block-sizeN1, onecan observe that there is no sharp PSNR drop. It is noteworthythat for up to moderate levels of noise, such as � < 35, thePSNR difference between the Fast and the Normal Pro�lesis in the range 0.05 � 0.2 dB. This can be an acceptableprice for the 6-fold reduction of the execution time shown inTable I; more precisely, the approximate execution time (fordenoising a 256�256 image calculated on a 1.5 GHz CeleronM) decreases from 4.1 seconds for the Normal Pro�le to 0.7seconds for the Fast Pro�le. The BM3D algorithm allowsfor further complexity/performance trade-off by varying Nstep.As a rough comparison, the execution times (for denoising a256�256 image on a 1.5GHz Celeron M) of the other methodsconsidered in Figure 4 were: 22.1 seconds for the BLS-GSM,6.2 seconds for the SA-DCT �lter, 9 � 30 minutes (dependingon �) for training the adaptive K-SVD on an input noisy imageand 25 � 120 seconds to perform the �ltering using the founddictionary. The execution time of the exemplar-based methodwas reported in [11] to be about 1 minute when measured on a2 GHz Pentium IV. The execution time of the FSP+TUP BLS-GSM was not reported; however, it is a two-step BLS-GSMextension that should not be faster than the BLS-GSM.
B. Color-image denoisingWe performed experiments with the C-BM3D using the op-
ponent color space transformation (13) and the Normal Pro�lealgorithm parameters. In all experiments, we considered noisyimages with i.i.d. zero-mean Gaussian noise of variance �2in each of their R, G, and B channels. The PSNR for RGBimages is computed using the standard formula
10 log10
0B@ 2552
(3 jXj)�1P
c=R;G;B
Px2X
(yc (x)� byc (x))21CA ,
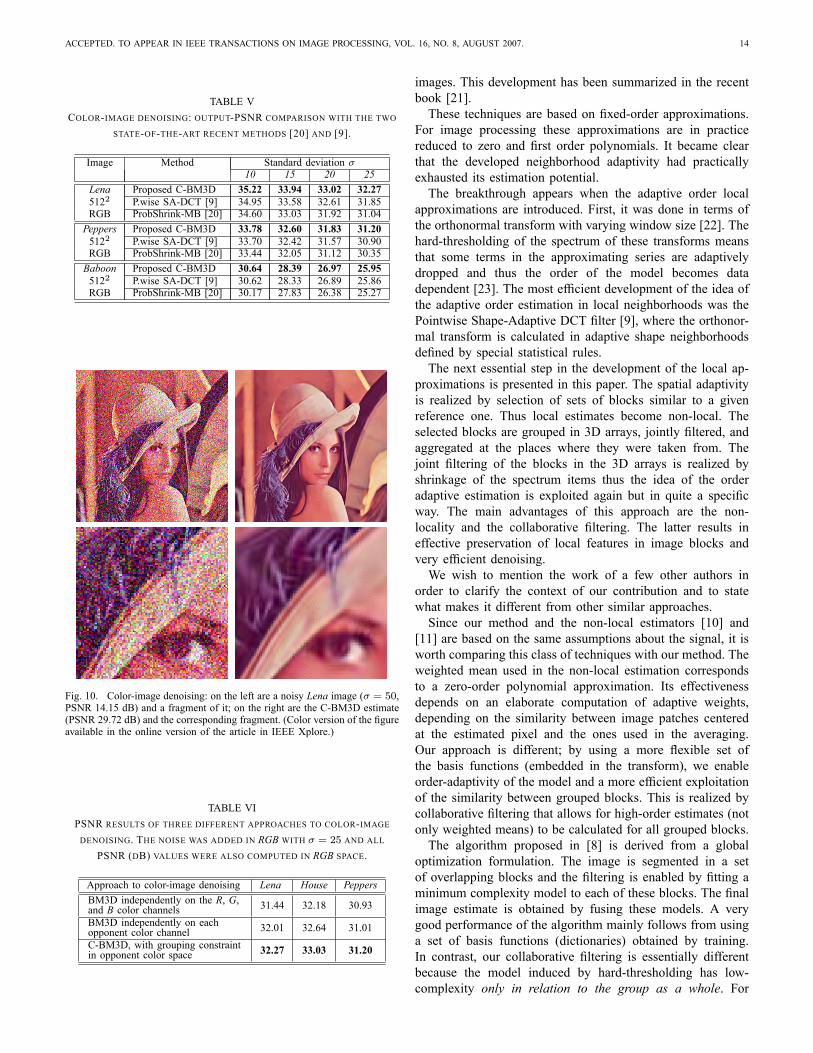
where the subscript c 2 fR;G;Bg denotes the color channel.Table IV presents the output-PSNR results of the proposedC-BM3D algorithm for a few standard test images. A com-parison with the two recent state-of-the-art methods [9], [20]is given in Table V. One can see that the proposed algorithmoutperforms them for the three test images considered there.The visual quality can be inspected from Figure 10 where anoisy (with � = 50) color Lena and the C-BM3D estimate areshown. One can observe the faithfully preserved details on thehat, the sharp edges, and the smooth regions. The approximate

ACCEPTED. TO APPEAR IN IEEE TRANSACTIONS ON IMAGE PROCESSING, VOL. 16, NO. 8, AUGUST 2007. 11
TABLE IIIGRAYSCALE-IMAGE DENOISING: OUTPUT PSNR (DB) OF THE PROPOSED BM3D ALGORITHM.
� / PSNR C.man House Peppers Montage Lena Barbara Boats F.print Man Couple Hill Lake2562 2562 2562 2562 5122 5122 5122 5122 5122 5122 5122 5122
2 / 42.11 43.96 44.63 43.48 46.47 43.59 43.66 43.18 42.90 43.61 43.17 43.04 43.025 / 34.16 38.29 39.83 38.12 41.14 38.72 38.31 37.28 36.51 37.82 37.52 37.14 36.5810 / 28.14 34.18 36.71 34.68 37.35 35.93 34.98 33.92 32.46 33.98 34.04 33.62 32.8515 / 24.61 31.91 34.94 32.70 35.15 34.27 33.11 32.14 30.28 31.93 32.11 31.86 31.0820 / 22.11 30.48 33.77 31.29 33.61 33.05 31.78 30.88 28.81 30.59 30.76 30.72 29.8725 / 20.18 29.45 32.86 30.16 32.37 32.08 30.72 29.91 27.70 29.62 29.72 29.85 28.9430 / 18.59 28.64 32.09 29.28 31.37 31.26 29.81 29.12 26.83 28.86 28.87 29.16 28.1835 / 17.25 27.93 31.38 28.52 30.46 30.56 28.98 28.43 26.09 28.22 28.15 28.56 27.5050 / 14.16 25.84 29.37 26.41 27.35 28.86 27.17 26.64 24.36 26.59 26.38 27.08 25.7875 / 10.63 24.05 27.20 24.48 25.04 27.02 25.10 24.96 22.68 25.10 24.63 25.58 24.11100 / 8.14 22.81 25.50 22.91 23.38 25.57 23.49 23.74 21.33 23.97 23.37 24.45 22.91
Barbara Lena House
10 15 20 2529
30
31
32
33
34
35
PSN
R (d
B)
10 15 20 25
32
33
34
35
36
PSN
R (d
B)
10 15 20 25
32
33
34
35
36
PSN
R (d
B)
� � �Boats Peppers Cameraman
10 15 20 25
30
31
32
33
34
PSN
R (d
B)
10 15 20 25
30
31
32
33
34
PSN
R (d
B)
10 15 20 25
29
30
31
32
33
34
PSN
R (d
B)
� � �
Fig. 4. Grayscale-image denoising: output PSNR as a function of � for the following methods: `�': proposed BM3D, `�': FSP+TUP BLS-GSM [4], `+':BLS-GSM [3], `�': exemplar-based [11], `�': K-SVD [8], `�': Pointwise SA-DCT [9]. (Note that the result of [4] for Boats and the results of [4], [11] forCameraman are missing since they were neither reported in the corresponding articles, nor were implementations of these methods publicly available.)
ACCEPTED. TO APPEAR IN IEEE TRANSACTIONS ON IMAGE PROCESSING, VOL. 16, NO. 8, AUGUST 2007. 12
Fig. 5. Noisy (� = 25) grayscale House image and the BM3D estimate (PSNR 32.86 dB).
(a) Lena (PSNR 32.08 dB) (b) Barbara (PSNR 30.73 dB) (c) Cameraman (PSNR 29.45 dB)
(d) Man (PSNR 29.62 dB) (e) Boats (PSNR 29.91 dB) (f) Couple (PSNR 29.72 dB)
Fig. 6. Fragments of noisy (� = 25, PSNR 20.18 dB) grayscale images and the corresponding BM3D estimates.
execution time of the C-BM3D for a 256�256 RGB imagewas 7.6 seconds on a 1.5 GHz Celeron M.
VII. DISCUSSION
The approach presented in this paper is an evolution ofour work on local approximation techniques. It started fromthe classical local polynomial approximation with a simplesymmetric neighborhood. The adaptive pointwise varying sizeof this neighborhood was a �rst step to practically ef�cientalgorithms. A next step was devoted to anisotropic estimationbased on adaptive starshaped neighborhoods allowing non-symmetric estimation areas. The non-symmetry of these esti-mates is a key-point in designing estimators relevant to natural
TABLE IVCOLOR-IMAGE DENOISING: OUTPUT PSNR OF THE PROPOSED C-BM3D
ALGORITHM.
� / PSNR Lena Peppers Baboon F16 House5 / 34.15 37.82 36.82 35.25 39.68 38.9710 / 28.13 35.22 33.78 30.64 36.69 36.2315 / 24.61 33.94 32.60 28.39 35.00 34.8520 / 22.11 33.02 31.83 26.97 33.77 33.8425 / 20.17 32.27 31.20 25.95 32.78 33.0330 / 18.59 31.59 30.62 25.14 31.94 32.3335 / 17.25 30.91 30.00 24.46 31.13 31.5850 / 14.15 29.72 28.68 23.14 29.41 30.2275 / 10.63 28.19 27.12 21.71 27.60 28.33

ACCEPTED. TO APPEAR IN IEEE TRANSACTIONS ON IMAGE PROCESSING, VOL. 16, NO. 8, AUGUST 2007. 13
Fig. 7. On the left: fragment of a noisy (� = 100, PSNR 8.14 dB) grayscale Barbara; on the right: the corresponding fragment of the BM3D estimate(PSNR 23.49 dB) .
BLS-GSM [3] K-SVD [8] Pointwise SA-DCT [9] Prelim. 3D-DFT BM3D [12] Proposed BM3D
PSNR 29.33 dB PSNR 29.32 dB PSNR 29.48 dB PSNR 29.68 dB PSNR 29.91 dB
PSNR 28.29 dB PSNR 28.91 dB PSNR 29.11 dB PSNR 29.08 dB PSNR 29.45 dB
Fig. 8. Fragments of the grayscale Boats (top row) and Cameraman (bottom row) denoised by (from left to right): [3], [8], [9], [12], and the proposedBM3D for noise with � = 25 (fragments of the noisy images can be seen in Figure 6).
Barbara Lena
10 20 30 40 50 60 70
23
25
27
29
31
33
35
PSN
R (d
B)
10 20 30 40 50 60 70
25
27
29
31
33
35
PSN
R (d
B)
� �
Fig. 9. Comparison between the output PSNR corresponding to the pro�les in Table I. Notation is: `�' for Fast Pro�le, `�' for the Normal Pro�le in thecase �� � 40� and `+' in the case �� > 40�; both instances of the Normal pro�le are shown for all considered values of � in the range [10; 75].
ACCEPTED. TO APPEAR IN IEEE TRANSACTIONS ON IMAGE PROCESSING, VOL. 16, NO. 8, AUGUST 2007. 14
TABLE VCOLOR-IMAGE DENOISING: OUTPUT-PSNR COMPARISON WITH THE TWO
STATE-OF-THE-ART RECENT METHODS [20] AND [9].
Image Method Standard deviation �10 15 20 25
Lena Proposed C-BM3D 35.22 33.94 33.02 32.275122 P.wise SA-DCT [9] 34.95 33.58 32.61 31.85RGB ProbShrink-MB [20] 34.60 33.03 31.92 31.04Peppers Proposed C-BM3D 33.78 32.60 31.83 31.205122 P.wise SA-DCT [9] 33.70 32.42 31.57 30.90RGB ProbShrink-MB [20] 33.44 32.05 31.12 30.35Baboon Proposed C-BM3D 30.64 28.39 26.97 25.955122 P.wise SA-DCT [9] 30.62 28.33 26.89 25.86RGB ProbShrink-MB [20] 30.17 27.83 26.38 25.27
Fig. 10. Color-image denoising: on the left are a noisy Lena image (� = 50,PSNR 14.15 dB) and a fragment of it; on the right are the C-BM3D estimate(PSNR 29.72 dB) and the corresponding fragment. (Color version of the �gureavailable in the online version of the article in IEEE Xplore.)
TABLE VIPSNR RESULTS OF THREE DIFFERENT APPROACHES TO COLOR-IMAGEDENOISING. THE NOISE WAS ADDED IN RGB WITH � = 25 AND ALL
PSNR (DB) VALUES WERE ALSO COMPUTED IN RGB SPACE.
Approach to color-image denoising Lena House PeppersBM3D independently on the R, G,and B color channels 31.44 32.18 30.93BM3D independently on eachopponent color channel 32.01 32.64 31.01C-BM3D, with grouping constraintin opponent color space 32.27 33.03 31.20
images. This development has been summarized in the recentbook [21].These techniques are based on �xed-order approximations.
For image processing these approximations are in practicereduced to zero and �rst order polynomials. It became clearthat the developed neighborhood adaptivity had practicallyexhausted its estimation potential.The breakthrough appears when the adaptive order local
approximations are introduced. First, it was done in terms ofthe orthonormal transform with varying window size [22]. Thehard-thresholding of the spectrum of these transforms meansthat some terms in the approximating series are adaptivelydropped and thus the order of the model becomes datadependent [23]. The most ef�cient development of the idea ofthe adaptive order estimation in local neighborhoods was thePointwise Shape-Adaptive DCT �lter [9], where the orthonor-mal transform is calculated in adaptive shape neighborhoodsde�ned by special statistical rules.The next essential step in the development of the local ap-
proximations is presented in this paper. The spatial adaptivityis realized by selection of sets of blocks similar to a givenreference one. Thus local estimates become non-local. Theselected blocks are grouped in 3D arrays, jointly �ltered, andaggregated at the places where they were taken from. Thejoint �ltering of the blocks in the 3D arrays is realized byshrinkage of the spectrum items thus the idea of the orderadaptive estimation is exploited again but in quite a speci�cway. The main advantages of this approach are the non-locality and the collaborative �ltering. The latter results ineffective preservation of local features in image blocks andvery ef�cient denoising.We wish to mention the work of a few other authors in
order to clarify the context of our contribution and to statewhat makes it different from other similar approaches.Since our method and the non-local estimators [10] and
[11] are based on the same assumptions about the signal, it isworth comparing this class of techniques with our method. Theweighted mean used in the non-local estimation correspondsto a zero-order polynomial approximation. Its effectivenessdepends on an elaborate computation of adaptive weights,depending on the similarity between image patches centeredat the estimated pixel and the ones used in the averaging.Our approach is different; by using a more �exible set ofthe basis functions (embedded in the transform), we enableorder-adaptivity of the model and a more ef�cient exploitationof the similarity between grouped blocks. This is realized bycollaborative �ltering that allows for high-order estimates (notonly weighted means) to be calculated for all grouped blocks.The algorithm proposed in [8] is derived from a global
optimization formulation. The image is segmented in a setof overlapping blocks and the �ltering is enabled by �tting aminimum complexity model to each of these blocks. The �nalimage estimate is obtained by fusing these models. A verygood performance of the algorithm mainly follows from usinga set of basis functions (dictionaries) obtained by training.In contrast, our collaborative �ltering is essentially differentbecause the model induced by hard-thresholding has low-complexity only in relation to the group as a whole. For
ACCEPTED. TO APPEAR IN IEEE TRANSACTIONS ON IMAGE PROCESSING, VOL. 16, NO. 8, AUGUST 2007. 15
the block-wise estimates and for the image overall, the modelcan instead be highly complex and redundant as each blockcan enter in many groups and thus can participate in manycollaborative estimates. This redundancy gives a very goodnoise attenuation and allows to avoid artifacts typical for thestandard thresholding schemes. Thus, we may say that insteadof some low-complexity modeling as in [8], we exploit speci�covercomplete representations.The collaborative Wiener �ltering used in the second step
and the aggregation of block-wise estimates using adaptiveweights are major features of our approach. The Wiener�ltering uses the power spectrum of the basic estimate to�lter the formed groups. In result, the estimation improvessigni�cantly over the hard-thresholding used in the �rst step.The improvement in PSNR can be seen from Table II (bycomparing the numbers in the column of �T ht2D� with thenumbers in any of the other two columns �T wie2D � or �T1D�);one can observe that the improvement is substantial, typicallygreater than 0.5 dB.The basis functions used in our algorithm are standard ones,
computationally ef�cient, and image independent. We believethat the proposed denoising method could be improved byusing more sophisticated bases such as adaptive PCA [7], orovercomplete learned dictionaries [8]. However, the computa-tional complexity would signi�cantly increase because thesetransforms are typically non-separable and do not have fastalgorithms. As it is shown in the previous section, even withthe currently used standard transforms, our algorithm alreadydemonstrates better performance than both [8] and [11].The proposed extension to color images is non-trivial be-
cause we do not apply the grayscale BM3D independentlyon the three luminance-chrominance channels but we imposea grouping constraint on both chrominances. The groupingconstraint means that the grouping is done only once, inthe luminance (which typically has a higher SNR than thechrominances), and exactly the same grouping is reusedfor collaborative �ltering in both chrominances. It is worthcomparing the performance of the proposed C-BM3D versusthe independent application of the grayscale BM3D on theindividual color channels. This is done in Table VI whichshows that the C-BM3D achieves 0.2 � 0.4 dB better PSNRthan the independent application of the BM3D on the opponentcolor channels and 0.3 � 0.8 dB better PSNR than theindependent application of the BM3D on the RGB channels.This improvement shows the signi�cant bene�t of using thegrouping constraint on the chrominances in the C-BM3D.We note that a similar idea of �ltering the chrominances
using information from the luminance was exploited already inthe Pointwise SA-DCT denoising method [9]. There, adaptive-shape estimation neighborhoods are determined only for Yand then reused for both U and V. The PSNR improvement(0.1 � 0.4 dB) of the proposed approach compared with [9]is consistent with the improvement between the grayscaleversions of these two methods.
VIII. CONCLUSIONSThe image modeling and estimation algorithm developed in
this paper can be interpreted as a novel approach to non-local
adaptive nonparametric �ltering. The algorithm demonstratesstate-of-the-art performance. To the best of our knowledge,the PSNR results shown in Tables III and IV are the highestfor denoising additive white Gaussian noise from grayscaleand color images, respectively. Furthermore, the algorithmachieves these results at reasonable computational cost and al-lows for effective complexity/performance trade-off, as shownin Table I.The proposed approach can be adapted to various noise
models such as additive colored noise, non-Gaussian noise,etc., by modifying the calculation of coef�cients' variances inthe basic and Wiener parts of the algorithm. In addition, thedeveloped method can be modi�ed for denoising 1D-signalsand video, for image restoration, as well as for other problemsthat can bene�t from highly sparse signal representations.
REFERENCES
[1] L. Sendur and I. W. Selesnick, �Bivariate shrinkage functions forwavelet-based denoising exploiting interscale dependency,� IEEE Trans.Signal Process., vol. 50, no. 11, pp. 2744�2756, November 2002.
[2] A. Pizurica, W. Philips, I. Lemahieu, and M. Acheroy, �A joint inter- andintrascale statistical model for Bayesian wavelet based image denoising,�IEEE Trans. Image Process., vol. 11, no. 5, pp. 545�557, May 2002.
[3] J. Portilla, V. Strela, M. Wainwright, and E. P. Simoncelli, �Imagedenoising using a scale mixture of Gaussians in the wavelet domain,�IEEE Trans. Image Process., vol. 12, no. 11, pp. 1338�1351, November2003.
[4] J. Guerrero-Colon and J. Portilla, �Two-level adaptive denoising usingGaussian scale mixtures in overcomplete oriented pyramids,� in Proc.IEEE Int. Conf. Image Process., vol. 1, Genova, Italy, September 2005.
[5] L. Yaroslavsky, K. Egiazarian, and J. Astola, �Transform domain imagerestoration methods: review, comparison and interpretation,� in Proc.Nonlinear Image Process. and Pattern Analysis XII, vol. 4304, 2001,pp. 155�169.
[6] O. Guleryuz, �Weighted overcomplete denoising,� in Proc. AsilomarConf. on Signals, Systems and Computers, vol. 2, Paci�c Grove, CA,USA, November 2003, pp. 1992�1996.
[7] D. Muresan and T. Parks, �Adaptive principal components and imagedenoising,� in Proc. IEEE Int. Conf. Image Process., vol. 1, September2003.
[8] M. Elad and M. Aharon, �Image denoising via sparse and redundant rep-resentations over learned dictionaries,� IEEE Trans. on Image Process.,vol. 15, no. 12, pp. 3736�3745, December 2006.
[9] A. Foi, V. Katkovnik, and K. Egiazarian, �Pointwise shape-adaptiveDCT for high-quality denoising and deblocking of grayscale and colorimages,� IEEE Trans. Image Process., vol. 16, no. 5, May 2007.
[10] A. Buades, B. Coll, and J. M. Morel, �A review of image denoisingalgorithms, with a new one,� Multisc. Model. Simulat., vol. 4, no. 2, pp.490�530, 2005.
[11] C. Kervrann and J. Boulanger, �Optimal spatial adaptation for patch-based image denoising,� IEEE Trans. Image Process., vol. 15, no. 10,pp. 2866�2878, October 2006.
[12] K. Dabov, A. Foi, V. Katkovnik, and K. Egiazarian, �Image denoisingwith block-matching and 3D �ltering,� in Proc. SPIE Electronic Imag-ing: Algorithms and Systems V, vol. 6064A-30, San Jose, CA, USA,January 2006.
[13] ��, �Color image denoising via sparse 3D collaborative �ltering withgrouping constraint in luminance-chrominance space,� in IEEE Int. Conf.Image Process., San Antonio, Texas, September 2007, accepted.
[14] J. B. MacQueen, �Some methods for classi�cation and analysis ofmultivariate observations,� in Proc. Berkeley Symp. Math. Stat. Probab.,Berkeley, 1967, pp. 281�297.
[15] T. Kohonen, Self-Organizing Maps, 2nd ed., ser. Information Sciences.Springer, Heidelberg, 1997, vol. 30.
[16] F. Höppner, F. Klawonn, R. Kruse, and T. Runkler, Fuzzy ClusterAnalysis. Wiley, Chichester, 1999.
[17] A. Gersho, �On the structure of vector quantizers,� IEEE Trans. Inf.Theory, vol. 28, no. 2, pp. 157�166, 1982.
[18] A. K. Jain, M. N. Murty, and P. J. Flynn, �Data clustering: A review,�ACM Computing Surveys, vol. 31, no. 3, pp. 264�323, 1999.

ACCEPTED. TO APPEAR IN IEEE TRANSACTIONS ON IMAGE PROCESSING, VOL. 16, NO. 8, AUGUST 2007. 16
[19] E. Vansteenkiste, D. Van der Weken, W. Philips, and E. E. Kerre,�Perceived image quality measurement of state-of-the-art noise reductionschemes,� in Lecture Notes in Computer Science ACIVS, vol. 4179,Antwerp, Belgium, September 2006, pp. 114�124.
[20] A. Pizurica and W. Philips, �Estimating the probability of the presenceof a signal of interest in multiresolution single- and multiband imagedenoising,� IEEE Trans. Image Process., vol. 15, no. 3, pp. 654�665,March 2006.
[21] V. Katkovnik, K. Egiazarian, and J. Astola, Local Approximation Tech-niques in Signal and Image Process. SPIE Press, 2006, vol. PM157.
[22] ��, �Adaptive window size image de-noising based on intersectionof con�dence intervals (ICI) rule,� Math. Imaging and Vision, vol. 16,no. 3, pp. 223�235, May 2002.
[23] A. Foi and V. Katkovnik, �From local polynomial approximation topointwise shape-adaptive transforms: an evolutionary nonparametricregression perspective,� in Proc. Int. TICSP Workshop Spectral MethodsMultirate Signal Process., Florence, Italy, September 2006.
Kostadin Dabov received the M.Sc. degree in digital signal processing atthe Institute of Signal Processing at Tampere University of Technology inApril 2006. There he is currently pursuing a D.Tech. degree on the topicof signal restoration with locally adaptive transform-based techniques. Hisinterests include signal enhancement and restoration, and ef�cient design andrealization of signal processing algorithms.
Alessandro Foi has received the M.Sc. and the Ph.D. degrees in mathematicsfrom Università degli Studi di Milano (Italy) in 2001 and from Politecnico diMilano in 2005, respectively. His research interests include mathematical andstatistical methods for signal processing, functional analysis, and harmonicanalysis. Currently, he is a researcher at the Institute of Signal Processing,Tampere University of Technology (Finland). His work focuses on spatiallyadaptive algorithms for denoising and deblurring of digital images and onnoise modeling for digital imaging sensors.
Vladimir Katkovnik received the M.Sc., Ph.D., and D.Sc. degrees intechnical cybernetics from the Leningrad Polytechnic Institute, Leningrad,Russia, in 1960, 1964, and 1974, respectively. From 1964 to 1991, he held thepositions of Associate Professor and Professor at the Department of Mechanicsand Control Processes, Leningrad Polytechnic Institute. From 1991 to 1999, hewas a Professor of statistics with the Department of the University of SouthAfrica, Pretoria. From 2001 to 2003, he was a Professor of mechatronicswith the Kwangju Institute of Science and Technology, Korea. From 2000to 2001 and since 2003 he is a Research Professor with the Institute ofSignal Processing, Tampere University of Technology, Tampere, Finland.He has published seven books and more than 200 papers. His researchinterests include stochastic signal processing, linear and nonlinear �ltering,nonparametric estimation, imaging, nonstationary systems, and time-frequencyanalysis.
Karen Egiazarian (SM'96) was born in Yerevan, Armenia, in 1959. Hereceived the M.Sc. degree in mathematics from Yerevan State Universityin 1981, the Ph.D. degree in physics and mathematics from Moscow StateUniversity, Moscow, Russia, in 1986, and the D.Tech. degree from theTampere University of Technology (TUT), Tampere, Finland, in 1994. He hasbeen Senior Researcher with the Department of Digital Signal Processing,Institute of Information Problems and Automation, National Academy ofSciences of Armenia. Since 1996, he has been an Assistant Professor with theInstitute of Signal Processing, TUT, where he is currently a Professor, leadingthe Transforms and Spectral Methods group. His research interests are in theareas of applied mathematics, signal processing, and digital logic.


![Sparse approximations in complex domain based on BM3D … · the complex domain dictionary learning with internal and external dictionaries [27] and the BM3D group sparsity algorithm](https://img.pdfslide.us/doc/110x75/5f3b59a7829a651fec5faa83/sparse-approximations-in-complex-domain-based-on-bm3d-the-complex-domain-dictionary.jpg)