Embed Size (px)
Citation preview

ACCEPTED MANUSCRIPT
Active contraction of microtubule networks
Peter J Foster, Sebastian Fürthauer, Michael J Shelley, Daniel J Needleman
http://dx.doi.org/10.7554/eLife.10837DOI:
Cite as: eLife 2015;10.7554/eLife.10837
Published: 23 December 2015Accepted: 20 December 2015Received: 18 August 2015
editing, and proofing.formatted HTML, PDF, and XML versions will be made available after technical processing, This PDF is the version of the article that was accepted for publication after peer review. Fully
elife.elifesciences.org at Sign up for alertsStay current on the latest in life science and biomedical research from eLife.
Active Contraction of Microtubule Networks
Peter J. Foster1, Sebastian Furthauer2,3, Michael J. Shelley2 and
Daniel J. Needleman1,3
1John A. Paulson School of Engineering and Applied Sciences and FAS Center for Systems
Biology, Harvard University, Cambridge, MA 021382Courant Institute of Mathematical Science, New York University, New York, NY, 10012
3Department of Molecular and Cellular Biology, Harvard University, Cambridge, MA, 02138
Abstract
Many cellular processes are driven by cytoskeletal assemblies. It re-
mains unclear how cytoskeletal filaments and motor proteins organize into
cellular scale structures and how molecular properties of cytoskeletal com-
ponents affect the large scale behaviors of these systems. Here we inves-5
tigate the self-organization of stabilized microtubules in Xenopus oocyte
extracts and find that they can form macroscopic networks that sponta-
neously contract. We propose that these contractions are driven by the
clustering of microtubule minus ends by dynein. Based on this idea, we
construct an active fluid theory of network contractions which predicts a10
dependence of the timescale of contraction on initial network geometry,
a development of density inhomogeneities during contraction, a constant
final network density, and a strong influence of dynein inhibition on the
rate of contraction, all in quantitative agreement with experiments. These
results demonstrate that the motor-driven clustering of filament ends is a15
generic mechanism leading to contraction.
1

1 Introduction
The mechanics, motions, and internal organization of eukaryotic cells are largely
determined by the cytoskeleton. The cytoskeleton consists of filaments, such as
actin and microtubules, and molecular motors, which consume chemical energy20
to exert forces on and arrange the filaments into large scale networks. Motor pro-
teins, including dynein and roughly 14 different families of kinesin (Wordeman,
2010), organize microtubules to form the spindle, which segregates chromosomes
during cell division. The motor protein myosin organizes actin filaments into
networks which drive cell motility, polarity, cytokinesis, and left-right symme-25
try breakage (Mitchinson and Cramer, 1996; Mayer et al., 2010; Naganathan
et al., 2014). The non-equilibrium nature of motor activity is essential for the
organization of the cytoskeleton into these diverse sub-cellular structures, but it
remains unclear how the interactions between filaments, different motor proteins
and other biomolecules influence the behaviors of the networks they form. In30
particular, it is difficult to extrapolate from the biochemical properties of motors
characterized in reconstituted systems to the biological function of those motors
in vivo. To address this question, we study self-organization of cytoskeletal fila-
ments in the Xenopus extracts, which recapitulate the biochemical complexity
of the in vivo system.35
The self-organization of cytoskeletal filaments has been extensively studied
in cell extracts and in reconstituted systems of purified components. Actin can
form macroscopic networks that exhibit a myosin dependent bulk contraction
(Murrell and Gardel, 2012; Bendix et al., 2008; Kohler and Bausch, 2012; Al-
varado et al., 2013; Szent-Gyorgyi, 1943). Microtubule networks purified from40
neuronal extracts have also been observed to undergo bulk contraction (Weisen-
berg and Cianci, 1984), while microtubules in mitotic and meiotic extracts are
found to assemble into asters (Gaglio et al., 1995; Mountain et al., 1999; Verde et
al., 1991). Aster formation in meiotic Xenopus egg extracts is dynein-dependent,
2
and has been proposed to be driven by the clustering of microtubule minus ends45
by dynein (Verde et al., 1991). It has also been suggested that dynein binds
to the minus ends of microtubules in spindles and clusters the minus ends of
microtubules to form spindle poles (Heald et al., 1996; Burbank et al., 2007;
Khodjakov et al., 2003; Goshima et al., 2005; Elting et al., 2014) and dynein
has been shown to accumulate on microtubule minus ends in a purified system50
(McKenney et al., 2014). Purified solutions of microtubules and kinesin can
also form asters (Nedelec et al., 1997; Hentrich and Surrey, 2010; Urrutia et al.,
1991), or under other conditions, dynamic liquid crystalline networks (Sanchez
et al., 2012). Hydrodynamic theories have been proposed to describe the be-
haviors of cytoskeletal networks on length scales that are much greater than the55
size of individual filaments and motor proteins (Prost et al., 2015, Marchetti et
al., 2013). These phenomenological theories are based on symmetries and gen-
eral principles of non-equilibrium physics, with the details of the microscopic
process captured by a small number of effective parameters. As hydrodynamic
theories are formulated at the continuum level, they cannot be used to derive60
the values of their associated parameters, which must be obtained from more
microscopic theories (Prost et al., 2015, Marchetti et al., 2013) or by comparison
to experiments (Mayer et al., 2010; Brugues and Needleman, 2014).
A key feature of networks of cytoskeletal filaments and motor proteins that
enters hydrodynamic theories, and differentiates these non-equilibrium systems65
from passive polymer networks, is the presence of additional, active stresses
(Prost et al., 2015, Marchetti et al., 2013). These active stresses can be con-
tractile or extensile, with profound implications for the large scale behavior of
cytoskeletal networks. Contractile stresses can result from a preferred asso-
ciation of motors with filament ends (Kruse and Julicher, 2000; Hyman and70
Karsenti, 1996), nonlinear elasticity of the network (Liverpool et al., 2009),
or the buckling of individual filaments (Murrell and Gardel, 2012; Lenz, 2014;
Soares e Silva et al., 2011). Extensile active stresses can arise from polarity
3
sorting or result from the mechanical properties of individual molecular motors
(Gao et al., 2015; Blackwell et al. 2015). In networks with dynamically growing75
and shrinking filaments, polymerization dynamics can also contribute to the
active stress. Experimentally, acto-myosin systems (Murrell and Gardel, 2012;
Bendix et al., 2008; Kohler and Bausch, 2012; Alvarado et al., 2013; Szent-
Gyorgy, 1943) and microtubule networks from neuronal extracts (Weisenberg
and Cianci, 1984) are observed to be contractile, while purified solutions of mi-80
crotubules and kinesin can form extensile liquid crystalline networks (Sanchez
et al., 2012). It is unclear which microscopic properties of filaments and motor
proteins dictate if the active stress is contractile or extensile in these different
systems.
Here, we investigate the motor-driven self-organization of stabilized micro-85
tubules in Xenopus meiotic egg extracts. These extracts are nearly undiluted
cytoplasm and recapitulate a range of cell biological processes, including spin-
dle assembly and chromosome segregation (Hannak and Heald, 2006). We have
discovered that, in addition to microtubules forming asters in this system as
previously reported (Verde et al., 1991), the asters assemble themselves into90
a macroscopic network that undergoes a bulk contraction. We quantitatively
characterized these contractions and found that their detailed behavior can be
well understood using a simple coarse-grained model of a microtubule network
in which dynein drives the clustering of microtubule minus ends. This end clus-
tering mechanism leads to a novel form of active stress, which drives the system95
to a preferred microtubule density. Our results suggest that the dynein-driven
clustering of microtubule minus ends causes both aster formation and network
contraction, and have strong implications for understanding the role of dynein
in spindle assembly and pole formation. Furthermore, the close agreement we
find between experiments and theory demonstrates that simple continuum mod-100
els can accurately describe the behavior of the cytoskeleton, even in complex
biological systems.
4
2 Results
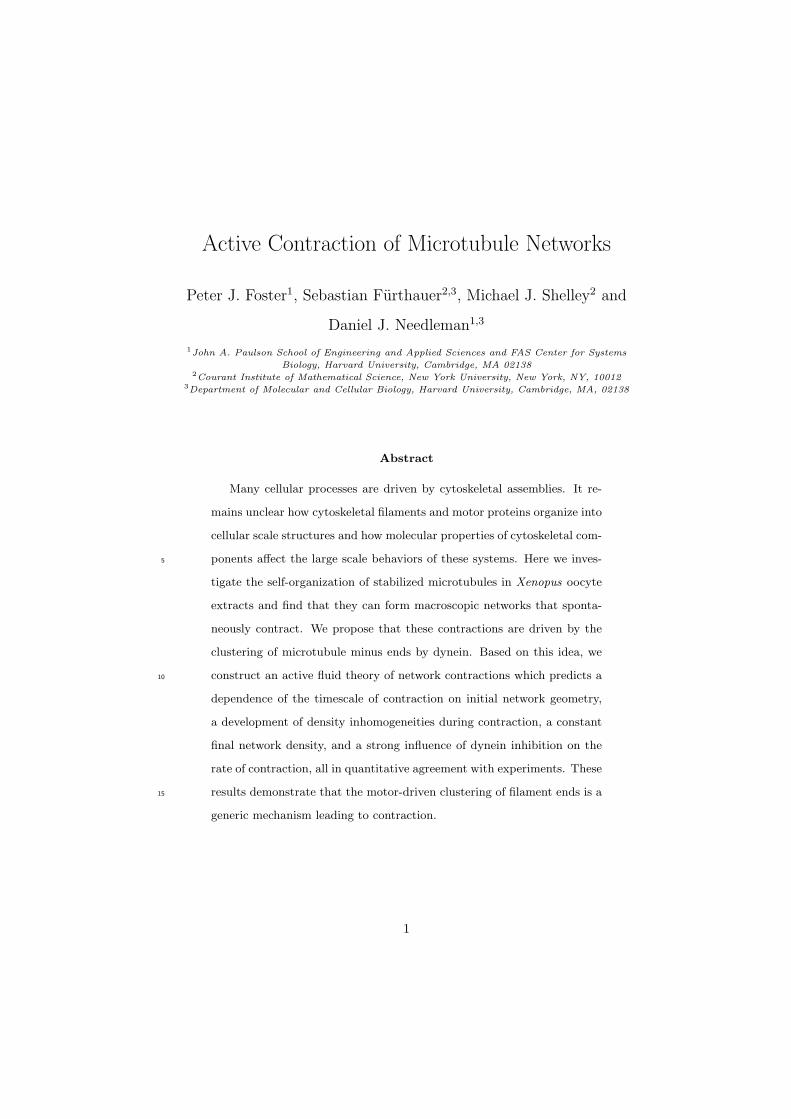
To further study the motor-induced organization of microtubules, we added 2.5
µM Taxol to Xenopus egg extracts and loaded them into microfluidic chan-105
nels (Figure 1A). Taxol causes microtubules to rapidly assemble and stabilize
(Mitchison et al., 2013), which allowed us to decouple the effects of motor-driven
self-assembly from the complicating effects of polymerization-depolymerization
dynamics. In some regions of the channel, microtubules organized into asters
(Figure1B) as observed previously (Verde et al., 1991). A NUMA antibody was110
used to locate microtubule minus ends (Mitchison et al., 2013), and was found
to localize to the aster core, confirming the polarity of the aster (Gaglio et al.,
1995). Isolated asters were found to interact and coalesce (Figure 1C, Video
1). In other regions of the channel, microtubules formed networks of aster-like
structures (Figure 1D), which were highly dynamic and exhibited large scale mo-115
tion that persisted for several tens of seconds (Figure 1E, Video 2). NUMA was
found to localize to the interior of these structures, confirming their aster-like
nature (Figure 1 F,G).
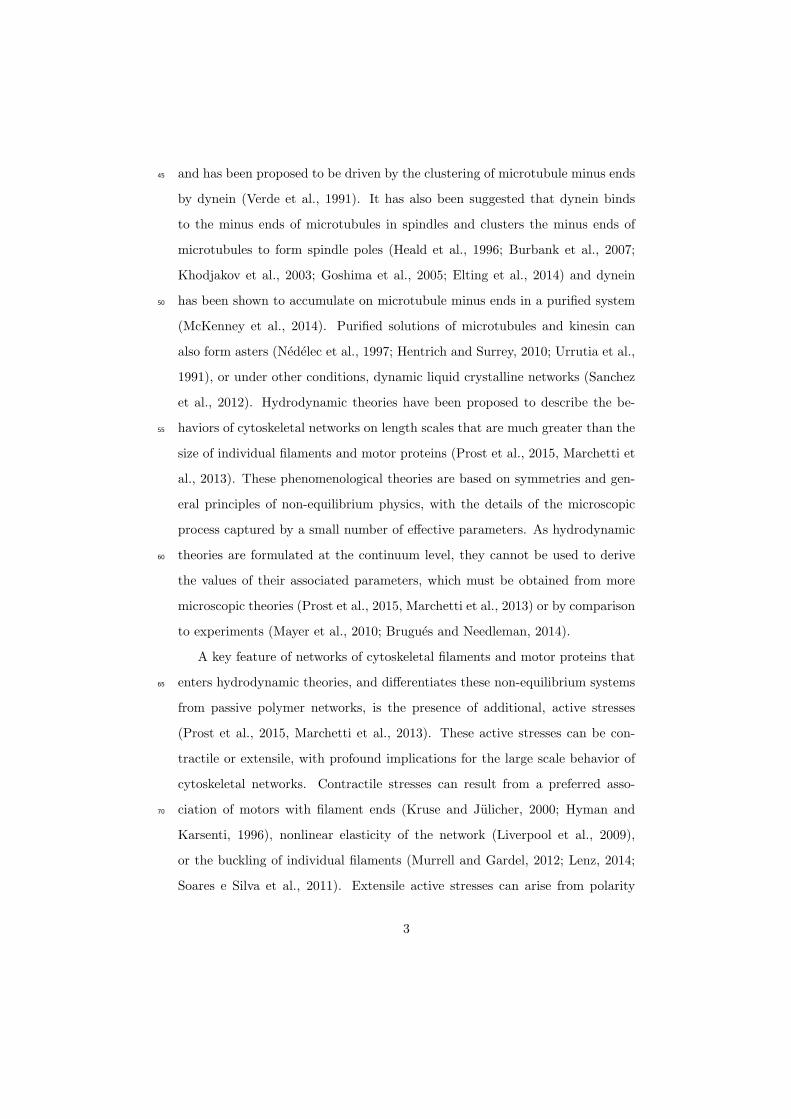
To characterize these large scale motions, we next imaged networks at lower
magnification, obtaining a field of view spanning the entire channel width. The120
networks, which initially filled the entire channel (width W0 = 1.4mm), under-
went a strong contraction, which was uniform along the length of the channel
(Figure 2A, Video 3). The contractile behavior of these microtubule networks
is highly reminiscent of the contractions of actin networks in these extracts
(Bendix et al., 2008), but in our experiments actin filaments are not present125
due to the addition of 10 µgmL Cytochalasin D. We characterized the dynamics
of microtubule network contractions by measuring the width , W(t) , of the
network as a function of time (Figure 2B). Occasionally we observed networks
tearing along their length (Video 4), yet these tears seemed to have little impact
on the contraction dynamics far from the tearing site, arguing that the Poisson130
5
ratio of the network is ≈ 0. We then calculated the fraction contracted of the
network:
ϵ(t) =W0 −W (t)
W0, (1)
The time course of ϵ(t) was found to be well fit by an exponential relaxation:
ϵ(t) ≃ ϵ∞[1− e−(t−Tc)
τ ], (2)
where ϵ∞ is the final fraction contracted, τ is the characteristic time of contrac-
tion, and Tc is a lag time before contraction begins (Figure 2B, inset, Figure 2135
- figure supplement 1).
We next sought to investigate which processes determine the time scale of
contraction and the extent that the network contracts. For this, we exploited
the fact that different mechanisms predict different dependence of the time
scale τ on the channel dimensions. For instance, in a viscoelastic Kelvin-Voight140
material driven to contract by a constant applied stress, τ = η/E depends solely
on the viscosity η and the Young’s modulus E and is independent of the size of
the channel (Oswald, 2009). In contrast, in a poroelastic material driven by a
constant stress, τ ∝ W 20 (Coussy, 2004), where W0 is the width of the channel.
Thus, studying how τ varies with channel width provides a means to test the145
validity of these models.
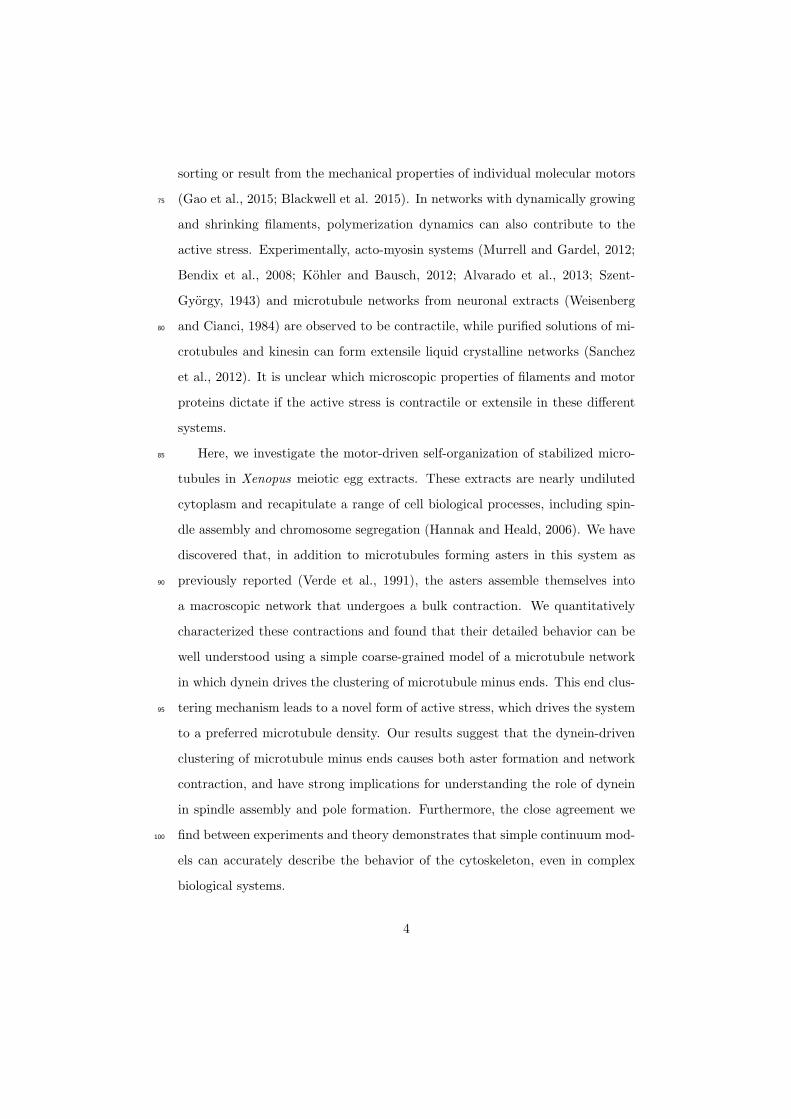
We fabricated microfluidic channels of varying width, W0 = 1.4mm, 0.9mm,
0.44mm, and 0.16 mm, all with height H0 = 125 µM, loaded the channels with
extracts supplemented with 2.5 µM Taxol, and imaged the networks at low mag-
nification (Figure 3A, Video 5). Results for each channel width were averaged150
together to produce master curves of the width, W(t) (Figure 3B), and fraction
contracted, ϵ(t) (Figure 3C), of the networks in each channel. Visual inspection
of the fraction contracted curves, ϵ(t), reveals that networks in smaller channels
contract faster, but all reach a similar final fraction contracted (Figure 3C).
To quantify these trends, we fit the ϵ(t) curves using Eqn. 2 and extracted155
6

the characteristic time to contract, τ , and the final fraction contracted, ϵ∞,
for each channel width. We find that the dependence of τ on channel width
is inconsistent with the time of contraction resulting from either viscoelastic
or poroelastic timescales, which would predict constant and quadratic scalings
respectively (Figure 3D). We next explored the influence of channel height H0160
(H0 = 75, 125, 150µM, all with width W0 = 1.4 mm) and found that τ does
not significantly vary in these channels (Figure 3E).
In all cases the networks contracted to a similar final fraction, ϵ∞, of ≈
0.77, irrespective of channel geometry (Figure 3F). Since the Taxol concentra-
tion was held constant, all experiments started with the same initial density of165
microtubules, regardless of the dimensions of the channel. Thus, all networks
contracted to the same final density. By using fluorescence intensity as a proxy
for tubulin concentration (see Materials and Methods), we estimate the final
concentration of tubulin in the network to be ρ0 ≈ 30µM. Remarkably, this is
comparable to the concentration of microtubules in reconstituted meiotic spin-170
dles in Xenopus extracts (Needleman et al., 2010), which is ≈ 60µM. As neither
the simple viscoelastic nor poroelastic models are consistent with these results,
we sought to construct an alternative model of the contraction process. Since
Taxol stabilizes microtubules in these experiments, the density of microtubules
ρ is conserved throughout the contraction process, implying175
∂tρ = −∇ · (ρv), (3)
where v is the local velocity of the microtubule network. The velocity v is set by
force balance. If the relevant timescales are long enough that the microtubule
network can be considered to be purely viscous, and if the network’s motion
results in drag, then the equation for force balance is
η∇2v − γv = ∇ · σ, (4)
7
where η and γ are the viscosity and drag coefficients, respectively, and σ is180
an active stress caused by motor proteins which drive the contraction of the
microtubule network. The observation that the timescale of contraction, τ , is
independent of channel height (Figure 3E) shows that the drag does not signif-
icantly vary with channel height, and thus could arise from weak interactions
between the microtubule network and the device wall.185
We obtain an expression for the active stress, σ, by considering the mi-
croscopic behaviors of microtubules and motor proteins. As the contracting
networks consist of microtubule asters (Figure 1 D, E), and microtubule asters
in meiotic extracts are thought to assemble by the dynein-induced clustering of
microtubule minus ends (Verde et al., 1991), we hypothesize that the contrac-190
tion process is also driven by dynein pulling microtubule minus ends towards
each other (Figure 4A).
In an orientationally disordered suspension of microtubules, we expect dynein
mediated collection of microtubule minus ends to drive a contractile stress which
is proportional to the number of motor molecules m and the local density of195
microtubules ρ, (see Appendix).
As only a finite number of microtubules can fit near the core of an aster,
steric collisions will counteract the contractile stress at high densities (Figure
4B).
Since most motion in the suspension is motor driven, thermal collisions can200
be ignored, and the extensile stress driven by steric interactions will be be
proportional to the number motor moleculesm and quadratic in the local density
of microtubules ρ, (see Appendix).
Taken together, these two effects lead to the active stress
σ = sρ(ρ− ρ0)I, (5)
where s is the strength of the active stress, ρ0 is the final density at which the205
8
effects of dynein mediated clustering and steric repulsion between microtubules
balance and I is a unit tensor (see Appendix).
Importantly, since the contractile and extensile parts of the active stress
both depend linearly on the number of motor molecules, the prefered density ρ0
that the suspension will reach after contraction depends only on the interaction210
geometry between microtubules and motors and not on the actual number of
active motors. Only the strength s of the active stress will be affected if the
number of active motors could be changed.
Taken together, Eqns. (3,4,5) constitutes an active fluid theory of micro-
tubule network contraction by minus end clustering. We note that this theory215
could be reformulated, essentially without change, as the clustering of aster
cores, again driven by dynein mediated clustering of minus-ends. Isotropy of
interactions remains a fundamental assumption.
We first investigated if this active fluid theory can explain the dependence
of the timescale of contraction on sample geometry. An analysis of the equa-220
tions of motion, Eqns. (3,4,5), near equilibrium predicts that the timescale of
contractions obeys
τ(W0) = αη
sρ20+ β
γ
sρ20W 2
0 , (6)
where α = 2.2 ± 0.05 and β = 0.085 ± 0.006 are dimensionless constants, which
we determined numerically (see Appendix). This predicted scaling is both con-
sistent with the experimental data and simulations of the full theory (Figure225
3D). Fitting the scaling relationship to the data allows combinations of the pa-
rameters to be determined, giving η/(sρ20) = 0.82 ± 0.20 min and γ/(sρ20) = 1.0
×10−5 ± 0.7× 10⁻⁵ min/(µm2) (mean ± standard error). Combining this mea-
surement with an estimate for the network viscosity taken from measurements
in spindles of η ≈ 2× 10⁻²Pa · s (Shimamoto et al., 2011), we can estimate the230
dynein generated active stress to be sρ20 ≈ 4Pa which is consistant with having
9
≈ 0.4 dynein per microtubule minus end each exerting an average force of 1 pN
(Nicholas et al., 2015).
To further explore the validity of the active fluid theory of contraction by
microtubule minus end clustering, we explored other testable predictions of the235
theory. This theory predicts that: (i) the preferred density of the network ρ0 is
constant and does not depend on the initial conditions. This is consistent with
the constant ϵ∞ measured experimentally (Figure 3F); (ii) since contractions are
driven by stress gradients (Eq. 4) and stress depends on microtubule density
(Eq. 5) the density discontinuity at the edge of the network should produce large240
stress gradients, leading to an inhomogeneous density profile in the network
during contraction; (iii) the magnitude of the active stress, s, is proportional
to the number of active motors, but the final density of the network, ρ0, is
independent of the number of molecular motors (see Appendix). Thus, reducing
the numbers of motors should lead to slower contractions, but still yield the same245
final density.
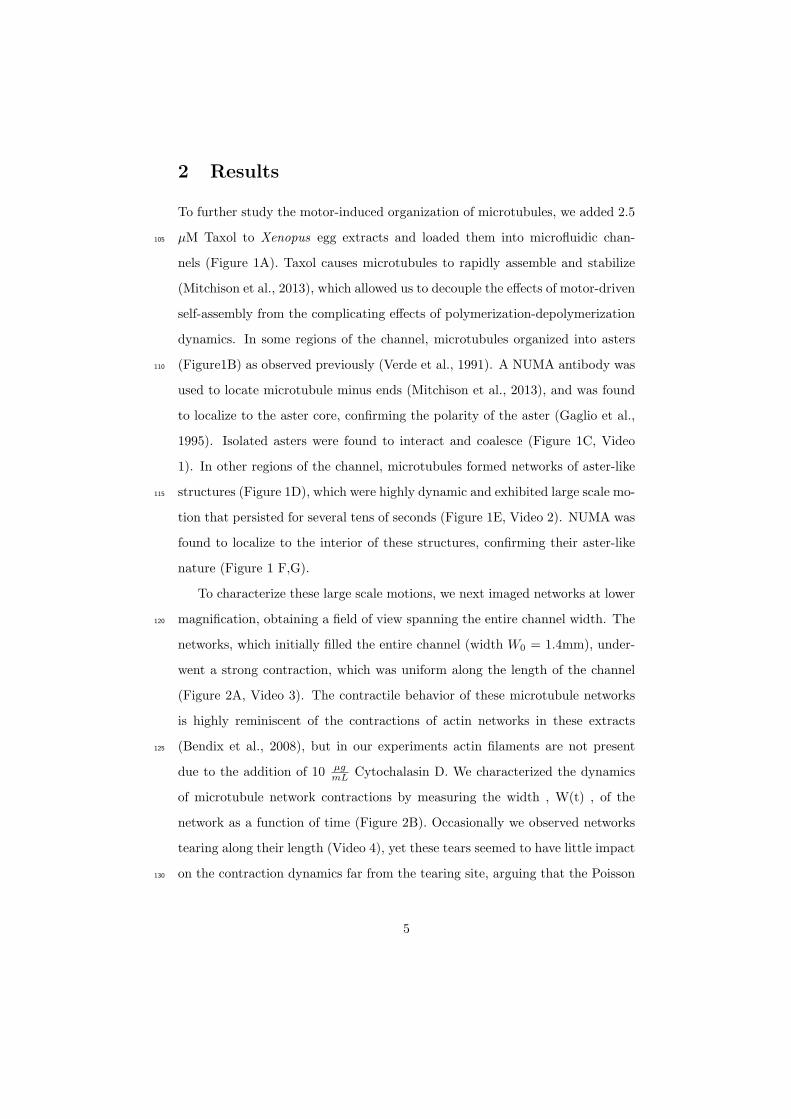
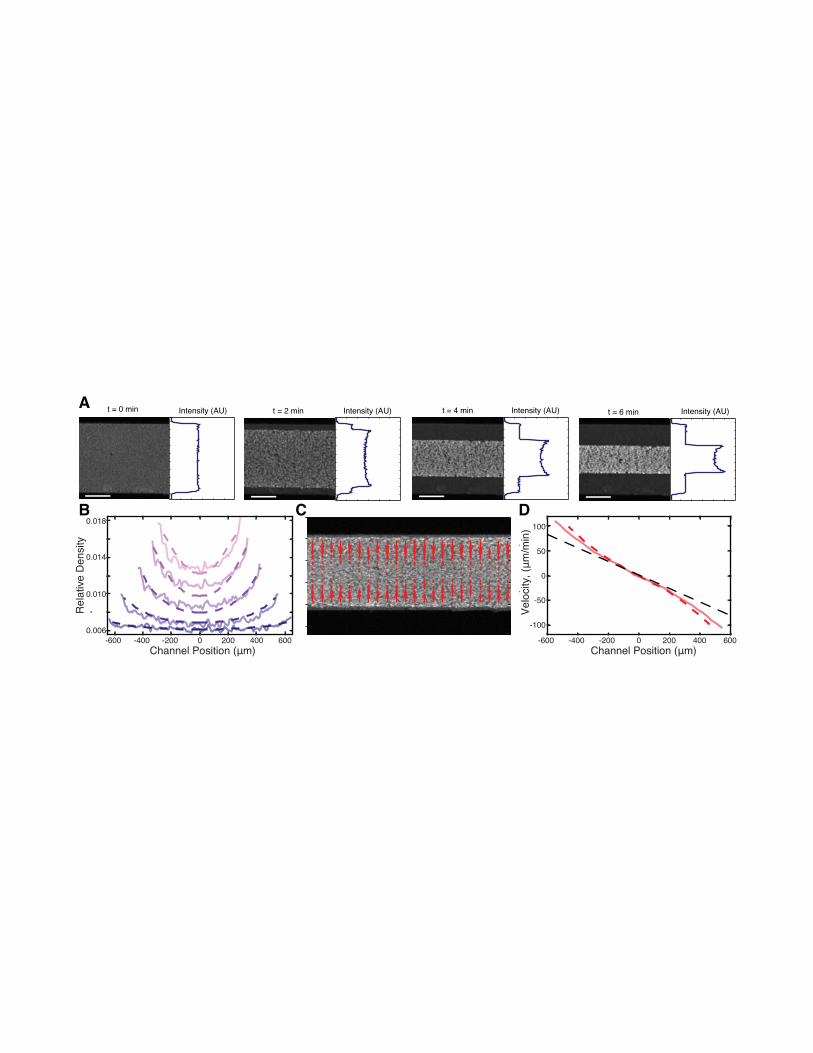
We first examined prediction (ii), that the stress discontinuity at the edge of
the network should lead to a material buildup in the film. To test this, we av-
eraged the fluorescence intensity along the length of the channel (see Materials
and Methods) and found that the microtubule density does indeed increase at250
the network’s edge during contraction (Figure 5A). We next explored if the inho-
mogeneous density profile could be quantitatively explained by our active fluid
theory. We numerically solved Eqns. (3, 4, 5) and used least squares fitting
to determine the simulation parameters which most closely matched the ex-
perimentally measured profiles (Figure 5B), yielding η/(sρ20) = 0.82±0.03 min,255
γ/(sρ20) = 6.1±0.1×10⁻⁶ min/(µm2), and ρinitial/ρ0 = 0.32 ± 0.01 (mean ±
s.e.m., n=4 experiments). Within error, these values are the same as those de-
termined from the dependence of the timescale of contraction on channel width
(Figure 3D). The simulated profiles closely match the experimental ones for
most of the contraction (Figure 5B), but at late times the simulated inhomo-260
10
geneities dissipate in contrast to the experiments (Figure 5 - figure supplement
1). This might be caused by a long-term aging of the network that is not in-
corporated into our simple model. To confirm that the density buildup was
due to an increased velocity near the network’s edge, we measured the velocity
throughout the network using Particle Image Velocimetry (PIV, see Materials265
and Methods) (Figure 5C) and found that the velocities increase superlinearly
with distance from the network’s center, as predicted (Figure 5D).
Finally, we sought to determine the molecular basis of the contraction pro-
cess, and check prediction (iii), that the number of motors driving the contrac-
tion affects the rate of contraction, but not the final density the network con-270
tracts to. Aster assembly is dynein-dependent in Xenopus egg extracts (Gaglio
et al.,1995; Verde et al., 1991), and dynein (Heald et al., 1996) and Kinesin-5
(Sawin et al., 1992) are two of the most dominant motors in spindle assembly
in this system. We inhibited these motors to test their involvement in the con-
traction process. Extracts supplemented with STLC for Kinesin-5 inhibition or275
p150-CC1 for dynein inhibition were loaded into channels with a width, W0, of
0.9 mm and imaged at low magnification. Inhibiting Kinesin-5 had little effect
on the contraction process (Figure 6 - figure supplement 1). In contrast, inhibit-
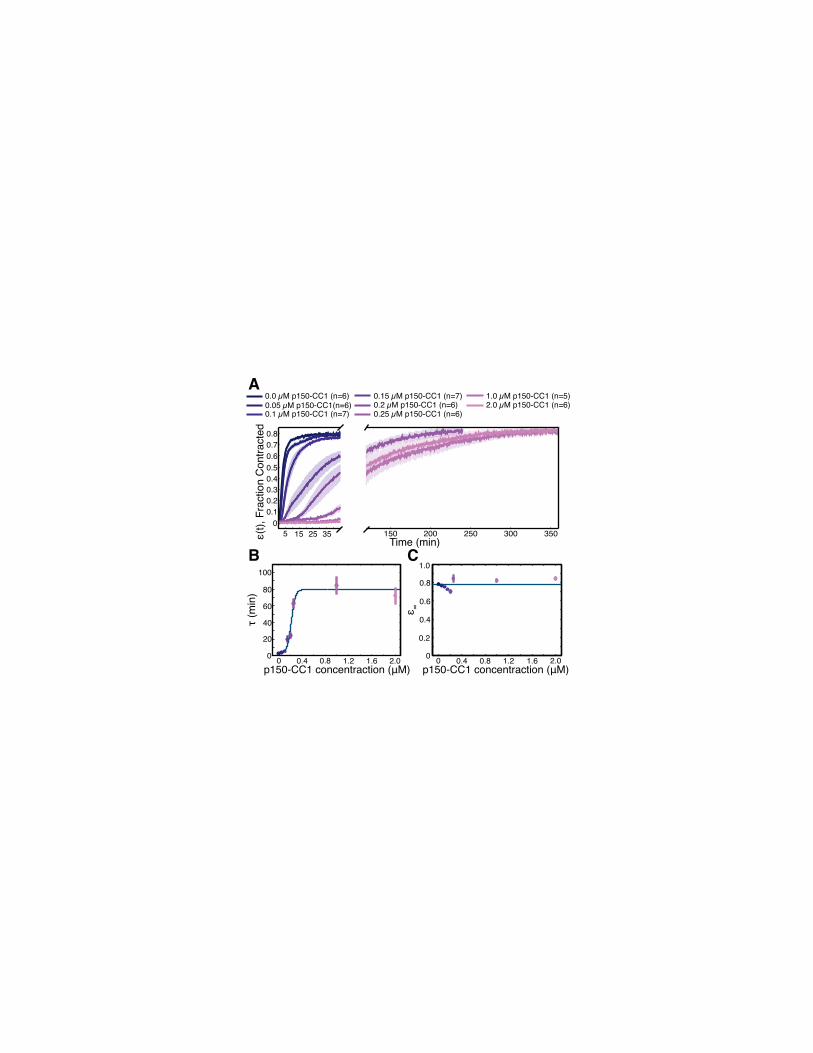
ing dynein caused a dose-dependent slowdown of the contraction (Figure 6A).
In spindle assembly, inhibiting Kinesin-5 suppresses the morphological changes280
caused by dynein inhibition (Mitchison et al., 2005). We therefore tested how
simultaneously inhibiting both motors influences the contraction process, but
found that the effects of dynein inhibition were not rescued by the simultane-
ous inhibition of Kinesin-5 (Figure 6 - figure supplement 1), suggesting that in
this context, Kinesin-5 is not generating a counteracting extensile stress. This285
further suggests the possibility that in the spindle, the role of Kinesin-5 may
be in orienting, polarity sorting, and sliding microtubules as opposed to active
stress generation. Curves of ϵ(t) were fit using Eqn. (2) to extract the final
fraction contracted, ϵ∞, and the characteristic time of contraction, τ . By vary-
11
ing the concentration of p150-CC1, the characteristic time, τ , could be tuned290
over a wide range from ≈ 3 minutes to ≈ 75 minutes (Figure 6B). Fitting a
sigmoid function to the τ vs. p150-CC1 concentration curve yields an EC50
value of 0.22 ± .02 µM (mean ± standard error), similar to the value of ≈ 0.3
µM reported for the effect of p150-CC1 on spindle length in Xenopus extracts
(Gaetz and Kapoor, 2004), which is consistent with active stress generated by295
dynein being required for pole focusing. Despite this large change in the con-
traction timescale, we found no apparent differences in ϵ∞ (Figure 6C). Thus,
the microtubule networks contract to approximately the same final density ir-
respective of the concentration of p150-CC1. The observation that inhibiting
dynein affects the timescale of contraction but not the final density to which300
the network contracts is consistent with the predictions of our model. We note
that even at the highest p150-CC1 concentrations used, the network still under-
goes a bulk contraction. This could possibly be due to incomplete inhibition of
dynein by p150-CC1, or by another motor protein present in the extract that
also contributes to the contraction process. As the characteristic time, τ ∝ 1s ,305
by comparing the characteristic times in the uninhibited and 2 µM p150-CC1
cases, we can estimate that the strength of the active stress, s, in the 2 µM
p150-CC1 condition is only ≈ 4% of the strength of the active stress in the un-
inhibited case, arguing that even if another motor is involved in the contraction,
dynein contributes ≈ 96% of the active stress.310
3 Discussion
Here we have shown that networks of stabilized microtubules in Xenopus egg
extracts undergo a bulk contraction. By systematically varying the width of
the microfluidic channel in which the network forms, we demonstrated that
the timescale of contraction is not a poroelastic or viscoelastic timescale. A315
simple active fluid model of network contraction by dynein-driven clustering
12

of microtubule minus ends correctly predicts the dependence of the contraction
timescale on channel width, the nonuniform density profile in the network during
contraction, and that inhibiting dynein affects the timescale of contraction but
not the final density that the network contracts to. Parameters of this model320
can be measured by the scaling of the contraction timescale with channel width
and by a detailed analysis of the inhomogeneities in the network that develop
during contraction. Both methods give similar values.
Our results demonstrate that the behaviors of a complex biological system
can be quantitatively described by a simple active matter continuum theory.325
These active matter theories aim to describe the behavior of cytoskeletal sys-
tems at large length-scales and long timescales by effectively averaging all of the
molecular complexity into a small set of coarse-grained parameters. Previously,
these theories have been predominately applied to describe biological systems
near non-equilibrium steady states (Prost et al., 2015; Brugues et al., 2014). In330
the present work, we augment previous theories with a nonlinear active stress
term derived from microscopic considerations to capture the far from steady
state dynamics of the contraction process. This approach allows us to quantita-
tively explain our experimental results using a theory with only 4 parameters,
while a complete microscopic model would require understanding the behavior335
of the thousands of different proteins present in Xenopus egg extracts. Further-
more, the considerations of the model are general, and it will be interesting to
consider whether the end clustering mechanism proposed here could contribute
to contraction in actin networks as well.
In our model, the active stress which drives network contraction results340
from the motor-induced clustering of microtubule minus ends, the same process
thought to be responsible for aster formation and spindle pole focusing (Gaglio
et al., 1995; Mountain et al., 1999; Verde et al., 1991, Elting et al., 2014; Heald
et al., 1996; Burbank et al., 2007; Khodjakov et al., 2003; Goshima et al., 2005).
Our results, and previous data (Verde et al., 1991; Heald et al., 1996; Burbank345
13
et al., 2007), are consistent with minus end clustering in Xenopus egg extracts
primarily arising from the activity of dynein. The ability of dynein to cluster
microtubule minus ends could result from dynein being able to accumulate on
the minus end of one microtubule, while simultaneously walking towards the
minus end of another (Hyman and Karsenti, 1996; McKenney et al. 2014;350
Figure 4A). There is indication that such behaviors may indeed occur in spindles
(Elting et al., 2014), and pursuing a better understanding of those processes is
an exciting future direction that will help to clarify the function of dynein in
spindles.
The observation that microtubule networks contract in Xenopus egg extracts355
suggests that motor-induced stresses in spindles are net contractile and not ex-
tensile as previously assumed (Brugues and Needleman, 2014). The contribution
of dynein to spindle pole focusing may ultimately be due to these contractile
stresses. The presence of contractile stresses from dynein might also explain
both the observation that the fusion of spindles is dynein-dependent (Gatlin et360
al., 2009), and the apparently greater cohesion between microtubules at spin-
dle poles, (where dynein is localized (Gatlin et al., 2010)). It is unclear what
processes set the density of microtubules in the spindle, and the finding that
the active stress generated from minus end clustering saturates at a preferred
microtubule density could play an important role.365
4 Materials and Methods
4.1 Preparation of Xenopus Extracts
CSF-arrested extracts were prepared from Xenopus llaevis oocytes as previously
described (Hannak and Heald, 2006). Crude extracts were sequentially filtered
through 2.0, 1.2, and 0.2 micron filters, frozen in liquid nitrogen, and stored at370
-80 ◦C until use.
14
4.2 Preparation of Microfluidic Devices
Channel negatives were designed using AutoCAD 360 (Autodesk) and Silhou-
ette Studio (Silhouette America) software, cut from 125 micron thick tape (3M
Scotchcal) using a Silhouette Cameo die cutter, and a master was made by ad-375
hering channel negatives to the bottom of a petri dish. PDMS (Sylgard 184,
Dow Corning, 10:1 mixing ratio) was cast onto the masters and cured overnight
at 60 ◦C. Devices and coverslips were each corona treated with air plasma for
1 minute before bonding. Channels containing a degassed solution of 5 mg/mL
BSA (J.T. Baker) supplemented with 2.5% w/w Pluronic F127 (Sigma) were380
incubated overnight at 12 ◦C. Unless stated otherwise, the microfluidic devices
had a length of 18 mm, a height of 0.125 mm, and a width of 1.4 mm.
4.3 Protein Purification
GST-tagged p150-CC1 plasmid was a gift from Thomas Surrey (Uteng et al.,
2008). GST-p150-CC1 was expressed in E. Coli BL21 (DE3)-T1R(Sigma) for 4385
hours at 37 ◦C. The culture was shifted to 18 ◦C for 1 hour before adding 0.2mM
IPTG and the culture was grown overnight at 18 ◦C. Cells were centrifuged, re-
suspended in PBS supplemented with Halt Protease Inhibitor Cocktail (Thermo
Scientific) and benzonase (Novagen) before lysis by sonication. GST-p150-CC1
was purified from clarified lysate using a GSTrap column FF (G.E. Healthcare)390
as per the manufacturer’s instructions. GST-p150-CC1 was dialyzed overnight
into 20mM Tris-HCl, 150mM KCl and 1mM DTT. The GST tag was cleaved
using Prescission Protease (overnight incubation at 4 ◦C). After removing free
GST and Prescission Protease using a GSTrap FF column, p150-CC1 was con-
centrated, frozen in liquid nitrogen, and stored at -80 ◦C until use.395
15

4.4 Bulk Contraction Assay
20 µL aliquots of filtered extract were supplemented with ∼1 µM Alexa-647
labeled tubulin and 2.5µM Taxol before being loaded into channels. For dynein
inhibition experiments, 1 µL of either p150-CC1 or buffer alone was added to
the extract immediately before Taxol addition. For Kinesin-5 inhibition ex-400
periments, 100 µM STLC (Sigma Aldrich) was added concurrently with Taxol.
Channels were sealed with vacuum grease and imaged using a spinning disk
confocal microscope (Nikon Ti2000, Yokugawa CSU-X1), an EMCCD camera
(Hamamatsu), and a 2x objective using Metamorph acquisition software (Molec-
ular Devices). t=0 is defined when the imaging begins, ≈ 1 minute after Taxol405
addition to the extract. After a brief lag time, the microtubule networks sponta-
neously begin contraction. Images were analyzed using ImageJ and custom build
MATLAB and Python software (available at https://github.com/peterjfoster/eLife).
Parameters were fit to contraction data using timepoints where ϵ(t) > 0.1.
4.5 Final Density Estimation410
The final density was estimated using contraction experiments with 2.5 µM
Taxol in 0.9 mm channels. For each experiment, the frame closest to t = τ +
Tc was isolated, where τ and Tc are the timescale of contraction and the offset
time respectively, obtained from fits of the time course of contraction to Eqn.
2 of the main text. After correcting for the camera offset and inhomogeneous415
laser illumination, the average fluorescence intensity of the network, ρN and
the average fluorescence intensity in the channel outside the network, ρM were
calculated. The fluorescence intensity in the channel but outside the network
comes from monomeric fluorescently labeled tubulin and was assumed to be
constant throughout the channel. The fractional concentration was then esti-420
mated as ρ(τ +Tc) =ρN−ρM
ρN+ρM. Using this measurement along with the fit curves
for ϵ(t) and under the assumption that the network contracts in the z direction
16
such that ϵ(t) in the z direction is the same as along the width, the inferred
fractional concentration at t = ∞ was calculated as
ρ(t = ∞) =ρ(τ + Tc)
(1− ϵ∞)2(1− ϵ∞(1− e−1))2
Assuming the fluorescently labeled tubulin incorporates into microtubules425
at the same rate as endogenous tubulin, we can multiply the derived fractional
density ρ(t = ∞) by the tubulin concentration in extract, 18µM (Parsons and
Salmon, 1997) to arrive a final network tubulin concentration of 30 µM.
4.6 Density Profile Measurements
Images from contraction experiments were corrected for the camera offset and430
inhomogeneous laser illumination before being thresholded in order to segment
the microtubule network from background fluorescence. Rotations of the chan-
nel relative to the CCD were detected by fitting a linear equations to edges of
the microtubule network. If the average of the slopes from the top and bottom
of the network was greater than 1/(the number of pixels in the length of the im-435
age), a rotated, interpolated frame was constructed where pixels were assigned
based on the intensity of the pixel in the original frame weighted by their area
fraction in the interpolated pixel. Frames were averaged along the length of the
channel before background signal subtraction. For density profiles compared
with simulations, the edge peaks of the density profile were identified and pixels440
between the two peaks were retained. Profiles were normalized such that the
integral of the profile was set to 1.
4.7 Particle Imaging Velocimetry
Particle Imaging Velocimetry was performed using PIVLab software (Thielicke
and Stamhuis, 2014) using the FFT window deformation algorithm with a 16445
pixel interrogation area and 8 pixel step for the first pass and an 8 pixel inter-
17
rogation area with a 4 pixel step for the second pass. After PIV was performed,
intensity images were thresholded to segment the microtubule network from the
background, and only velocity vectors within the microtubule network that were
> 8 pixels from the network’s edges were retained.450
5 Appendix
5.1 Derivation of Active Fluid Theory
We introduce a theoretical description of a confined active microtubule-motor
gel immersed in a Newtonian fluid. We obtain generic equations of motion
for this system closely following the logic outlined in (Doi and Onuki, 1992;455
Joanny et al., 2007). This generic description is augmented by including a
density-dependent active stress, which is derived from a minimal microscopic
description of microtubule-dynein interactions. Here, we present the equations
of motion for the one dimensional system.
5.1.1 Generic theory for an immersed active gel460
We begin by stating the conservation laws an active gel permeated by a Newto-
nian fluid obeys. The system shall be incompressible such that the total density
ρtot = ρ + ρf is a constant. Here ρ and ρf are the densities of gel and fluid,
respectively. The gel density ρ obeys the continuity equation,
∂tρ = −∂x(ρv), (7)
where v is the velocity of the gel. Similarly the fluid permeating the gel obeys,465
∂tρf = −∂x(ρfvf ), (8)
where vf and ρf are the fluid density and velocity fields, respectively. Since
the overall system is incompressible ∂x(ρv+ ρfvf ) = 0. Force balance in the gel
18
requires
∂xσgel = γv + λ (v − vf ) , (9)
where the gel stress σgel = η∂xv − σ + (ρ/ρtot)P consists of a viscous stress
η∂xv, an active stress σ, and a hydrostatic pressure P . The friction coefficient470
γ quantifies the momentum transfer between the gel and its confinement and
λ quantifies the momentum transfer between and the gel and the fluid. The
momentum continuity equation of the permeating fluid is
0 = ηf∂2xvf − ∂x [(ρf/ρtot)P ] + λ (v − vf ) , (10)
where ηf is the fluid viscosity. In our experiments, changing the height of the
chamber does not appreciably change the time-scale τ of the observed contrac-475
tions, see Figure 3F. Furthermore, there is little observed motion of the extract
surrounding the film. Presumably vf ≪ v since the system is relatively dilute,
i.e. ρ ≪ ρf , and the length-scale√ηf/λ is large compared to the chamber
height. We thus simplify Eq.(9) to
η∂2xv − γv = ∂xσ, (11)
where γ = λ+γ. Eq. (11) is the force balance equation we henceforth use for the480
gel to quantitatively capture the experimental dynamics. Note that ρ ≪ ρf also
allowed us to neglect the hydrostatic pressure in the gel. We complement Eq.(11)
by the stress boundary condition at the edges of the film at x = ±W (t)/2
[η∂xv − σ]x=
±W (t)2
= 0. (12)
The width of the film obeys
∂tW (t) = v (W (t)/2)− v (−W (t)/2) . (13)
5.1.2 Active stresses from dynein-mediated microtubule interactions485
We next seek to obtain an expression for the active stress by coarse-graining a
microscopic model of interactions between dynein molecular motors and micro-
tubules. Here we assume that dynein builds up near microtubule minus ends as
19
previously suggested (Elting et al., 2014; Surrey et al., 2001), and hence forces
are exchanged between microtubules through the microtubules’ minus ends. We490
introduce the positions of microtubule minus ends xi, such that the film density
can be written as
ρ(x) =∑i
δ(x− xi). (14)
The force exerted by the i-th on the j-th filament is Fij , with Fij = −Fji
as required by momentum conservation. The active stress σ generated in this
context is defined by the force balance equation495
∂xσ =∑i
δ(x− xi)∑j
Fij , (15)
up to an arbitrary constant of integration. Note that averaging Eq. (15) over
an appropriate mesoscopic volume yields the well-known Kirkwood formula.
To model microtubule-dynein interactions, we propose that Fij = Aij + Rij ,
where Aij is a dynein-mediated attractive force between minus ends, and Rij is
a repulsive force from steric interactions between nearby filaments (Figure 4).500
Generically, Aij and Rij depend on the relative positions and orientations of
microtubules i and j. Since we are concerned with a disordered assembly of mi-
crotubules in which all orientations occur with the same likelihood it is sufficient
for our purposes to only think of microtubule positions, and orientation effects
average out. The average attractive force Aij that motors bound to the minus505
end of filament i exert on filament j can be expressed locally as the product
Aij = (Pij + Pji)aij , (16)
where Pij is the probability that a motor connects the minus end of filament i
to filament j and aij is the force which the motor exerts if a connection is made.
Since each dynein can link at most 2 filaments,
Pij = m1−Θ(|xi − xj | − Γ)∑
k =i
(1−Θ(|xi − xk| − Γ)), (17)
20
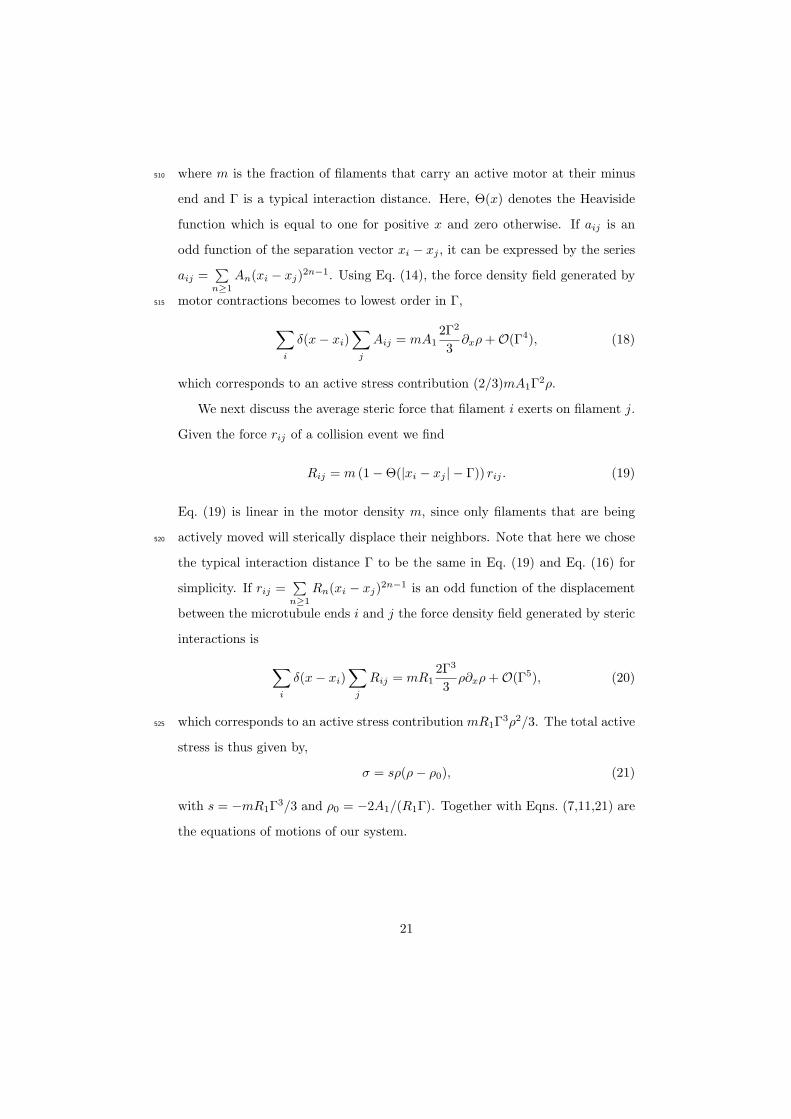
where m is the fraction of filaments that carry an active motor at their minus510
end and Γ is a typical interaction distance. Here, Θ(x) denotes the Heaviside
function which is equal to one for positive x and zero otherwise. If aij is an
odd function of the separation vector xi − xj , it can be expressed by the series
aij =∑n≥1
An(xi − xj)2n−1. Using Eq. (14), the force density field generated by
motor contractions becomes to lowest order in Γ,515
∑i
δ(x− xi)∑j
Aij = mA12Γ2
3∂xρ+O(Γ4), (18)
which corresponds to an active stress contribution (2/3)mA1Γ2ρ.
We next discuss the average steric force that filament i exerts on filament j.
Given the force rij of a collision event we find
Rij = m (1−Θ(|xi − xj | − Γ)) rij . (19)
Eq. (19) is linear in the motor density m, since only filaments that are being
actively moved will sterically displace their neighbors. Note that here we chose520
the typical interaction distance Γ to be the same in Eq. (19) and Eq. (16) for
simplicity. If rij =∑n≥1
Rn(xi − xj)2n−1 is an odd function of the displacement
between the microtubule ends i and j the force density field generated by steric
interactions is
∑i
δ(x− xi)∑j
Rij = mR12Γ3
3ρ∂xρ+O(Γ5), (20)
which corresponds to an active stress contribution mR1Γ3ρ2/3. The total active525
stress is thus given by,
σ = sρ(ρ− ρ0), (21)
with s = −mR1Γ3/3 and ρ0 = −2A1/(R1Γ). Together with Eqns. (7,11,21) are
the equations of motions of our system.
21
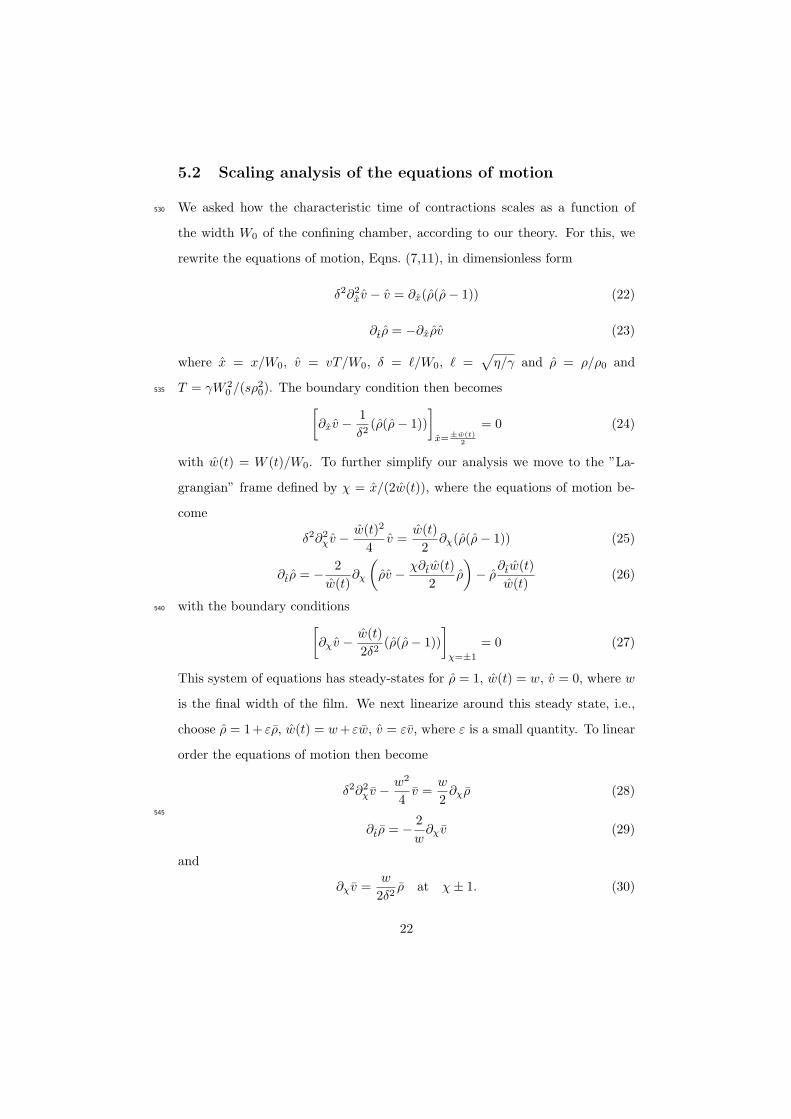
5.2 Scaling analysis of the equations of motion
We asked how the characteristic time of contractions scales as a function of530
the width W0 of the confining chamber, according to our theory. For this, we
rewrite the equations of motion, Eqns. (7,11), in dimensionless form
δ2∂2xv − v = ∂x(ρ(ρ− 1)) (22)
∂tρ = −∂xρv (23)
where x = x/W0, v = vT/W0, δ = ℓ/W0, ℓ =√
η/γ and ρ = ρ/ρ0 and
T = γW 20 /(sρ
20). The boundary condition then becomes535 [
∂xv −1
δ2(ρ(ρ− 1))
]x=
±w(t)2
= 0 (24)
with w(t) = W (t)/W0. To further simplify our analysis we move to the ”La-
grangian” frame defined by χ = x/(2w(t)), where the equations of motion be-
come
δ2∂2χv −
w(t)2
4v =
w(t)
2∂χ(ρ(ρ− 1)) (25)
∂tρ = − 2
w(t)∂χ
(ρv − χ∂tw(t)
2ρ
)− ρ
∂tw(t)
w(t)(26)
with the boundary conditions540 [∂χv −
w(t)
2δ2(ρ(ρ− 1))
]χ=±1
= 0 (27)
This system of equations has steady-states for ρ = 1, w(t) = w, v = 0, where w
is the final width of the film. We next linearize around this steady state, i.e.,
choose ρ = 1+ ερ, w(t) = w+ εw, v = εv, where ε is a small quantity. To linear
order the equations of motion then become
δ2∂2χv −
w2
4v =
w
2∂χρ (28)
545
∂tρ = − 2
w∂χv (29)
and
∂χv =w
2δ2ρ at χ± 1. (30)
22
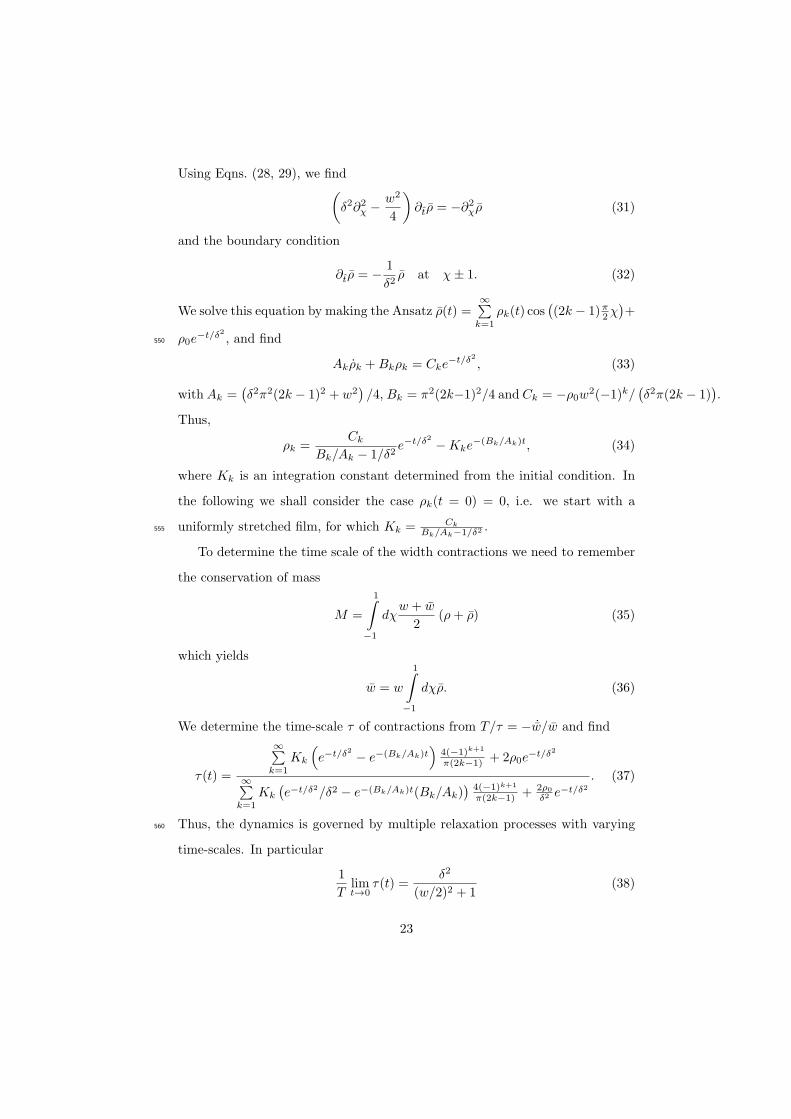
Using Eqns. (28, 29), we find(δ2∂2
χ − w2
4
)∂tρ = −∂2
χρ (31)
and the boundary condition
∂tρ = − 1
δ2ρ at χ± 1. (32)
We solve this equation by making the Ansatz ρ(t) =∞∑k=1
ρk(t) cos((2k − 1)π2χ
)+
ρ0e−t/δ2 , and find550
Akρk +Bkρk = Cke−t/δ2 , (33)
withAk =(δ2π2(2k − 1)2 + w2
)/4, Bk = π2(2k−1)2/4 and Ck = −ρ0w
2(−1)k/(δ2π(2k − 1)
).
Thus,
ρk =Ck
Bk/Ak − 1/δ2e−t/δ2 −Kke
−(Bk/Ak)t, (34)
where Kk is an integration constant determined from the initial condition. In
the following we shall consider the case ρk(t = 0) = 0, i.e. we start with a
uniformly stretched film, for which Kk = Ck
Bk/Ak−1/δ2 .555
To determine the time scale of the width contractions we need to remember
the conservation of mass
M =
1∫−1
dχw + w
2(ρ+ ρ) (35)
which yields
w = w
1∫−1
dχρ. (36)
We determine the time-scale τ of contractions from T/τ = − ˙w/w and find
τ(t) =
∞∑k=1
Kk
(e−t/δ2 − e−(Bk/Ak)t
)4(−1)k+1
π(2k−1) + 2ρ0e−t/δ2
∞∑k=1
Kk
(e−t/δ2/δ2 − e−(Bk/Ak)t(Bk/Ak)
) 4(−1)k+1
π(2k−1) + 2ρ0
δ2 e−t/δ2. (37)
Thus, the dynamics is governed by multiple relaxation processes with varying560
time-scales. In particular
1
Tlimt→0
τ(t) =δ2
(w/2)2 + 1(38)
23

and1
Tlimt→∞
τ(t) = δ2 +w2
π2(39)
In the experimental parameter regime, the time scale we measure is presumably
intermediate,
τ = αη
sρ20+ β
γ
sρ20W 2
0 , (40)
where α and β are dimensionless quantities which we determine numerically.565
To obtain α and β for a given set of input parameters, we numerically solve
Eqns. (7,11,13) and extract the time scale τ(W0) for several initial widths. We
then fit the results to the functional form of Eq. 40.
In the experimental regime, using the parameters for which the theoretical
contraction profiles best agree with the numerical one (see Figure 5B), we esti-570
mate α ≃ 2.2± 0.05 and β ≃ 0.085± 0.006. The error estimates were obtained
by sampling α and β over a range of input parameters between half and twice
the best fit values, and evaluating a standard error on the computed values.
5.3 Numerical Treatment
To solve Eqns. (7,11,13) numerically, we discretize the system by representing575
ρ on an equispaced grid between x = −W (t)/2 and x = W (t)/2, where W (t) is
the instantaneous width of the contracting film. The instantaneous film velocity
is determined from Eq. (11) using a second order finite difference scheme. The
boundary conditions σ = 0 at x = ±W (t)/2, are implemented using an asym-
metric second order finite difference stencil, see (Tornberg and Shelley, 2004).580
We determine the time derivative of density using Eq. (26) with the boundary
condition specified in Eq. (27), which account for the grid contracting with the
width of the film. We time-evolve Eqns. (26,13) using a adaptive second or-
der time stepping provided by Scientific Python project (Jones and Oliphant,
2001-).585
24
6 Acknowledgments
The authors would like to thank Bryan Hassell for assistance fabricating the
microfluidic devices, Thomas Surrey for the generous gift of the GST-p150-
CC1 plasmid, and Tim Mitchison for the gift of labeled NUMA antibody. SF
acknowledges support by Human Frontiers Science Program. This work was590
supported by National Science Foundation Grants PHY-0847188, PHY-1305254,
and DMR-0820484 to DJN and Grant DMR-1420073 to MJS, and National
Institutes of Health Grant 1R01GM104976-01 to MJS.
References
[1] Wordeman L. 2010. How kinesin motor proteins drive mitotic spindle
function: Lessons from molecular assays. Semin Cell Dev Biol 21:260–8.
doi:10.1016/j.semcdb.2010.01.018.
[2] Mitchinson, TJ, Cramer LP. 1996. Actin-Based Cell Motility and Cell Lo-
comotion, Cell 84:371–379
[3] Mayer M, Depken M, Bois JS, Julicher F, Grill, SW. 2010. Anisotropies in
cortical tension reveal the physical basis of polarizing cortical flows. Nature
467:617–621. doi:10.1038/nature09376.
[4] Naganathan SR, Furthauer S, Nishikawa M Julicher F, Grill SW. 2014. Ac-
tive torque generation by the actomyosin cell cortes drives left-right sym-
metry breaking. elife 3:w04165. doi: 10.7554/eLife.04165
[5] Murrell MP, Gardel ML. 2012. F-actin buckling coordinates contractility
and severing in a biomimetic actomyosin cortex. Proc Natl Acad Sci USA
109:20820–20825. doi:10.1073/pnas.1214753109.
25
[6] Bendix PM, et al. (2008) A Quantitative Analysis of Contractil-
ity in Active Cytoskeletal Protein Networks. Biophys J 94:3126–3136.
doi:10.1529/biophysj.107.117960.
[7] Kohler S, Bausch AR. 2012. Contraction Mechanisms in Composite Active
Actin Networks. PLOS ONE 7:e39869. doi:10.1371/journal.pone.0039869.
[8] Alvarado J, Sheinman M, Sharma A, MacKintosh FC, Koenderink, GH.
2013. Molecular motors robustly drive active gels to a critically connected
state. Nat Phys 9:591–597. doi:10.1038NPHYS2715
[9] Szent-Gyorgyi A. 1943. Observations on actomyosin. Stud Inst Med Chem
Univ Szeged 3:86– 92.
[10] Weisenberg R, Cianci C. 1984. ATP-induced Gelation-Contraction of Mi-
crotubules Assembled In Vitro. J Cell Biol 99:1527–1533.
[11] Gaglio T, Saredi A, and Compton DA.1995. NuMA is required for the
organization of micro- tubules into aster-like mitotic arrays. J Cell Biol
131:693–708.
[12] Mountain V, Simerly C, Howard L, Ando A, Schatten G, Compton
DA.1999. The kinesin-related protein, HSET, opposes the activity of Eg5
and cross-links microtubules in the mammalian mitotic spindle. J Cell Biol
147:351–366.
[13] Verde F, Berrez JM, Antony C, Karsenti E. 1991. Taxol-induced micro-
tubule asters in mitotic extracts of Xenopus eggs: requirement for phos-
phorylated factors and cytoplasmic dynein. J Cell Biol 112:1177–1187.
[14] Elting MW, Hueschen CL, Udy DB, Dumont S. 2014. Force on spin-
dle microtubule minus ends moves chromosomes. J Cell Biol 206:245–256.
doi:10.1083/jcb.201401091.
26
[15] Heald R, Tournebize R, Blank T, Sandaltzopoulos R, Becker P, Hyman
A, and Karsenti E. 1996. Self-organization of microtubules into bipolar
spindles around artificial chromosomes in Xenopus egg extracts. Nature
382:420–425.
[16] Burbank KS, Mitchison TJ, Fisher DS. 2007. Slide-and-Cluster Models for
Spindle Assembly. Curr Biol 17:1373–1383. doi:10.1016/j.cub.2007.07.058.
[17] Khodjakov A, Copenagle L, Gordon MB, Compton DA, and Kapoor TM.
2003. Minus-end capture of preformed kinetochore fibers contributes to
spindle morphogenesis. J Cell Biol 160:671–683. doi:10.1083/jcb.200208143.
[18] Goshima G, Nedelec F, and Vale RD. 2005. Mechanisms for focusing mitotic
spindle poles by minus end-directed motor proteins. J Cell Biol 171:229–
240. doi:10.1083/jcb.200505107.
[19] Nedelec FJ, Surrey T, Maggs AC, Leibler S. 1997. Self-organization of
microtubules and motors. Nature 389:305–308.
[20] Hentrich C, and Surrey T. 2010. Microtubule organization by the antag-
onistic mitotic motors kinesin-5 and kinesin-14. J Cell Biol 189:465–480.
doi:10.1083/jcb.200910125.
[21] Urrutia R, McNiven MA, Albanesi, JP, Murphy DB, Kachar B. 1991. Pu-
rified kinesin promotes vesicle motility and induces active sliding between
microtubules in vitro. Proc Natl Acad Sci USA 88 6701–6705
[22] Sanchez T, Chen DTN, DeCamp SJ, Heymann M, Dogic Z. 2012. Spon-
taneous motion in hierarchically assembled active matter. Nature 491:431–
434. doi:10.1038/nature11591.
[23] Prost J, Julicher F, Joanny JF. 2015. Active gel physics. Nature Phys
11:111–117. doi:10.1038/NPHYS3224.
27
[24] Marchetti MC, et al. 2013. Hydrodynamics of soft active matter. Rev Mod
Phys 85:1143–1189. doi:10.1103/Rev Mod Phys.85.1143.
[25] Brugues J, Needleman D. 2014. Physical basis of spindle self-organization.
Proc Natl Acad Sci USA 111:18496–18500. doi:10.1073/pnas.1409404111.
[26] Kruse K, Julicher F. 2000. Actively contracting bundles of polar filaments.
Phys Rev Lett 85:1778–1781.
[27] Hyman AA, Karsenti E. 1996. Morphogenetic properties of microtubules
and mitotic spindle assembly. Cell 84:401–10.
[28] McKenney RJ, Huynh W, Tanenbaum ME, Bhabha G, Vale RD. 2014.
Activation of cytoplasmic dynein motility by dynactin-cargo adapter com-
plexes. Science. 345(6194):337–341. doi: 10.1126/science.1254198
[29] Liverpool TB, Marchetti MC, Joanny JF, Prost J. 2009. Mechani-
cal response of active gels. Europhys Lett 85:18007. doi:10.1209/0295-
5075/85/18007.
[30] Lenz M. 2014. Geometrical Origins of Contractility in Disordered Acto-
myosin Networks. Phys Rev X 4:041002. doi:10.1103/PhysRevX.4.041002.
[31] Soares e Silva M et al. 2011. Active multistage coarsening of actin net-
works driven by myosin motors. Proc Natl Acad Sci USA 108:9408–9413.
doi:10.1073/pnas.1016616108.
[32] Gao T, Blackwell R, Glaser MA, Betterton MD, Shelley MJ. 2015. Mul-
tiscale Polar Theory of Microtubule and Motor-Protein Assemblies. Phys
Rev Lett 114:048101. doi:10.1103/PhysRevLett.114.048101.
[33] Blackwell R, Sweezy-Schindler O, Baldwin C, Hough LE, Glaser M, Bet-
terton MD. 2015. Microscopic origins of anistropic active stress in motor-
driven nematic liquid crystals. Soft Matter doi: 10.1039/C5SM02506K.
28
[34] Hannak E, Heald R. 2006. Investigating mitotic spindle assembly and func-
tion in vitro using Xenopus laevis egg extracts. Nat Protoc 1:2305–2314.
doi:10.1038/nprot.2006.396.
[35] Mitchison TJ, Nguyen P, Coughlin M, Groen AC. 2013. Self-organization
of stabilized mi- crotubules by both spindle and midzone mechanisms in
Xenopus egg cytosol. Mol Biol Cell 24:1559–1573. doi:10.1091/mbc.E12-12-
0850.
[36] Oswald P. 2009. Rheophysics. Cambridge Univ Press
[37] Coussy O. 2004. Poromechanics John Wiley and Sons, Ltd
[38] Needleman DJ, Groen A, Ohi R, Maresca T, Mirny L, Mitchison T. 2010.
Fast microtubule dynamics in meiotic spindles measured by single molecule
imaging: evidence that the spindle environment does not stabilize micro-
tubules. Mol Biol Cell 21:323–333. doi/10.1091/mbc.E09 09 0816.
[39] Shimamoto Y, Maeda YT, Ishiwata S, Libchaber AJ, Kapoor TM. 2011.
Insights into the Micromechanical Properties of the Metaphase Spindle.
Cell. 145(7):1062–74. doi:10.1016/j.cell.2011.05.038
[40] Nicholas MP, Hook P, Brenner S, Wynne CL, Vallee RB, Gennerich A.
2015. Control of cytoplasmic dynein force production and processivity by
its C-terminal domain. Nat. Commun. 6:6206. doi:10.1038/ncomms7206
[41] Sawin KE, LeGuellec K, Philippe M, Mitchison TJ. 1992. Mitotic spindle
organization by a plus-end-directed microtubule motor. Nature 359:540–
543.
[42] Mitchison TJ, et al. 2005. Roles of polymerization dynamics, opposed mo-
tors, and a tensile element in governing the length of Xenopus extract
meiotic spindles. Mol Biol Cell 16:3064– 3076. doi/10.1091/mbc.E05 02
0174.
29
[43] Gaetz J, and Kapoor TM. 2004. Dynein/dynactin regulate metaphase spin-
dle length by targeting depolymerizing activities to spindle poles. J Cell Biol
166:465–471. doi/10.1083/jcb.200404015.
[44] Gatlin JC, et al. 2009. Spindle Fusion Requires Dynein-Mediated Slid-
ing of Oppositely Oriented Microtubules. Curr Biol 19:287–296. DOI
10.1016/j.cub.2009.01.055.
[45] Gatlin JC, Matov A, Danuser G, Mitchison TJ, Salmon ED. 2010. Directly
probing the mechanical properties of the spindle and its matrix. J Cell Biol
188:481–489. doi:10.1083/jcb.200907110.
[46] Uteng M, Hentrich C, Miura K, Bieling P, Surrey T. 2008. Poleward trans-
port of Eg5 by dynein-dynactin in Xenopus laevis egg extract spindles. J
Cell Biol 182:715–726. doi:10.1083/jcb.200801125.
[47] Parsons SF, Salmon ED. 1997. Microtubule assembly in clarified Xenopus
egg extracts. Cell Motil Cytoskeleton. 36(1):1–11.
[48] Thielicke W, Stamhuis EJ. 2014. PIVlab–Towards User-friendly, Affordable
and Accurate Digital Particle Image Velocimetry in MATLAB. Journal of
Open Research Software 2(1):e30. DOI: http://dx.doi.org/10.5334/jors.bl
[49] Doi M, Onuki A. 1992. Dynamic coupling between stress and com-
position in polymer solutions and blends. Journal de Physique II.
doi:10.1051/jp2:1992225
[50] Joanny JF, Julicher F, Kruse K, Prost J. 2007. Hydrodynamic the-
ory for multi-component active polar gels. New J Phys. 9(11):422–2.
doi:10.1088/1367-2630/9/11/422
[51] Surrey T, Nedelec F, Leibler S, Karsenti E. 2001. Physical proper-
ties determining self-organization of motors and microtubules. Science.
292(5519):1167–71. doi:10.1126/science.1059758
30
[52] Tornberg AK, Shelley MJ. 2004. Simulating the dynamics and interac-
tions of flexible fibers in Stokes flows. Journal of Computational Physics.
doi:10.1016/j.jcp.2003.10.017
[53] E. Jones, T. Oliphant, P. Peterson and others, www.scipy.org (2001–)
7 Figure Legends
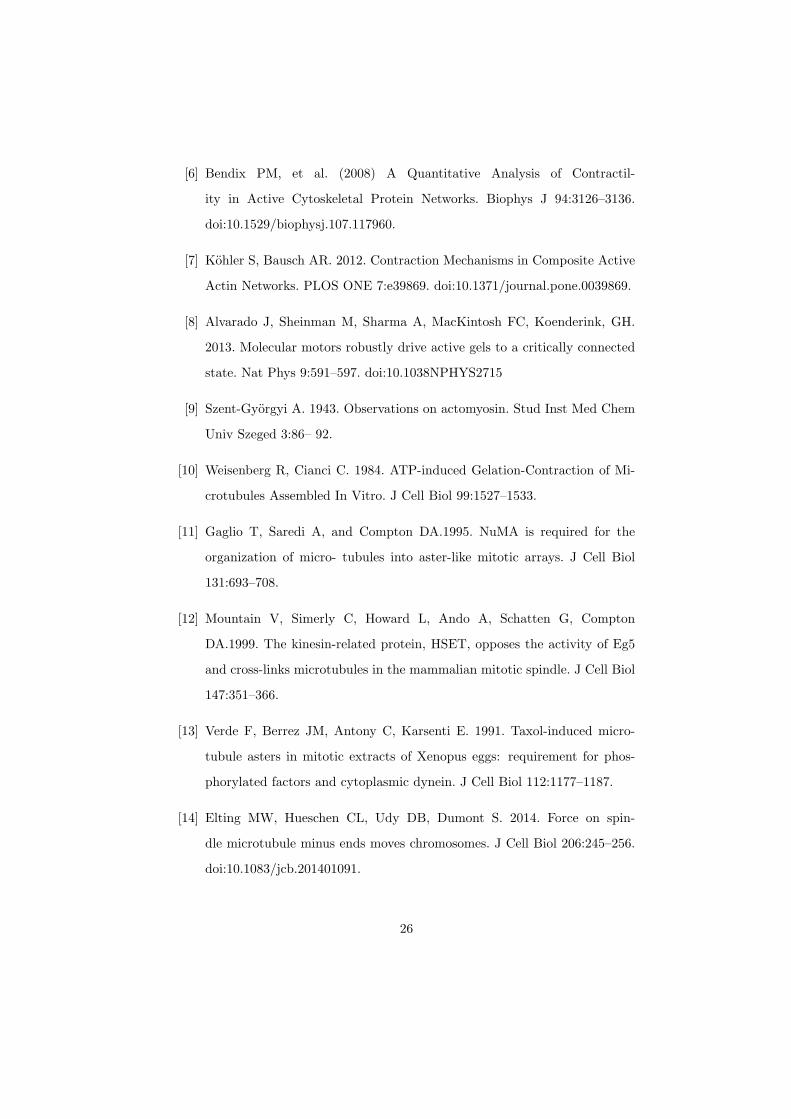
Figure 1 Stabilized microtubules form asters in Xenopus egg extracts. (A)
Experiments were performed in thin rectangular channels of width W0, height
H0 and length L0. (B) In some regions of the channel, microtubules organize into
asters, with minus ends localized in the aster core (Scale bar, 5µm). (C) Isolated
asters fuse together over minute timescales (Scale bar, 5µm). (D) Aster-like
structures form in other regions of the channel (Scale bar, 10µm) (E) Aster-like
structures show large scale movement on minute timescales. (Scale bar, 25µm).
(F) NUMA localizes to the network interior (Scale bar, 20µm). (F) Closeup of
aster-like structure showing NUMA localized on the interior (Scale bar, 10µm).
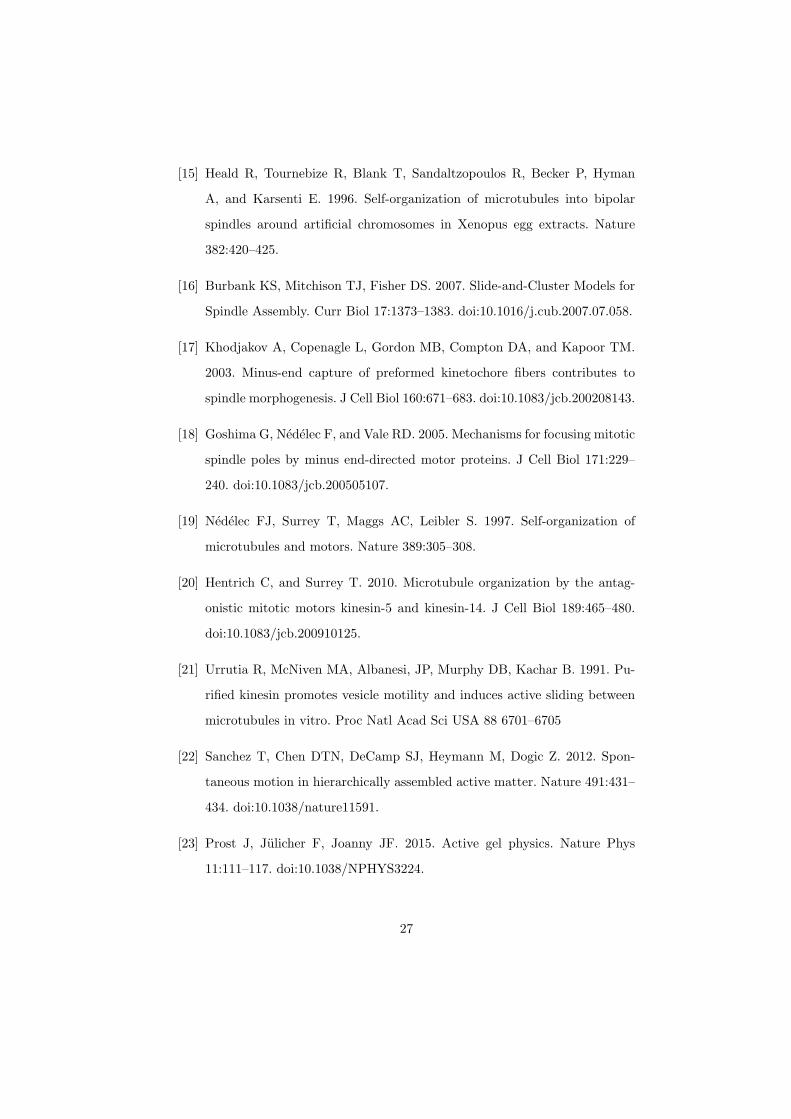
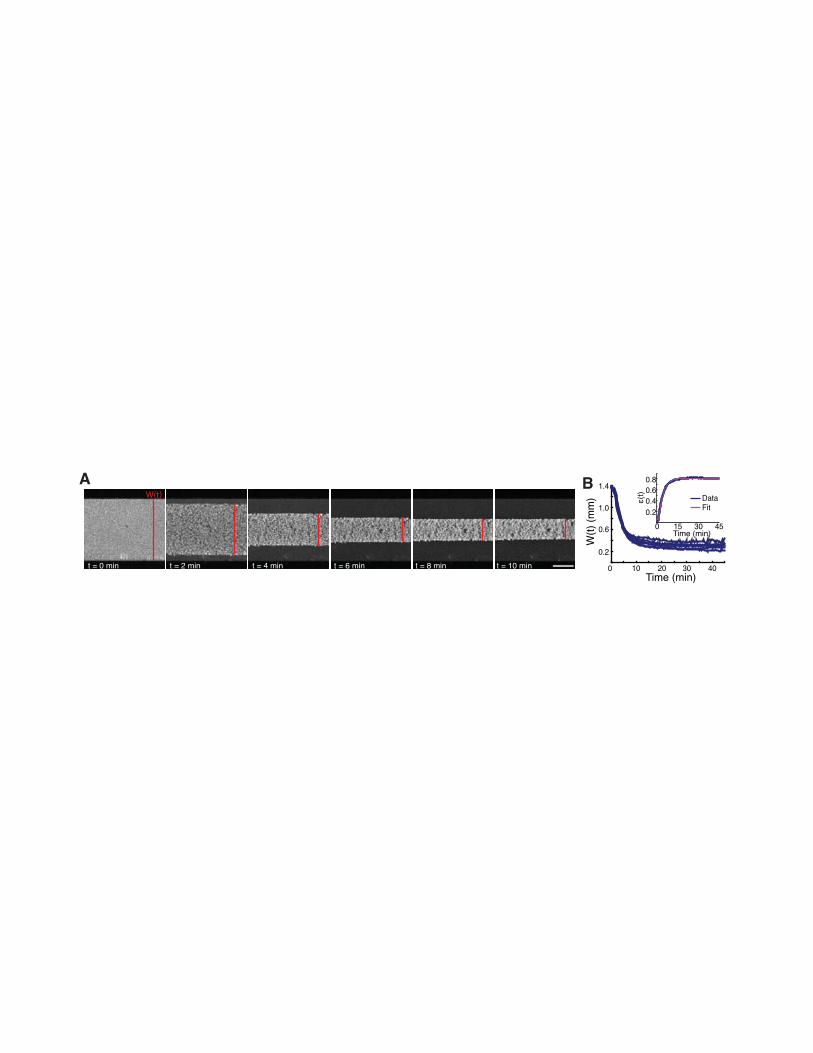
Figure 2 Stabilized microtubules form a contractile network in Xenopus
egg extracts. (A) Low magnification imaging shows that microtubules form
a contractile network (Scale bar, 500µm). (B) The width of the microtubule
network decreases with time (n = 6 experiments). (Inset) Representative plot
of ϵ(t) (Blue line) and fit from Eqn. 2 (Pink line), with ϵ∞ = 0.81 , τ = 3.49
min, Tc = 1.06 min.
Figure 2-figure supplement 1 Plots of ϵ(t) from data in Figure 1F (Blue
lines) along with fits from Eqn. 2 (Pink lines).
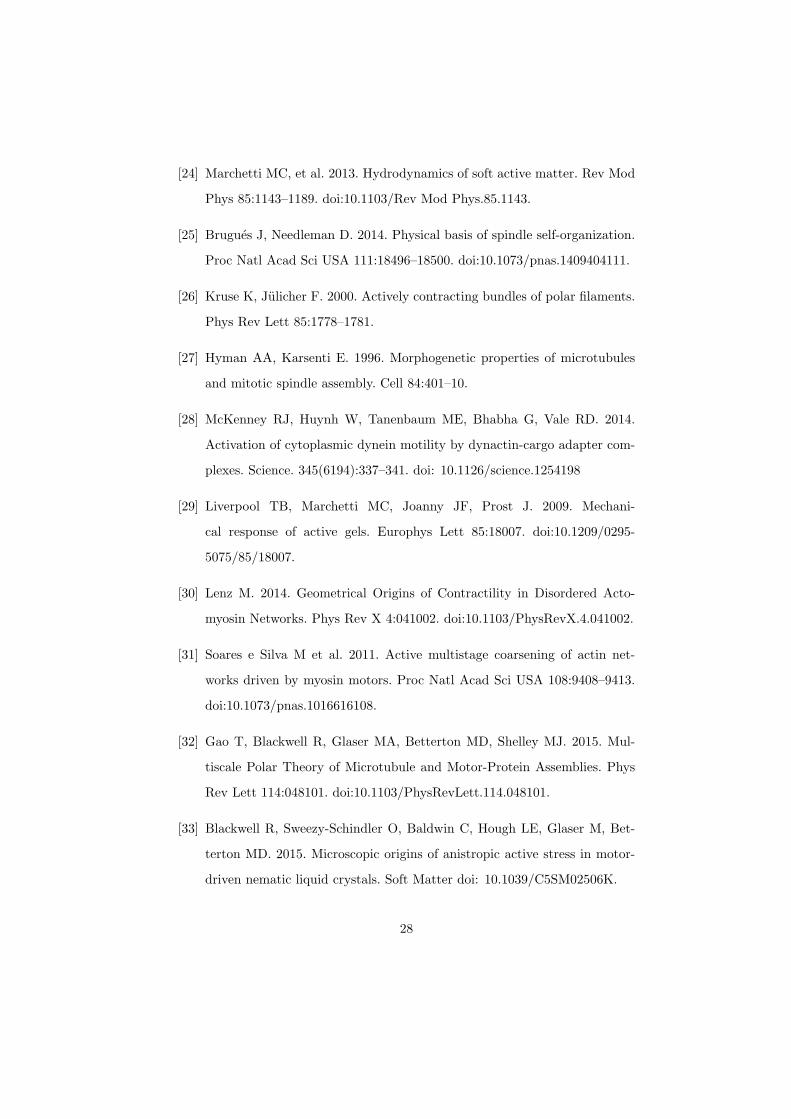
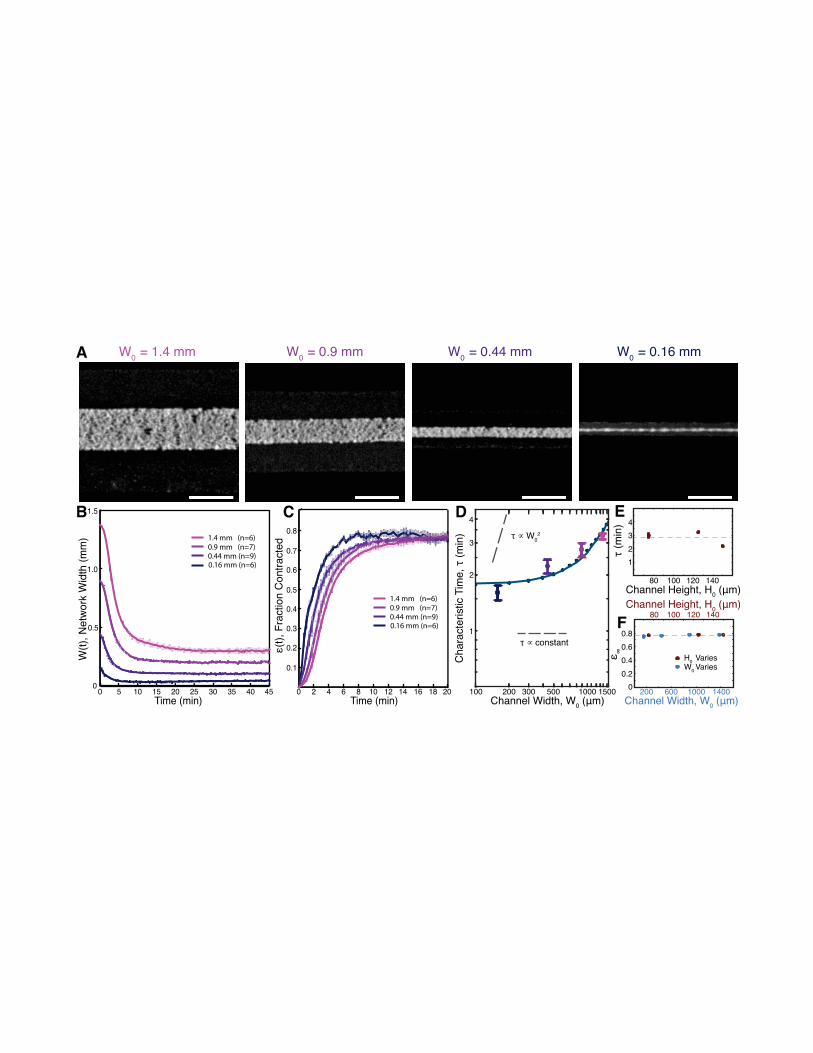
Figure 3 Contraction dynamics in channels of different width provide a
means to test potential contraction mechanisms. (A) Microtubules form con-
tractile networks in channels with various widths (Scale bar, 500 µm, t=10
minutes) (B) Width of the networks as a function of time in channels with
various widths. (C) Fraction contracted as a function of time, ϵ(t), calculated
31
from the data in B. The networks all contract to a similar final fraction, while
the timescale of contraction differs. (D) The scaling of the characteristic time,
τ , with channel width does not vary as W 20 , as would result for a poroelastic
timescale, and is not a constant, independent of width, as would result from a
viscoelastic time scale. The scaling is well described by an active fluid model
(green line analytic scaling, fit to Eqn. 6; green dots numerical solution). (E)
The characteristic time, τ , is found to be independent of channel height. The
dashed line is the mean value of τ . (F) ϵ∞ is constant for all channel widths
and heights, indicating that the network contracts to a constant final density.
The dashed line is the mean value of ϵ∞. All panels display mean ± s.e.m.
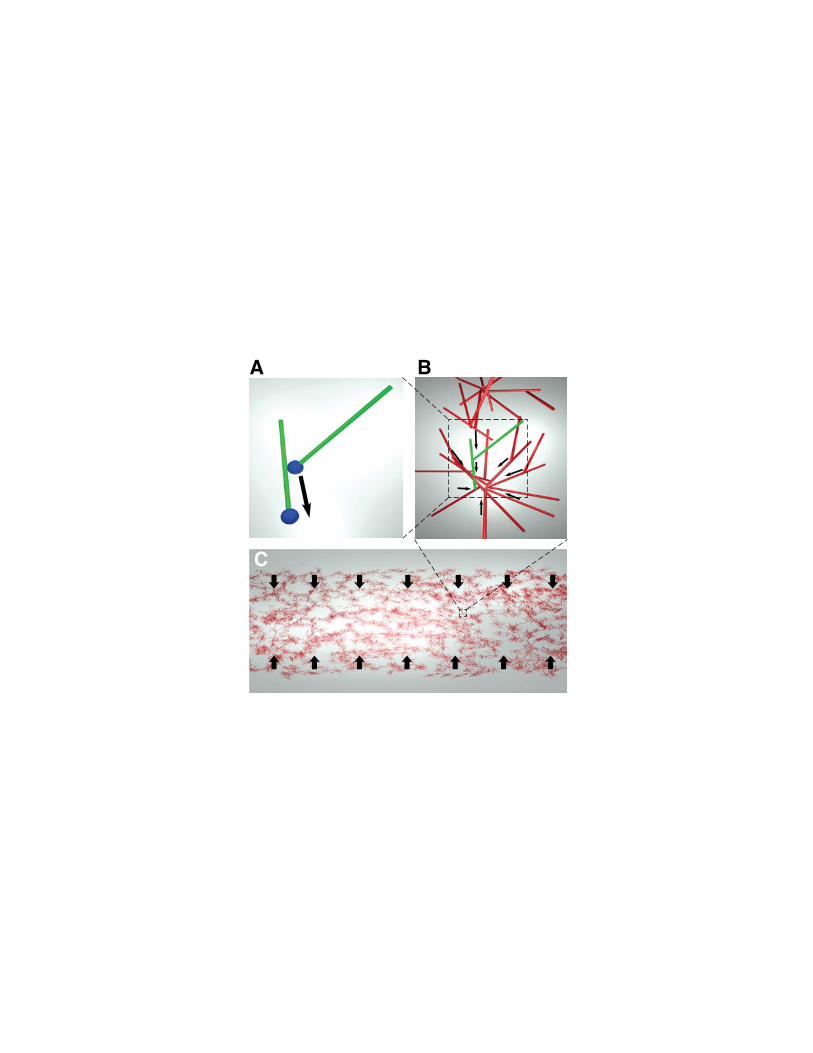
Figure 4 Cartoon of the microscopic model underlying the active fluid the-
ory of network contractions by minus end clustering. (A) Microtubule sliding by
dynein drives microtubule minus ends together. (B) Minus end clustering leads
to the formation of aster-like structures. Due to steric interactions between mi-
crotubules, there is an upper limit to the local microtubule density. (C) The
microtubule network is composed of interacting asters. Motor activity driving
aster cores together leads to bulk contraction of the network.
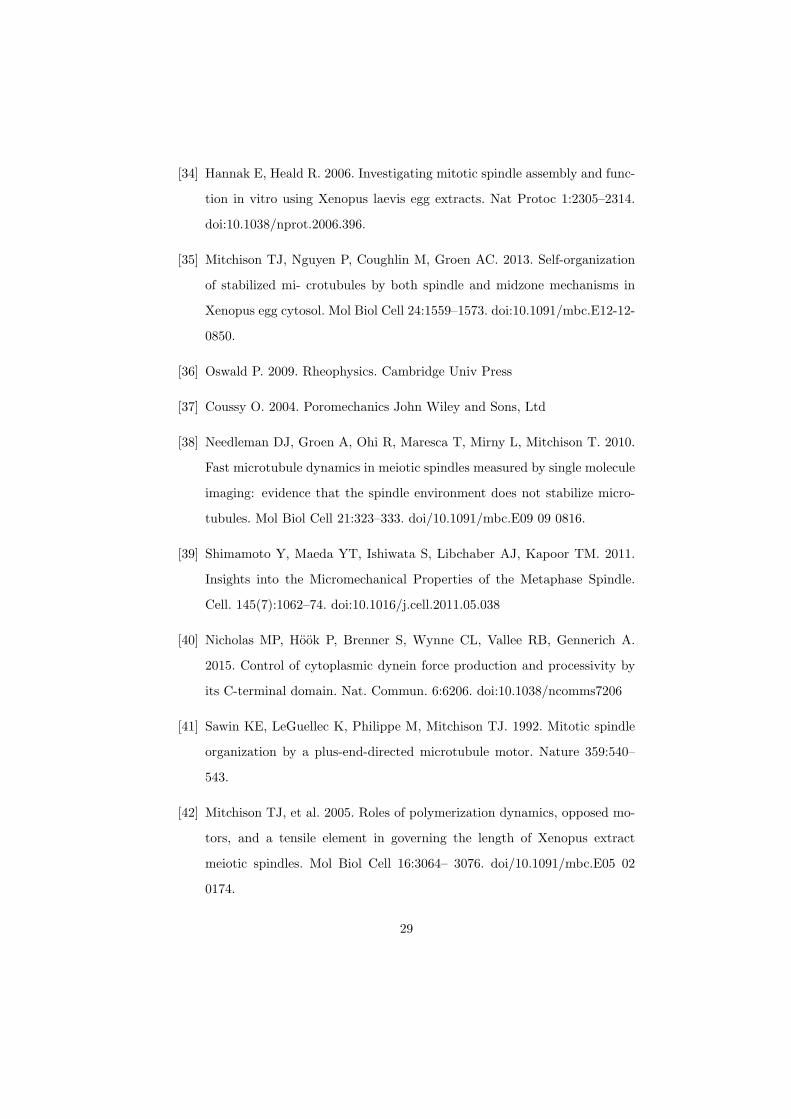
Figure 5 Microtubule density increases at the network’s edges during con-
traction. (A) Time series of contraction showing intensity averaged along the
length of the channel. The average intensity peaks at the network’s edges due
to increased local microtubule density. (Scale bars, 500 µm) (B) Comparison
of measured density profiles (solid lines) with density profiles from simulation
(dashed lines). Data are plotted at 1 minute intervals starting at t = 40 sec. (C)
Representative frame from PIV showing the network’s local velocity component
along the network’s width. (D) Comparison between measured (solid red line)
and simulated (dashed red line) velocity along the width of the channel at t =
80 sec. The measured and simulated velocities increase superlinearly with dis-
tance from the center of the network, as can be seen by comparison to a linear
velocity profile (dashed black line).
32
Figure 5-figure supplement 1 Comparison between measured (solid lines)
and simulated (dashed lines) density profiles. Data are plotted at 2 minute
intervals starting at t = 40 sec.
Figure 6 Network contraction is a dynein-dependent process. (A) Fraction
contracted as a function of time, ϵ(t), when dynein is inhibited using p150-CC1.
(B) The characteristic time of contraction, τ , increases with increasing p150-
CC1 concentration. Solid green line indicates fit of sigmoid function. (C) ϵ∞ has
no apparent variation with p150-CC1 concentration. Solid green line indicates
the mean value of ϵ∞. All panels display mean ± s.e.m.
Figure 6-figure supplement 1 Inhibition of Kinesin-5 has little effect
on the contraction process. (A) Comparison of ϵ(t) curves for samples where
Kinesin-5 was inhibited using STLC and control where no STLC was added.
(B) Simultaneous inhibition of dynein with p150-CC1 and Kinesin-5 with STLC
does not rescue the effects of dynein inhibition alone. All panels display mean
± s.e.m.
Figure 6-figure supplement 2 Plots of ϵ(t) from experiments with 2 µM
p150-cc1 (Blue lines) along with fits from Eqn. 2 (Pink lines).
8 Video Legends
Video 1 - Isolated asters undergo coalescence Taxol stabilized micro-
tubules in Xenopus oocyte extracts self-organize into asters that can then co-
alesce. The mageneta channel depicts microtubules while the green channel
depicts NUMA localization, here used as a proxy for microtubule minus ends.
Time is shown in minutes : seconds.
Video 2 - Microtubules organize into dynamic aster-like structures
In other regions of the channel, microtubules organize into aster-like structures
that exhibit large scale movement on the minute timescale. Time is shown in
minutes : seconds.
33
Video 3 - Microtubule networks undergo a spontaneous bulk con-
traction Low magnification imaging of the channels reveals that microtubules
organize into a macroscopic network that spontaneously contracts on the mil-
limeter length scale. Time is shown in minutes : seconds.
Video 4 - Microtubule networks can undergo tearing During contraction,
tears can develop in the microtubule network, causing the network to break.
Time is shown in minutes : seconds.
Video 5 - Network contraction in channels of varying width Devices
were fabricated with different widths. Each video panel depicts a representative
experiment using channels of the given width. Time is shown in minutes :
seconds.
34

L 0
W0 H0
t = 30 sec t = 60 sec
A B
ED
t = 90 sec
t = 30 sec t = 60 sec t = 90 sec
C
F GTubulin
TubulinαNUMA
t = 0 min t = 2 min t = 4 min t = 6 min t = 8 min t = 10 min
A B
Time (min)0 10 20 30 40
0.2
0.6
1.0
1.4
W(t
) (m
m)
0 15 30 45
0.20.40.60.8
Time (min)
W(t) DataFit
B C
A
100 200 300 500 1000 1500
1
2
3
4
Cha
ract
eris
tic T
ime,
(
min
)
Channel Width, W0
1
2
3
4
10080 120 140Channel Height, H0
Time (min)0 5 10 15 20 25 30 35 40 45
0
0.5
1.0
1.5
W(t
), N
etw
ork
Wid
th (
mm
)
0.16 mm (n=6) 0.44 mm (n=9) 0.9 mm (n=7) 1.4 mm (n=6)
constant
W02
0
0.2
0.4
0.6
0.8
Channel Width, W0
200 600 1000 1400
F
ED
0 2 4 6 8 10 12 14 16 18 20
0.1
0.2
0.3
0.4
0.5
0.6
0.7
0.8
80 100 120 140
H0 W0 Varies
0.16 mm (n=6) 0.44 mm (n=9) 0.9 mm (n=7) 1.4 mm (n=6)
W0 = 1.4 mm W0 = 0.9 mm W0 = 0.44 mm W0 = 0.16 mm
Varies
Channel Height, H0
Time (min)
A B
C
pos
Intensity (AU)
2040
6080
100120
140160
180200
pos20
4060
80100
120140
160180
200
20
Intensity (AU) Intensity (AU) Intensity (AU)t = 0 min t = 2 min t = 4 min t = 6 minA
B C D
-400 4002000-200-600 600
Rel
ativ
e D
ensi
ty
0.006
0.010
0.014
0.018
-400-600 600
0
-50
-100
50
100
-200 0 200 400
0.0 μM p150-CC1 (n=6) 0.05 μM p150-CC1(n=6)0.1 μM p150-CC1 (n=7)
0.15 μM p150-CC1 (n=7) 0.2 μM p150-CC1 (n=6) 0.25 μM p150-CC1 (n=6)
1.0 μM p150-CC1 (n=5)2.0 μM p150-CC1 (n=6)
15 25 3550
0.10.20.30.40.50.60.70.8
150 200 250 300 350
0
0.2
0.4
0.6
0.8
1.0
0 0.4 1.2 1.6 2.00
20
40
60
80
A
B
0.8 0 0.4 1.2 1.6 2.00.8
C100