Embed Size (px)
Citation preview
Accepted manuscript doi: 10.1680/jgeot.17.p.133
Submitted: 17 May 2017
Published online in ‘accepted manuscript’ format: 29 March 2018
Manuscript title: A conceptual constitutive model unifying slurried (saturated), compacted
(unsaturated) and dry states
Authors: M. Pedrotti* and A. Tarantino*
Affiliation: *Department of Civil and Environmental Engineering, University of Strathclyde,
Glasgow, Scotland, UK.
Corresponding author: M. Pedrotti, Department of Civil and Environmental Engineering,
University of Strathclyde, James Weir Building - Level 5, 75 Montrose Street - Glasgow G1
1XJ, Scotland, UK.
E-mail: [email protected]
Downloaded by [ University of Strathclyde] on [16/04/18]. Copyright © ICE Publishing, all rights reserved.
Accepted manuscript doi: 10.1680/jgeot.17.p.133
Abstract
Reconstituted and compacted soils are commonly assumed to exhibit a fundamentally different behaviour due to
different microstructure. However, inspection of pore size distribution of the same soil in compacted and
reconstituted states suggests that the boundary between these two states is more blurred. This paper explores the
continuity between the microstructure of reconstituted and compacted states of kaolin clay and formulates a
conceptual constitutive model unifying these states. Clay samples were prepared by saturating the pore space
with different fluids (water, acetone, and air) and the effect of pore-fluid fraction on the micro- and macroscale
response of the clay was investigated experimentally. A conceptual constitutive model for unsaturated clays for
quasi-isotropic stress states was therefore formulated, which allows modelling various unsaturated hydro-
mechanical paths based on constitutive parameters only derived from the compression behaviour of clay under
dry and saturated conditions (testing on samples formed from dry powder and slurry respectively).
Keywords: Clay; micromechanics; unsaturated clay; saturated clay; compacted; mercury intrusion porosimetry
Downloaded by [ University of Strathclyde] on [16/04/18]. Copyright © ICE Publishing, all rights reserved.
Accepted manuscript doi: 10.1680/jgeot.17.p.133
INTRODUCTION
Soil microstructure is often the key to interpret major aspects of hydro-mechanical response
of unsaturated (compacted) soils. Implicit or explicit microstructural assumptions have been
used to inform mechanical constitutive models (Gallipoli et al., 2003, Wheeler et al., 2003,
Tarantino, 2007, Alonso et al., 2012) and water retention constitutive models (Romero et al.,
2011).
Microstructure of clays in reconstituted and compacted states has been assumed to be
controlled by the conditions ‘at formation’ (Delage et al., 1983, Delage et al., 2006, Romero
et al., 1999, Tarantino and Tombolato, 2005, Romero and Simms, 2008, Romero et al., 2011).
Reconstituted clays typically show a mono-modal Pore-Size Distribution (PSD) with the
dominant class of pores into the micro-pore range. Reconstituted clays are traditionally
assumed to have a matrix-like fabric, with the mechanical behaviour controlled by particle-
to-particle or cluster-to-cluster electro-chemical interactions (McConnachie, 1974).
Sample compacted on the dry side of optimum (and at optimum water content) typically
show a bi-modal PSD with two dominant classes of pores, one within the micro-pore range
and the other within the macro-pore range (Delage et al., 1996, Tarantino and De Col, 2008).
The bi-modal pore-size distribution is commonly associated with an aggregated
microstructure with the macro-pores representing the intra-aggregate porosity and the micro-
pores representing the inter-aggregate porosity respectively. On the other hand, clays
compacted on the wet-side of optimum typically show a mono-modal pore-size distribution
(Ahmed et al., 1974, Delage et al., 1996). These clays are generally assumed to have a
microstructure similar to reconstituted clays because of the similar mono-modal PSD.
Although different compaction water contents give rise to different PSDs, Tarantino and De
Col (2008) observed that the characteristic pore size associated with micro- and macro-
porosities in compacted kaolin remain the same from very low water contents (dry-side of
Downloaded by [ University of Strathclyde] on [16/04/18]. Copyright © ICE Publishing, all rights reserved.
Accepted manuscript doi: 10.1680/jgeot.17.p.133
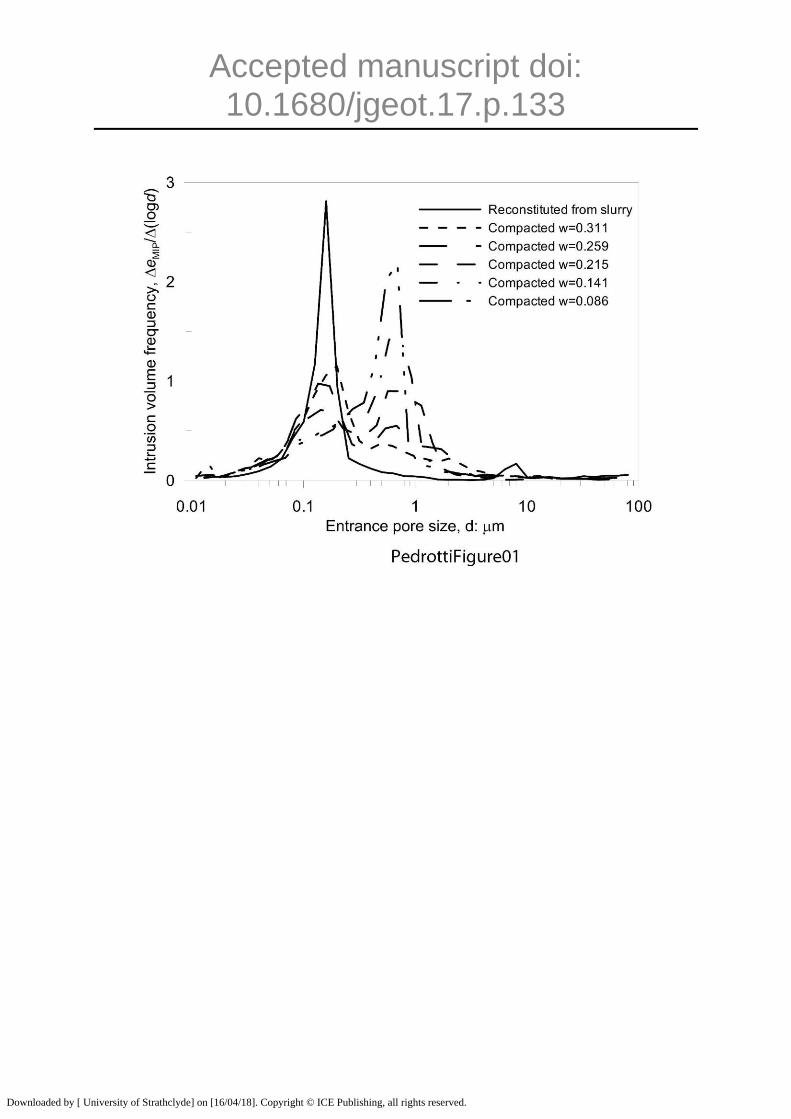
optimum) up to the water content at optimum. As shown in Figure 1, kaolin sample
compacted at optimum water content (w=0.311) shows a mono-modal PSD with modal size
of 0.2m. Samples compacted at intermediate water contents on the dry side of optimum
(w=0.141-0.259) show a micro-porosity in the same range (0.2m) in addition to a macro-
porosity with modal size 0.7 m. At very low water content (w=0.086), the PSD becomes
again mono-modal with the dominant size exactly in the same macro-porosity range (0.7
m).
The PSD of the sample compacted at very low water content (w=0.086) raises an apparent
paradox with respect to the traditional view of compacted clay made of aggregates. This
sample shows inter-aggregate porosity (macro-porosity) in the absence of intra-aggregate
porosity (micro-porosity) and, hence, in the absence of aggregates!
Moreover, the (mono-modal) pore size distribution of reconstituted samples (Figure 1) is
again characterised by the same micro-porosity range (0.2m) as shown by Tarantino
(2010). In other words, the changes in PSD generated by different formation processes seem
to be simply associated with a redistribution of pore volumes around the same two dominant
pore-sizes. There is therefore a common thread across different microstructures generated
within the same clay that have not yet been elucidated.
This paper aims to i) explore the continuity between the microstructure of reconstituted states
(clay formed saturated) and compacted states (clay formed partially saturated) and ii)
formulate a conceptual constitutive model unifying these states. The discussion is here
limited to clays that are non-active.
One of the differences between reconstituted and compacted states (spanning from dry to wet
of optimum) is represented by the nature and/or fraction of the pore-fluids at formation. Pores
are either occupied by a single fluid (reconstituted soils) or by two fluids (compacted soils).
Downloaded by [ University of Strathclyde] on [16/04/18]. Copyright © ICE Publishing, all rights reserved.
Accepted manuscript doi: 10.1680/jgeot.17.p.133
The strategy pursued to explore common features of these states was therefore to investigate
the effect of various pore-fluids and their fractions. To this end, ‘single-fluid’ samples were
prepared by saturating the pore space with fluids of different nature, i.e. water, acetone, and
air. These samples will be referred to as water-saturated, acetone-saturated, and air-saturated
samples. In addition, clay samples have been prepared by saturating the pore space with two
fluids of different nature, air and water or air and acetone. These samples will be referred to
as air/water-saturated and air/acetone-saturated samples.
MATERIAL AND SAMPLE PREPARATION
Speswhite kaolin with plastic limit wP=0.32 and liquid limit wL=0.64 was chosen for
tests presented in this paper The grain size distribution showed it to have 0.20 silt
fraction and 0.80 clay fraction.
Samples were prepared in five different ways for hydro-mechanical testing:
i) Water-saturated samples were reconstituted from slurry by mixing dry
powder of kaolin with demineralized water at water content equal to 0.96
(1.5 times the liquid limit);
ii) Air-saturated samples were prepared from air-dried clay powder (at
hygroscopic water content wh=0.006). Preliminary tests showed that
mechanical response of these samples under one-dimensional
compression was not different from the samples prepared from clay
powder oven-dried at 105C for 24h;
iii) Acetone-saturated samples were reconstituted from slurry by mixing dry
clay powder with acetone. The samples were initially prepared to an
acetone content equal to 0.96 (as the water-saturated samples);
Downloaded by [ University of Strathclyde] on [16/04/18]. Copyright © ICE Publishing, all rights reserved.
Accepted manuscript doi: 10.1680/jgeot.17.p.133
iv) Air/water saturated samples (compacted samples) were prepared by
laying oven dried powder kaolin in a large plastic basin in layers of about
10 mm and spraying each layer with demineralised water to reach the
target water content. The moistened powder was hand-mixed, and
saturated lumps cut by means of a spatula. The sample was therefore
tested without waiting for moisture equilibration. Preliminary tests showed
that compaction behaviour and PSD of such samples were not different
from samples tested after 24h moisture equilibration as per Tarantino and
De Col (2008);
v) Air/acetone saturated samples (sample compacted with acetone) were
prepared according to the procedure described above, but acetone was
used in place of water.
EXPERIMENTAL PROCEDURES
Single-fluid samples (air-, water-, and acetone- saturated) were subjected to 1-D
mechanical compression in an oedometer cell (diameter 75 mm). Samples were
loaded in steps (2, 3, 6, 12, 23, 45, 90, 178, 356, 711, 1422 kPa) to the target
vertical stress (either 70kPa or 2220 kPa) and unloading was performed in one
single step. Full consolidation was allowed for every loading/unloading step.
Two-fluid samples (air/water- and air/acetone-saturated) were compacted statically
in an oedometer cell (diameter 75 mm). The target vertical stress (either 300 or 1200
kPa) was reached in steps (150, 300, 600, 900, 1200 kPa). Although no drainage
was allowed and proper sealing was made, the acetone content of the air/acetone
saturated samples did not remain constant during static compaction because of the
high volatility of acetone. In order to reduce the amount of evaporation of acetone,
Downloaded by [ University of Strathclyde] on [16/04/18]. Copyright © ICE Publishing, all rights reserved.
Accepted manuscript doi: 10.1680/jgeot.17.p.133
the compaction tests took no more than 30 minutes. The acetone content was
therefore measured at the end of the compaction test.
Finally, air/water saturated (compacted) samples and air-saturated samples were
saturated with water in the oedometer cell by flooding the cell until the sample was
submerged. Sample saturation was performed under various vertical stresses
(nearly-zero vertical stress, 300 kPa and 1200kPa). After allowing for full
consolidation, the saturated samples were then loaded in steps to the target vertical
stress and unloaded in one single step.
Mercury intrusion porosimeter tests were carried out using an apparatus that
measures pore entrance size in the range from 0.003 μm to 1000 μm as described in
Pedrotti and Tarantino (2017). Samples prepared with water and subsequently
tested in the MIP were dehydrated by means of the freeze-drying technique as
described in Tarantino and De Col (2008) and Pedrotti and Tarantino (2017).
Samples containing acetone were dehydrated by placing them in the oven (105 C)
for 24 hours. Because of the low surface tension of the acetone, sample disturbance
due to oven-drying was assumed to be negligible. This was corroborated by the
comparison of macroscopic void ratio with the void ratio extrapolated from MIP test.
EXPERIMENTAL RESULTS
Microstructure of samples saturated at formation with single-fluid or two-fluids
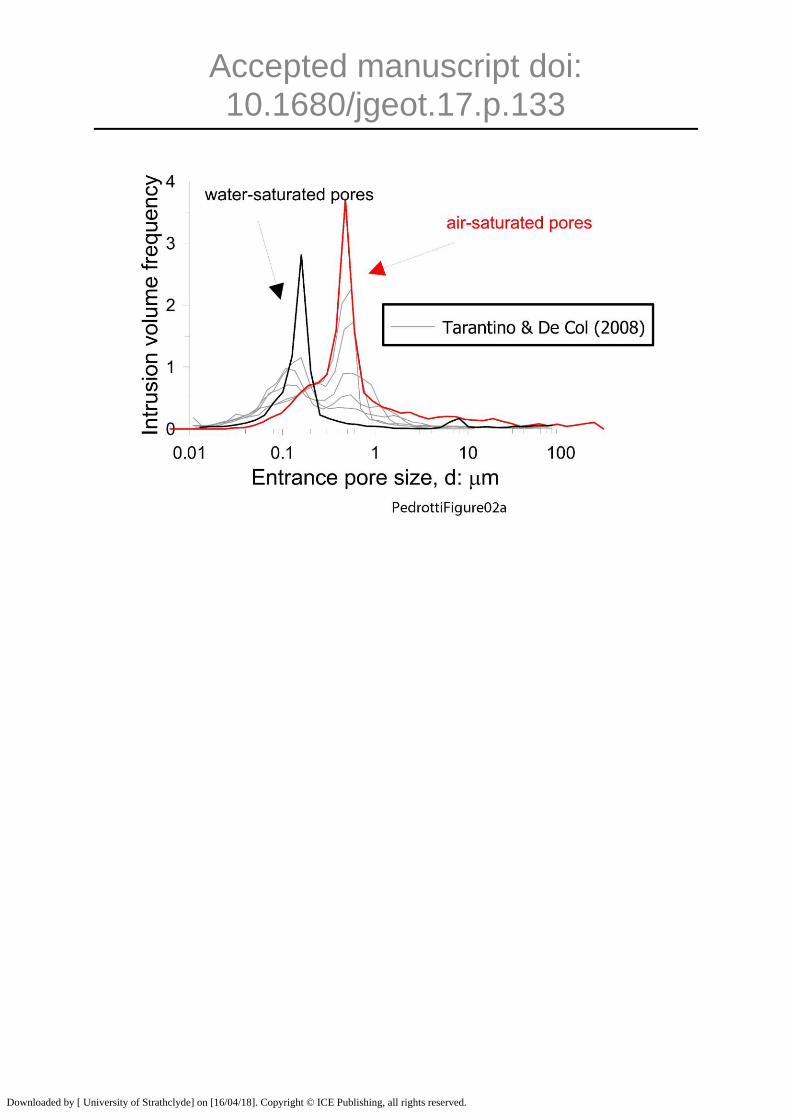
A water-saturated sample (reconstituted from slurry) and an air-saturated sample
(formed from dry powder) were compressed to a vertical stress of 2220kPa and then
unloaded. The PSD of these two samples is shown in Figure 2a. The same figure
also reports the PSD of samples compacted to 1200 kPa at different water contents
(from 0.09 to 0.32) according to Tarantino and De Col (2008). The compaction water
Downloaded by [ University of Strathclyde] on [16/04/18]. Copyright © ICE Publishing, all rights reserved.
Accepted manuscript doi: 10.1680/jgeot.17.p.133
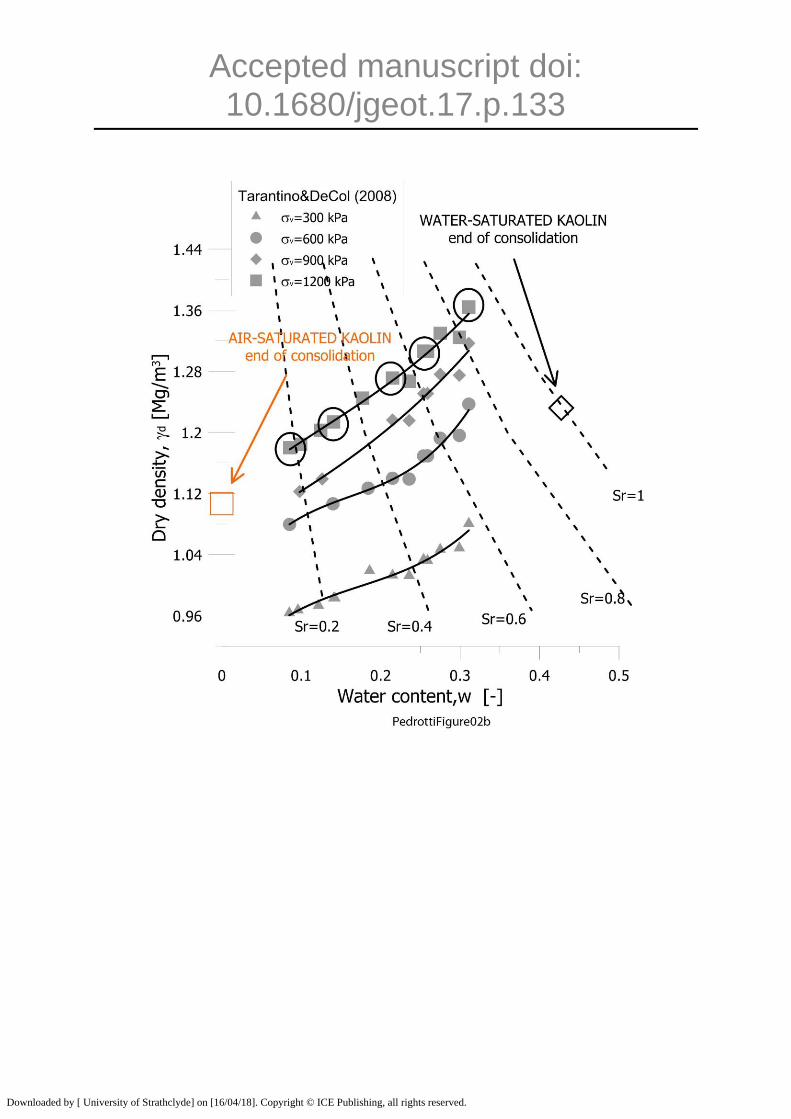
content and dry density of the samples whose PSD is shown in in Figure 2a are
illustrated in Figure 2b after Tarantino and De Col (2008).
The kaolin sample reconstituted from slurry (water-saturated) shows a mono-modal
pore size distribution with a modal value of 0.2 m. On the other hand, sample
compressed from dry powder (air-saturated) shows a modal value of 0.60 m.
The most striking aspect is that the PSD of the compacted air/water saturated
samples shows two modal sizes that essentially overlap with the modal size of the
water-saturated and air-saturated samples respectively. In addition, the void ratio
frequency redistributes as the water content changes and the air-saturated and
water-saturated samples appear to represent the two extremes of the redistribution
of frequencies in the compacted samples. The dominant pore size and the intrusion
volume frequency of the sample compressed from dry powder (air-saturated) are
higher than the ones of the sample reconstituted from slurry (water-saturated). This
is consistent with the higher repulsion Columbian forces between ‘dry’ particles in
turn associated with the lower dielectric permittivity of air (air=1) compared to water
(water=80) (Pedrotti and Tarantino, 2017).
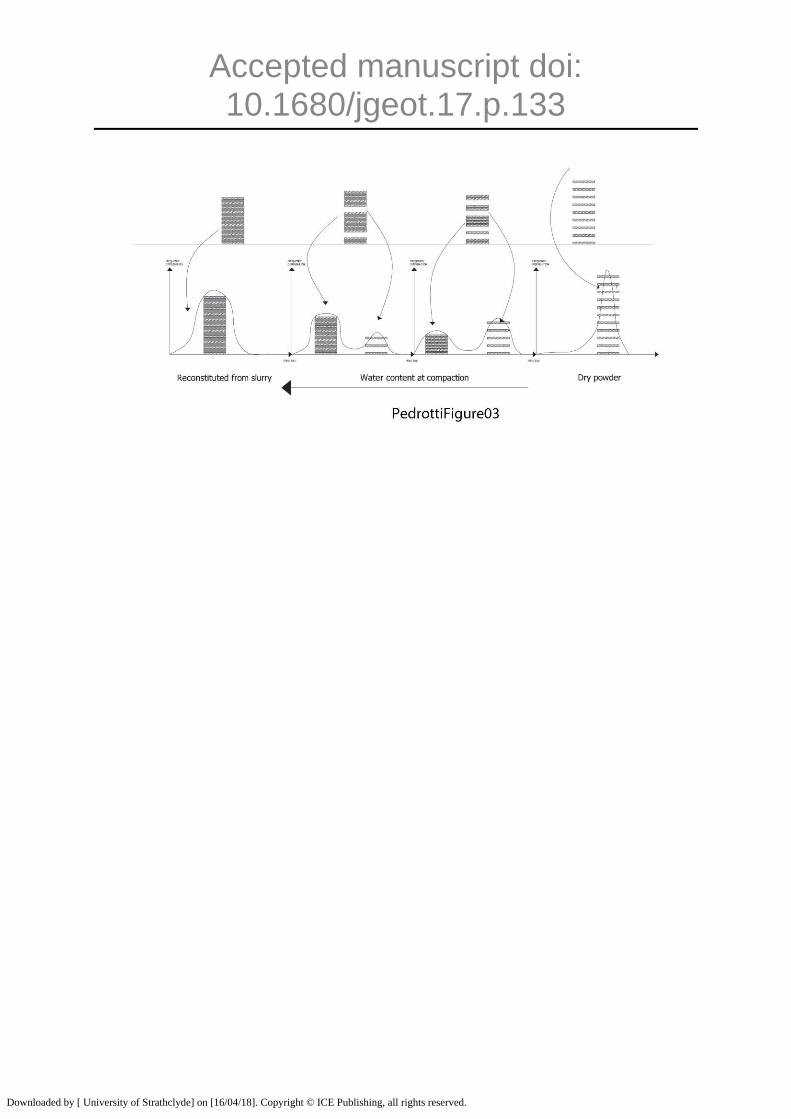
The transition from dry to fully saturated microstructure is tentatively represented in
Figure 3. As the compaction water content increases (from right to left in Figure 3),
the volume of pores filled with air decreases and the volume of pores filled with water
increases.
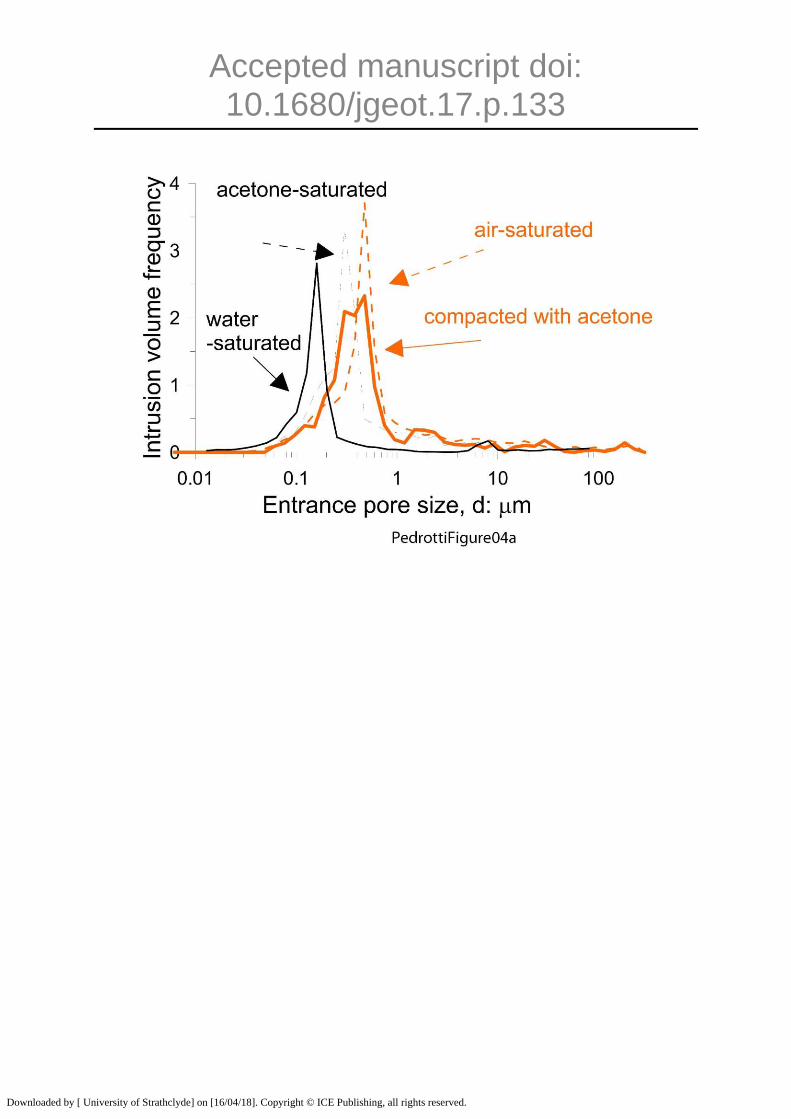
The PSD of samples formed with single and two pore fluids were compared again in
an additional set of experiments where acetone was used in place of water. Figure
4a shows the PSD of air-saturated, acetone saturated, and air/acetone saturated
samples. The air/acetone saturated sample was compacted to 1200 kPa vertical
Downloaded by [ University of Strathclyde] on [16/04/18]. Copyright © ICE Publishing, all rights reserved.
Accepted manuscript doi: 10.1680/jgeot.17.p.133
stress at nominal acetone content of 0.2 whereas the acetone-saturated sample
were consolidated from slurry to 2220 kPa. For purpose of comparison, the PSD of
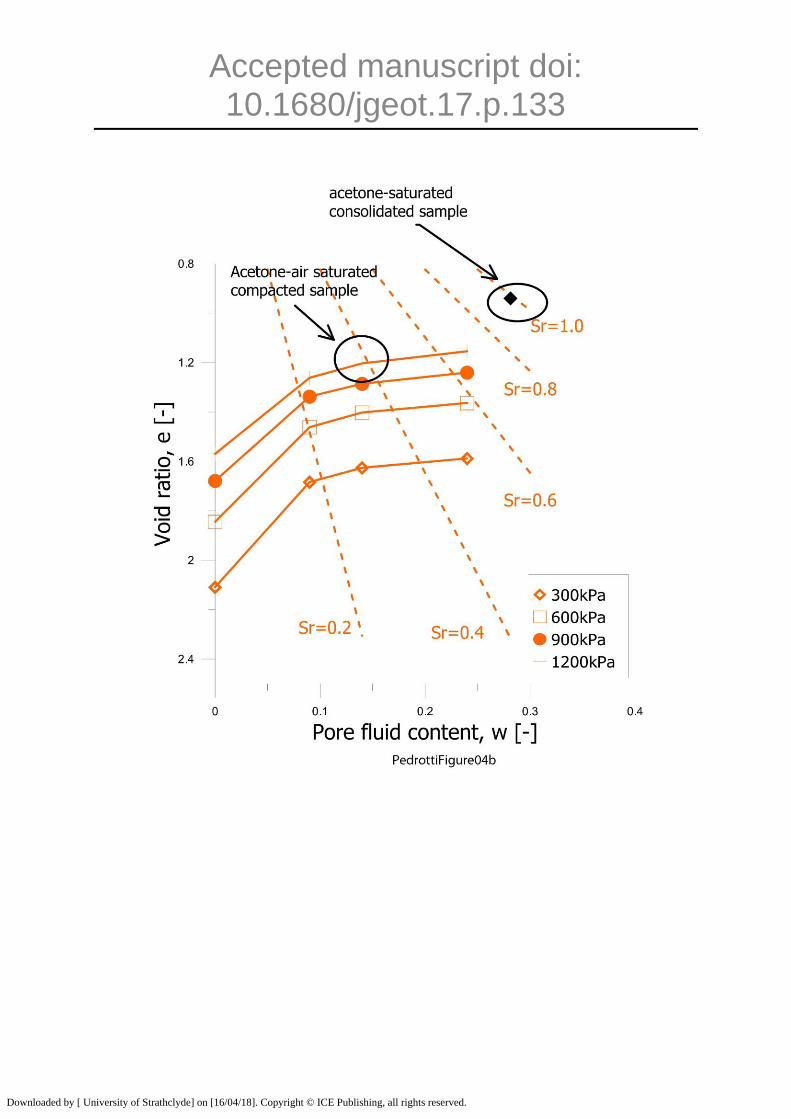
the water-saturated sample is also reported in the Figure 4a. The compaction water
content and dry density of the samples whose PSD is shown in in Figure 4a are
illustrated in Figure 4b.
Figure 4a shows that the PSD of the acetone-saturated sample is mono-modal and this appear
to be a common feature of all single-fluid saturated samples (air, water, and acetone).
Furthermore, the PSD of the air/acetone-saturated sample is bi-modal and this appears to be a
common feature with the air/water-saturated sample.
Similarly to the case of air/water saturated samples (Figure 2) the two modal sizes of
the PSD of the compacted air/acetone saturated samples essentially overlap with the
modal size of the acetone-saturated and air-saturated samples respectively. It is also
worth noticing that the dominant size of the acetone-saturated pores is higher than
the one of the water saturated pores. Again, this is consistent higher repulsion
Columbian forces between particles in acetone due to the lower dielectric permittivity
of acetone (acetone=24) compared to water (water=80).
Regardless of the liquid (wetting fluid) used to prepare the sample by compaction,
the pore size of the micro-pores therefore appears to correspond to the dominant
pore size of the liquid-saturated sample (either acetone or water) whereas the modal
size of the macro-pores appears to correspond to the dominant pore size of the air-
saturated sample.
As a result, for samples compacted with water, one can tentatively infer that
macro-pores are just pores filled with air (air-saturated) and micro-pores are just
pores filled with water (water-saturated). This is an unusual view of compacted soil
Downloaded by [ University of Strathclyde] on [16/04/18]. Copyright © ICE Publishing, all rights reserved.
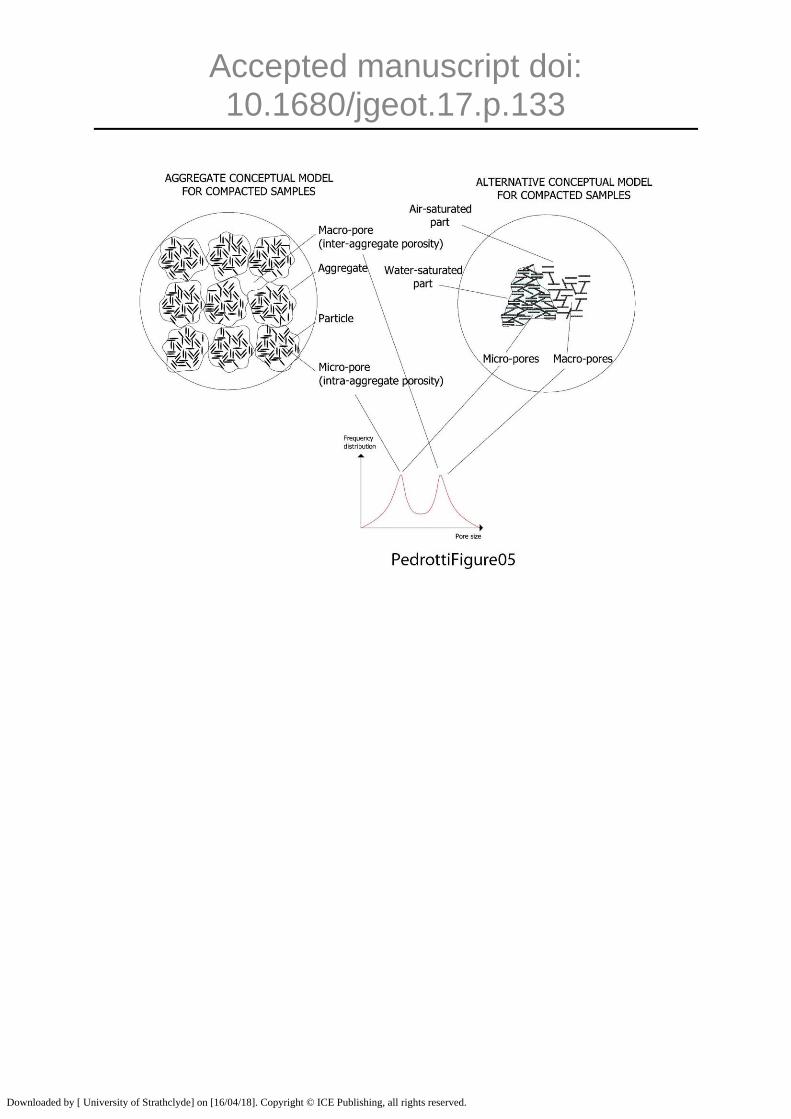
Accepted manuscript doi: 10.1680/jgeot.17.p.133
microstructure and is somehow in contrast with the traditional aggregate-based
representation where micro-pores are associated with ‘intra-aggregate’ pores and
macro-pores are associated with ‘inter-aggregate pores’ (Delage et al., 2006,
Romero and Simms, 2008, Sivakumar et al., 2010, Tarantino, 2010, Monroy et al.,
2010, Casini et al., 2012) as shown in Figure 5. To explore this assumption,
additional experiments were carried out.
Microstructure evolution of compacted and dry samples upon saturation
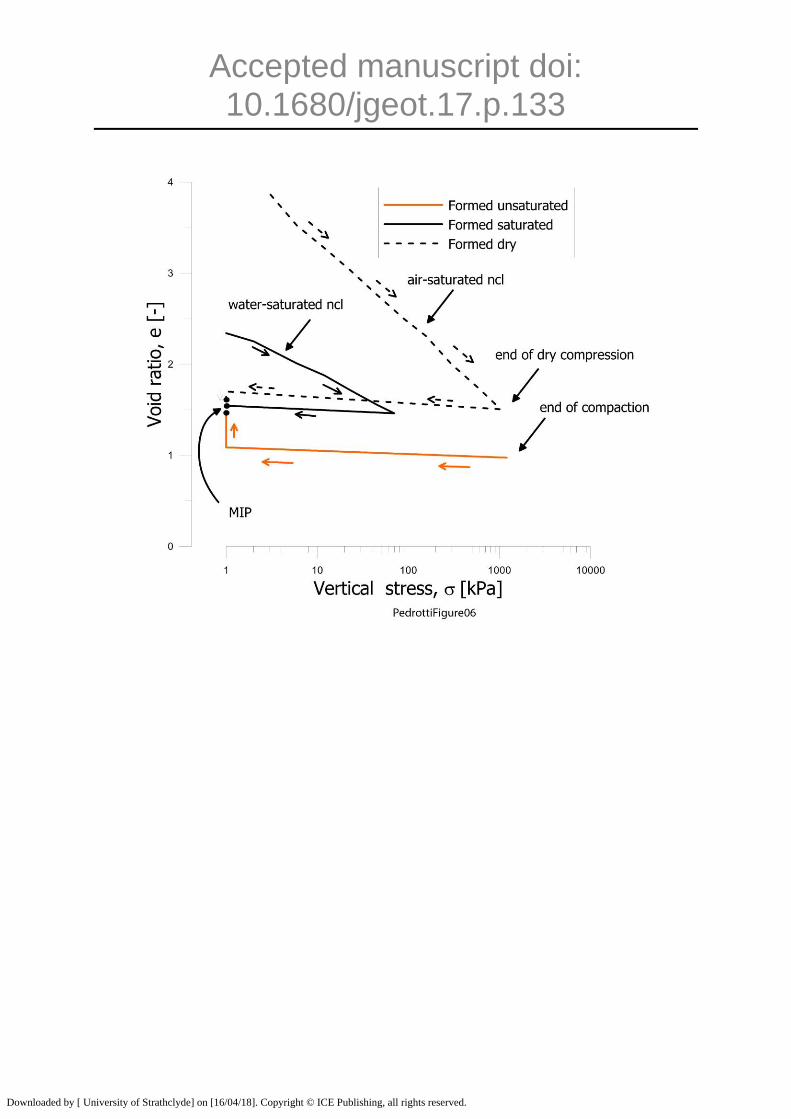
The evolution of the PSD of three samples tested in the oedometer was examined
(Figure 6):
i) Sample ‘formed unsaturated’ - Compacted at w=0.12 to 1200 kPa, unloaded to 1 kPa and
saturated;
ii) Sample ‘formed dry’ - Compressed from dry powder to 1200 kPa, unloaded to 1 kPa, and
saturated;
iii) Sample ‘formed saturated’ - Reconstituted from slurry, consolidated to 70 kPa and
unloaded to 1 kPa.
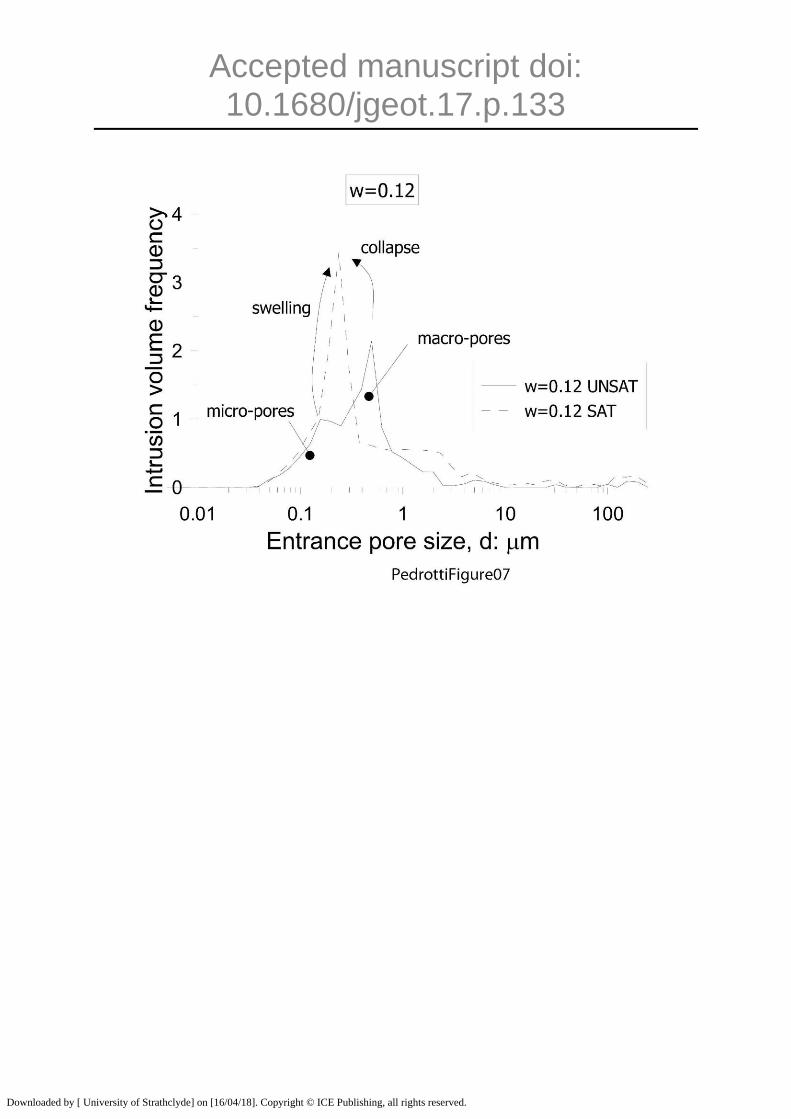
Figure 7 shows the pore-size distribution of kaolin sample compacted to 1200 kPa vertical
stress before and after saturation under nearly zero vertical stress. Upon saturation the bi-
modal PSD becomes mono-modal and this evolution of PSD can be interpreted as follows.
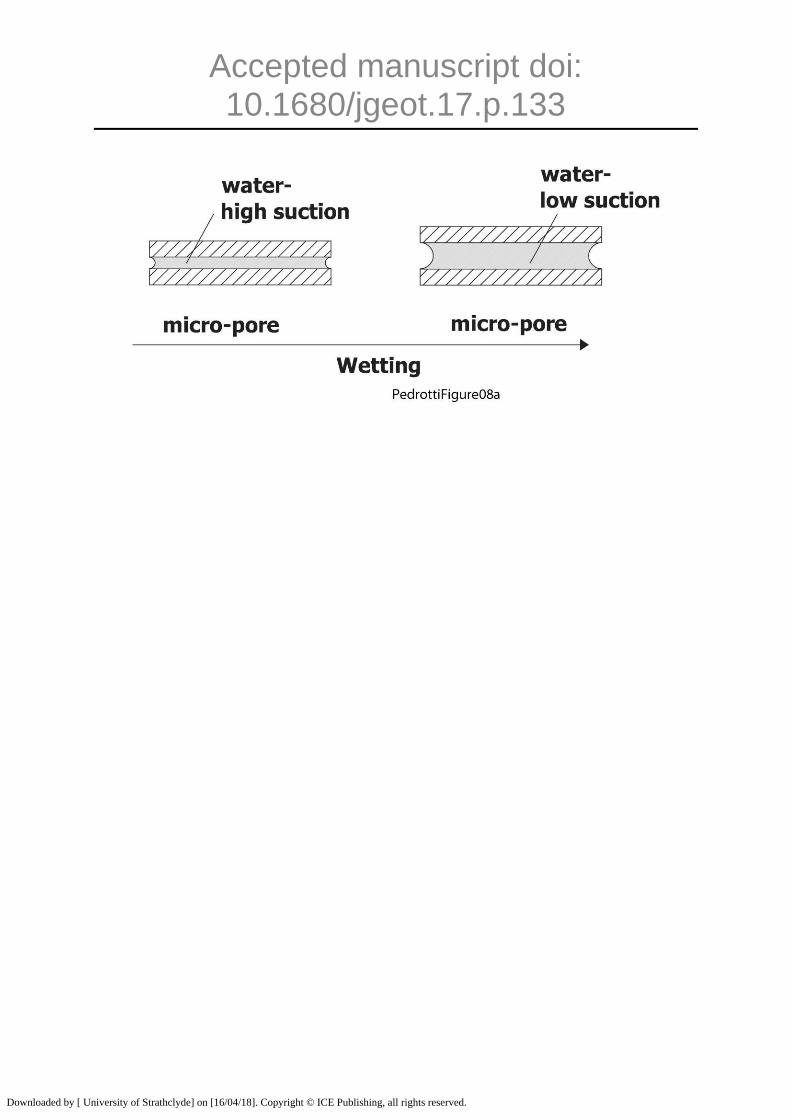
The water-saturated pores (micro-pores) tend to rebound because pore-water pressure in these
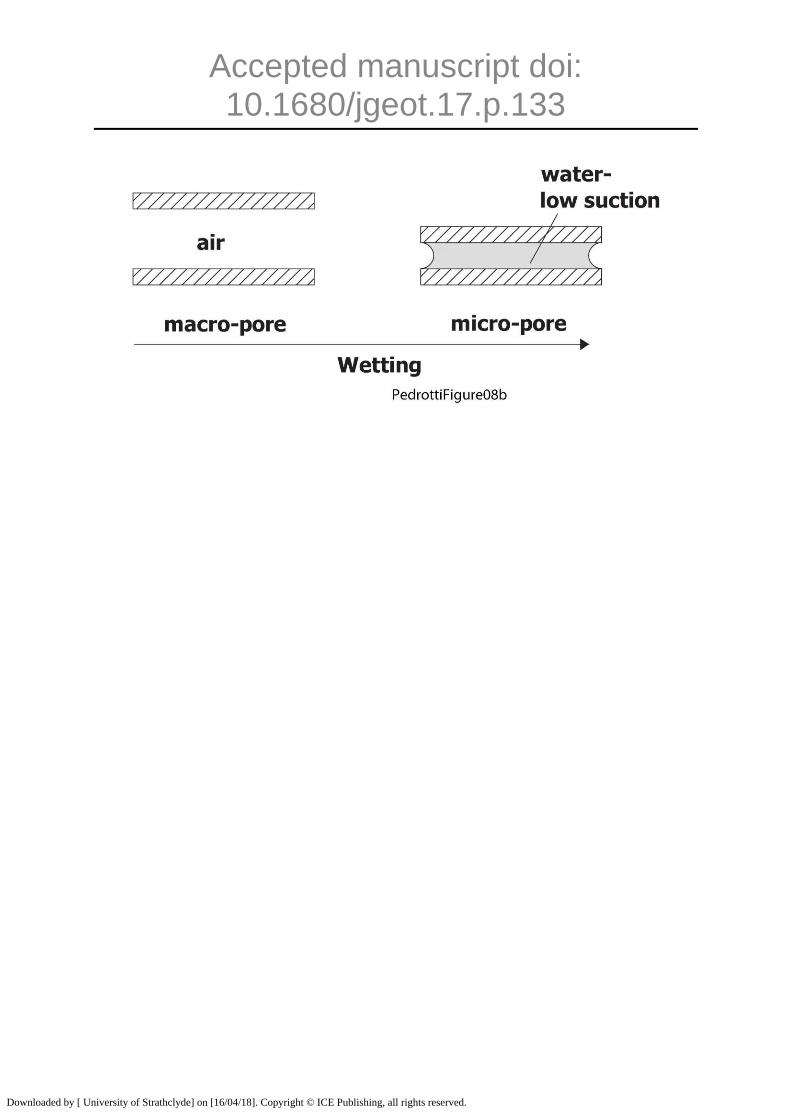
pores increases from negative values to zero. On the other hand, the initially air-saturated
pores reduce their volume when they become saturated with water. The replacement of air
with water causes a decrease in the Columbian repulsion forces between particles due to the
higher dielectric permittivity of water, which in turn decreases the inter-particle distance.
These two mechanisms are illustrated in Figure 8a and Figure 8b respectively.
Downloaded by [ University of Strathclyde] on [16/04/18]. Copyright © ICE Publishing, all rights reserved.
Accepted manuscript doi: 10.1680/jgeot.17.p.133
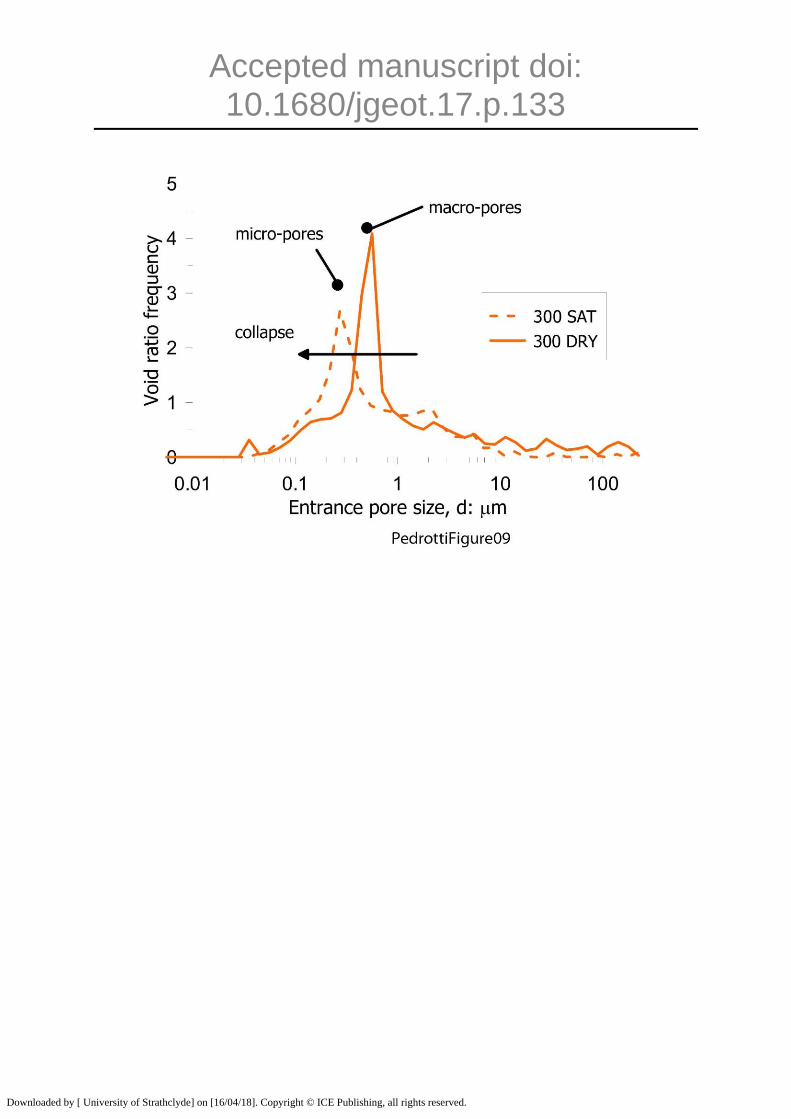
Figure 9 shows the PSD of the sample compressed form dry powder before and after
saturation under nearly zero vertical stress. Before saturation the sample shows a mono-
modal PSD with the dominant porosity in the range of the macro-pores (0.7m). Upon
saturation, the PSD remains mono-modal but the dominant porosity switches to the range of
micro-pores (0.2m). In this case, only the mechanism depicted in Figure 8b takes place
upon saturation. As a result, samples prepared from dry powder experience volumetric
collapse upon saturation even at very low vertical stress as shown in Figure 6.
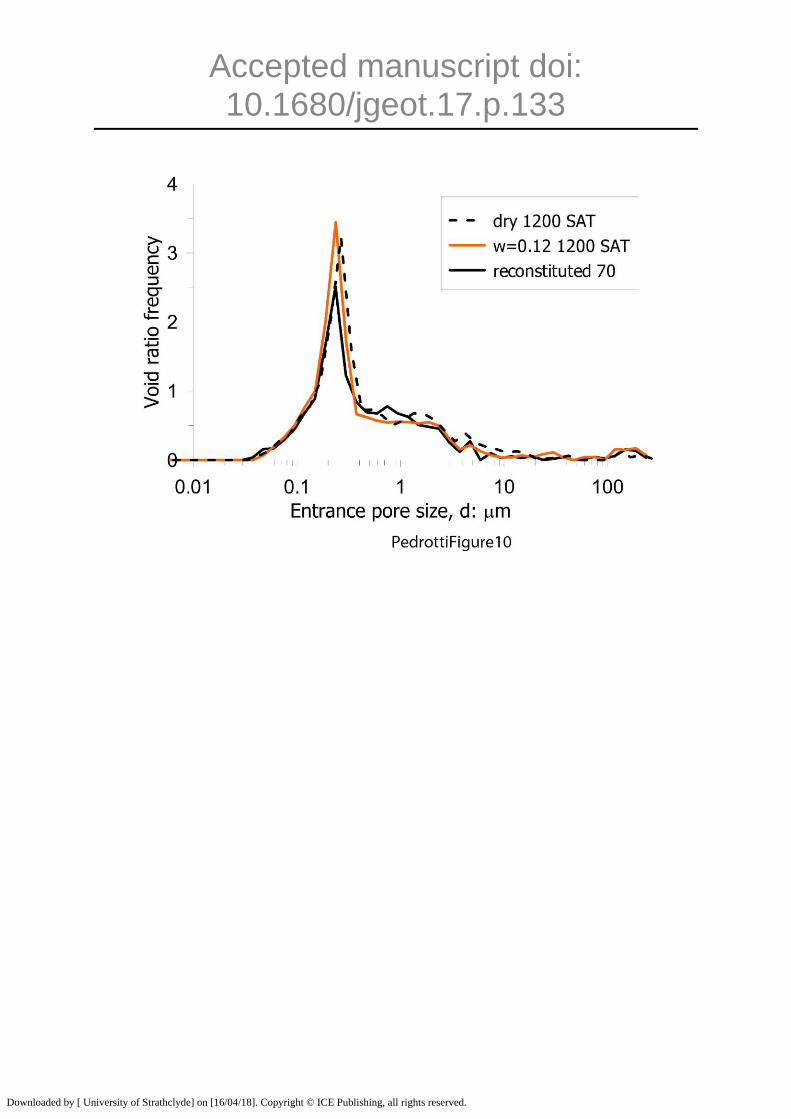
Figure 10 shows the PSDs of the samples formed under dry and unsaturated (compacted)
conditions and then saturated. These are compared with the PSD of the sample formed
saturated (reconstituted). The PSDs are very similar and different conditions ‘at formation’
do not appear to generate samples that are microstructurally different as often assumed in the
literature. Figure 10 also shows once again that the ‘dry’ state is one of the extremes of the
possible states of a clay.
Continuity of macroscopic behaviour across different states
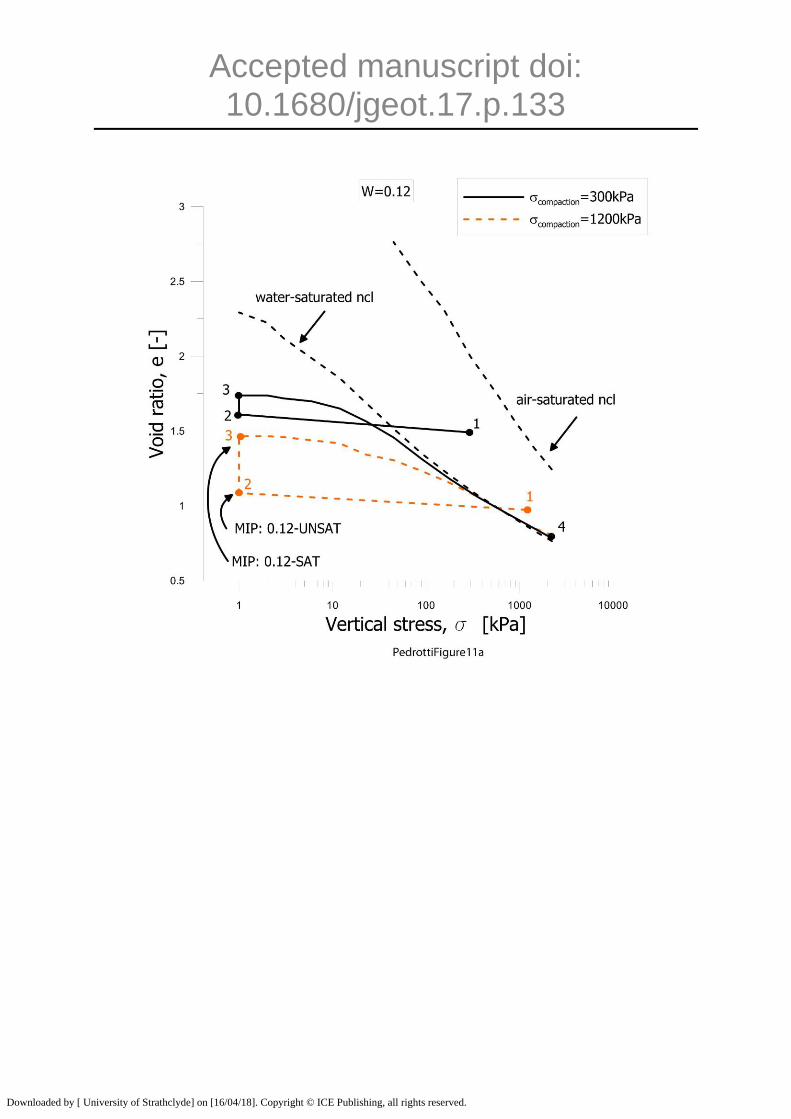
Figure 11a shows two samples compacted in an oedometer cell to 300 and 1200 kPa
respectively at water content w=0.12. After compaction (point 1), the samples were unloaded
to 1 kPa (point 2), saturated (point 3), and then loaded to 2220 kPa (point 4). The void ratio
change associated with this hydro-mechanical paths is shown in Figure 11a together with the
compression curve of the reconstituted clay (formed water-saturated) and dry clay (formed
air-saturated).
At the end of compaction (point 1), the two samples lie between the air-saturated and water-
saturated normal compression curves. The sample having the higher degree of saturation at
compaction, i.e. the sample compacted to 1200 kPa, appears to be closer to the normal
consolidation line of the water-saturated (reconstituted from slurry) sample. Upon saturation,
Downloaded by [ University of Strathclyde] on [16/04/18]. Copyright © ICE Publishing, all rights reserved.
Accepted manuscript doi: 10.1680/jgeot.17.p.133
the void ratio of the two samples increased (path 2-3). The higher the degree of saturation
after unloading (point 2), the higher was the amount of void ratio increase (swelling)
occurring upon saturation (path 2-3), i.e. the sample compacted to 1200 kPa, exhibited higher
swelling. Finally, following saturation, the saturated compression curves of the two
compacted samples appear to join the normal consolidation line of the sample reconstituted
from slurry, after having initially exhibited an over-consolidation-like response upon loading.
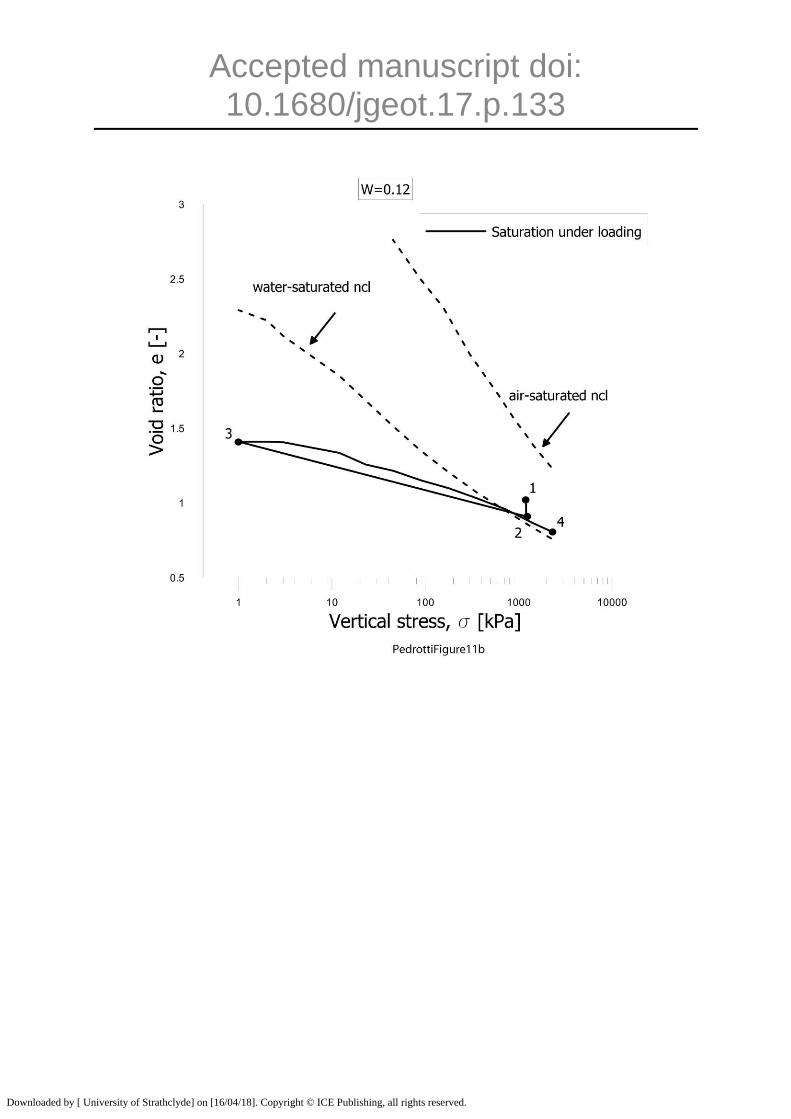
Figure 11b shows a sample compacted to 1200 kPa (point 1), saturated under 1200 kPa
vertical stress (point 2), unloaded to 1 kPa (point 3), and finally re-loaded to 2220 kPa.
Following saturation, the sample collapses on the normal consolidation line of the
reconstituted sample. The re-loading curve joins again the normal consolidation line of the
reconstituted sample.
The fact that compacted samples tend to join the same normal compression line after
saturation, regardless of whether saturation is attained at high or very low vertical stress, is
not a new finding. However, the striking aspect in Figure 11 is that the normal compression
line attained by the compacted samples after saturation coincides with the normal
compression of samples reconstituted from slurry. This highlights the continuity between
compacted and reconstituted states
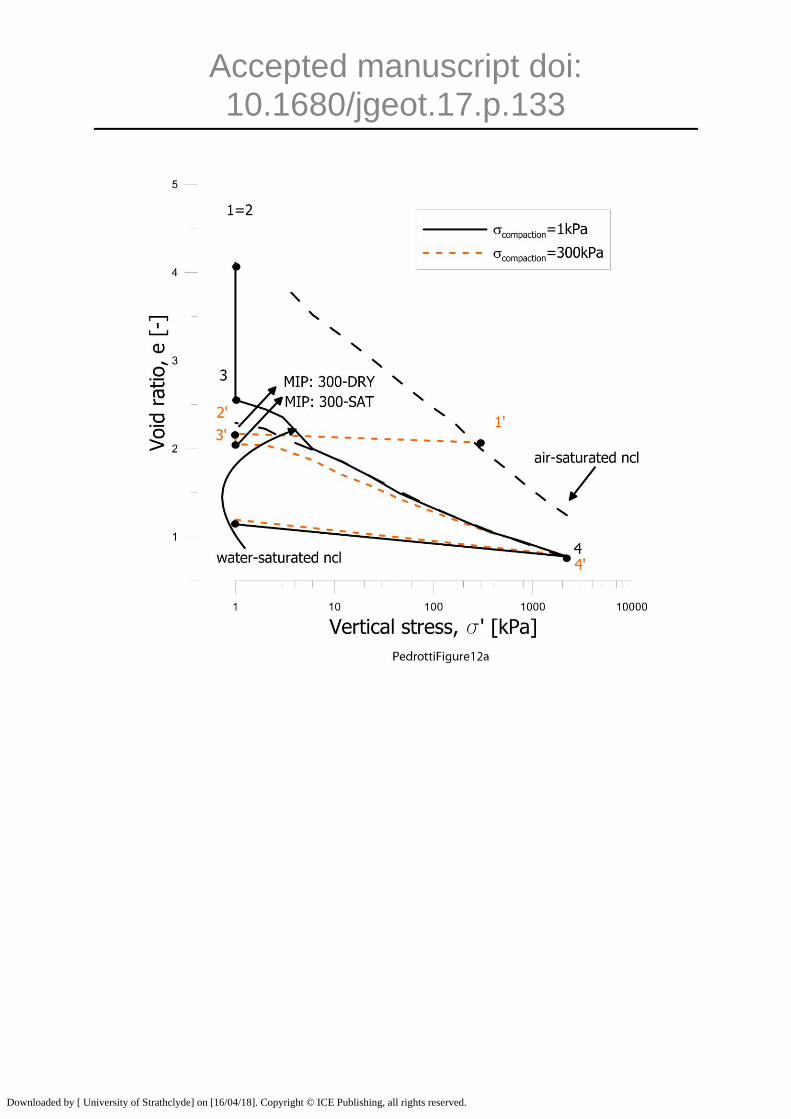
The mechanical response of samples prepared from dry powder (born air-saturated) and
subjected to saturation is illustrated in Figure 12. Tests were similar to the ones presented in
Figure 11 with the only difference that only one fluid was initially filling the pores, i.e. air, in
contrast to the compacted samples where two fluids were present in the pores at formation,
i.e. air and water.
Figure 12a shows two air-saturated samples (prepared from dry powder) saturated at nearly
zero vertical stress. One sample was subjected to 1kPa (point 1), saturated (point 3), and then
Downloaded by [ University of Strathclyde] on [16/04/18]. Copyright © ICE Publishing, all rights reserved.
Accepted manuscript doi: 10.1680/jgeot.17.p.133
loaded to 2220 kPa (point 4). A second sample was compressed to 300 kPa (point 1’),
unloaded to 1 kPa (point 2’), saturated (point 3’), and then loaded to 2220 kPa (point 4 in
Figure 12a). Figure 12a also shows the compression curves of the water-saturated
(reconstituted from slurry) and air-saturated samples (dry powder) for purpose of comparison.
Upon saturation at quasi-zero vertical stress, the air-saturated samples exhibited a volumetric
collapse in contrast to the swelling that would have been exhibited by a compacted sample.
Upon loading, both samples join the normal consolidation line of the sample reconstituted
from slurry (path 3-4), in a way very similar to the compacted samples shown in Figure 11a.
This highlights again the continuity between dry and reconstituted states and the fact that
these two states ‘bound’ the compacted states.
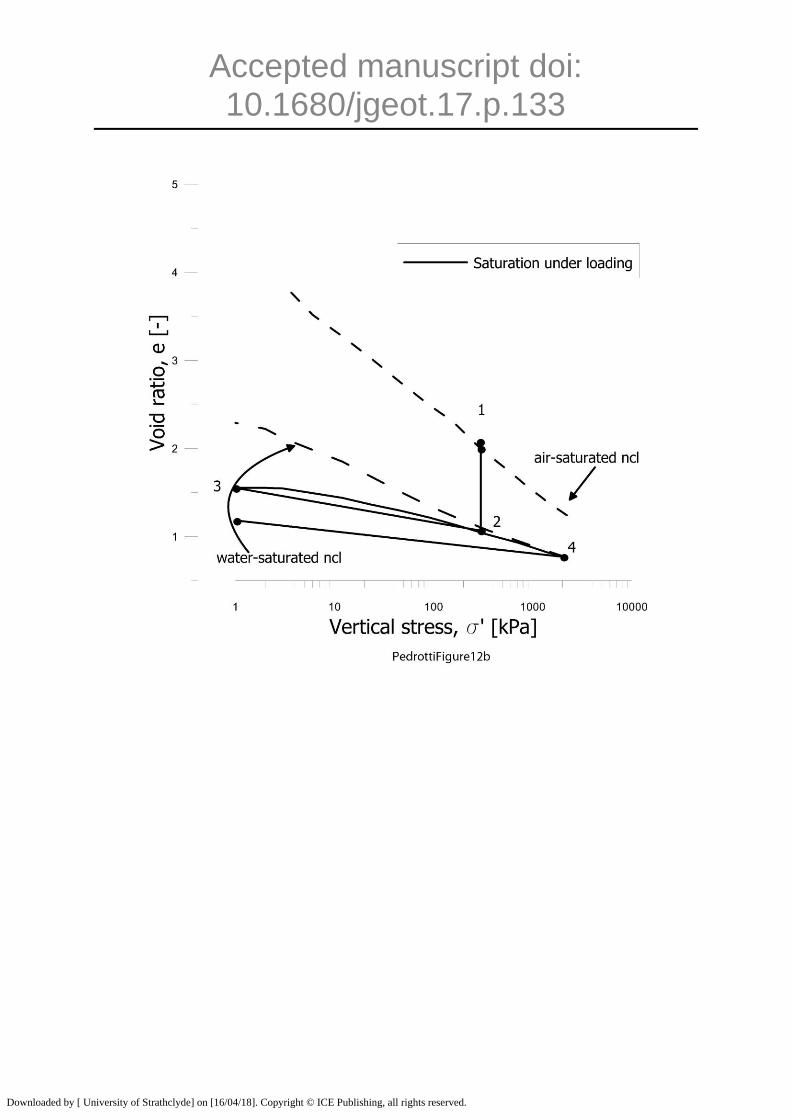
Figure 12b shows a sample compressed dry to 300 kPa (point 1 in Figure 12b), saturated
under 300 kPa vertical stress (point 2 in Figure 12b), unloaded to 1 kPa (point 3 in Figure
12b) and re-loaded to 2220 kPa (point 4 in Figure 12b). Upon saturation, this sample also
showed a volumetric collapse moving from the air-saturated (dry powder) normal
consolidation line to the water-saturated (reconstituted from slurry) normal compression line.
The response of dry clay upon saturation differs from the compacted clay where micro-pores
swell and macro-pores collapse as shown in Figure 8. In compacted samples, these two
competing mechanisms cause the compacted sample to experience either swelling under low
vertical stress or volumetric collapse at high vertical stress upon saturation (Figure 11b).
It is worth observing that the concomitance of swelling and collapse mechanisms in
compacted soils upon saturation is also returned by the aggregate-based microstructural
model. Collapse of the macro-pores is associated with slippage at aggregate contacts whereas
swelling of micro-pores is associated with the swelling of the aggregates themselves. What
the aggregate-based microstructural model cannot justify is the collapse experienced by
Downloaded by [ University of Strathclyde] on [16/04/18]. Copyright © ICE Publishing, all rights reserved.
Accepted manuscript doi: 10.1680/jgeot.17.p.133
samples prepared from dry powder regardless of the stress level, which can be indeed
inferred from the particle-based microstructural model put forward in Figure 5 and Figure 8.
CONCEPTUAL CONSTITUTIVE MODEL FOR NON-ACTIVE CLAY
The microstructural investigation presented above led to the assumption that unsaturated
(compacted) clay is made of air-saturated and water-saturated pores. A second assumption is
made in this paper, i.e. the air-saturated part behaves as the air-saturated clay (compressed
from dry powder) and the water-saturated part behaves as the water-saturated clay
(reconstituted from slurry). A conceptual constitutive model is built around these two
assumptions in the following sections and validated against different hydro-mechanical paths
under 1-D conditions.
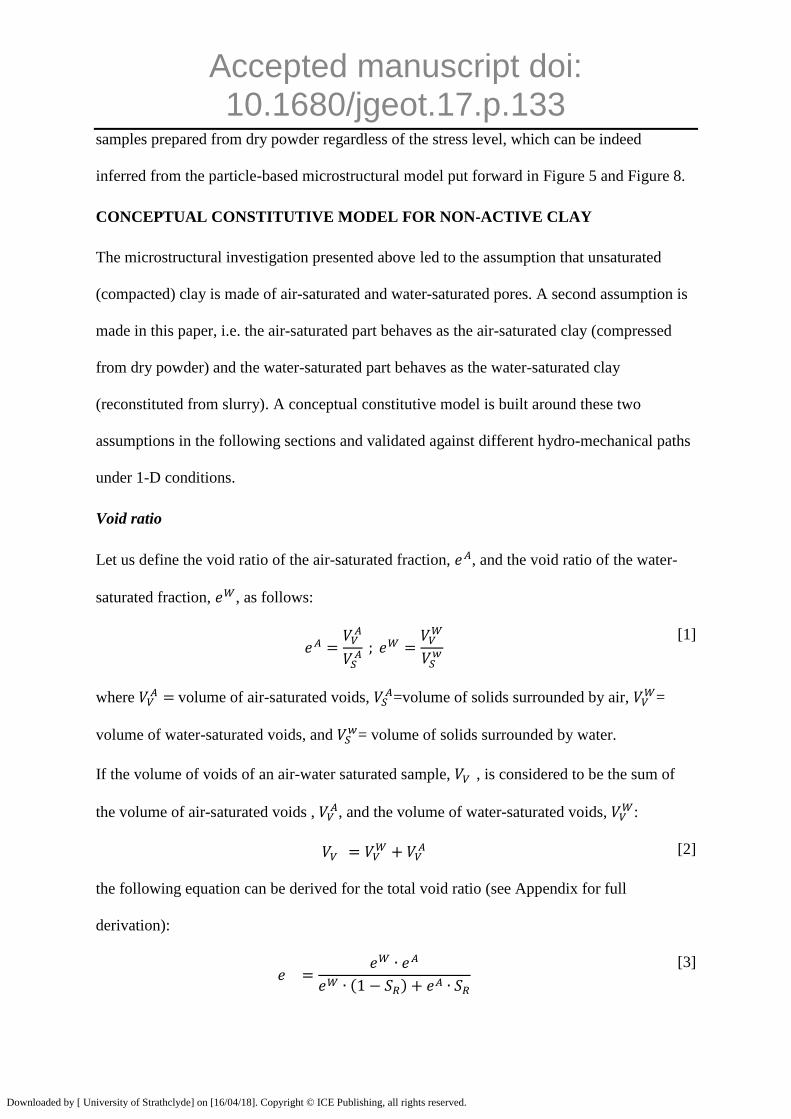
Void ratio
Let us define the void ratio of the air-saturated fraction, , and the void ratio of the water-
saturated fraction, , as follows:
[1]
where volume of air-saturated voids,
=volume of solids surrounded by air, =
volume of water-saturated voids, and = volume of solids surrounded by water.
If the volume of voids of an air-water saturated sample, , is considered to be the sum of
the volume of air-saturated voids , , and the volume of water-saturated voids,
:
[2]
the following equation can be derived for the total void ratio (see Appendix for full
derivation):
( )
[3]
Downloaded by [ University of Strathclyde] on [16/04/18]. Copyright © ICE Publishing, all rights reserved.
Accepted manuscript doi: 10.1680/jgeot.17.p.133
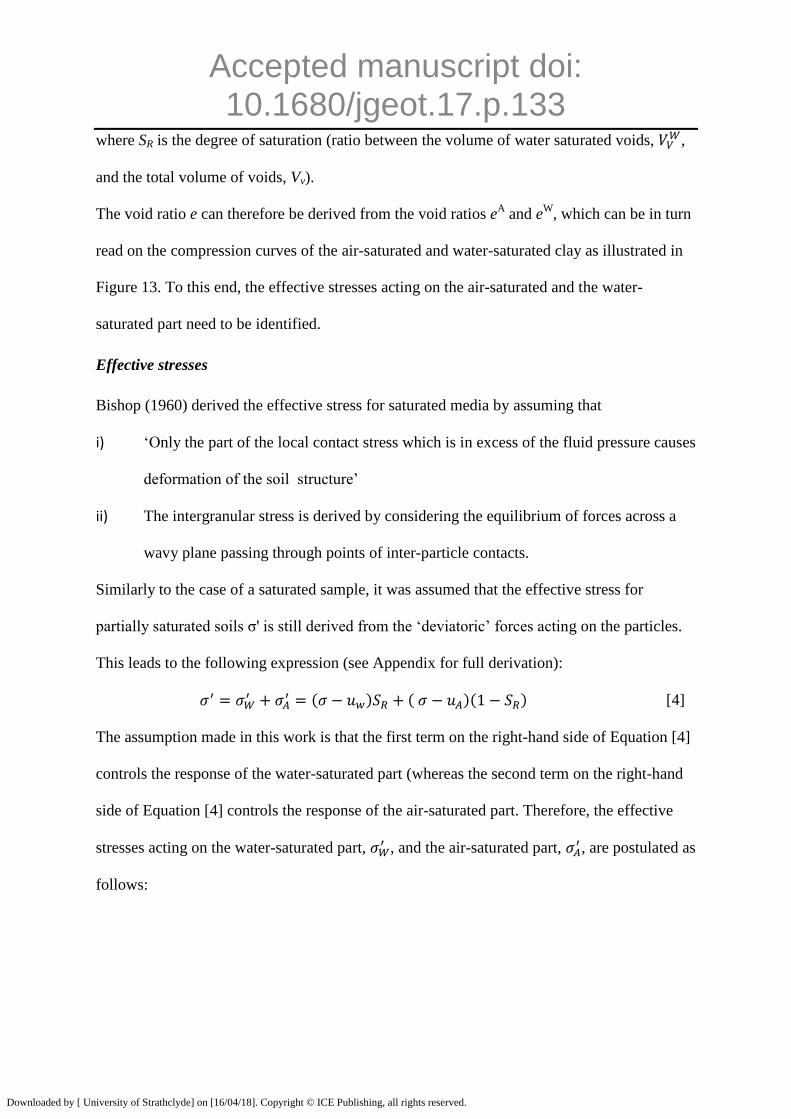
where SR is the degree of saturation (ratio between the volume of water saturated voids, ,
and the total volume of voids, Vv).
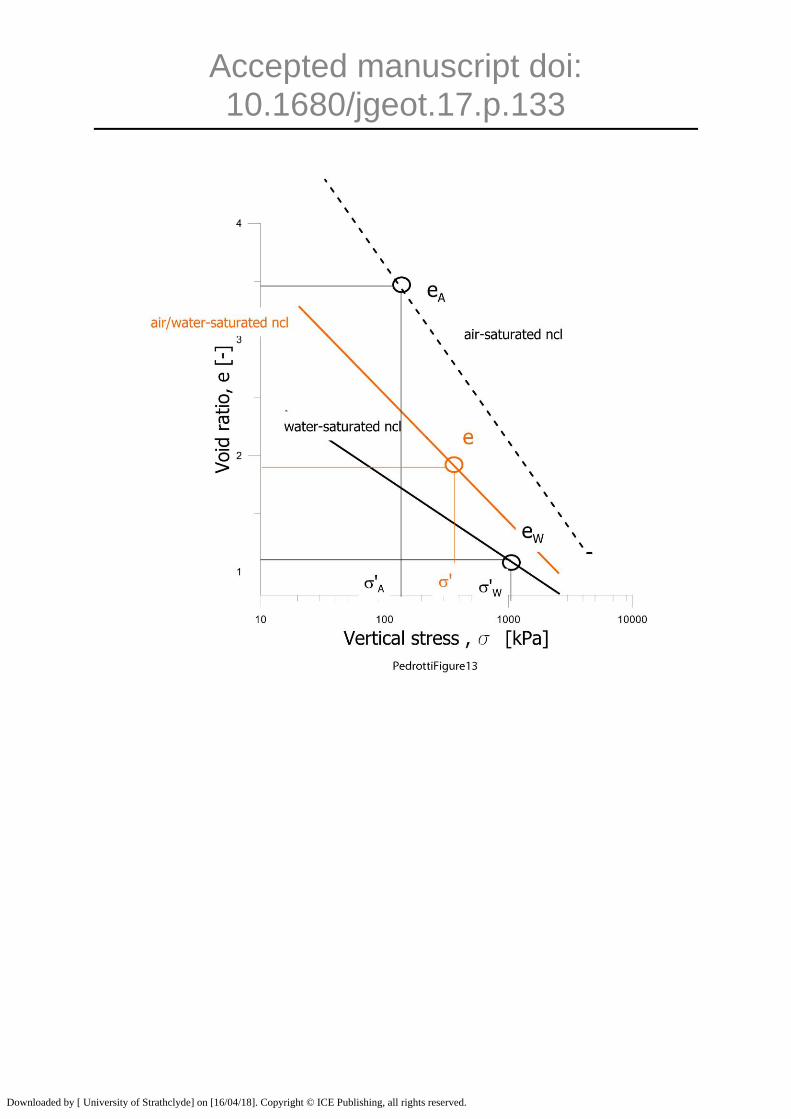
The void ratio e can therefore be derived from the void ratios eA and e
W, which can be in turn
read on the compression curves of the air-saturated and water-saturated clay as illustrated in
Figure 13. To this end, the effective stresses acting on the air-saturated and the water-
saturated part need to be identified.
Effective stresses
Bishop (1960) derived the effective stress for saturated media by assuming that
i) ‘Only the part of the local contact stress which is in excess of the fluid pressure causes
deformation of the soil structure’
ii) The intergranular stress is derived by considering the equilibrium of forces across a
wavy plane passing through points of inter-particle contacts.
Similarly to the case of a saturated sample, it was assumed that the effective stress for
partially saturated soils σ' is still derived from the ‘deviatoric’ forces acting on the particles.
This leads to the following expression (see Appendix for full derivation):
( ) ( )( ) [4]
The assumption made in this work is that the first term on the right-hand side of Equation [4]
controls the response of the water-saturated part (whereas the second term on the right-hand
side of Equation [4] controls the response of the air-saturated part. Therefore, the effective
stresses acting on the water-saturated part, , and the air-saturated part,
, are postulated as
follows:
Downloaded by [ University of Strathclyde] on [16/04/18]. Copyright © ICE Publishing, all rights reserved.
Accepted manuscript doi: 10.1680/jgeot.17.p.133
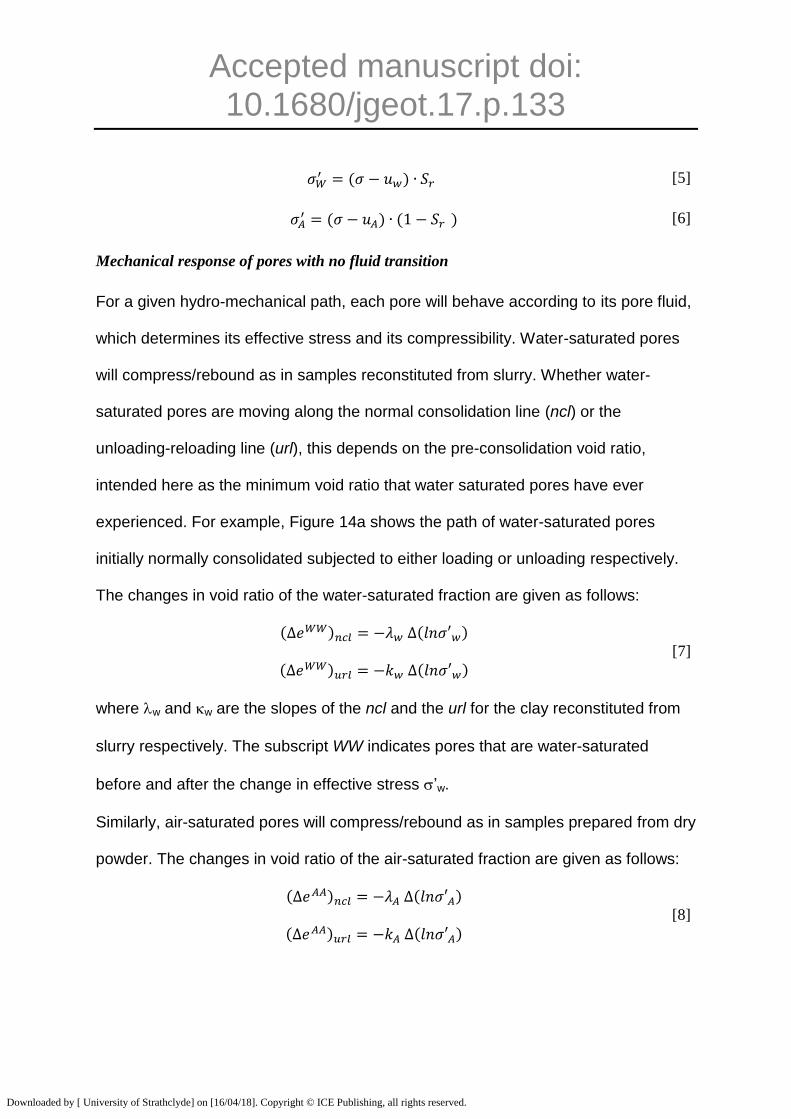
( ) [5]
( ) ( ) [6]
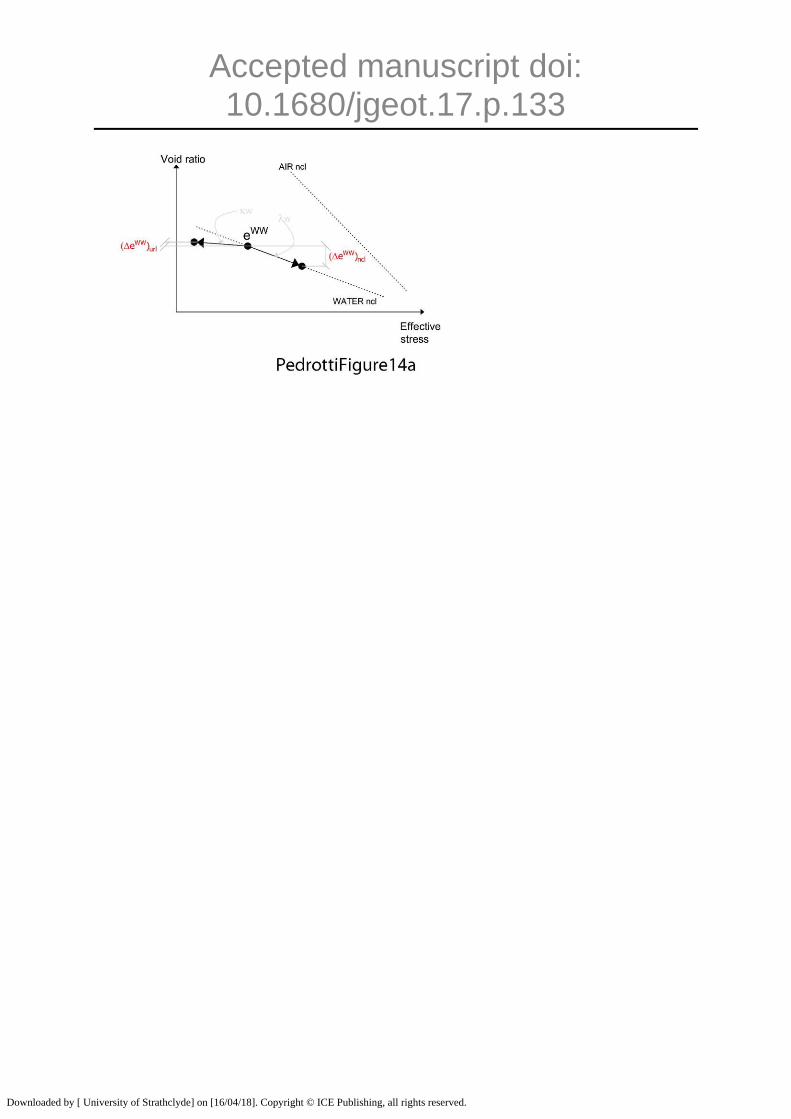
Mechanical response of pores with no fluid transition
For a given hydro-mechanical path, each pore will behave according to its pore fluid,
which determines its effective stress and its compressibility. Water-saturated pores
will compress/rebound as in samples reconstituted from slurry. Whether water-
saturated pores are moving along the normal consolidation line (ncl) or the
unloading-reloading line (url), this depends on the pre-consolidation void ratio,
intended here as the minimum void ratio that water saturated pores have ever
experienced. For example, Figure 14a shows the path of water-saturated pores
initially normally consolidated subjected to either loading or unloading respectively.
The changes in void ratio of the water-saturated fraction are given as follows:
( ) ( )
( ) ( ) [7]
where w and w are the slopes of the ncl and the url for the clay reconstituted from
slurry respectively. The subscript WW indicates pores that are water-saturated
before and after the change in effective stress ’w.
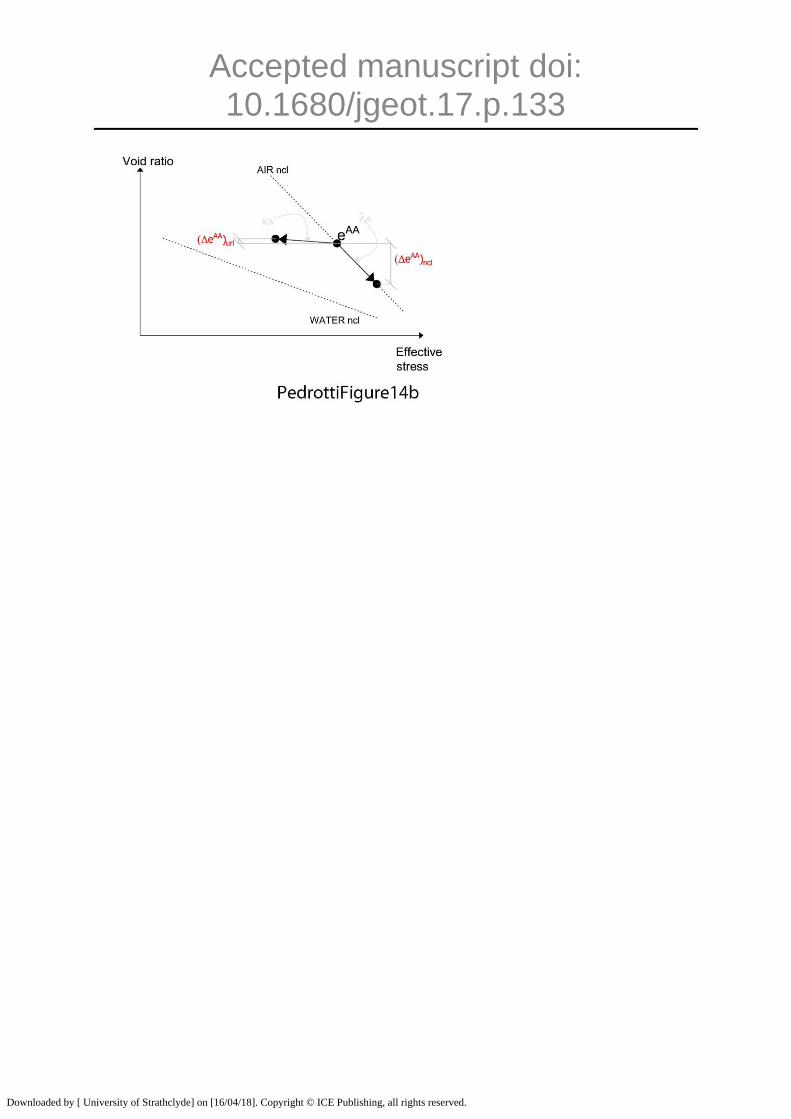
Similarly, air-saturated pores will compress/rebound as in samples prepared from dry
powder. The changes in void ratio of the air-saturated fraction are given as follows:
( ) ( )
( ) ( ) [8]
Downloaded by [ University of Strathclyde] on [16/04/18]. Copyright © ICE Publishing, all rights reserved.
Accepted manuscript doi: 10.1680/jgeot.17.p.133
where A and A are the slopes of the ncl and the url for the clay prepared from dry
powder respectively (Figure 14b). The subscript AA indicates the pores that are air-
saturated before and after the change in effective stress ’A.
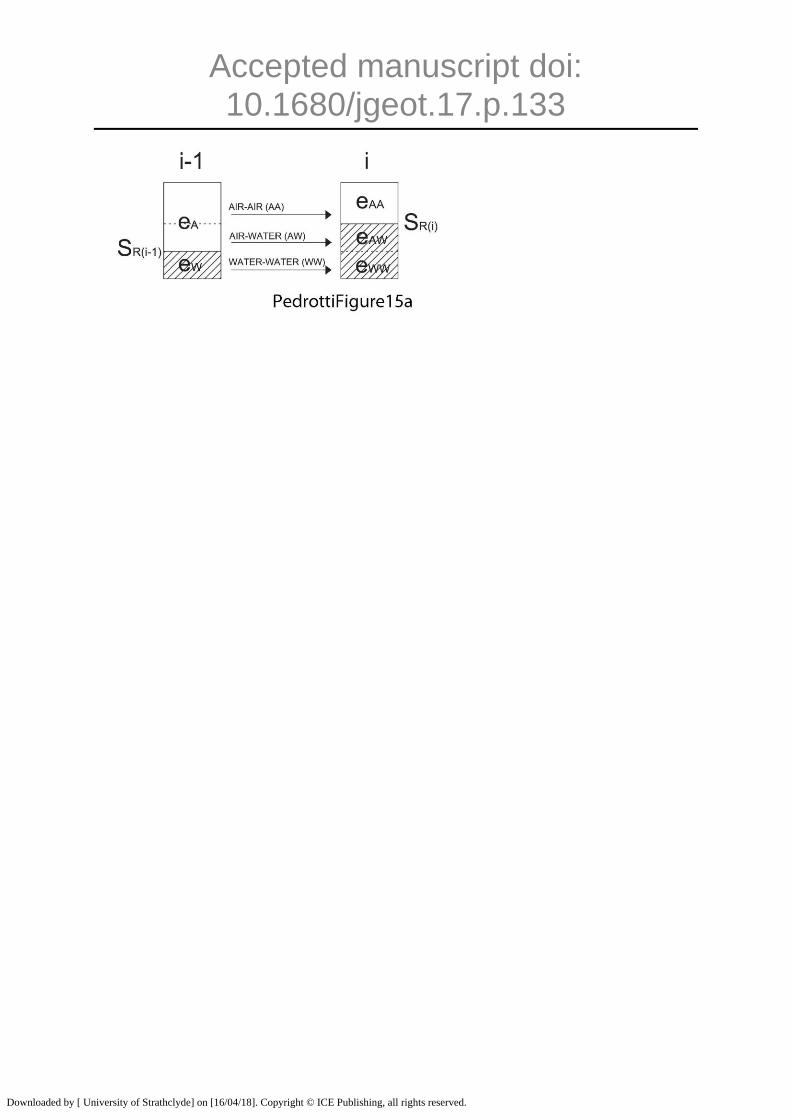
Mechanical response of pores with fluid transition
The effect of an increase in degree of saturation (wetting) is shown in Figure 15a.
Water-saturated pores do not change their state and remain water-saturated (such
pores are denoted with eWW since they move from a water-saturated state –W- to
another water-saturated state –W). On the other hand, air-saturated pores split in
two different sub-classes upon wetting. One fraction of these pores remains air-
saturated (such pores are denoted with eAA since they move from an air-saturated
state –A- to another air-saturated state –A). A second fraction of air-saturated pores
becomes water-saturated (such pores are denoted with eAW since they move from an
air-saturated state –A- to a water saturated state –W).
The path of the water-saturated and air-saturated pores is the one shown in Figure 14 for the
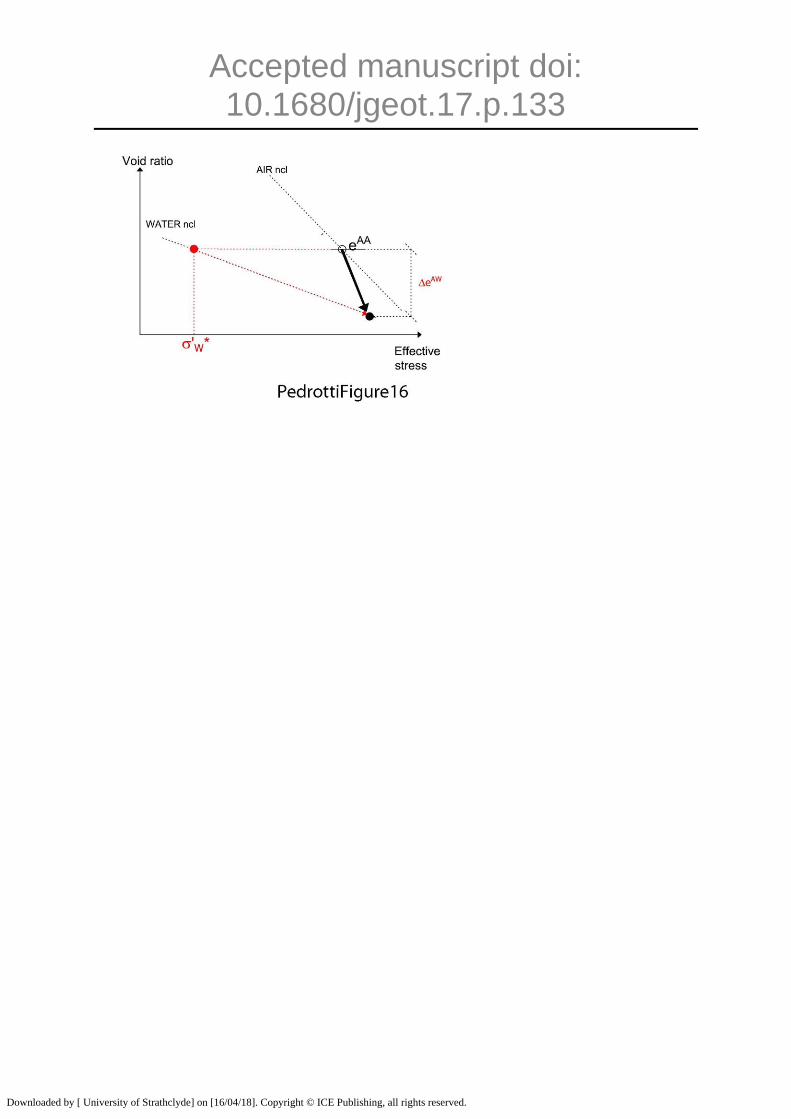
case of pores with no fluid transition. An example of the path of the pores that are initially
air-saturated and becomes water-saturated (fluid transition) upon a wetting path is shown in
Figure 16. These pores initially lie on the air-saturated ncl and then move to the water-
saturated ncl.
To compute the change in void ratio eAW
, it is convenient to introduce an equivalent water-
saturated pre-consolidation stress
. As shown in Figure 16, this is given by the water-
saturated effective stress that returns a void ratio on the water-saturated ncl equal to the void
ratio before the change of state.
Downloaded by [ University of Strathclyde] on [16/04/18]. Copyright © ICE Publishing, all rights reserved.
Accepted manuscript doi: 10.1680/jgeot.17.p.133
Accordingly, the change in void ratio eAW
is given by:
( ) (
) [9]
For the case shown in Figure 16, the equivalent water-saturated pre-consolidation stress
is exceeded by the current water-saturated effective stress ’w
and the ‘equivalent’
water-saturated path occurs along the ncl, i.e. plastic deformations take place. In other words,
this class of pores experience volumetric collapse upon wetting.
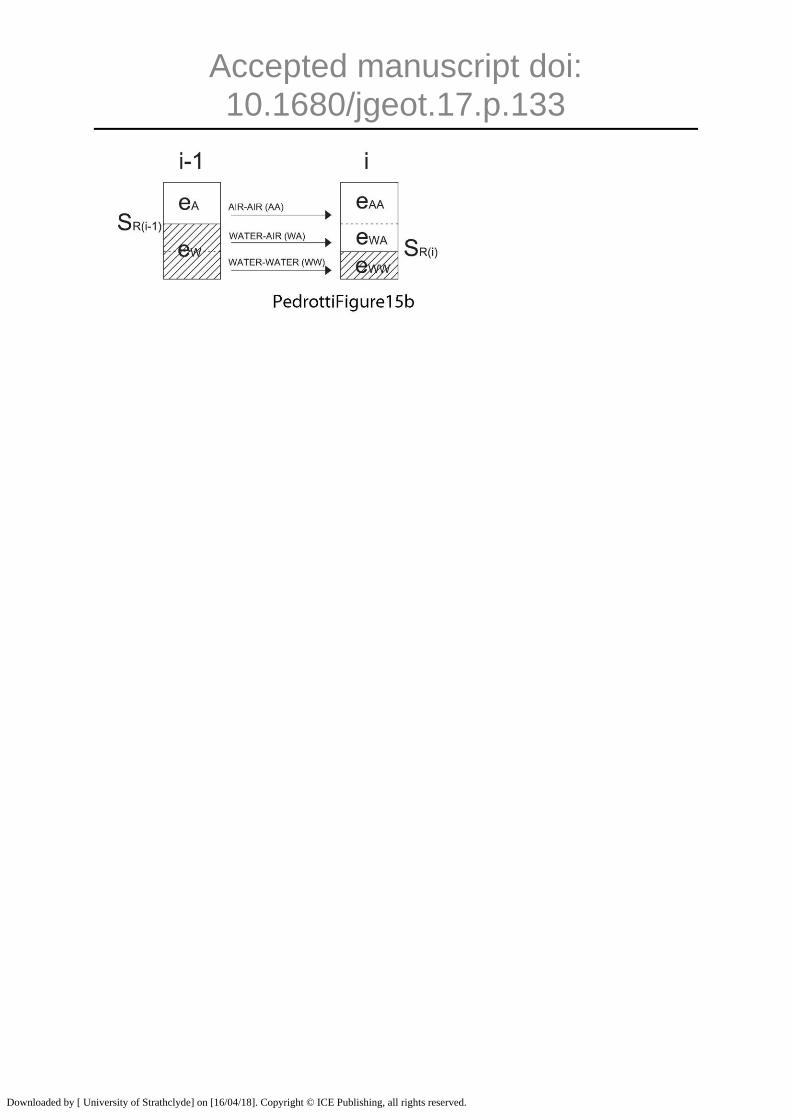
Figure 15b shows the effect of a decrease in degree of saturation (drying). The air-
saturated pores do not change their state and remain air-saturated (such pores are
denoted with eAA since they move from an air-saturated state –A- to another air-
saturated state –A). On the other hand, water-saturated pores split in two different
sub-classes upon drying. One fraction of these pores remains water-saturated (such
pores are denoted with eWW since they move from a water-saturated state –W- to
another water-saturated state –W). A second fraction of water-saturated pores
becomes air-saturated (such pores are denoted with eWA since they move from a
water-saturated state –W- to an air-saturated state –A).
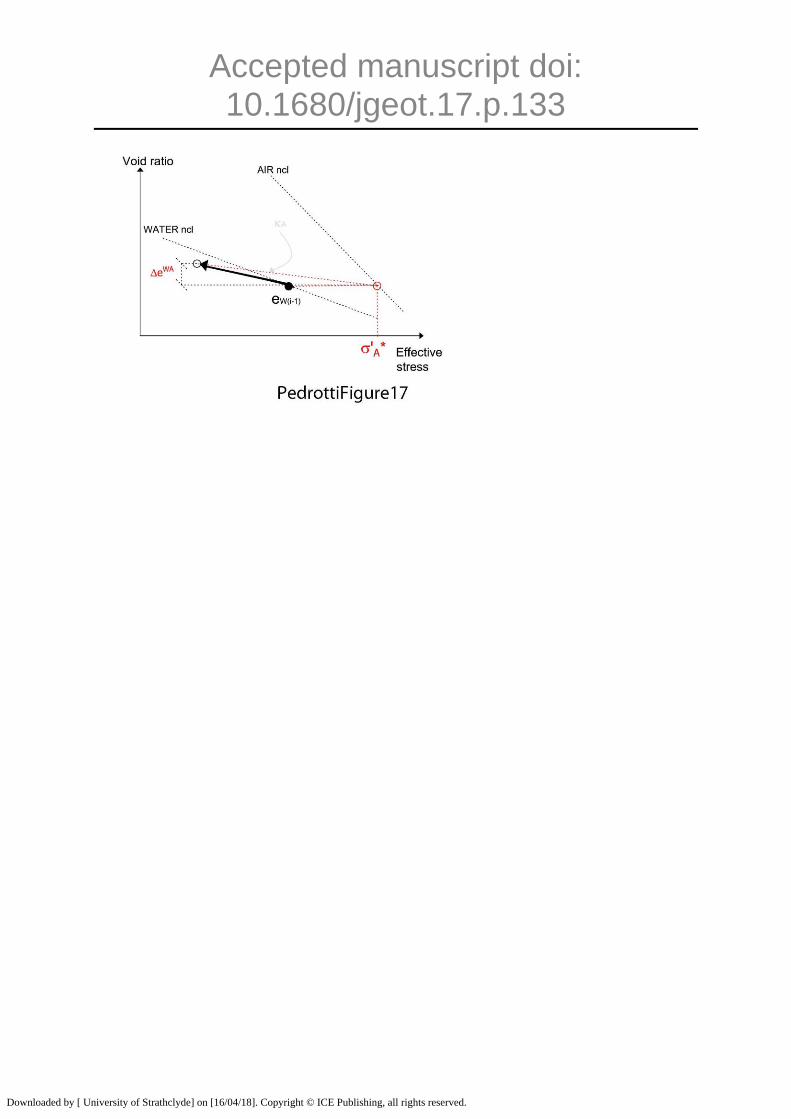
An example of the path of the pores that are initially water-saturated and becomes air-
saturated upon a drying path is shown in Figure 17. These pores lie initially on the water-
saturated ncl and then move to an air-saturated url.
To compute the change in void ratio eWA
, it is convenient to introduce an equivalent air-
saturated pre-consolidation stress
. As shown in Figure 17, this is given by the air-
saturated effective stress that returns a void ratio on the air-saturated ncl equal to the void
ratio before the change of state.
Downloaded by [ University of Strathclyde] on [16/04/18]. Copyright © ICE Publishing, all rights reserved.
Accepted manuscript doi: 10.1680/jgeot.17.p.133
For the case shown in Figure 16, the equivalent air-saturated pre-consolidation stress
is
not exceeded by the current air-saturated effective stress
and the ‘equivalent’ air-
saturated path occurs along the url,
Accordingly, the change in void ratio eWA
is given by:
( ) (
) [10]
SIMULATION OF HYDRO-MECHANICAL PATHS OF UNSATURARED
SAMPLES
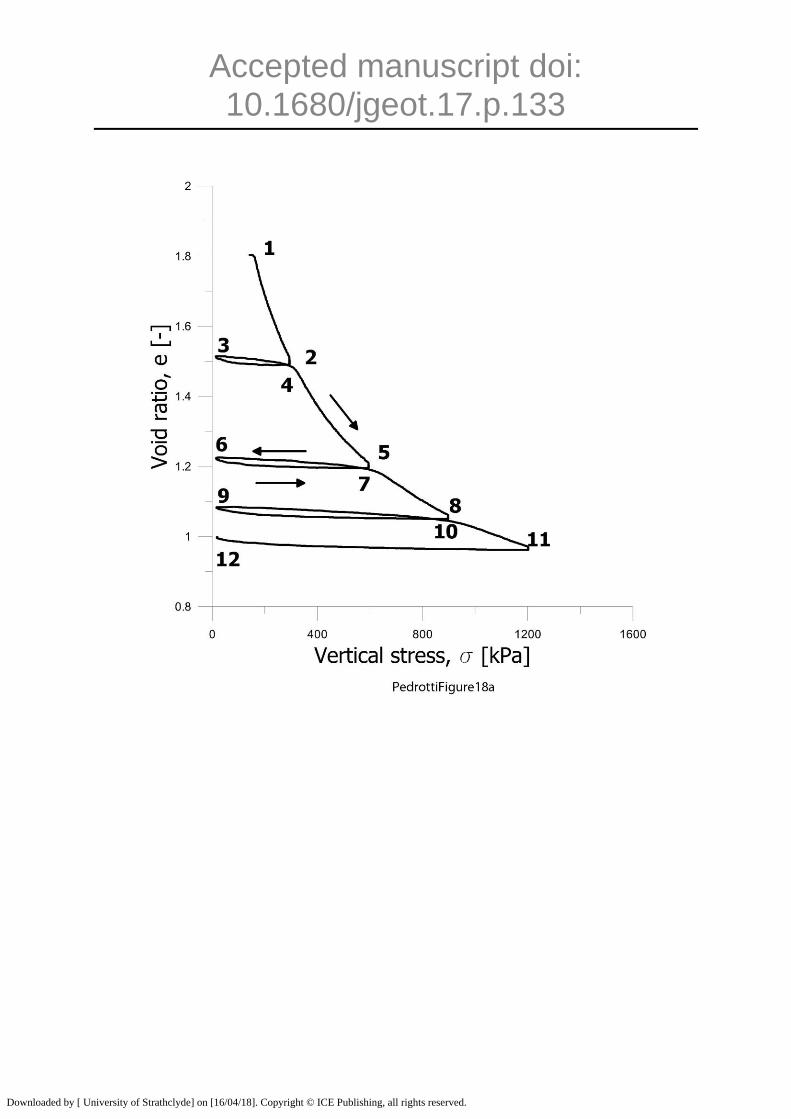
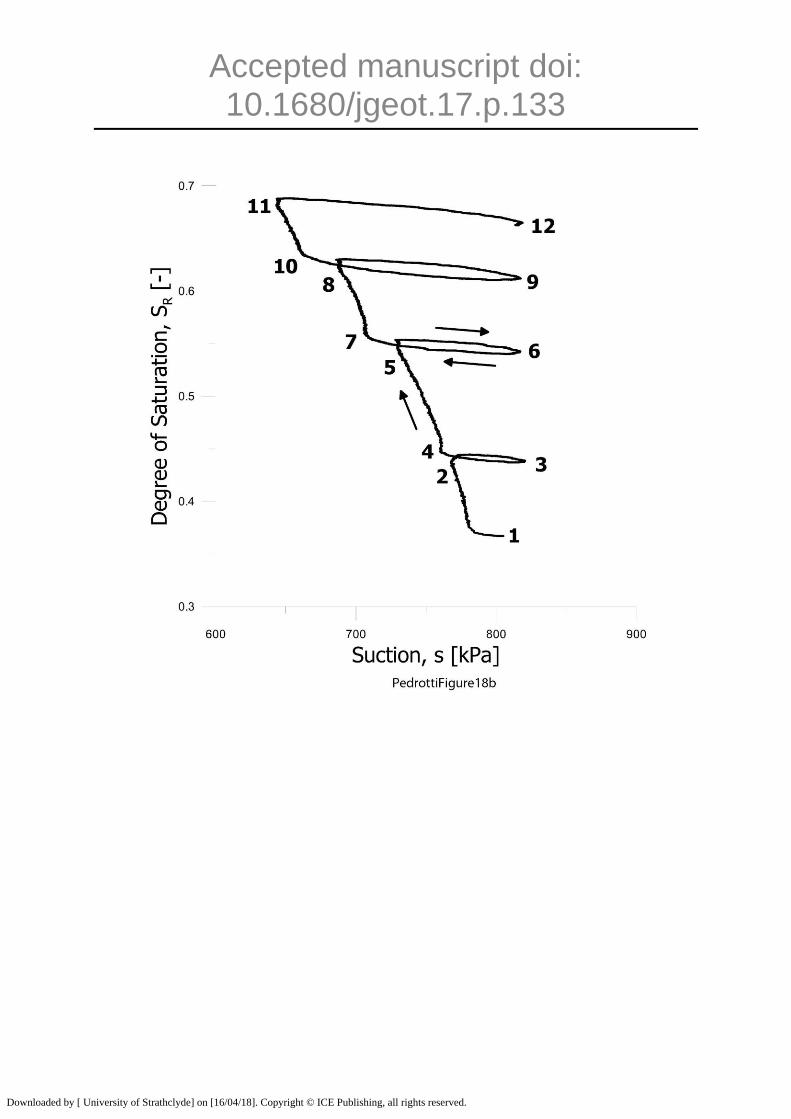
Simulation of loading and unloading at constant water content (compaction)
The experimental data presented by Tarantino and De Col (2008) were considered
for the simulation. Six samples were loaded and unloaded at constant water content
to 300, 600, 900 and 1200 kPa respectively with water content ranging from w=0.236
to w=0.311. Compression at constant water content (compaction) was carried out in
a modified oedometer cell where suction was measured by high-capacity
tensiometers during the compaction process. As an example, Figure 18 shows the
results of the test on the specimen at w=0.254 in terms of void ratio versus total
stress and degree of saturation versus matric suction.
Because the test involves both loading (e.g. 4 to 5) and unloading paths (e.g. 5 to 6),
these are discussed separately.
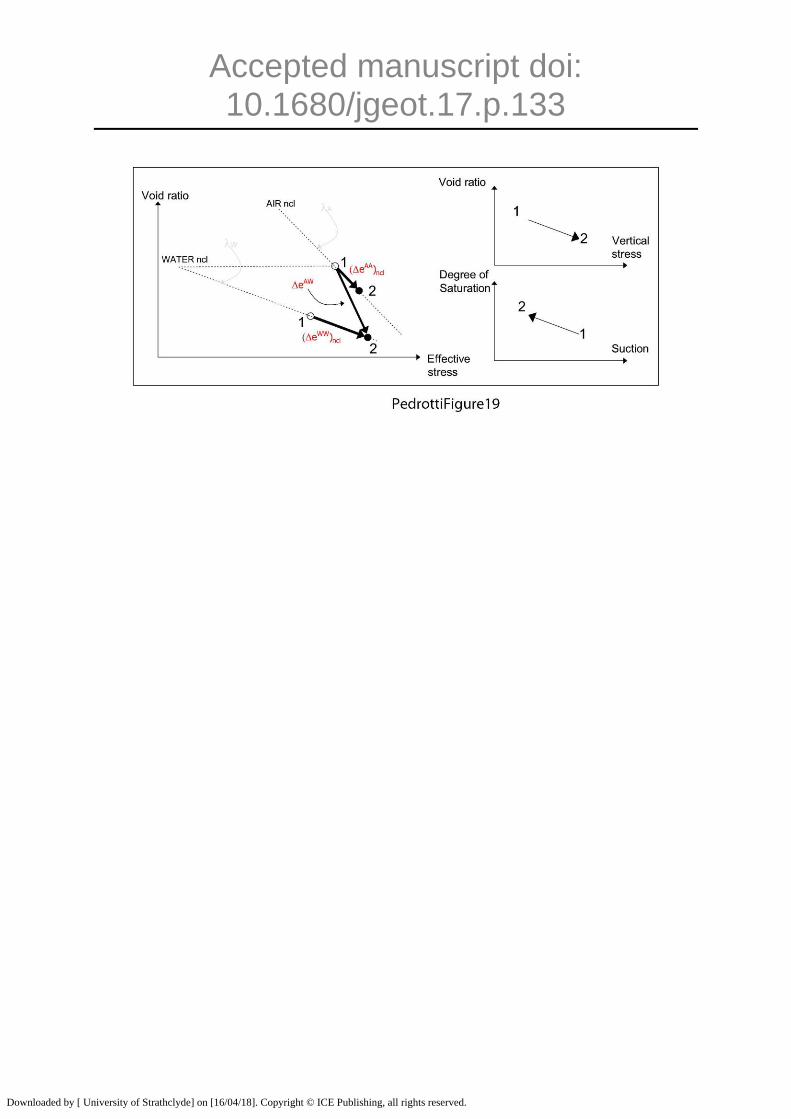
Mechanical loading path
Upon loading, the void ratio decreases at constant water content. The hydraulic path is
therefore a wetting path since the degree of saturation increases. Accordingly, the pores
follow the pattern shown in Figure 15a.
Downloaded by [ University of Strathclyde] on [16/04/18]. Copyright © ICE Publishing, all rights reserved.
Accepted manuscript doi: 10.1680/jgeot.17.p.133
The water-saturated pores and the air-saturated pores that do not change their state move
along the water-saturated ncl (eWW
) and the air-saturated ncl respectively (eAA
) (Figure
19). The air-saturated pores that become water-saturated move from the air-saturated ncl to
the water-saturated ncl (eAW
in Figure 19). These pores therefore experience volumetric
collapse as discussed in Figure 16.
The wetting path generates a new fraction of water-saturated pores that experience
a void ratio change (eAW) that adds to the fraction of pores that were already
saturated and are subjected to the change eWW. To compute the overall change in
water-saturated void ratio eW, the volume of solids of these two fractions need to be
considered. If VsWW is the volume of solids of the fraction that remains water-
saturated and VsAW is the volume of solids of the fraction that becomes water-
saturated, the total volume of ‘wet’ solids is given by VsW=Vs
AW+VsWW.
The water-saturated void ratio eW is therefore given by a weighted average of the
two water-saturated void ratio changes:
(
)
[11]
The volume of the solids , i.e. the volume of the solids that becomes wetted
upon an increase in degree of saturation (wetting) can be reasonably assumed to be
proportional to the increase in degree of saturation Sr. Accordingly, the most
convenient assumption for the ratio
⁄ is:
Downloaded by [ University of Strathclyde] on [16/04/18]. Copyright © ICE Publishing, all rights reserved.
Accepted manuscript doi: 10.1680/jgeot.17.p.133
Eq. [11] therefore becomes:
(
)
[12]
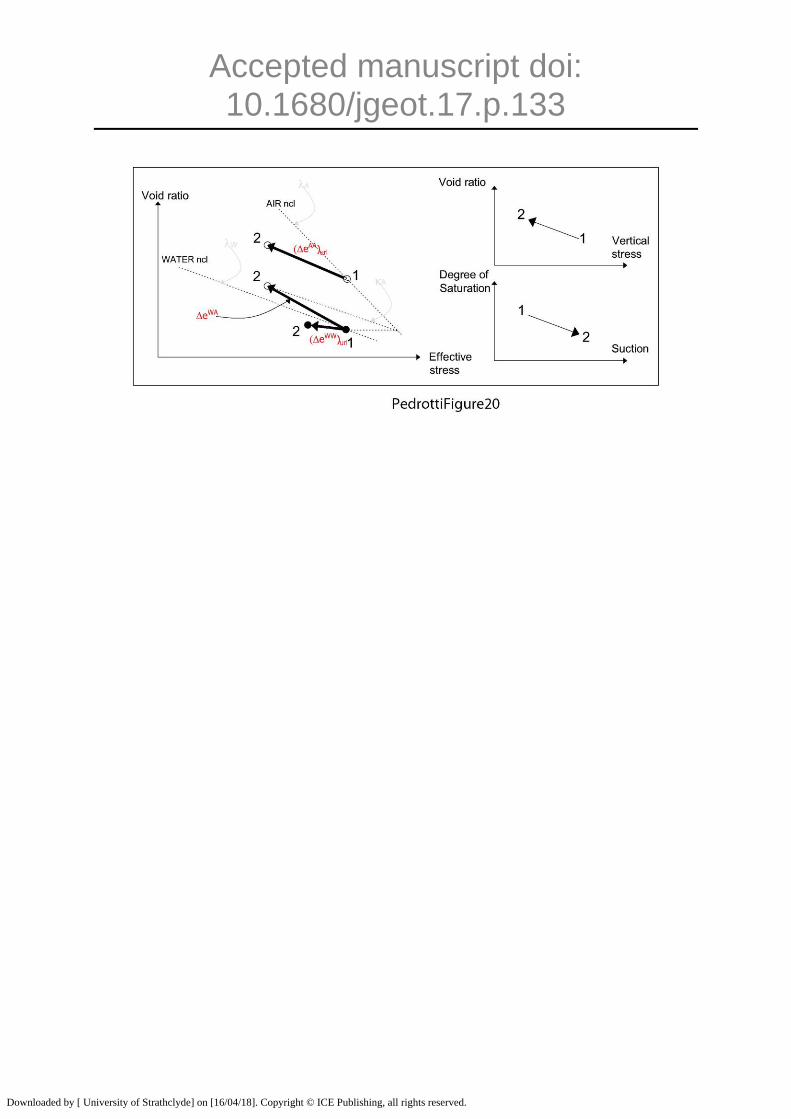
Mechanical unloading path
Upon unloading, the void ratio decreases at constant water content. The hydraulic path is
therefore a drying path since the degree of saturation decreases. Accordingly, the pores
follow the pattern shown in Figure 20a. The air-saturated pores and the water-saturated pores
that do not change their state move along the water-saturated url (eWW
) and the air-saturated
url respectively (eAA
) and experience rebound (Figure 19). The water-saturated pores that
become air-saturated move from the water-saturated ncl to the air-saturated url (eWA
in
Figure 17 and Figure 20a). These pores also experience volumetric rebound.
The drying path generates a new fraction of air-saturated pores that experience a
void ratio change (eWA) that adds to the fraction of pores that were and remain air-
saturated and are subjected to the void ratio change eAA. To compute the overall
change in air-saturated void ratio eA, the volume of solids of these two fractions
needs to be considered.
The air-saturated void ratio eA is given by a weighted average of the two air-
saturated void ratio changes. With similar arguments as above, one can write:
[ ( )
]
( )
[13]
Test simulation
Downloaded by [ University of Strathclyde] on [16/04/18]. Copyright © ICE Publishing, all rights reserved.
Accepted manuscript doi: 10.1680/jgeot.17.p.133
To simulate the loading and unloading paths of the type shown in Figure 18:
i) The applied vertical stress, the suction, and the degree of saturation measured
during the test were taken as input data (Tarantino and De Col, 2008)
ii) The compressibility indexes of kaolin reconstituted from slurry and kaolin
prepared from dry powder taken as the only ‘constitutive’ parameters.
iii) The initial states of the air-saturated and water-saturated fractions are both
normally consolidated.
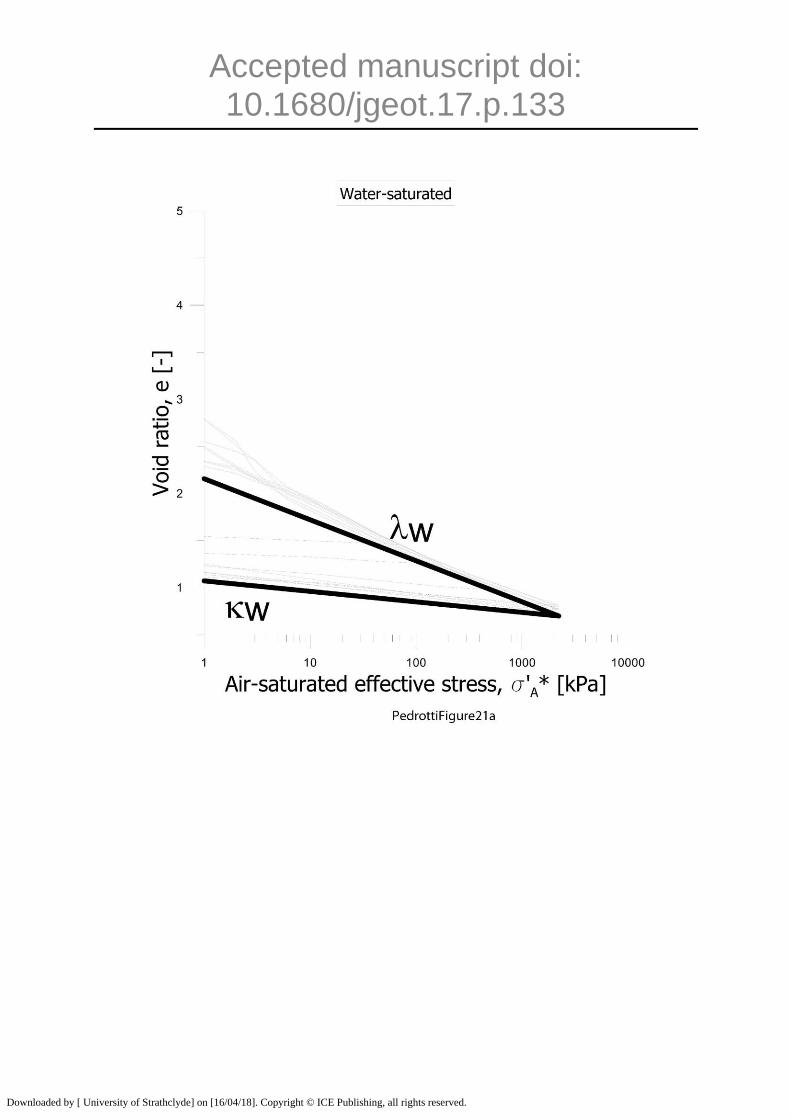
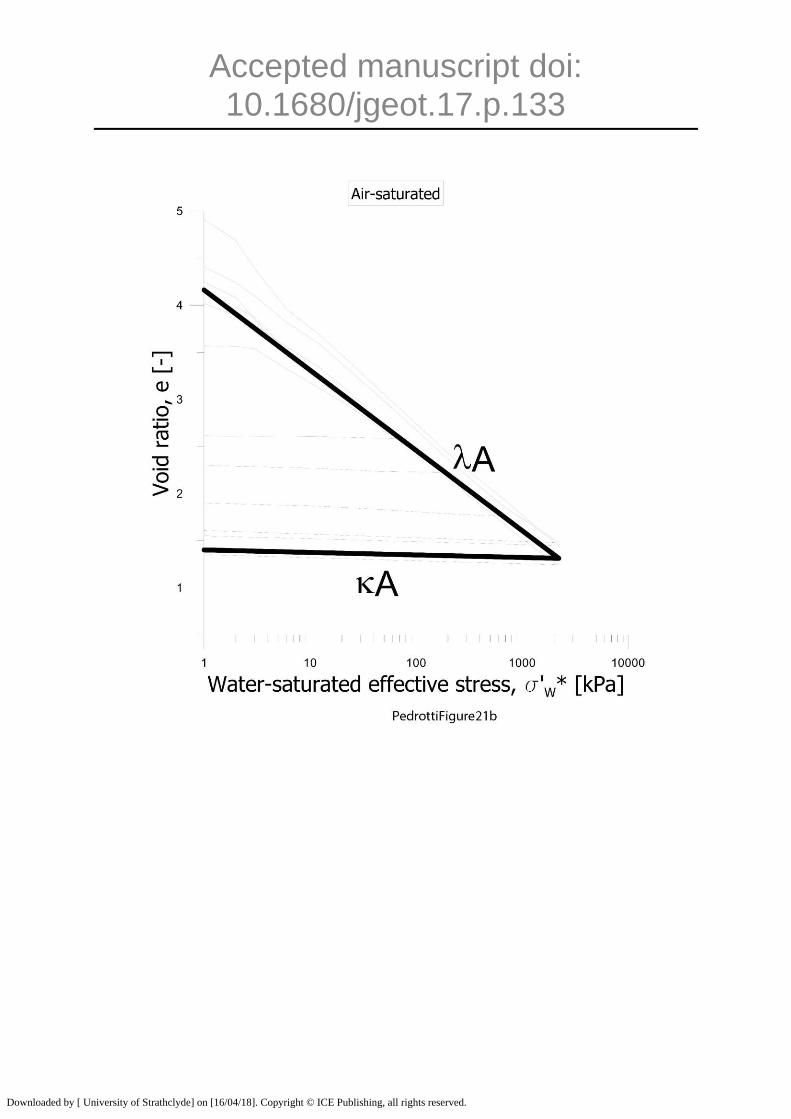
The compressibility indexes assumed for the water-saturated and air-saturated pores are
shown in Figure 21 (the experimental curves are also shown for reference)
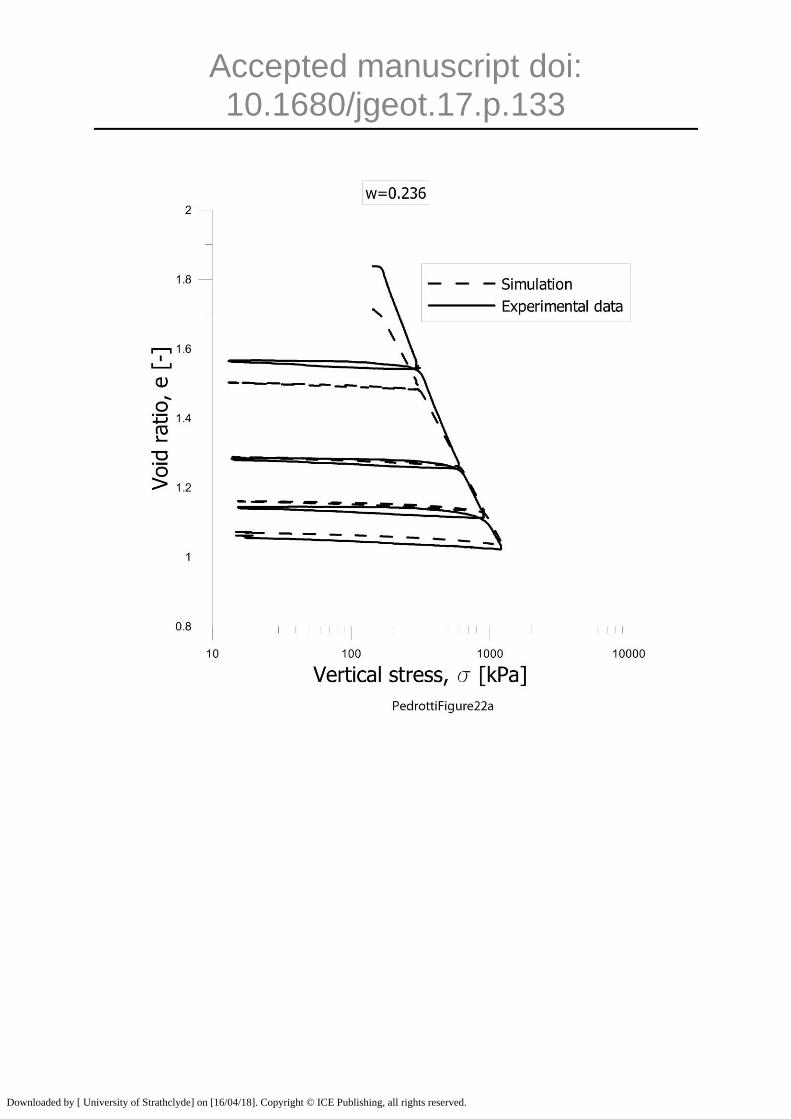
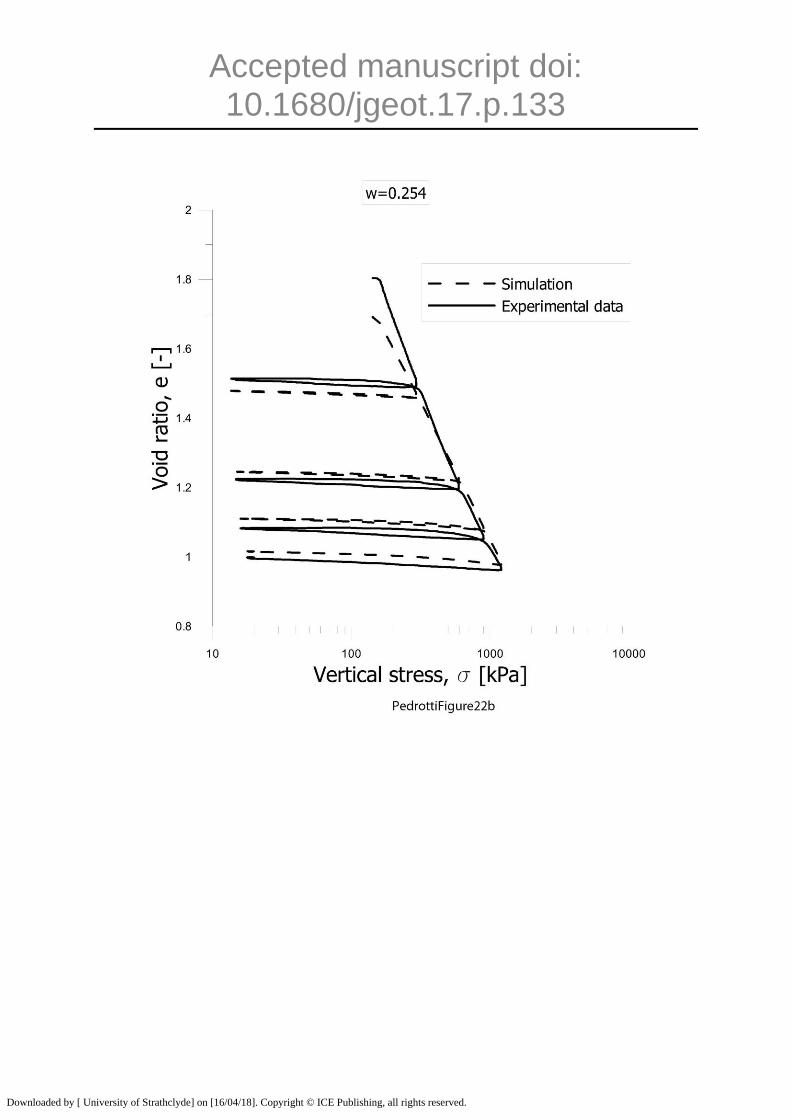
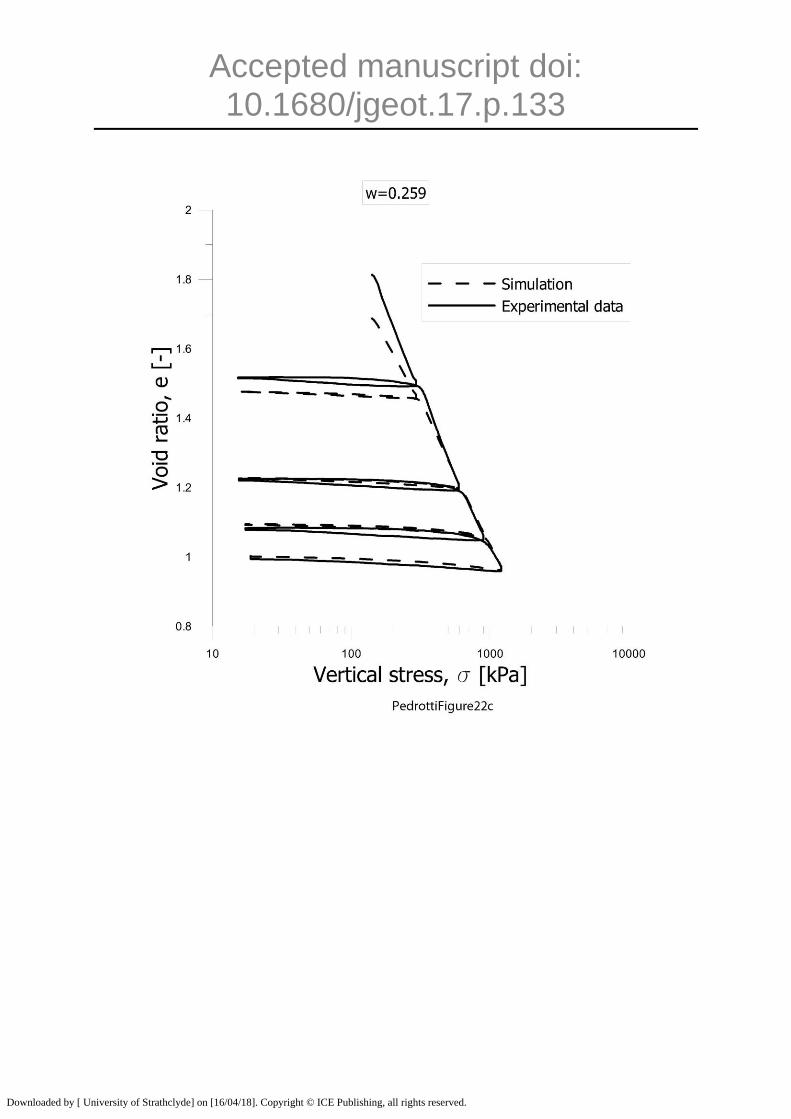
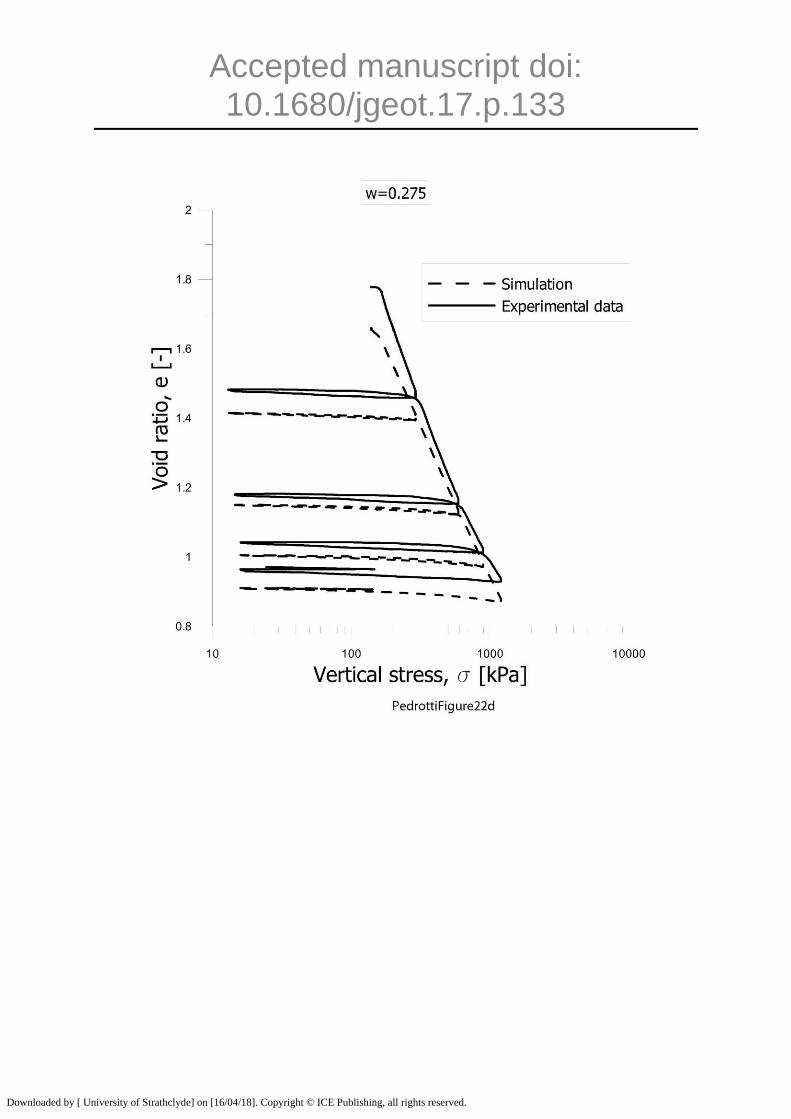
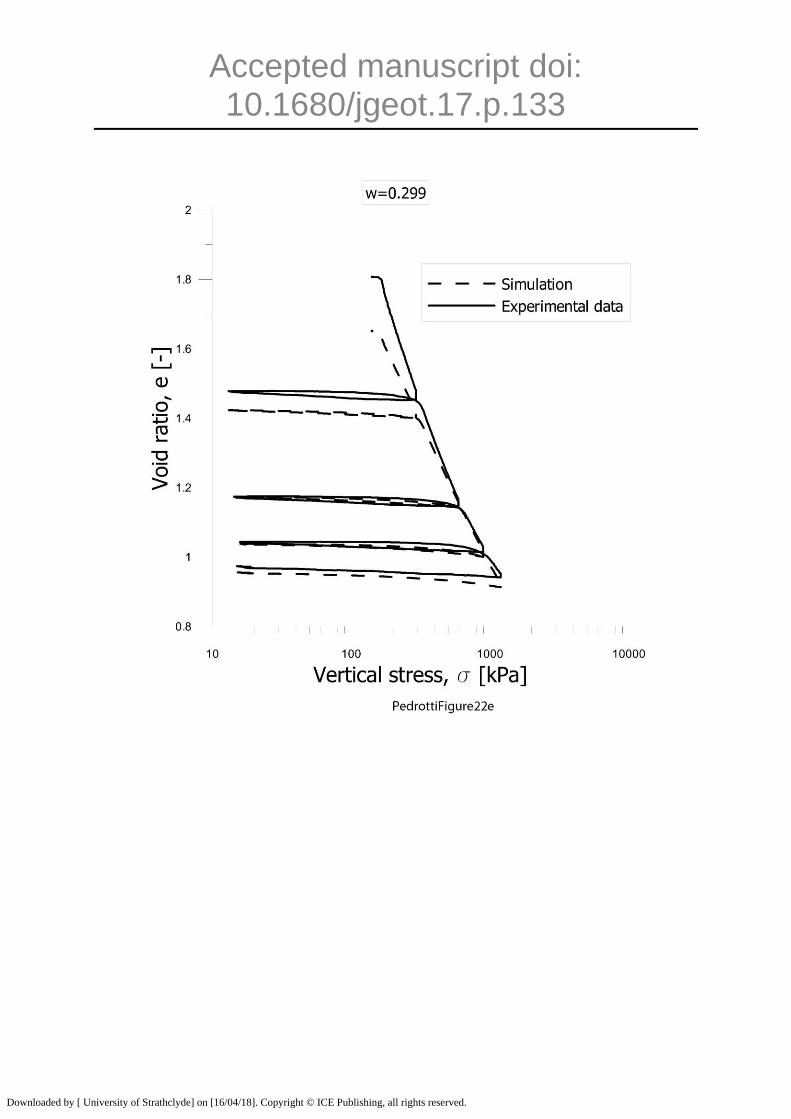
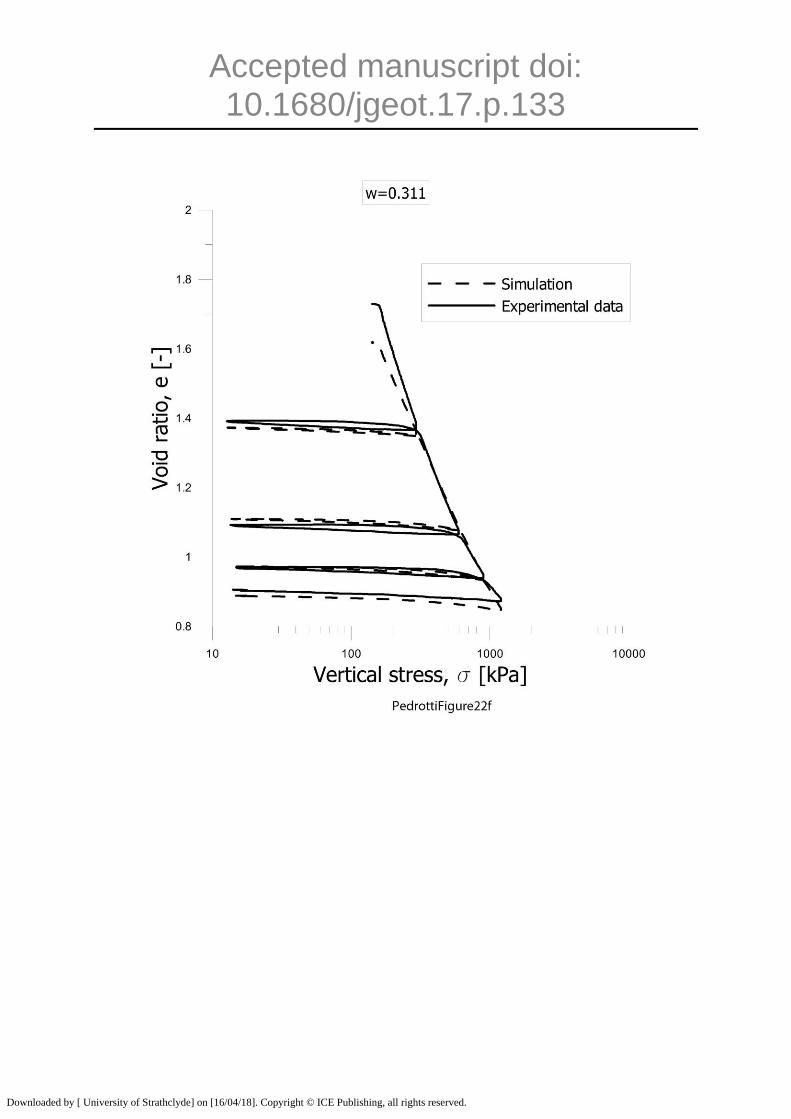
Figure 22 shows the simulated paths for the loading and unloading at constant water
content together with the experimental data. The simulation shows an excellent
agreement with the experimental data. This is a remarkable achievement
considering that no fittings parameters have been used and only the compression
curves for water-saturated clay (reconstituted from slurry) and air-saturated clay
(prepared from dry powder) were used to model the experimental data.
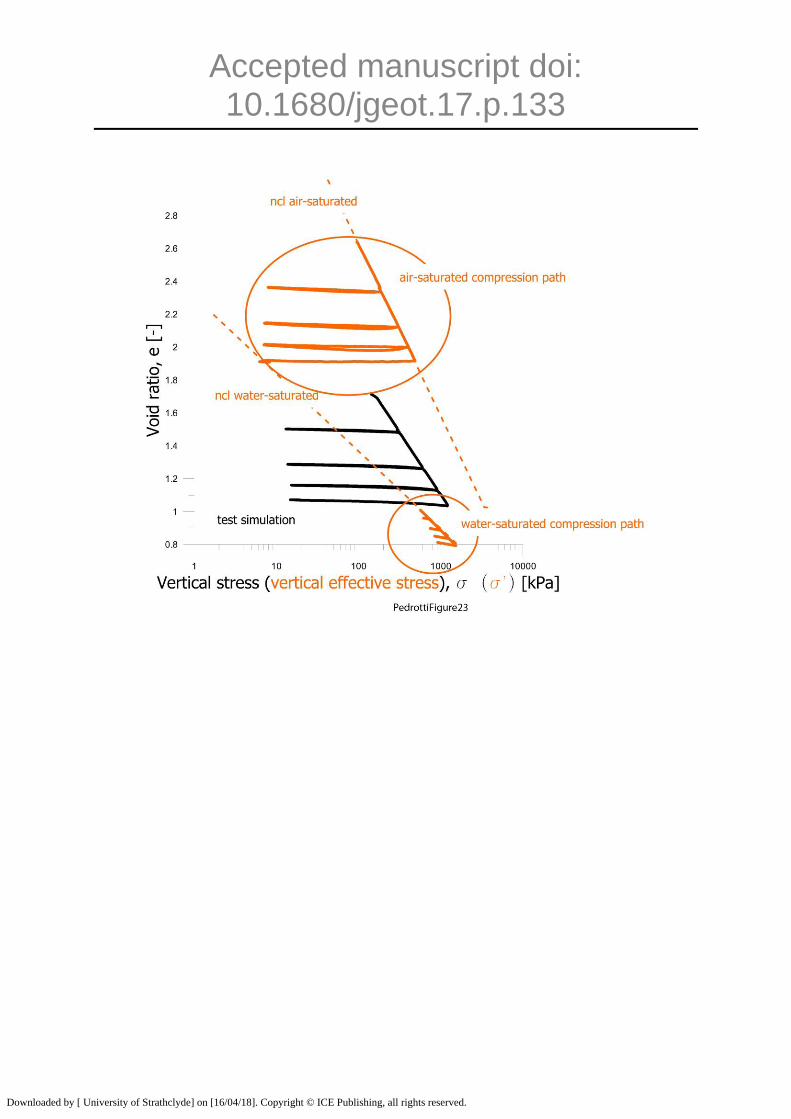
To better highlight the separate compression of air-saturated and water-saturated pores,
Figure 23 shows the compression paths of the water-saturated part, , and the compression
path of the air-saturated part, , for the sample compacted at w=0.236. For the virgin
compression, the paths followed by the water saturated and air-saturated pores both lie on
their relative ncl. At any step, the void ratio of the compacted sample is the weighted average
of the air-saturated and water-saturated pores, i.e. the compression curve of the unsaturated
(compacted) sample lies between ncl of the clay reconstituted from slurry and the clay
prepared from dry powder respectively. Furthermore, since the degree of saturation increases
Downloaded by [ University of Strathclyde] on [16/04/18]. Copyright © ICE Publishing, all rights reserved.
Accepted manuscript doi: 10.1680/jgeot.17.p.133
upon loading, the compaction curve tends to converge to the water-saturated ncl
(reconstituted from slurry).
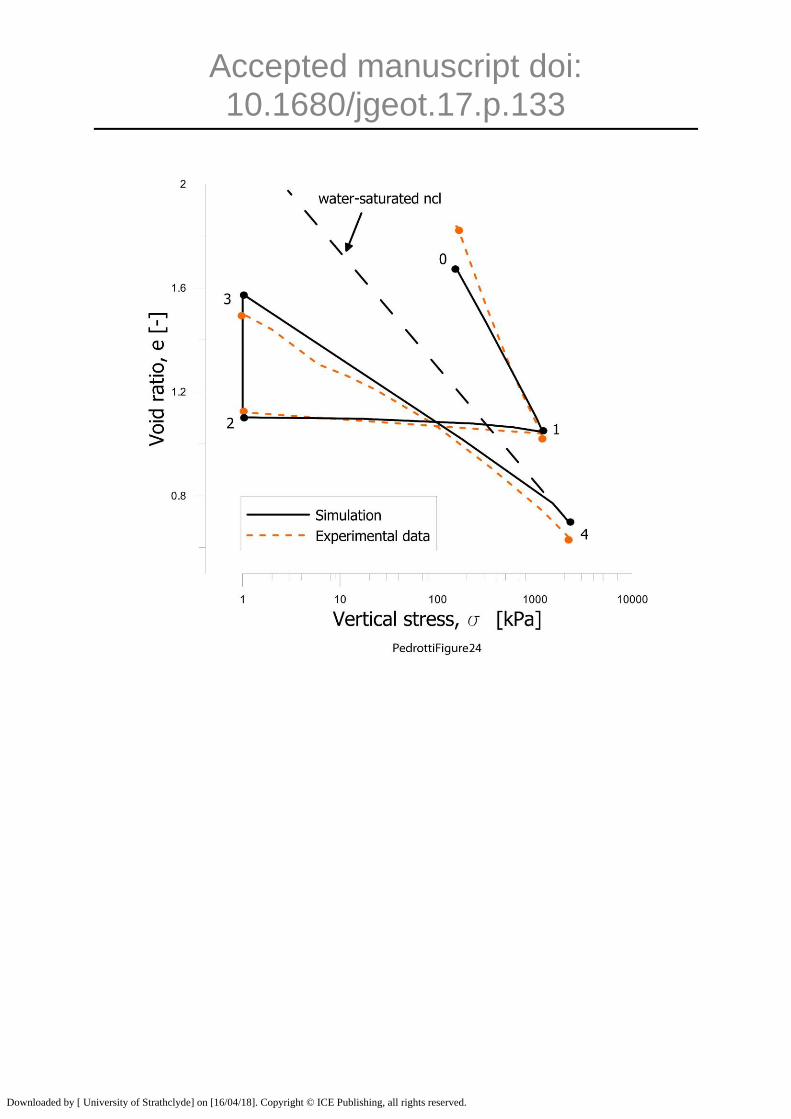
Simulation of saturation (hydraulic wetting) and subsequent mechanical loading
A test involving saturation of a compacted sample was considered to test the conceptual
constitutive model. The test was characterised by three steps as shown in Figure 24:
- Step 0-1-2: compaction at constant water content (w=0.12) to 1200 kPa vertical stress and
subsequent unloading to 1kPa. State 2 is the state commonly referred to ‘as-compacted’ state.
- Step 2-3: saturation under quasi-zero vertical stress
- Step 3-4: reloading under saturated conditions
The approach followed to simulate the path 0-1-2 is the one illustrated the previous section.
The focus here is the simulation of the swelling upon saturation (path 2-3) and the following
reloading under saturated conditions (path 3-4).
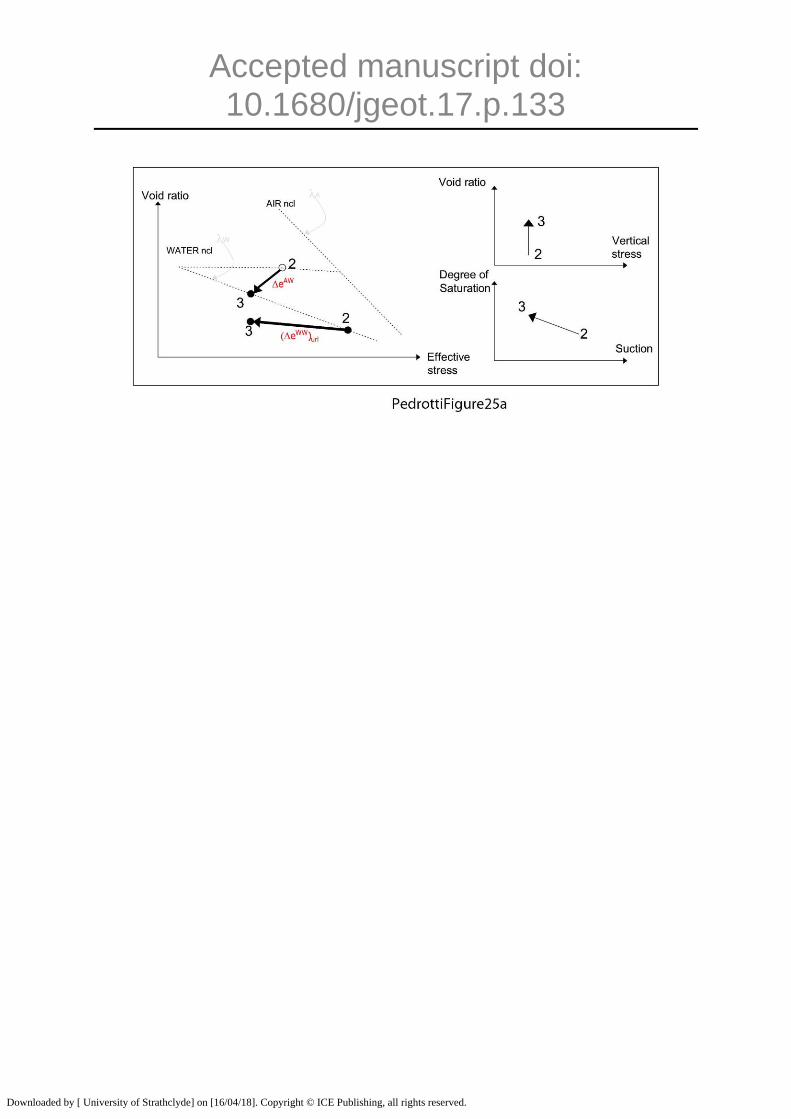
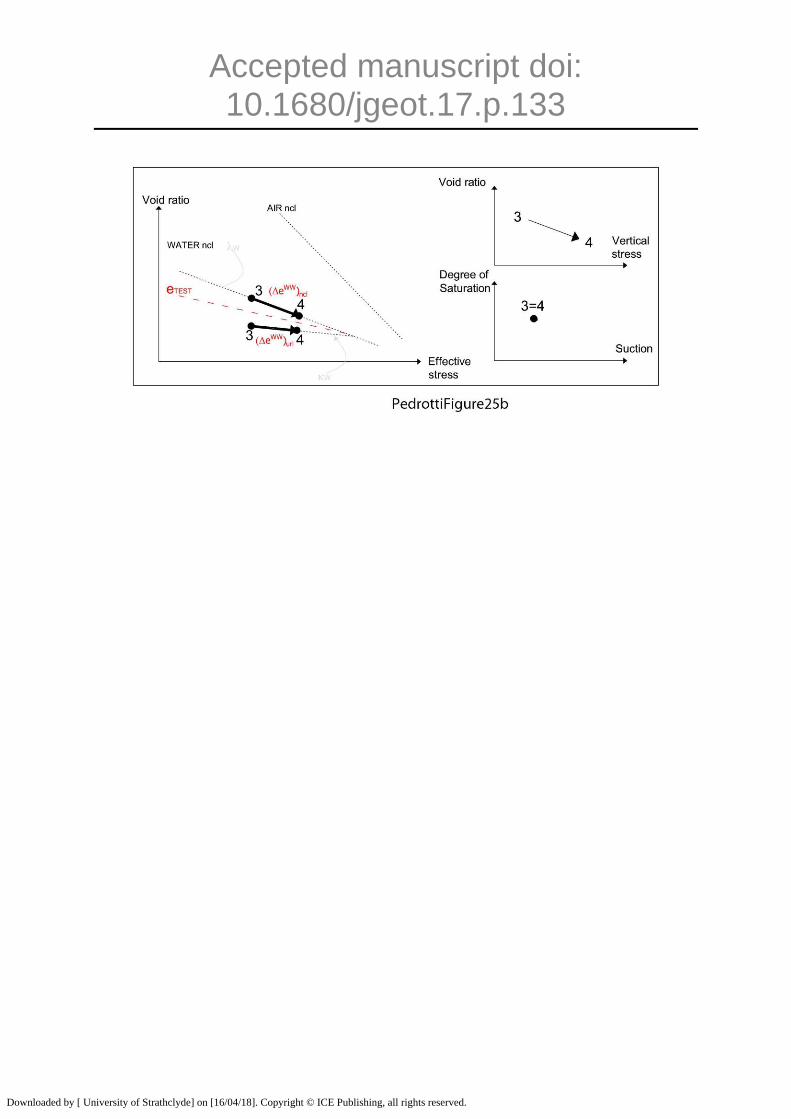
The path followed by the pores in step 2-3 is shown Figure 25a. At point 2, air-
saturated and water-saturated pores are both present. The sample is subjected to
quasi-zero total stress and only the suction contributes to the water-saturated
effective stress. Upon saturation, the water-saturated pores that were and remain
saturated experience swelling due to the decrease in suction (eWW in Figure 25a).
On the other hand, the air-saturated pores become water-saturated. As discussed in
Figure 16, such pores experience volumetric collapse as they move to the water-
saturated ncl (eAW in Figure 25a). The total change in void ratio experienced upon
saturation depends on the competition between these two mechanisms. As shown in
the simulation in Figure 24, the swelling mechanism was found to prevail in this
specific case.
Downloaded by [ University of Strathclyde] on [16/04/18]. Copyright © ICE Publishing, all rights reserved.
Accepted manuscript doi: 10.1680/jgeot.17.p.133
The path 3-4 only involves water-saturated pores. However, two fractions needs to
be considered, the pores the experienced the void ratio changes eWW and eAW
respectively. Although these two fractions are both subjected to the same water-
saturated effective stress, their history is different in the sense that they are
characterised by a different pre-consolidation stress, i.e. one fraction lies on the url
(WW) and one fraction lies on the ncl (AW). These fractions therefore experience
different void ratio change when the effective stress is increased (Figure 25b). The
overall void ratio therefore moves between the ncl and the url of the reconstituted
sample as shown in Figure 25b until a virgin state is attained by the class of pores
initially over-consolidated.
The simulation of the paths 0-1-2, 2-3 and 3-4 is shown in Figure 24. For the first path,
suction and degree of saturation was inferred from a test reported in Tarantino and De Col
(2008) carried out at same water content and maximum vertical stress. The quality of the
simulation of this path is in line with the simulation of the loading-unloading path shown in
the previous section.
Simulation of the paths 2-3 and 3-4 appears to capture quite well the swelling upon
saturation and the subsequent reloading. Again, the accuracy of this simulation is
remarkable if one considers that the mechanical constitutive parameters were only
derived from the compression curves of the clay reconstituted from slurry and
compressed from dry powder.
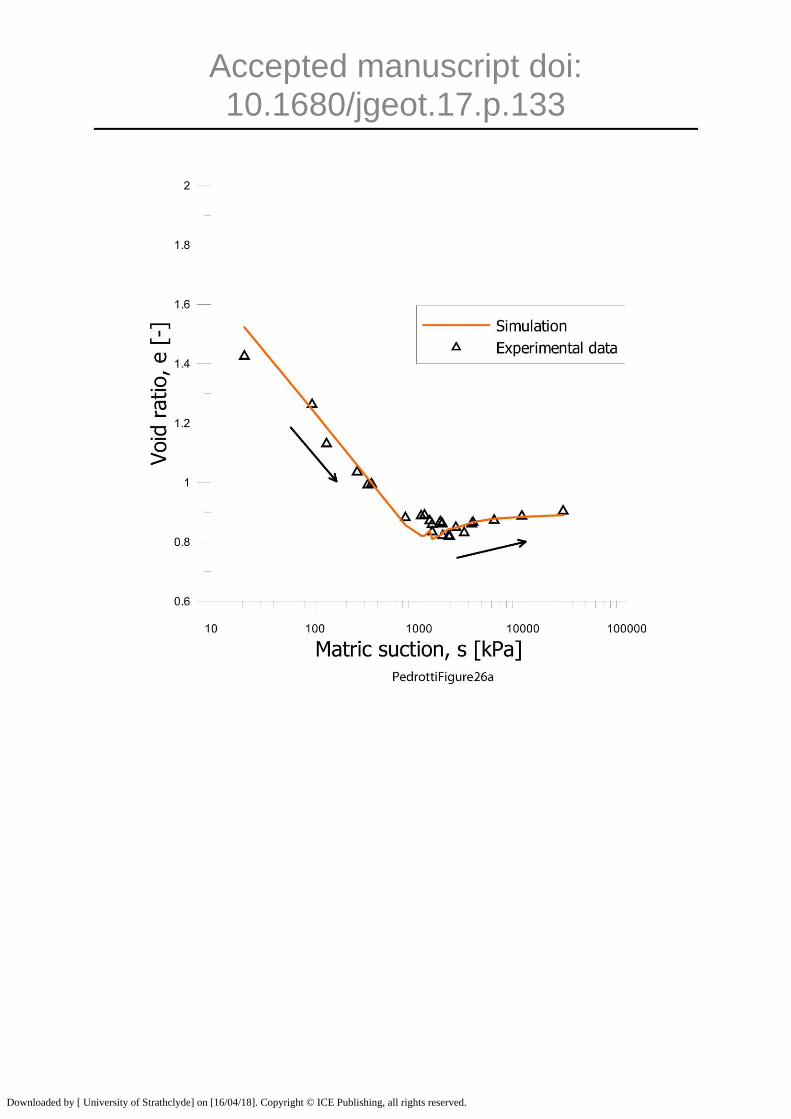
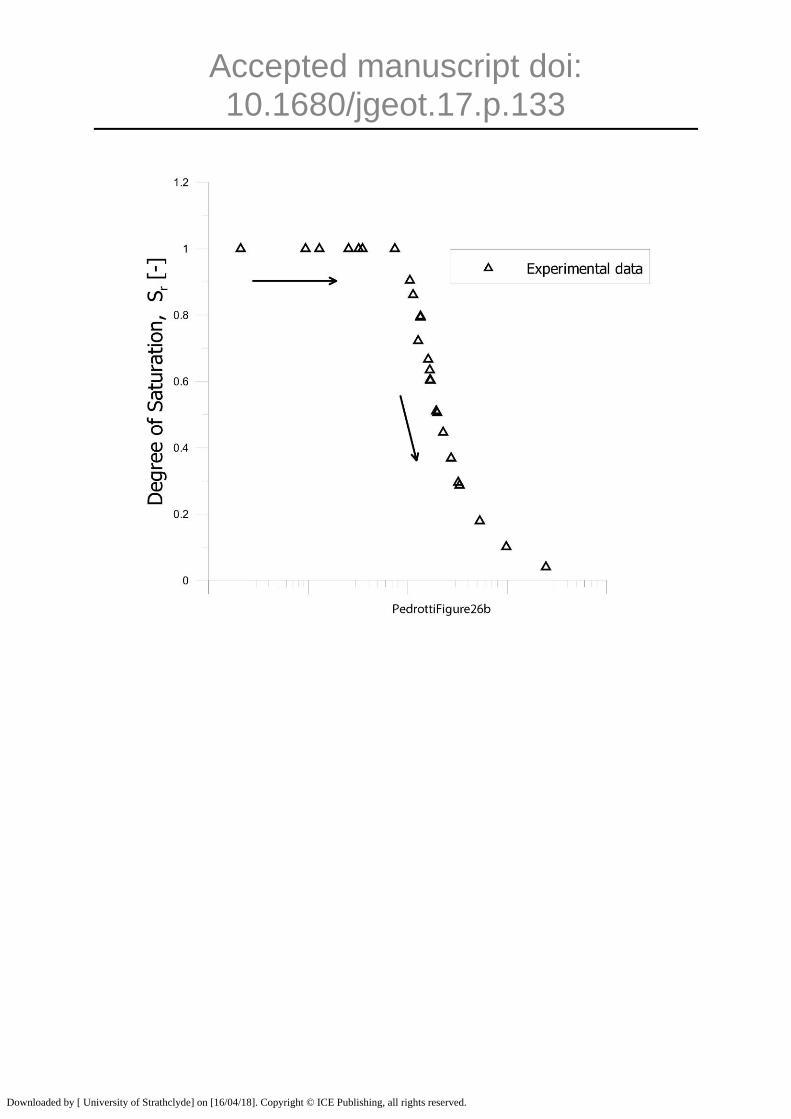
Simulation of volume change of reconstituted kaolin upon drying
A test presented by Tarantino (2010) was used for this simulation. Kaolin clay was
consolidated from slurry to 100 kPa vertical stress, removed from the oedometer, and then let
dry to different target water contents. Figure 26 shows the evolution of the degree of
Downloaded by [ University of Strathclyde] on [16/04/18]. Copyright © ICE Publishing, all rights reserved.
Accepted manuscript doi: 10.1680/jgeot.17.p.133
saturation and the void ratio as suction increases upon drying. Under saturated conditions, the
specimen follows the ncl. Beyond the air-entry suction, the specimen shows a tendency to
rebound.
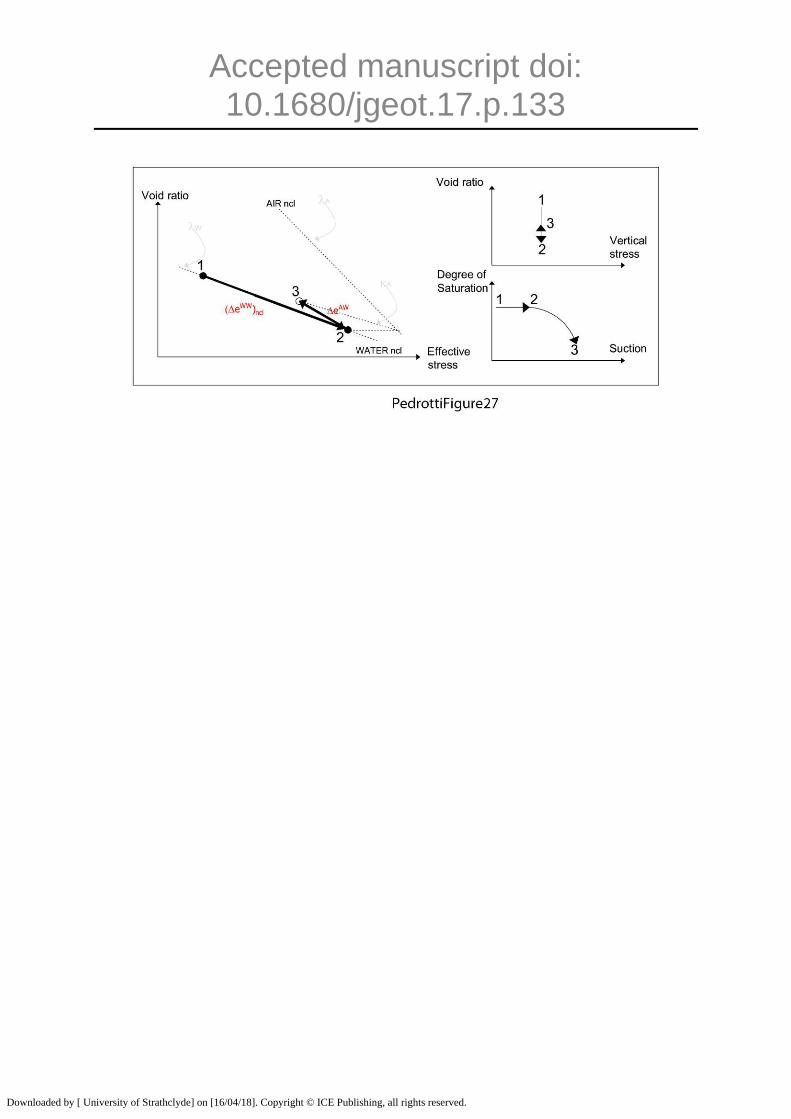
The path followed by the pores in the saturated range is trivial. This specimen was
reconstituted from slurry and therefore all the pores initially follow the water-saturated ncl.
Beyond the air entry suction, two classes of pores are present, the water-saturated pores that
remain water-saturated (WW) and the air-saturated pores that were previously water-saturated
(AW).
Pores that remain water-saturated move along the water saturated ncl and experience a
decrease in void ratio eWW
. Pores that become air-saturated moves to an air-saturated url and
experience a rebound eWA
as shown in Figure 27. The overall void ratio change depends on
the competition between these two opposite mechanisms.
The simulation of this test is shown in Figure 26. Suction and degree of saturation were taken
from the experimental data and used as input variables. The ncl of the water saturated kaolin
(reconstituted from slurry) was used as reference for the water-saturated part and the air-
saturated url (dry powder) as reference for the drying process. The simulation captures quite
well the response of the clay in the unsaturated range. In this specific case, the rebound of the
pores that dry out prevail on the shrinkage of the pores that remain saturated and the overall
void ratio increases upon drying.
CONCLUSIONS
This paper has presented an experimental investigation aimed at exploring the continuity
between the microstructure of reconstituted and compacted states. The pore-size distribution
(PSD) of compacted samples has been compared with the PSDs of samples reconstituted
from slurry and samples prepared from dry powder respectively.
Downloaded by [ University of Strathclyde] on [16/04/18]. Copyright © ICE Publishing, all rights reserved.
Accepted manuscript doi: 10.1680/jgeot.17.p.133
Compacted samples show a bi-modal pore-size frequency distribution characterised by
micro-pores and macro-pores. It has been shown that the distribution of the micro-pores is
associated with the distribution of pores in samples reconstituted from slurry and the
distribution of the macro-pores is associated with the distribution of pores in sample prepared
from dry powder. This has led to a different view of compacted soil microstructure where
macro-pores are assumed to be just pores filled with air (air-saturated) and micro-pores are
assumed to be just pores filled with water (water-saturated).
The evolution of PSD has then been inspected upon saturation paths under quasi-zero stress
involving unsaturated (compacted) and dry (compressed from dry powder) samples. It has
been shown that the PSD of samples in saturated state (at given vertical stress) is the same
irrespective of whether the sample was formed saturated (reconstituted from slurry),
unsaturated (compacted), or dry (from clay powder). This appears to support the idea that
there are two classes of pores in clay, one filled with water (water-saturated) and the other
one filled with air (air-saturated).
Based on this idea, a conceptual constitutive model has been formulated based on two core
assumptions, i) unsaturated (compacted) clay is made of air-saturated and water-saturated
pores, and ii) the air-saturated part behaves as the air-saturated (compressed from dry
powder) clay and the water-saturated part behaves as the water-saturated (reconstituted from
slurry) clay.
After identifying the ‘effective’ stresses acting on the dry and saturated part of the
clay, complex hydro mechanical paths have been modelled, including loading and
unloading at constant water content, saturation of an initially unsaturated
(compacted) clay, and drying of an initially saturated (reconstituted from slurry) clay.
The simulations captured quite well the experimental data. It is remarkable that
Downloaded by [ University of Strathclyde] on [16/04/18]. Copyright © ICE Publishing, all rights reserved.

Accepted manuscript doi: 10.1680/jgeot.17.p.133
simulations were based on constitutive parameters derived only from the
compression behaviour of clay under dry (formed from dry powder) and saturated
(reconstituted from slurry) conditions.
Downloaded by [ University of Strathclyde] on [16/04/18]. Copyright © ICE Publishing, all rights reserved.
Accepted manuscript doi: 10.1680/jgeot.17.p.133
APPENDIX
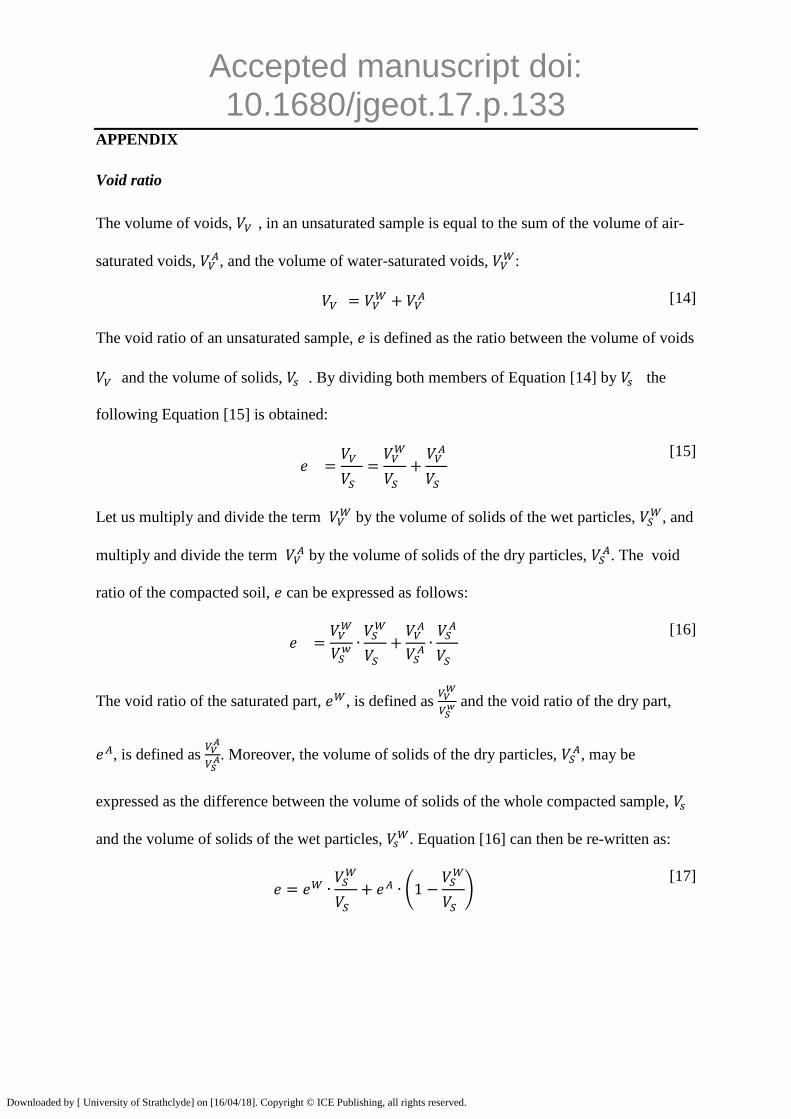
Void ratio
The volume of voids, , in an unsaturated sample is equal to the sum of the volume of air-
saturated voids, , and the volume of water-saturated voids,
:
[14]
The void ratio of an unsaturated sample, is defined as the ratio between the volume of voids
and the volume of solids, . By dividing both members of Equation [14] by the
following Equation [15] is obtained:
[15]
Let us multiply and divide the term by the volume of solids of the wet particles,
, and
multiply and divide the term by the volume of solids of the dry particles,
. The void
ratio of the compacted soil, can be expressed as follows:
[16]
The void ratio of the saturated part, , is defined as
and the void ratio of the dry part,
, is defined as
. Moreover, the volume of solids of the dry particles,
, may be
expressed as the difference between the volume of solids of the whole compacted sample,
and the volume of solids of the wet particles, . Equation [16] can then be re-written as:
(
) [17]
Downloaded by [ University of Strathclyde] on [16/04/18]. Copyright © ICE Publishing, all rights reserved.
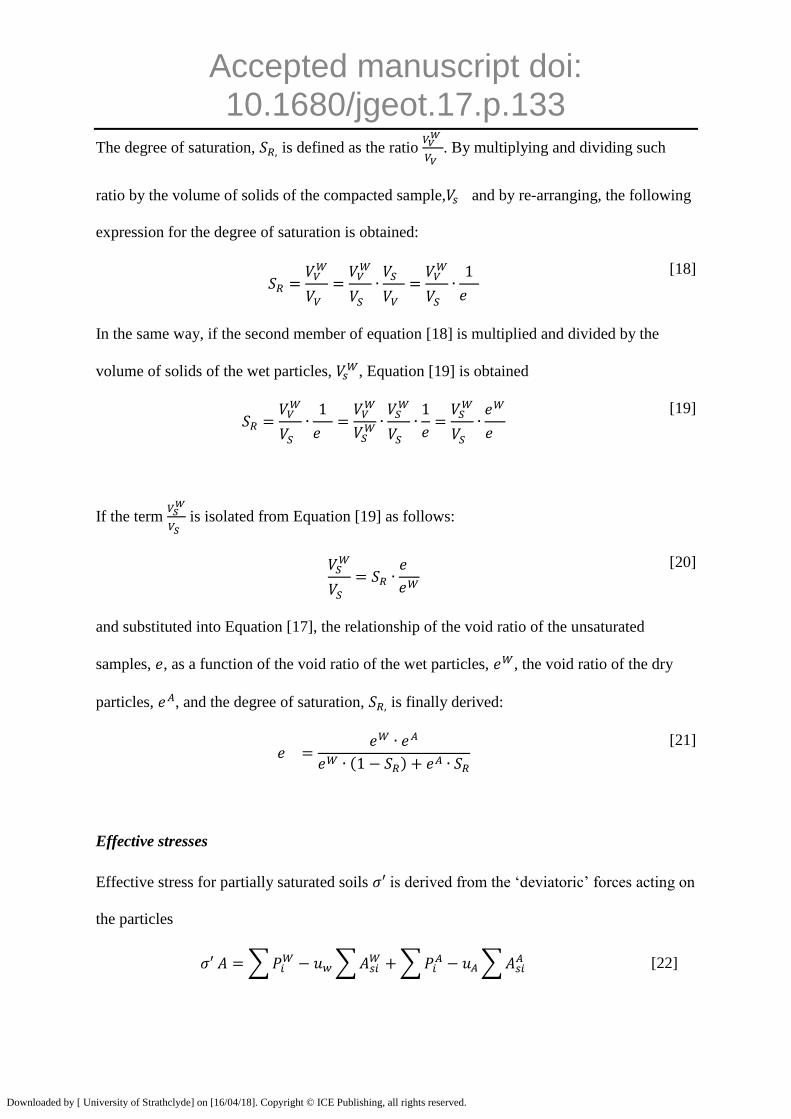
Accepted manuscript doi: 10.1680/jgeot.17.p.133
The degree of saturation, is defined as the ratio
. By multiplying and dividing such
ratio by the volume of solids of the compacted sample, and by re-arranging, the following
expression for the degree of saturation is obtained:
[18]
In the same way, if the second member of equation [18] is multiplied and divided by the
volume of solids of the wet particles, , Equation [19] is obtained
[19]
If the term
is isolated from Equation [19] as follows:
[20]
and substituted into Equation [17], the relationship of the void ratio of the unsaturated
samples, , as a function of the void ratio of the wet particles, , the void ratio of the dry
particles, , and the degree of saturation, is finally derived:
( )
[21]
Effective stresses
Effective stress for partially saturated soils is derived from the ‘deviatoric’ forces acting on
the particles
∑ ∑
∑ ∑
[22]
Downloaded by [ University of Strathclyde] on [16/04/18]. Copyright © ICE Publishing, all rights reserved.
Accepted manuscript doi: 10.1680/jgeot.17.p.133
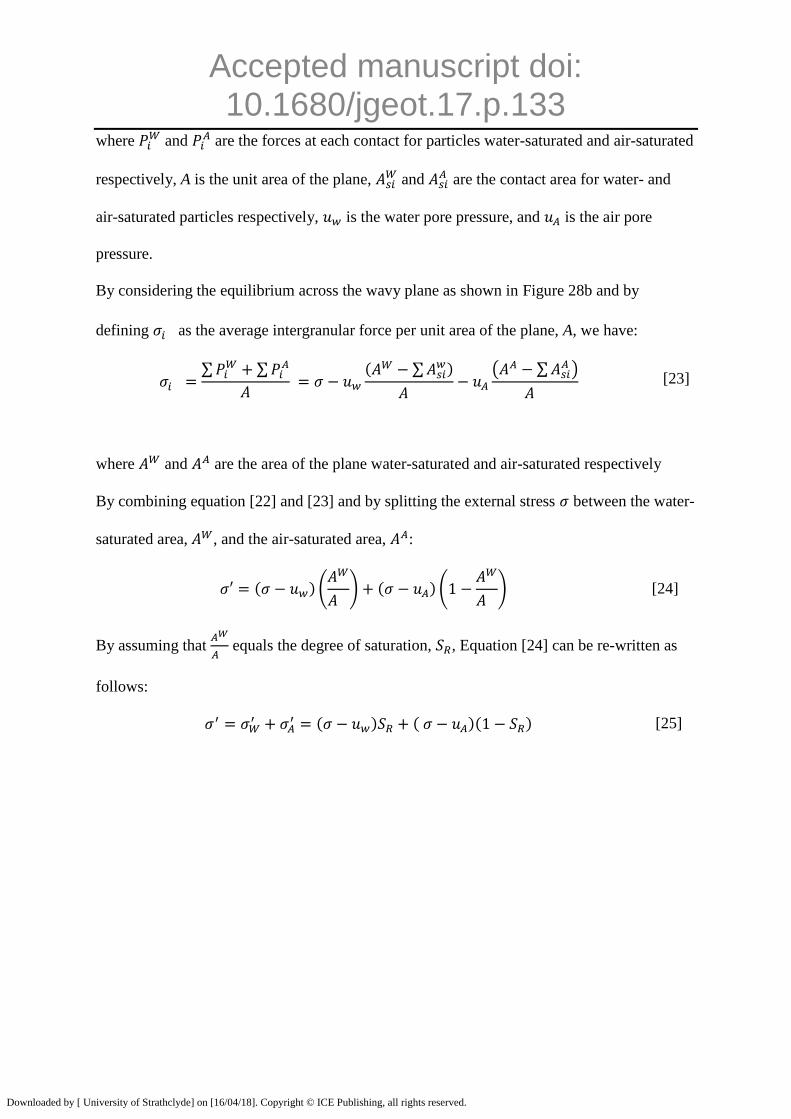
where and
are the forces at each contact for particles water-saturated and air-saturated
respectively, A is the unit area of the plane, and
are the contact area for water- and
air-saturated particles respectively, is the water pore pressure, and is the air pore
pressure.
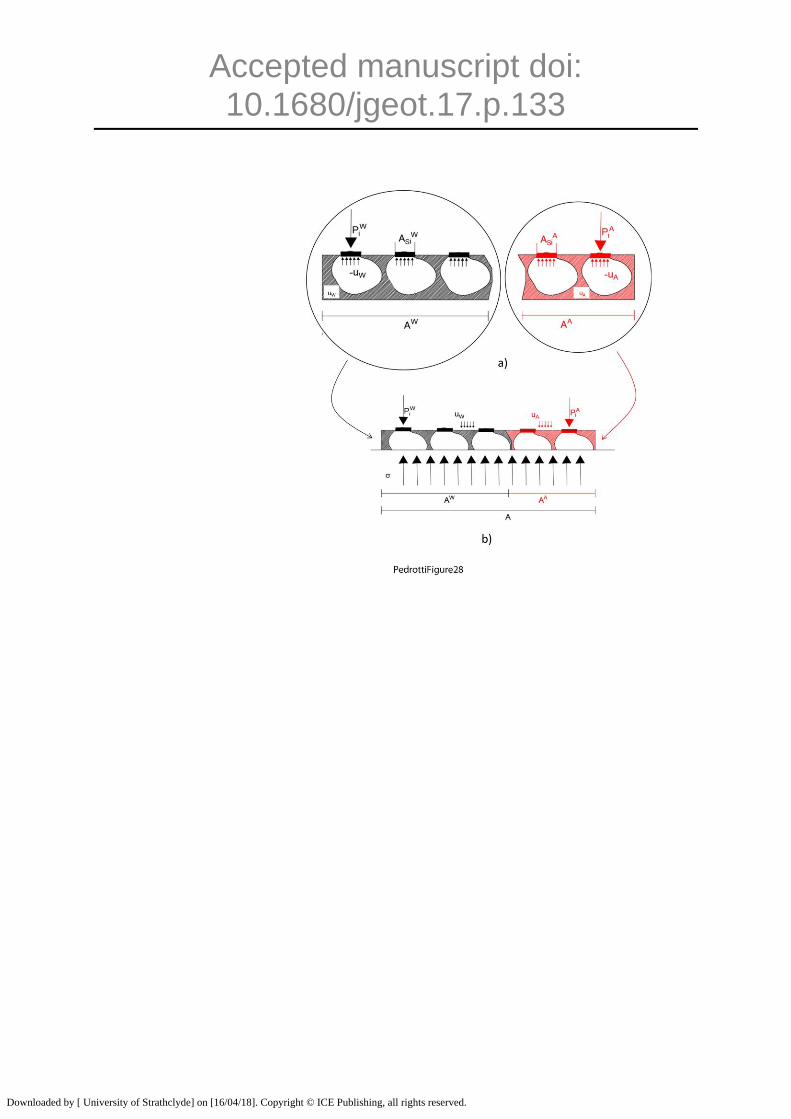
By considering the equilibrium across the wavy plane as shown in Figure 28b and by
defining as the average intergranular force per unit area of the plane, A, we have:
∑
∑
( ∑ )
( ∑ )
[23]
where and are the area of the plane water-saturated and air-saturated respectively
By combining equation [22] and [23] and by splitting the external stress between the water-
saturated area, , and the air-saturated area, :
( ) (
) ( ) (
) [24]
By assuming that
equals the degree of saturation, , Equation [24] can be re-written as
follows:
( ) ( )( ) [25]
Downloaded by [ University of Strathclyde] on [16/04/18]. Copyright © ICE Publishing, all rights reserved.
Accepted manuscript doi: 10.1680/jgeot.17.p.133
References
AHMED, S., LOVELL, C. & DIAMOND, S. Pore sizes and strength of compacted clay: 14F,
2T, 15R. J. GEOTECH. ENGNG. DIV. V100, N. GT4, APR. 1974, P407–425.
International Journal of Rock Mechanics and Mining Sciences & Geomechanics
Abstracts, 1974. Pergamon, A161.
ALONSO, E., PINYOL, N. & GENS, A. 2012. Compacted soil behaviour: initial state,
structure and constitutive modelling. Geotechnique, 63, 463-478.
BISHOP, A. W. 1960. The principles of effective stress, Norges Geotekniske Institutt.
CASINI, F., VAUNAT, J., ROMERO, E. & DESIDERI, A. 2012. Consequences on water
retention properties of double-porosity features in a compacted silt. Acta Geotechnica,
7, 139-150.
DELAGE, P., AUDIGUIER, M., CUI, Y.-J. & HOWAT, M. D. 1996. Microstructure of a
compacted silt. Canadian Geotechnical Journal, 33, 150-158.
DELAGE, P., LEFEBVRE, G., SRIDHARAN, A., JAYADEVA, M., MURTY, B. &
NAGARAJ, T. 1983. Double-layer theory and compressibility of calys-discussion.
Thomas Telford Services LTD. Thomas Teldford House, 1 Heron Quay, London
England E14 4JD.
DELAGE, P., MARCIAL, D., CUI, Y. & RUIZ, X. 2006. Ageing effects in a compacted
bentonite: a microstructure approach. Geotechnique, 56, 291-304.
GALLIPOLI, D., GENS, A., SHARMA, R. & VAUNAT, J. 2003. An elasto-plastic model
for unsaturated soil incorporating the effects of suction and degree of saturation on
mechanical behaviour. Géotechnique., 53, 123-136.
MCCONNACHIE, I. 1974. Fabric changes in consolidated kaolin. Geotechnique, 24, 207-
222.
MONROY, R., ZDRAVKOVIC, L. & RIDLEY, A. 2010. Evolution of microstructure in
compacted London Clay during wetting and loading. Geotechnique, 60, 105-119.
PEDROTTI, M. & TARANTINO, A. 2017. An experimental investigation into the
micromechanics of non-active clays. Géotechnique, 1-18.
ROMERO, E., DELLA VECCHIA, G. & JOMMI, C. 2011. An insight into the water
retention properties of compacted clayey soils. Geotechnique, 61, 313.
ROMERO, E., GENS, A. & LLORET, A. 1999. Water permeability, water retention and
microstructure of unsaturated compacted Boom clay. Engineering Geology, 54, 117-
127.
ROMERO, E. & SIMMS, P. H. 2008. Microstructure investigation in unsaturated soils: a
review with special attention to contribution of mercury intrusion porosimetry and
environmental scanning electron microscopy. Geotechnical and Geological
Engineering, 26, 705-727.
SIVAKUMAR, V., SIVAKUMAR, R., MURRAY, E., MACKINNON, P. & BOYD, J. 2010.
Mechanical behaviour of unsaturated kaolin (with isotropic and anisotropic stress
history). Part 1: wetting and compression behaviour. Géotechnique, 60, 581-594.
TARANTINO, A. 2007. A possible critical state framework for unsaturated compacted soils.
Geotechnique, 57, 385-389.
TARANTINO, A. Unsaturated soils: compacted versus reconstituted states. 5th International
Conference on Unsaturated Soil, 2010. 113-136.
TARANTINO, A. & DE COL, E. 2008. Compaction behaviour of clay. Geotechnique, 58,
199-213.
Downloaded by [ University of Strathclyde] on [16/04/18]. Copyright © ICE Publishing, all rights reserved.
Accepted manuscript doi: 10.1680/jgeot.17.p.133
TARANTINO, A. & TOMBOLATO, S. 2005. Coupling of hydraulic and mechanical
behaviour in unsaturated compacted clay. Geotechnique, 55, 307-317.
WHEELER, S., SHARMA, R. & BUISSON, M. 2003. Coupling of hydraulic hysteresis and
stress–strain behaviour in unsaturated soils. Geotechnique, 53, 41-54.
LIST OF CAPTIONS FOR ILLUSTRATIONS
Figure 1. PSD of samples compacted at the same vertical stress but different water content
and PSD of sample reconstituted from slurry (modified from Tarantino (2010).
Figure 2. (a) PSDs of air/water saturated (compacted) samples, water-saturated
(reconstituted) samples, and air-saturated (compressed from dry powder) samples. (b)
Dry density and water content of compacted samples tested for MIP.
Figure 3. Schematic representation of different conditions “at formation” (samples
reconstituted from slurry, compacted at target water content, and compressed from dry
powder).
Figure 4. (a) Pore size distribution of water-saturated, acetone-saturated, air/acetone
saturated, and air-saturated kaolin samples. (b) Dry density and water content of
air/acetone saturated (compacted) sample tested for MIP.
Figure 5. Comparison between traditional “aggregate-based” and “pore-fluid-based”
microstructure model.
Figure 6. Hydro-mechanical paths followed by samples i) formed dry (compressed from dry
powder) and then saturated, ii) formed unsaturated (compacted) and then saturated,
and iii) formed saturated (reconstituted).
Figure 7. PSDs of kaolin sample compacted to 1200 kPa vertical stress before and after
saturation under nearly zero vertical stress.
Figure 8. Pore mechanical response upon saturation (a) Micro-pore swelling and (b) macro-
pore collapse.
Downloaded by [ University of Strathclyde] on [16/04/18]. Copyright © ICE Publishing, all rights reserved.
Accepted manuscript doi: 10.1680/jgeot.17.p.133
Figure 9. PSDs of samples prepared from dry powder before and after saturation under quasi-
zero vertical stress.
Figure 10. PSDs of samples having similar void ratio under saturated conditions but formed
under dry, unsaturated (compacted), or saturated (reconstituted) conditions.
Figure 11. (a) Kaolin samples compacted to 300 and 1200 kPa vertical stress, unloaded, and
saturated under near-zero vertical stress (b) Kaolin samples compacted to 1200 kPa
vertical stress and saturated under 1200 kPa vertical stress.
Figure 12. (a) Kaolin samples prepared from dry powder saturated at nearly-zero vertical
stress (b) Kaolin sample prepared from dry powder, compressed to 300 kPa vertical
stress, and saturated under 300 kPa vertical stress.
Figure 13. Constitutive modelling framework
Figure 14. Mechanical path for (a) water-saturated pores eWW
and (b) air-saturated pores eAA
,
Figure 15. Change in degree of saturation upon (a) wetting paths and (b) drying paths.
Figure 16. Mechanical path for air-saturated pores that boecme water-saturated eAW
Figure 17. Mechanical path for water-saturated pores that become air-saturated eWA
Figure 18. Compaction test for specimen having w=0. 254. (a) Void ratio versus vertical
stress. (b) Degree of saturation versus matric suction (Tarantino and De Col, 2008).
Figure 19. Pore response upon mechanical loading at constant water content of a compacted
sample.
Figure 20. Pore response upon mechanical unloading at constant water content of a
compacted sample.
Figure 21. ‘Constitutive’ compression curves derived from (a) reconstituted (formed water-
saturated) samples and (b) dry (formed from dry powder) samples.
Downloaded by [ University of Strathclyde] on [16/04/18]. Copyright © ICE Publishing, all rights reserved.
Accepted manuscript doi: 10.1680/jgeot.17.p.133
Figure 22. Simulation of 1-D loading-unloading paths at different water contents for
compacted kaolin. a) water content 0.236, b) water content 0.254, c) water content
0.259, d) water content 0.275, e) water content 0.299 and f) water content 0.311
Figure 23. Compression paths of the water-saturated and air-saturated parts for test at
w=0.236.
Figure 24. Simulation of saturation at nearly zero vertical stress of sample previpously
compacted to 1200 kPa vertical stress at water content of 0.236.
Figure 25. Pore response upon (a) saturation and (b) subsequent re-loading under saturated
conditions
Figure 26. (a) Simulation of drying path of kaolin reconstituted from slurry. (b) Degree of
saturation versus matric suction measure experimentally
Figure 27. Pores macroscopic behaviour of a reconstituted sample from slurry upon drying
Figure 28. (a) Excess (effective) stresses acting on water-saturated and air-saturated part. (b)
Stress equilibrium across wavy plane
Downloaded by [ University of Strathclyde] on [16/04/18]. Copyright © ICE Publishing, all rights reserved.
Accepted manuscript doi: 10.1680/jgeot.17.p.133
Downloaded by [ University of Strathclyde] on [16/04/18]. Copyright © ICE Publishing, all rights reserved.
Accepted manuscript doi: 10.1680/jgeot.17.p.133
Downloaded by [ University of Strathclyde] on [16/04/18]. Copyright © ICE Publishing, all rights reserved.
Accepted manuscript doi: 10.1680/jgeot.17.p.133
Downloaded by [ University of Strathclyde] on [16/04/18]. Copyright © ICE Publishing, all rights reserved.
Accepted manuscript doi: 10.1680/jgeot.17.p.133
Downloaded by [ University of Strathclyde] on [16/04/18]. Copyright © ICE Publishing, all rights reserved.
Accepted manuscript doi: 10.1680/jgeot.17.p.133
Downloaded by [ University of Strathclyde] on [16/04/18]. Copyright © ICE Publishing, all rights reserved.
Accepted manuscript doi: 10.1680/jgeot.17.p.133
Downloaded by [ University of Strathclyde] on [16/04/18]. Copyright © ICE Publishing, all rights reserved.
Accepted manuscript doi: 10.1680/jgeot.17.p.133
Downloaded by [ University of Strathclyde] on [16/04/18]. Copyright © ICE Publishing, all rights reserved.
Accepted manuscript doi: 10.1680/jgeot.17.p.133
Downloaded by [ University of Strathclyde] on [16/04/18]. Copyright © ICE Publishing, all rights reserved.
Accepted manuscript doi: 10.1680/jgeot.17.p.133
Downloaded by [ University of Strathclyde] on [16/04/18]. Copyright © ICE Publishing, all rights reserved.
Accepted manuscript doi: 10.1680/jgeot.17.p.133
Downloaded by [ University of Strathclyde] on [16/04/18]. Copyright © ICE Publishing, all rights reserved.
Accepted manuscript doi: 10.1680/jgeot.17.p.133
Downloaded by [ University of Strathclyde] on [16/04/18]. Copyright © ICE Publishing, all rights reserved.
Accepted manuscript doi: 10.1680/jgeot.17.p.133
Downloaded by [ University of Strathclyde] on [16/04/18]. Copyright © ICE Publishing, all rights reserved.
Accepted manuscript doi: 10.1680/jgeot.17.p.133
Downloaded by [ University of Strathclyde] on [16/04/18]. Copyright © ICE Publishing, all rights reserved.
Accepted manuscript doi: 10.1680/jgeot.17.p.133
Downloaded by [ University of Strathclyde] on [16/04/18]. Copyright © ICE Publishing, all rights reserved.
Accepted manuscript doi: 10.1680/jgeot.17.p.133
Downloaded by [ University of Strathclyde] on [16/04/18]. Copyright © ICE Publishing, all rights reserved.
Accepted manuscript doi: 10.1680/jgeot.17.p.133
Downloaded by [ University of Strathclyde] on [16/04/18]. Copyright © ICE Publishing, all rights reserved.
Accepted manuscript doi: 10.1680/jgeot.17.p.133
Downloaded by [ University of Strathclyde] on [16/04/18]. Copyright © ICE Publishing, all rights reserved.
Accepted manuscript doi: 10.1680/jgeot.17.p.133
Downloaded by [ University of Strathclyde] on [16/04/18]. Copyright © ICE Publishing, all rights reserved.
Accepted manuscript doi: 10.1680/jgeot.17.p.133
Downloaded by [ University of Strathclyde] on [16/04/18]. Copyright © ICE Publishing, all rights reserved.
Accepted manuscript doi: 10.1680/jgeot.17.p.133
Downloaded by [ University of Strathclyde] on [16/04/18]. Copyright © ICE Publishing, all rights reserved.
Accepted manuscript doi: 10.1680/jgeot.17.p.133
Downloaded by [ University of Strathclyde] on [16/04/18]. Copyright © ICE Publishing, all rights reserved.
Accepted manuscript doi: 10.1680/jgeot.17.p.133
Downloaded by [ University of Strathclyde] on [16/04/18]. Copyright © ICE Publishing, all rights reserved.
Accepted manuscript doi: 10.1680/jgeot.17.p.133
Downloaded by [ University of Strathclyde] on [16/04/18]. Copyright © ICE Publishing, all rights reserved.
Accepted manuscript doi: 10.1680/jgeot.17.p.133
Downloaded by [ University of Strathclyde] on [16/04/18]. Copyright © ICE Publishing, all rights reserved.
Accepted manuscript doi: 10.1680/jgeot.17.p.133
Downloaded by [ University of Strathclyde] on [16/04/18]. Copyright © ICE Publishing, all rights reserved.
Accepted manuscript doi: 10.1680/jgeot.17.p.133
Downloaded by [ University of Strathclyde] on [16/04/18]. Copyright © ICE Publishing, all rights reserved.
Accepted manuscript doi: 10.1680/jgeot.17.p.133
Downloaded by [ University of Strathclyde] on [16/04/18]. Copyright © ICE Publishing, all rights reserved.
Accepted manuscript doi: 10.1680/jgeot.17.p.133
Downloaded by [ University of Strathclyde] on [16/04/18]. Copyright © ICE Publishing, all rights reserved.
Accepted manuscript doi: 10.1680/jgeot.17.p.133
Downloaded by [ University of Strathclyde] on [16/04/18]. Copyright © ICE Publishing, all rights reserved.
Accepted manuscript doi: 10.1680/jgeot.17.p.133
Downloaded by [ University of Strathclyde] on [16/04/18]. Copyright © ICE Publishing, all rights reserved.
Accepted manuscript doi: 10.1680/jgeot.17.p.133
Downloaded by [ University of Strathclyde] on [16/04/18]. Copyright © ICE Publishing, all rights reserved.
Accepted manuscript doi: 10.1680/jgeot.17.p.133
Downloaded by [ University of Strathclyde] on [16/04/18]. Copyright © ICE Publishing, all rights reserved.
Accepted manuscript doi: 10.1680/jgeot.17.p.133
Downloaded by [ University of Strathclyde] on [16/04/18]. Copyright © ICE Publishing, all rights reserved.
Accepted manuscript doi: 10.1680/jgeot.17.p.133
Downloaded by [ University of Strathclyde] on [16/04/18]. Copyright © ICE Publishing, all rights reserved.
Accepted manuscript doi: 10.1680/jgeot.17.p.133
Downloaded by [ University of Strathclyde] on [16/04/18]. Copyright © ICE Publishing, all rights reserved.
Accepted manuscript doi: 10.1680/jgeot.17.p.133
Downloaded by [ University of Strathclyde] on [16/04/18]. Copyright © ICE Publishing, all rights reserved.
Accepted manuscript doi: 10.1680/jgeot.17.p.133
Downloaded by [ University of Strathclyde] on [16/04/18]. Copyright © ICE Publishing, all rights reserved.
Accepted manuscript doi: 10.1680/jgeot.17.p.133
Downloaded by [ University of Strathclyde] on [16/04/18]. Copyright © ICE Publishing, all rights reserved.
Accepted manuscript doi: 10.1680/jgeot.17.p.133
Downloaded by [ University of Strathclyde] on [16/04/18]. Copyright © ICE Publishing, all rights reserved.
Accepted manuscript doi: 10.1680/jgeot.17.p.133
Downloaded by [ University of Strathclyde] on [16/04/18]. Copyright © ICE Publishing, all rights reserved.
Accepted manuscript doi: 10.1680/jgeot.17.p.133
Downloaded by [ University of Strathclyde] on [16/04/18]. Copyright © ICE Publishing, all rights reserved.
Accepted manuscript doi: 10.1680/jgeot.17.p.133
Downloaded by [ University of Strathclyde] on [16/04/18]. Copyright © ICE Publishing, all rights reserved.
Accepted manuscript doi: 10.1680/jgeot.17.p.133
Downloaded by [ University of Strathclyde] on [16/04/18]. Copyright © ICE Publishing, all rights reserved.
Accepted manuscript doi: 10.1680/jgeot.17.p.133
Downloaded by [ University of Strathclyde] on [16/04/18]. Copyright © ICE Publishing, all rights reserved.