Embed Size (px)
Citation preview
This is an electronic reprint of the original article. This reprint may differ from the original in pagination and typographic detail.
Author(s):
Title:
Year:
Version:
Please cite the original version:
All material supplied via JYX is protected by copyright and other intellectual property rights, and duplication or sale of all or part of any of the repository collections is not permitted, except that material may be duplicated by you for your research use or educational purposes in electronic or print form. You must obtain permission for any other use. Electronic or print copies may not be offered, whether for sale or otherwise to anyone who is not an authorised user.
Diurnal changes in the perception of emotions in music: Does the time of day matter?
Brabant, Olivier; Toiviainen, Petri
Brabant, O., & Toiviainen, P. (2014). Diurnal changes in the perception of emotions inmusic: Does the time of day matter?. Musicae Scientiae, 18 (3), 256-274.doi:10.1177/1029864914532281
2014
1
Diurnal changes in the perception of emotions in music: Does the time of day matter?
Authors: Olivier Brabant and Petri Toiviainen Published version of the article: doi:10.1177/1029864914532281
2
Abstract
According to the Hindustani music tradition, the ability of a song to induce certain
emotions depends on the time of day: playing a song at the right time is said to maximise its
emotional effect. The present exploratory study investigated this claim by combining
findings in chronobiology, mood research and music perception. It has already been
established that some aspects of our mood fluctuations follow a cyclical pattern. Besides, it
is a known fact that our current mood influences our perception and assessment of
emotions. However, these elements have never been linked together in a study examining
the effect of mood cyclicity on perceived emotions in music. To test the hypothesis of a link
between the two, Western film music excerpts were played to 36 participants at two
different times (9 am and 4 pm). Their task was to rate the perceived emotional content of
each clip. The results showed that sad and tender clips were rated higher on sadness and
tenderness in the morning compared to the afternoon. Furthermore, the more tired the
participants were in the afternoon, the higher was their perception of fear in angry and
fearful music. Although the reported effect sizes were small, these findings could have
important implications for ethnomusicologists, emotion researchers and music therapists.
Keywords
Music, emotion, time of day, circadian rhythms, Indian classical music, raga
3
Introduction
The way our current mood influences how we perceive emotions has been examined in
numerous studies. Although these studies use different methodologies and types of stimuli,
the general agreement is that our current mood acts as a perceptual filter, creating a bias in
our perception and assessment of emotions.
One very common way to investigate the link between mood state and emotional perception
is through the assessment of pictures with faces expressing various emotions. Surguladze et
al. (2004) for example showed that compared to healthy volunteers, people with major
depressive disorder were perceptually less sensitive to happy facial expressions. Along the
same line, Gotlib, Krasnoperova, Yue, and Joormann (2004) found that when presented
simultaneously with sad and neutral faces, people with major depression exhibited an
attentional bias for faces expressing sadness.
Moving now to the field of music psychology, a similar bias has been found for musically-
expressed emotions. Vuoskoski and Eerola (2011), for example, studied the role of mood
and personality in the perception of emotions in music. They identified several statistically
significant correlations: vigour (positive mood) correlated positively with ratings of
happiness in the music, and depression (negative mood) correlated positively with ratings
of sadness. Punkanen, Eerola, and Erkkilä (2011) made a similar discovery in a study on
emotional recognition and depression. They asked a group of participants with depression
to emotionally rate the content of musical excerpts. The scores were then compared to the
ratings of healthy controls. The results indicated that participants with depression displayed
a judgement bias towards negative emotions.
As illustrated by the previous examples, research offers abundant evidence supporting the
idea that we perceive emotions differently depending on our current mood. Besides, there
seems to be a high degree of congruence between the valence of the mood and the valence
of the emotions affected by the resulting perceptual filter. Moreover, although moods are
relatively long-lasting emotional states, they are evidently not stable but display a certain
level of fluctuation. Is there any indication that our mood fluctuations are not completely
erratic but predictable to a certain extent?
We know from chronobiology that every living organism contains biological clocks that
regulate and synchronise its activity to the time of day and the seasons (Reinberg &
Smolensky, 1983). What comes to humans, chronobiologists have established that countless
physiological processes follow a predictable rhythm of ups and downs, for instance, brain
wave activity, hormone production, body temperature, blood pressure and alertness
(Palmer, 2002). Because of the entrainment effect of the day and night cycle, many of these
rhythms display a 24h pattern and are therefore called circadian rhythms (from the Latin
circa, around and dies, day). Although longer and shorter cycles have also been identified,
for example, circannual (one year) or ultradian rhythms (less than 24 hours), circadian
rhythms are by far the most studied and best known biological rhythms.
4
Since most, it not all, of our physiological processes display some form of circadian
rhythmicity, it is legitimate to assume that at least some aspects of our daily mood states are
governed by similar rhythms. Furthermore, these rhythms might to a large extent be
endogenous, meaning that they originate within the organism and are unaffected by outside
events. According to findings in mood research, such seems indeed to be the case.
When studying a person’s mood, researchers commonly distinguish between Positive
Affect (PA) and Negative Affect (NA) to describe positive and negative moods.
Interestingly enough, PA and NA have been found to be largely autonomous dimensions
that fluctuate independently from each other (see e.g. Stone et al., 2006; Vittengl & Holt,
1998; Watson, Clark, & Tellegen, 1988). In other words, low PA does not necessarily
imply high NA, because they are not two ends of the same spectrum.
Looking now more closely at mood cyclicity, a majority of studies using the PA-NA
paradigm found that PA, but not NA, was following a daily rhythm (e.g., Clark, Watson, &
Leeka, 1989; Hasler, Mehl, Bootzin, & Vazire, 2008; Murray, Allen, & Trinder, 2002;
Wood & Magnello, 1992). Typically, PA will be at its lowest early in the morning and late
in the evening, and reach a peak at some point during the day. Several studies concluded
that the PA pattern over 24h can be adequately approximated with a fitted sinusoidal curve
(Hasler et al., 2008; Murray et al., 2002). However, researchers disagree as to the time of
that peak, and whether we experience one or several peaks. Nevertheless, this overall low-
high-low pattern in PA has proven to be a solid finding of mood research. Furthermore,
there is strong evidence to suggest that the PA cycle is driven by endogenous clocks.
Indeed, the diurnal PA pattern is not fundamentally affected by lifestyle factors, such as a
person’s daily schedule or activities like socialising, eating and exercising (Hasler et al.,
2008; Watson, 2000).
In contrast, NA usually does not display any predictable pattern and tends to remain low in
the absence of external stressors (real or imagined). The explanation that has been advanced
is that PA and NA belong to different motivational systems. According to Watson (2000),
PA is the expression of a reward-seeking mechanism whose goal is to allow humans to
successfully coordinate their efforts, while NA belongs to a pain-avoiding mechanism that
is only triggered in the presence of an immediate threat.
In addition to the current state of our circadian clock, the proximity of sleep has also proven
to be another important determinant of our subjective mood. If a person has just risen or is
about to retire, his or her PA score will be very low, independently from the time of day
(Clark et al., 1989). Several studies have placed the peak in PA roughly 8 to 10 hours after
waking up (Hasler et al., 2008; Watson, 2000). Taking 7 am as a common wake-up time,
this means that a fair amount of people will reach their peak in positive mood around 4 pm.
Another factor that is likely to influence our mood is our current level of tiredness.
Commonly, people who are not tired are in a better mood, and therefore see negative things
in a more positive light. Conversely, tiredness is typically accompanied by a lower mood
and a negative perceptual bias. Thayer (1987), for example, has established that people
5
perceived their personal problems as being much worse when their level of energetic
arousal was low, in other words, when they were tired. Similarly, Kanning (2010) has
demonstrated that when people’s level of energetic arousal increased, so did their positive
mood.
To summarise the findings presented so far, we know that our current mood influences the
way we perceive emotions in general, including musically-expressed emotions. We also
know that some aspects of our mood states are endogenous and follow a daily rhythm. The
logical conclusion from these two premises is that musically-expressed emotions should be
perceived differently depending on the time of day. Is there any aspect in our practice and
experience of music that might support this hypothesis?
Unfortunately, there is no tradition in Western music linking the emotional content of a
piece with a specific performance time. One might object that Western classical music does
associate certain pieces with specific times of the day, such as Grieg’s ‘Morning Mood’
(‘Morgenstemning’), Falla’s ‘Nights in the Gardens of Spain’ (‘Noches en los Jardines de
España’) or Purcell’s ‘Welcome, Welcome, Glorious Morn’. However, this association is
only a theme present in the composition of the piece, not a recommendation as to when the
piece should be played. Nevertheless, one music tradition that does associate specific songs
with specific performance times is Indian classical music. It therefore represents a suitable
starting point for investigating the relevance of such an association.
Indian classical music
Navarasa
The Indian aesthetic tradition is based on a set of nine emotions. An initial list of eight
items was established in the Natya Shastra, a treatise on performing arts dating back to the
3rd century AD. A ninth emotion was added in the 10th century AD, and the list became
subsequently known as the navarasa (from the Sanskrit nava, nine and rasa, sentiment).
All the classical Indian art forms are aiming at expressing these rasas and evoking them in
the audience. The Natya Shastra specifies that although several rasas can be present in a
given work of art, only one should be dominant (Bharata, 1996).
The following are the navarasa, as described by Raja (2005): shringaara (love,
attractiveness), karuna (pathos, compassion, sadness), haasya (mirth, joy, laughter), raudra
(anger), veera (valour, heroism, majesty), bhaya (fear), bibhatsa (disgust), adbhut (surprise,
marvel, amazement) and shaanta (peace).
Scholars and musicians frequently mention a tenth rasa called bhakti, which is a feeling of
devotion and spirituality. However, as Shankar (2008) points out, bhakti could also be seen
as a combination of shaanta (peace), karuna (sentimentality, sadness) and adbhut (marvel).
Since the navarasa were established for performing arts in general, not all of them can be
easily expressed in every art form. The sentiments of bhaya (fear) and bibhatsa (disgust)
6
for example are the least suitable for Indian classical music and are therefore hardly ever
expressed musically (Shankar, 2008).
Navarasa and the Geneva Emotional Music Scale
One unresolved issue in the field of music psychology has to do with the cross-cultural
ability to accurately assess the intended emotions expressed in music. Is this ability culture-
specific, or does it transcend cultural boundaries? In other words, are the navarasa
universal or specific to Indian culture?
These questions cannot be answered with certainty yet, as studies focussing on emotional
recognition across cultures are few and far between. However, the existing studies indicate
that there is indeed a certain degree of universality, at least for some basic emotions. In a
study by Balkwill and Thompson (1999), 30 Western listeners were tested on their ability to
recognise joy, sadness, anger, and peace in specific pieces of Indian classical music. The
authors concluded that at least joy, sadness, and anger could be recognised by the
participants, although all of them were naïve listeners of this type of music. The two
authors repeated the experiment with 147 Japanese listeners, and had similar results
(Balkwill, Thompson, & Matsunaga, 2004).
A more systematic approach to determine which musical emotions might be the most
frequent and most recognisable would be to perform a survey across several genres and
cultures. This was precisely the task undertaken by Zentner, Grandjean, and Scherer (2008),
although they limited themselves to Western musical genres.
Zentner et al. (2008) first compiled a list of 146 emotion terms and tested their frequency
across several groups of listeners with different music tastes. After having reduced the data
through exploratory factor analyses, they carried out a field study during a music festival in
order to test the validity of the extracted factors. The result is a nine-factorial model of
music-induced emotions, known as the Geneva Emotional Music Scale (GEMS). The
identified factors are wonder, transcendence, tenderness, nostalgia, peacefulness, power,
joyful activation, tension, and sadness.
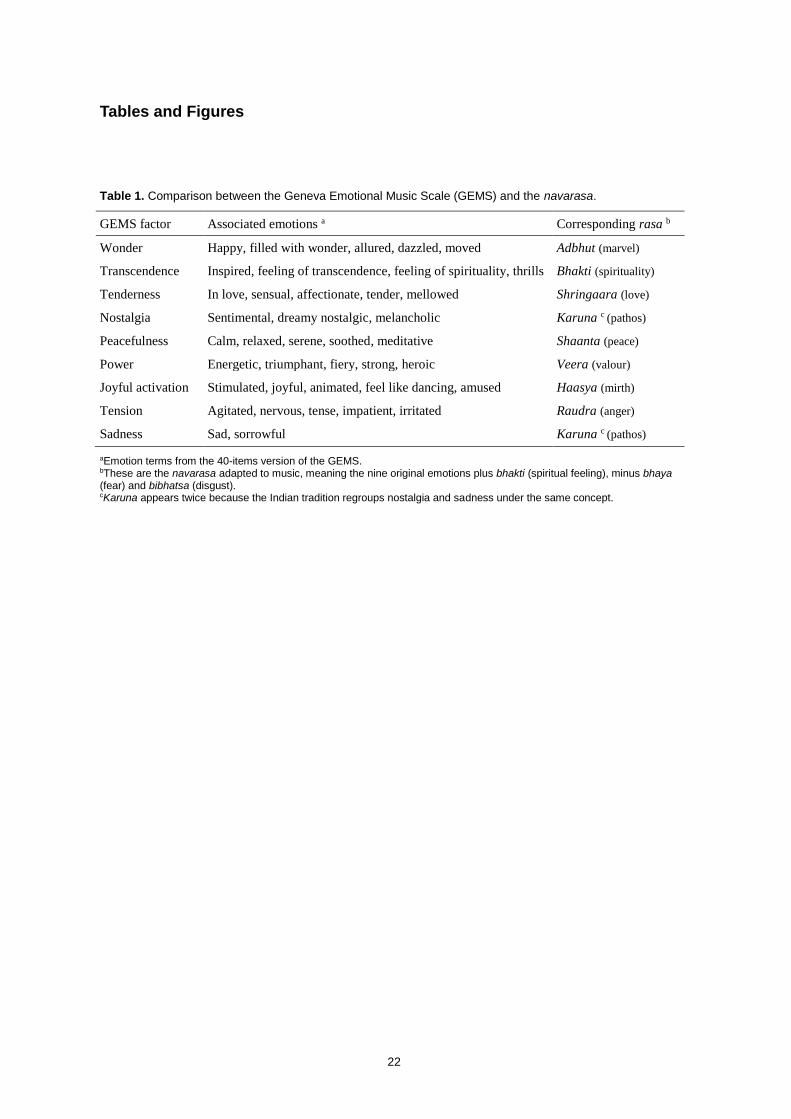
First of all, we would like to draw the reader’s attention to the striking similarity between
the GEMS and the navarasa. Table 1 shows a descriptive list of the GEMS items with the
corresponding rasas from Indian classical music.
[Insert Table 1 about here]
It is also worth mentioning that the creators of the GEMS had ‘disgust’, ‘fear’ and ‘anger’
in their initial affect list, but they were eventually discarded. Indeed, since their participants
very seldom mentioned these emotions in relation to music, the authors concluded that they
could not be considered musical emotions (Zentner et al., 2008). This is interesting because
as we just saw, a similar discarding happened to the navarasa, with bhaya (fear) and
bibhatsa (disgust) being considered not suitable for Indian classical music. Although
7
raudra (anger) has remained in the list, it can easily be assimilated to the ‘tension’ factor of
the GEMS (see Table 1).
The fact that the GEMS so closely matches an 1800-year-old list from another culture is
quite interesting to say the least. It also constitutes a strong argument in favour of the
universality of these musical emotions.
Raga
As we just saw, the goal of Indian classical music is to express a certain set of emotions or
rasas. In order to do so, Indian musicians rely on melodic frameworks known as ragas.
As the term ‘melodic framework’ indicates, a raga is neither a pre-composed melody nor a
scale, but something in between. Raja (2005) gives us the following definition: ‘A raga is a
psycho-acoustic hypothesis, which states that melody, created and rendered in accordance
with a certain set of rules, has a high probability of eliciting a certain quality of emotional
response’ (p. 392).
When talking about Indian classical music, one has to distinguish between the Hindustani
music from the north and the Carnatic music from the south. From this point on, the focus
will be solely on Hindustani music, as the time theory that will soon be addressed does not
concern Carnatic music.
Many treatises have been written about Hindustani classical music, but the treatise
nowadays regarded as the reference is called Hindusthani Sangeet Paddhati (Bhatkhande,
1990). Written by the musicologist Vishnu Narayan Bhatkhande (1860-1936), it is an
attempt to reconcile theory with centuries of practice. Bhatkhande’s main contribution to
Hindustani music is the creation of a coherent classification system to organise the
hundreds of existing ragas. Although it has attracted some criticism (e.g., Roy, 1937),
Bhatkhande’s theory is nowadays widely accepted.
Bhatkhande organised the ragas into groups according to their parent scale or thaat. There
exist ten of these thaats, all bearing the name of a prominent raga (Bilawal, Marwa,
Bhairav, Poorvi, Bhairavi, Todi, Asavari, Kalyan, Khamaj and Kafi). However, unlike a
raga, a thaat is only a theoretical construct that serves as the basis for their derivative ragas.
Therefore, a thaat does not have different ascending and descending lines, nor does it have
emotional qualities. As Kaufmann (1965) says, a raga is ‘alive’ whereas a thaat is
‘impersonal’ (p. 283).
We have now defined the nature of a raga, as well as its purpose, which is to induce
specific emotions. Quite logically, the next step is to find ways to enhance and maximise
this emotional effect. In the West, we mainly rely on musical features and interpretation
skills. While Indian music does not ignore these aspects either, it has added an extra factor
to the equation: the time factor.
8
Raga and performance time
The Hindustani music tradition contains a very elaborate system of specific time
associations for each raga. The idea is that people are more or less receptive to certain rasas
depending on the time of day. Therefore, playing a raga at the right time is said to increase
its emotional impact (e.g., Batish & Batish, 1989; Deva, 1980; Shankar, 2008). In other
words, successfully conveying an emotion requires not only a skilled musician and an
appropriate vehicle (the raga), but also an appropriate time frame.
As we will now see, there are different aspects to the time associations existing in the
Hindustani tradition. The most studied of these aspects are the structural features of the
music, starting with the parent scales. Similarly to the circle of keys and spiral of fifths
found in Western music, the ten parent scales are following each other in two consecutive
cycles called the circle of thaats. Roy (1937) notes that the principle behind these cycles is
simply ‘the tendency of ragas to follow the line of least resistance in the easy transition
from scale to scale’ (p. 82). Each cycle lasts 12 hours, starting at 7 am. Consequently, every
thaat is appearing twice in the course of 24 hours, once during daytime and once during the
night.
Furthermore, Bhatkhande divided the 24 hours of the day into eight praharas or ‘beats’ of
three hours each. All ragas fall into one of these praharas. In Bhatkhande’s system, the first
prahara starts at 7 am, whereas some other authors make the cycle start at 6 am (e.g.,
Kaufmann, 1965). This division is therefore not so strict and should rather be regarded as
an approximate time frame.
What comes to the general emotional qualities of the ragas, Yardi and Chew (2004) have
shown that ragas performed between late night and morning are what they call ‘bottom
heavy’, whereas ragas performed between late morning and early evening are ‘top heavy’.
Bottom heavy ragas are characterised by solemn and grave emotions, whereas top heavy
ragas evoke lighter and happier emotions.
The preceding description focussed mainly on a raga’s structural features to explain the
time associations. However, this is only one of the possible approaches, since scholars and
musicians do not seem to agree about the actual origin of the time theory. Shankar (2008)
for instance lists several possible origins, such as tradition, historical anecdotes or the
Hindu time division, where the day is divided into lucky and unlucky moments. Some
authors also see in the time associations a direct application of principles found in
Ayurvedic medicine (Batish & Batish, 1989; Westbrook, 1998). This last point deserves to
be developed, as Ayurvedic medicine contains elements perfectly compatible with the
notion of circadian rhythms described earlier.
Ayurveda is a medical system that was originally described in the Vedas, the oldest Hindu
scriptures. Literally, Ayurveda means ‘science of life’. It is based on the concept of doshas,
which are basic principles or humours deriving from the combination of the five elements
(Air, Fire, Water, Earth and Ether). There exist three doshas, called kapha, pitta and vata.
9
Together they form what is called the tridosha (tri meaning ‘three’ in Sanskrit). Kapha can
be broadly associated with the ideas of cohesion and structure, pitta with fire and
transformation, and vata with air and movement. It is described in Ayurveda that all living
things are made of these three doshas combined in different amounts, with one dosha
usually dominant (Ninivaggi, 2010).
Another central concept in Ayurvedic medicine is the idea of the tridosha cycle. It is said
that kapha, pitta and vata alternate over a cycle of 24 hours, starting with kapha at 6 am.
Every four hours, one of the doshas becomes dominant and influences the body/mind/soul
in a specific way, making us for example more sensitive to certain emotions (Ninivaggi,
2010). According to Batish and Batish (1989) and Westbrook (1998), Indian music
tradition has developed by taking into account and respecting the tridosha cycle. The
possible existence of a link between Ayurvedic health principles and Indian classical music
is further supported by the fact that the eight praharas of Bhatkhande’s time theory and the
tridosha cycle of Ayurvedic medicine both start at 6 or 7 am.
Interestingly enough, the idea behind the tridosha cycle is the same as the idea behind
circadian rhythms. Although their paradigms are different, Ayurvedic medicine and
Western chronobiology both came to the conclusion that our physiology follows a
predictable and cyclical pattern over the course of 24 hours. For the second time, we are
encountering a striking similarity between Indian and Western ideas. This accumulation of
similarities (navarasa and GEMS, tridosha cycle and circadian rhythms) indicates that the
Indian time theory could be investigated with empirical methods outside the Indian context.
In other words, nothing speaks against transposing the Indian time theory into a Western
context and testing its validity with Western music and Western listeners.
Music-listening experiment
The following experiment was designed to investigate the possible influence of the time of
day on perceived emotions in music. The overall idea was to ask a group of people to rate
the emotional content of selected music clips at two different times of the day, and then to
compare the results. The experiment was conducted over a two-week period, from 30
January to 15 February 2012. It took place at [removed to allow blinded review].
Given the findings in chronobiology, mood research and music perception presented above,
the hypothesis was that musically-expressed emotions would be affected by a perceptual
bias corresponding to the general PA curve described earlier. In other words, we expected
to find a higher sensitivity to negative emotions when PA was low (typically in the morning
and in the evening). With regard to tiredness, we predicted that tired participants would be
more sensitive to negative emotions than non-tired participants.
Participants
A total of 36 people participated in the experiment. All the participants were recruited
among students or researchers from the University of [removed to allow blinded review].
10
Their age ranged from 19 to 39 (M = 25, SD = 4.2). A majority of them were female (75%).
As to their nationality, 15 participants were [removed to allow blinded review] and the
remaining 21 were international students. Most of the [removed to allow blinded review]
were Europeans, with a few exceptions (two Chinese participants and one West-African
participant). None of the participants were native English speakers. All of them were
familiar with Western film music, and 86% said that they pay quite a lot attention to music
when watching a film. The level of self-assessed musicality was rather high, with an
average of 4 on a scale of 1–5 (SD = 1). The first 30 participants were compensated with a
free cinema ticket.
Session choice
The experiment consisted of two parts: one morning session at 9 am and one afternoon
session at 4 pm. The chosen times roughly corresponded to two extremes of a typical PA
curve, with one point taken at the lower end (morning) and another point taken near the
theoretical acrophase (afternoon).
A total of six morning and five afternoon sessions were organised. Each participant had to
choose one morning session and one afternoon session, but not necessarily on the same day
or in that order. In other words, the participants’ first session might be a morning or an
afternoon session, and they might do the sessions on the same day or on different days.
In the end, 16 participants started with a morning session and 20 with an afternoon session.
Furthermore, 13 participants did both parts on the same day, and 23 participants did them
on different days.
Music stimuli
In many studies on music and emotion, the music clips are arbitrarily chosen, meaning that
there is no guarantee they will accurately convey the intended emotion. Another common
problem is that the chosen clips are often well-known pieces of Western classical music.
Being easily recognisable by the average participant, episodic memory linked to that
specific piece could interfere with the emotional perception or effect the researcher is trying
to investigate.
To avoid these problems, Eerola and Vuoskoski (2011) created a dataset of music clips
specifically designed for the study of music and emotion. The 110 clips constituting this
dataset were carefully selected through a pilot study followed by a large validation study.
They were all unfamiliar excerpts from recent film soundtracks, lasting around 15 seconds
each. The style was Western classical music, which is the dominant style in film scores.
During the validation study, each clip had been rated by 116 non-musicians using both the
discrete and dimensional model of emotion (for a critical review of these models, see
Eerola & Vuoskoski, 2013). The target emotions were anger, fear, happiness, sadness and
tenderness. For the present experiment, three highly representative examples and two
moderate examples of each target emotion were chosen, according to the ratings obtained
11
with the discrete model. On a scale of 1–9, the average rating was 6.24 for highly
representative examples (SD = 0.44) and 4.8 for moderate examples (SD = 0.55).
Because of the within-subject design, using the same playlist twice could have led to
implicit or explicit memory effects. Therefore, two different but comparable playlists of 25
clips each were created, referred to from now on as playlist A and playlist B (for the detail
of the playlists, see Appendix). In order to counterbalance the presentation of the stimuli,
half of the participants listened to playlist A in the morning and B in the afternoon, while
the other half listened to playlist B in the morning and A in the afternoon. Furthermore, the
presentation order of the clips inside the playlists was randomised for each participant.
Apparatus
The experiment was conducted on iMac computers. Each computer was equipped with an
MBox 2 audio interface and high-quality headphones (AKG K141). The music clips were
MP3 files encoded at 160 Kbps (variable bit rate). The interface for the music listening part
was designed with PsychoPy, version 1.72. This open-source, cross-platform application
allows for the presentation of stimuli and the collection of rating results (Peirce, 2007).
Initial questionnaire
Each session consisted of a questionnaire followed by the actual music-listening part. The
questionnaire was used to collect general information and to assess the current mood of
each participant. For the mood evaluation, we chose the Positive Affect Negative Affect
Schedule (PANAS). The PANAS is composed of 20 mood adjectives, 10 for Positive
Affect (active, alert, attentive, determined, enthusiastic, excited, inspired, interested, proud,
strong) and 10 for Negative Affect (afraid, scared, nervous, jittery, irritable, hostile, guilty,
ashamed, upset, distressed). Each item was rated on a scale of 1–5. In order to extend the
scope of the PANAS, three extra items were added to the evaluation (tired, calm and sad).
On average, it took the participants five minutes to complete the initial questionnaire.
As noted by Thompson (2007), the original PANAS poses some problems when used in an
international context with non-native English speakers. Many of the mood adjectives have
shown to be unclear or ambiguous in the context of ‘international English’. Thompson
therefore conducted an extensive cross-cultural validation of the original 20 items and
proposed a short form of the PANAS with only 10 items. Since we wanted to keep the
original PANAS, the language problem was circumvented by adding some semantic
explanations to the most unfamiliar and ambiguous items.
We mentioned earlier that the sleep-wake cycle was known to have an influence on the
phase of various circadian rhythms. Therefore, the participants were also asked how many
hours they slept last night and at what time they woke up that day.
12
Music rating
After the initial questionnaire, the participants had to listen to 25 film music excerpts with
an average length of 15 seconds each. Their task was to rate the emotional content of each
clip using five rating scales, one for each target emotion (anger, fear, happiness, sadness
and tenderness). The rating scales ranged from 1 to 9. The participants were explicitly
asked to rate the perceived emotions and not the felt emotions. The instructions contained a
short explanation of the difference between the two. As far as the interface is concerned, it
was designed in such a way that participants could only proceed to the next clip once all the
five ratings were done. They were also given the possibility to replay the clip if needed.
Most participants completed the music-listening part in 25 minutes or less.
Results
Mood evaluation
The analysis of the initial questionnaire indicated that participants slept on average 6.7
hours before the 9 am session (SD = 1.3) and 6.9 hours before the 4 pm session (SD = 0.97).
A paired samples t-test revealed that this difference was not statistically significant (p = .4).
Furthermore, 80% of the participants slept at least 6 hours before the morning session, and
95% did so before the afternoon session. The sample was therefore very homogeneous in
terms of sleep length, and that length was long enough to assume that none of the
participants were experiencing disrupted circadian patterns because of sleep deprivation.
As to the proximity of sleep, participants awoke on average 1.5 hours before the 9 am
session (SD = 0.7 hour) and 7.9 hours before the 4 pm session (SD = 1.3 hours). The range
was quite small in the morning (3 hours), but it became very large in the afternoon (7
hours) because of two extreme values (one participant woke up at 6:30 am and another at
12:15 pm).
In order to determine the existence of possible outliers, the Mahalanobis Distances were
calculated for each participant, using two sets of variables (NA_am - NA_pm and PA_am -
PA_pm). No one exceeded the critical value for df = 2 and p < .001 (critical value: 13.82).
Looking specifically at the mood scores of the two participants with extreme values in
wake-up time, both had very similar PANAS scores, and these scores were close to the
group’s average (within one standard deviation of both PA and NA). It therefore appeared
that their difference in wake-up time did not affect their mood scores. Given those two
findings, the whole dataset (N = 36) was used to analyse the mood scores.
When averaging the mood scores for all the participants, NA and PA were almost identical
between the morning and the afternoon: 14.25 for NA_am (SD = 4.47), 14.81 for NA_pm
(SD = 5.67), 31.72 for PA_am (SD = 6.68) and 31.75 for PA_pm (SD = 7.04). None of
these differences were statistically significant. At first sight, it would therefore appear that
the participants’ mood did not follow the expected fluctuations observed in previous
studies.
13
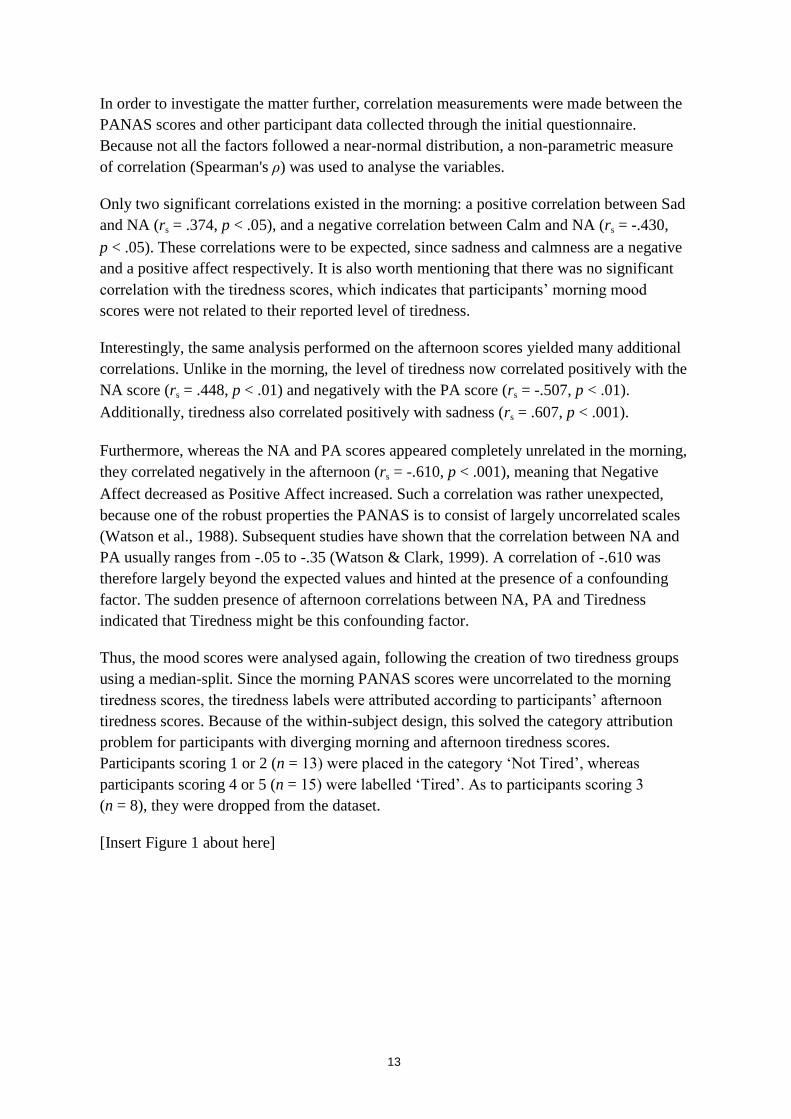
In order to investigate the matter further, correlation measurements were made between the
PANAS scores and other participant data collected through the initial questionnaire.
Because not all the factors followed a near-normal distribution, a non-parametric measure
of correlation (Spearman's ρ) was used to analyse the variables.
Only two significant correlations existed in the morning: a positive correlation between Sad
and NA (rs = .374, p < .05), and a negative correlation between Calm and NA (rs = -.430,
p < .05). These correlations were to be expected, since sadness and calmness are a negative
and a positive affect respectively. It is also worth mentioning that there was no significant
correlation with the tiredness scores, which indicates that participants’ morning mood
scores were not related to their reported level of tiredness.
Interestingly, the same analysis performed on the afternoon scores yielded many additional
correlations. Unlike in the morning, the level of tiredness now correlated positively with the
NA score (rs = .448, p < .01) and negatively with the PA score (rs = -.507, p < .01).
Additionally, tiredness also correlated positively with sadness (rs = .607, p < .001).
Furthermore, whereas the NA and PA scores appeared completely unrelated in the morning,
they correlated negatively in the afternoon (rs = -.610, p < .001), meaning that Negative
Affect decreased as Positive Affect increased. Such a correlation was rather unexpected,
because one of the robust properties the PANAS is to consist of largely uncorrelated scales
(Watson et al., 1988). Subsequent studies have shown that the correlation between NA and
PA usually ranges from -.05 to -.35 (Watson & Clark, 1999). A correlation of -.610 was
therefore largely beyond the expected values and hinted at the presence of a confounding
factor. The sudden presence of afternoon correlations between NA, PA and Tiredness
indicated that Tiredness might be this confounding factor.
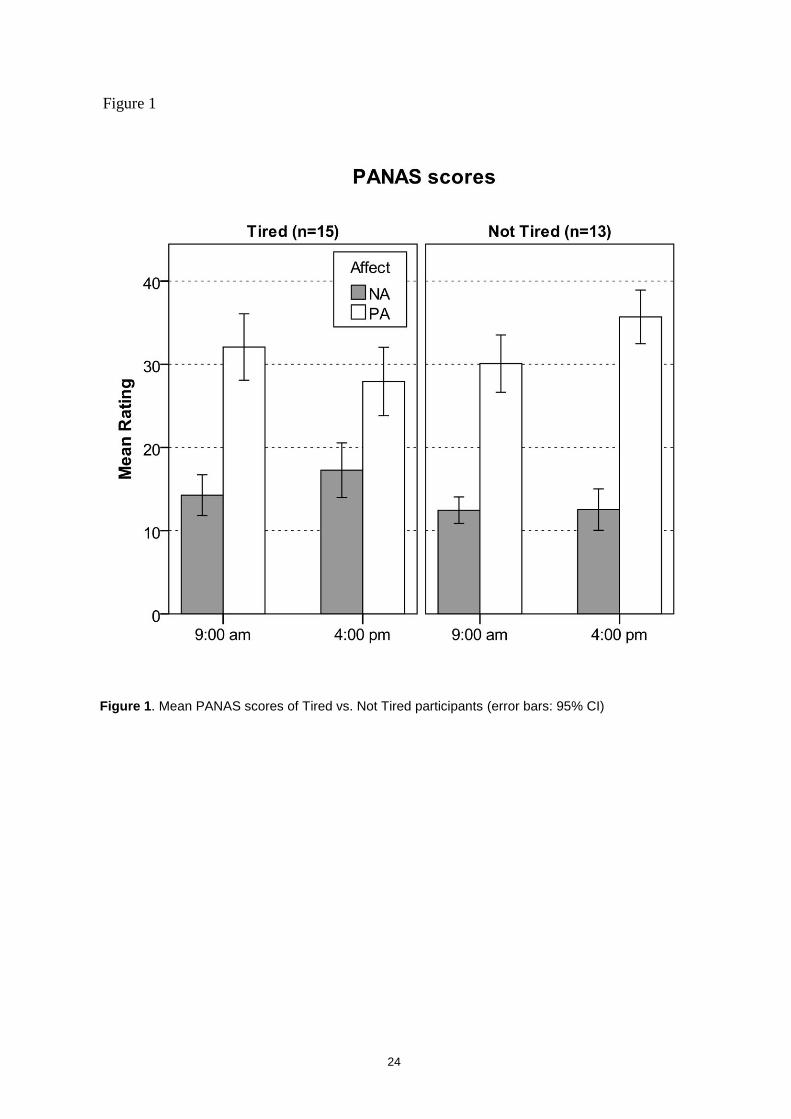
Thus, the mood scores were analysed again, following the creation of two tiredness groups
using a median-split. Since the morning PANAS scores were uncorrelated to the morning
tiredness scores, the tiredness labels were attributed according to participants’ afternoon
tiredness scores. Because of the within-subject design, this solved the category attribution
problem for participants with diverging morning and afternoon tiredness scores.
Participants scoring 1 or 2 (n = 13) were placed in the category ‘Not Tired’, whereas
participants scoring 4 or 5 (n = 15) were labelled ‘Tired’. As to participants scoring 3
(n = 8), they were dropped from the dataset.
[Insert Figure 1 about here]
14
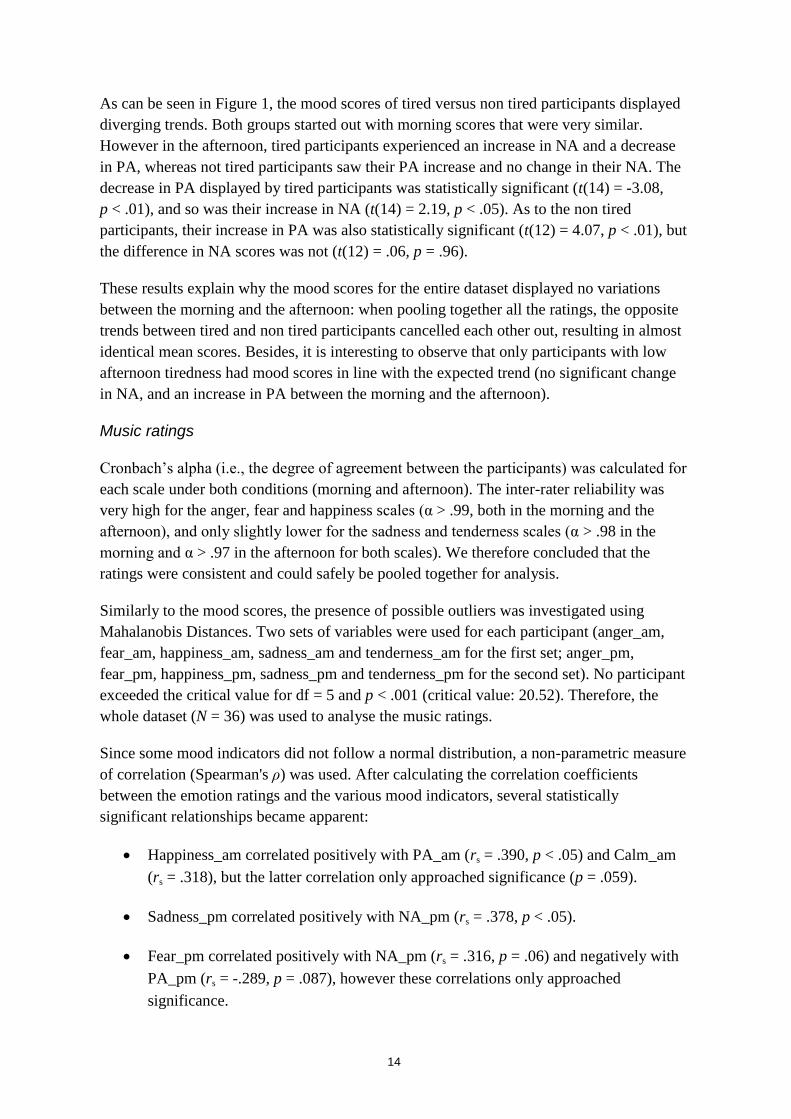
As can be seen in Figure 1, the mood scores of tired versus non tired participants displayed
diverging trends. Both groups started out with morning scores that were very similar.
However in the afternoon, tired participants experienced an increase in NA and a decrease
in PA, whereas not tired participants saw their PA increase and no change in their NA. The
decrease in PA displayed by tired participants was statistically significant (t(14) = -3.08,
p < .01), and so was their increase in NA (t(14) = 2.19, p < .05). As to the non tired
participants, their increase in PA was also statistically significant (t(12) = 4.07, p < .01), but
the difference in NA scores was not (t(12) = .06, p = .96).
These results explain why the mood scores for the entire dataset displayed no variations
between the morning and the afternoon: when pooling together all the ratings, the opposite
trends between tired and non tired participants cancelled each other out, resulting in almost
identical mean scores. Besides, it is interesting to observe that only participants with low
afternoon tiredness had mood scores in line with the expected trend (no significant change
in NA, and an increase in PA between the morning and the afternoon).
Music ratings
Cronbach’s alpha (i.e., the degree of agreement between the participants) was calculated for
each scale under both conditions (morning and afternoon). The inter-rater reliability was
very high for the anger, fear and happiness scales (α > .99, both in the morning and the
afternoon), and only slightly lower for the sadness and tenderness scales (α > .98 in the
morning and α > .97 in the afternoon for both scales). We therefore concluded that the
ratings were consistent and could safely be pooled together for analysis.
Similarly to the mood scores, the presence of possible outliers was investigated using
Mahalanobis Distances. Two sets of variables were used for each participant (anger_am,
fear_am, happiness_am, sadness_am and tenderness_am for the first set; anger_pm,
fear_pm, happiness_pm, sadness_pm and tenderness_pm for the second set). No participant
exceeded the critical value for df = 5 and p < .001 (critical value: 20.52). Therefore, the
whole dataset (N = 36) was used to analyse the music ratings.
Since some mood indicators did not follow a normal distribution, a non-parametric measure
of correlation (Spearman's ρ) was used. After calculating the correlation coefficients
between the emotion ratings and the various mood indicators, several statistically
significant relationships became apparent:
Happiness_am correlated positively with PA_am (rs = .390, p < .05) and Calm_am
(rs = .318), but the latter correlation only approached significance (p = .059).
Sadness_pm correlated positively with NA_pm (rs = .378, p < .05).
Fear_pm correlated positively with NA_pm (rs = .316, p = .06) and negatively with
PA_pm (rs = -.289, p = .087), however these correlations only approached
significance.
15
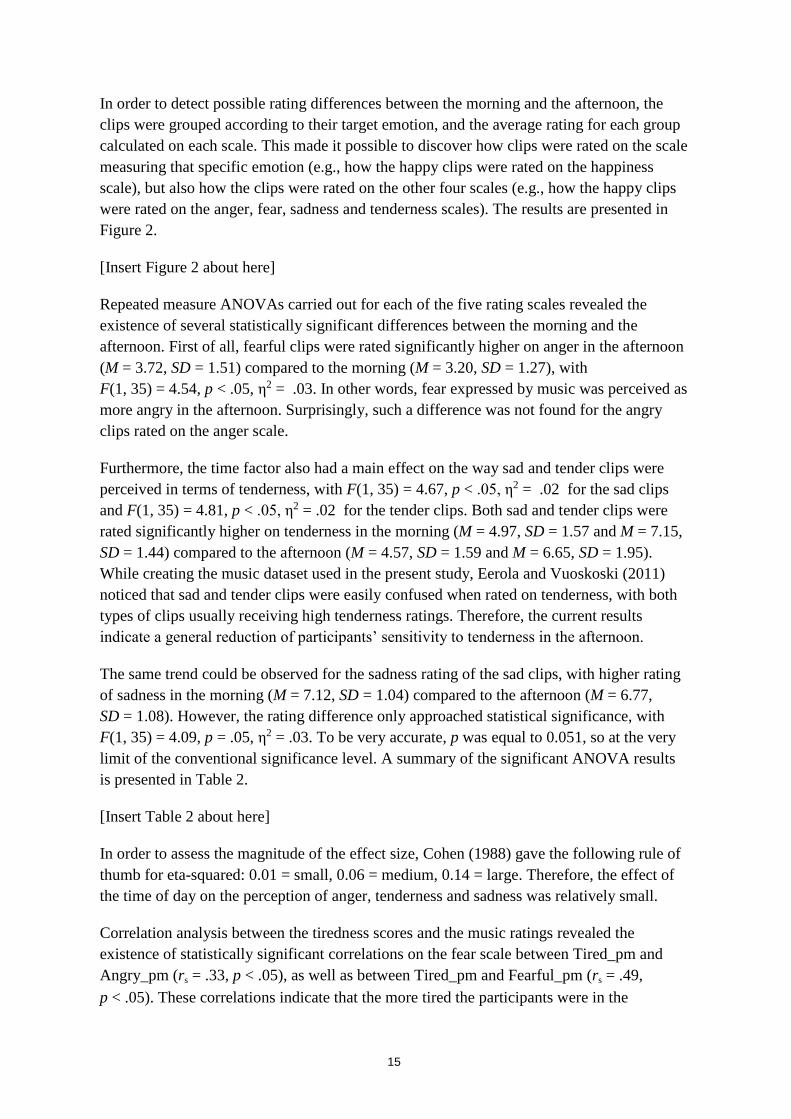
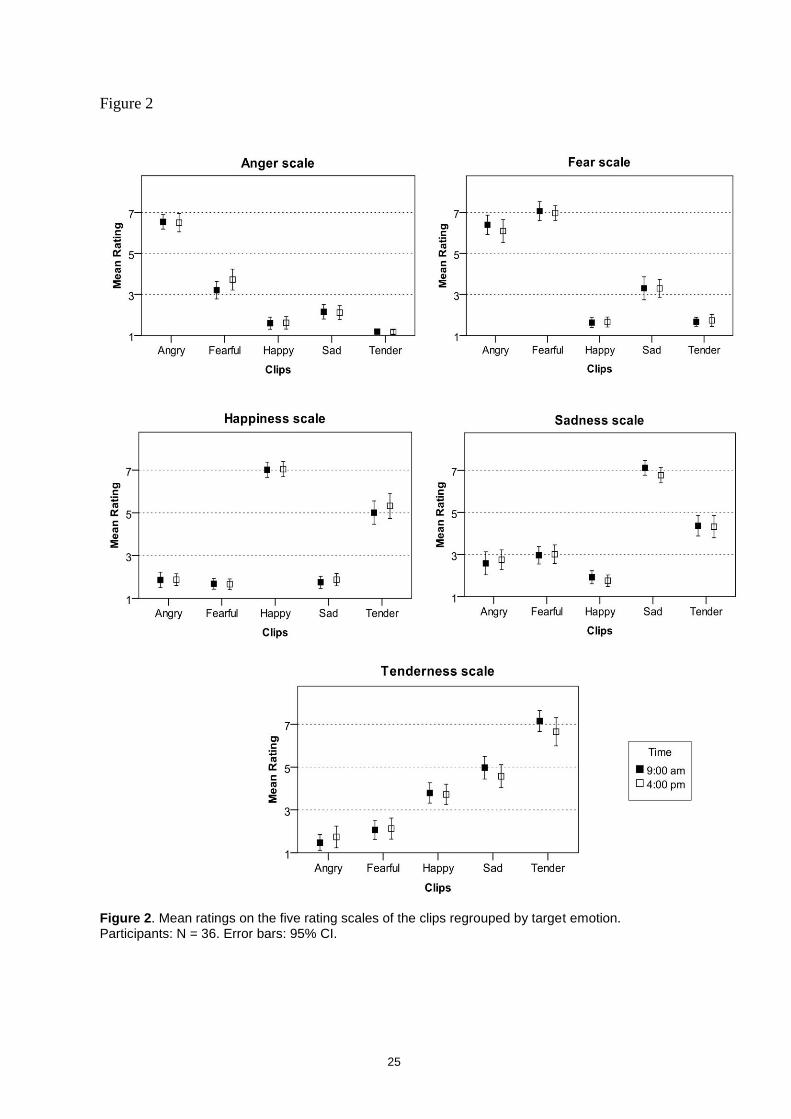
In order to detect possible rating differences between the morning and the afternoon, the
clips were grouped according to their target emotion, and the average rating for each group
calculated on each scale. This made it possible to discover how clips were rated on the scale
measuring that specific emotion (e.g., how the happy clips were rated on the happiness
scale), but also how the clips were rated on the other four scales (e.g., how the happy clips
were rated on the anger, fear, sadness and tenderness scales). The results are presented in
Figure 2.
[Insert Figure 2 about here]
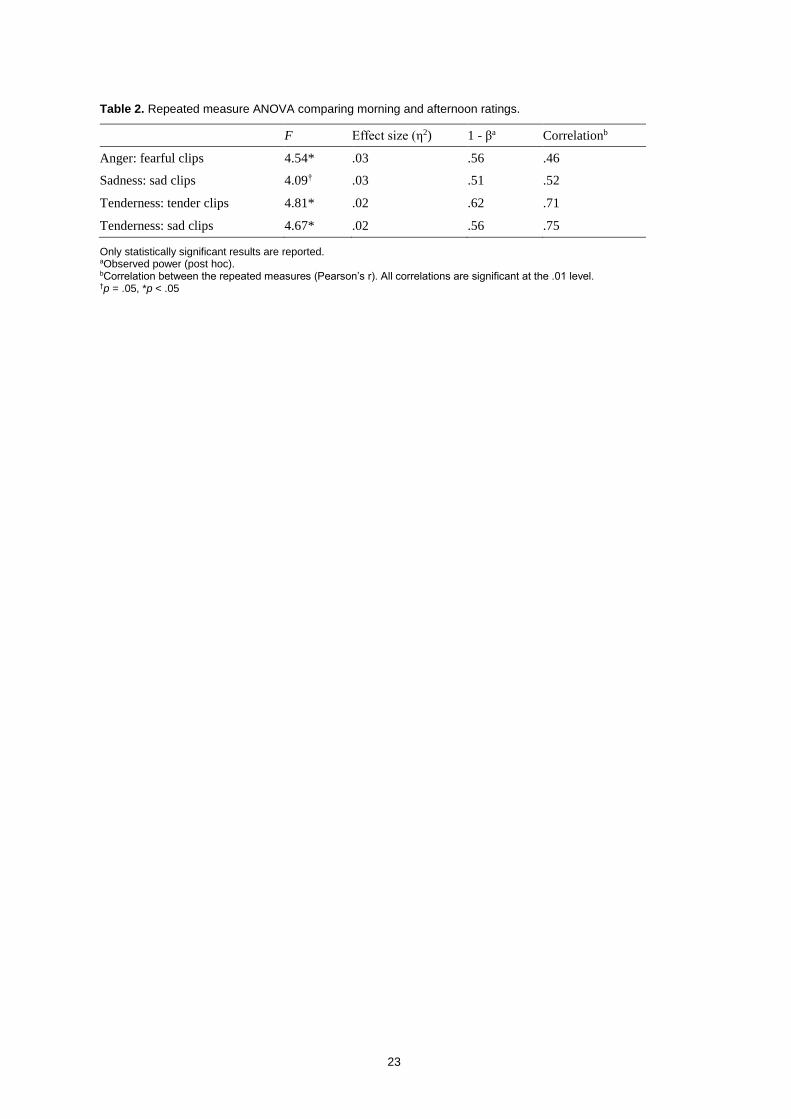
Repeated measure ANOVAs carried out for each of the five rating scales revealed the
existence of several statistically significant differences between the morning and the
afternoon. First of all, fearful clips were rated significantly higher on anger in the afternoon
(M = 3.72, SD = 1.51) compared to the morning (M = 3.20, SD = 1.27), with
F(1, 35) = 4.54, p < .05, η2 = .03. In other words, fear expressed by music was perceived as
more angry in the afternoon. Surprisingly, such a difference was not found for the angry
clips rated on the anger scale.
Furthermore, the time factor also had a main effect on the way sad and tender clips were
perceived in terms of tenderness, with F(1, 35) = 4.67, p < .05, η2 = .02 for the sad clips
and F(1, 35) = 4.81, p < .05, η2 = .02 for the tender clips. Both sad and tender clips were
rated significantly higher on tenderness in the morning (M = 4.97, SD = 1.57 and M = 7.15,
SD = 1.44) compared to the afternoon (M = 4.57, SD = 1.59 and M = 6.65, SD = 1.95).
While creating the music dataset used in the present study, Eerola and Vuoskoski (2011)
noticed that sad and tender clips were easily confused when rated on tenderness, with both
types of clips usually receiving high tenderness ratings. Therefore, the current results
indicate a general reduction of participants’ sensitivity to tenderness in the afternoon.
The same trend could be observed for the sadness rating of the sad clips, with higher rating
of sadness in the morning (M = 7.12, SD = 1.04) compared to the afternoon (M = 6.77,
SD = 1.08). However, the rating difference only approached statistical significance, with
F(1, 35) = 4.09, p = .05, η2 = .03. To be very accurate, p was equal to 0.051, so at the very
limit of the conventional significance level. A summary of the significant ANOVA results
is presented in Table 2.
[Insert Table 2 about here]
In order to assess the magnitude of the effect size, Cohen (1988) gave the following rule of
thumb for eta-squared: 0.01 = small, 0.06 = medium, 0.14 = large. Therefore, the effect of
the time of day on the perception of anger, tenderness and sadness was relatively small.
Correlation analysis between the tiredness scores and the music ratings revealed the
existence of statistically significant correlations on the fear scale between Tired_pm and
Angry_pm (rs = .33, p < .05), as well as between Tired_pm and Fearful_pm (rs = .49,
p < .05). These correlations indicate that the more tired the participants were in the
16
afternoon, the more fearful was their perception of angry and fearful music. Similarly to
what has been said about sad and tender clips, both fearful and angry clips tend to receive
high ratings on the fear scale (Eerola & Vuoskoski, 2011). Therefore, the ratings of fearful
and angry clips can be linked to the perception of fear in general
Similarly to the mood scores, tiredness only seemed to play a role in the afternoon. Indeed,
no correlations were found with Tired_am, on any of the rating scales. This systematic
absence of morning correlations involving tiredness – both in the mood evaluation and the
music rating – will be addressed in the discussion.
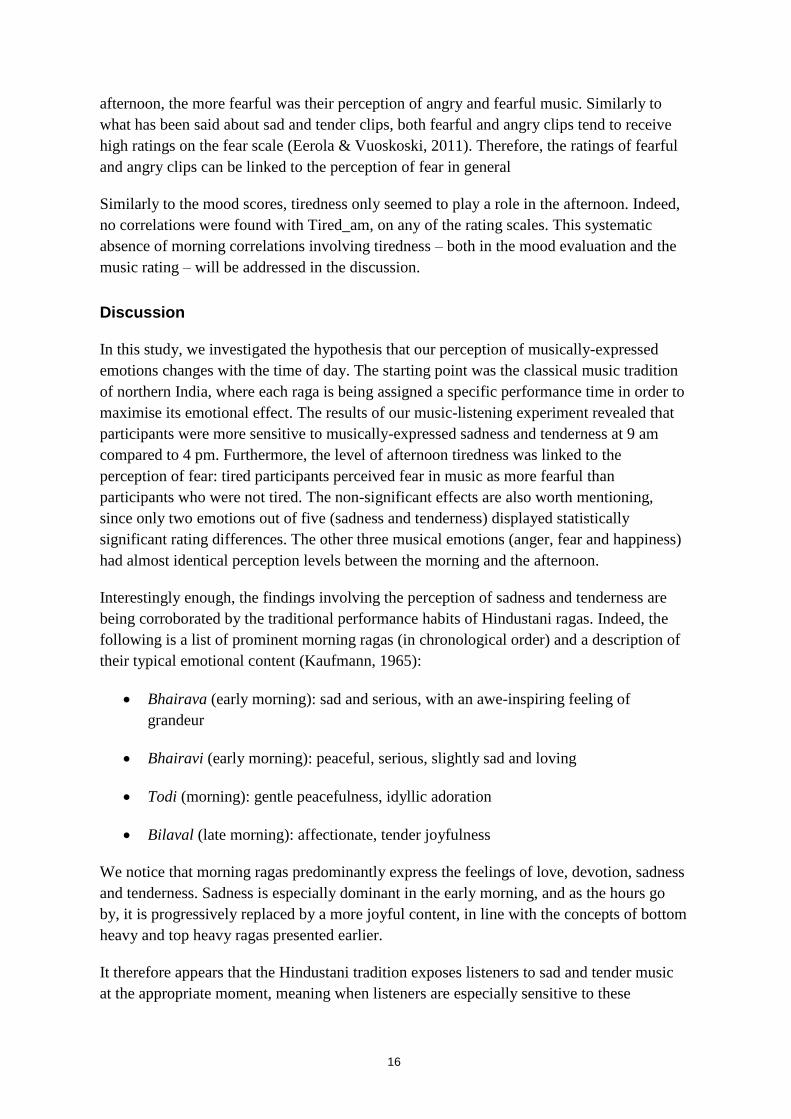
Discussion
In this study, we investigated the hypothesis that our perception of musically-expressed
emotions changes with the time of day. The starting point was the classical music tradition
of northern India, where each raga is being assigned a specific performance time in order to
maximise its emotional effect. The results of our music-listening experiment revealed that
participants were more sensitive to musically-expressed sadness and tenderness at 9 am
compared to 4 pm. Furthermore, the level of afternoon tiredness was linked to the
perception of fear: tired participants perceived fear in music as more fearful than
participants who were not tired. The non-significant effects are also worth mentioning,
since only two emotions out of five (sadness and tenderness) displayed statistically
significant rating differences. The other three musical emotions (anger, fear and happiness)
had almost identical perception levels between the morning and the afternoon.
Interestingly enough, the findings involving the perception of sadness and tenderness are
being corroborated by the traditional performance habits of Hindustani ragas. Indeed, the
following is a list of prominent morning ragas (in chronological order) and a description of
their typical emotional content (Kaufmann, 1965):
Bhairava (early morning): sad and serious, with an awe-inspiring feeling of
grandeur
Bhairavi (early morning): peaceful, serious, slightly sad and loving
Todi (morning): gentle peacefulness, idyllic adoration
Bilaval (late morning): affectionate, tender joyfulness
We notice that morning ragas predominantly express the feelings of love, devotion, sadness
and tenderness. Sadness is especially dominant in the early morning, and as the hours go
by, it is progressively replaced by a more joyful content, in line with the concepts of bottom
heavy and top heavy ragas presented earlier.
It therefore appears that the Hindustani tradition exposes listeners to sad and tender music
at the appropriate moment, meaning when listeners are especially sensitive to these
17
emotions. On the other hand, we did not obtain a corresponding support for the happier and
lighter afternoon ragas, since no significant rating difference was found for the happy clips.
Nevertheless, the present study will be of particular interest for ethnomusicologists and
Indian musicians, who are now presented for the first time with empirical evidence to
partially support and justify a long-standing tradition.
Moreover, by highlighting the importance of considering the time of day when planning an
experiment, the current results also have implications for researchers studying music and
emotion. Should these results be confirmed by subsequent studies, then controlling for the
time factor might prove to be important in order to maintain consistency and avoid
distortions in the results.
Finally, the present findings open a promising avenue for music therapists, who might be
able to optimise the efficacy of musical interventions by taking into account the
chronobiological state of the clients. Increased awareness for the interaction between mood
cyclicity and music perception could be applied to music therapy in several ways. Schedule
permitting, sessions could take place at moments deemed most beneficial for the clients,
depending on the issue at hand and the therapeutic goals. If personalised scheduling is not
feasible, then therapists could still adjust their interventions and modulate their
interpretation of the events that occurred in the session.
Quite understandably, since this study was only exploratory and the emotion ratings not
connected to any clinical outcome measures, it is difficult at this stage to make any claims
in terms of practical impact. However, the study by Punkanen et al. (2011) mentioned
earlier allows us to put the current results into perspective. Indeed, in their study on
emotional recognition and depression, the authors also used music clips from the dataset
created by Eerola and Vuoskoski (2011), and they tested the participants on the same five
target emotions as we did. Most of their reported effect sizes ranged from .01 to .03, with
the notable exception of the tender clips rated on the tenderness scale (η2 = .07). It therefore
would appear that in terms of emotional perception of music, the effect of the time of day is
as strong as the effect of being depressed. In other words, the results obtained in the present
study might actually be relevant in practice, even if the effect sizes are small. This will have
to be confirmed by future studies that are more clinically-oriented.
Regarding the absence of correlations involving tiredness ratings in the morning, one
possible explanation could be that participants were not rating tiredness in the sense of
mental exhaustion and physical fatigue, but sleepiness. Sleepiness can be defined as the
desire to sleep or the efforts to resist sleep. Since tiredness and sleepiness frequently co-
occur, the terms are often used interchangeably. However, they refer to two separate
phenomena that can also happen independently from one another. A confusion could have
easily occurred in the present experiment, for two reasons. First of all, the questionnaire did
not specify the exact meaning of ‘tired’, leaving the door open to multiple interpretations.
Secondly, we know from chronobiological studies that everybody experiences a slight
morning depression after waking up, which dissipates after ca. two hours (Smolensky &
Lamberg, 2001). The morning sessions were characterised by a sleep proximity of less than
18
two hours for most participants (M = 1.5, SD = 0.7). In other words, most of them were still
in that two-hour time frame where they had presumably not yet reached their normal
daytime mood. Under these circumstances, it is plausible that only their afternoon ratings
were assessing true physical and mental tiredness, whereas their morning ratings were
about the feeling of not being fully awake.
Interestingly enough, the statistically significant correlations between Happiness_am and
PA_am, as well as between Sadness_pm and NA_pm are corroborated by Vuoskoski and
Eerola (2011). In their study, they used clips from the same dataset and tested the same five
target emotions, although time of day was not controlled for. Instead of the PANAS, they
used the POMS (Profile of Mood States) to assess participants’ initial mood. Their results
showed a positive correlation between Vigour and the ratings on the Happiness scale
(r = .32, p < .01), as well as a positive correlation between Anger and the ratings on the
Sadness scale (r = .33, p < .01). Given the adjectives that make up the two dimensions of
the PANAS, POMS Vigour can be assimilated to PA and POMS Anger to NA (Watson &
Clark, 1999). Although these correlations are not very strong, they support the idea that
people’s current mood influences their perception of emotions expressed by music.
Quite obviously, the results presented in this article are only the first step in a promising
and new direction. This study’s main limitation comes from the fact that measurements
were taken at only two moments in time. It would be important and valuable to expand the
present experiment by adding more time points, so as to cover participants’ entire waking
hours. Increasing temporal granularity would allow to better capture the diurnal cyclicity of
mood fluctuation and emotional perception.
Another potentially fruitful idea would be to look not only at circadian but also circannual
rhythms. Indeed, research has confirmed the existence of seasonal variations in depression,
as well as in other mood states such as anger, irritability and anxiety. This is true for both
healthy and depressed individuals, the mood variations of the latter simply being much
more pronounced (Harmatz et al., 2000). Indian classical music could again serve as a
starting point, since the Hindustani time theory also associates certain ragas with each
season of the year.
Besides, a seasonal approach could have useful applications in music therapy. We might for
example discover that certain therapy processes are easier or have different outcomes
depending on when they are started. This type of reasoning is especially important for
issues like Seasonal Affective Disorder (SAD), where depressive symptoms tend to appear
during one specific season (usually in the winter). In this case, it would probably be wise to
start the therapy process before and not during the season in question.
On a more general note, we hope the present article will serve as a reminder that time
possesses a double aspect: it is not only quantitative and linear, but also qualitative and
circular. Far from being mutually exclusive, these two aspects can actually co-exist and
support each other, as exemplified by the findings in chronobiology and their valuable
application in chronotherapy (Smolensky & Lamberg, 2001).
19
References
Balkwill, L.-L., & Thompson, W. F. (1999). A cross-cultural investigation of the perception
of emotion in music: psychophysical and cultural cues. Music Perception, 17(1), 43–
64.
Balkwill, L.-L., Thompson, W. F., & Matsunaga, R. (2004). Recognition of emotion in
Japanese, Western, and Hindustani music by Japanese listeners. Japanese
Psychological Research, 46(4), 337–349.
Batish, S. D., & Batish, A. (1989). Ragopedia: Exotic scales of North India (volume 1).
Santa Cruz, CA: Batish Publications.
Bharata. (1996). Nāṭyaśāstra: English translation with critical notes. (Śrīraṅga, Trans.).
New Delhi: Munshiram Manoharlal Publishers.
Bhatkhande, V. N. (1990). Hindustani sangeet paddhati. (P. K. Garg, Ed.). Hathras, India:
Sakhi Prakashan.
Clark, L. A., Watson, D., & Leeka, J. (1989). Diurnal variation in the positive affects.
Motivation and Emotion, 13(3), 205–234.
Cohen, J. (1988). Statistical power analysis for the behavioral sciences. Hillsdale, NJ:
Erlbaum.Deva, B. C. (1980). A study in the psychological response to ragas: semantic
descriptions and synesthetic relations of ragas. Journal of the Indian Musicological
Society, 11(1), 33–36.
Eerola, T., & Vuoskoski, J. K. (2011). A comparison of the discrete and dimensional
models of emotion in music. Psychology of Music, 39(1), 18–49.
Eerola, T., & Vuoskoski, J. K. (2013). A Review of Music and Emotion Studies:
Approaches, Emotion Models, and Stimuli. Music Perception: An Interdisciplinary
Journal, 30(3), 307–340.
Gotlib, I. H., Krasnoperova, E., Yue, D. N., & Joormann, J. (2004). Attentional biases for
negative interpersonal stimuli in clinical depression. Journal of Abnormal Psychology,
113(1), 127–135.
Harmatz, M. G., Well, A. D., Overtree, C. E., Kawamura, K. Y., Rosal, M., & Ockene, I. S.
(2000). Seasonal variation of depression and other moods: A longitudinal approach.
Journal of Biological Rhythms, 15(4), 344–350.
Hasler, B. P., Mehl, M. R., Bootzin, R. R., & Vazire, S. (2008). Preliminary evidence of
diurnal rhythms in everyday behaviors associated with positive affect. Journal of
Research in Personality, 42(6), 1537–1546.
20
Kanning, M. (2010). Be active and become happy: An ecological momentary assessment of
physical activity and mood. Journal of Sport & Exercise Psychology, 32(2), 253–261.
Kaufmann, W. (1965). Rasa, rāga-mālā and performance times in North Indian rāgas.
Ethnomusicology, 9(3), 272–291.
Murray, G., Allen, N. B., & Trinder, J. (2002). Mood and the circadian system:
Investigation of a circadian component in positive affect. Chronobiology International,
19(6), 1151–1169.
Ninivaggi, F. J., M. D. (2010). Ayurveda: A comprehensive guide to traditional Indian
medicine for the West (Reprint.). Lanham, MD: Rowman & Littlefield Publishers.
Palmer, J. D. (2002). The living clock: The orchestrator of biological rhythms. Oxford ;
New York: Oxford University Press.
Peirce, J. W. (2007). PsychoPy—Psychophysics software in Python. Journal of
Neuroscience Methods, 162(1–2), 8–13.
Punkanen, M., Eerola, T., & Erkkilä, J. (2011). Biased emotional recognition in depression:
Perception of emotions in music by depressed patients. Journal of Affective Disorders,
130(1-2), 118–126.
Raja, D. (2005). Hindustani music: A tradition in transition (illustrated edition.). New
Delhi: DK Print World.
Reinberg, A., & Smolensky, M. H. (1983). Biological rhythms and medicine: Cellular,
metabolic, physiopathologic, and pharmacologic aspects. New York, NY: Springer-
Verlag.
Roy, H. L. (1937). Problems of Hindustani music. Calcutta: K. B. Bhaduri.
Shankar, R. (2008). My music, my life (New Ed.). San Rafael, CA: Mandala Publishing
Group.
Smolensky, M., & Lamberg, L. (2001). The body clock guide to better health: How to use
your body’s natural clock to fight illness and achieve maximum health. New York,
NY: Henry Holt and Company.
Stone, A. A., Schwartz, J. E., Schkade, D., Schwarz, N., Krueger, A., & Kahneman, D.
(2006). A population approach to the study of emotion: Diurnal rhythms of a working
day examined with the day reconstruction method. Emotion, 6(1), 139–149.
Surguladze, S. A., Young, A. W., Senior, C., Brébion, G., Travis, M. J., & Phillips, M. L.
(2004). Recognition accuracy and response bias to happy and sad facial expressions in
patients with major depression. Neuropsychology, 18(2), 212–218.
21
Thayer, R. E. (1987). Problem perception, optimism, and related states as a function of time
of day (diurnal rhythm) and moderate exercise: Two arousal systems in interaction.
Motivation and Emotion, 11(1), 19–36.
Thompson, E. R. (2007). Development and validation of an internationally reliable short-
form of the Positive and Negative Affect Schedule (PANAS). Journal of Cross-
Cultural Psychology, 38(2), 227–242.
Vittengl, J. R., & Holt, C. S. (1998). A time-series diary study of mood and social
interaction. Motivation and Emotion, 22(3), 255–275.
Vuoskoski, J. K., & Eerola, T. (2011). The role of mood and personality in the perception
of emotions represented by music. Cortex, 47(9), 1099–1106.
Watson, D. (2000). Mood and temperament. New York, NY: The Guilford Press.
Watson, D., & Clark, L. A. (1999). The PANAS-X: Manual for the Positive and Negative
Affect Schedule - Expanded Form. Psychology Publications. Retrieved from
http://ir.uiowa.edu/psychology_pubs/11
Watson, D., Clark, L. A., & Tellegen, A. (1988). Development and validation of brief
measures of positive and negative affect: The PANAS scales. Journal of Personality
and Social Psychology, 54(6), 1063–1070.
Westbrook, P. (1998). Ayurveda, Samkhya and the time theory of performance in
Hindustani classical music. Journal of Indian Philosophy and Religion, 3.
Wood, C., & Magnello, M. E. (1992). Diurnal changes in perceptions of energy and mood.
Journal of the Royal Society of Medicine, 85(4), 191–194.
Yardi, S., & Chew, E. (2004). Giving ragas the time of day: Linking structure, emotion and
performance time in North Indian classical music using the harmonic network. In
Proceedings of the 8th International Conference on Music Perception & Cognition
(pp. 705–708). Retrieved from
http://www.icmpc8.umn.edu/proceedings/ICMPC8/PDF/AUTHOR/MP040062.PDF
Zentner, M., Grandjean, D., & Scherer, K. R. (2008). Emotions evoked by the sound of
music: Characterization, classification, and measurement. Emotion, 8(4), 494–521.
22
Tables and Figures
Table 1. Comparison between the Geneva Emotional Music Scale (GEMS) and the navarasa.
GEMS factor Associated emotions a Corresponding rasa b
Wonder Happy, filled with wonder, allured, dazzled, moved Adbhut (marvel)
Transcendence Inspired, feeling of transcendence, feeling of spirituality, thrills Bhakti (spirituality)
Tenderness In love, sensual, affectionate, tender, mellowed Shringaara (love)
Nostalgia Sentimental, dreamy nostalgic, melancholic Karuna c (pathos)
Peacefulness Calm, relaxed, serene, soothed, meditative Shaanta (peace)
Power Energetic, triumphant, fiery, strong, heroic Veera (valour)
Joyful activation Stimulated, joyful, animated, feel like dancing, amused Haasya (mirth)
Tension Agitated, nervous, tense, impatient, irritated Raudra (anger)
Sadness Sad, sorrowful Karuna c (pathos)
aEmotion terms from the 40-items version of the GEMS. bThese are the navarasa adapted to music, meaning the nine original emotions plus bhakti (spiritual feeling), minus bhaya (fear) and bibhatsa (disgust). cKaruna appears twice because the Indian tradition regroups nostalgia and sadness under the same concept.
23
Table 2. Repeated measure ANOVA comparing morning and afternoon ratings.
F Effect size (η2) 1 - βa Correlationb
Anger: fearful clips 4.54* .03 .56 .46
Sadness: sad clips 4.09† .03 .51 .52
Tenderness: tender clips 4.81* .02 .62 .71
Tenderness: sad clips 4.67* .02 .56 .75
Only statistically significant results are reported. aObserved power (post hoc). bCorrelation between the repeated measures (Pearson’s r). All correlations are significant at the .01 level. †p = .05, *p < .05
24
Figure 1
Figure 1. Mean PANAS scores of Tired vs. Not Tired participants (error bars: 95% CI)
25
Figure 2
Figure 2. Mean ratings on the five rating scales of the clips regrouped by target emotion. Participants: N = 36. Error bars: 95% CI.
26
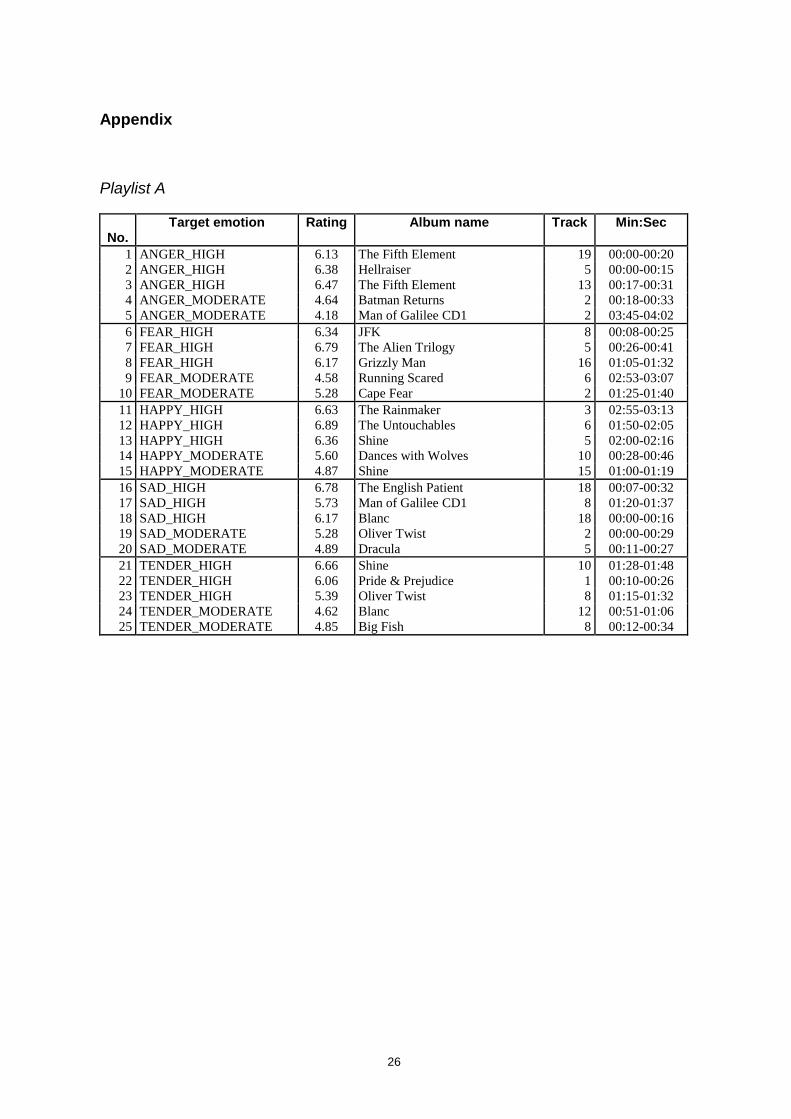
Appendix
Playlist A
No. Target emotion Rating Album name Track Min:Sec
1 ANGER_HIGH 6.13 The Fifth Element 19 00:00-00:20
2 ANGER_HIGH 6.38 Hellraiser 5 00:00-00:15
3 ANGER_HIGH 6.47 The Fifth Element 13 00:17-00:31
4 ANGER_MODERATE 4.64 Batman Returns 2 00:18-00:33
5 ANGER_MODERATE 4.18 Man of Galilee CD1 2 03:45-04:02
6 FEAR_HIGH 6.34 JFK 8 00:08-00:25
7 FEAR_HIGH 6.79 The Alien Trilogy 5 00:26-00:41
8 FEAR_HIGH 6.17 Grizzly Man 16 01:05-01:32
9 FEAR_MODERATE 4.58 Running Scared 6 02:53-03:07
10 FEAR_MODERATE 5.28 Cape Fear 2 01:25-01:40
11 HAPPY_HIGH 6.63 The Rainmaker 3 02:55-03:13
12 HAPPY_HIGH 6.89 The Untouchables 6 01:50-02:05
13 HAPPY_HIGH 6.36 Shine 5 02:00-02:16
14 HAPPY_MODERATE 5.60 Dances with Wolves 10 00:28-00:46
15 HAPPY_MODERATE 4.87 Shine 15 01:00-01:19
16 SAD_HIGH 6.78 The English Patient 18 00:07-00:32
17 SAD_HIGH 5.73 Man of Galilee CD1 8 01:20-01:37
18 SAD_HIGH 6.17 Blanc 18 00:00-00:16
19 SAD_MODERATE 5.28 Oliver Twist 2 00:00-00:29
20 SAD_MODERATE 4.89 Dracula 5 00:11-00:27
21 TENDER_HIGH 6.66 Shine 10 01:28-01:48
22 TENDER_HIGH 6.06 Pride & Prejudice 1 00:10-00:26
23 TENDER_HIGH 5.39 Oliver Twist 8 01:15-01:32
24 TENDER_MODERATE 4.62 Blanc 12 00:51-01:06
25 TENDER_MODERATE 4.85 Big Fish 8 00:12-00:34
27
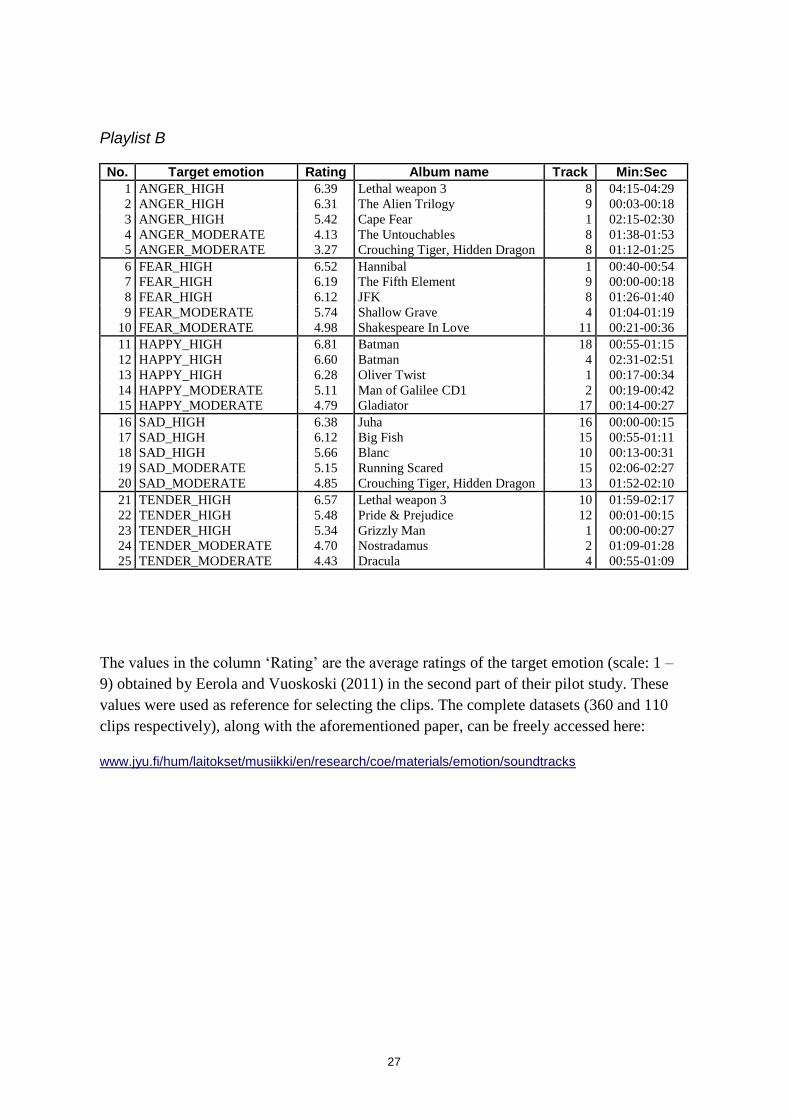
Playlist B
No. Target emotion Rating Album name Track Min:Sec
1 ANGER_HIGH 6.39 Lethal weapon 3 8 04:15-04:29
2 ANGER_HIGH 6.31 The Alien Trilogy 9 00:03-00:18
3 ANGER_HIGH 5.42 Cape Fear 1 02:15-02:30
4 ANGER_MODERATE 4.13 The Untouchables 8 01:38-01:53
5 ANGER_MODERATE 3.27 Crouching Tiger, Hidden Dragon 8 01:12-01:25
6 FEAR_HIGH 6.52 Hannibal 1 00:40-00:54
7 FEAR_HIGH 6.19 The Fifth Element 9 00:00-00:18
8 FEAR_HIGH 6.12 JFK 8 01:26-01:40
9 FEAR_MODERATE 5.74 Shallow Grave 4 01:04-01:19
10 FEAR_MODERATE 4.98 Shakespeare In Love 11 00:21-00:36
11 HAPPY_HIGH 6.81 Batman 18 00:55-01:15
12 HAPPY_HIGH 6.60 Batman 4 02:31-02:51
13 HAPPY_HIGH 6.28 Oliver Twist 1 00:17-00:34
14 HAPPY_MODERATE 5.11 Man of Galilee CD1 2 00:19-00:42
15 HAPPY_MODERATE 4.79 Gladiator 17 00:14-00:27
16 SAD_HIGH 6.38 Juha 16 00:00-00:15
17 SAD_HIGH 6.12 Big Fish 15 00:55-01:11
18 SAD_HIGH 5.66 Blanc 10 00:13-00:31
19 SAD_MODERATE 5.15 Running Scared 15 02:06-02:27
20 SAD_MODERATE 4.85 Crouching Tiger, Hidden Dragon 13 01:52-02:10
21 TENDER_HIGH 6.57 Lethal weapon 3 10 01:59-02:17
22 TENDER_HIGH 5.48 Pride & Prejudice 12 00:01-00:15
23 TENDER_HIGH 5.34 Grizzly Man 1 00:00-00:27
24 TENDER_MODERATE 4.70 Nostradamus 2 01:09-01:28
25 TENDER_MODERATE 4.43 Dracula 4 00:55-01:09
The values in the column ‘Rating’ are the average ratings of the target emotion (scale: 1 –
9) obtained by Eerola and Vuoskoski (2011) in the second part of their pilot study. These
values were used as reference for selecting the clips. The complete datasets (360 and 110
clips respectively), along with the aforementioned paper, can be freely accessed here:
www.jyu.fi/hum/laitokset/musiikki/en/research/coe/materials/emotion/soundtracks