Embed Size (px)
Citation preview

Acceptance Criteria:
What Accuracy Will We Require for M&V2.0 Results, and
How Will We Prove It?
1

Quality, accurate results
• Tool testing can tell us that 2.0 technologies are reliable – can model, predict energy use well over time horizons used for EE
• Once we have reliable tools, still have to verify that application generates a quality result
• Many, but not all buildings are ‘predictable’/model-able– Uncertainty analysis can quantify error due to modeling error in
M&V2.0 tools
• Gross savings at meter may not be gross savings due to the measure, i.e., non-routine adjustments may be needed– Transparent documentation especially of non-routine
adjustments is needed
2

Non-routine events and adjustments
• Gross metered savings may not reflect gross program/measure savings
– E.g. Occupancy may change or loads may be added/removed
• Most 2.0 tools do *not* capture non-routine events, comparison group 2.0 tools may– Possible that 2.0 analytics can flag cases where savings drop or increase
unexpectedly, so that implementers can flag events, make adjustment
– Currently this is a manual process
– If whole-building M&V were used at large scale, would these events cancel out? 3

Common sources of error savings estimation and evaluation
• Measurement error: is the instrument accurate
– Often assumed negligible for revenue-grade utility meters
• Modeling error: does the model fit the data, characterize the phenomenon
– Often characterized with ‘goodness of fit’ statistics
• Sampling error: is a selection representative of the population
– Often considered in evaluation, not applicable to single site M&V
4

Uncertainty analysis
• ASHRAE Guideline 14 provides formulation to quantify savings uncertainty due to model error (no sampling)– Scope is individual buildings/projects
– Negligible measurement uncertainty for revenue grade utility meters
• Add up each building’s savings to get program-level result; – Use error propagation to get aggregated savings uncertainty (not covered in ASHRAE)
5
Desired Confidence
Level
Model Accuracy
(error)
Energy Savings
# of Data Points Baseline, Post
Savings Uncertainty = fn of

Usual interpretation of uncertainty
• Establish range of values (uncertainty), and likelihood (confidence) that savings lie in that range
• Lower uncertainty, smaller confidence interval, smaller range– 95% confident that savings are between [4,000, 12,000], i.e. 8,000 +/-
4,000, i.e. fractional savings uncertainty is 50%
– 68% confident that savings are between [6,000, 10,000], i.e. 8,000 +/-2,000 , i.e. fractional savings uncertainty is 25%
64,000 6,000 8,000 10,000 12,000

Illustration: savings uncertainty at building and aggregate level, due to model uncertainty (no sampling)
7Savings uncertainty ranges for each of 39 buildings, at 95% confidence level
For the aggregate of the 39 buildings, at 95% confidence level
Savings = 3.96% +/-.3, that is within confidence interval of [3.66%; 4.26%]Aggregate far exceeds ASHRAE guidance

Some cautions on certainty analyses
• If accuracy concerns are issue for M&V2.0, we should establish what bar for rigor must be met
• For 2.0 tools, use same standards for sufficiency applied to “1.0” – Consider whether 2.0 can give equivalent or higher
levels of certainty
• Not suggesting we quantify every source of uncertainty in EE savings estimations
• Avoid double standard for existing cond. whole building approaches vs. deemed, custom, simulation-based approaches– Currently, often treat gross savings as point values --
no uncertainty– Uncertainty is considered for program evaluation,
often in sampling
8

Existing confidence-uncertainty guidance
• ASHRAE puts bar at 68-50 for building-level gross M&V– Propagating gross uncertainty from building to aggregate multi-building
level reduces uncertainty for the total
• Forward capacity markets have used 80-20 for portfolio-wide savings EM&V
• These criteria arise from separate use cases - what will we require of M&V2.0 tools applied to a program?
9
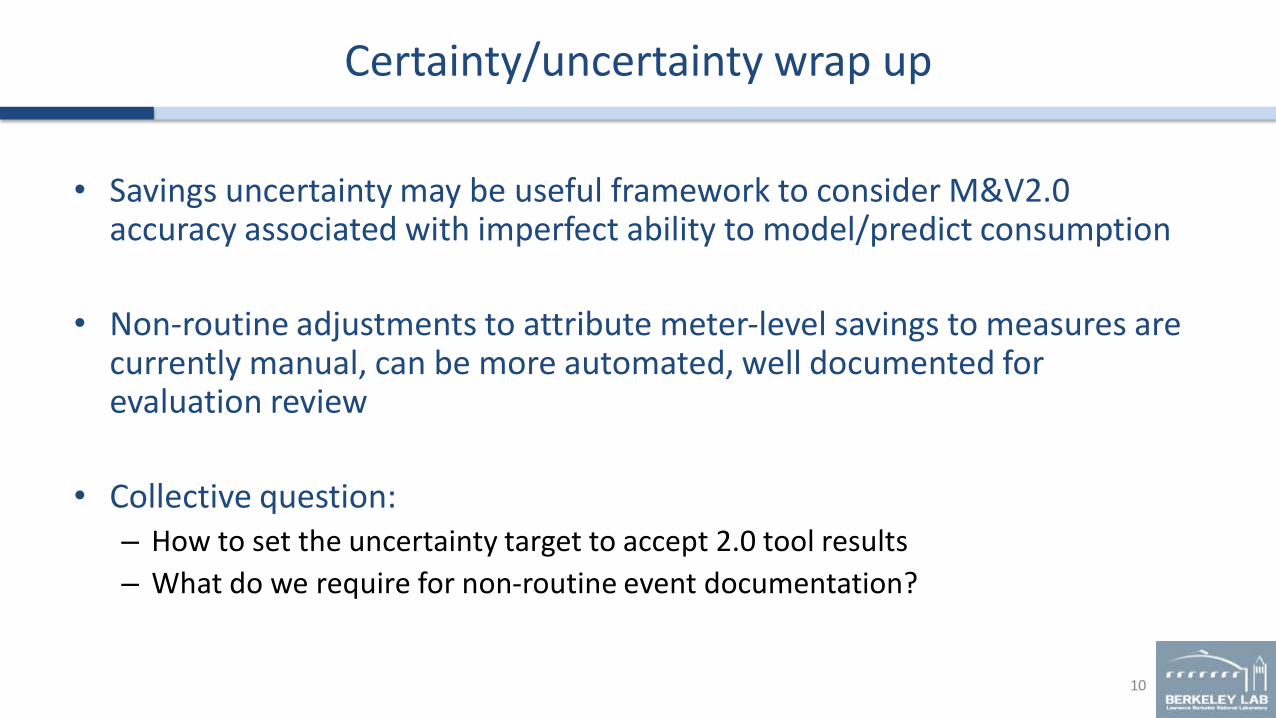
Certainty/uncertainty wrap up
• Savings uncertainty may be useful framework to consider M&V2.0 accuracy associated with imperfect ability to model/predict consumption
• Non-routine adjustments to attribute meter-level savings to measures are currently manual, can be more automated, well documented for evaluation review
• Collective question: – How to set the uncertainty target to accept 2.0 tool results
– What do we require for non-routine event documentation?
10

Questions on Uncertainty
11

Program Evaluation Perspective
12
Sue Haselhorst,
Vice President of Project Analytics

Scaling site results to a program evaluation
13
The results of an impact evaluation are high-stakes
Drive shareholder incentives
Large factor in cost-effectiveness
Best practices specifies impact evaluations that will yield unbiased results.
A precise value in-and-of-itself does not insure an unbiased result
Considerations in scaling to a full impact evaluation

Accurate but biased …
14
In 1948, the opinion polls projected Dewey would beat Truman based on
telephone surveys. The newspapers were so confident, they printed the
results before all the results were in.
It turns out Republicans owned telephones, Democrats not so much

A precisely biased result
15
Hypothetical
In blue: Evaluated results for all sites yields a 97% RR with equivalent
precision of ±5% (includes red marker sites as well)
In red: Sub-sample not selected randomly yields 60% with similar precision.

Uncertainty and bias
16
On-site M&V: sampling error, unknown measurement error, but minimal
bias
Sites are selected for on-site M&V introducing sampling error
Sampling error is often prescribed to meet ± 10% at the 90% confidence level
If the sample was redrawn 10x
All but one of the ten result would fall within ±10% of the others
The results are unbiased, as long as the sample has been selected
randomly
This error value does not account for measurement error – that is the
uncertainty associated with individual sites
Billing analysis: no sampling error, some assessment of measurement
error, unknown bias
Billing analysis starts with a census of sites – so no sampling error
However, bias is potentially introduced by dropping of sites that are not
suitable for billing analysis (insufficient data, too many estimated reads,
badly behaved)
Some measurement error (although attribution of technology contribution to
savings within this band has uncertainty)

SMUD Example
17
Direct install small business whole building evaluation billing data attrition
What is your confidence in savings estimated using a non-random
sample of 45 sites?
• Deep Savings for Small CDI ACEEE Summer Study 2016

Systematic confounding factors
18
Billing analysis works well in the residential sector
One-to-one correspondence between the measure and the meter serving the
measure
Savings is often a large fraction of bills (i.e. weatherization savings in the
order of 20%)
Similar order of magnitude of stable usages (500kWh – 20000 kWh)
10s of thousands of accounts in the analysis often
Less successful in non-residential sector
Multi-meter accounts occur frequently
Correspondence between the measure and the meter serving the measure is
uncertain
Small savings fractions
Orders of magnitude range in usage (20,000 – 200,000,000 kWh)
Relatively small number of participants
NY and MA have recently tried and failed to conduct a billing analysis, in
some part attributed to meter mismatch problems

Potential Pilot Features
19
Collect data through out the pilot of the account attrition
How many and why were accounts excluded from analysis
Within the confines of the pilot
Track screening processes and number of sites that meet screening and
those that do not
Track reasons for attrition
Did not meet initial screening
Insufficient pre or post billing data
Missing or estimated meter reads
Poorly performing individual models
Model fails other tests
At the conclusion of the test, estimate potential impact of the excluded sites
on the outcome