Embed Size (px)
DESCRIPTION
analis
Citation preview

7/17/2019 Accenture Mega Analitics Consumer 2013 2015 English (1)
http://slidepdf.com/reader/full/accenture-mega-analitics-consumer-2013-2015-english-1 1/40
Mega Analytics:Consumer 2013-2015Mikhail Pershin
Head of Russian Retail Practice, Accenture
7/17/2019 Accenture Mega Analitics Consumer 2013 2015 English (1)
http://slidepdf.com/reader/full/accenture-mega-analitics-consumer-2013-2015-english-1 2/40
Copyright © 2013 Accenture All rights reserved. 2
To be covered
1. Factors influencingretail in Russia
2. Consumer:expectations &
preferences
4. Retail in Russia:segments dynamic
3. Retail in Russia:channels dynamic
Retail inRussia
7/17/2019 Accenture Mega Analitics Consumer 2013 2015 English (1)
http://slidepdf.com/reader/full/accenture-mega-analitics-consumer-2013-2015-english-1 3/40
Factors influencing retailin Russia

7/17/2019 Accenture Mega Analitics Consumer 2013 2015 English (1)
http://slidepdf.com/reader/full/accenture-mega-analitics-consumer-2013-2015-english-1 4/40
Copyright © 2013 Accenture All rights reserved. 4
Three major factors that will influence theRussian retail market in 2012-2015
Consumer
preferences
Competition
Legislation
• Tightening of government regulations for tobacco and alcohol product sales
• Active government regulation of e-commerce sales
• Possible legislation changes in retail trade - reducing of the dominance limitat the municipal level from 35% to 25%
• Revenues of Top-30 retailers in Russia were 14% of the total turnover in
2012, compared to 12% in 2011, while the share of grocery retailers hasincreased from 9% to 10% respectively
• There is a shortage of quality retail and warehouse premises
• Expansion of global e-commerce retail players onto the Russian market
• Consumers are becoming more and more focused on retailers’ promises: 83%are frustrated by failure to deliver on a promise
• E-commerce market continues to increase by 25-30% annually• Price and quality are still the most important factors for consumers, and the
main drivers for growth in private label sales, up to 29% annually
• Consumers are becoming more global and mobile: the volume of cross-bordershopping is growing by about 50% per year, and has now surpassed $15 billion
Source: Infoline, research by Accenture, news resources
7/17/2019 Accenture Mega Analitics Consumer 2013 2015 English (1)
http://slidepdf.com/reader/full/accenture-mega-analitics-consumer-2013-2015-english-1 5/40
Copyright © 2013 Accenture All rights reserved. 5
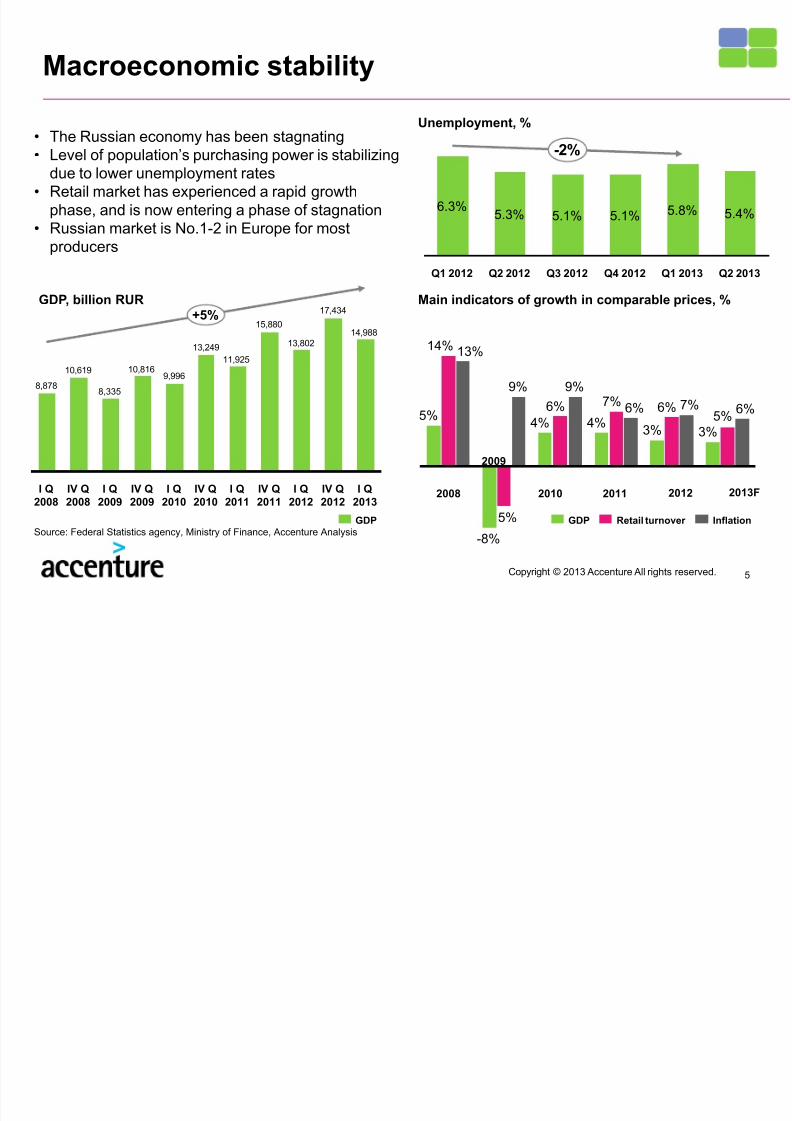
Macroeconomic stability
14,988
17,434
13,802
15,880
11,925
13,249
9,99610,816
8,335
10,619
8,878
+5%
I Q2013
IV Q2012
I Q2012
IV Q2011
I Q2011
IV Q2010
I Q2010
IV Q2009
I Q2009
IV Q2008
I Q2008
GDP
6%5%3%
7%6%
3%6%
7%
4%
9%
6%
4%
9%
5%
-8%
13%14%
5%
InflationRetail turnoverGDP
GDP, billion RUR Main indicators of growth in comparable prices, %
2008
2009
2010 2011 2012 2013F
-2%
Q2 2013
5.4%
Q1 2013
5.1% 5.8%
Q4 2012
5.1%
Q3 2012Q2 2012
5.3%
Q1 2012
6.3%
• The Russian economy has been stagnating• Level of population’s purchasing power is stabilizing
due to lower unemployment rates• Retail market has experienced a rapid growth
phase, and is now entering a phase of stagnation• Russian market is No.1-2 in Europe for most
producers
Source: Federal Statistics agency, Ministry of Finance, Accenture Analysis
Unemployment, %

7/17/2019 Accenture Mega Analitics Consumer 2013 2015 English (1)
http://slidepdf.com/reader/full/accenture-mega-analitics-consumer-2013-2015-english-1 6/40
Copyright © 2013 Accenture All rights reserved. 6
Russia now has a leading position in theEuropean retail market
• Thanks to enormous growth, as well as the
sheer size of the economy, Russia in 2012became the leader in retail turnover inEurope
• Ministry for Economic Development (MED)forecasts ~5-6% CAGR of retail turnover incomparable prices
2014F
+26%
23.8
+6%
55%
2015F
45%
47%
53%
2013F
22.6
54%
46%
2012
21.4
53%
47%
2011
19.1
52%
48%
2010
16.5
52%
48%
2009
14.6
55%51%
45%
49%
2006
25.2
8.7
13.9
55%
2007 2008
10.9
56%
44%
+14%
45%
Non-foodFood
Russian retail turnover, 2006-2015, trillion RUR
2011 2012 2013
Fact 16% 12% ?
MED forecast 5% 6.1% 5.2%
2014
5.2%(1 year prior period in comparableprices)
TOP-5 countries by retail turnover in2012, bln EURO
Russia 509.5
France 418.2
Germany 410.1
UK 377.6
Italy 253.1
Source: GFK, Federal Statistics Agency, MED forecast 2013-2015
7/17/2019 Accenture Mega Analitics Consumer 2013 2015 English (1)
http://slidepdf.com/reader/full/accenture-mega-analitics-consumer-2013-2015-english-1 7/40Copyright © 2013 Accenture All rights reserved. 7
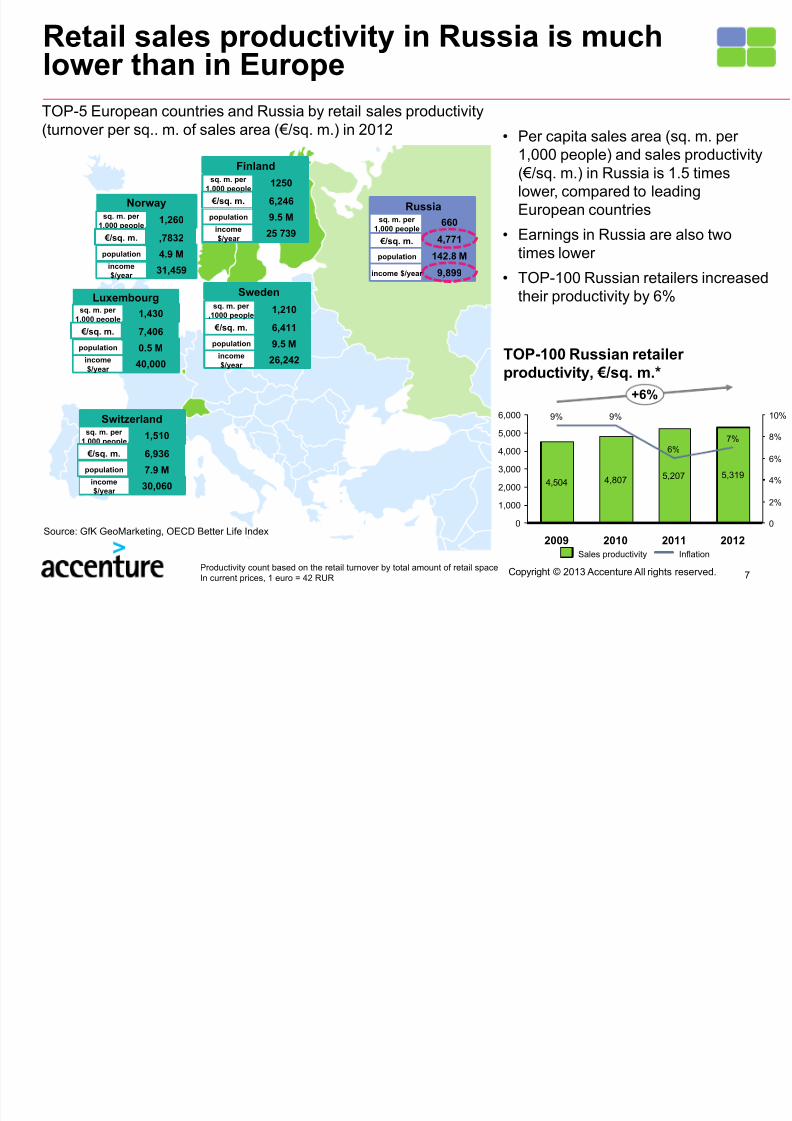
Retail sales productivity in Russia is muchlower than in Europe
4,504 4,807 5,207 5,319
0
1,000
2,000
3,000
4,000
5,000
6,000
8%
2%
4%
6%
+6%
2012
7%
2011
6%
2009
9% 9%
2010
0
10%
Norwaysq. m. per
1,000 people1,260
income
$/year31,459
population 4.9 M
Luxembourgsq. m. per
1,000 people1,430
income$/year
40,000
population 0.5 M
Switzerlandsq. m. per
1,000 people1,510
income$/year
30,060
population 7.9 M
€ /sq. m. ,7832
€ /sq. m. 7,406
€ /sq. m. 6,936
Swedensq. m. per
,1000 people1,210
income$/year
26,242
population 9.5 M
€ /sq. m. 6,411
Finlandsq. m. per
1,000 people1250
income$/year
25 739
population 9.5 M
€ /sq. m. 6,246Russia
sq. m. per1,000 people
660
income $/year 9,899
population 142.8 M
€ /sq. m. 4,771
TOP-5 European countries and Russia by retail sales productivity(turnover per sq.. m. of sales area ( €/sq. m.) in 2012
• Per capita sales area (sq. m. per1,000 people) and sales productivity( €/sq. m.) in Russia is 1.5 timeslower, compared to leadingEuropean countries
• Earnings in Russia are also twotimes lower
• TOP-100 Russian retailers increasedtheir productivity by 6%
TOP-100 Russian retailerproductivity, € /sq. m.*
Source: GfK GeoMarketing, OECD Better Life Index
Productivity count based on the retail turnover by total amount of retail spaceIn current prices, 1 euro = 42 RUR
InflationSales productivity

7/17/2019 Accenture Mega Analitics Consumer 2013 2015 English (1)
http://slidepdf.com/reader/full/accenture-mega-analitics-consumer-2013-2015-english-1 8/40
Consumer: expectations &preferences

7/17/2019 Accenture Mega Analitics Consumer 2013 2015 English (1)
http://slidepdf.com/reader/full/accenture-mega-analitics-consumer-2013-2015-english-1 9/409Copyright © 2013 Accenture All rights reserved.
Modern Russian Consumer – who is it?
493 RURI spend an average of onetrip to the store
Family
Security andWealth
Peace andJustice
30,245 RUR I received on average per month in 2013
43.5 K RURThe average amount currentpersonal loan/credit
The most important thing for me, and the importance of it is growing
Still important to me, but gradually their importance is decreasing
One of the most important words for me and over theyears their importance is growing
67%Consumers still love to goshopping and enjoy the shoppingprocess, but their volume is startingto decrease (fell by 1% comparedto 2011)
Source: Romir, FOM, Federal Statistics Agency, National Bureau of Credit Histories, GFK
7/17/2019 Accenture Mega Analitics Consumer 2013 2015 English (1)
http://slidepdf.com/reader/full/accenture-mega-analitics-consumer-2013-2015-english-1 10/40Copyright © 2013 Accenture All rights reserved. 10
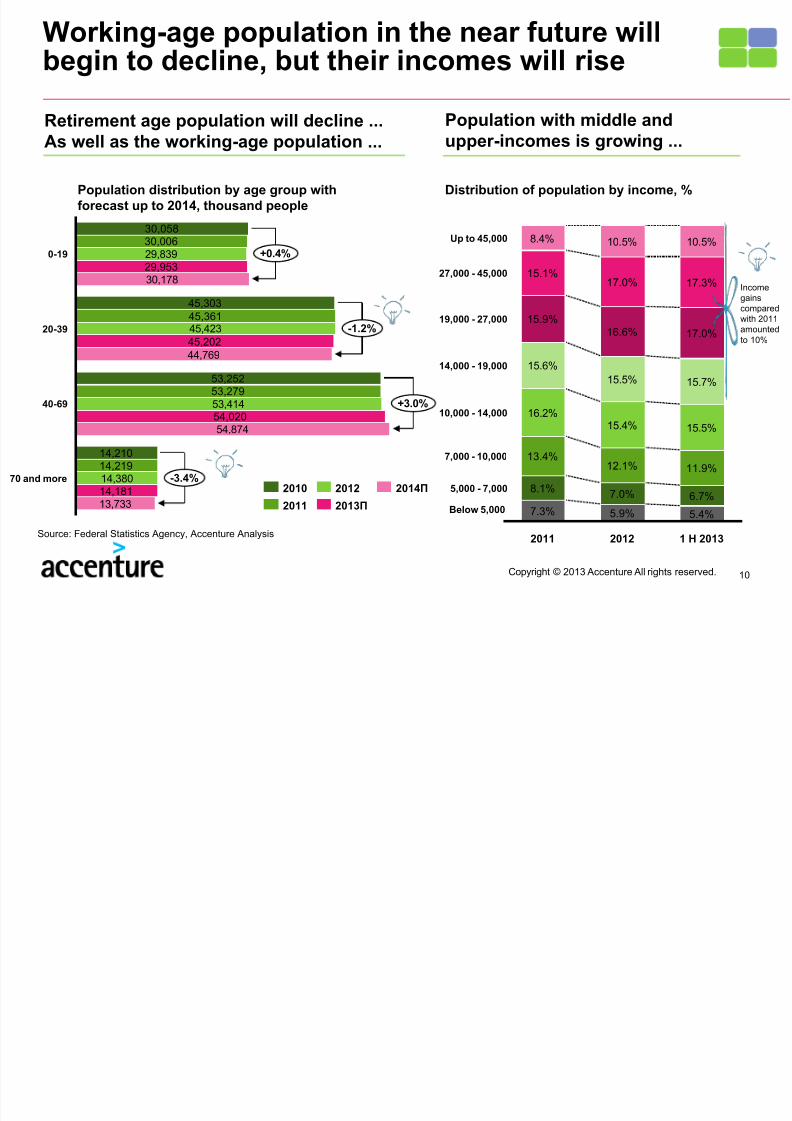
Working-age population in the near future willbegin to decline, but their incomes will rise
16.2%15.4% 15.5%
15.6%
15.5% 15.7%
8.4% 10.5% 10.5%
15.9%
15.1%
2012
17.0%
17.0%
5.9%
7.0%
12.1% 11.9%
16.6%
17.3%
2011
7.3%
8.1%
13.4%
Below 5,000
5,000 - 7,000
10,000 - 14,000
14,000 - 19,000
19,000 - 27,000
7,000 - 10,000
27,000 - 45,000
Up to 45,000
1 H 2013
5.4%
6.7%
Population with middle and
upper-incomes is growing ...
Distribution of population by income, %
Retirement age population will decline ...
As well as the working-age population ...
29,839
45,423
53,414
14,380
30,178
44,769
54,874
13,733
14,21914,210
-3.4%
+3.0%
-1.2%
+0.4%
14,181
45,36145,303
0-19
29,953
30,00630,058
40-69
54,020
70 and more
53,27953,252
20-39
45,202
2014П
2013П
2012
2011
2010
Population distribution by age group withforecast up to 2014, thousand people
Source: Federal Statistics Agency, Accenture Analysis
Incomegainscomparedwith 2011amountedto 10%

7/17/2019 Accenture Mega Analitics Consumer 2013 2015 English (1)
http://slidepdf.com/reader/full/accenture-mega-analitics-consumer-2013-2015-english-1 11/40Copyright © 2013 Accenture All rights reserved. 11
Income of Russian citizens is growing, but theywant to spend even more than they earn
30,245
26,62923,369
20,95218,63817,290
+14%
+12%
1 half2013
20122011201020092008
Average monthly income, RUR
1,922
1,534
1,7361,6191,588
1,252
316227
332270249181
Q2 2012Q1 2012
+27%
Q2 2013Q1 2013Q4 2012Q3 2012
Mortgage loansConsumer loans
Consumer and mortgage loans taken out during theperiod, billion RUR
11,72110,75410,478
10,0109,632
3,8663,8423,9233,8613,931
Q3 2012
1,2041,098
Q1 2012
1,046
+5%
Q1 2013
1,495
Q4 2012
1,337
Q2 2012
CashSecurititesSaving accounts
Accrued money savings, billion RUR
• Consumer income in 2013 has already grown by 14%
• Consumer loans have grown by 5% in Q2 2013compared to Q2 2012, and keep growing, mortgageloans have grown by 27%
• In 2013, consumers have increased savings, savingsaccounts have grown by 5%
• The volume of individuals with overdue loans in the Q22013 increased by 23%, compared to the same period
in 2012
Source: Federal Statistics agency, Accenture Analysis, Central Bank
7/17/2019 Accenture Mega Analitics Consumer 2013 2015 English (1)
http://slidepdf.com/reader/full/accenture-mega-analitics-consumer-2013-2015-english-1 12/40Copyright © 2013 Accenture All rights reserved. 12
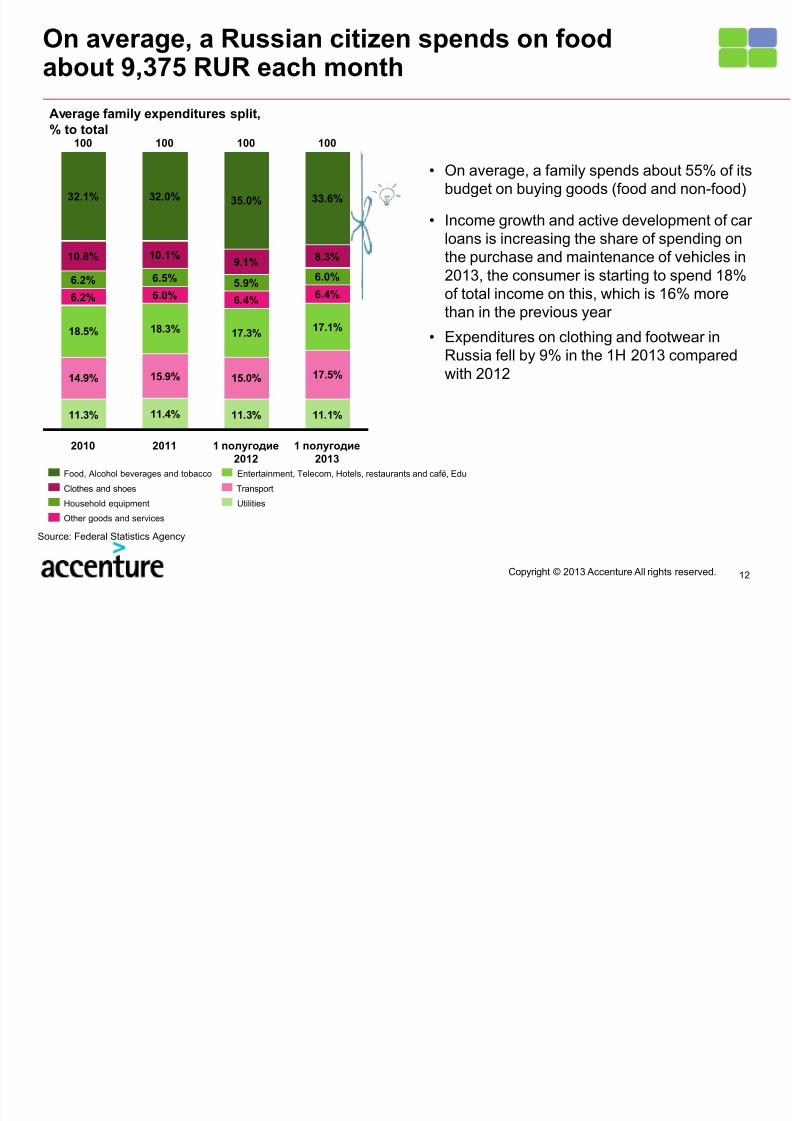
On average, a Russian citizen spends on foodabout 9,375 RUR each month
11.3% 11.4% 11.3% 11.1%
14.9% 15.9% 15.0% 17.5%
18.5% 18.3% 17.3% 17.1%
1 полугодие
2012
6.4%6.0%
8.3%
2011
35.0%
100
32.1%
1 полугодие
2013
5.9%
9.1%
6.2%
6.2%
100
10.8%
6.4%6.0%
10.1%
32.0%
6.5%
2010
100 100
33.6%
Utilities
Entertainment, Telecom, Hotels, restaurants and café, Edu
Other goods and services
Household equipment
Food, Alcohol beverages and tobacco
Clothes and shoes Transport
Average family expenditures split,% to total
Source: Federal Statistics Agency
• On average, a family spends about 55% of itsbudget on buying goods (food and non-food)
• Income growth and active development of carloans is increasing the share of spending onthe purchase and maintenance of vehicles in
2013, the consumer is starting to spend 18%of total income on this, which is 16% morethan in the previous year
• Expenditures on clothing and footwear inRussia fell by 9% in the 1H 2013 comparedwith 2012

7/17/2019 Accenture Mega Analitics Consumer 2013 2015 English (1)
http://slidepdf.com/reader/full/accenture-mega-analitics-consumer-2013-2015-english-1 13/4013Copyright © 2013 Accenture All rights reserved.
0
10
20
3040
50
60
70
80
Q2 2008
70.39%64.00%
71.59%
Q4 20102009
66.67%69.59%
Q4 2008 Q3 2011
66.86%
-6.61%
Q2 2012
Price is still the most important factor duringpurchase decisions for the consumer in Russia
Source: GFK Omnibus consumer habits
Responses to the questions:1. Price is the most important thing in making decision to buy2. I am willing to purchase essentials in several stores, if this will get me a better price and greater choice
Consumer is less ready to spend timesearching for the best deal*
0
10
20
3040
50
60
70
80
+12.38%
Q3 2011
65.55%
Q4 2010
69.90%
2009
72.46%
Q4 2008
70.15%
Q2 2008
73.67%
Q2 2012
66.03%
2007
72.13%
Price is the most important thing while buying goods*
While buying goods the most importantthing is the price*
% of those who agree % of those who agree
• 73.7% of consumers consider price as the most important thing in making decision to buy a good,with strong upward trend (growth rate of those who agreed is 12.4%)
• 66% of consumers are ready to spend additional time on searching for the best price and comparingprice in different places in order to make the best deal. This trend is declining, which can beexplained by the expansion of discounters and convenience stores.
I analyze the
price first
I won’t waste my
time looking for thelowest price
I am ready to try a new place for a better price*

7/17/2019 Accenture Mega Analitics Consumer 2013 2015 English (1)
http://slidepdf.com/reader/full/accenture-mega-analitics-consumer-2013-2015-english-1 14/4014Copyright © 2013 Accenture All rights reserved.
A lower price is more important to the consumerthan the communication with him, which cannot be saidabout the price
68%
28%4%
Neither Agree nor Disagree
Strongly Disagree – Disagree
Agree
32%28%
41%
50%37%
13%8%
54%
38%
The consumer is not willing to sacrificequality for price ...
The consumer is indifferent tocommunications with him ...
The buyer does not compare the price andthe assortment when making a choice ...
The level of service for the consumer isalmost as important as the quality *
* Response to the statement : I am willing to acceptlower levels of product quality, if it ensures I get thelowest price
* Response to the statement : I am willing to acceptlower frequency of communications, if it ensures Iget the lowest price
* Response to the statement : I am willing to acceptlower levels of customer service, if it ensures I getthe lowest price
* Response to the statement : I am willing to acceptlower levels of product ,if it ensures I get the lowestprice
Source: Accenture Consumer Pulse 2012
7/17/2019 Accenture Mega Analitics Consumer 2013 2015 English (1)
http://slidepdf.com/reader/full/accenture-mega-analitics-consumer-2013-2015-english-1 15/4015Copyright © 2013 Accenture All rights reserved.
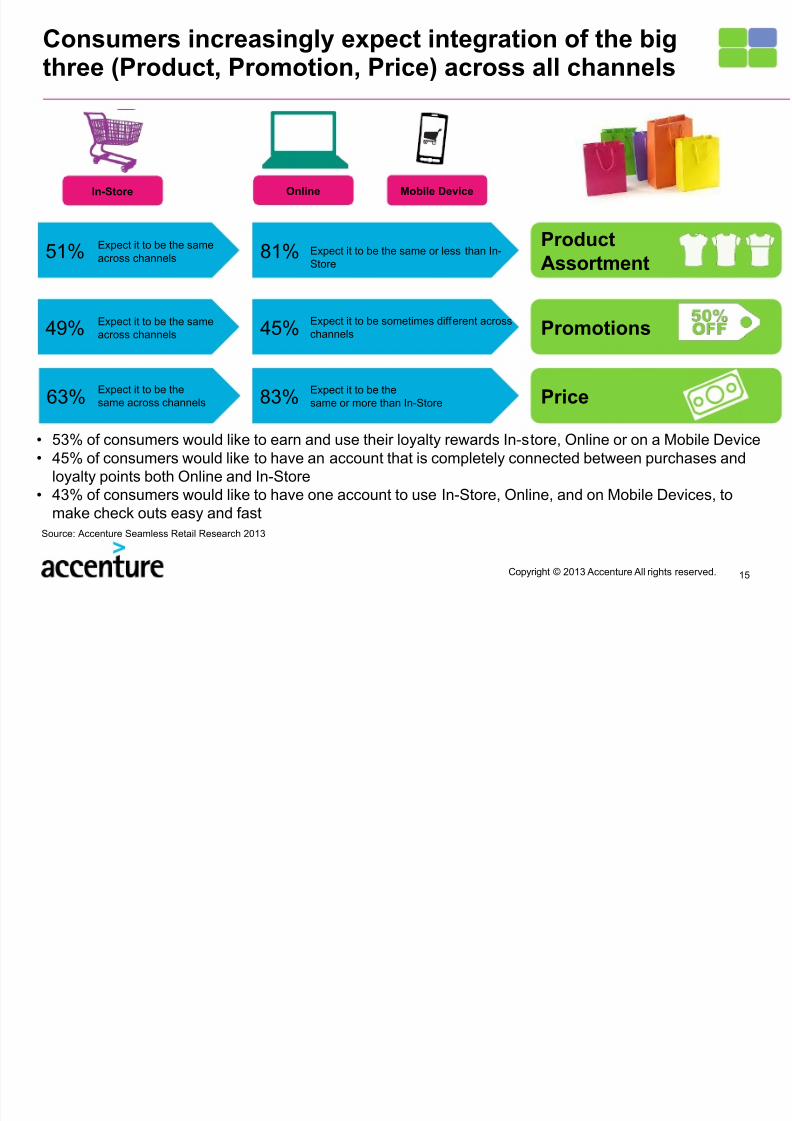
Consumers increasingly expect integration of the bigthree (Product, Promotion, Price) across all channels
In-Store Mobile DeviceOnline
ProductAssortment
Promotions
Price
51% 81%Expect it to be the sameacross channels
Expect it to be the same or less than In-Store
63% 83%Expect it to be thesame across channels
Expect it to be thesame or more than In-Store
49% 45%Expect it to be the sameacross channels
Expect it to be sometimes different acrosschannels
• 53% of consumers would like to earn and use their loyalty rewards In-store, Online or on a Mobile Device• 45% of consumers would like to have an account that is completely connected between purchases and
loyalty points both Online and In-Store• 43% of consumers would like to have one account to use In-Store, Online, and on Mobile Devices, to
make check outs easy and fastSource: Accenture Seamless Retail Research 2013

7/17/2019 Accenture Mega Analitics Consumer 2013 2015 English (1)
http://slidepdf.com/reader/full/accenture-mega-analitics-consumer-2013-2015-english-1 16/4016Copyright © 2013 Accenture All rights reserved.
Brand loyalty is still important, but it does notimply private labels do not have a bright future
98%
2%
Bulgaria Ukraine
99%
1%
Russia
89%
11%
Poland
82%
18%
CzechRepublic
79%
21%
Austria
73%
27%
National brandsPrivate labels
Share of private labels in Russia and Europe, %
Source: GFK, AC Nielsen Households Research Panel
0
20
40
60
80
100 -3%
Q2 2012
69%
Q3 2011
65%
Q4 2010
70%
2009
62%
Q4 2008
73%
Q2 2008
72%
2007
79%
2005
83%
Consumers prefer well-known brands to unknown
products*, % of those who agree
Brand-named goods are better than no-name goods
Response to the question:1. Well-known brand name goods are better than no-name goods
• Russian consumers have to constantly weigh their choice of brand versus private label. As wesee from the graph above, consumer preference for well-known brands is highly related to theeconomic conditions (lower during an economic downturn). Currently, the consumer would ratherchoose a well-known brand, and his/her intentions have become stronger during the last period
• 60% of respondents have already decided on the brand to buy before they come to the store• Despite strong adherence to well-known brands, Russians are ready to buy retailers’ private
labels as we can see from the growth of private labels turnover of 29.6% in 2012, compared to2011.
C till tl d f th i f ti

7/17/2019 Accenture Mega Analitics Consumer 2013 2015 English (1)
http://slidepdf.com/reader/full/accenture-mega-analitics-consumer-2013-2015-english-1 17/40
17Copyright © 2013 Accenture All rights reserved.
Consumers still mostly use word-of-mouth informationfrom family and friends, but with internet penetration,
online sources are growing in popularity
86% of consumers seek advice of theirrelatives and friends before making adecision to buy, 60% of these usually follow
this advice
Usage of information (% of consumers using the channel whilechoosing and making a purchase)
Usage of information sources varies withproduct category
Main info sources forsupermarkets
Main info sources for electronics Main info sources for apparel
?
21
23
31
Off line catalogues, leaflets
Word-of-mouth fromfamily and friends
Retailer corporate site
34
44
55
Search engines
Product comparison site
Retailer corporate site
29
34
37
Word-of-mouth fromfamily and friends
In store display or demo
Manufacturer corporate site
42
54
56
60
64
70
72
73
86
Online ads through banner ads,pop-up ads, etc.
Online ads in search enginesGoogle, Yandex, etc.
TV or radio ad
Online information from Social Media(Twitter, Facebook)
Print ads (newspaper, magazine)
In store information from sales peopleor displays
Corporate web site(company, brand or product website)
Online information from sources likeexpert review sites
Word-of-mouth informationfrom people I know
Source: 2012 Accenture Global Consumer Research Russia, Locata, GFK

7/17/2019 Accenture Mega Analitics Consumer 2013 2015 English (1)
http://slidepdf.com/reader/full/accenture-mega-analitics-consumer-2013-2015-english-1 18/40
18Copyright © 2013 Accenture All rights reserved.
Consumer expects retailers to deliver on theirpromise
83% of consumers feel frustrationwhen they do not get whatwas promised from acompany
78% of consumers will switchto another seller in suchcase
Source: Accenture Consumer Pulse
The consumer constantly monitors the company and its promises, and cares more about relations to his\her needs*
58%
47%
63%
83%
76%
74%
29%
47%
Promised one thing but delivered another
Employees are not knowledgeable or do not acknowledgeconsumer’s specific needs when considering a purchase
Company does not make it easy to do business with them
Unable to access information or buy a product/service usingmultiple channels
The company asks me the same questions or market s to me
the same offer againInconsistent offers through different channels when shopping
for the same product or service
The company is not using personal information to makeinteractions and offers more relevant
Inconsistent experience of treatment when using differentchannels
Responses to the question:1. For each of the following situations, please indicate the extent to which you personallyfind frustrating, and affect your buying choices?
7/17/2019 Accenture Mega Analitics Consumer 2013 2015 English (1)
http://slidepdf.com/reader/full/accenture-mega-analitics-consumer-2013-2015-english-1 19/40
19Copyright © 2013 Accenture All rights reserved.
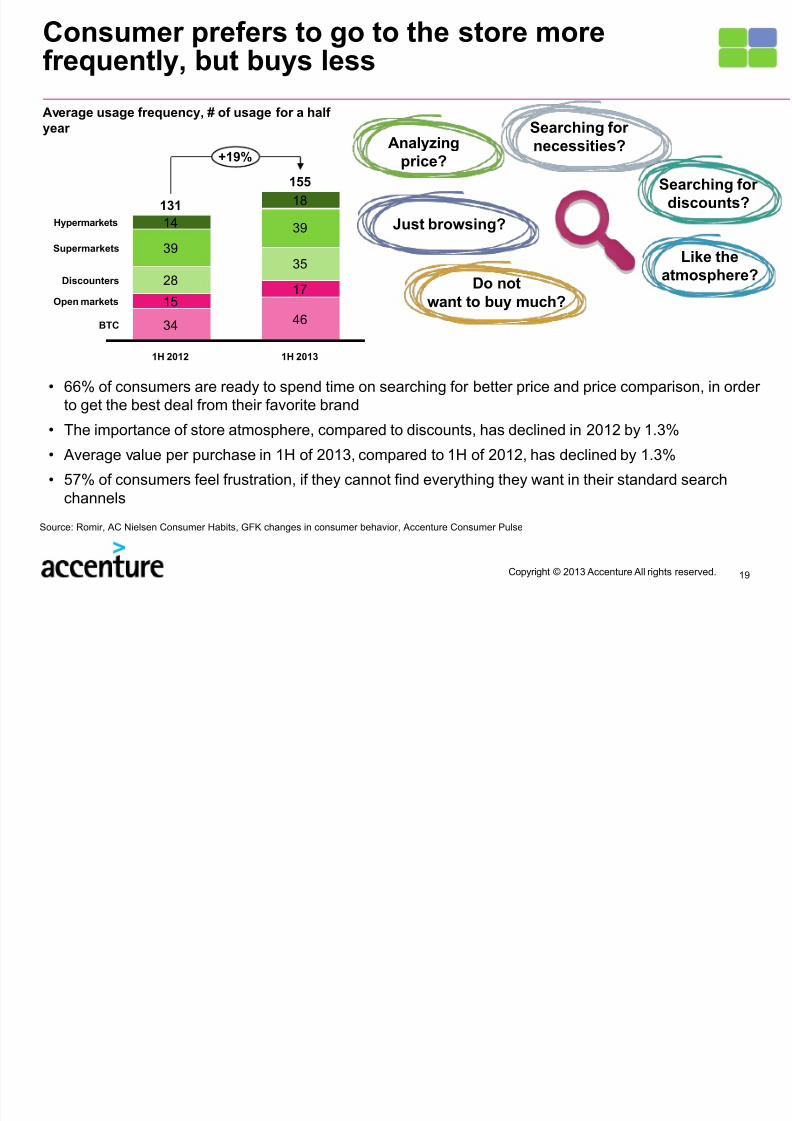
Consumer prefers to go to the store morefrequently, but buys less
34 46
28
35
39
39
Supermarkets
+19%
Hypermarkets
BTC
1H 2013
Open markets
155
Discounters17
18
1H 2012
131
15
14
Average usage frequency, # of usage for a halfyear
Source: Romir, AC Nielsen Consumer Habits, GFK changes in consumer behavior, Accenture Consumer Pulse
• 66% of consumers are ready to spend time on searching for better price and price comparison, in orderto get the best deal from their favorite brand
• The importance of store atmosphere, compared to discounts, has declined in 2012 by 1.3%
• Average value per purchase in 1H of 2013, compared to 1H of 2012, has declined by 1.3%
• 57% of consumers feel frustration, if they cannot find everything they want in their standard searchchannels
Do notwant to buy much?
Like the
atmosphere?
Analyzingprice?
Just browsing?
Searching fordiscounts?
Searching for
necessities?
7/17/2019 Accenture Mega Analitics Consumer 2013 2015 English (1)
http://slidepdf.com/reader/full/accenture-mega-analitics-consumer-2013-2015-english-1 20/40
20Copyright © 2013 Accenture All rights reserved.
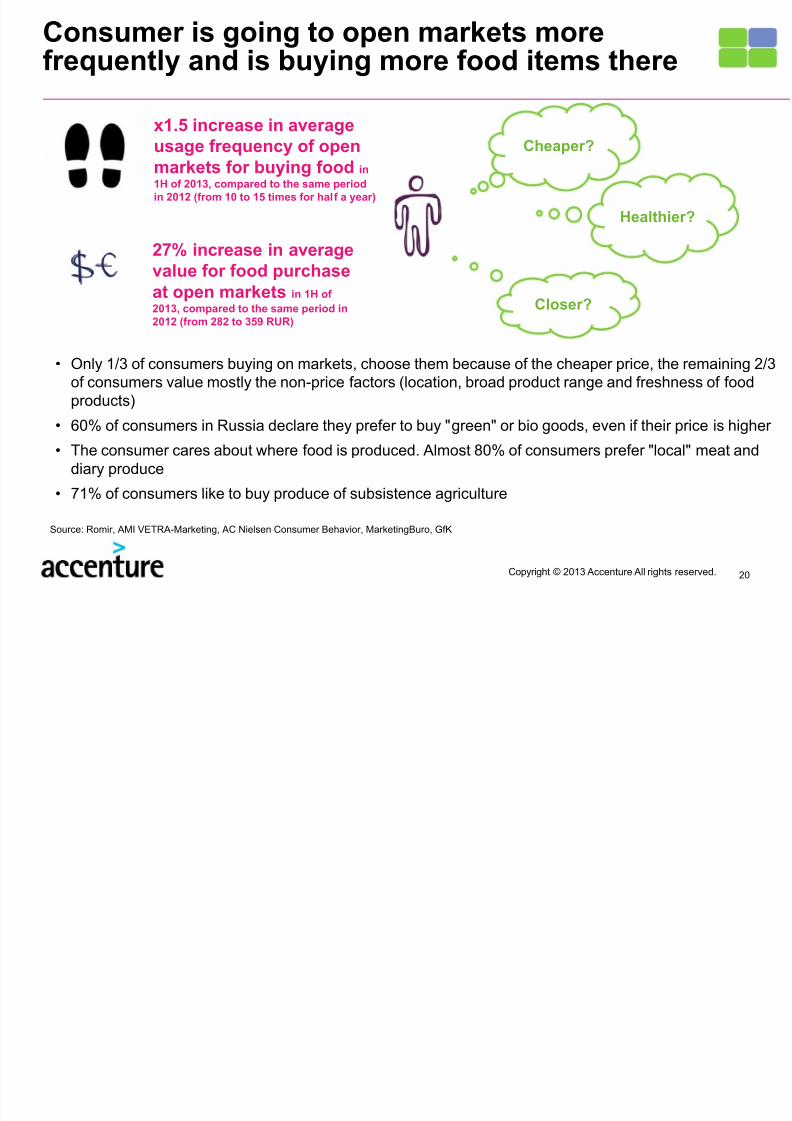
Consumer is going to open markets morefrequently and is buying more food items there
x1.5 increase in average
usage frequency of openmarkets for buying food in
1H of 2013, compared to the same periodin 2012 (from 10 to 15 times for half a year)
27% increase in average
value for food purchaseat open markets in 1H of
2013, compared to the same period in2012 (from 282 to 359 RUR)
Cheaper?
Healthier?
Closer?
• Only 1/3 of consumers buying on markets, choose them because of the cheaper price, the remaining 2/3of consumers value mostly the non-price factors (location, broad product range and freshness of foodproducts)
• 60% of consumers in Russia declare they prefer to buy "green" or bio goods, even if their price is higher
• The consumer cares about where food is produced. Almost 80% of consumers prefer "local" meat anddiary produce
• 71% of consumers like to buy produce of subsistence agriculture
Source: Romir, AMI VETRA-Marketing, AC Nielsen Consumer Behavior, MarketingBuro, GfK
7/17/2019 Accenture Mega Analitics Consumer 2013 2015 English (1)
http://slidepdf.com/reader/full/accenture-mega-analitics-consumer-2013-2015-english-1 21/40
21Copyright © 2013 Accenture All rights reserved.
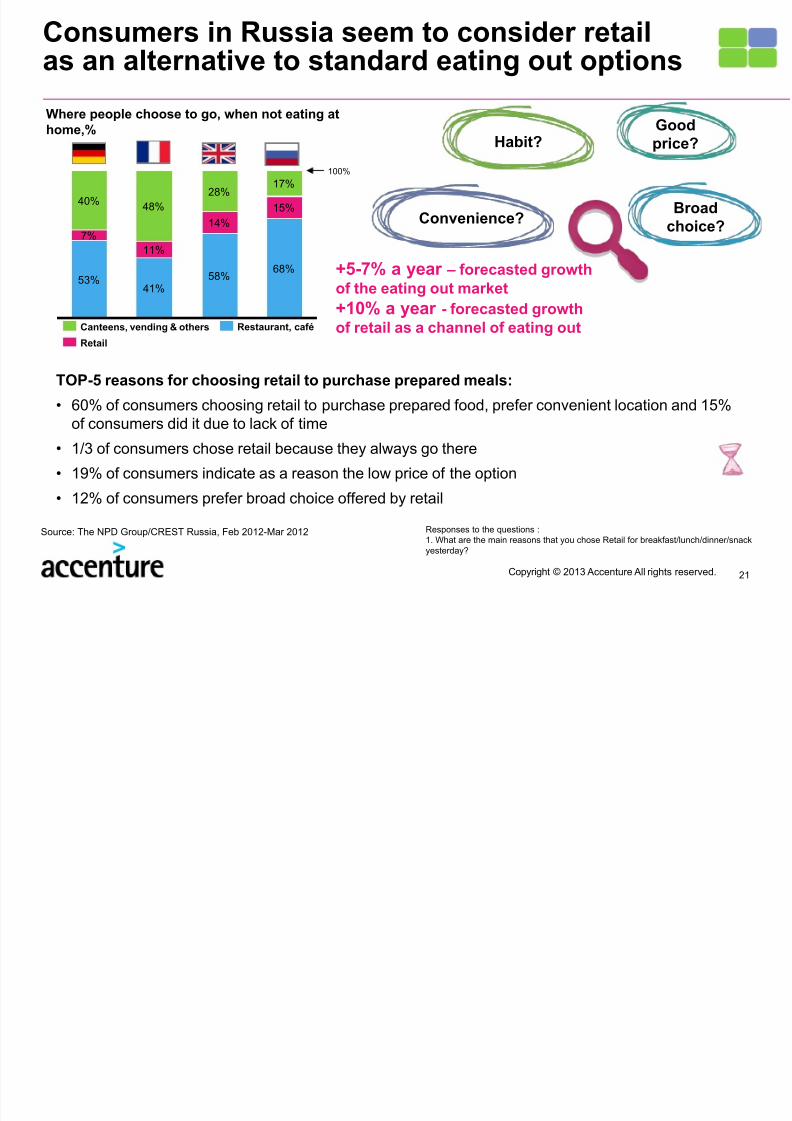
Consumers in Russia seem to consider retailas an alternative to standard eating out options
40%48%
28%17%
100%
68%
15%
58%
14%
41%
11%
53%
7%
Where people choose to go, when not eating athome,%
Broadchoice?
Habit?
Convenience?
Good
price?
Restaurant, café
Retail
Canteens, vending & others
TOP-5 reasons for choosing retail to purchase prepared meals:
• 60% of consumers choosing retail to purchase prepared food, prefer convenient location and 15%of consumers did it due to lack of time
• 1/3 of consumers chose retail because they always go there
• 19% of consumers indicate as a reason the low price of the option
• 12% of consumers prefer broad choice offered by retail
Source: The NPD Group/CREST Russia, Feb 2012-Mar 2012
+5-7% a year – forecasted growthof the eating out market
+10% a year - forecasted growthof retail as a channel of eating out
Responses to the questions :1. What are the main reasons that you chose Retail for breakfast/lunch/dinner/snackyesterday?
7/17/2019 Accenture Mega Analitics Consumer 2013 2015 English (1)
http://slidepdf.com/reader/full/accenture-mega-analitics-consumer-2013-2015-english-1 22/40
Retail in Russia:channels dynamic
7/17/2019 Accenture Mega Analitics Consumer 2013 2015 English (1)
http://slidepdf.com/reader/full/accenture-mega-analitics-consumer-2013-2015-english-1 23/40
Copyright © 2013 Accenture All rights reserved. 23
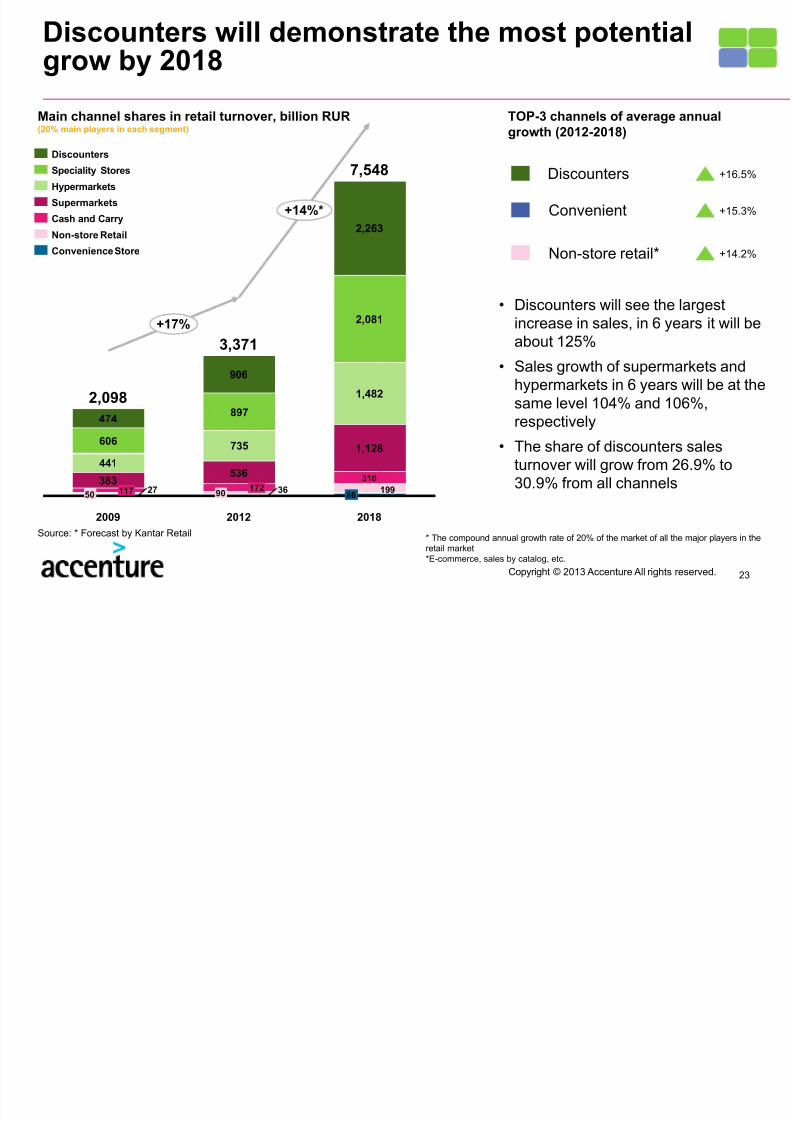
Discounters will demonstrate the most potentialgrow by 2018
Main channel shares in retail turnover, billion RUR(20% main players in each segment)
TOP-3 channels of average annualgrowth (2012-2018)
Discounters +16.5%
Convenient +15.3%
Non-store retail* +14.2%
• Discounters will see the largestincrease in sales, in 6 years it will beabout 125%
• Sales growth of supermarkets andhypermarkets in 6 years will be at thesame level 104% and 106%,
respectively
• The share of discounters salesturnover will grow from 26.9% to30.9% from all channels
Source: * Forecast by Kantar Retail
441
735606
897
3627 199
+14%*
+17%
2018
7,548
86
310
1,128
1,482
2,081
2,263
2012
3,371
90172
536
906
2009
2,098
50 117383
474
Convenience Store
Non-store Retail
Cash and Carry
Supermarkets
Hypermarkets
Speciality Stores
Discounters
* The compound annual growth rate of 20% of the market of all the major players in theretail market
*E-commerce, sales by catalog, etc.

7/17/2019 Accenture Mega Analitics Consumer 2013 2015 English (1)
http://slidepdf.com/reader/full/accenture-mega-analitics-consumer-2013-2015-english-1 24/40
Copyright © 2013 Accenture All rights reserved. 24
Hypermarkets have become the most fast-growing saleschannel in 1H 2013, thanks to rising average frequency
• Hypermarkets have become the most fast-growing channel in 1H 2013, due to rising penetration rate and
average usage frequency
• Modern retail is losing its share in the 1H of 2013, which is connected to rising popularity of open foodmarkets average usage frequency, and the greater variety of food offered there
• In 1H of 2013, average usage frequency of hypermarkets has increased with slightly decreasing averagevalue per purchase
Channel share in consumer expenditures and keydrivers in 1H 2013, %
Channel share
0.87%
-1.17%
# SKU
7.69%
-1.37%
Average valueper purchase
-4.63%
2.97%
Averagefrequency
22.90%
15.67%Traditional trade
Modern trade
Main indicators change in 1H 2013 to 1H 2012, %
Source: Romir
5.20%6.10%
4.00%
16.30%
3.00%
6.10%
9.30%
0
1
2
3
4
5
6
7
8
9
0 500 1,000 1,500 2,000
Average valueper purchase,RUR
DIY
1.20%Electronics
DrogeryClothing and footwear
E-commerce
Open markets
Discounter
13.80%
BTC
Supermarket
16.70%
Hypermarket
Averagefrequency,per month
7/17/2019 Accenture Mega Analitics Consumer 2013 2015 English (1)
http://slidepdf.com/reader/full/accenture-mega-analitics-consumer-2013-2015-english-1 25/40
25Copyright © 2013 Accenture All rights reserved.
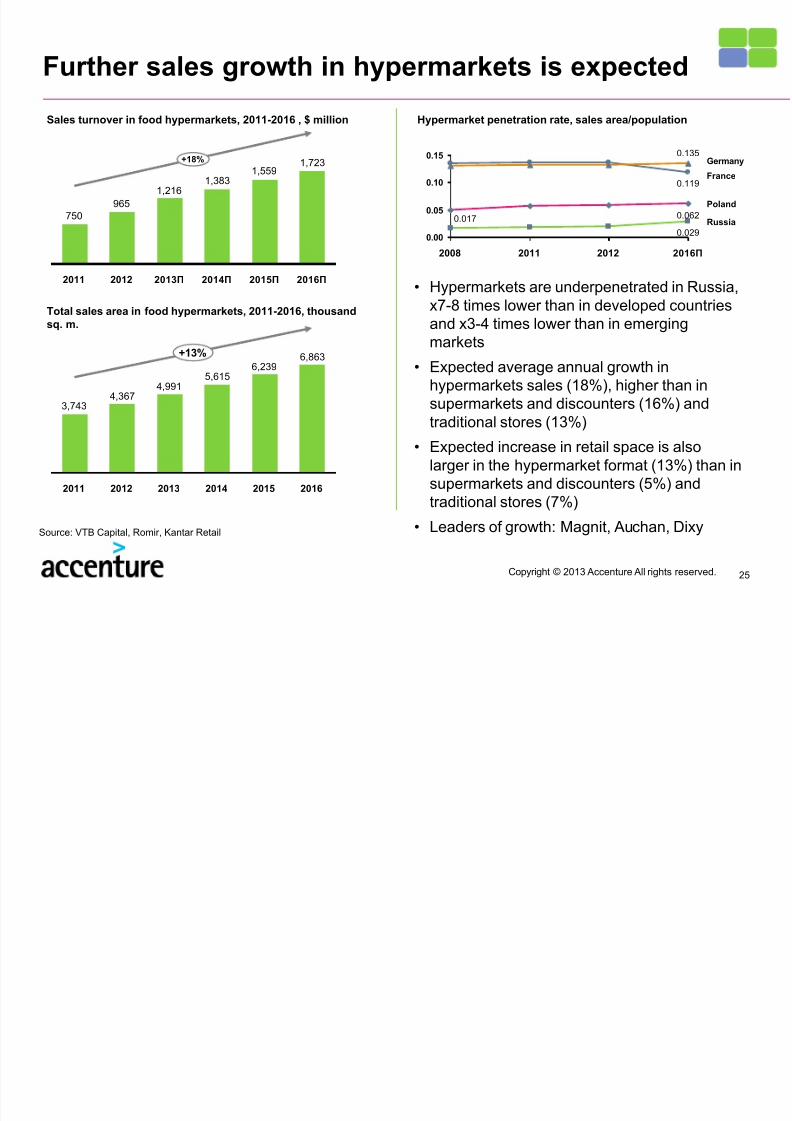
Further sales growth in hypermarkets is expected
• Hypermarkets are underpenetrated in Russia,x7-8 times lower than in developed countriesand x3-4 times lower than in emergingmarkets
• Expected average annual growth inhypermarkets sales (18%), higher than insupermarkets and discounters (16%) and
traditional stores (13%)
• Expected increase in retail space is alsolarger in the hypermarket format (13%) than insupermarkets and discounters (5%) andtraditional stores (7%)
• Leaders of growth: Magnit, Auchan, Dixy
Sales turnover in food hypermarkets, 2011-2016 , $ million
1,7231,559
1,3831,216
965
750
+18%
2016П 2015П 2014П 2013П 20122011
6,8636,239
5,6154,991
4,3673,743
+13%
201620152014201320122011
Total sales area in food hypermarkets, 2011-2016, thousandsq. m.
0.119
0.135
0.062
0.029
0.017
0.00
0.05
0.10
0.15Germany
Poland
Russia
France
2016П 201220112008
Hypermarket penetration rate, sales area/population
Source: VTB Capital, Romir, Kantar Retail
7/17/2019 Accenture Mega Analitics Consumer 2013 2015 English (1)
http://slidepdf.com/reader/full/accenture-mega-analitics-consumer-2013-2015-english-1 26/40
26Copyright © 2013 Accenture All rights reserved.
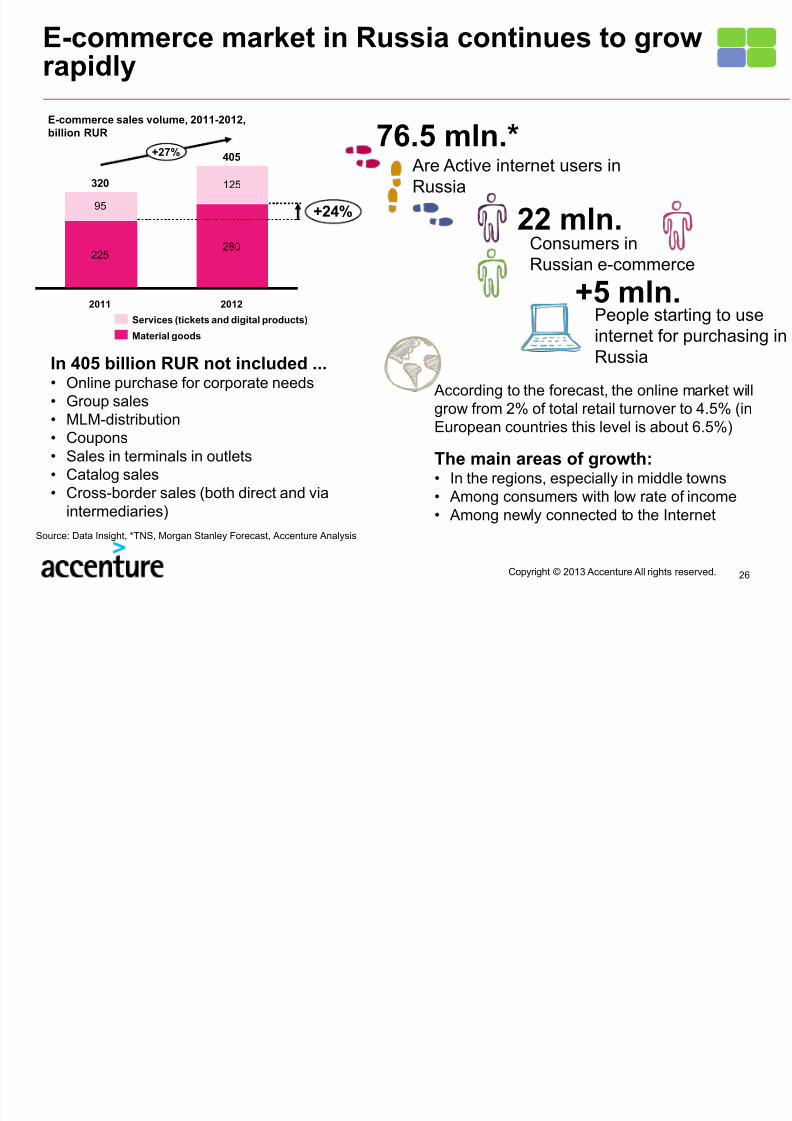
E-commerce market in Russia continues to growrapidly
95
125
+27% 405
+24%
2012
280
2011
320
225
Material goods
Services (tickets and digital products)
E-commerce sales volume, 2011-2012,billion RUR
In 405 billion RUR not included ...• Online purchase for corporate needs• Group sales
• MLM-distribution• Coupons• Sales in terminals in outlets• Catalog sales• Cross-border sales (both direct and via
intermediaries)
Source: Data Insight, *TNS, Morgan Stanley Forecast, Accenture Analysis
22 mln.Consumers inRussian e-commerce
+5 mln.People starting to useinternet for purchasing inRussia
The main areas of growth:• In the regions, especially in middle towns• Among consumers with low rate of income• Among newly connected to the Internet
According to the forecast, the online market willgrow from 2% of total retail turnover to 4.5% (inEuropean countries this level is about 6.5%)
76.5 mln.* Are Active internet users inRussia
7/17/2019 Accenture Mega Analitics Consumer 2013 2015 English (1)
http://slidepdf.com/reader/full/accenture-mega-analitics-consumer-2013-2015-english-1 27/40
Copyright © 2013 Accenture All rights reserved. 27
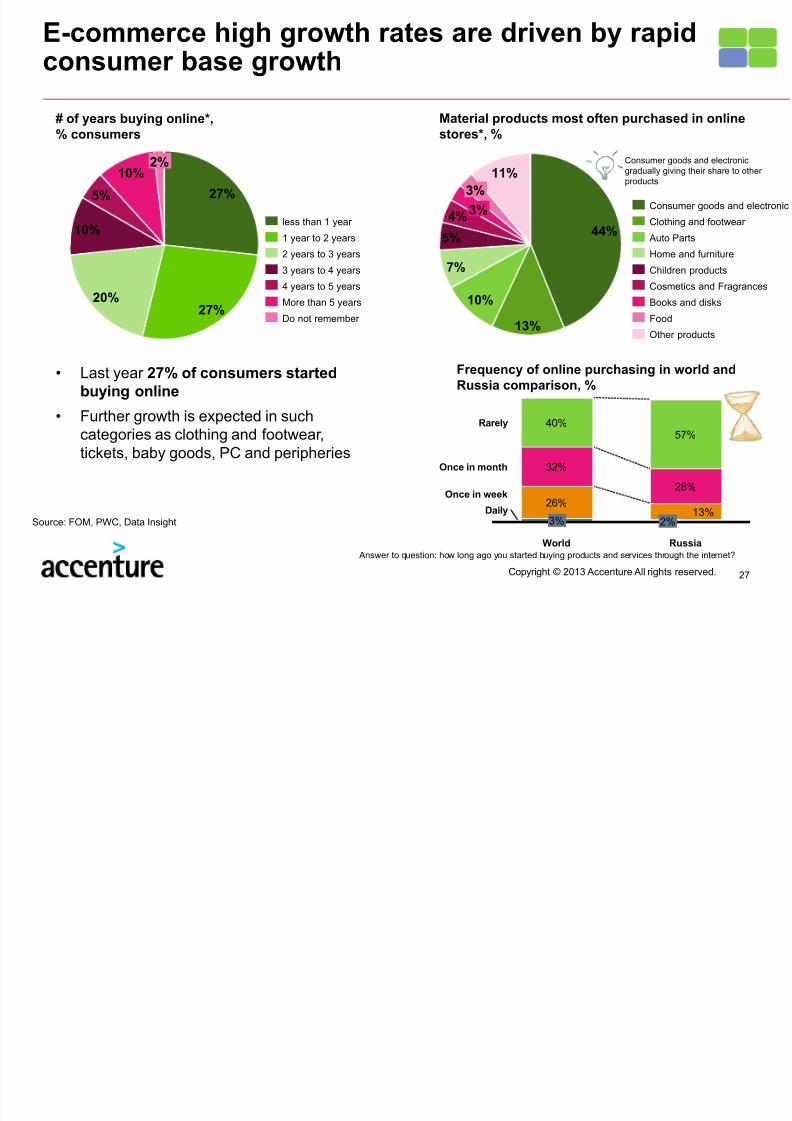
E-commerce high growth rates are driven by rapidconsumer base growth
20%27%
5%
2%
10%
10%
27%
4 years to 5 years
3 years to 4 years
Do not remember
2 years to 3 years
1 year to 2 years
More than 5 years
less than 1 year
# of years buying online*,% consumers
Answer to question: how long ago you started buying products and services through the internet?
Material products most often purchased in onlinestores*, %
Source: FOM, PWC, Data Insight
• Last year 27% of consumers startedbuying online
• Further growth is expected in suchcategories as clothing and footwear,tickets, baby goods, PC and peripheries
Frequency of online purchasing in world andRussia comparison, %
Daily
Rarely
Russia
2%
26%
3%13%
28%Once in week
57%
World
32%
40%
Once in month
7%
11%
10%
3%
3%4%
5%
13%
44%
Other products
Food
Books and disks
Cosmetics and Fragrances
Children products
Home and furniture
Auto Parts
Clothing and footwear
Consumer goods and electronic
Consumer goods and electronicgradually giving their share to otherproducts

7/17/2019 Accenture Mega Analitics Consumer 2013 2015 English (1)
http://slidepdf.com/reader/full/accenture-mega-analitics-consumer-2013-2015-english-1 28/40
28Copyright © 2013 Accenture All rights reserved.
Main e-commerce players are still representinga small part of entire e-commerce sales market
82%
18%
48% 52%
Remaining players
TOP-10 e-commerce stores
Level of e-commerce sales concentration, 2012
Russia USA
Market volume~$13 billion
Market volume~$184 billion
Source: Digital Guru, Data Insight, Accenture Analysis
• 5-8 million purchases (forpersonal use and not for resale)
during 2012• ~ 45 billion rubles of turnover(16% of sales of tangible goods)
• ~ 2 million consumers (10% oftotal)
• Purchases increase by morethan 50% in 2012
New global players on the Russian e-commercemarket :
Plans to double their performance in Russia
In the next 2.5 years, eBay plans to increase sales in Russiaby 4 times, and users by 6 times. Company turnover inRussia already has reached $400 million
Opened an office in RussiaCross-border shopping - thefastest growing and at the sametime the most unclear marketsegment
TOP-10 online stores turnover in 2012, $ billion/ year
188147150134
168231
187
493
297
774
211
947134
12768
286
115
290433
UtkonosKupiVip.ruOzonSvyaznoyExist.ruUlmart M.VideoBiglionSotmarketWilf-Berries
600
Holodilnik
2011
2012
7/17/2019 Accenture Mega Analitics Consumer 2013 2015 English (1)
http://slidepdf.com/reader/full/accenture-mega-analitics-consumer-2013-2015-english-1 29/40
Copyright © 2013 Accenture All rights reserved. 29
64
2
2
3
3
5
5
6
10
3
1
3
5
7
5
6
22
59
virtual bank card online
SMS
bank card upon receiving
internet banking
payment terminal
bank transfer in the bank
electronic money
bank card online
Cash upon receiving
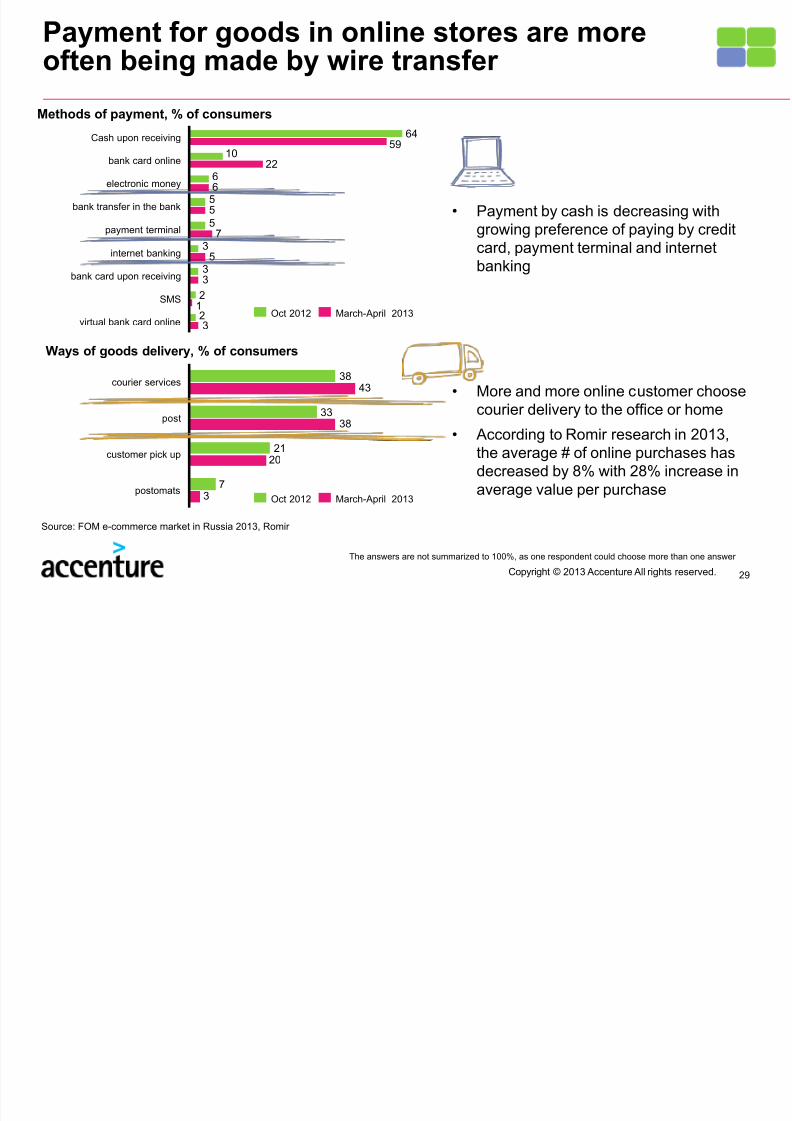
Payment for goods in online stores are moreoften being made by wire transfer
Methods of payment, % of consumers
March-April 2013Oct 2012
The answers are not summarized to 100%, as one respondent could choose more than one answer
• Payment by cash is decreasing withgrowing preference of paying by creditcard, payment terminal and internetbanking
• More and more online customer choosecourier delivery to the office or home
• According to Romir research in 2013,the average # of online purchases hasdecreased by 8% with 28% increase inaverage value per purchase
Ways of goods delivery, % of consumers
7
21
33
38
3
20
38
43
customer pick up
postomats
post
courier services
March-April 2013Oct 2012
Source: FOM e-commerce market in Russia 2013, Romir

7/17/2019 Accenture Mega Analitics Consumer 2013 2015 English (1)
http://slidepdf.com/reader/full/accenture-mega-analitics-consumer-2013-2015-english-1 30/40
Retail in Russia:segments dynamic
7/17/2019 Accenture Mega Analitics Consumer 2013 2015 English (1)
http://slidepdf.com/reader/full/accenture-mega-analitics-consumer-2013-2015-english-1 31/40
Copyright © 2013 Accenture All rights reserved. 31
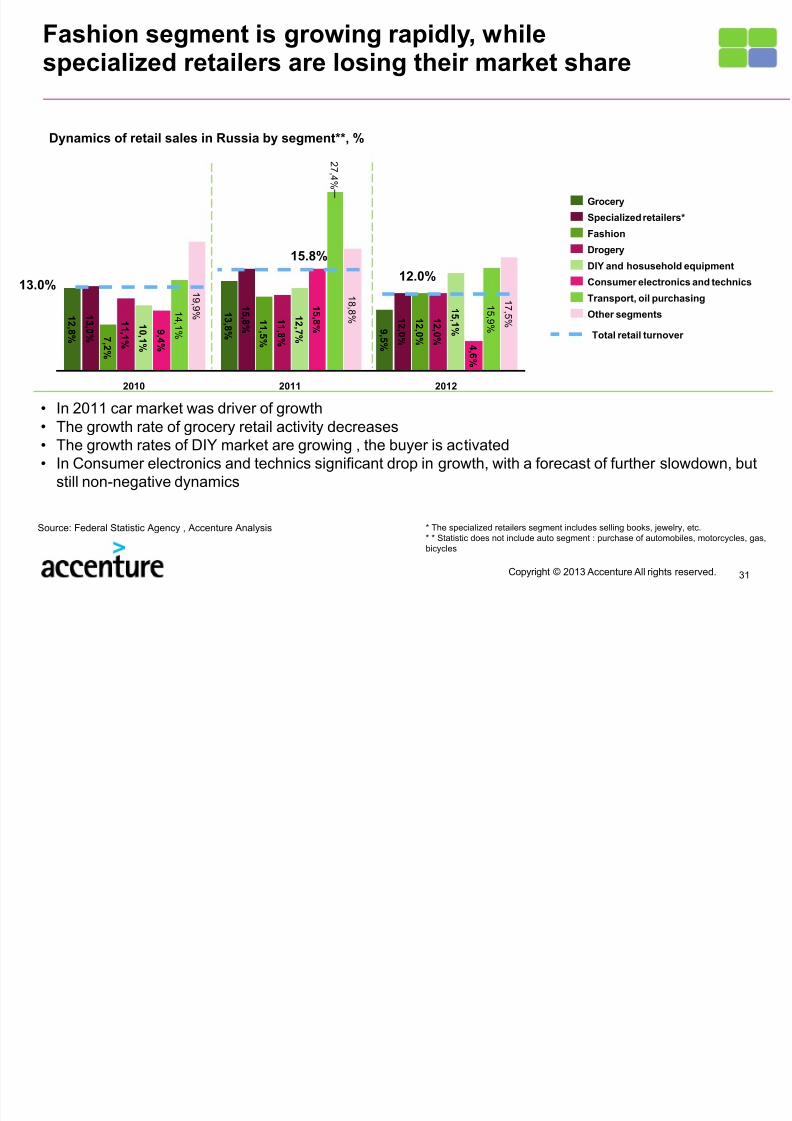
Fashion segment is growing rapidly, whilespecialized retailers are losing their market share
2012
1 7 , 5 %
1 5 , 9 %
4 , 6 %
1 5 ,1 %
1 2 , 0 %
1 2 , 0 %
1 2 , 0 %
9 , 5 %
2011
1 8 , 8 %
2 7 ,4 %
1 5 , 8 %
1 2 ,7 %
1 1 , 8 %
1 1 , 5 %
1 5 , 8 %
1 3 , 8 %
2010
1 9 , 9 %
1 4 ,1 %
9 ,4 %
1 0 ,1 %
1 1 ,1 %
7 ,2 %
1 3 , 0 %
1 2 , 8 %
Other segments
Transport, oil purchasing
Consumer electronics and technics
DIY and hosusehold equipment
Drogery
Fashion
Specialized retailers*
Grocery
Source: Federal Statistic Agency , Accenture Analysis
Dynamics of retail sales in Russia by segment**, %
• In 2011 car market was driver of growth• The growth rate of grocery retail activity decreases• The growth rates of DIY market are growing , the buyer is activated• In Consumer electronics and technics significant drop in growth, with a forecast of further slowdown, but
still non-negative dynamics
13.0%
15.8%
12.0%
Total retail turnover
* The specialized retailers segment includes selling books, jewelry, etc.* * Statistic does not include auto segment : purchase of automobiles, motorcycles, gas,bicycles

7/17/2019 Accenture Mega Analitics Consumer 2013 2015 English (1)
http://slidepdf.com/reader/full/accenture-mega-analitics-consumer-2013-2015-english-1 32/40
32Copyright © 2013 Accenture All rights reserved.
Grocery retail: the market growth rates of foodretail network are declining
The share and dynamics of grocery chains inthe total retail turnover, %
192022
14
23
34
42
0
5
10
15
20
25
30
35
40
45
0.03
0.10
0.00
0.04
0.05
0.06
0.07
0.08
0.09
0.01
0.02
2013П
14%
2012
15%
2011
12%
2006
11%
2010
13%
2009
13%
2008
15
11%
2007
14%
Share in retail turnover, % Growth rate, %
• The entire food market grew by 8.7% in2012, mainly due to inflation
• In retail turnover in 2012, the share offood retail chains is about 15%, 1 p.p.increase compared to 2011. But in 2013,1% decline is forecasted due to slowergrowth rates of 18-19%
• In the first half of 2013, the leader of foodretail has changed. The new leaderMagnit has overcome the X5 RetailGroup, not only by the number of stores,
but also by sales
Source: RBC Research, Romir
Decline in theshare by 1%
BillionRUR
DIY and Household retail: dynamic market share
7/17/2019 Accenture Mega Analitics Consumer 2013 2015 English (1)
http://slidepdf.com/reader/full/accenture-mega-analitics-consumer-2013-2015-english-1 33/40
33Copyright © 2013 Accenture All rights reserved.
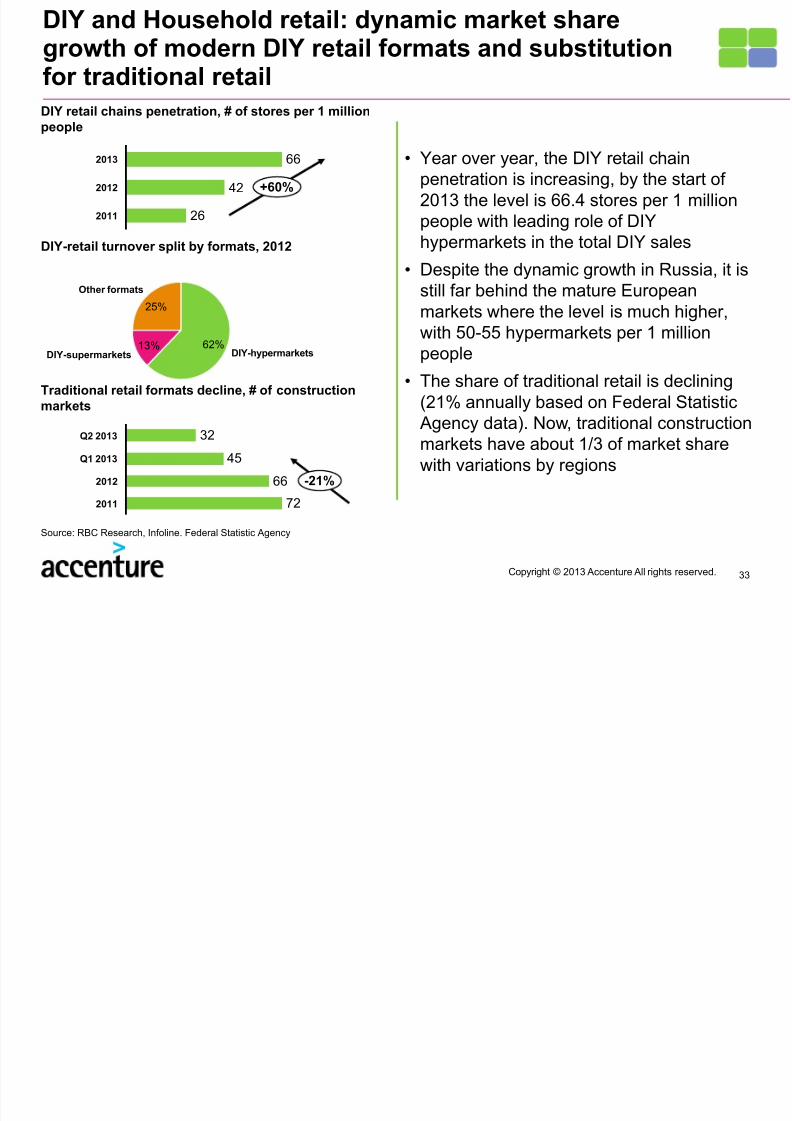
DIY and Household retail: dynamic market sharegrowth of modern DIY retail formats and substitutionfor traditional retailDIY retail chains penetration, # of stores per 1 millionpeople
• Year over year, the DIY retail chainpenetration is increasing, by the start of2013 the level is 66.4 stores per 1 millionpeople with leading role of DIYhypermarkets in the total DIY sales
• Despite the dynamic growth in Russia, it isstill far behind the mature Europeanmarkets where the level is much higher,with 50-55 hypermarkets per 1 millionpeople
• The share of traditional retail is declining(21% annually based on Federal Statistic
Agency data). Now, traditional constructionmarkets have about 1/3 of market sharewith variations by regions
DIY-hypermarkets
Other formats
13%
25%
DIY-supermarkets62%
26
42
66
2011
+60%2012
2013
DIY-retail turnover split by formats, 2012
72
66
45
32Q2 2013
2011
2012
Q1 2013
-21%
Traditional retail formats decline, # of constructionmarkets
Source: RBC Research, Infoline. Federal Statistic Agency
DIY d H h ld t il i t ti l DIY h i

7/17/2019 Accenture Mega Analitics Consumer 2013 2015 English (1)
http://slidepdf.com/reader/full/accenture-mega-analitics-consumer-2013-2015-english-1 34/40
34Copyright © 2013 Accenture All rights reserved.
DIY and Household retail: international DIY chainskeep their leading positions in the segment
Top-3 DIY retailers, sales, billion RUR, 2012
• TOP-3 retailers in 2012 are international chains:Leroy Merlin, OBI, Castorama
• But leading positions vary by regions
• The regional expansion of majority of DIY chains isslowing (Castorama, OBI, Home Center, K-Rauta,“Starik Khottabych", "СSuperStroy", etc.)
• DIY retail market keeps consolidating, thecompetition between Russian and global markets isrising
• DIY retail logistics function has grown in 2012, dueto new distribution centers construction, suppliesautomatization and logistics outsourcing
21
35
77
CastoramaOBILeroy Merlin
7
7
8
14
7
10
17
0
7
8
13
6
16
18
0
2
8
11
10
8
5
Severo-Zapadny
Central
Dalnevostochny
Sibirsky
Urals
Yuzhny
Privolzhsky
Castorama
OBI
Leroy Merlin
% of consumers visited TOP-3 retailers by regions,
1H of 2013
Source: RBC.Research, Federal Statistic Agency
7/17/2019 Accenture Mega Analitics Consumer 2013 2015 English (1)
http://slidepdf.com/reader/full/accenture-mega-analitics-consumer-2013-2015-english-1 35/40
35Copyright © 2013 Accenture All rights reserved.
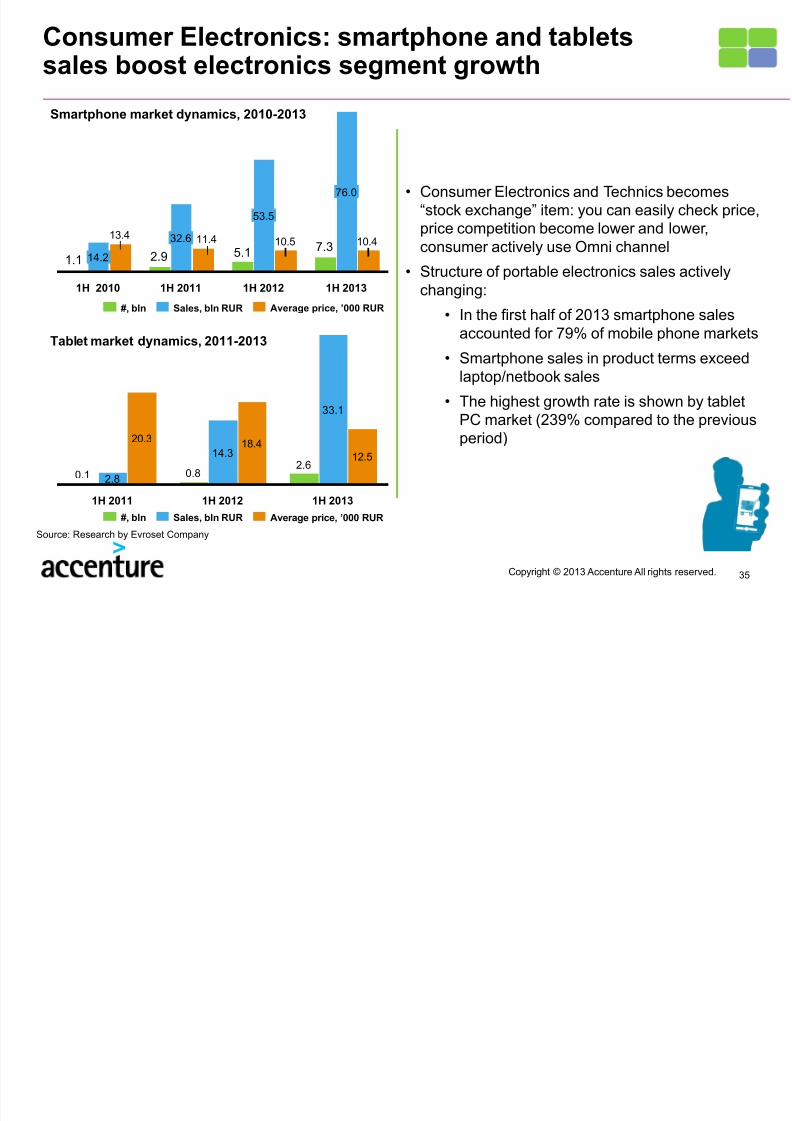
Consumer Electronics: smartphone and tabletssales boost electronics segment growth
• Consumer Electronics and Technics becomes“stock exchange” item: you can easily check price,
price competition become lower and lower,consumer actively use Omni channel
• Structure of portable electronics sales activelychanging:
• In the first half of 2013 smartphone salesaccounted for 79% of mobile phone markets
• Smartphone sales in product terms exceedlaptop/netbook sales
• The highest growth rate is shown by tablet
PC market (239% compared to the previousperiod)
Source: Research by Evroset Company
7.35.12.91.1
10.410.511.413.4
1H 2013
76.0
1H 2012
53.5
1H 2011
32.6
1H 2010
14.2
Average price, ’000 RUR Sales, bln RUR#, bln
20.318.4
12.52.6
0.80.1
1H 2013
33.1
1H 2012
14.3
1H 2011
2.8
Average price, ’000 RUR Sales, bln RUR#, bln
Tablet market dynamics, 2011-2013
Smartphone market dynamics, 2010-2013
F hi t il th t ti l i i ll
7/17/2019 Accenture Mega Analitics Consumer 2013 2015 English (1)
http://slidepdf.com/reader/full/accenture-mega-analitics-consumer-2013-2015-english-1 36/40
36Copyright © 2013 Accenture All rights reserved.
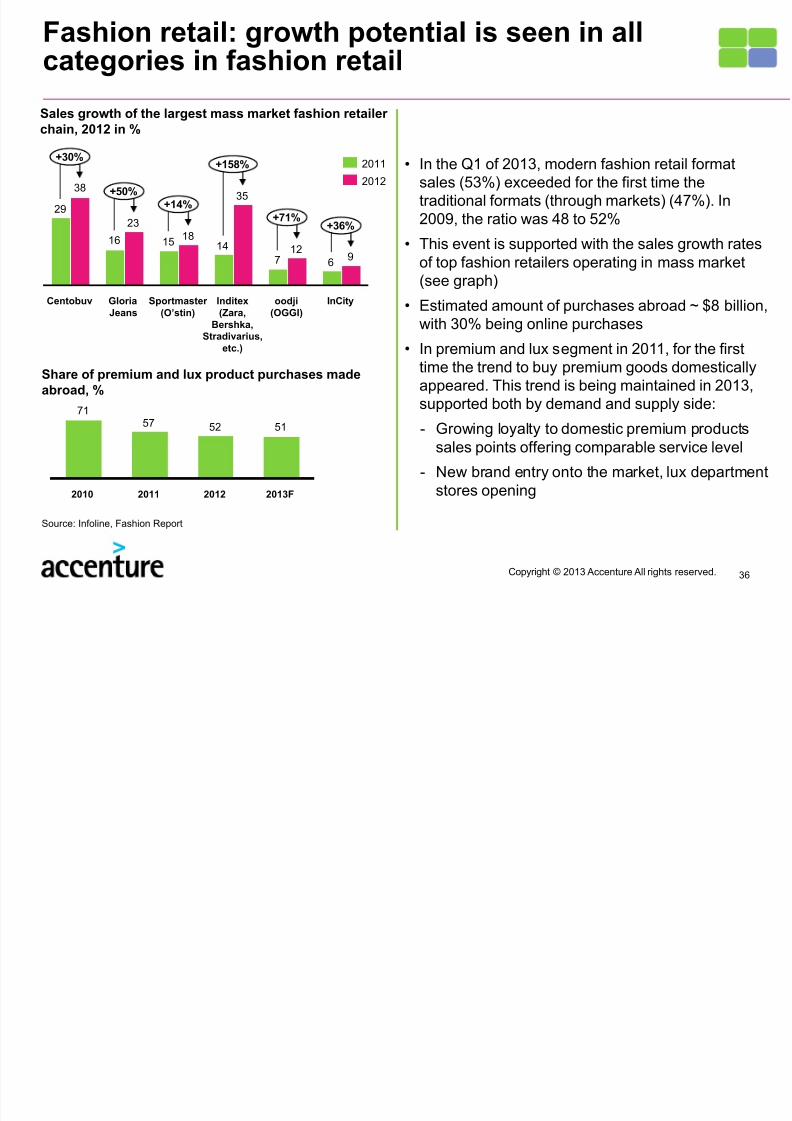
Fashion retail: growth potential is seen in allcategories in fashion retail
Share of premium and lux product purchases madeabroad, %
Sales growth of the largest mass market fashion retailerchain, 2012 in %
• In the Q1 of 2013, modern fashion retail formatsales (53%) exceeded for the first time thetraditional formats (through markets) (47%). In2009, the ratio was 48 to 52%
• This event is supported with the sales growth ratesof top fashion retailers operating in mass market
(see graph)• Estimated amount of purchases abroad ~ $8 billion,
with 30% being online purchases
• In premium and lux segment in 2011, for the firsttime the trend to buy premium goods domesticallyappeared. This trend is being maintained in 2013,supported both by demand and supply side:
- Growing loyalty to domestic premium productssales points offering comparable service level
- New brand entry onto the market, lux departmentstores opening
67
141516
29
912
35
18
23
38
Centobuv GloriaJeans
Sportmaster(O’stin)
+71%
+158%
+14%
+30%
Inditex(Zara,
Bershka,Stradivarius,
etc.)
+36%
+50%
InCityоodji
(OGGI)
2012
2011
515257
71
20112010 2013F2012
Source: Infoline, Fashion Report
D & Ph t il d t
7/17/2019 Accenture Mega Analitics Consumer 2013 2015 English (1)
http://slidepdf.com/reader/full/accenture-mega-analitics-consumer-2013-2015-english-1 37/40
37Copyright © 2013 Accenture All rights reserved.
Drogery & Pharma retail: drogery segmentincreases market share
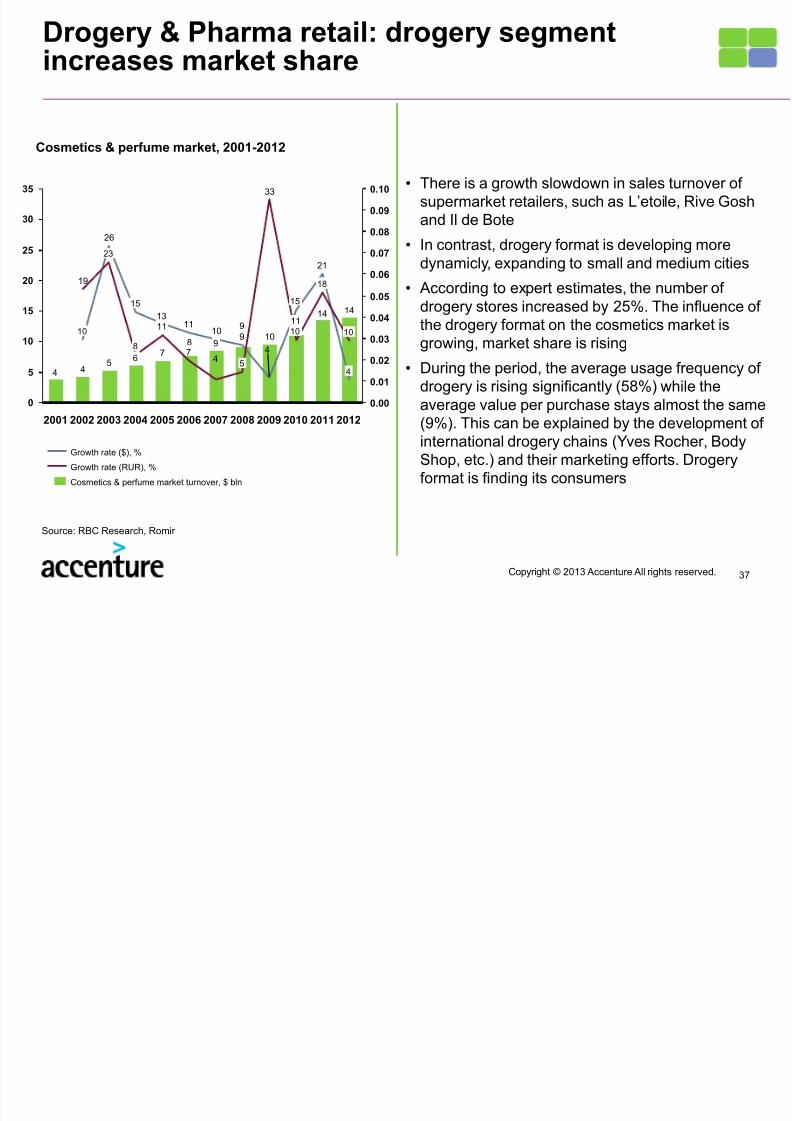
Cosmetics & perfume market, 2001-2012
• There is a growth slowdown in sales turnover ofsupermarket retailers, such as L’etoile, Rive Gosh
and Il de Bote
• In contrast, drogery format is developing moredynamicly, expanding to small and medium cities
• According to expert estimates, the number ofdrogery stores increased by 25%. The influence ofthe drogery format on the cosmetics market isgrowing, market share is rising
• During the period, the average usage frequency ofdrogery is rising significantly (58%) while theaverage value per purchase stays almost the same
(9%). This can be explained by the development ofinternational drogery chains (Yves Rocher, BodyShop, etc.) and their marketing efforts. Drogeryformat is finding its consumers
1414
10
9
8
7
544
21
4
910
1113
26
33
47
19
0
5
10
15
20
25
30
35 0.10
0.00
0.02
0.01
0.03
0.04
0.05
0.06
0.07
0.08
0.09
4
23
2002
10
2001 20122003
10
2011
18
2010
1110
15
20092008
5
2007
9
2005 2006
11
2004
6
8
15
Cosmetics & perfume market turnover, $ bln
Growth rate (RUR), %
Growth rate ($), %
Source: RBC Research, Romir
J l t il d t i i
7/17/2019 Accenture Mega Analitics Consumer 2013 2015 English (1)
http://slidepdf.com/reader/full/accenture-mega-analitics-consumer-2013-2015-english-1 38/40
38Copyright © 2013 Accenture All rights reserved.
Jewelry retailers expand to regions usingfranchising
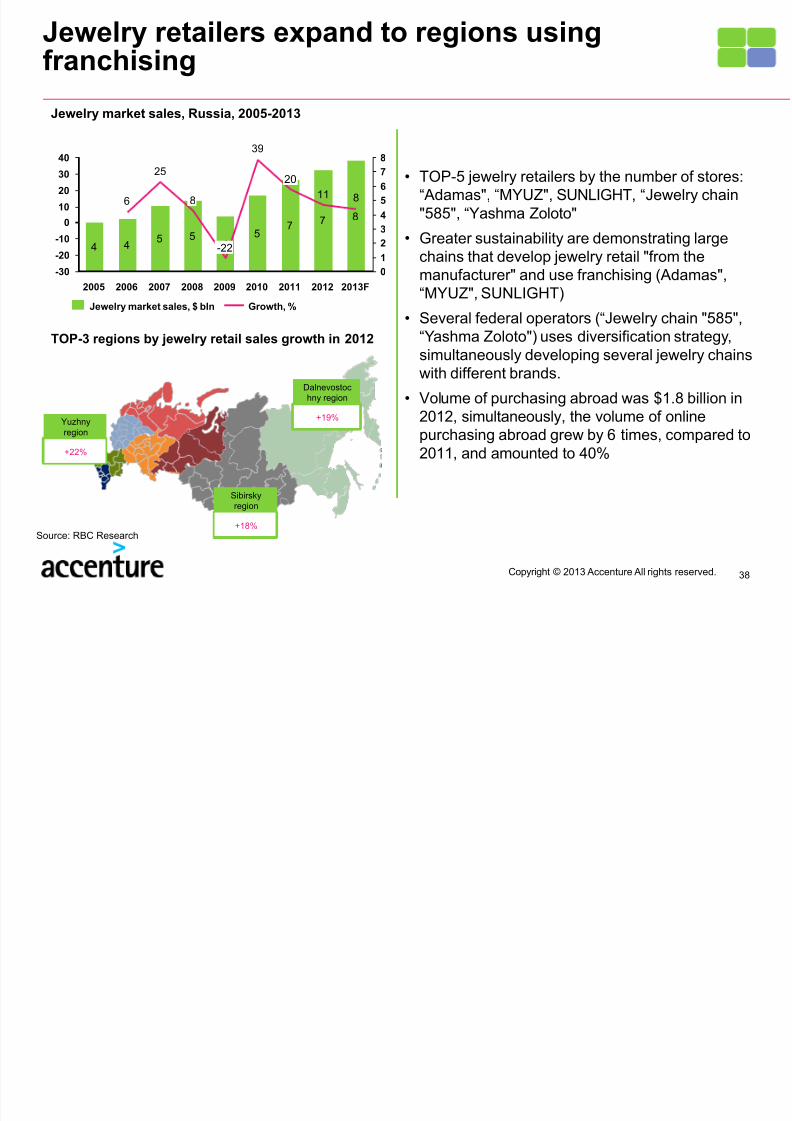
Jewelry market sales, Russia, 2005-2013
• TOP-5 jewelry retailers by the number of stores:“ Adamas", “MYUZ", SUNLIGHT, “Jewelry chain"585", “Yashma Zoloto"
• Greater sustainability are demonstrating largechains that develop jewelry retail "from the
manufacturer" and use franchising (Adamas",“MYUZ", SUNLIGHT)
• Several federal operators (“Jewelry chain "585",“Yashma Zoloto") uses diversification strategy,simultaneously developing several jewelry chainswith different brands.
• Volume of purchasing abroad was $1.8 billion in
2012, simultaneously, the volume of onlinepurchasing abroad grew by 6 times, compared to2011, and amounted to 40%
4 4 5 5
45
7 7 8
811
39
25
6
0
1
2
3
4
5
6
7
8
-30
-20
-10
0
10
20
30
40
2013F20122011
20
20102009
-22
2008
8
200720062005
Growth, %Jewelry market sales, $ bln
Dalnevostochny region
TOP-3 regions by jewelry retail sales growth in 2012
+19%Yuzhnyregion
+22%
Sibirskyregion
+18%Source: RBC Research
7/17/2019 Accenture Mega Analitics Consumer 2013 2015 English (1)
http://slidepdf.com/reader/full/accenture-mega-analitics-consumer-2013-2015-english-1 39/40
39Copyright © 2013 Accenture All rights reserved.
Three main facts to remember
• Market is in a stagnation phase, competition isescalating
• The middle class is growing, but is liking less theprocess of buying
• Service, quality, price
Summary
7/17/2019 Accenture Mega Analitics Consumer 2013 2015 English (1)
http://slidepdf.com/reader/full/accenture-mega-analitics-consumer-2013-2015-english-1 40/40
This document makes descriptive reference to trademarks that may be owned by others. The use of such trademarks herein is not an assertion of ownership ofsuch trademarks by Accenture and is not intended to represent or imply the existence of an association between Accenture and the lawful owners of suchtrademarks.
Copyright © 2013 Accenture. All rights reserved. Accenture, its logo, and High Performance Delivered are trademarks of Accent ure. This document is produced byconsultants at Accenture as general guidance. It is not intended to provide specific advice on your circumstances. If you require advice or further details on anymatters referred to, please contact your Accenture representative.
Thank you
Mikhail Pershin,Head of Russian Retail Practice, Accenture
www.accenture.com