Embed Size (px)
Citation preview

Accenture
ANALYSIS for NYSE : ACN OCTOBER 9, 2012
$73.56$46.8 B MKT CAP
Trefis Estimate
$70.40$44.8 B MKT CAP
Market Price
See the Full Analysis for Accenture on Trefis
— CORPORATE SNAPSHOT —
Accenture offers outsourcing and consulting services primarily to Fortune 500
companies. It helps its clients improve their business processes by leveraging
technology and utilizing outsourced service providers wherever appropriate.
For instance Accenture may help the IT department of a client to outsource
the development and maintenance of software applications used by company
employees. The clients benefit through long term IT cost savings and
improved processes for application development.
In Technology Consulting, Accenture competes with IBM at the top of
the heap. Accenture's expertise in the technology space includes IT Strategy,
Enterprise IT Architecture and Infrastructure, Management of Data
(Security, Privacy and Storage), and the entire spectrum of Application
Software, ranging from development to maintenance.
Accenture is one of the best positioned companies in IT Services in
today's economic context because of three reasons:
It has a very resilient business model with a healthy mix of outsourcing
and consulting at a ~45/55 revenue ratio.
1.
The firm is a market leader in outsourcing and is the growth engine of
IT Services along with IBM and HP, supported by its extensive Global
Delivery Network (GDN)
2.
It has a strong consulting practice along with IBM in the IT space and
supported by its ability to leverage specialized industry expertise through
its group of management consultants.
3.
— VALUATION HIGHLIGHTS —
Outsourcing (Technology Outsourcing, Business Outsourcing)
constitutes 31% of the Trefis price estimate for Accenture's stock.
1.
Management Consulting constitutes 25% of the Trefis price estimate for
Accenture's stock.
2.
Technology Consulting constitutes 22% of the Trefis price estimate for
Accenture's stock.
3.
MANAGEMENT CONSULTING 4Consultant Bill Rate per Hour
5
Annual Billable Hours per
Consultant
5Consultant Headcount
6Consultant Utilization
7
Management Consulting EBITDA
Margin
TECHNOLOGY CONSULTING 9Consultant Bill Rate per Hour
10Billable Hours per Year
10Technology Consultant Headcount
11Technology Consultant Utilization
12
Technology Consulting EBITDA
Margin
TECHNOLOGY OUTSOURCING
14
Bill Rate per Hour for Accenture
Software Application Outsourcing
Professionals
15
Annual Billable Hours per Accenture
Professional
15
Number of Accenture Software
Application Outsourcing
Professionals
17
Utilization Rate for Accenture
Application Outsourcing
Professionals
18
Technology Outsourcing EBITDA
Profit Margin
BUSINESS OUTSOURCING
19
Bill Rate per Hour for Accenture
Business Process Outsourcing
Professionals
20
Number of Accenture Business Process
Outsourcing Professionals
22
Utilization Rate of Accenture Business
Process Outsourcing Professionals
23
Business Process Outsourcing EBITDA
Profit Margin
SYSTEMS INTEGRATION 24Professional Bill Rate per Hour
25Systems Integration Headcount
26
Systems Integration EBITDA Profit
Margin
APPENDICES 29Summary P&L for Accenture
30
Detailed Management Consulting
P&L
31
Detailed Technology Consulting
P&L
32
Detailed Technology Outsourcing
P&L
Detailed Business Outsourcing
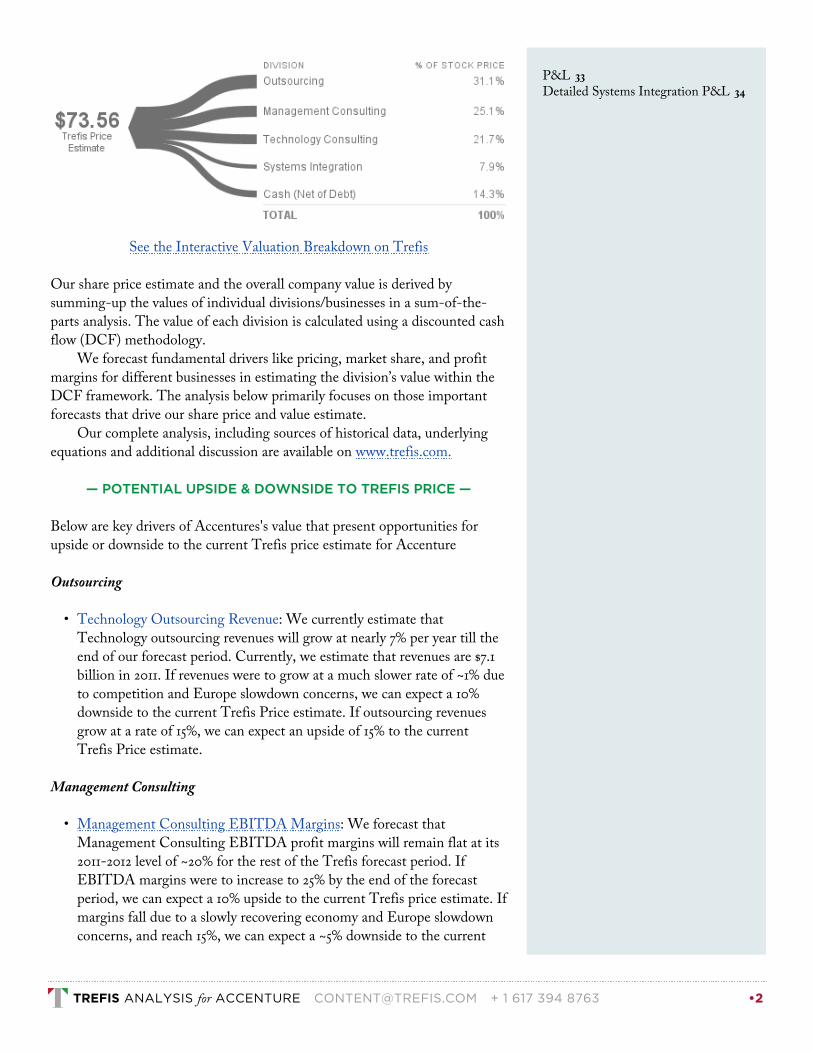
See the Interactive Valuation Breakdown on Trefis
Our share price estimate and the overall company value is derived by
summing-up the values of individual divisions/businesses in a sum-of-the-
parts analysis. The value of each division is calculated using a discounted cash
flow (DCF) methodology.
We forecast fundamental drivers like pricing, market share, and profit
margins for different businesses in estimating the division’s value within the
DCF framework. The analysis below primarily focuses on those important
forecasts that drive our share price and value estimate.
Our complete analysis, including sources of historical data, underlying
equations and additional discussion are available on www.trefis.com.
— POTENTIAL UPSIDE & DOWNSIDE TO TREFIS PRICE —
Below are key drivers of Accentures's value that present opportunities for
upside or downside to the current Trefis price estimate for Accenture
Outsourcing
Technology Outsourcing Revenue: We currently estimate that
Technology outsourcing revenues will grow at nearly 7% per year till the
end of our forecast period. Currently, we estimate that revenues are $7.1
billion in 2011. If revenues were to grow at a much slower rate of ~1% due
to competition and Europe slowdown concerns, we can expect a 10%
downside to the current Trefis Price estimate. If outsourcing revenues
grow at a rate of 15%, we can expect an upside of 15% to the current
Trefis Price estimate.
•
Management Consulting
Management Consulting EBITDA Margins: We forecast that
Management Consulting EBITDA profit margins will remain flat at its
2011-2012 level of ~20% for the rest of the Trefis forecast period. If
EBITDA margins were to increase to 25% by the end of the forecast
period, we can expect a 10% upside to the current Trefis price estimate. If
margins fall due to a slowly recovering economy and Europe slowdown
concerns, and reach 15%, we can expect a ~5% downside to the current
•
33P&L
34Detailed Systems Integration P&L
TREFIS ANALYSIS for ACCENTURE [email protected] + 1 617 394 8763 •2

Trefis price estimate.
— SOURCES OF VALUE —
Market Leader in OutsourcingThe share of outsourcing in Accenture's revenues has gradually increased
from ~ 35% in 2005 to ~42% in 2011. We expect it to stabilize around the
current level going forward. Outsourcing is the growth engine of IT Services
and Accenture is among the leaders in the space. Accenture is a market leader
in 'Application Outsourcing' and among the top players in 'Business Process
Outsourcing' and 'Infrastructure Outsourcing' along with IBM, HP and the
top Indian players.
— KEY TRENDS —
Growing Demand for Software Application OutsourcingSince software development and maintenance is easier to outsource as
compared to outsourcing complete processes or IT infrastructure (given the
increased complexity), Application Outsourcing is growing faster than BPO
and Infrastructure Outsourcing.
See the Full Analysis for Accenture on Trefis
TREFIS ANALYSIS for ACCENTURE [email protected] + 1 617 394 8763 •3
•
•
•
•
•
1.
Management Consulting The Management Consulting division constitutes 25.1% of our $73.56 price estimate for this stock, based on our sum of the
parts analysis.The most important drivers for the Management Consulting business are:
Consultant Bill Rate per Hour
Annual Billable Hours per Consultant
Consultant Headcount
Consultant Utilization
Management Consulting EBITDA Margin
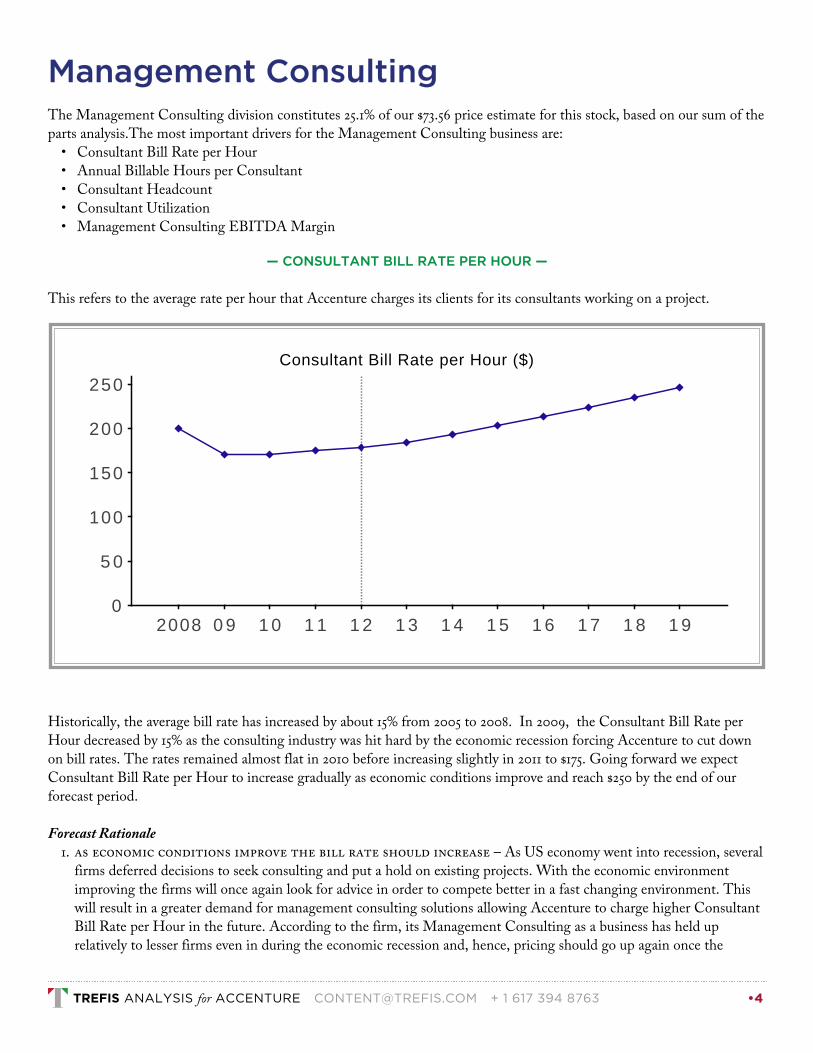
— CONSULTANT BILL RATE PER HOUR —
This refers to the average rate per hour that Accenture charges its clients for its consultants working on a project.
Historically, the average bill rate has increased by about 15% from 2005 to 2008. In 2009, the Consultant Bill Rate per
Hour decreased by 15% as the consulting industry was hit hard by the economic recession forcing Accenture to cut down
on bill rates. The rates remained almost flat in 2010 before increasing slightly in 2011 to $175. Going forward we expect
Consultant Bill Rate per Hour to increase gradually as economic conditions improve and reach $250 by the end of our
forecast period.
Forecast Rationale
AS ECONOMIC CONDITIONS IMPROVE THE BILL RATE SHOULD INCREASE – As US economy went into recession, several
firms deferred decisions to seek consulting and put a hold on existing projects. With the economic environment
improving the firms will once again look for advice in order to compete better in a fast changing environment. This
will result in a greater demand for management consulting solutions allowing Accenture to charge higher Consultant
Bill Rate per Hour in the future. According to the firm, its Management Consulting as a business has held up
relatively to lesser firms even in during the economic recession and, hence, pricing should go up again once the
Consultant Bill Rate per Hour ($)
2008 0 9 1 0 1 1 1 2 1 3 1 4 1 5 1 6 1 7 1 8 1 90
5 0
100
150
200
250
TREFIS ANALYSIS for ACCENTURE [email protected] + 1 617 394 8763 •4

business environment improves. Accenture Management Consulting competes with other top leagues players such as
Mckinsey, Boston Consulting Group in terms of expertise. With experience varying from strategic consulting to the
optimization of processes ranging from operations to finance, Accenture covers a wide variety of fields making it one
of the more sought after firms.
Sources for historical data and explanations can be found on the Trefis.com website (link)
— ANNUAL BILLABLE HOURS PER CONSULTANT —
This refers to the total number of hours than an Accenture consultant works on various projects for which the clients are
charged for the work.
Total number of billable hours per year is calculated based on an average of 20 working days for a month comprising 9
hours each day.
Sources for historical data and explanations can be found on the Trefis.com website (link)
— CONSULTANT HEADCOUNT —
This refers to the total number of employees available in a particular division for projects.
Annual Billable Hours per Consultant (K )
2008 0 9 1 0 1 1 1 2 1 3 1 4 1 5 1 6 1 7 1 8 1 90.0
0.5
1.0
1.5
2.0
TREFIS ANALYSIS for ACCENTURE [email protected] + 1 617 394 8763 •5
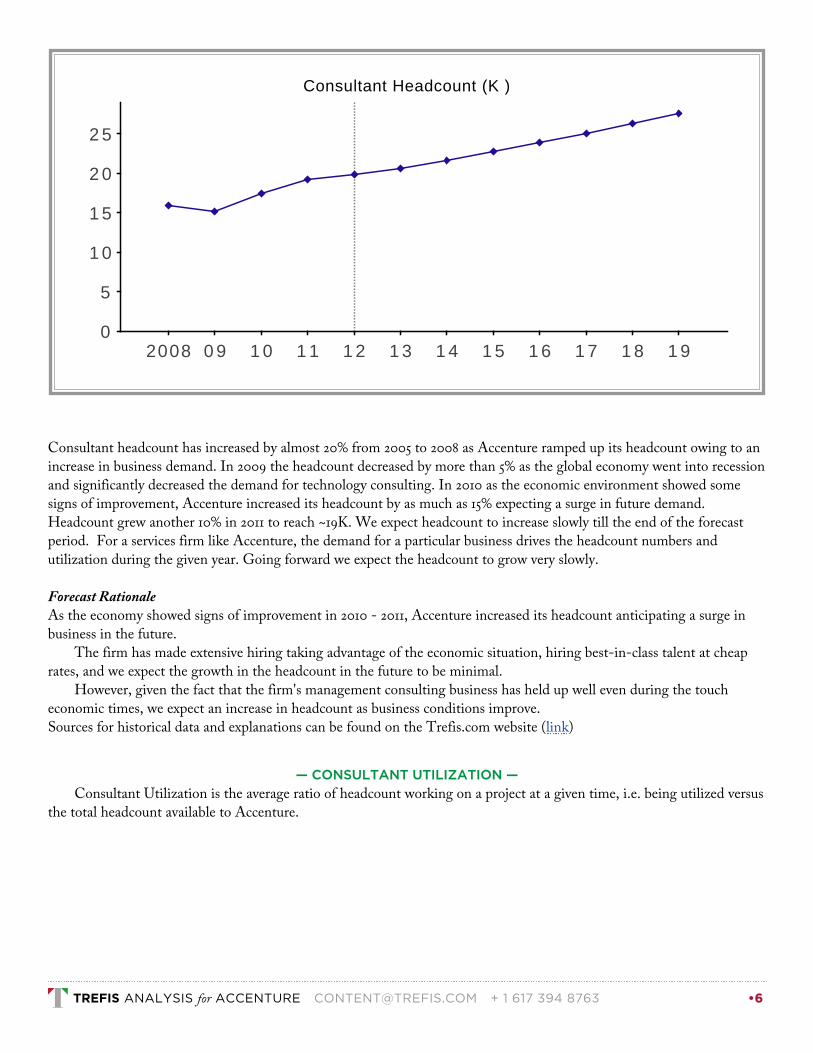
Consultant headcount has increased by almost 20% from 2005 to 2008 as Accenture ramped up its headcount owing to an
increase in business demand. In 2009 the headcount decreased by more than 5% as the global economy went into recession
and significantly decreased the demand for technology consulting. In 2010 as the economic environment showed some
signs of improvement, Accenture increased its headcount by as much as 15% expecting a surge in future demand.
Headcount grew another 10% in 2011 to reach ~19K. We expect headcount to increase slowly till the end of the forecast
period. For a services firm like Accenture, the demand for a particular business drives the headcount numbers and
utilization during the given year. Going forward we expect the headcount to grow very slowly.
Forecast RationaleAs the economy showed signs of improvement in 2010 - 2011, Accenture increased its headcount anticipating a surge in
business in the future.
The firm has made extensive hiring taking advantage of the economic situation, hiring best-in-class talent at cheap
rates, and we expect the growth in the headcount in the future to be minimal.
However, given the fact that the firm's management consulting business has held up well even during the touch
economic times, we expect an increase in headcount as business conditions improve.
Sources for historical data and explanations can be found on the Trefis.com website (link)
— CONSULTANT UTILIZATION —
Consultant Utilization is the average ratio of headcount working on a project at a given time, i.e. being utilized versus
the total headcount available to Accenture.
Consultant Headcount (K )
2008 0 9 1 0 1 1 1 2 1 3 1 4 1 5 1 6 1 7 1 8 1 90
5
1 0
1 5
2 0
2 5
TREFIS ANALYSIS for ACCENTURE [email protected] + 1 617 394 8763 •6

The utilization rate has historically remained high at around 80%, growing at a slow rate rate each year. In 2008 it dipped
briefly as the business environment declined. In 2009 the utilization rate jumped back as Accenture laid off employees
during the economic recession which led to a higher utilization of existing consultants despite a decline in business. In
2010 the rate remained constant despite a significant increase of 15% in Accenture's headcount as the demand for
consulting services surged with an improvement in the economic environment. Consultant utilization increased in 2011 to
87%. Going forward we expect the rate to remain constant as firms like to maintain the utilization at a certain maximum
and keep bench strength for upcoming new projects. If the demand increases then instead of increasing utilization the
company hires more consultants.
Forecast RationaleFor a services firm like Accenture the demand for a particular business drives the headcount numbers and utilization
during the given year.
Accenture Management Consulting claims to belong in the top league with firms like Mckinsey, Boston Consulting
Group and Bain & Company in terms of its expertise.
With expertise varying from Strategic Consulting, M&A to Optimal Supply Chain Management, and optimization
of processes ranging from operations to finance to HR, Accenture covers a wide gamut of fields making it one of the more
sought after firms by its clients.
The fact that firm's management consulting business has held up even during the tough economic times lead us to
believe that it will be able to maintain its utilization rates going forward despite the uptick in consultant headcount.
Sources for historical data and explanations can be found on the Trefis.com website (link)
— MANAGEMENT CONSULTING EBITDA MARGIN —
Earnings Before Interest, Taxes, Depreciation and Amortization (EBITDA) are profits after factoring in typical
expenses such as Cost of Goods and Services Sold, SG&A Expense and R&D Expense. EBITDA Margin represents
divisional EBITDA as a percentage of divisional revenues. We adjust EBITDA figures to exclude non-recurring charges
and non-cash charges such as Stock-Based Compensation Expense.
Consultant Utilization (%)
2008 0 9 1 0 1 1 1 2 1 3 1 4 1 5 1 6 1 7 1 8 1 90
2 5
5 0
7 5
TREFIS ANALYSIS for ACCENTURE [email protected] + 1 617 394 8763 •7
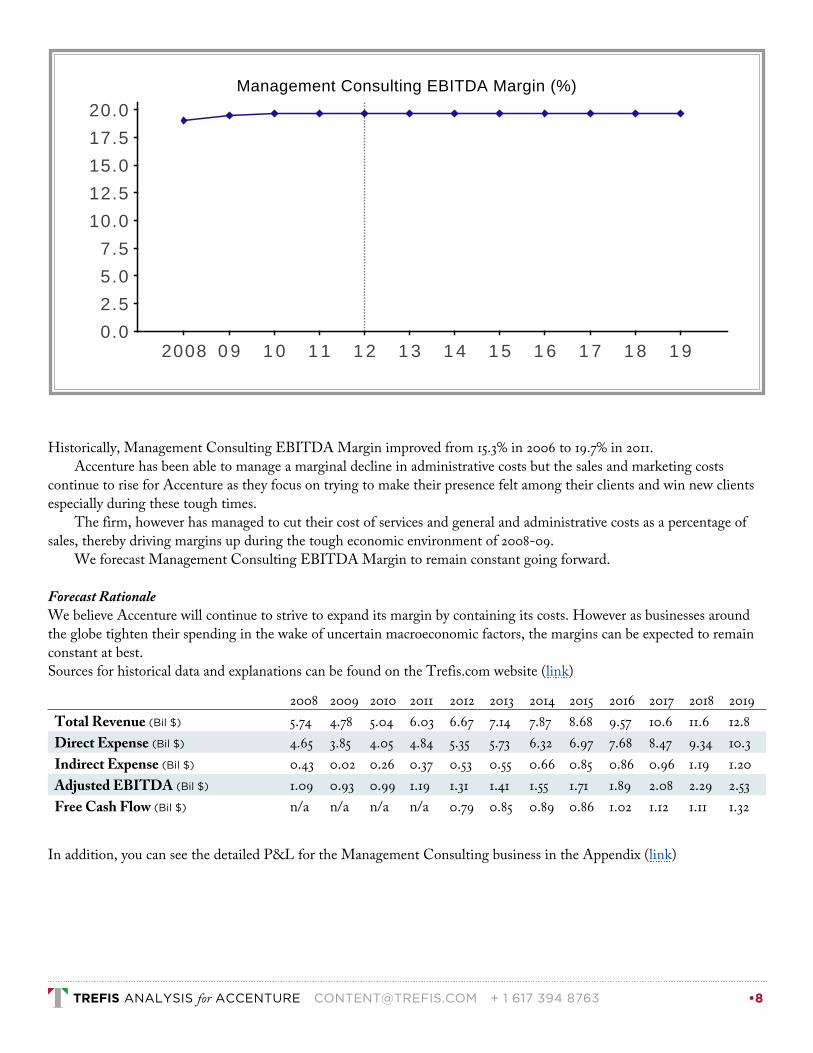
Historically, Management Consulting EBITDA Margin improved from 15.3% in 2006 to 19.7% in 2011.
Accenture has been able to manage a marginal decline in administrative costs but the sales and marketing costs
continue to rise for Accenture as they focus on trying to make their presence felt among their clients and win new clients
especially during these tough times.
The firm, however has managed to cut their cost of services and general and administrative costs as a percentage of
sales, thereby driving margins up during the tough economic environment of 2008-09.
We forecast Management Consulting EBITDA Margin to remain constant going forward.
Forecast RationaleWe believe Accenture will continue to strive to expand its margin by containing its costs. However as businesses around
the globe tighten their spending in the wake of uncertain macroeconomic factors, the margins can be expected to remain
constant at best.
Sources for historical data and explanations can be found on the Trefis.com website (link)
In addition, you can see the detailed P&L for the Management Consulting business in the Appendix (link)
Management Consulting EBITDA Margin (%)
2008 0 9 1 0 1 1 1 2 1 3 1 4 1 5 1 6 1 7 1 8 1 90.0
2.5
5.0
7.5
10.0
12.5
15.0
17.5
20.0
2008 2009 2010 2011 2012 2013 2014 2015 2016 2017 2018 2019
Total Revenue (Bil $) 5.74 4.78 5.04 6.03 6.67 7.14 7.87 8.68 9.57 10.6 11.6 12.8
Direct Expense (Bil $) 4.65 3.85 4.05 4.84 5.35 5.73 6.32 6.97 7.68 8.47 9.34 10.3
Indirect Expense (Bil $) 0.43 0.02 0.26 0.37 0.53 0.55 0.66 0.85 0.86 0.96 1.19 1.20
Adjusted EBITDA (Bil $) 1.09 0.93 0.99 1.19 1.31 1.41 1.55 1.71 1.89 2.08 2.29 2.53
Free Cash Flow (Bil $) n/a n/a n/a n/a 0.79 0.85 0.89 0.86 1.02 1.12 1.11 1.32
TREFIS ANALYSIS for ACCENTURE [email protected] + 1 617 394 8763 •8

•
•
•
•
•
1.
2.
Technology Consulting The most important drivers for the Technology Consulting business are:
Consultant Bill Rate per Hour
Billable Hours per Year
Technology Consultant Headcount
Technology Consultant Utilization
Technology Consulting EBITDA Margin
— CONSULTANT BILL RATE PER HOUR —
This refers to the average rate per hour that Accenture charges its clients for its consultants working on a project.
Historically, the average bill rate increased by about 15% from 2005 to 2008. In 2009, the bill rate declined by 10% as the
consulting industry was hit hard by the economic recession forcing Accenture to cut down on bill rates. The rates
remained almost flat in 2010 before increasing slightly in 2011 to reach $124. Going forward we expect the bill rate to
increase gradually as economic conditions improve.
Forecast Rationale
CONTINUED INCREASES IN DEMAND – According to the firm technology consulting is continuing to show growth as
clients avail the services offered by Accenture. This should help the average bill rate recover as the business
environment recovers and firms increasingly rely on consulting services to sustain growth in a competitive and fast
changing environment.
IT SPEND TO INCREASE GOING FORWARD – Firms hire consultants in order to help improve their business. This is
purely a discretionary and not necessary spend which can be cut back immediately if a firm has to cut costs. As US
economy went into recession several firms deferred decisions about new work and put a hold on extensions in current
projects. With the economic environment improving, the IT spend is expected to increase in going forward. This will
result in a greater demand for technology consulting solutions allowing Accenture to charge higher in the future.
Consultant Bill Rate per Hour ($)
2008 0 9 1 0 1 1 1 2 1 3 1 4 1 5 1 6 1 7 1 8 1 90
2 5
5 0
7 5
100
125
150
TREFIS ANALYSIS for ACCENTURE [email protected] + 1 617 394 8763 •9

Sources for historical data and explanations can be found on the Trefis.com website (link)
— BILLABLE HOURS PER YEAR —
This refers to the total number of hours than an Accenture consultant works on various projects for which the clients are
charged for the work.
Total number of billable hours per year is calculated based on an average of 20 working days for a month, comprising 9
hours each day.
Sources for historical data and explanations can be found on the Trefis.com website (link)
— TECHNOLOGY CONSULTANT HEADCOUNT —
This refers to the total number of employees available in a particular division for projects.
Billable Hours per Year (K )
2008 0 9 1 0 1 1 1 2 1 3 1 4 1 5 1 6 1 7 1 8 1 90.0
0.5
1.0
1.5
2.0
TREFIS ANALYSIS for ACCENTURE [email protected] + 1 617 394 8763 •10

1.
Headcount has increased by almost 30% from 2005 to 2008 as Accenture has ramped up its headcount owing to increase in
business demand. For a services firm like Accenture the demand for a particular business drives the headcount numbers
and utilization during the given year. In 2009 headcount decreased by more than 5% as the global economy went into
recession and significantly decreased the demand for technology consulting with firms around the world looking to cut
costs. In 2010 as the economic environment showed some signs of improvement, Accenture increased its headcount by as
much as 15% expecting a surge in future demand. Headcount increased by another 10% in 2011 to reach ~29K and going
forward we expect the headcount to grow very slowly.
Forecast Rationale
TECHNOLOGY CONSULTANT HEADCOUNT – As the economy showed signs of improvement in 2010 - 2011, Accenture
increased its headcount, anticipating a surge in business in the future. The firm has made extensive hiring taking
advantage of the economic situation, hiring best-in-class talent at cheap rates, and we expect the growth in the
headcount in the future to be minimal. As the business environment recovers, Accenture's leadership in the field of
Technology Consulting along with IBM should help it drive demand for business which will prompt an increase in
consulting demand and consequently headcount.
Sources for historical data and explanations can be found on the Trefis.com website (link)
— TECHNOLOGY CONSULTANT UTILIZATION —
Technology Consultant Utilization is the average ratio of headcount working on a project at a given time.
Technology Consultant Headcount (K )
2008 0 9 1 0 1 1 1 2 1 3 1 4 1 5 1 6 1 7 1 8 1 90
5
1 0
1 5
2 0
2 5
3 0
3 5
4 0
TREFIS ANALYSIS for ACCENTURE [email protected] + 1 617 394 8763 •11

1.
2.
Utilization has remained at around the 80% level historically. It dipped slightly in 2008 as the business environment
declined.
During 2009, utilization increase as Accenture laid off employees during the economic recession which led to a
higher utilization of existing consultants despite a decline in business.
In 2010 utilization remained constant despite a significant increase of 15% in Accenture's headcount as the demand for
technology consulting surged with an improvement in the economic environment. 2011 saw a slight improvement in
utilization and it grew 3 percentage points to reach 87%. Going forward we expect utilization to remain constant as firms
like to maintain headcount to meet the need for new projects.
Forecast Rationale
GROWING DEMAND FROM ORGANIZATIONS – For a services firm like Accenture the demand for a particular business
drives the headcount numbers and utilization during the given year. Demand for Technology Consulting is growing
with firms looking for IT infrastructure cost reduction, data security and privacy and this has kept the utilization up
even in tough times. We believe the following factor will help Accenture maintain a high utilization rate despite a
significant increase in its headcount.
IT SPEND TO INCREASE GOING FORWARD – Firms hire consultants in order to help improve their business. This is
purely a discretionary and not necessary spend which can be cut back immediately if a firm has to cut costs. As US
economy went into recession several firms deferred decisions about new work and put a hold on extensions in current
projects. With the economic environment improving, the IT spend is expected to increase going forward. This will
result in a greater demand for technology consulting solutions allowing Accenture to maintain its optimum utilization
rate in the future.
Sources for historical data and explanations can be found on the Trefis.com website (link)
— TECHNOLOGY CONSULTING EBITDA MARGIN —
Earnings Before Interest, Taxes, Depreciation and Amortization (EBITDA) are profits after factoring in typical expenses
such as Cost of Goods and Services Sold, SG&A Expense and R&D Expense. EBITDA Margin represents divisional
EBITDA as a percentage of divisional revenues. We adjust EBITDA figures to exclude non-recurring charges and non-
Technology Consultant Utilization (%)
2008 0 9 1 0 1 1 1 2 1 3 1 4 1 5 1 6 1 7 1 8 1 90
2 5
5 0
7 5
TREFIS ANALYSIS for ACCENTURE [email protected] + 1 617 394 8763 •12

cash charges such as Stock-Based Compensation Expense.
Historically, margins improved gradually from 14.7% in 2006 to 18% in 2011.
Accenture has been able to manage a marginal decline in administrative costs but the sales and marketing costs
continue to rise for Accenture as they focus on trying to make their presence felt among their clients and win new clients .
Accenture has also managed to cut their cost of services and general and administrative costs driving up margins even
during the tough economic environment of 2008-09.
We forecast Technology Consulting EBITDA Margin to remain steady going forward.
Forecast RationaleWe believe Accenture will continue to strive to expand its margin by containing its costs. However as businesses around
the globe tighten their spending in the wake of uncertain macroeconomic factors, the margins can be expected to remain
constant at best.
Sources for historical data and explanations can be found on the Trefis.com website (link)
Technology Consulting EBITDA Margin (%)
2008 0 9 1 0 1 1 1 2 1 3 1 4 1 5 1 6 1 7 1 8 1 90.0
2.5
5.0
7.5
10.0
12.5
15.0
17.5
2008 2009 2010 2011 2012 2013 2014 2015 2016 2017 2018 2019
Total Revenue (Bil $) 5.74 5.04 5.34 6.38 6.99 7.42 8.02 8.67 9.38 10.1 11.0 11.9
Direct Expense (Bil $) 4.75 4.14 4.38 5.23 5.73 6.08 6.58 7.11 7.69 8.32 9.00 9.73
Indirect Expense (Bil $) 0.39 0.02 0.25 0.35 0.50 0.53 0.62 0.78 0.77 0.84 1.02 1.02
Adjusted EBITDA (Bil $) 0.99 0.90 0.96 1.15 1.26 1.33 1.44 1.56 1.69 1.83 1.97 2.14
Free Cash Flow (Bil $) n/a n/a n/a n/a 0.75 0.81 0.83 0.78 0.92 0.98 0.95 1.12
TREFIS ANALYSIS for ACCENTURE [email protected] + 1 617 394 8763 •13

•
•
•
•
•
1.
2.
In addition, you can see the detailed P&L for the Technology Consulting business in the Appendix (link)
Technology Outsourcing The Technology Outsourcing division is part of the Outsourcing business, and constitutes 20.2% of our $73.56 price
estimate for the stock, based on our sum of the parts analysis.The most important drivers for the Technology Outsourcing
business are:
Bill Rate per Hour for Accenture Software Application Outsourcing Professionals
Annual Billable Hours per Accenture Professional
Number of Accenture Software Application Outsourcing Professionals
Utilization Rate for Accenture Application Outsourcing Professionals
Technology Outsourcing EBITDA Profit Margin
— BILL RATE PER HOUR FOR ACCENTURE SOFTWARE APPLICATION OUTSOURCING PROFESSIONALS
—
This refers to the average rate per hour that Accenture charges its clients for its consultants working on a project.
The average bill rate has declined by about 19% from 2005 to 2011 due to the following factors:
Indian outsourcing firms have jumped into the competition, thus lowering the rates
The economic slowdown led to clients demand for cost-cutting resulting in further decrease in bill rate
Going forward we expect the bill rate to increase gradually, though it will remain much below historical levels.
Forecast RationaleSupporting
Bill Rate per Hour for Accenture Software Application Outsourcing Professionals ($)
2008 0 9 1 0 1 1 1 2 1 3 1 4 1 5 1 6 1 7 1 8 1 90
1 0
2 0
3 0
4 0
5 0
TREFIS ANALYSIS for ACCENTURE [email protected] + 1 617 394 8763 •14
1.
2.
3.
ACCENTURE REMAINS THE LEADER IN THE SPACE – Despite the competition from the Indian players, Accenture holds
an edge in its knowledge house through its pool of management and technology consultants who have far more
experience than the Indian players. We expect the company to continue to leverage this knowledge and technical
know-how and hence expect it to be able to increase their bill rates in the future, but we do not expect it to recover to
the historical high as competitive pricing of Indian factors will continue to weigh.
BILL RATES WILL IMPROVE ALONG WITH THE ECONOMY – A recovery in the economy should help the bill rates to
recover from the levels of 2008-09
Mitigating
COMPETITION TO WEIGH ON BILL RATES – Indian players such as Infosys operate on a lower billing rate and hence
despite low rates compared to Consulting and Systems Integration, we do expect a slight decline in pricing in order to
stay competitive in the market.
Sources for historical data and explanations can be found on the Trefis.com website (link)
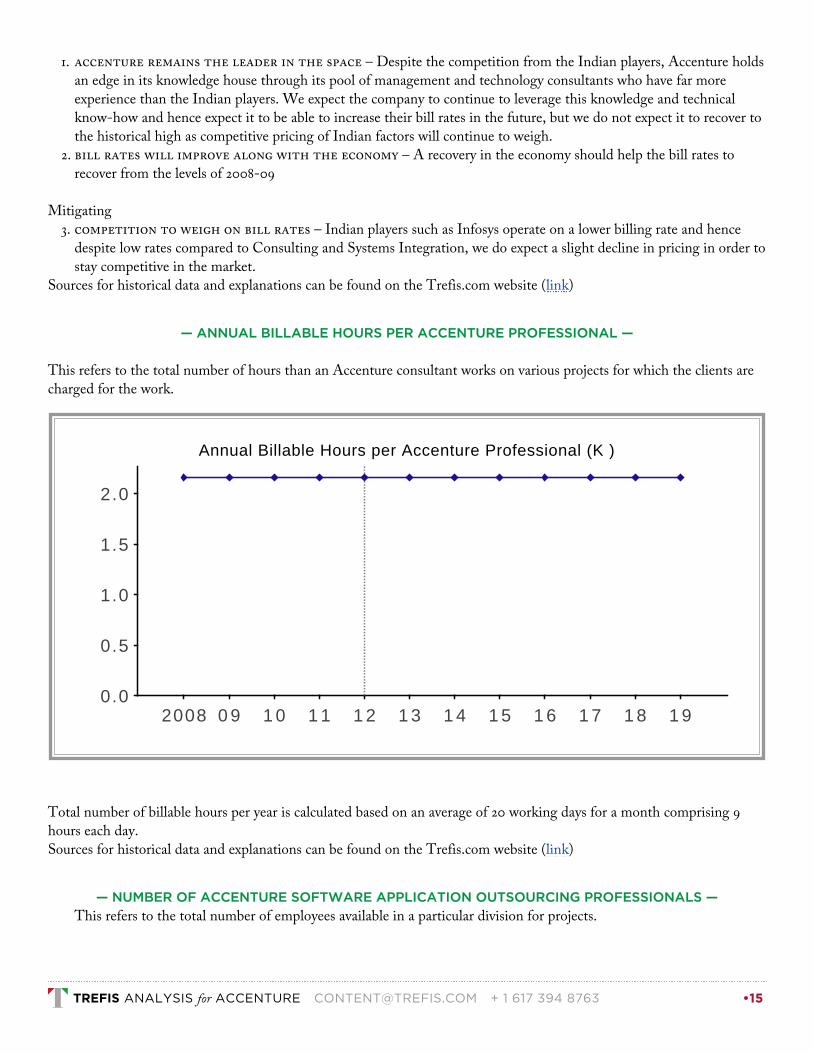
— ANNUAL BILLABLE HOURS PER ACCENTURE PROFESSIONAL —
This refers to the total number of hours than an Accenture consultant works on various projects for which the clients are
charged for the work.
Total number of billable hours per year is calculated based on an average of 20 working days for a month comprising 9
hours each day.
Sources for historical data and explanations can be found on the Trefis.com website (link)
— NUMBER OF ACCENTURE SOFTWARE APPLICATION OUTSOURCING PROFESSIONALS —
This refers to the total number of employees available in a particular division for projects.
Annual Billable Hours per Accenture Professional (K )
2008 0 9 1 0 1 1 1 2 1 3 1 4 1 5 1 6 1 7 1 8 1 90.0
0.5
1.0
1.5
2.0
TREFIS ANALYSIS for ACCENTURE [email protected] + 1 617 394 8763 •15

1.
2.
1.
2.
The Number of Accenture Software Application Outsourcing Professionals increased by more then 75% from 2005 to
2008 as Accenture ramped up its headcount owing to increase in business demand.
In 2009 the number of professionals decreased by more than 5% as the global economy went into recession and
significantly decreased the demand for technology consulting with firms around the world looking to cut cost.
In 2010 as the economic environment showed some signs of improvement, Accenture increased its headcount by as
much as 15% expecting a surge in future demand. This trend continued into 2011 as headcount increased by another 10% to
reach 67K. For a services firm like Accenture the demand for a particular business drives the headcount numbers and
utilization during the given year.
We expect Accenture's Application Outsourcing headcount to grow at a steady rate in the long run because of the
following two reasons:
Demand for Application Outsourcing across industries is growing faster than Business Process Outsourcing and
Infrastructure Outsourcing
Accenture's leadership in the field
Forecast Rationale
INCREASED DEMAND FOR APPLICATION OUTSOURCING – Pressure to reduce IT expenses in times when companies are
trying to cut on IT budgets is forcing firms to outsource these services. Firms are realizing that the cost of ownership
of this is pretty high and resorting to
Software as a Service (SaaS) model. As software development and maintenance is easier to outsource as against
outsourcing complete processes or IT infrastructure given the increased complexity, Application Outsourcing is
growing faster than BPO and Infrastructure Outsourcing.
ACCENTURE'S LEADERSHIP IN APPLICATION OUTSOURCING – Accenture is a market leader along with IBM in the
Application Outsourcing field with close to half of its outsourcing revenues coming from this area.
Resources available - Accenture's Global delivery network in more than 40 locations worldwide allows it to offer
clients 24/7 services, making it one of the most competitive firms in this field.
Industry expertise - Accenture is able to leverage its wide industry knowledge through its experts in Management and
Technology Consulting and thus add strategic value to a client's business.
Scope - Accenture offers a breadth of services from management of a single application to application portfolios and
Number of Accenture Software Application Outsourcing Professionals (K )
2008 0 9 1 0 1 1 1 2 1 3 1 4 1 5 1 6 1 7 1 8 1 90
2 5
5 0
7 5
100
TREFIS ANALYSIS for ACCENTURE [email protected] + 1 617 394 8763 •16

specialises in Enterprise softwares such as SAP, Oracle etc.
Breadth of services - Accenture covers a breadth of services from development to testing, and maintenance to
enhancements/upgrades.
Bundling - Accenture is able to bundle its Application Outsourcing services along with its BPO and Infrastructure
Outsourcing Services thereby offering the complete IT solution to its clients.
Sources for historical data and explanations can be found on the Trefis.com website (link)
— UTILIZATION RATE FOR ACCENTURE APPLICATION OUTSOURCING PROFESSIONALS —
This is is the average ratio of headcount working on a project at a given time.
The utilization rate has historically remained high at 80%. with a slow increase each year. It dipped in 2008 as the business
environment declined.
In 2009 the utilization rate jumped back as Accenture laid off employee during the economic recession which led to a
higher utilization of existing employees despite a decline in business.
As the economy showed signs of improvement in 2010, Accenture increased its AO headcount by ~15% in order to
meet the expected increase in demand. Since this increase in headcount was significant and occurred throughout the year
it led to a decrease in average annual billable hours per professional in 2010. We decreased our Utilization Rate for
Accenture Application Outsourcing Professionals in 2010 to account for fewer billable hours (keeping annual billable
hours per professional constant for consistency). Utilization improved by 6 percentage points in 2011 and reached 86% in
2011.
Outsourcing usually experiences a higher utilization rate than consulting or systems integration and given that the
demand for outsourcing is only growing we expect the utilization to increase back to historical levels going forward.
For a services firm like Accenture, the demand for a particular business drives the headcount numbers and utilization
during the given year.
Forecast Rationale
Utilization Rate for Accenture Application Outsourcing Professionals (%)
2008 0 9 1 0 1 1 1 2 1 3 1 4 1 5 1 6 1 7 1 8 1 90
2 5
5 0
7 5
TREFIS ANALYSIS for ACCENTURE [email protected] + 1 617 394 8763 •17
We expect the utilization levels to go back up to optimum historical level because firms like to maintain the utilization at a
certain maximum and keep bench strength for upcoming new projects. If the demand increases, then instead of increasing
utilization they hire more.
Sources for historical data and explanations can be found on the Trefis.com website (link)
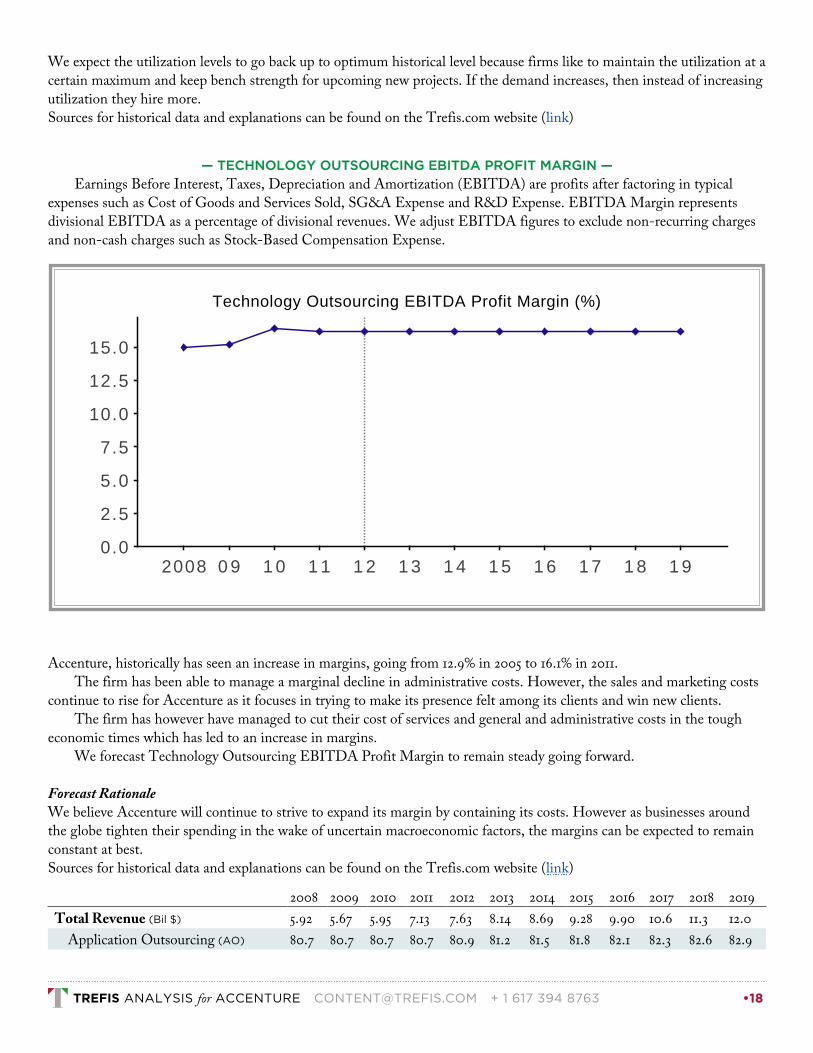
— TECHNOLOGY OUTSOURCING EBITDA PROFIT MARGIN —
Earnings Before Interest, Taxes, Depreciation and Amortization (EBITDA) are profits after factoring in typical
expenses such as Cost of Goods and Services Sold, SG&A Expense and R&D Expense. EBITDA Margin represents
divisional EBITDA as a percentage of divisional revenues. We adjust EBITDA figures to exclude non-recurring charges
and non-cash charges such as Stock-Based Compensation Expense.
Accenture, historically has seen an increase in margins, going from 12.9% in 2005 to 16.1% in 2011.
The firm has been able to manage a marginal decline in administrative costs. However, the sales and marketing costs
continue to rise for Accenture as it focuses in trying to make its presence felt among its clients and win new clients.
The firm has however have managed to cut their cost of services and general and administrative costs in the tough
economic times which has led to an increase in margins.
We forecast Technology Outsourcing EBITDA Profit Margin to remain steady going forward.
Forecast RationaleWe believe Accenture will continue to strive to expand its margin by containing its costs. However as businesses around
the globe tighten their spending in the wake of uncertain macroeconomic factors, the margins can be expected to remain
constant at best.
Sources for historical data and explanations can be found on the Trefis.com website (link)
Technology Outsourcing EBITDA Profit Margin (%)
2008 0 9 1 0 1 1 1 2 1 3 1 4 1 5 1 6 1 7 1 8 1 90.0
2.5
5.0
7.5
10.0
12.5
15.0
2008 2009 2010 2011 2012 2013 2014 2015 2016 2017 2018 2019
Total Revenue (Bil $) 5.92 5.67 5.95 7.13 7.63 8.14 8.69 9.28 9.90 10.6 11.3 12.0
Application Outsourcing (AO) 80.7 80.7 80.7 80.7 80.9 81.2 81.5 81.8 82.1 82.3 82.6 82.9
TREFIS ANALYSIS for ACCENTURE [email protected] + 1 617 394 8763 •18

•
•
•
•
In addition, you can see the detailed P&L for the Technology Outsourcing business in the Appendix (link)
Business Outsourcing The Business Outsourcing division is part of the Outsourcing business, and constitutes 10.9% of our $73.56 price estimate
for the stock, based on our sum of the parts analysis.The most important drivers for the Business Outsourcing business
are:
Bill Rate per Hour for Accenture Business Process Outsourcing Professionals
Number of Accenture Business Process Outsourcing Professionals
Utilization Rate of Accenture Business Process Outsourcing Professionals
Business Process Outsourcing EBITDA Profit Margin
— BILL RATE PER HOUR FOR ACCENTURE BUSINESS PROCESS OUTSOURCING PROFESSIONALS —
Bill Rate per Hour for Accenture Business Process Outsourcing Professionals is the average rate per hour that
Accenture charges its clients for its consultants working on a project.
The average bill rate has declined by about 22% from 2005 to 2009 owing to following two factors:
2008 2009 2010 2011 2012 2013 2014 2015 2016 2017 2018 2019
Infrastructure Outsourcing (ITO) 19.3 19.3 19.3 19.3 19.1 18.8 18.5 18.2 17.9 17.7 17.4 17.1
Direct Expense (Bil $) 5.03 4.81 4.97 5.97 6.40 6.83 7.29 7.78 8.30 8.86 9.46 10.1
Indirect Expense (Mil $) 345 21.5 253 354 494 518 599 744 731 788 942 924
Adjusted EBITDA (Bil $) 0.89 0.86 0.98 1.15 1.23 1.32 1.40 1.50 1.60 1.71 1.82 1.94
Free Cash Flow (Bil $) n/a n/a n/a n/a 0.74 0.80 0.80 0.75 0.87 0.92 0.88 1.02
Bill Rate per Hour for Accenture Business Process Outsourcing Professionals ($)
2008 0 9 1 0 1 1 1 2 1 3 1 4 1 5 1 6 1 7 1 8 1 90
1 0
2 0
3 0
4 0
5 0
TREFIS ANALYSIS for ACCENTURE [email protected] + 1 617 394 8763 •19
1.
2.
1.
2.
3.
Indian outsourcing firms have jumped into the competition thus lowering the rates
The economic slowdown led to clients demand for cost cutting resulting in further decrease in Bill Rate per Hour for
Accenture Business Process Outsourcing Professionals
In 2011, the bill rate remained flat as the economic conditions remained uncertain. It stood at $46 per hour. Going forward
we expect the bill rate to increase gradually, though it will remain much below historical levels.
Forecast Rationale
Supporting
ACCENTURE REMAINS THE LEADER IN THE SPACE AND HAS AN EDGE OVER LOWER PRICE INDIAN PLAYERS – Despite
the competition from the Indian Players, Accenture holds an edge in its knowledge house through its pool of
management and technology consultants who have far more experience than the Indian players. We expect the
company to continue to leverage this knowledge and technical know-how and hence expect it to be able to increase
their bill rates in the future, but we do not expect it to recover to the historical high as the competitive pricing of
Indian factors will continue to weigh.
BILL RATES WILL IMPROVE ALONG WITH THE ECONOMY – As the economy recovers, it will help the bill rates to
increase back from the levels of 2008-09.
Mitigating
COMPETITION TO IMPACT BILL RATES – Indian players such as Infosys operate on a lower billing rate and hence
despite low rates compared to Consulting and Systems Integration, we do not expect the bill rate to increase much in
order to stay competitive in the market.
Sources for historical data and explanations can be found on the Trefis.com website (link)
— NUMBER OF ACCENTURE BUSINESS PROCESS OUTSOURCING PROFESSIONALS —
Number of Accenture Business Process Outsourcing Professionals is the total number of employees available in a
particular division for projects.
TREFIS ANALYSIS for ACCENTURE [email protected] + 1 617 394 8763 •20

1.
2.
1.
2.
Number of Accenture Business Process Outsourcing Professionals increased by nearly 70% from 2005 to 2008 as
Accenture ramped up its headcount owing to an increase in business demand. In 2009 the number declined by more than
5% as the global economy went into recession and significantly decreased the demand for technology consulting with firms
around the world looking to cut costs. In 2010 as the economic environment showed some signs of improvement,
Accenture increased its headcount by as much as 15% expecting a surge in future demand. In 2011 Accenture increased its
headcount by 10% expecting a surge in future demand. For a services firm like Accenture, the demand for a particular
business drives the headcount numbers and utilization during the given year. We expect Accenture's Business Process
Outsourcing (BPO) headcount to grow at a steady rate in the long run because of the following two reasons:
Growing demand for Business Process Outsourcing across industries albeit at a slower rate than Application
Outsourcing
Accenture is among the top players in the field and a leader in HR and F&A BPO
Forecast RationaleTrefis considered following factors for its forecast:
STRONG DEMAND FOR OUTSOURCING – Outsourcing processes that are more of a support function rather than a
business critical function helps firms reduce costs and allows them to focus on their core competency. Firms are
typically looking at outsourcing support functions such as HR (recruitment and talent management), Procurement
functions (procuring material for business operations), Finance and Accounting (Order management, Billing,
Transaction processing, etc.) which help run businesses but are not their actual business. Given that these processes
require a more detailed understanding of a company's operations and are not as easy to outsource as software, this
market is going slower than Application Outsourcing.
ACCENTURE'S LEADERSHIP IN BUSINESS PROCESS OUTSOURCING – Accenture is among the top players in this field and
competes with the Indian IT services players. However, in certain fields such as HR, F&A, BPO, etc. it is among the
market leaders.
Resources available - Accenture's global delivery network around the world allows it to leverage its resources 24/7
making it best suited for global companies and one of the most competitive firms in this aspect.
Industry Expertise - Accenture is able to leverage its wide industry knowledge through its experts in Management
and Technology Consulting and thus adds strategic value to a client thereby giving it excellent market understanding.
Number of Accenture Business Process Outsourcing Professionals (K )
2008 0 9 1 0 1 1 1 2 1 3 1 4 1 5 1 6 1 7 1 8 1 90
1 0
2 0
3 0
4 0
5 0
6 0
TREFIS ANALYSIS for ACCENTURE [email protected] + 1 617 394 8763 •21
Experience - Accenture has more than 15 years of experience in providing BPO services making it one of the most
mature organizations in the field.
Scope & Breadth of Services - Accenture offers customized services in each of its service offerings, tailor-made for its
client from HR to F&A, and customer management to procurement and even specialized offerings for companies in
the field of insurance, pharmaceuticals and utilities.
Bundling - Accenture is able to bundle its BPO Offerings along with its Application and Infrastructure Outsourcing
Services thereby offering an end-to-end solution to its clients.
Sources for historical data and explanations can be found on the Trefis.com website (link)
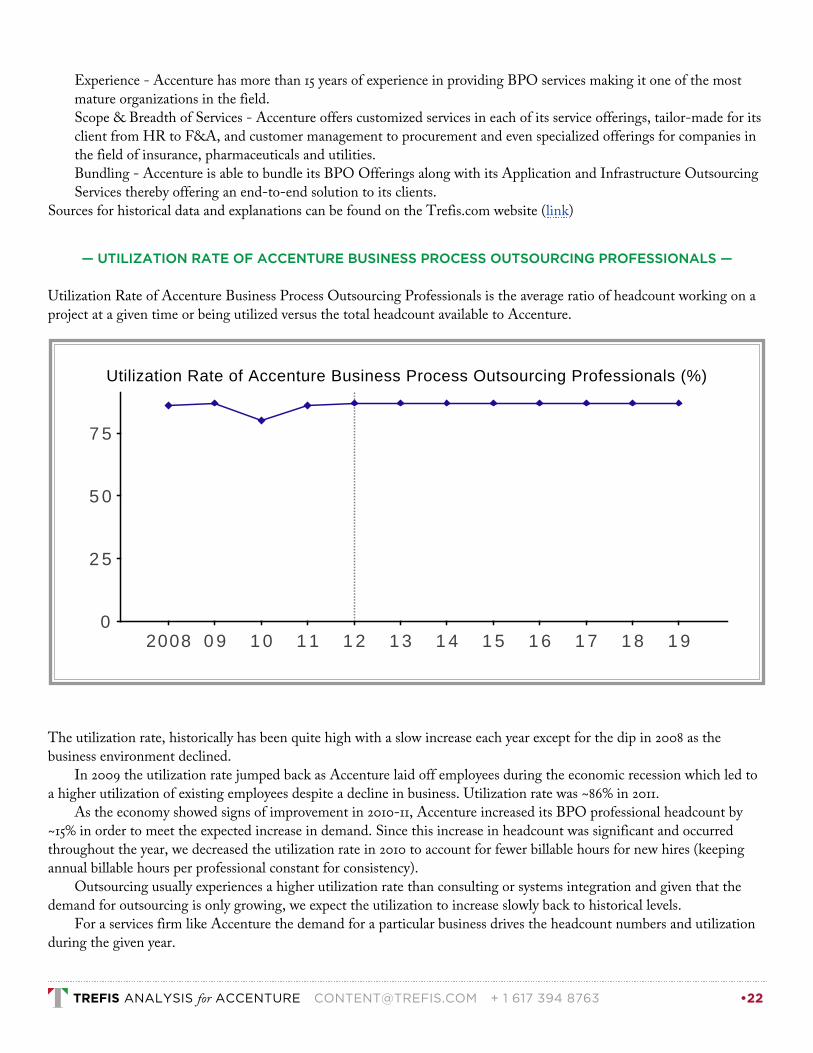
— UTILIZATION RATE OF ACCENTURE BUSINESS PROCESS OUTSOURCING PROFESSIONALS —
Utilization Rate of Accenture Business Process Outsourcing Professionals is the average ratio of headcount working on a
project at a given time or being utilized versus the total headcount available to Accenture.
The utilization rate, historically has been quite high with a slow increase each year except for the dip in 2008 as the
business environment declined.
In 2009 the utilization rate jumped back as Accenture laid off employees during the economic recession which led to
a higher utilization of existing employees despite a decline in business. Utilization rate was ~86% in 2011.
As the economy showed signs of improvement in 2010-11, Accenture increased its BPO professional headcount by
~15% in order to meet the expected increase in demand. Since this increase in headcount was significant and occurred
throughout the year, we decreased the utilization rate in 2010 to account for fewer billable hours for new hires (keeping
annual billable hours per professional constant for consistency).
Outsourcing usually experiences a higher utilization rate than consulting or systems integration and given that the
demand for outsourcing is only growing, we expect the utilization to increase slowly back to historical levels.
For a services firm like Accenture the demand for a particular business drives the headcount numbers and utilization
during the given year.
Utilization Rate of Accenture Business Process Outsourcing Professionals (%)
2008 0 9 1 0 1 1 1 2 1 3 1 4 1 5 1 6 1 7 1 8 1 90
2 5
5 0
7 5
TREFIS ANALYSIS for ACCENTURE [email protected] + 1 617 394 8763 •22
Forecast RationaleWe expect the utilization levels to go back up to optimum historical levels because firms like to maintain the utilization at
a certain maximum and keep bench strength for upcoming new projects. If the demand increases then instead of
increasing utilization rates they hire more.
Sources for historical data and explanations can be found on the Trefis.com website (link)
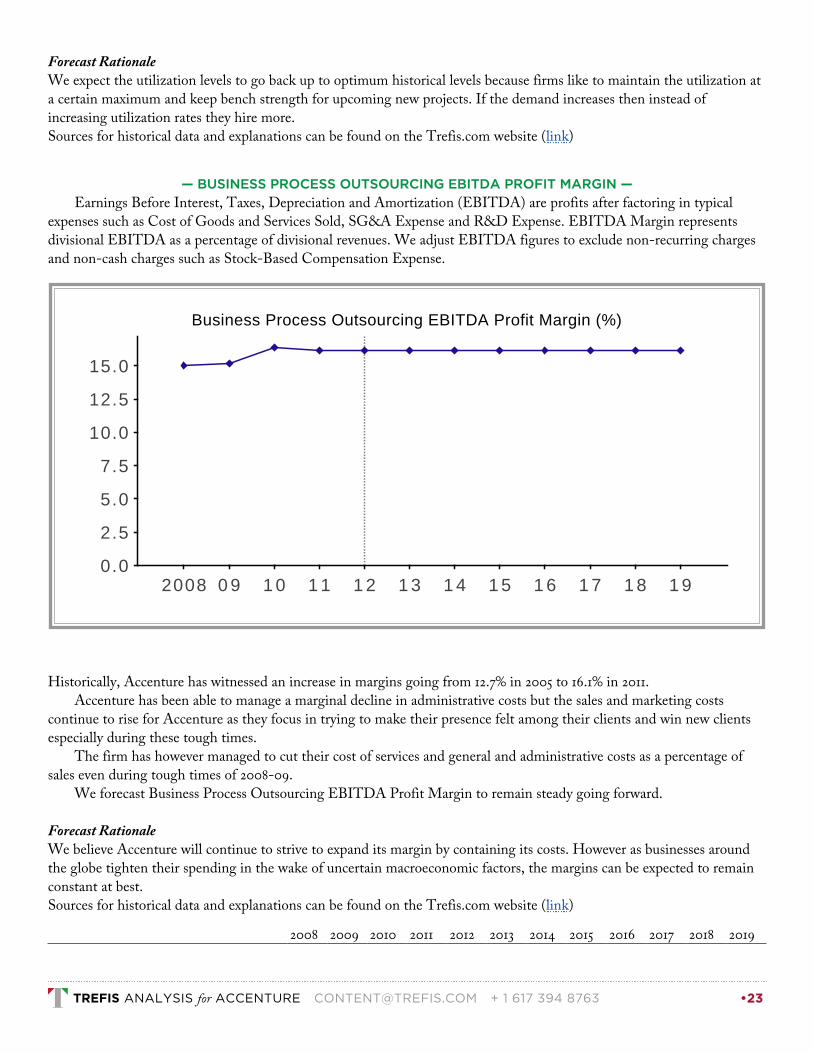
— BUSINESS PROCESS OUTSOURCING EBITDA PROFIT MARGIN —
Earnings Before Interest, Taxes, Depreciation and Amortization (EBITDA) are profits after factoring in typical
expenses such as Cost of Goods and Services Sold, SG&A Expense and R&D Expense. EBITDA Margin represents
divisional EBITDA as a percentage of divisional revenues. We adjust EBITDA figures to exclude non-recurring charges
and non-cash charges such as Stock-Based Compensation Expense.
Historically, Accenture has witnessed an increase in margins going from 12.7% in 2005 to 16.1% in 2011.
Accenture has been able to manage a marginal decline in administrative costs but the sales and marketing costs
continue to rise for Accenture as they focus in trying to make their presence felt among their clients and win new clients
especially during these tough times.
The firm has however managed to cut their cost of services and general and administrative costs as a percentage of
sales even during tough times of 2008-09.
We forecast Business Process Outsourcing EBITDA Profit Margin to remain steady going forward.
Forecast RationaleWe believe Accenture will continue to strive to expand its margin by containing its costs. However as businesses around
the globe tighten their spending in the wake of uncertain macroeconomic factors, the margins can be expected to remain
constant at best.
Sources for historical data and explanations can be found on the Trefis.com website (link)
Business Process Outsourcing EBITDA Profit Margin (%)
2008 0 9 1 0 1 1 1 2 1 3 1 4 1 5 1 6 1 7 1 8 1 90.0
2.5
5.0
7.5
10.0
12.5
15.0
2008 2009 2010 2011 2012 2013 2014 2015 2016 2017 2018 2019
TREFIS ANALYSIS for ACCENTURE [email protected] + 1 617 394 8763 •23

•
•
•
1.
2.
In addition, you can see the detailed P&L for the Business Outsourcing business in the Appendix (link)
Systems Integration The most important drivers for the Systems Integration business are:
Professional Bill Rate per Hour
Systems Integration Headcount
Systems Integration EBITDA Profit Margin
— PROFESSIONAL BILL RATE PER HOUR —
This is the average rate per hour that Accenture charges its clients for its consultants working on a project.
The average bill rate has declined by about 21% from 2005 to 2010 due to the following factors:
Indian outsourcing firms have jumped into the competition thus lowering the rates
The economic slowdown led to clients demand for cost-cutting resulting in further decrease in the bill rate
In 2011 it increased slightly by 3% to reach $52. Going forward we expect the bill rate to increase gradually, though it will
remain much below historical levels.
2008 2009 2010 2011 2012 2013 2014 2015 2016 2017 2018 2019
Total Revenue (Bil $) 3.27 3.13 3.32 3.98 4.27 4.53 4.80 5.10 5.41 5.74 6.08 6.45
Direct Expense (Bil $) 2.78 2.66 2.78 3.34 3.58 3.80 4.03 4.27 4.53 4.81 5.10 5.41
Indirect Expense (Mil $) 191 11.9 141 198 276 288 331 409 399 427 508 495
Adjusted EBITDA (Bil $) 0.49 0.48 0.54 0.64 0.69 0.73 0.78 0.82 0.87 0.93 0.98 1.04
Free Cash Flow (Mil $) n/a n/a n/a n/a 413 443 444 413 473 498 473 546
Professional Bill Rate per Hour ($)
2008 0 9 1 0 1 1 1 2 1 3 1 4 1 5 1 6 1 7 1 8 1 90
1 0
2 0
3 0
4 0
5 0
6 0
TREFIS ANALYSIS for ACCENTURE [email protected] + 1 617 394 8763 •24

1.
2.
Forecast RationaleSupporting:
BILL RATES WILL IMPROVE ALONG WITH THE ECONOMY – As the economy recovers, it will help the bill rates to
increase back from the levels of 2008-09.
Mitigating:
COMPETITION TO PRESSURIZE RATES – Indian players such as Infosys operate on a lower billing rate, and hence
despite low rates compared to Consulting, we do not expect the bill rate to increase much in order to stay competitive
in the market.
Sources for historical data and explanations can be found on the Trefis.com website (link)
— SYSTEMS INTEGRATION HEADCOUNT —
This refers to the total number of employees available in a particular division for projects.
Systems Integration Headcount increased by 50% from 2005 to 2008 as Accenture ramped up its headcount owing to an
increase in business demand. For a services firm like Accenture the demand for a particular business drives the headcount
numbers and utilization during the given year. In 2009 Systems Integration Headcount decreased by more than 5% as the
global economy went into recession and significantly decreased the demand for technology consulting with firms around
the world looking to cut cost. In 2010 as the economic environment showed some signs of improvement, Accenture
increased its headcount by as much as 15% expecting a surge in future demand. In 2011 it increased to ~30K and going
forward we expect the headcount figure to increase gradually.
Forecast RationaleAs the economy showed signs of improvement in 2010 and 2011, Accenture increased its headcount by anticipating a surge
in business in the future.
Systems Integration Headcount (K )
2008 0 9 1 0 1 1 1 2 1 3 1 4 1 5 1 6 1 7 1 8 1 90
5
1 0
1 5
2 0
2 5
3 0
3 5
TREFIS ANALYSIS for ACCENTURE [email protected] + 1 617 394 8763 •25
The firm has made extensive hiring taking advantage of the economic situation, hiring best-in-class talent at cheap
rates. We expect the headcount growth in the future to be very gradual.
Sources for historical data and explanations can be found on the Trefis.com website (link)
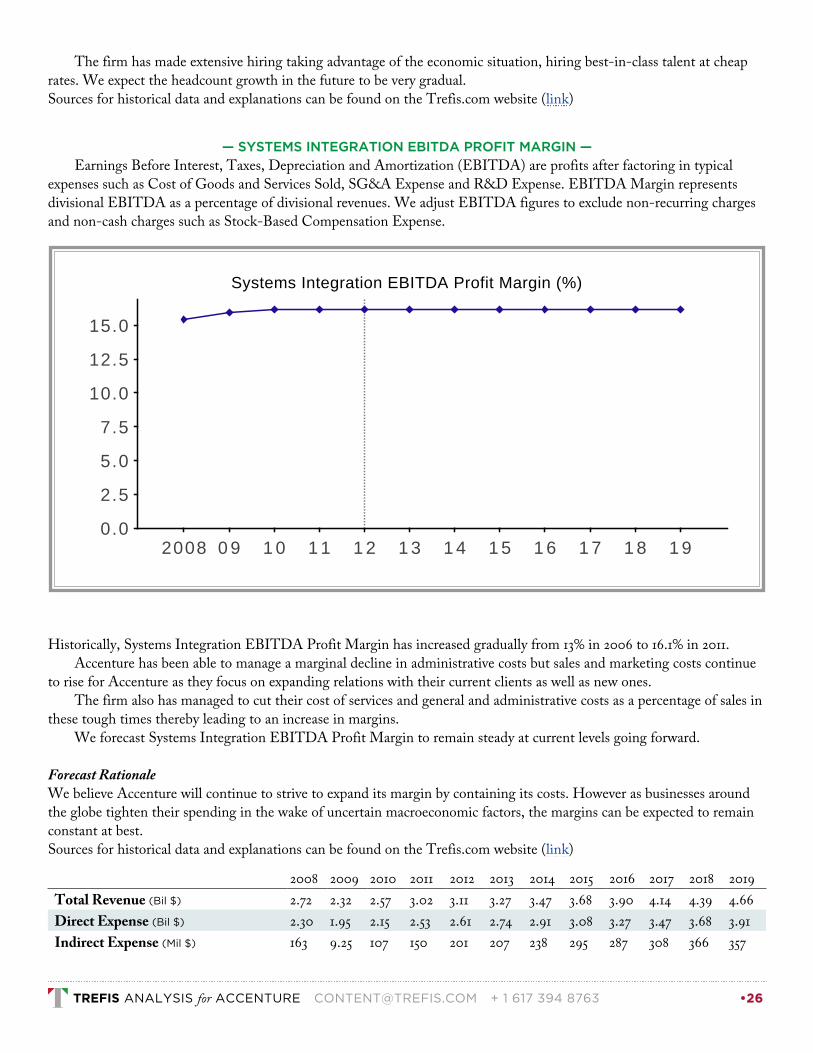
— SYSTEMS INTEGRATION EBITDA PROFIT MARGIN —
Earnings Before Interest, Taxes, Depreciation and Amortization (EBITDA) are profits after factoring in typical
expenses such as Cost of Goods and Services Sold, SG&A Expense and R&D Expense. EBITDA Margin represents
divisional EBITDA as a percentage of divisional revenues. We adjust EBITDA figures to exclude non-recurring charges
and non-cash charges such as Stock-Based Compensation Expense.
Historically, Systems Integration EBITDA Profit Margin has increased gradually from 13% in 2006 to 16.1% in 2011.
Accenture has been able to manage a marginal decline in administrative costs but sales and marketing costs continue
to rise for Accenture as they focus on expanding relations with their current clients as well as new ones.
The firm also has managed to cut their cost of services and general and administrative costs as a percentage of sales in
these tough times thereby leading to an increase in margins.
We forecast Systems Integration EBITDA Profit Margin to remain steady at current levels going forward.
Forecast RationaleWe believe Accenture will continue to strive to expand its margin by containing its costs. However as businesses around
the globe tighten their spending in the wake of uncertain macroeconomic factors, the margins can be expected to remain
constant at best.
Sources for historical data and explanations can be found on the Trefis.com website (link)
Systems Integration EBITDA Profit Margin (%)
2008 0 9 1 0 1 1 1 2 1 3 1 4 1 5 1 6 1 7 1 8 1 90.0
2.5
5.0
7.5
10.0
12.5
15.0
2008 2009 2010 2011 2012 2013 2014 2015 2016 2017 2018 2019
Total Revenue (Bil $) 2.72 2.32 2.57 3.02 3.11 3.27 3.47 3.68 3.90 4.14 4.39 4.66
Direct Expense (Bil $) 2.30 1.95 2.15 2.53 2.61 2.74 2.91 3.08 3.27 3.47 3.68 3.91
Indirect Expense (Mil $) 163 9.25 107 150 201 207 238 295 287 308 366 357
TREFIS ANALYSIS for ACCENTURE [email protected] + 1 617 394 8763 •26
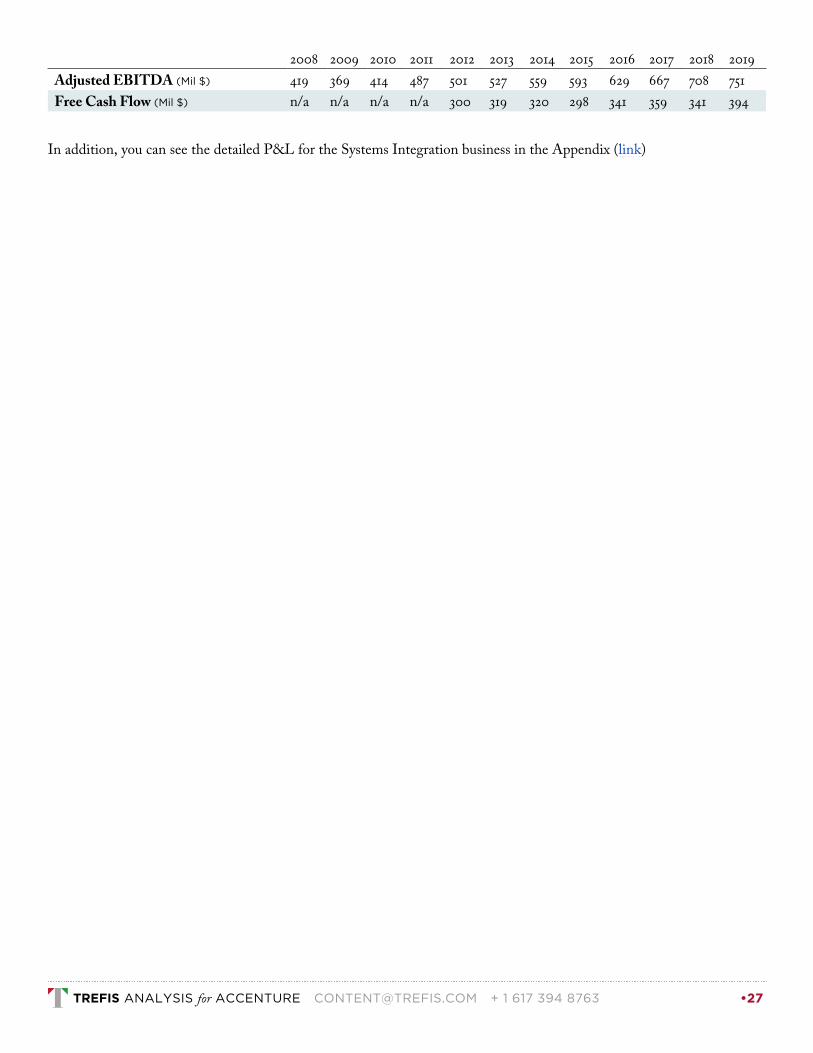
In addition, you can see the detailed P&L for the Systems Integration business in the Appendix (link)
2008 2009 2010 2011 2012 2013 2014 2015 2016 2017 2018 2019
Adjusted EBITDA (Mil $) 419 369 414 487 501 527 559 593 629 667 708 751
Free Cash Flow (Mil $) n/a n/a n/a n/a 300 319 320 298 341 359 341 394
TREFIS ANALYSIS for ACCENTURE [email protected] + 1 617 394 8763 •27
Learn More
— Related Trefis Coverage —
If you're interested in Accenture, you may also want to see the Trefis coverage for companies such as:
IBM
HP
Dell
Lexmark
ADP
Paychex
See the list of all companies covered by Trefis
— 2 Week Free Trial of Trefis Pro —
Liked this report? Get access to even more comprehensive reports along with interactive analyses with Trefis Pro
Try Trefis Pro for 2 weeks
— About Trefis —
Trefis.com was founded by MIT engineers and former Wall Street analysts who realized that most people do not
understand the seemingly familiar companies around them including well known companies like Apple, Google, Coca
Cola, GE, Ford and Gap to name a few.
The Trefis platform uses extensive data to show in a single snapshot what drives the value of a company's business.
We move beyond the qualitative notion "if you love the coffee at Dunkin’ Donuts, you should think about buying the
stock," to answer quantitative questions like "If their coffee sales are up 10% next year but doughnut sales are down 5%,
what happens to the value of the company?"
Trefis analysts spend weeks evaluating each stock that we cover and utilize commonly used valuation methodologies
to determine a Trefis price for each company. We present you with not only our synthesized view but also every single
step within the valuation process used to determine the Trefis price which you can see via our interactive analysis on
Trefis.com.
Learn more about the Trefis story
Read the Trefis FAQ
TREFIS ANALYSIS for ACCENTURE [email protected] + 1 617 394 8763 •28
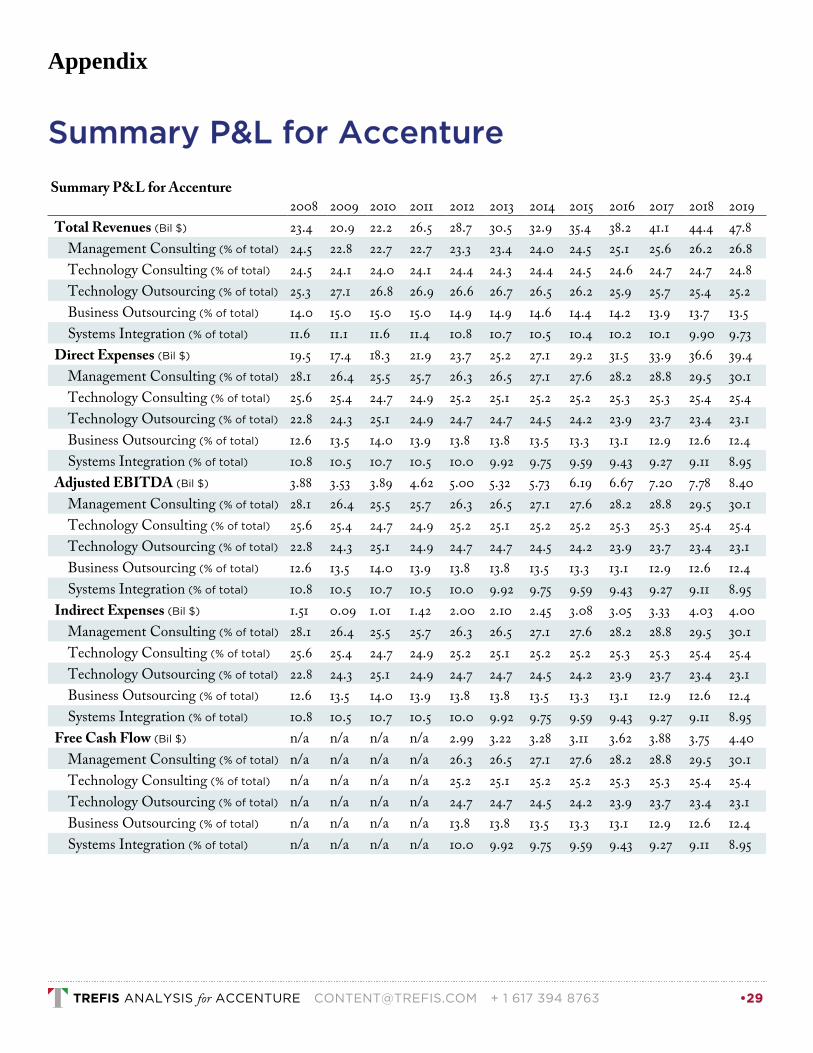
Appendix
Summary P&L for Accenture
Summary P&L for Accenture
2008 2009 2010 2011 2012 2013 2014 2015 2016 2017 2018 2019
Total Revenues (Bil $) 23.4 20.9 22.2 26.5 28.7 30.5 32.9 35.4 38.2 41.1 44.4 47.8
Management Consulting (% of total) 24.5 22.8 22.7 22.7 23.3 23.4 24.0 24.5 25.1 25.6 26.2 26.8
Technology Consulting (% of total) 24.5 24.1 24.0 24.1 24.4 24.3 24.4 24.5 24.6 24.7 24.7 24.8
Technology Outsourcing (% of total) 25.3 27.1 26.8 26.9 26.6 26.7 26.5 26.2 25.9 25.7 25.4 25.2
Business Outsourcing (% of total) 14.0 15.0 15.0 15.0 14.9 14.9 14.6 14.4 14.2 13.9 13.7 13.5
Systems Integration (% of total) 11.6 11.1 11.6 11.4 10.8 10.7 10.5 10.4 10.2 10.1 9.90 9.73
Direct Expenses (Bil $) 19.5 17.4 18.3 21.9 23.7 25.2 27.1 29.2 31.5 33.9 36.6 39.4
Management Consulting (% of total) 28.1 26.4 25.5 25.7 26.3 26.5 27.1 27.6 28.2 28.8 29.5 30.1
Technology Consulting (% of total) 25.6 25.4 24.7 24.9 25.2 25.1 25.2 25.2 25.3 25.3 25.4 25.4
Technology Outsourcing (% of total) 22.8 24.3 25.1 24.9 24.7 24.7 24.5 24.2 23.9 23.7 23.4 23.1
Business Outsourcing (% of total) 12.6 13.5 14.0 13.9 13.8 13.8 13.5 13.3 13.1 12.9 12.6 12.4
Systems Integration (% of total) 10.8 10.5 10.7 10.5 10.0 9.92 9.75 9.59 9.43 9.27 9.11 8.95
Adjusted EBITDA (Bil $) 3.88 3.53 3.89 4.62 5.00 5.32 5.73 6.19 6.67 7.20 7.78 8.40
Management Consulting (% of total) 28.1 26.4 25.5 25.7 26.3 26.5 27.1 27.6 28.2 28.8 29.5 30.1
Technology Consulting (% of total) 25.6 25.4 24.7 24.9 25.2 25.1 25.2 25.2 25.3 25.3 25.4 25.4
Technology Outsourcing (% of total) 22.8 24.3 25.1 24.9 24.7 24.7 24.5 24.2 23.9 23.7 23.4 23.1
Business Outsourcing (% of total) 12.6 13.5 14.0 13.9 13.8 13.8 13.5 13.3 13.1 12.9 12.6 12.4
Systems Integration (% of total) 10.8 10.5 10.7 10.5 10.0 9.92 9.75 9.59 9.43 9.27 9.11 8.95
Indirect Expenses (Bil $) 1.51 0.09 1.01 1.42 2.00 2.10 2.45 3.08 3.05 3.33 4.03 4.00
Management Consulting (% of total) 28.1 26.4 25.5 25.7 26.3 26.5 27.1 27.6 28.2 28.8 29.5 30.1
Technology Consulting (% of total) 25.6 25.4 24.7 24.9 25.2 25.1 25.2 25.2 25.3 25.3 25.4 25.4
Technology Outsourcing (% of total) 22.8 24.3 25.1 24.9 24.7 24.7 24.5 24.2 23.9 23.7 23.4 23.1
Business Outsourcing (% of total) 12.6 13.5 14.0 13.9 13.8 13.8 13.5 13.3 13.1 12.9 12.6 12.4
Systems Integration (% of total) 10.8 10.5 10.7 10.5 10.0 9.92 9.75 9.59 9.43 9.27 9.11 8.95
Free Cash Flow (Bil $) n/a n/a n/a n/a 2.99 3.22 3.28 3.11 3.62 3.88 3.75 4.40
Management Consulting (% of total) n/a n/a n/a n/a 26.3 26.5 27.1 27.6 28.2 28.8 29.5 30.1
Technology Consulting (% of total) n/a n/a n/a n/a 25.2 25.1 25.2 25.2 25.3 25.3 25.4 25.4
Technology Outsourcing (% of total) n/a n/a n/a n/a 24.7 24.7 24.5 24.2 23.9 23.7 23.4 23.1
Business Outsourcing (% of total) n/a n/a n/a n/a 13.8 13.8 13.5 13.3 13.1 12.9 12.6 12.4
Systems Integration (% of total) n/a n/a n/a n/a 10.0 9.92 9.75 9.59 9.43 9.27 9.11 8.95
TREFIS ANALYSIS for ACCENTURE [email protected] + 1 617 394 8763 •29
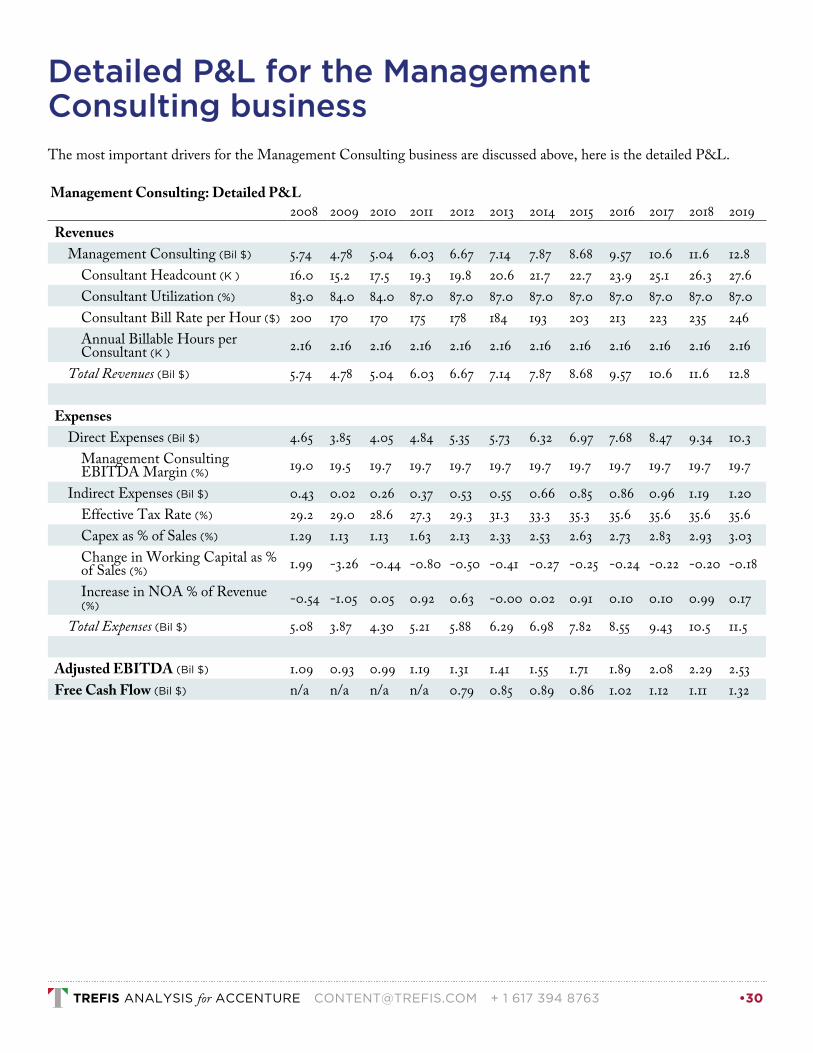
Detailed P&L for the ManagementConsulting business The most important drivers for the Management Consulting business are discussed above, here is the detailed P&L.
Management Consulting: Detailed P&L
2008 2009 2010 2011 2012 2013 2014 2015 2016 2017 2018 2019
Revenues
Management Consulting (Bil $) 5.74 4.78 5.04 6.03 6.67 7.14 7.87 8.68 9.57 10.6 11.6 12.8
Consultant Headcount (K ) 16.0 15.2 17.5 19.3 19.8 20.6 21.7 22.7 23.9 25.1 26.3 27.6
Consultant Utilization (%) 83.0 84.0 84.0 87.0 87.0 87.0 87.0 87.0 87.0 87.0 87.0 87.0
Consultant Bill Rate per Hour ($) 200 170 170 175 178 184 193 203 213 223 235 246
Annual Billable Hours per
Consultant (K )2.16 2.16 2.16 2.16 2.16 2.16 2.16 2.16 2.16 2.16 2.16 2.16
Total Revenues (Bil $) 5.74 4.78 5.04 6.03 6.67 7.14 7.87 8.68 9.57 10.6 11.6 12.8
Expenses
Direct Expenses (Bil $) 4.65 3.85 4.05 4.84 5.35 5.73 6.32 6.97 7.68 8.47 9.34 10.3
Management Consulting
EBITDA Margin (%)19.0 19.5 19.7 19.7 19.7 19.7 19.7 19.7 19.7 19.7 19.7 19.7
Indirect Expenses (Bil $) 0.43 0.02 0.26 0.37 0.53 0.55 0.66 0.85 0.86 0.96 1.19 1.20
Effective Tax Rate (%) 29.2 29.0 28.6 27.3 29.3 31.3 33.3 35.3 35.6 35.6 35.6 35.6
Capex as % of Sales (%) 1.29 1.13 1.13 1.63 2.13 2.33 2.53 2.63 2.73 2.83 2.93 3.03
Change in Working Capital as %
of Sales (%)1.99 -3.26 -0.44 -0.80 -0.50 -0.41 -0.27 -0.25 -0.24 -0.22 -0.20 -0.18
Increase in NOA % of Revenue
(%)-0.54 -1.05 0.05 0.92 0.63 -0.00 0.02 0.91 0.10 0.10 0.99 0.17
Total Expenses (Bil $) 5.08 3.87 4.30 5.21 5.88 6.29 6.98 7.82 8.55 9.43 10.5 11.5
Adjusted EBITDA (Bil $) 1.09 0.93 0.99 1.19 1.31 1.41 1.55 1.71 1.89 2.08 2.29 2.53
Free Cash Flow (Bil $) n/a n/a n/a n/a 0.79 0.85 0.89 0.86 1.02 1.12 1.11 1.32
TREFIS ANALYSIS for ACCENTURE [email protected] + 1 617 394 8763 •30
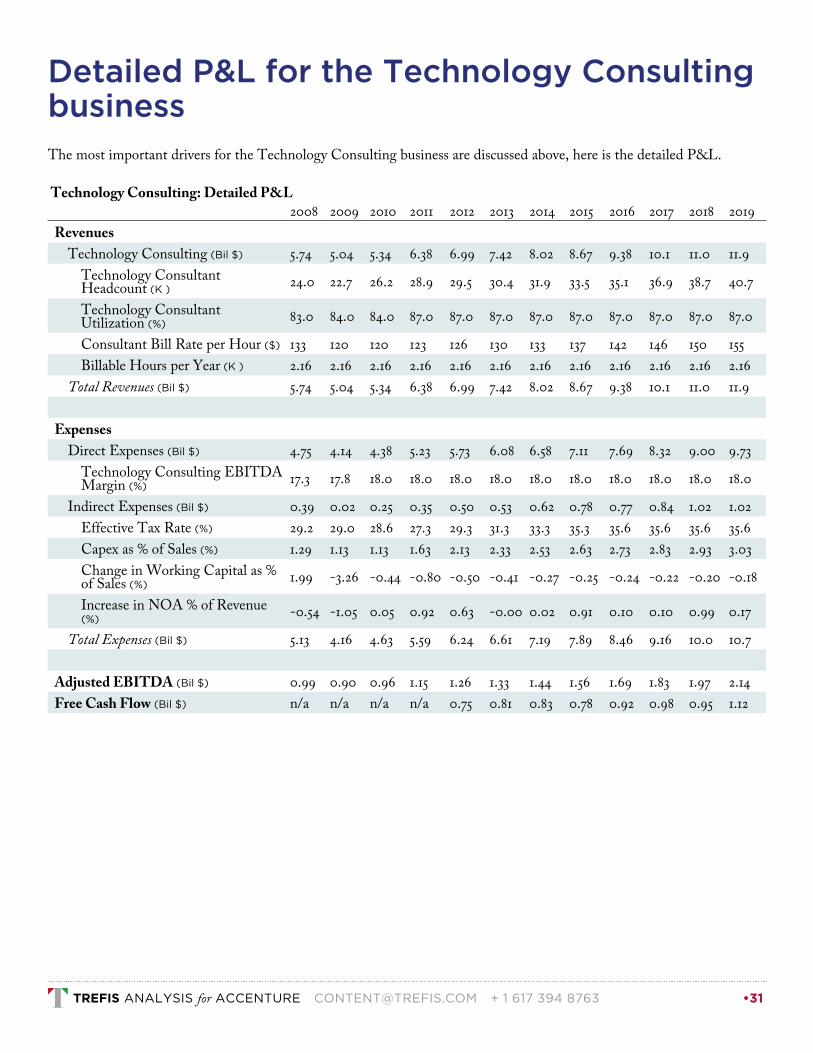
Detailed P&L for the Technology Consultingbusiness The most important drivers for the Technology Consulting business are discussed above, here is the detailed P&L.
Technology Consulting: Detailed P&L
2008 2009 2010 2011 2012 2013 2014 2015 2016 2017 2018 2019
Revenues
Technology Consulting (Bil $) 5.74 5.04 5.34 6.38 6.99 7.42 8.02 8.67 9.38 10.1 11.0 11.9
Technology Consultant
Headcount (K )24.0 22.7 26.2 28.9 29.5 30.4 31.9 33.5 35.1 36.9 38.7 40.7
Technology Consultant
Utilization (%)83.0 84.0 84.0 87.0 87.0 87.0 87.0 87.0 87.0 87.0 87.0 87.0
Consultant Bill Rate per Hour ($) 133 120 120 123 126 130 133 137 142 146 150 155
Billable Hours per Year (K ) 2.16 2.16 2.16 2.16 2.16 2.16 2.16 2.16 2.16 2.16 2.16 2.16
Total Revenues (Bil $) 5.74 5.04 5.34 6.38 6.99 7.42 8.02 8.67 9.38 10.1 11.0 11.9
Expenses
Direct Expenses (Bil $) 4.75 4.14 4.38 5.23 5.73 6.08 6.58 7.11 7.69 8.32 9.00 9.73
Technology Consulting EBITDA
Margin (%)17.3 17.8 18.0 18.0 18.0 18.0 18.0 18.0 18.0 18.0 18.0 18.0
Indirect Expenses (Bil $) 0.39 0.02 0.25 0.35 0.50 0.53 0.62 0.78 0.77 0.84 1.02 1.02
Effective Tax Rate (%) 29.2 29.0 28.6 27.3 29.3 31.3 33.3 35.3 35.6 35.6 35.6 35.6
Capex as % of Sales (%) 1.29 1.13 1.13 1.63 2.13 2.33 2.53 2.63 2.73 2.83 2.93 3.03
Change in Working Capital as %
of Sales (%)1.99 -3.26 -0.44 -0.80 -0.50 -0.41 -0.27 -0.25 -0.24 -0.22 -0.20 -0.18
Increase in NOA % of Revenue
(%)-0.54 -1.05 0.05 0.92 0.63 -0.00 0.02 0.91 0.10 0.10 0.99 0.17
Total Expenses (Bil $) 5.13 4.16 4.63 5.59 6.24 6.61 7.19 7.89 8.46 9.16 10.0 10.7
Adjusted EBITDA (Bil $) 0.99 0.90 0.96 1.15 1.26 1.33 1.44 1.56 1.69 1.83 1.97 2.14
Free Cash Flow (Bil $) n/a n/a n/a n/a 0.75 0.81 0.83 0.78 0.92 0.98 0.95 1.12
TREFIS ANALYSIS for ACCENTURE [email protected] + 1 617 394 8763 •31

Detailed P&L for the TechnologyOutsourcing business The most important drivers for the Technology Outsourcing business are discussed above, here is the detailed P&L.
Technology Outsourcing: Detailed P&L
2008 2009 2010 2011 2012 2013 2014 2015 2016 2017 2018 2019
Revenues
Application Outsourcing (AO) 4.78 4.58 4.80 5.75 6.17 6.61 7.08 7.59 8.12 8.70 9.32 9.98
Number of Accenture Software
Application Outsourcing
Professionals (K )56.0 53.1 61.2 67.5 70.2 73.7 77.4 81.2 85.3 89.6 94.1 98.8
Utilization Rate for Accenture
Application Outsourcing
Professionals (%)86.0 87.0 80.0 86.0 87.0 87.0 87.0 87.0 87.0 87.0 87.0 87.0
Bill Rate per Hour for Accenture
Software Application Outsourcing
Professionals ($)45.9 45.9 45.4 45.9 46.8 47.7 48.7 49.7 50.7 51.7 52.7 53.8
Annual Billable Hours per
Accenture Professional (K )2.16 2.16 2.16 2.16 2.16 2.16 2.16 2.16 2.16 2.16 2.16 2.16
Infrastructure Outsourcing (ITO) 1.14 1.09 1.15 1.37 1.46 1.53 1.61 1.69 1.78 1.87 1.96 2.06
ITO Headcount (K ) 13.4 12.7 14.6 16.1 16.6 17.1 17.6 18.1 18.7 19.2 19.8 20.4
ITO Utilization (%) 86.0 87.0 80.0 86.0 87.0 87.0 87.0 87.0 87.0 87.0 87.0 87.0
Professional Bill Rate per Hour
(ITO)45.9 45.9 45.4 45.9 46.8 47.7 48.7 49.7 50.7 51.7 52.7 53.8
Annual Billable Hours per
Professional (K )2.16 2.16 2.16 2.16 2.16 2.16 2.16 2.16 2.16 2.16 2.16 2.16
Total Revenues (Bil $) 5.92 5.67 5.95 7.13 7.63 8.14 8.69 9.28 9.90 10.6 11.3 12.0
Expenses
Direct Expenses (Bil $) 5.03 4.81 4.97 5.97 6.40 6.83 7.29 7.78 8.30 8.86 9.46 10.1
Technology Outsourcing
EBITDA Profit Margin (%)15.0 15.2 16.4 16.1 16.1 16.1 16.1 16.1 16.1 16.1 16.1 16.1
Indirect Expenses (Mil $) 345 21.5 253 354 494 518 599 744 731 788 942 924
Effective Tax Rate (%) 29.2 29.0 28.6 27.3 29.3 31.3 33.3 35.3 35.6 35.6 35.6 35.6
Capex as % of Sales (%) 1.29 1.13 1.13 1.63 2.13 2.33 2.53 2.63 2.73 2.83 2.93 3.03
Change in Working Capital as %
of Sales (%)1.99 -3.26 -0.44 -0.80 -0.50 -0.41 -0.27 -0.25 -0.24 -0.22 -0.20 -0.18
Increase in NOA % of Revenue
(%)-0.54 -1.05 0.05 0.92 0.63 -0.00 0.02 0.91 0.10 0.10 0.99 0.17
Total Expenses (Bil $) 5.38 4.83 5.23 6.33 6.89 7.35 7.89 8.52 9.03 9.65 10.4 11.0
Adjusted EBITDA (Bil $) 0.89 0.86 0.98 1.15 1.23 1.32 1.40 1.50 1.60 1.71 1.82 1.94
Free Cash Flow (Bil $) n/a n/a n/a n/a 0.74 0.80 0.80 0.75 0.87 0.92 0.88 1.02
TREFIS ANALYSIS for ACCENTURE [email protected] + 1 617 394 8763 •32

Detailed P&L for the Business Outsourcingbusiness The most important drivers for the Business Outsourcing business are discussed above, here is the detailed P&L.
Business Outsourcing: Detailed P&L
2008 2009 2010 2011 2012 2013 2014 2015 2016 2017 2018 2019
Revenues
Business Process Outsourcing (BPO) 3.27 3.13 3.32 3.98 4.27 4.53 4.80 5.10 5.41 5.74 6.08 6.45
Number of Accenture Business
Process Outsourcing Professionals
(K )38.4 36.3 41.9 46.2 48.1 50.0 52.0 54.0 56.2 58.5 60.8 63.2
Utilization Rate of Accenture
Business Process Outsourcing
Professionals (%)86.0 87.0 80.0 86.0 87.0 87.0 87.0 87.0 87.0 87.0 87.0 87.0
Bill Rate per Hour for Accenture
Business Process Outsourcing
Professionals ($)45.9 45.9 45.9 46.4 47.3 48.2 49.2 50.2 51.2 52.2 53.3 54.3
Annual Billable Hours per
Professional (K )2.16 2.16 2.16 2.16 2.16 2.16 2.16 2.16 2.16 2.16 2.16 2.16
Total Revenues (Bil $) 3.27 3.13 3.32 3.98 4.27 4.53 4.80 5.10 5.41 5.74 6.08 6.45
Expenses
Direct Expenses (Bil $) 2.78 2.66 2.78 3.34 3.58 3.80 4.03 4.27 4.53 4.81 5.10 5.41
Business Process Outsourcing
EBITDA Profit Margin (%)15.0 15.2 16.4 16.1 16.1 16.1 16.1 16.1 16.1 16.1 16.1 16.1
Indirect Expenses (Mil $) 191 11.9 141 198 276 288 331 409 399 427 508 495
Effective Tax Rate (%) 29.2 29.0 28.6 27.3 29.3 31.3 33.3 35.3 35.6 35.6 35.6 35.6
Capex as % of Sales (%) 1.29 1.13 1.13 1.63 2.13 2.33 2.53 2.63 2.73 2.83 2.93 3.03
Change in Working Capital as %
of Sales (%)1.99 -3.26 -0.44 -0.80 -0.50 -0.41 -0.27 -0.25 -0.24 -0.22 -0.20 -0.18
Increase in NOA % of Revenue
(%)-0.54 -1.05 0.05 0.92 0.63 -0.00 0.02 0.91 0.10 0.10 0.99 0.17
Total Expenses (Bil $) 2.97 2.67 2.92 3.53 3.86 4.09 4.36 4.68 4.93 5.24 5.61 5.91
Adjusted EBITDA (Bil $) 0.49 0.48 0.54 0.64 0.69 0.73 0.78 0.82 0.87 0.93 0.98 1.04
Free Cash Flow (Mil $) n/a n/a n/a n/a 413 443 444 413 473 498 473 546
TREFIS ANALYSIS for ACCENTURE [email protected] + 1 617 394 8763 •33

Detailed P&L for the Systems Integrationbusiness The most important drivers for the Systems Integration business are discussed above, here is the detailed P&L.
Systems Integration: Detailed P&L
2008 2009 2010 2011 2012 2013 2014 2015 2016 2017 2018 2019
Revenues
Systems Integration (Bil $) 2.72 2.32 2.57 3.02 3.11 3.27 3.47 3.68 3.90 4.14 4.39 4.66
Systems Integration Headcount (K)
25.2 23.9 27.5 30.3 30.6 31.3 32.2 33.2 34.2 35.2 36.2 37.3
Systems Integration Utilization
(%)85.0 85.0 85.0 88.0 88.0 88.0 88.0 88.0 88.0 88.0 88.0 88.0
Professional Bill Rate per Hour
($)58.8 52.9 50.8 52.3 53.4 55.0 56.6 58.3 60.1 61.9 63.7 65.7
Annual Billable Hours per
Professional (K )2.16 2.16 2.16 2.16 2.16 2.16 2.16 2.16 2.16 2.16 2.16 2.16
Total Revenues (Bil $) 2.72 2.32 2.57 3.02 3.11 3.27 3.47 3.68 3.90 4.14 4.39 4.66
Expenses
Direct Expenses (Bil $) 2.30 1.95 2.15 2.53 2.61 2.74 2.91 3.08 3.27 3.47 3.68 3.91
Systems Integration EBITDA
Profit Margin (%)15.4 15.9 16.1 16.1 16.1 16.1 16.1 16.1 16.1 16.1 16.1 16.1
Indirect Expenses (Mil $) 163 9.25 107 150 201 207 238 295 287 308 366 357
Effective Tax Rate (%) 29.2 29.0 28.6 27.3 29.3 31.3 33.3 35.3 35.6 35.6 35.6 35.6
Capex as % of Sales (%) 1.29 1.13 1.13 1.63 2.13 2.33 2.53 2.63 2.73 2.83 2.93 3.03
Change in Working Capital as %
of Sales (%)1.99 -3.26 -0.44 -0.80 -0.50 -0.41 -0.27 -0.25 -0.24 -0.22 -0.20 -0.18
Increase in NOA % of Revenue
(%)-0.54 -1.05 0.05 0.92 0.63 -0.00 0.02 0.91 0.10 0.10 0.99 0.17
Total Expenses (Bil $) 2.46 1.96 2.26 2.68 2.81 2.95 3.14 3.38 3.56 3.78 4.05 4.26
Adjusted EBITDA (Mil $) 419 369 414 487 501 527 559 593 629 667 708 751
Free Cash Flow (Mil $) n/a n/a n/a n/a 300 319 320 298 341 359 341 394
TREFIS ANALYSIS for ACCENTURE [email protected] + 1 617 394 8763 •34