Embed Size (px)
Citation preview
ENDANGERED SPECIES RESEARCHEndang Species Res
Vol. 31: 1–12, 2016doi: 10.3354/esr00746
Published August 19
INTRODUCTION
Tri-axial accelerometers are becoming commonlyused devices that, when attached to animals, recordacceleration due to the individual’s movement andorientation (Shepard et al. 2008, Sala et al. 2011,Brown et al. 2013). Such acceleration data allows forthe remote sensing of animal behavior without humanpresence. For example, accelerometers have beenemployed to detect activity levels (Wilson et al. 2006,Halsey et al. 2009, Enstipp et al. 2011), body orienta-
tion (Lyons et al. 2005, Ringgenberg et al. 2010),movement through space (Rothwell et al. 2011), spe-cific behavioral states (Gómez Laich et al. 2008,Moreau et al. 2009, Whitney et al. 2010), and internalstates (Wilson et al. 2014) of a variety of animals.
Accelerometers may also prove to be powerfultools for remotely monitoring elephant behavior. Inzoos, such data could be useful for long-term behav-ioral research and real-time detection of elephantdistress that may require attention. For example, ifthe need for increased exercise is indicated for a par-
© The authors 2016. Open Access under Creative Commons byAttribution Licence. Use, distribution and reproduction are un -restricted. Authors and original publication must be credited.
Publisher: Inter-Research · www.int-res.com
*Corresponding author: [email protected]
Accelerometers and simple algorithms identifyactivity budgets and body orientation in African
elephants Loxodonta africana
Joseph Soltis1,*, Lucy King2,3, Fritz Vollrath2,3, Iain Douglas-Hamilton2,3
1Education and Science, Disney’s Animal Kingdom®, Bay Lake, Florida 32830, USA2Save the Elephants, PO Box 54667, Nairobi 00200, Kenya
3Animal Behaviour Research Group, Department of Zoology, University of Oxford, Oxford OX1 2JD, UK
ABSTRACT: Accelerometers can be used to monitor animal behavior remotely, but validation isrequired for each species. Previously, we showed that accelerometer data in collars could be usedto identify specific behaviors in African elephants Loxodonta africana, using complex analyticalmethods. Here, we show that simple methods can also be used to identify elephant activity levelsand body orientation. Subjects were 6 African elephants: 3 at Disney’s Animal Kingdom®, Florida,USA, and 3 in Samburu-Laikipia, Kenya. Each elephant wore a collar containing a tri-axial ac -celerometer positioned on top of the neck. Simultaneous video recordings allowed validation ofaccelerometer data against observed behavior. The standard deviation of the total accelerationwas shown to be a valid measure of dynamic acceleration, differentiating activity levels associatedwith resting, feeding, bathing, walking, and rapid walking. The mean of the total acceleration wasshown to be a valid measure of static acceleration, and indicated upright and recumbent orienta-tions. Simulations showed how accuracy was affected by sample rate, number of axes examined,and analysis window lengths. Based on 34 continuous 24 h acceleration streams, the 6 elephantsexhibited an average of 2.5 h of overnight recumbence associated with minimal movement, indi-cating sleep. Daily activity budgets exhibited periods of minimal activity (e.g. resting, 17%), lowactivity (e.g. feeding, 68%), medium activity (e.g. walking, 13%), and high activity (e.g. rapidwalking, 2%). Kenyan elephants were slightly more active and exhibited less restful recumbencecompared to zoo elephants. Accelerometers in elephant collars can detect activity levels that areassociated with specific behaviors, and can detect body orientation as a proxy for sleep.
KEY WORDS: Behavior measurement · Accelerometry · Elephant management
OPENPEN ACCESSCCESS
Endang Species Res 31: 1–12, 2016
ticular elephant, accelerometers could determine ifinterventions to increase activity, such as enrichmenttechniques, are effective (e.g. Soulsby 2012, Rothwellet al. 2011). Accelerometers may also be used to de -tect atypical behaviors that require immediate atten-tion, such as limping (e.g. Pastell et al. 2009).
Accelerometer research on zoo and safari park ele-phants is on the increase. For example, Rothwell etal. (2011) showed that accelerometers in anklets canbe used to count steps and infer walking distance inAfrican elephants, and Ren & Hutchinson (2008)used accelerometers attached to the legs to investi-gate gaits of walking Asian and African elephants. Ina multi-institutional study, Holdgate et al. (2016)used accelerometers in anklets to measure recum-bence in both Asian and African elephants. Finally,Soulsby (2012) used accelerometers and GPS units incollars on Asian elephants Elephas maximus tomeasure activity budgets, activity levels associatedwith specific behaviors, and the correlation betweenactivity level and walking distance. Our group previ-ously attached accelerometers in collars to Africanelephants at Disney’s Animal Kingdom®, showingthat common elephant behaviors (resting, feeding,bathing, and walking) can be differentiated from oneanother using dynamic acceleration and the perio-dicity of movement (Soltis et al. 2012). We alsoshowed that elephants walk with a different posturedependent on whether they are in a positive or nega-tive emotional state (Wilson et al. 2014).
We could not find published research on acce lero -meter use in wild elephants, but data from accelero -meters would be very useful for long-term behavioralresearch in free-ranging populations (e.g. Wall et al.2014, O’Donoghue & Rutz 2016). For example, ac -celerometers could be used to determine energyexpenditure during different behavioral states, suchas female estrous or male musth, or in different eco-logical contexts, such as dry versus wet seasons.Also, real-time analysis of accelerometer data coulddetect when elephants are in distress. For example, alimping gait or sudden falling (e.g. Bourke et al.2007) may indicate instances of injury or attack byhumans, and electronic messages could be sent towildlife veterinarians or anti-poaching units (O’Dono -ghue & Rutz 2016).
Collars are routinely used to house various sensorsin both wild and zoo contexts (see citations above),and here, we extend our previous findings fromaccelerometers embedded in elephant collars (Soltiset al. 2012). Our scope extends validations of acce -lerometer data to detect body orientation (uprightversus recumbent) in addition to overall activity lev-
els (Soltis et al. 2012), in wild African elephants, aswell as zoo-housed elephants (Soltis et al. 2012).
In terms of methodology, we expand on our previ-ous work in 3 ways. First, we validate simple meth-ods for analyzing accelerometer data. In our previ-ous work, we used complex methods involving lineinterpolation, line subtraction, and Fourier transfor-mations. Simpler methods may prove useful, how-ever, in particular when low-cost, real-time analysisis re quired on-board elephant collars, or when userslack access to appropriate software. Therefore, wevalidated the mean of acceleration to measure bodyorientation (upright versus recumbent) and the stan-dard deviation of acceleration to measure activitylevels associated with a variety of elephant behav-iors (resting, feeding, bathing, walking, and rapidwalking). Second, we examine the trade-off be -tween data reduction and accuracy. Accelerometerdata can be abundant compared to other forms ofdata (e.g. GPS), and therefore costly to analyze ortransfer wirelessly. Nevertheless, the appropriatedata must be recorded such that targeted behavioris reliably detected. We used simulations to investi-gate how accuracy is affected by the number of axesexamined, sample rate, and analysis window length,so that researchers may use this information to de -sign data collection and analyses protocols. Third,we collected 24 h periods of continuous acce lero -meter streams for both wild and zoo elephants. Wedeveloped fully automated routines that computedactivity levels and body orientation from the acceler-ation streams, showing how these factors could beanalyzed in real-time. In so doing, we provide pre-liminary data on wild African elephant activitybudgets and recumbence and compare the re sultsto zoo-housed Disney elephants. These results, com-bined with those of Soltis et al. (2012), provide arobust foundation for the study of African elephantbehavior using tri-axial accelerometers.
MATERIALS AND METHODS
Study subjects and data collection
We collected accelerometry data from 6 adultfemale African elephants Loxodonta africana. Threeof the subjects were housed at Disney’s Animal King-dom®, Florida, USA, in a 1.6 ha outdoor exhibit dur-ing the day, and various indoor or outdoor enclosuresovernight (for details, see Soltis et al. 2012, Leighty etal. 2009). Data were collected from June to December2011, and April to September 2013. The outdoor ex -
2
Soltis et al.: Accelerometers determine elephant activity and orientation
hibit contained a large pool in which multiple ele-phants could submerge simultaneously, multiplescratching surfaces, a mud wallow, and large rockrings that allowed animals to move out of contact andvisual range of other animals and guests. Elephantsat Disney’s Animal Kingdom® have been trained inoperant conditioning to voluntarily wear collarsaround their necks to which various data collectingsensors have been attached, including audio-recordersand GPS units (e.g. Leighty et al. 2008). In the pres-ent study, tri-axial accelerometer loggers (X9-2mini,Gulf Coast Data Concepts,) were attached to the col-lars. These collars are described in detail by Leightyet al. (2009), and the specific accelerometer attach-ment is described by Soltis et al. (2012). Note thatHorback et al. (2012) showed that collars did not af -fect elephant behavior in another zoo context. Ac -celerometers were programmed to internally logdata at a 10 Hz sample rate on 3 axes. After record-ings, collars were removed from elephants by keeperstaff, and raw accelerometer data were downloadedfrom the loggers.
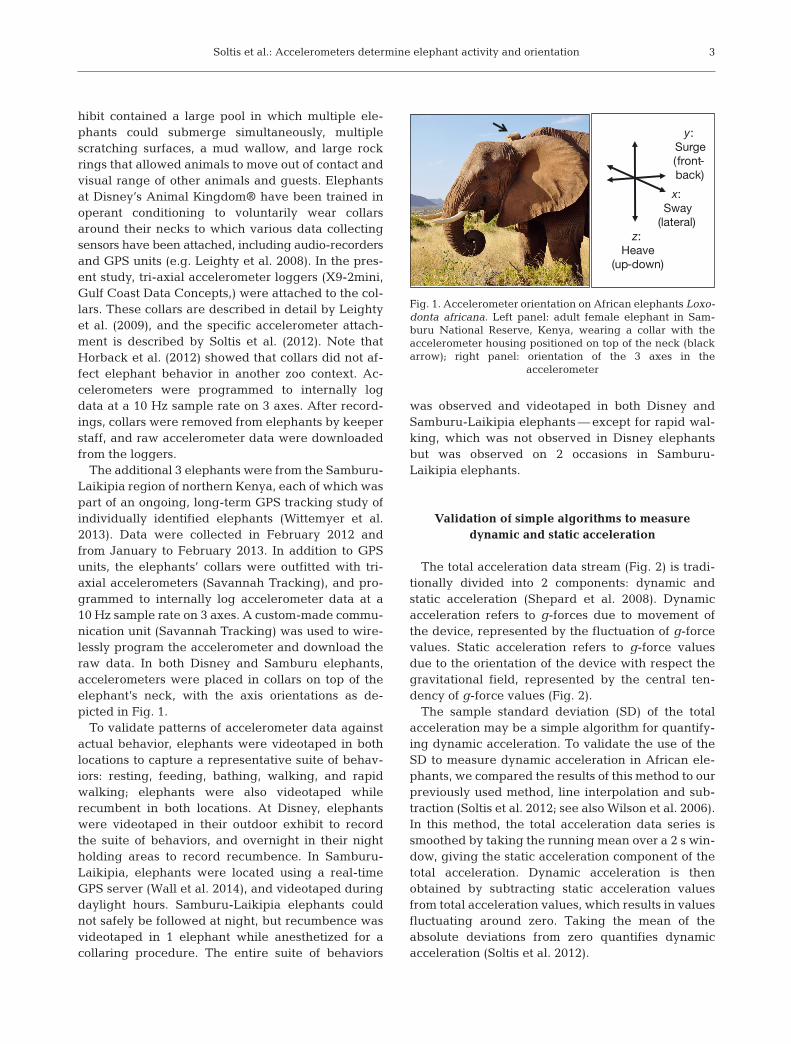
The additional 3 elephants were from the Samburu-Laikipia region of northern Kenya, each of which waspart of an ongoing, long-term GPS tracking study ofindividually identified elephants (Wittemyer et al.2013). Data were collected in February 2012 andfrom January to February 2013. In addition to GPSunits, the elephants’ collars were outfitted with tri-axial accelerometers (Savannah Tracking), and pro-grammed to internally log accelerometer data at a10 Hz sample rate on 3 axes. A custom-made commu-nication unit (Savannah Tracking) was used to wire-lessly program the accelerometer and download theraw data. In both Disney and Samburu elephants,accelerometers were placed in collars on top of theelephant’s neck, with the axis orientations as de -picted in Fig. 1.
To validate patterns of accelerometer data againstactual behavior, elephants were videotaped in bothlocations to capture a representative suite of behav-iors: resting, feeding, bathing, walking, and rapidwalking; elephants were also videotaped whilerecumbent in both locations. At Disney, elephantswere videotaped in their outdoor exhibit to recordthe suite of behaviors, and overnight in their nightholding areas to record recumbence. In Samburu-Laikipia, elephants were located using a real-timeGPS server (Wall et al. 2014), and videotaped duringdaylight hours. Samburu-Laikipia elephants couldnot safely be followed at night, but recumbence wasvideotaped in 1 elephant while anesthetized for acollaring procedure. The entire suite of behaviors
was observed and videotaped in both Disney andSamburu-Laikipia elephants — except for rapid wal -king, which was not observed in Disney elephantsbut was observed on 2 occasions in Samburu-Laikipia elephants.
Validation of simple algorithms to measuredynamic and static acceleration
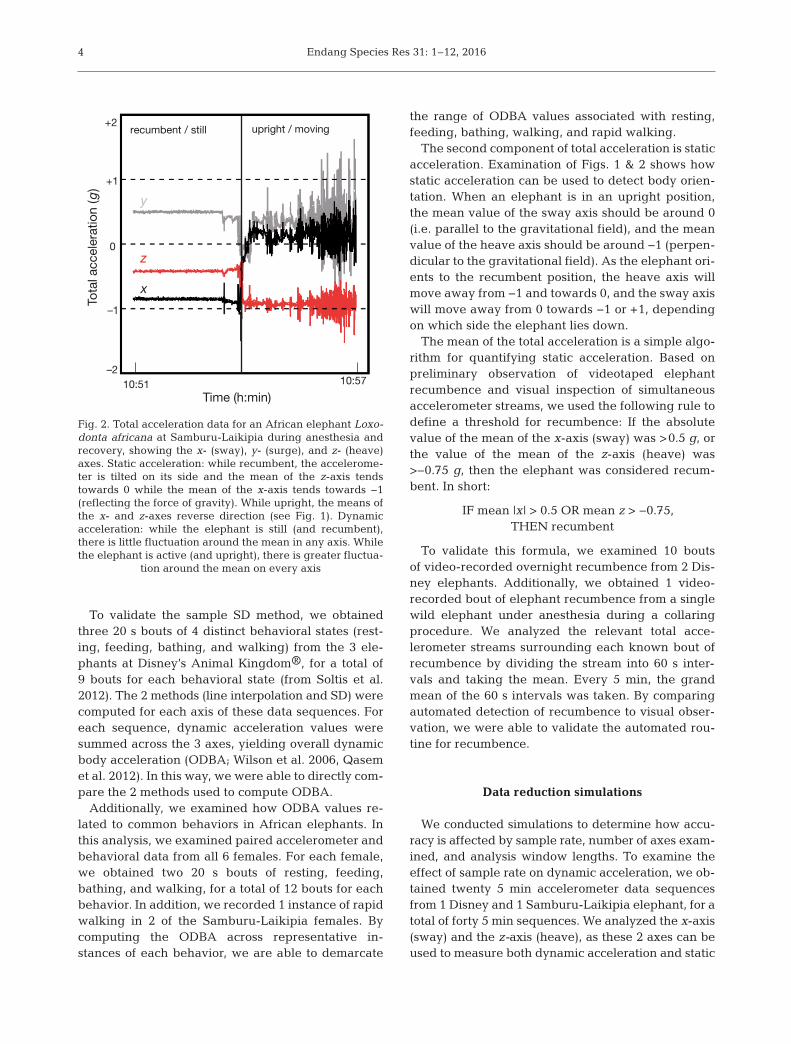
The total acceleration data stream (Fig. 2) is tradi-tionally divided into 2 components: dynamic andstatic acceleration (Shepard et al. 2008). Dynamicacceleration refers to g-forces due to movement ofthe device, represented by the fluctuation of g-forcevalues. Static acceleration refers to g-force valuesdue to the orientation of the device with respect thegravitational field, represented by the central ten-dency of g-force values (Fig. 2).
The sample standard deviation (SD) of the totalacceleration may be a simple algorithm for quantify-ing dynamic acceleration. To validate the use of theSD to measure dynamic acceleration in African ele-phants, we compared the results of this method to ourpreviously used method, line interpolation and sub-traction (Soltis et al. 2012; see also Wilson et al. 2006).In this method, the total acceleration data series issmoothed by taking the running mean over a 2 s win-dow, giving the static acceleration component of thetotal acceleration. Dynamic acceleration is thenobtained by subtracting static acceleration valuesfrom total acceleration values, which results in valuesfluctuating around zero. Taking the mean of theabsolute deviations from zero quantifies dynamicacceleration (Soltis et al. 2012).
3
x: Sway
(lateral)
y:Surge (front-back)
z:Heave
(up-down)
Fig. 1. Accelerometer orientation on African elephants Loxo -donta africana. Left panel: adult female elephant in Sam-buru National Reserve, Kenya, wearing a collar with theaccelerometer housing positioned on top of the neck (blackarrow); right panel: orientation of the 3 axes in the
accelerometer
Endang Species Res 31: 1–12, 2016
To validate the sample SD method, we obtainedthree 20 s bouts of 4 distinct behavioral states (rest-ing, feeding, bathing, and walking) from the 3 ele-phants at Disney’s Animal Kingdom®, for a total of9 bouts for each behavioral state (from Soltis et al.2012). The 2 methods (line interpolation and SD) werecomputed for each axis of these data se quen ces. Foreach sequence, dynamic acceleration values weresummed across the 3 axes, yielding overall dynamicbody acceleration (ODBA; Wilson et al. 2006, Qasemet al. 2012). In this way, we were able to directly com-pare the 2 methods used to compute ODBA.
Additionally, we examined how ODBA values re -lated to common behaviors in African elephants. Inthis analysis, we examined paired accelerometer andbehavioral data from all 6 females. For each female,we obtained two 20 s bouts of resting, feeding,bathing, and walking, for a total of 12 bouts for eachbehavior. In addition, we recorded 1 instance of rapidwalking in 2 of the Samburu-Laikipia females. Bycomputing the ODBA across representative in -stances of each behavior, we are able to demarcate
the range of ODBA values associated with resting,feeding, bathing, walking, and rapid walking.
The second component of total acceleration is staticacceleration. Examination of Figs. 1 & 2 shows howstatic acceleration can be used to detect body orien-tation. When an elephant is in an upright position,the mean value of the sway axis should be around 0(i.e. parallel to the gravitational field), and the meanvalue of the heave axis should be around −1 (perpen-dicular to the gravitational field). As the elephant ori-ents to the recumbent position, the heave axis willmove away from −1 and towards 0, and the sway axiswill move away from 0 towards −1 or +1, dependingon which side the elephant lies down.
The mean of the total acceleration is a simple algo-rithm for quantifying static acceleration. Based onpreliminary observation of videotaped elephantrecumbence and visual inspection of simultaneousaccelerometer streams, we used the following rule todefine a threshold for recumbence: If the absolutevalue of the mean of the x-axis (sway) was >0.5 g, orthe value of the mean of the z-axis (heave) was>−0.75 g, then the elephant was considered recum-bent. In short:
IF mean |x| > 0.5 OR mean z > −0.75, THEN recumbent
To validate this formula, we examined 10 boutsof video-recorded overnight recumbence from 2 Dis-ney elephants. Additionally, we obtained 1 video-recorded bout of elephant recumbence from a singlewild elephant under anesthesia during a collaringprocedure. We analyzed the relevant total acce -lerometer streams surrounding each known bout ofrecumbence by dividing the stream into 60 s inter-vals and taking the mean. Every 5 min, the grandmean of the 60 s intervals was taken. By comparingautomated detection of recumbence to visual obser-vation, we were able to validate the automated rou-tine for recumbence.
Data reduction simulations
We conducted simulations to determine how accu-racy is affected by sample rate, number of axes exam-ined, and analysis window lengths. To examine theeffect of sample rate on dynamic acceleration, we ob-tained twenty 5 min accelerometer data sequencesfrom 1 Disney and 1 Samburu-Laikipia elephant, for atotal of forty 5 min sequences. We analyzed the x-axis(sway) and the z-axis (heave), as these 2 axes can beused to measure both dynamic acceleration and static
4
Tota
l acc
eler
atio
n (g
)
Time (h:min)
–2
+2
+1
–1
0
10:51 10:57
y
z
x
recumbent / still upright / moving
Fig. 2. Total acceleration data for an African elephant Loxo -donta africana at Samburu-Laikipia during anesthesia andrecovery, showing the x- (sway), y- (surge), and z- (heave)axes. Static acceleration: while recumbent, the accelerome-ter is tilted on its side and the mean of the z-axis tendstowards 0 while the mean of the x-axis tends towards −1(reflecting the force of gravity). While upright, the means ofthe x- and z-axes reverse direction (see Fig. 1). Dynamicacceleration: while the elephant is still (and recumbent),there is little fluctuation around the mean in any axis. Whilethe elephant is active (and upright), there is greater fluctua-
tion around the mean on every axis
Soltis et al.: Accelerometers determine elephant activity and orientation
acceleration related to lateral recumbence. For eachof the 40 sequences of total acceleration data, we cal-culated the SD of the original file (10 Hz), and thendown-sampled the file to 5, 2.5, 1, 0.5, 0.2, 0.1, 0.05,and 0.025 Hz. To down-sample from 10 to 5 Hz, everyother line was selected, and so on for each samplerate. Dynamic acceleration was again calculated foreach of these decimated files. In this way, the relation-ship between sample rate and deviations from actualdynamic acceleration could be observed.
To measure the effect of analysis window length ondynamic acceleration, we obtained thirty-four 5 minacceleration streams and obtained the overall bodydynamic acceleration using 2 different analysis win-dow lengths. In the first analysis, the window lengthwas 10 s, such that the SD was calculated across 10 ssequences for the 5 min data stream. Then the grandmean was calculated for each axis, and the means foreach axis summed for ODBA. In the second analysis,the window length was 5 min (the length of eachacceleration stream), so that the SD was calculatedfor the 5 min stream as a whole, and the axessummed for ODBA. In this way, ODBA could be com-pared using a relatively short (10 s) and relativelylong (5 min) analysis window length.
Rules for determining elephant recumbence arethreshold-based, such that an elephant is eitherupright or recumbent. Therefore, 2 types of error arepossible. False negatives occur when a bout ofrecumbence is missed. This error is dependent solelyon the length of the analysis window (5 min for datain this paper), such that bouts of recumbence shorterthan the analysis window may be missed, but boutsof recumbence longer than the window will be cap-tured. Here, we focus on false positives, which occurwhen an upright posture is mistaken for recumbence.
False positives are most likely to occur when highacceleration values are combined with low samplerates. To understand why, consider the followingexample. If an elephant is upright, the central ten-dency of the z-axis (heave) will be −1, reflecting theforce of gravity. In high activity behaviors, however,the fluctuations around the mean of −1 could be quitelarge. Sampling error could result in selection of ex -treme values that satisfy the recumbence rule for thez-axis (z > −0.75), resulting in an instance of falserecumbence. To examine this phenomenon, we ob -tained two 5 min bouts of high activity behavior (2bouts of rapid walking) from 2 Samburu-Laikipia ele-phants, and calculated the mean for the x- (sway) andz- (heave) axes. Then, we down-sampled each file toa new sample rate (1, 0.5, 0.1, 0.05, 0.025, and 0.016Hz). Data streams were down-sampled from a 10 to a
1 Hz sample rate by selecting every 10th value, and soon for each sample rate. For each sample rate, themean of the 5 min file was calculated 10 times by ran-domly choosing starting points in the sequence. Inthis way, we determined what sample rates yieldfalse recumbence due to sampling error.
Automated routines for 24 h sequences ofaccelerometer data
In addition to simultaneous collection of behavioraland accelerometer data used for validation, we alsorecorded full 24 h sequences of accelerometer data(without simultaneous video collection) from all 6elephants. We recorded 34 full days from the 6females (Disney: 7, 6, and 6 d; Samburu-Laikipia: 8,4, and 3 d). To automate analysis of the 24 h ac -celerometer streams, we developed simple computerprograms (QBASIC; available upon request) thatseparated dynamic and static acceleration from totalacceleration, and computed 5 min summaries acrossthe 24 h time period.
To compute dynamic acceleration, the sample SD ofthe total acceleration was obtained in sequential 10 swindows for each axis. The 10 s window was chosenbased on preliminary observations of paired accelerom-eter data and behavior, which showed that the 10 swindow matched results from the line interpolationand subtraction method. Every 5 min, the mean of the10 s SD was calculated, and the 3 axes were summedto determine ODBA for that 5 min period.
To compute static acceleration (body orientation),the mean of the total acceleration was obtainedin sequential 60 s windows for the x- (sway) andz-(heave) axes. A 60 s window was chosen (ratherthan a 10 s window as for dynamic acceleration)because short bouts of recumbence were consideredunlikely. Every 5 min, the grand mean of the 60 smeans was calculated. Elephants were consideredrecumbent if the grand mean for the 5 min period satisfied the previously validated rule (IF |x | > 0.5 ORz > −0.75, THEN recumbent).
RESULTS
Validation of algorithms
Activity level (dynamic acceleration)
The sample SD of the total acceleration is a simpleand accurate method for computing dynamic acceler-
5
Endang Species Res 31: 1–12, 2016
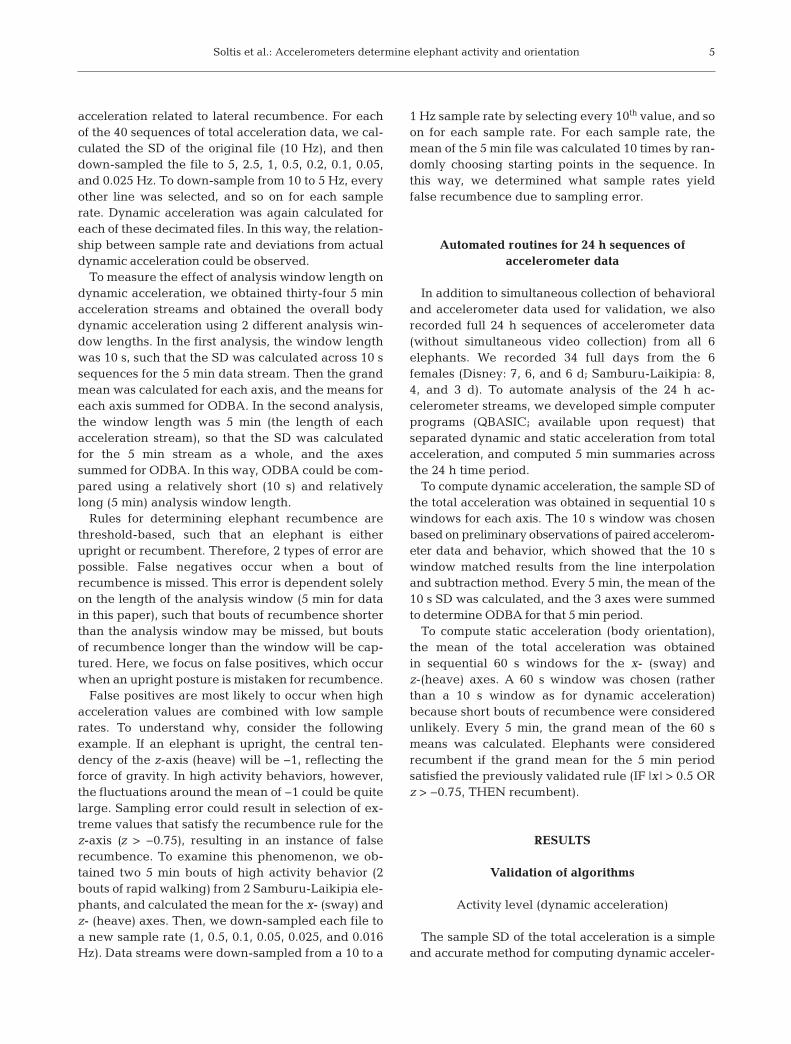
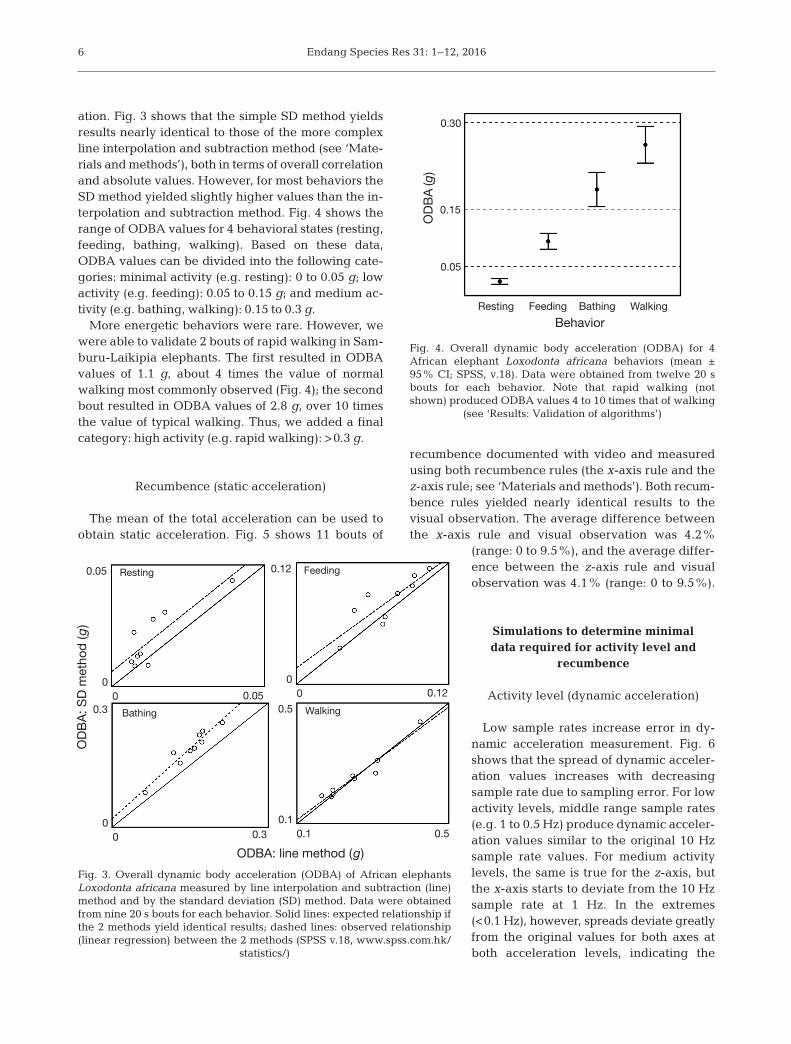
ation. Fig. 3 shows that the simple SD method yieldsresults nearly identical to those of the more complexline interpolation and subtraction method (see ‘Mate-rials and methods’), both in terms of overall correlationand absolute values. However, for most behaviors theSD method yielded slightly higher values than the in-terpolation and subtraction method. Fig. 4 shows therange of ODBA values for 4 behavioral states (resting,feeding, bathing, walking). Based on these data,ODBA values can be divided into the following cate-gories: minimal activity (e.g. resting): 0 to 0.05 g; lowactivity (e.g. feeding): 0.05 to 0.15 g; and medium ac-tivity (e.g. bathing, walking): 0.15 to 0.3 g.
More energetic behaviors were rare. However, wewere able to validate 2 bouts of rapid walking in Sam-buru-Laikipia elephants. The first resulted in ODBAvalues of 1.1 g, about 4 times the value of normalwalking most commonly observed (Fig. 4); the secondbout resulted in ODBA values of 2.8 g, over 10 timesthe value of typical walking. Thus, we added a finalcategory: high activity (e.g. rapid walking): >0.3 g.
Recumbence (static acceleration)
The mean of the total acceleration can be used toobtain static acceleration. Fig. 5 shows 11 bouts of
recumbence documented with video and measuredusing both recumbence rules (the x-axis rule and thez-axis rule; see ‘Materials and methods’). Both recum-bence rules yielded nearly identical re sults to thevisual observation. The average difference betweenthe x-axis rule and visual observation was 4.2%
(range: 0 to 9.5%), and the average differ-ence between the z-axis rule and visualobservation was 4.1% (range: 0 to 9.5%).
Simulations to determine minimal data required for activity level and
recumbence
Activity level (dynamic acceleration)
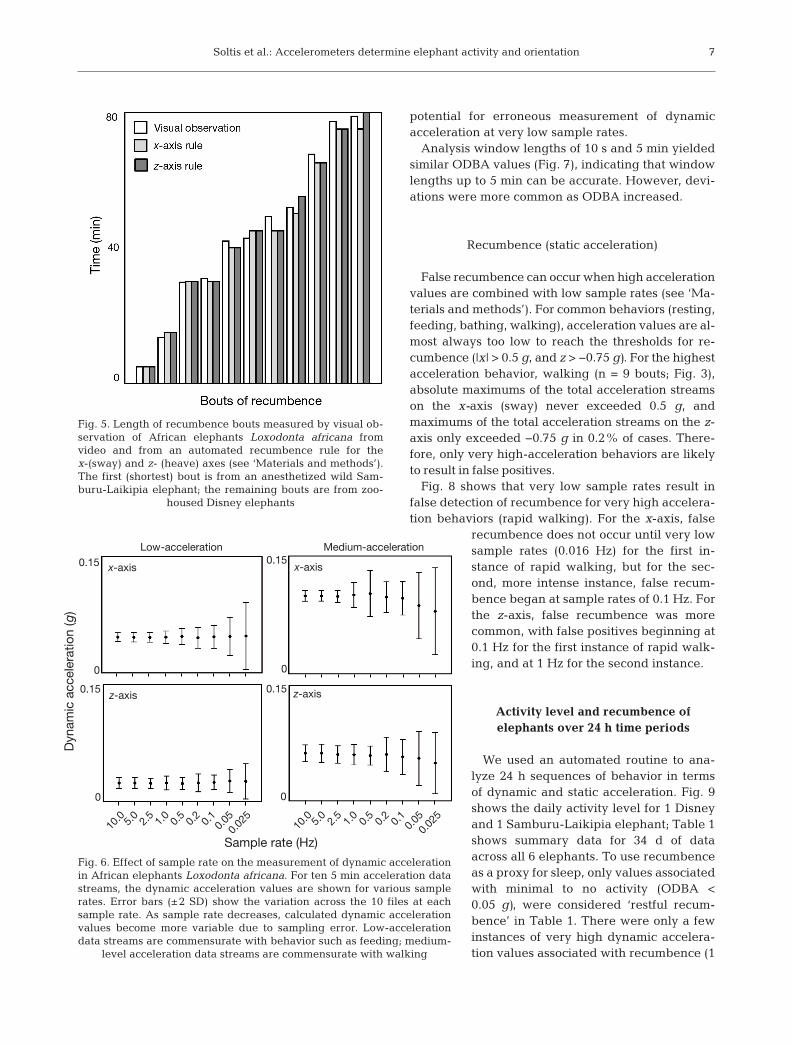
Low sample rates increase error in dy -namic acceleration measurement. Fig. 6shows that the spread of dynamic acceler-ation values increases with decreasingsample rate due to sampling error. For lowactivity levels, middle range sample rates(e.g. 1 to 0.5 Hz) produce dynamic acceler-ation values similar to the original 10 Hzsample rate values. For medium activitylevels, the same is true for the z-axis, butthe x-axis starts to deviate from the 10 Hzsample rate at 1 Hz. In the extremes(<0.1 Hz), however, spreads deviate greatlyfrom the original values for both axes atboth acceleration levels, indicating the
6
ODBA: line method (g)
OD
BA
: SD
met
hod
(g
)
Resting
0 0.05
0.05
0
0.1 0.5
Walking
0.1
0.5
0 0
Feeding
0 0
0.12
0.12
Bathing
0.3
0.3
Fig. 3. Overall dynamic body acceleration (ODBA) of African elephantsLoxo donta africana measured by line interpolation and subtraction (line)method and by the standard deviation (SD) method. Data were obtainedfrom nine 20 s bouts for each behavior. Solid lines: expected relationship ifthe 2 methods yield identical results; dashed lines: observed relationship(linear regression) between the 2 methods (SPSS v.18, www. spss. com.hk/
statistics/)
Resting Feeding Bathing Walking
OD
BA
(g)
0.05
0.15
0.30
Behavior
Fig. 4. Overall dynamic body acceleration (ODBA) for 4African elephant Loxodonta africana behaviors (mean ±95% CI; SPSS, v.18). Data were obtained from twelve 20 sbouts for each behavior. Note that rapid walking (notshown) produced ODBA values 4 to 10 times that of walking
(see ‘Results: Validation of algorithms’)
Soltis et al.: Accelerometers determine elephant activity and orientation
potential for erroneous measurement of dynamicacceleration at very low sample rates.
Analysis window lengths of 10 s and 5 min yieldedsimilar ODBA values (Fig. 7), indicating that windowlengths up to 5 min can be accurate. However, devi-ations were more common as ODBA increased.
Recumbence (static acceleration)
False recumbence can occur when high accelerationvalues are combined with low sample rates (see ‘Ma-terials and methods’). For common behaviors (resting,feeding, bathing, walking), acceleration values are al-most always too low to reach the thresholds for re-cumbence (|x| > 0.5 g, and z > −0.75 g). For the highestacceleration behavior, walking (n = 9 bouts; Fig. 3),absolute maximums of the total acceleration streamson the x-axis (sway) never exceeded 0.5 g, and maxi mums of the total acceleration streams on the z-axis only ex ceeded −0.75 g in 0.2% of cases. There-fore, only very high-acceleration behaviors are likelyto result in false positives.
Fig. 8 shows that very low sample rates result infalse detection of re cumbence for very high accelera-tion behaviors (rapid walking). For the x-axis, false
recumbence does not oc cur until very lowsample rates (0.016 Hz) for the first in -stance of rapid walking, but for the sec-ond, more intense instance, false recum-bence began at sample rates of 0.1 Hz. Forthe z-axis, false recumbence was morecommon, with false positives be ginning at0.1 Hz for the first instance of rapid walk-ing, and at 1 Hz for the se cond instance.
Activity level and recumbence of elephants over 24 h time periods
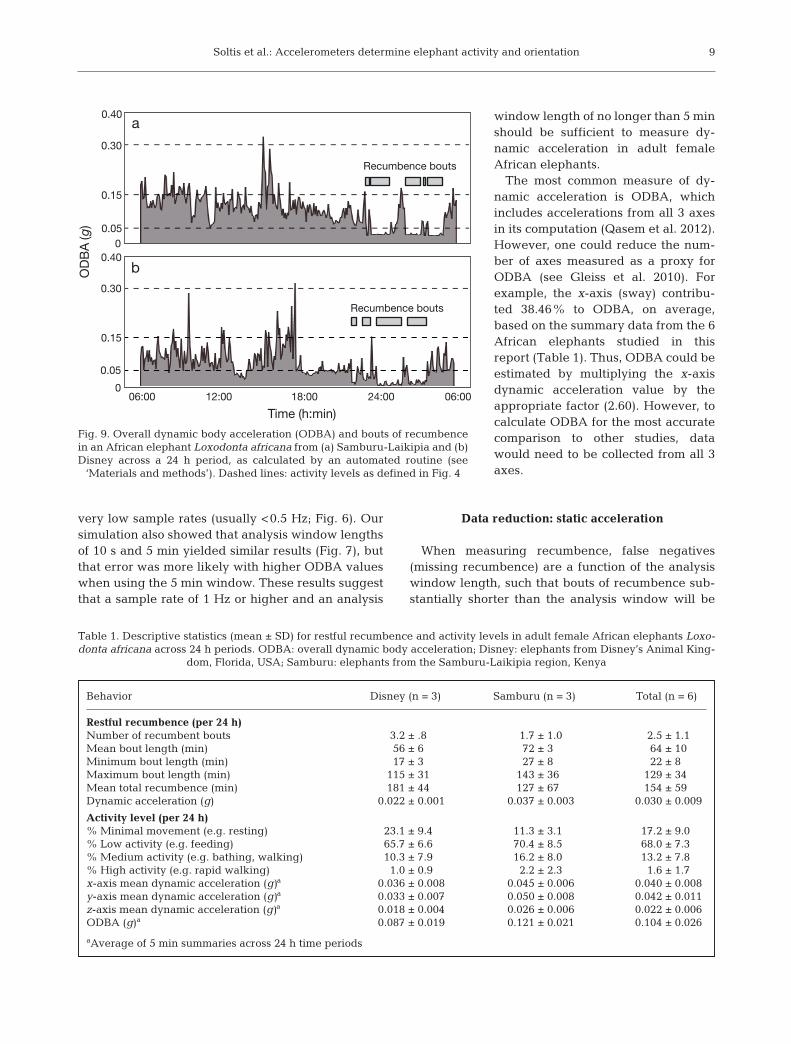
We used an automated routine to ana-lyze 24 h sequences of behavior in termsof dynamic and static acceleration. Fig. 9shows the daily activity level for 1 Disneyand 1 Samburu-Laikipia elephant; Table 1shows summary data for 34 d of dataacross all 6 elephants. To use recumbenceas a proxy for sleep, only values associatedwith minimal to no activity (ODBA <0.05 g), were considered ‘restful recum-bence’ in Table 1. There were only a fewinstances of very high dynamic accelera-tion values associated with re cumbence (1
7
Fig. 5. Length of recumbence bouts measured by visual ob -servation of African elephants Loxodonta africana fromvideo and from an automated recumbence rule for thex-(sway) and z- (heave) axes (see ‘Materials and methods’).The first (shortest) bout is from an anesthetized wild Sam-buru-Laikipia elephant; the remaining bouts are from zoo-
housed Disney elephants
Dyn
amic
acc
eler
atio
n (g
)
Sample rate (Hz)
Low-acceleration Medium-acceleration
x-axis
z-axis
x-axis
0
0.15
z-axis
0
0.15
0
0.15
0
0.15
10.0 5.
02.
51.
00.
50.
20.
10.
050.
025
10.0 5.
02.
51.
00.
50.
20.
10.
050.
025
Fig. 6. Effect of sample rate on the measurement of dynamic accelerationin African elephants Loxodonta africana. For ten 5 min acceleration datastreams, the dynamic acceleration values are shown for various samplerates. Error bars (±2 SD) show the variation across the 10 files at eachsample rate. As sample rate decreases, calculated dynamic accelerationvalues become more variable due to sampling error. Low-accelerationdata streams are commensurate with behavior such as feeding; medium-
level acceleration data streams are commensurate with walking
Endang Species Res 31: 1–12, 2016
individual at Disney and 1 in Samburu-Laikipia), andthis may have been associated with active recumbentbehavior such as wallowing in the mud.
DISCUSSION
Methods for measuring dynamic and static acceleration
Our results show that for adult female Africanelephants, the sample SD of the total accelerationcan be used as a measure of dynamic acceleration(ac tivity level), and that the mean of the total accel-eration can be used as a measure of static accelera-tion (body orientation). The results apply when ac -cel ero meters are placed in collars on top of theelephant’s neck, an attachment technique that hasproved successful in both wild and zoo African ele-phants (see ‘Introduction’). While these methodsmay also be valid in male African elephants, non-adult African elephants, and Asian elephants, thesefindings may not extend to other large terrestrial
mammals, and so independent vali-dations should be made for non- elephant species.
The value of these simple methods istwofold. First, results can be directlycomparable across research groupswhether or not they use the SD methodor the line interpolation and subtrac-tion method. Second, the simple algo-rithms are computationally inexpen-sive, and thus will be more useful thancomplex methods for many applica-tions, such as real-time, on-board ana -lysis of data from elephant collars.
Data reduction: dynamic acceleration
In many applications, battery life is aconstraining factor when data is wire-lessly transferred from collars over thelong term (Wall et al. 2014). Therefore,it may be necessary to limit the amountof accelerometer data that is analyzedand/or transmitted from elephant col-lars. However, there is a trade-off be -tween data reduction and accuracy.For dynamic acceleration, our simula-tions showed that large de viationsfrom actual values only oc curred at
8
10 s window ODBA (g)
5-m
in w
ind
ow O
DB
A (
g)
0 0 0.5
0.5
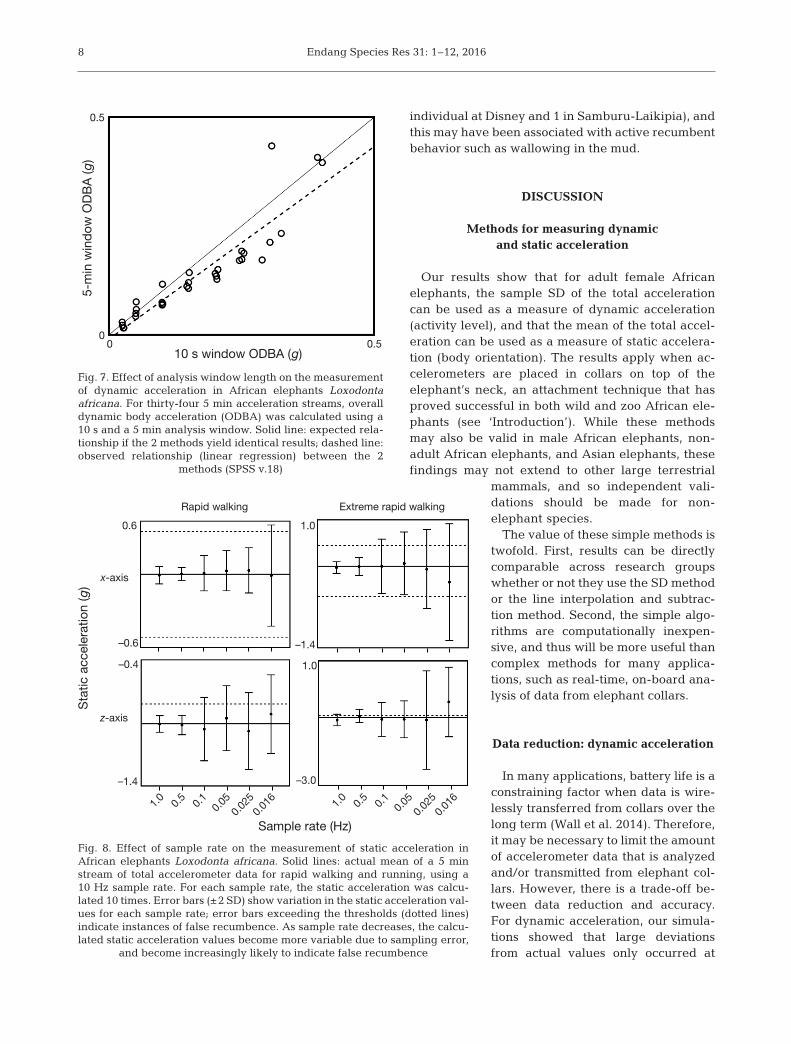
Fig. 7. Effect of analysis window length on the measurementof dynamic acceleration in African elephants Loxodontaafricana. For thirty-four 5 min acceleration streams, overalldynamic body acceleration (ODBA) was calculated using a10 s and a 5 min analysis window. Solid line: expected rela-tionship if the 2 methods yield identical results; dashed line:observed relationship (linear regression) between the 2
methods (SPSS v.18)
Sta
tic a
ccel
erat
ion
(g)
Sample rate (Hz)
Rapid walking Extreme rapid walking
–0.6
0.6
–1.4
–0.4
x-axis
z-axis
–1.4
1.0
–3.0
1.0
1.0
0.5
0.1
0.05
0.02
50.
016
1.0
0.5
0.1
0.05
0.02
50.
016
Fig. 8. Effect of sample rate on the measurement of static acceleration inAfrican elephants Loxodonta africana. Solid lines: actual mean of a 5 minstream of total accelerometer data for rapid walking and running, using a10 Hz sample rate. For each sample rate, the static acceleration was calcu-lated 10 times. Error bars (±2 SD) show variation in the static acceleration val-ues for each sample rate; error bars exceeding the thresholds (dotted lines)indicate instances of false recumbence. As sample rate decreases, the calcu-lated static acceleration values become more variable due to sampling error,
and become increasingly likely to indicate false recumbence
Soltis et al.: Accelerometers determine elephant activity and orientation
very low sample rates (usually <0.5 Hz; Fig. 6). Oursimulation also showed that analysis window lengthsof 10 s and 5 min yielded similar results (Fig. 7), butthat error was more likely with higher ODBA valueswhen using the 5 min window. These results suggestthat a sample rate of 1 Hz or higher and an analysis
window length of no longer than 5 minshould be sufficient to measure dy -namic acceleration in adult femaleAfrican elephants.
The most common measure of dy -namic acceleration is ODBA, whichincludes accelerations from all 3 axesin its computation (Qasem et al. 2012).However, one could reduce the num-ber of axes measured as a proxy forODBA (see Gleiss et al. 2010). Forexample, the x-axis (sway) contri bu -ted 38.46% to ODBA, on average,based on the summary data from the 6African elephants studied in thisreport (Table 1). Thus, ODBA could beestimated by multiplying the x-axisdynamic acceleration value by theappropriate factor (2.60). However, tocalculate ODBA for the most accuratecomparison to other studies, datawould need to be collected from all 3axes.
Data reduction: static acceleration
When measuring recumbence, false negatives(missing recumbence) are a function of the analysiswindow length, such that bouts of recumbence sub-stantially shorter than the analysis window will be
9
OD
BA
(g)
Time (h:min)
0 0.05
0.15
0.30
0.40 a
0
0.05
0.15
0.30
0.40 b
06:00 12:00 18:00 24:00 06:00
Recumbence bouts
Recumbence bouts
Fig. 9. Overall dynamic body acceleration (ODBA) and bouts of recumbencein an African elephant Loxodonta africana from (a) Samburu-Laikipia and (b)Disney across a 24 h period, as calculated by an automated routine (see
‘Materials and methods’). Dashed lines: activity levels as defined in Fig. 4
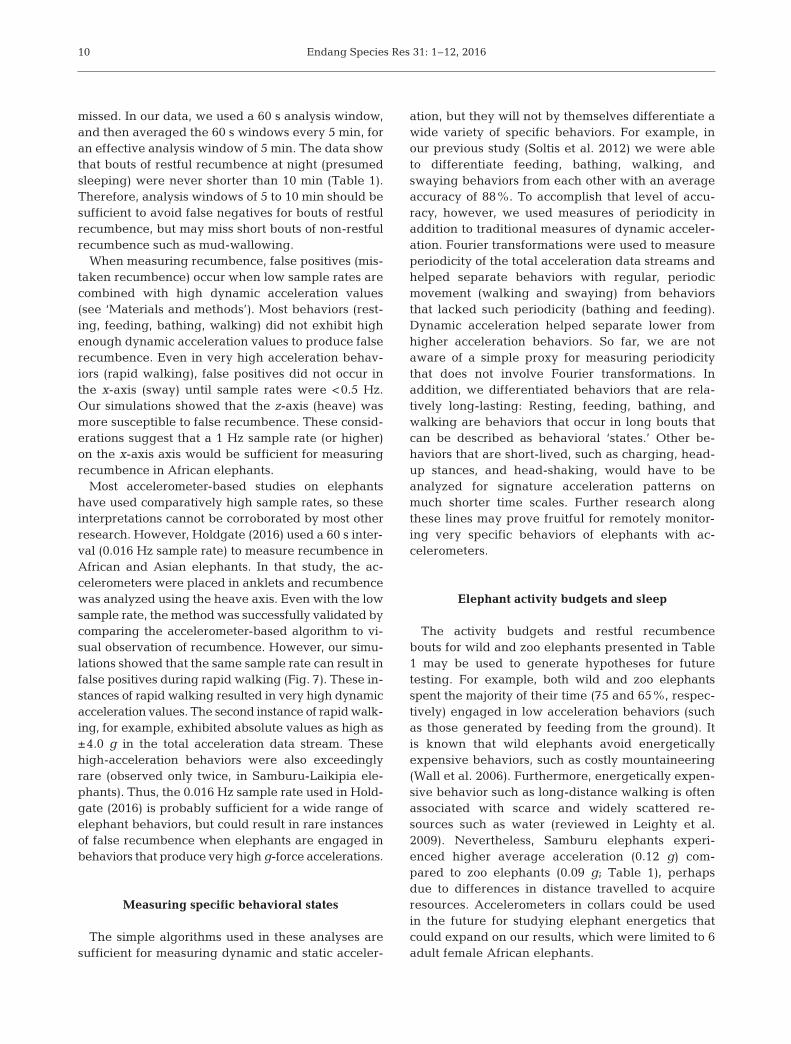
Behavior Disney (n = 3) Samburu (n = 3) Total (n = 6)
Restful recumbence (per 24 h)Number of recumbent bouts 3.2 ± .8 1.7 ± 1.0 2.5 ± 1.1Mean bout length (min) 56 ± 6 72 ± 3 64 ± 10Minimum bout length (min) 17 ± 3 27 ± 8 22 ± 8Maximum bout length (min) 115 ± 31 143 ± 36 129 ± 34Mean total recumbence (min) 181 ± 44 127 ± 67 154 ± 59Dynamic acceleration (g) 0.022 ± 0.001 0.037 ± 0.003 0.030 ± 0.009
Activity level (per 24 h)% Minimal movement (e.g. resting) 23.1 ± 9.4 11.3 ± 3.1 17.2 ± 9.0% Low activity (e.g. feeding) 65.7 ± 6.6 70.4 ± 8.5 68.0 ± 7.3% Medium activity (e.g. bathing, walking) 10.3 ± 7.9 16.2 ± 8.0 13.2 ± 7.8% High activity (e.g. rapid walking) 1.0 ± 0.9 2.2 ± 2.3 1.6 ± 1.7x-axis mean dynamic acceleration (g)a 0.036 ± 0.008 0.045 ± 0.006 0.040 ± 0.008y-axis mean dynamic acceleration (g)a 0.033 ± 0.007 0.050 ± 0.008 0.042 ± 0.011z-axis mean dynamic acceleration (g)a 0.018 ± 0.004 0.026 ± 0.006 0.022 ± 0.006ODBA (g)a 0.087 ± 0.019 0.121 ± 0.021 0.104 ± 0.026
aAverage of 5 min summaries across 24 h time periods
Table 1. Descriptive statistics (mean ± SD) for restful recumbence and activity levels in adult female African elephants Loxo -donta africana across 24 h periods. ODBA: overall dynamic body acceleration; Disney: elephants from Disney’s Animal King-
dom, Florida, USA; Samburu: elephants from the Samburu-Laikipia region, Kenya
Endang Species Res 31: 1–12, 2016
missed. In our data, we used a 60 s analysis window,and then averaged the 60 s windows every 5 min, foran effective analysis window of 5 min. The data showthat bouts of restful recumbence at night (presumedsleeping) were never shorter than 10 min (Table 1).Therefore, analysis windows of 5 to 10 min should besufficient to avoid false negatives for bouts of restfulrecumbence, but may miss short bouts of non-restfulrecumbence such as mud-wallowing.
When measuring recumbence, false positives (mis-taken recumbence) occur when low sample rates arecombined with high dynamic acceleration values(see ‘Materials and methods’). Most behaviors (rest-ing, feeding, bathing, walking) did not exhibit highenough dynamic acceleration values to produce falserecumbence. Even in very high acceleration behav-iors (rapid walking), false positives did not occur inthe x-axis (sway) until sample rates were <0.5 Hz.Our simulations showed that the z-axis (heave) wasmore susceptible to false recumbence. These consid-erations suggest that a 1 Hz sample rate (or higher)on the x-axis axis would be sufficient for measuringrecumbence in African elephants.
Most accelerometer-based studies on elephantshave used comparatively high sample rates, so theseinterpretations cannot be corroborated by most otherresearch. However, Holdgate (2016) used a 60 s inter-val (0.016 Hz sample rate) to measure recumbence inAfrican and Asian elephants. In that study, the ac-celerometers were placed in anklets and re cumbencewas analyzed using the heave axis. Even with the lowsample rate, the method was successfully validated bycomparing the accelerometer-based algorithm to vi-sual observation of recumbence. However, our simu-lations showed that the same sample rate can result infalse positives during rapid walking (Fig. 7). These in-stances of rapid walking resulted in very high dynamicacceleration values. The second instance of rapid walk-ing, for example, exhibited absolute values as high as±4.0 g in the total acceleration data stream. Thesehigh-acceleration behaviors were also exceedinglyrare (observed only twice, in Samburu-Laikipia ele-phants). Thus, the 0.016 Hz sample rate used in Hold -gate (2016) is probably sufficient for a wide range ofelephant behaviors, but could result in rare instancesof false recumbence when elephants are engaged inbehaviors that produce very high g-force accelerations.
Measuring specific behavioral states
The simple algorithms used in these analyses aresufficient for measuring dynamic and static acceler-
ation, but they will not by themselves differentiate awide variety of specific behaviors. For example, inour previous study (Soltis et al. 2012) we were ableto differentiate feeding, bathing, walking, andswaying behaviors from each other with an averageaccuracy of 88%. To accomplish that level of accu-racy, however, we used measures of periodicity inaddition to traditional measures of dynamic acceler-ation. Fourier transformations were used to measureperiodicity of the total acceleration data streams andhelped separate behaviors with regular, periodicmovement (walking and swaying) from behaviorsthat lacked such periodicity (bathing and feeding).Dynamic ac celeration helped separate lower fromhigher acceleration behaviors. So far, we are notaware of a simple proxy for measuring periodicitythat does not involve Fourier transformations. Inaddition, we differentiated behaviors that are rela-tively long-lasting: Resting, feeding, bathing, andwalking are behaviors that occur in long bouts thatcan be described as behavioral ‘states.’ Other be -haviors that are short-lived, such as charging, head-up stances, and head-shaking, would have to beanalyzed for signature acceleration patterns onmuch shorter time scales. Further research alongthese lines may prove fruitful for remotely monitor-ing very specific behaviors of elephants with ac -celerometers.
Elephant activity budgets and sleep
The activity budgets and restful recumbencebouts for wild and zoo elephants presented in Table1 may be used to generate hypotheses for futuretesting. For example, both wild and zoo elephantsspent the majority of their time (75 and 65%, respec-tively) engaged in low acceleration behaviors (suchas those generated by feeding from the ground). Itis known that wild elephants avoid energeticallyexpensive behaviors, such as costly mountaineering(Wall et al. 2006). Furthermore, energetically expen-sive behavior such as long-distance walking is oftenassociated with scarce and widely scattered re -sources such as water (reviewed in Leighty et al.2009). Nevertheless, Samburu elephants experi-enced higher average acceleration (0.12 g) com-pared to zoo elephants (0.09 g; Table 1), perhapsdue to differences in distance travelled to acquireresources. Accelerometers in collars could be usedin the future for studying elephant energetics thatcould expand on our results, which were limited to 6adult female African elephants.
10
Soltis et al.: Accelerometers determine elephant activity and orientation
Table 1 also provides descriptive statistics on ele-phant restful recumbence, which may be used as aproxy for sleep. Our data show that lying down wasassociated with minimal movement (Fig. 9), suggest-ing that this proxy may be valid, but further workwould be required to definitively illustrate how rest-ful recumbence equates to physiological sleep. Ourdata also show that Samburu-Laikipia elephantsspent an average of about 2 h night−1 in restful re -cumbence, and that zoo elephants spent about 3 hnight−1, perhaps because zoo elephants require lessvigilance due to the lack of interspecific conflict, forexample with humans or lions. The amount of recum-bence observed in this study (2.5 h on average), con-forms to other studies. For example, Holdgate et al.(2016) investigated 72 adult female African ele-phants across 40 North American zoos, and found anaverage of 2.1 h of recumbence per night. For wildAfrican elephants, Wyatt & Eltringham (1974) showedthat adult female elephants (n = 4) were recumbentfor 1 to 2 h night−1. Accelerometers may be used tofurther study variation in African elephant sleepingbehavior (e.g. seasonality, zoo vs. wild). Additionally,unusually long recumbence bouts could be triggersfor electronic alarms that warn authorities of possiblemortality.
Acknowledgements. At Disney’s Animal Kingdom®, imple-mentation of the project was made possible by the ElephantTeam and the Education & Science Team. In Samburu-Laikipia, help was provided by local staff at the Save theElephants Research Center in the Samburu National Re -serve. We also thank Susannah Rouse who helped withlogistics and provided an elephant collar in Lewa WildlifeConservancy. Finally, we thank Henrik Rasmussen whohelped with technical aspects of the accelerometer sensorsin Kenya. This research was approved by Disney’s AnimalCare and Welfare Committee and the Kenyan NationalCouncil for Science and Technology (NCST/RCD/ 12B/013/18).
LITERATURE CITED
Bourke AK, O’Brien JV, Lyons GM (2007) Evaluation of athreshold-based tri-axial accelerometer fall detectionalgorithm. Gait Posture 26: 194−199
Brown EF, Tettamanti F, McElligott AG (2013) Observingthe unwatchable through acceleration logging of animalbehavior. Anim Biotelem 1: 20
Enstipp MR, Ciccione S, Gineste B, Milbergue M and others(2011) Energy expenditure of freely swimming adultgreen sea turtles (Chelonia mydas) and its link with bodyacceleration. J Exp Biol 214: 4010−4020
Gleiss AC, Dale JJ, Holland KN, Wilson RP (2010) Accelerat-ing estimates of activity-specific metabolic rate in fishes: testing the applicability of acceleration data-loggers.J Exp Mar Biol Ecol 385: 85−91
Gómez Laich A, Wilson RP, Quintana F, Shepard ELC (2008)Identification of imperial cormorant Phalacrocorax atri-ceps behaviour using accelerometers. Endang SpeciesRes 10: 29−37
Halsey LG, Green JA, Wilson RP, Frappell PB (2009)Accelerometry to estimate energy expenditure duringactivity: best practices with data loggers. Physiol Bio -chem Zool 82: 396−404
Holdgate MR, Meehan CL, Hogan JN, Miller LJ and others(2016) Recumbence behavior in zoo elephants: determi-nation of patterns and frequency of recumbent rest andassociated environmental and social factors. PLoS ONE11: e0153301
Horback K, Miller L, Andrews J, Anderson M (2012) Theeffects of GPS collars on African elephant (Loxodontaafricana) behavior at the San Diego Zoo Safari Park.Appl Anim Behav Sci 142: 76−81
Leighty KA, Soltis J, Wesolek CM, Savage A (2008) Rumblevocalizations mediate interpartner distance in Africanelephants, Loxodonta africana. Anim Behav 76: 1601−1608
Leighty KA, Soltis J, Wesolek CM, Savage A, Mellen J,Lehnhardt J (2009) GPS determination of walking ratesin captive African elephants (Loxodonta africana). ZooBiol 28: 16−28
Lyons GM, Culhane KM, Hilton D, Grace PA, Lyons D (2005)A description of an accelerometer-based mobility moni-toring technique. Med Eng Phys 27: 497−504
Moreau M, Siebert S, Buerkert A, Schlecht E (2009) Use of atri-axial accelerometer for automated recording and clas-sification of goats’ grazing behavoiur. Appl Anim BehavSci 119: 158−170
O’Donoghue P, Rutz C (2016) Real-time anti-poaching tagscould help prevent imminent species extinctions. J ApplEcol 53:5–10
Pastell M, Tiusanen J, Hakojärvi M, Hänninen L (2009) Awireless accelerometer system with wavelet analysis forassessing lameness in cattle. Biosystems Eng 104: 545−551
Qasem L, Cardew A, Wilson A, Griffisths I and others (2012)Tri-axial dynamic acceleration as a proxy for animalenergy expenditure; Should we be summing values orcalculating the vector? PLoS ONE 7: e31187
Ren L, Hutchinson JR (2008) The three-dimensional locomo-tor dynamics of African (Loxodonta africana) and Asian(Elephas maximus) elephants reveal a smooth gait transi-tion at moderate speed. J R Soc Interface 5:195–211
Ringgenberg N, Bergeron R, Devillers N (2010) Validation ofaccelerometers to automatically record sow postures andstepping behaviour. Appl Anim Behav Sci 128: 37−44
Rothwell ES, Bercovitch FB, Andrews JRM, Anderson MJ(2011) Estimating daily walking distance of captiveAfrican elephants using an accelerometer. Zoo Biol 30: 579−591
Sala JE, Quintana F, Wilson RP, Dignani J, Lewis MN, Cam-pagna C (2011) Pitching a new angle on elephant sealdive patterns. Polar Biol 34: 1197−1209
Shepard ELC, Wilson RP, Quintana F, Gómez Laich A andothers (2008) Identification of animal movement patternsusing tri-axial accelerometry. Endang Species Res 10: 47−60
Soltis J, Wilson RP, Douglas-Hamilton I, Vollrath F, King LE,Savage A (2012) Accelerometers in collars identifybehavioral states in captive African elephants Loxodontaafricana. Endang Species Res 18: 255−263
11

Endang Species Res 31: 1–12, 2016
Soulsby KS (2012) Use of a tri-axial accelerometer, behav-ioral observation, and GPS to monitor the activity offemale Asian elephants in a zoo. MSc dissertation, TheUniversity of Texas at Arlington
Wall J, Douglas-Hamilton I, Vollrath F (2006) Elephantsavoid costly mountaineering. Curr Biol 16: R527−R529
Wall J, Wittemyer G, Klinkenberg B, Douglas-Hamilton I(2014) Novel opportunities for wildlife conservation andresearch with real-time monitoring. Ecol Appl 24: 593−601
Whitney NM, Pratt HL Jr, Pratt TC, Carrier JC (2010) Identi-fying shark mating behavior using three-dimensionalacceleration loggers. Endang Species Res 10: 71−82
Wilson RP, White CR, Quintana F, Halsey LG, Liebsch N,
Martin GR, Butler PJ (2006) Moving towards accelerationfor estimates of activity-specific metabolic rate in free-living animals: the case of the cormorant. J Anim Ecol 75: 1081−1090
Wilson RP, Grundy E, Massy R, Soltis J and others (2014)Wild state secrets: ultra-sensitive measurement of micro-movement can reveal internal processes in animals.Front Ecol Environ 12: 582−587
Wittemyer G, Daballen D, Douglas-Hamilton I (2013) Com-parative demography of an at-risk elephant population.PLoS ONE 8: e53726
Wyatt JR, Eltringham SK (1974) The daily activity of the ele-phant in the Rwenzori National Park, Uganda. Afr J Ecol12: 273−289
12
Editorial responsibility: Matthew Hayward, Bangor, UK
Submitted: March 7, 2016; Accepted: July 11, 2016Proofs received from author(s): August 10, 2016
➤
➤
➤
➤
➤
➤
➤