Embed Size (px)
Citation preview
Final report, v4-2.doc
Accelerating Transition to Virtual Research Organisation in Social Science (AVROSS)
Deliverable title & no. M4 Final Report
Deliverable Version:
Final report, v4-2.doc
Date: 21.12.2007
Contract: A study on requirements and options for accelerating the transition from traditional research to virtual research organisations through e-Infrastructure
EU Service Contract No. 30-CE-0066163/00-39
Issued by: Information Society and Media Directorate General, Commission of the European Communities
Consortium: School of Business, University of Applied Sciences Northwestern Switzerland (FHNW), Olten, Switzerland (lead contractor)
empirica GmbH, Bonn, Germany
National Centre for e-Social Science (NCeSS), Manchester, UK
National Opinion Research Center at the University of Chicago (NORC), Chicago, USA
Coordination: Franz Barjak School of Business University of Applied Sciences Northwestern Switzerland Riggenbachstrasse 16 CH-4600 Olten Switzerland [email protected] phone +41 62 287 7825, fax: +41 62 287 7845
AVROSS
II
Preface This report is the fourth deliverable of the AVROSS study (Accelerating Transition to Virtual Research Organisation in Social Science, AVROSS).
The study aims were to identify the requirements and options for accelerating the transition from traditional research to virtual research organisations through e-Infrastructures” to the EC under EU Service Contract No. 30-CE-0066163/00-39.
The report authors were:
− Franz Barjak and Gordon Wiegand (University of Applied Sciences Northwestern Switzerland),
− Julia Lane and Zack Kertcher (University of Chicago),
− Rob Procter and Meik Poschen (NCeSS),
− Simon Robinson and Alexander Mentrup (empirica).
The authors gratefully acknowledge the support and contributions from the following persons and institutions: Lawrence Burton (NSF), Jeremy Neathey (ESRC), Andrea Scharnhorst (Virtual Knowledge Studio of the Royal Netherlands Academy for Arts and Sciences), Ralph Schroeder and Jenny Fry (Oxford Internet Institute), Mirco Mazzucato (INFN), Javier G. Tobío (CESGA), Roger Slack (Bangor University, Wales), Alex Voss (NCeSS), all participants of the Brussels workshop on November 27th, 2007, as well as several informants on the case studies who wished to remain anonymous. We also grateful acknowledge the contributions of all the survey respondents, as well as the participants in the case study research.
Lat but not least we wish to acknowledge the funding and support by the European Commission, Directorate-General Information Society and Media, Unit F3 “Géant & eInfrastructure”.
25
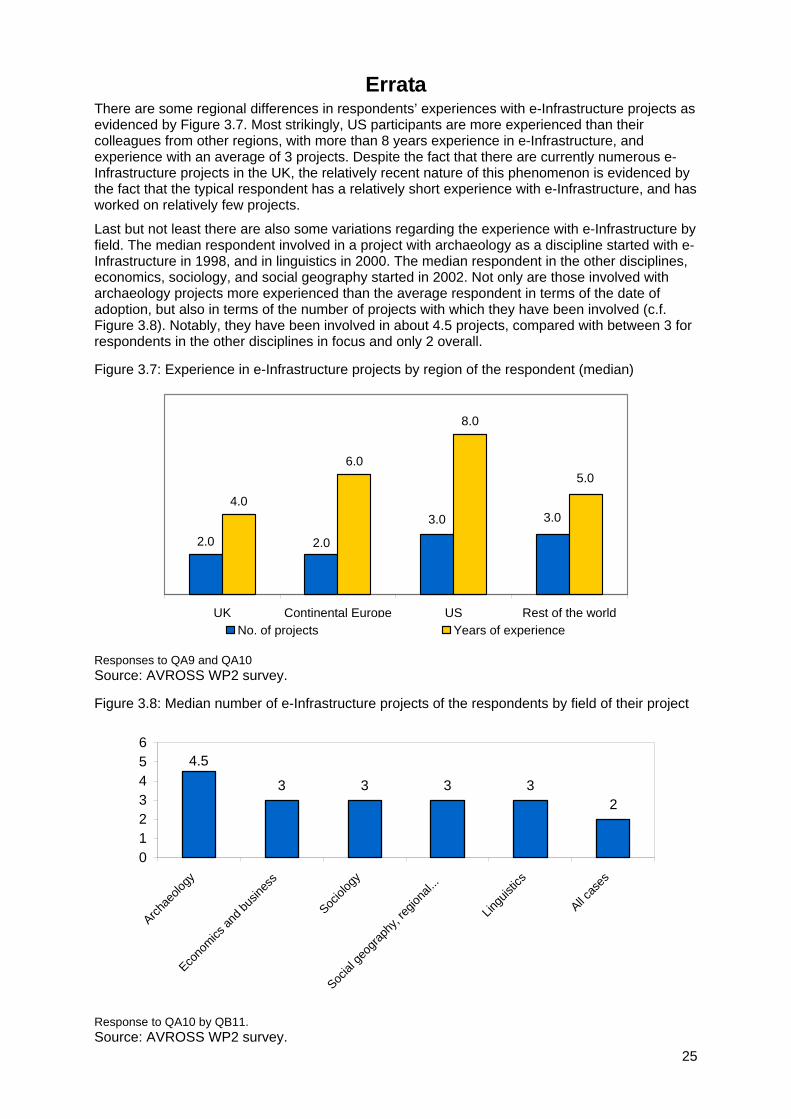
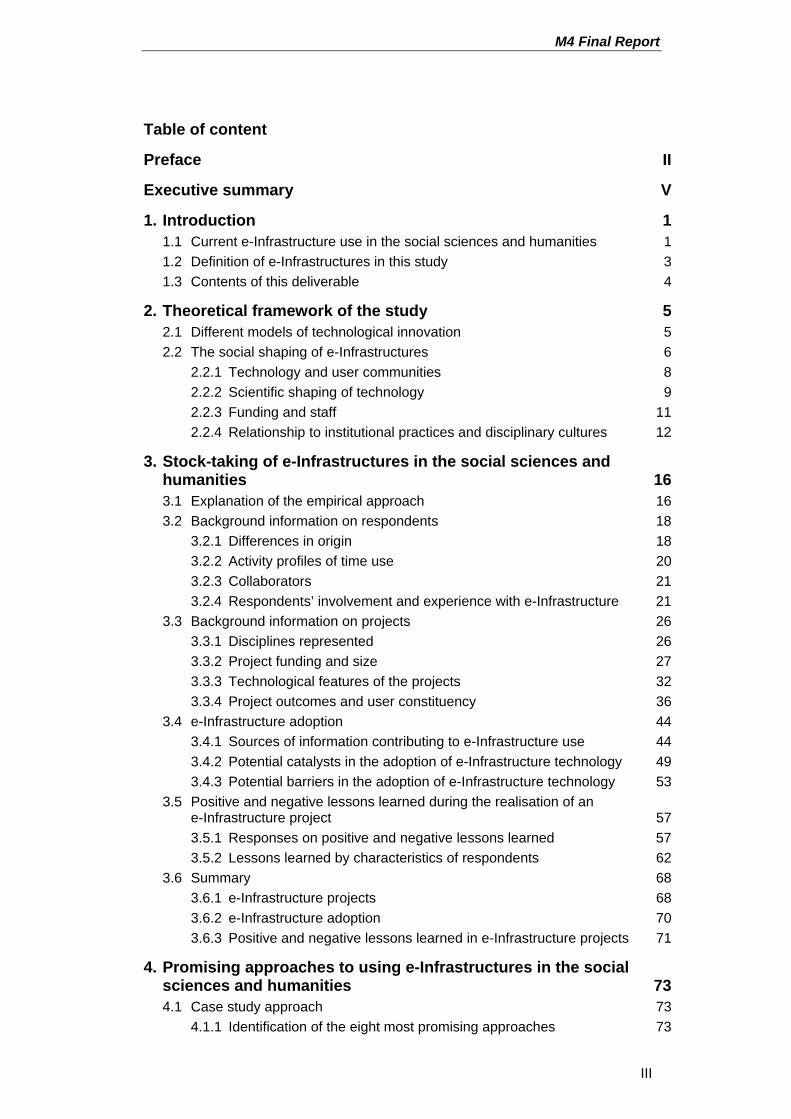
Errata There are some regional differences in respondents’ experiences with e-Infrastructure projects as evidenced by Figure 3.7. Most strikingly, US participants are more experienced than their colleagues from other regions, with more than 8 years experience in e-Infrastructure, and experience with an average of 3 projects. Despite the fact that there are currently numerous e-Infrastructure projects in the UK, the relatively recent nature of this phenomenon is evidenced by the fact that the typical respondent has a relatively short experience with e-Infrastructure, and has worked on relatively few projects.
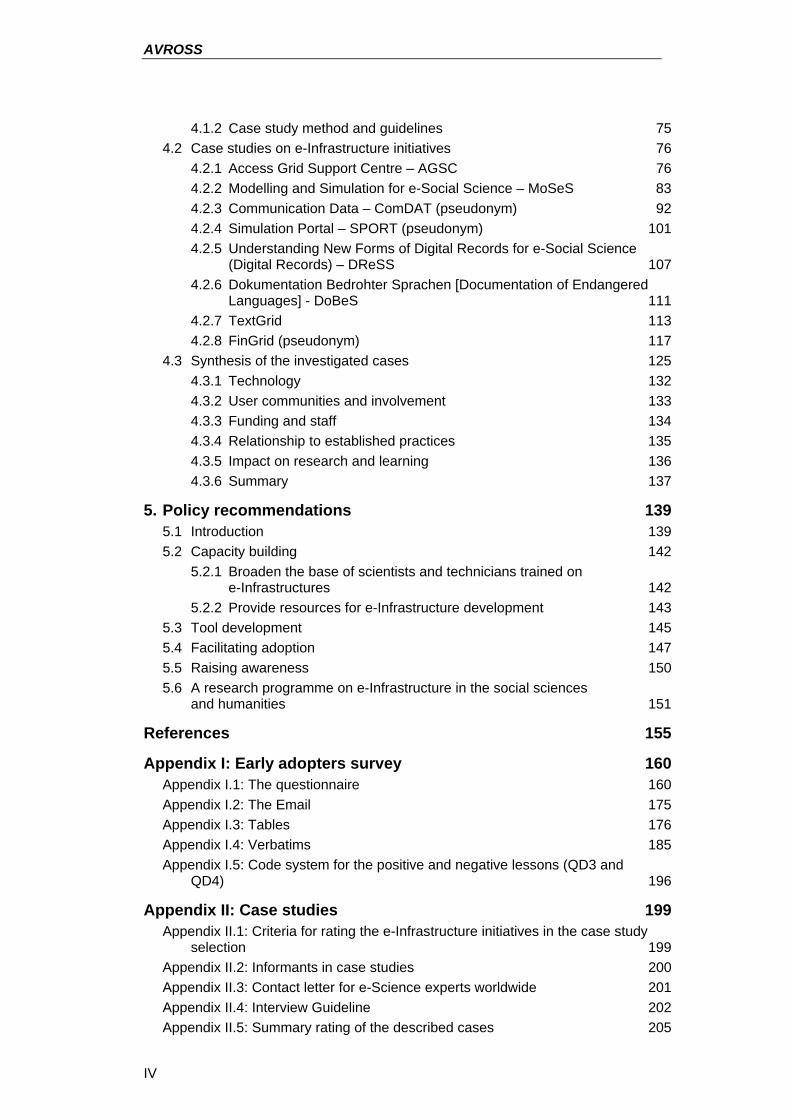
Last but not least there are also some variations regarding the experience with e-Infrastructure by field. The median respondent involved in a project with archaeology as a discipline started with e-Infrastructure in 1998, and in linguistics in 2000. The median respondent in the other disciplines, economics, sociology, and social geography started in 2002. Not only are those involved with archaeology projects more experienced than the average respondent in terms of the date of adoption, but also in terms of the number of projects with which they have been involved (c.f. Figure 3.8). Notably, they have been involved in about 4.5 projects, compared with between 3 for respondents in the other disciplines in focus and only 2 overall.
Figure 3.7: Experience in e-Infrastructure projects by region of the respondent (median)
2.0
4.0
6.0
8.0
3.03.0
2.0
5.0
UK Continental Europe US Rest of the worldNo. of projects Years of experience
Responses to QA9 and QA10 Source: AVROSS WP2 survey.
Figure 3.8: Median number of e-Infrastructure projects of the respondents by field of their project
3 3 3 32
4.5
0123456
Archae
ology
Econo
mics an
d bus
iness
Sociol
ogy
Social
geog
raphy
, regio
nal...
Lingu
istics
All cas
es
Response to QA10 by QB11. Source: AVROSS WP2 survey.
45
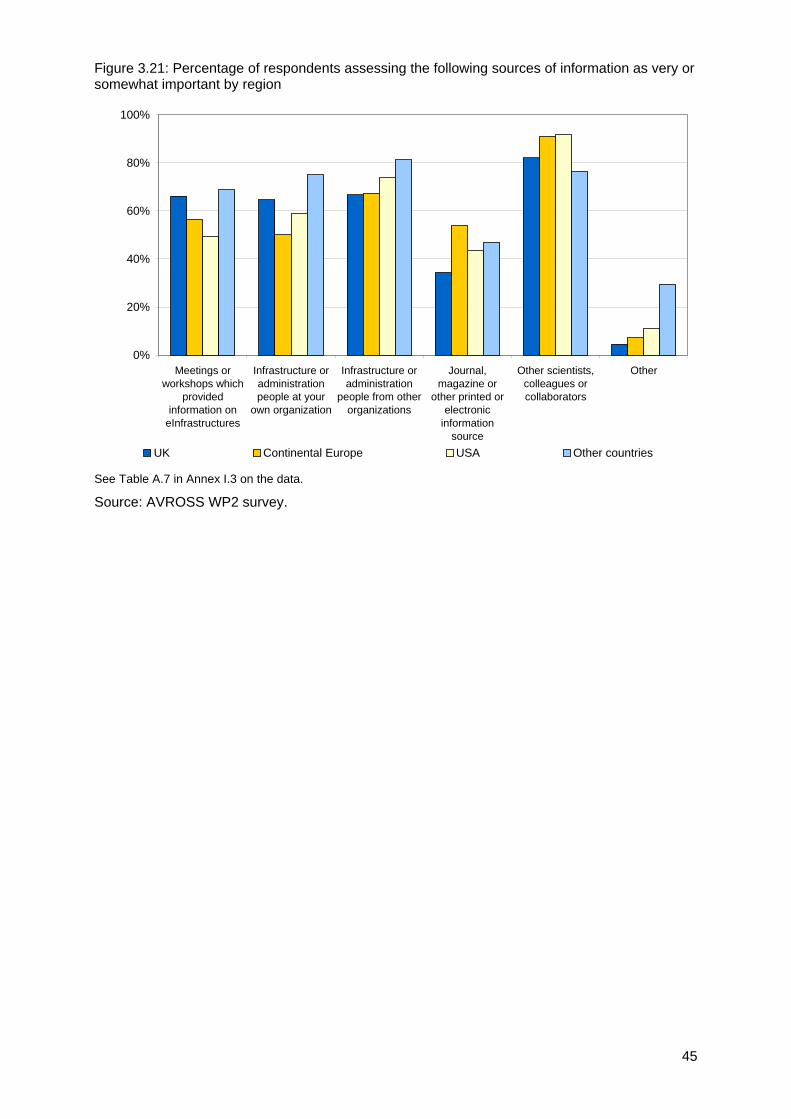
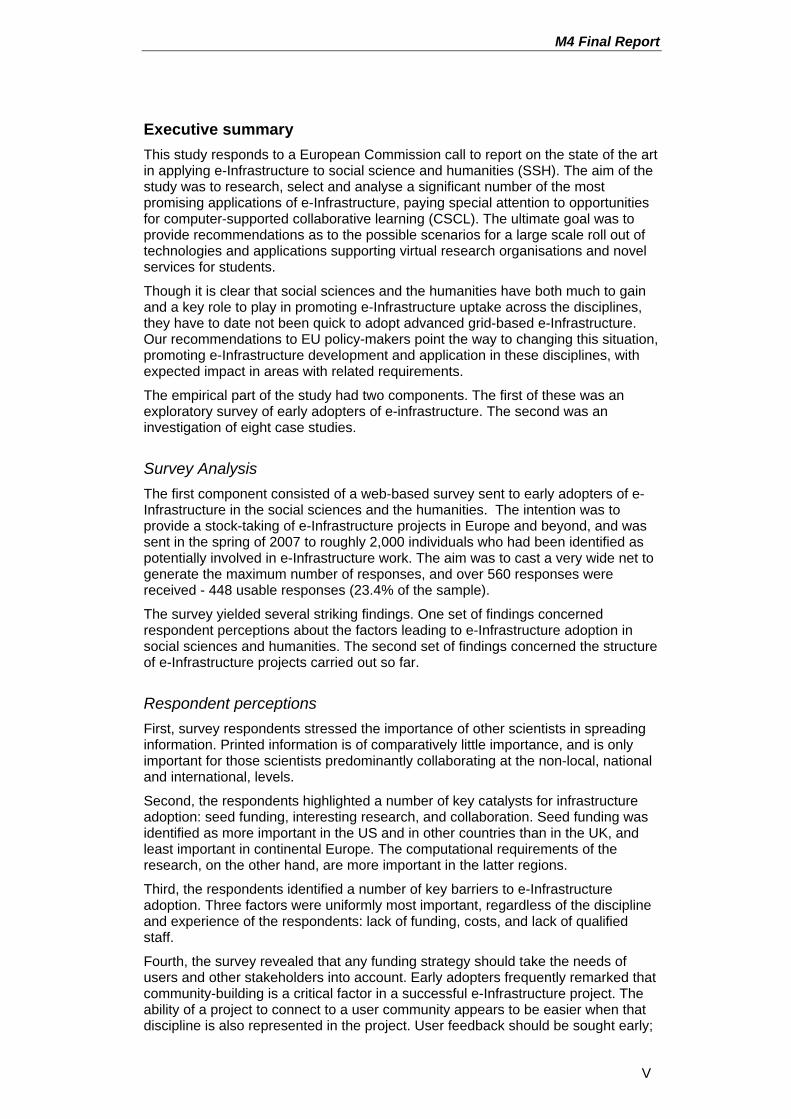
Figure 3.21: Percentage of respondents assessing the following sources of information as very or somewhat important by region
0%
20%
40%
60%
80%
100%
Meetings orworkshops which
providedinformation on
eInfrastructures
Infrastructure oradministrationpeople at your
own organization
Infrastructure oradministration
people from otherorganizations
Journal,magazine or
other printed orelectronic
informationsource
Other scientists,colleagues orcollaborators
Other
UK Continental Europe USA Other countries
See Table A.7 in Annex I.3 on the data.
Source: AVROSS WP2 survey.
178
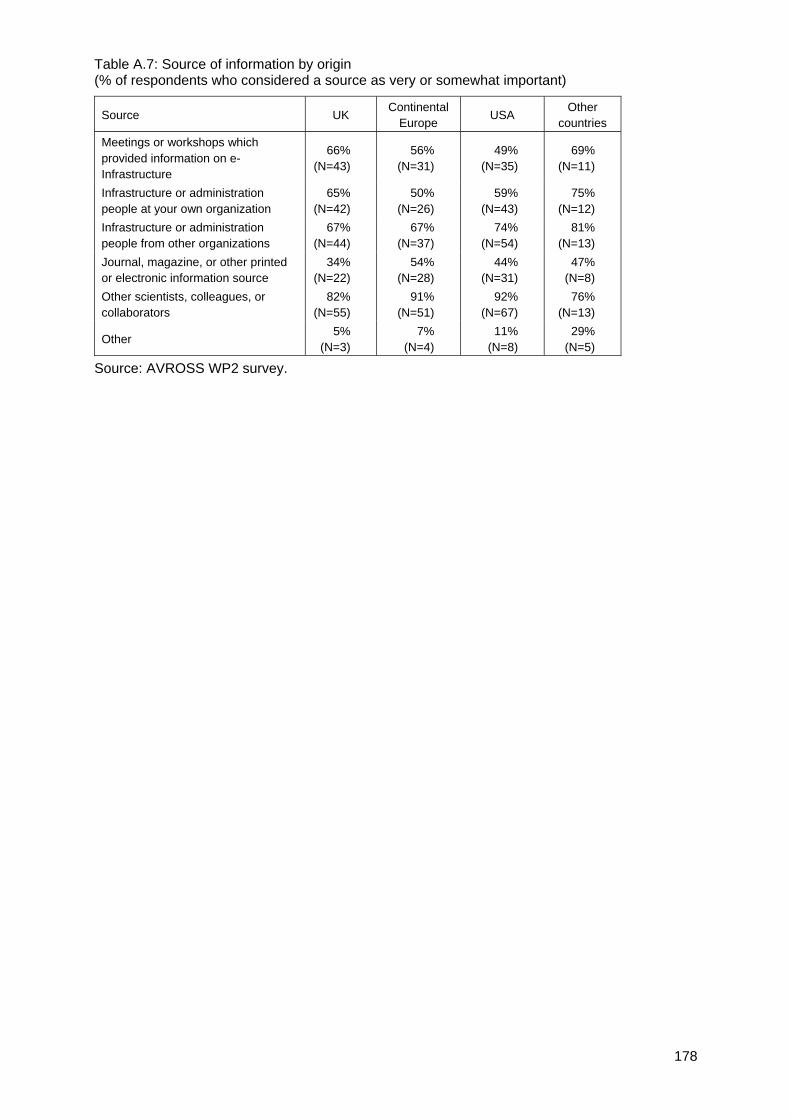
Table A.7: Source of information by origin (% of respondents who considered a source as very or somewhat important)
Source UK Continental
Europe USA Other
countries Meetings or workshops which provided information on e-Infrastructure
66% (N=43)
56% (N=31)
49% (N=35)
69% (N=11)
Infrastructure or administration people at your own organization
65% (N=42)
50% (N=26)
59% (N=43)
75% (N=12)
Infrastructure or administration people from other organizations
67% (N=44)
67% (N=37)
74% (N=54)
81% (N=13)
Journal, magazine, or other printed or electronic information source
34% (N=22)
54% (N=28)
44% (N=31)
47% (N=8)
Other scientists, colleagues, or collaborators
82% (N=55)
91% (N=51)
92% (N=67)
76% (N=13)
Other 5%
(N=3) 7%
(N=4) 11%
(N=8) 29%
(N=5)
Source: AVROSS WP2 survey.
M4 Final Report
III
Table of content
Preface II
Executive summary V
1. Introduction 1 1.1 Current e-Infrastructure use in the social sciences and humanities 1 1.2 Definition of e-Infrastructures in this study 3 1.3 Contents of this deliverable 4
2. Theoretical framework of the study 5 2.1 Different models of technological innovation 5 2.2 The social shaping of e-Infrastructures 6
2.2.1 Technology and user communities 8 2.2.2 Scientific shaping of technology 9 2.2.3 Funding and staff 11 2.2.4 Relationship to institutional practices and disciplinary cultures 12
3. Stock-taking of e-Infrastructures in the social sciences and humanities 16 3.1 Explanation of the empirical approach 16 3.2 Background information on respondents 18
3.2.1 Differences in origin 18 3.2.2 Activity profiles of time use 20 3.2.3 Collaborators 21 3.2.4 Respondents’ involvement and experience with e-Infrastructure 21
3.3 Background information on projects 26 3.3.1 Disciplines represented 26 3.3.2 Project funding and size 27 3.3.3 Technological features of the projects 32 3.3.4 Project outcomes and user constituency 36
3.4 e-Infrastructure adoption 44 3.4.1 Sources of information contributing to e-Infrastructure use 44 3.4.2 Potential catalysts in the adoption of e-Infrastructure technology 49 3.4.3 Potential barriers in the adoption of e-Infrastructure technology 53
3.5 Positive and negative lessons learned during the realisation of an e-Infrastructure project 57 3.5.1 Responses on positive and negative lessons learned 57 3.5.2 Lessons learned by characteristics of respondents 62
3.6 Summary 68 3.6.1 e-Infrastructure projects 68 3.6.2 e-Infrastructure adoption 70 3.6.3 Positive and negative lessons learned in e-Infrastructure projects 71
4. Promising approaches to using e-Infrastructures in the social sciences and humanities 73 4.1 Case study approach 73
4.1.1 Identification of the eight most promising approaches 73
AVROSS
IV
4.1.2 Case study method and guidelines 75 4.2 Case studies on e-Infrastructure initiatives 76
4.2.1 Access Grid Support Centre – AGSC 76 4.2.2 Modelling and Simulation for e-Social Science – MoSeS 83 4.2.3 Communication Data – ComDAT (pseudonym) 92 4.2.4 Simulation Portal – SPORT (pseudonym) 101 4.2.5 Understanding New Forms of Digital Records for e-Social Science
(Digital Records) – DReSS 107 4.2.6 Dokumentation Bedrohter Sprachen [Documentation of Endangered
Languages] - DoBeS 111 4.2.7 TextGrid 113 4.2.8 FinGrid (pseudonym) 117
4.3 Synthesis of the investigated cases 125 4.3.1 Technology 132 4.3.2 User communities and involvement 133 4.3.3 Funding and staff 134 4.3.4 Relationship to established practices 135 4.3.5 Impact on research and learning 136 4.3.6 Summary 137
5. Policy recommendations 139 5.1 Introduction 139 5.2 Capacity building 142
5.2.1 Broaden the base of scientists and technicians trained on e-Infrastructures 142
5.2.2 Provide resources for e-Infrastructure development 143 5.3 Tool development 145 5.4 Facilitating adoption 147 5.5 Raising awareness 150 5.6 A research programme on e-Infrastructure in the social sciences
and humanities 151
References 155
Appendix I: Early adopters survey 160 Appendix I.1: The questionnaire 160 Appendix I.2: The Email 175 Appendix I.3: Tables 176 Appendix I.4: Verbatims 185 Appendix I.5: Code system for the positive and negative lessons (QD3 and
QD4) 196
Appendix II: Case studies 199 Appendix II.1: Criteria for rating the e-Infrastructure initiatives in the case study
selection 199 Appendix II.2: Informants in case studies 200 Appendix II.3: Contact letter for e-Science experts worldwide 201 Appendix II.4: Interview Guideline 202 Appendix II.5: Summary rating of the described cases 205
M4 Final Report
V
Executive summary This study responds to a European Commission call to report on the state of the art in applying e-Infrastructure to social science and humanities (SSH). The aim of the study was to research, select and analyse a significant number of the most promising applications of e-Infrastructure, paying special attention to opportunities for computer-supported collaborative learning (CSCL). The ultimate goal was to provide recommendations as to the possible scenarios for a large scale roll out of technologies and applications supporting virtual research organisations and novel services for students.
Though it is clear that social sciences and the humanities have both much to gain and a key role to play in promoting e-Infrastructure uptake across the disciplines, they have to date not been quick to adopt advanced grid-based e-Infrastructure. Our recommendations to EU policy-makers point the way to changing this situation, promoting e-Infrastructure development and application in these disciplines, with expected impact in areas with related requirements.
The empirical part of the study had two components. The first of these was an exploratory survey of early adopters of e-infrastructure. The second was an investigation of eight case studies.
Survey Analysis The first component consisted of a web-based survey sent to early adopters of e-Infrastructure in the social sciences and the humanities. The intention was to provide a stock-taking of e-Infrastructure projects in Europe and beyond, and was sent in the spring of 2007 to roughly 2,000 individuals who had been identified as potentially involved in e-Infrastructure work. The aim was to cast a very wide net to generate the maximum number of responses, and over 560 responses were received - 448 usable responses (23.4% of the sample).
The survey yielded several striking findings. One set of findings concerned respondent perceptions about the factors leading to e-Infrastructure adoption in social sciences and humanities. The second set of findings concerned the structure of e-Infrastructure projects carried out so far.
Respondent perceptions First, survey respondents stressed the importance of other scientists in spreading information. Printed information is of comparatively little importance, and is only important for those scientists predominantly collaborating at the non-local, national and international, levels.
Second, the respondents highlighted a number of key catalysts for infrastructure adoption: seed funding, interesting research, and collaboration. Seed funding was identified as more important in the US and in other countries than in the UK, and least important in continental Europe. The computational requirements of the research, on the other hand, are more important in the latter regions.
Third, the respondents identified a number of key barriers to e-Infrastructure adoption. Three factors were uniformly most important, regardless of the discipline and experience of the respondents: lack of funding, costs, and lack of qualified staff.
Fourth, the survey revealed that any funding strategy should take the needs of users and other stakeholders into account. Early adopters frequently remarked that community-building is a critical factor in a successful e-Infrastructure project. The ability of a project to connect to a user community appears to be easier when that discipline is also represented in the project. User feedback should be sought early;
AVROSS
VI
indeed, it may be advisable to ensure that tool development be user-led in order to secure the uptake of the results.
Fifth, it is important to have a supportive institutional and scientific environment, namely, supportive local IT staff and university administrations, as well as broader support in the disciplinary domain.
Finally, the technological limitations of e-Infrastructure include their reliability and user-friendliness. These tend to be exacerbated if the service models of computing services are deficient, particularly if the models’ technical solutions are inflexible, there is a lack of openness to software revisions and information exchange and a failure to incorporate mutual learning across e-Infrastructure projects.
Project structure We found that research foundations and councils were the dominant source of funding across the board. Projects in continental Europe and the USA are larger than projects in the UK, both with respect to funding and staff.
The most frequently used e-Infrastructure items included communication and collaboration tools, as well as distributed data, and required high bandwidth. High performance computing, which is a feature of other sciences, was not as important, nor were the innovative data collection methods. Some level of variation was visible by country of the project: learning environments and virtual/3D environments play a larger role in US-based projects. Continental European projects more often contain data repositories, whereas videoconferencing is relatively unimportant – it is used more than twice as often in UK-based projects. The items varied also by project length: virtual/3D environments were of notably higher relevance in long-term projects, lasting for three years or longer. This is consistent with a view that the provision of interfaces for learning and practice becomes more important when the development phase is completed and the actual user involvement gets more and more critical.
Respondents reported a variety of outcomes from their projects, including publications, new methods, new data, follow-on collaborations, and new tools. They also reported a very broad user constituency. Interestingly, almost all disciplinary constituencies that are reached are reached by a project that includes participants on the team with the same discipline as the user constituency.
Case Study Analysis The second empirical contribution of AVROSS was based on an analysis of eight case studies identified as promising e-Infrastructure projects in the social sciences and humanities. Data on the cases was obtained through semi-structured interviews with developers, principal investigators, and users of the infrastructure; in addition, both published and internal project material was obtained from different sources such as the interview partners, project websites or other sites containing project descriptions and presentations. As with the survey, several striking findings emerged.
The first was the importance of technology. The main technological problems in the cases resulted from concerns about data security and reliability of the technology. Protecting new types of data and controlling access to it required the developments of new tools and applications. The second key technological constraint was the often negative experiences of (pilot) users when using the applications. These negative experiences resulted from complex user interfaces (UI), unstable applications, and difficulties in integrating existing applications and standards into the new environment. However, lack of computational power was not a major barrier. Interviewees from the case studies remarked that it is very
M4 Final Report
VII
difficult to align the approaches to computing followed by social scientists with those followed by high energy physicists or other more developed Grid user communities. Since the SSH approaches are ingrained in field-specific cultures and practices, SSH researchers are typically unwilling to adjust their practices in order to use the grid.
The second set of findings concerns key challenges. Most projects had difficulty in developing a user community. Only two of the eight projects currently have large user communities. The strategies for recruiting users are rather weak and underdeveloped: projects tend to rely on what is offered by their funding or institutional environment. A related challenge was the difficulty of developing sources of sustainable funding: For example, while the Access Grid project has been successful, a key ingredient to this success seems to be that the service is offered free or close to free of charge for the users. However, in contrast to the survey, the case study projects did not identify the recruitment of staff as a major issue.
The third set of findings centred around the disruptive nature of the technology. Some cases found difficulty in relating their work to existing practices and the culture within their field. Data privacy and access restrictions, high costs of producing metadata and making data usable for third parties were particularly problematic. A related challenge was the difficulty of finding appropriate academic compensation for tool developers, data producers, or contributors to methodology, since the assignment of academic credits and rewards for such tasks is not common in SSH. However, the case studies suggest that the problems of communication and collaboration across disciplinary borders was more sophisticated, possibly as these were more pressing and disrupting project progress.
The final set of findings had to do with the actual impact on research and teaching which has been, by and large, rather modest. This can partially be explained by the fact that some of the projects are either pilot projects or still in an early phase of development. However, this cannot hide the fact that making a measurable impact on the field is actually one of the main challenges for any e-Infrastructure project in SSH. Since publications are the key output measure in SSH as in other academic domains, and because data sources and tools are still rather neglected in research publications, it will be difficult to prove the impact through this channel. The teaching and learning activities are not very well developed in any of the investigated projects. Graduate students were mentioned as users in some projects; however, except for one project, they do not receive special attention, for instance through courses that teach the use of the infrastructure.
Policy recommendations Although the survey was not scientific in nature, and case study analyses are inherently illustrative rather than definitive in scope, the study did identify several key issues which could be used for policy purposes.
1. There is a limited base of motivated scientists and skilled technicians trained on e-Infrastructures which could be broadened through education and training – with an important role for CSCL.
2. Tool development must be done with the cooperation of the user community. Use barriers are lower if users are familiar with tools which “only” have been ported on the grid environment; standardisation raises the confidence in sustainability.
3. The adoption of e-infrastructures by domain scientists is as often hindered by organizational as it is by technical barriers. The provision of user support
AVROSS
VIII
services to provide advice and propagate best practice is essential if organisational barriers are to be tackled effectively.
4. Awareness needs to be raised through demonstrating the benefits of e-Infrastructures. This is most effectively done through field-specific information channels and between peers. Institutional environments can be structured to increase the pay-offs of e-Infrastructure investments.
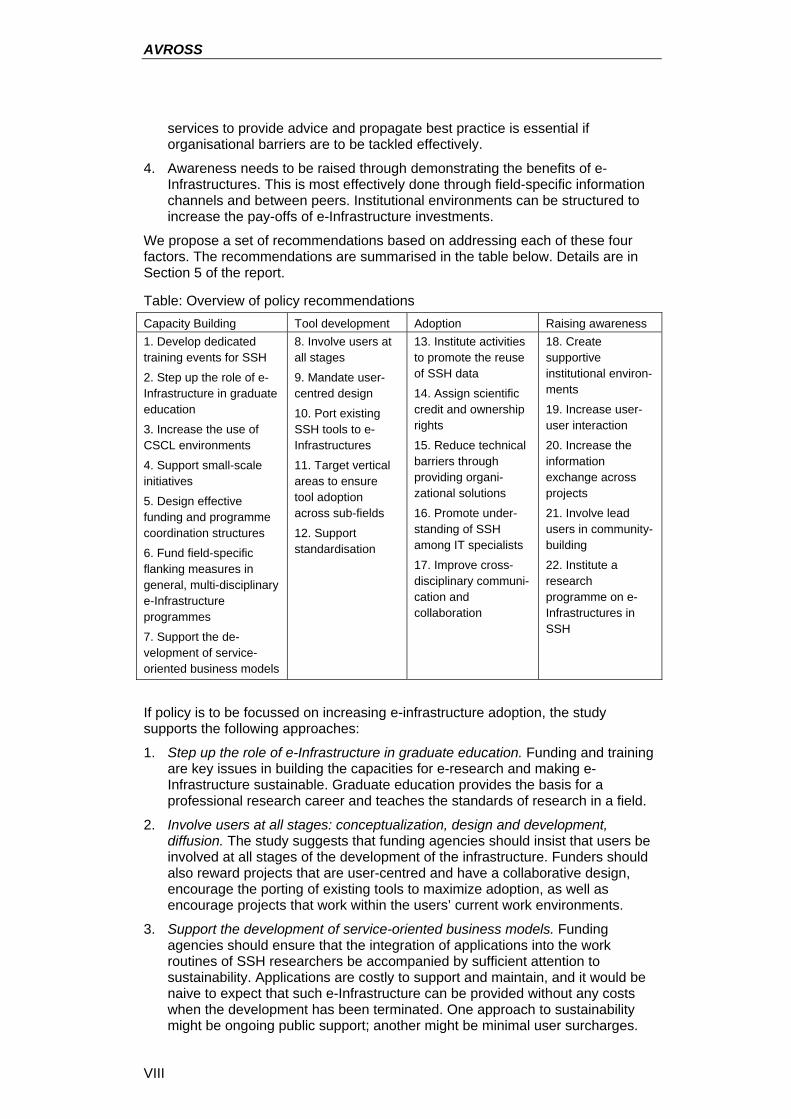
We propose a set of recommendations based on addressing each of these four factors. The recommendations are summarised in the table below. Details are in Section 5 of the report.
Table: Overview of policy recommendations Capacity Building Tool development Adoption Raising awareness 1. Develop dedicated training events for SSH
2. Step up the role of e-Infrastructure in graduate education
3. Increase the use of CSCL environments
4. Support small-scale initiatives
5. Design effective funding and programme coordination structures
6. Fund field-specific flanking measures in general, multi-disciplinary e-Infrastructure programmes
7. Support the de-velopment of service-oriented business models
8. Involve users at all stages
9. Mandate user-centred design
10. Port existing SSH tools to e-Infrastructures
11. Target vertical areas to ensure tool adoption across sub-fields
12. Support standardisation
13. Institute activities to promote the reuse of SSH data
14. Assign scientific credit and ownership rights
15. Reduce technical barriers through providing organi-zational solutions
16. Promote under-standing of SSH among IT specialists
17. Improve cross-disciplinary communi-cation and collaboration
18. Create supportive institutional environ-ments
19. Increase user-user interaction
20. Increase the information exchange across projects
21. Involve lead users in community-building
22. Institute a research programme on e-Infrastructures in SSH
If policy is to be focussed on increasing e-infrastructure adoption, the study supports the following approaches:
1. Step up the role of e-Infrastructure in graduate education. Funding and training are key issues in building the capacities for e-research and making e-Infrastructure sustainable. Graduate education provides the basis for a professional research career and teaches the standards of research in a field.
2. Involve users at all stages: conceptualization, design and development, diffusion. The study suggests that funding agencies should insist that users be involved at all stages of the development of the infrastructure. Funders should also reward projects that are user-centred and have a collaborative design, encourage the porting of existing tools to maximize adoption, as well as encourage projects that work within the users’ current work environments.
3. Support the development of service-oriented business models. Funding agencies should ensure that the integration of applications into the work routines of SSH researchers be accompanied by sufficient attention to sustainability. Applications are costly to support and maintain, and it would be naive to expect that such e-Infrastructure can be provided without any costs when the development has been terminated. One approach to sustainability might be ongoing public support; another might be minimal user surcharges.
M4 Final Report
IX
4. Invest in addressing the data confidentiality concerns that inhibit adoption. The survey demonstrated that most of the early adopters were in areas that did not use confidential data on human subjects, and the existence of this barrier was confirmed by the case study research.
5. Institute a research programme on e-Infrastructures in SSH. This study has provided much valuable data on adoption patterns of e-Infrastructure within SSH. However, our findings must be understood as being provisional and bounded. This is for two main reasons: 1) the limited time and resources available have constrained the scope and depth of the data collection and our analysis; 2) the adoption of e-Infrastructure within SSH is a fast changing and dynamic picture as new user communities engage and new technological solutions come into play. The character and impact of barriers to adoption are highly likely to change as this process continues and a one-off evaluation activity cannot capture this.
A research program that has the capacity to continually monitor adoption patterns, processes and challenges faced as e-Infrastructure diffuses into new SSH user communities will be central to maximizing the value of the investment Such a program could provide feedback into the strategic planning and execution of e-Infrastructure programmes and projects. Monitoring could be instituted at three different levels: individual users and developers, research fields and research organisations.
It is not within the remit of this study to provide recommendations about the merits of a pan-European strategy versus a nationally based strategy to promote e-infrastructure adoption. However, we do note that a European approach could be extremely useful if it could: support international exchange and collaboration; transfer competence among countries; reduce problems of interoperability and coordination costs; achieve economies of scale; deal more effectively with collaboration extending beyond European boundaries and the academic sector; and create a joint technological space for the social sciences and humanities.

M4 Final Report
1
1. Introduction
1.1 Current e-Infrastructure use in the social sciences and humanities
There is a profound potential for advances in e-social science to promote social science to the rank of “big science”, with enormous scientific and social payoff. The advancement of the science of human measurement has been one of the greatest challenges faced by scientists – precisely because human beings and organi-zations are extraordinarily complex units of scientific analysis. E-infrastructure developments offer an opportunity to answer fundamental scientific questions about the complexity of human interactions because of the new potential to collect, link, access and analyse data on a scale transcending what is now possible. The parallels to the success of the human genome project are clear. That project, which generated a whole new “systems” approach to understanding health and disease, has meant that biological sciences are now moving from having the complete parts list to learning how these parts function together in networks and systems. Similarly, the sweeping changes in the ability to collect and analyse data on human subjects and their interactions now mean that social science researchers are at a similar tipping point in being able to study human behaviour.
The tipping points are evident in a number of dimensions. Social scientists can now build and analyze ever more complex and multi-disciplinary models using real and synthetic populations. They can now model social networks as well as individual behaviour. In addition, new topics of study have been opened up, precisely because human beings have a new tool. Regular human actions are influenced by computer-related phenomena, and social scientists are learning about how these new tools affect human behaviour. They are studying how cyberspace has fundamentally changed not only human social transactions, such as dating and marriage, but also human economic transactions, such as shopping and outsourcing. This extends to the process of scientific discovery. As the Atkins report pointed out,
“The conduct of science is a social activity, pursued by individuals, collaborations, and formal organizations… Any enlightened application of information technology must take into account not only the mission of science and engineering research but also the organizations and processes adopted in seeking these missions… Advanced cyberinfrastructure offers the potential to conduct new types of research in new ways. Doing this effectively requires holistic attention to mission, organization, processes, and technology. It creates the need to involve social scientists as well as natural scientists and technologists in a joint quest for better ways to conduct research.” (Atkins, Droegemeier, Feldman, Garcia-Molina, Klein, Messerschmitt et al., 2003, pp. 14-15)
In sum, social scientists, given the appropriate investments and infrastructure, may not only achieve fundamental scientific advances in their own fields, but also provide the scientific insights to promote the success of e-science investments more generally.
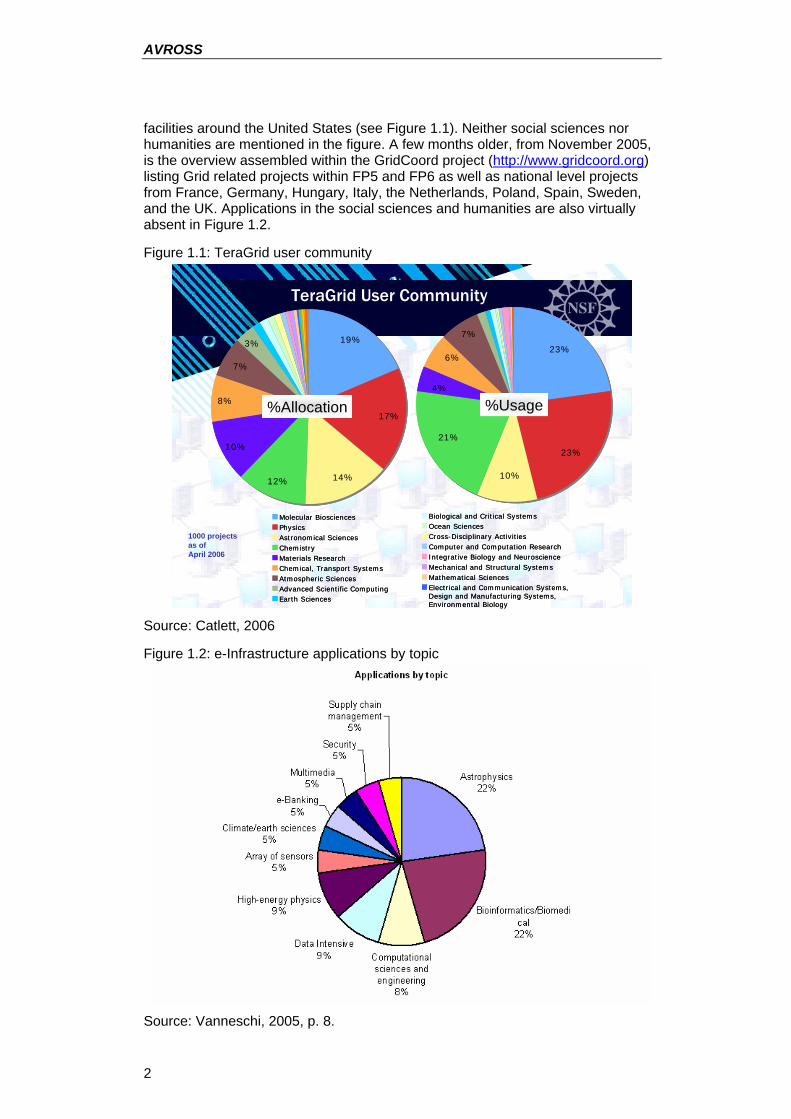
Yet social sciences, by and large, have not adopted e-Infrastructure in their work. In a 2006 presentation1 Charlie Catlett, the Director of TeraGrid, showed the usage by different disciplines of the TeraGrid, a large scale project to integrate high-performance computers, data resources and tools, and high-end experimental 1 TeraGrid All Hands Meeting, June 13, 2006.
AVROSS
2
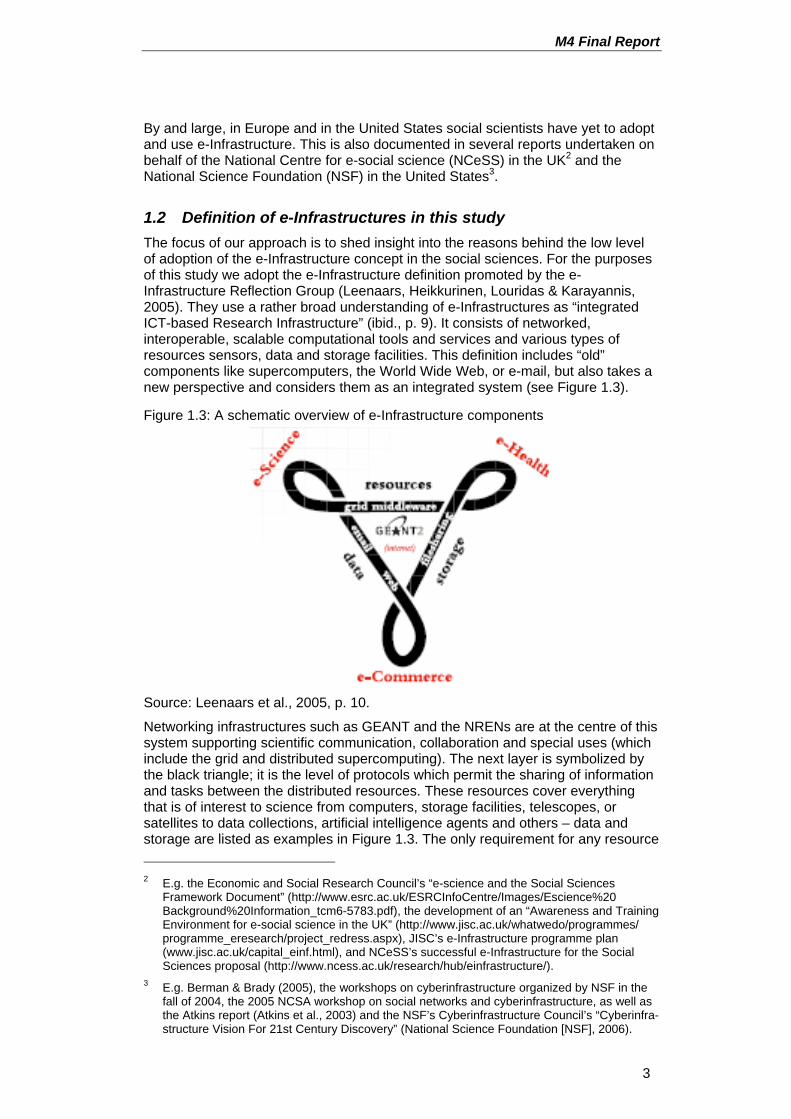
facilities around the United States (see Figure 1.1). Neither social sciences nor humanities are mentioned in the figure. A few months older, from November 2005, is the overview assembled within the GridCoord project (http://www.gridcoord.org) listing Grid related projects within FP5 and FP6 as well as national level projects from France, Germany, Hungary, Italy, the Netherlands, Poland, Spain, Sweden, and the UK. Applications in the social sciences and humanities are also virtually absent in Figure 1.2.
Figure 1.1: TeraGrid user community
Molecular BiosciencesMolecular BiosciencesPhysicsPhysicsAstronomical SciencesAstronomical SciencesChemistryChemistryMaterials ResearchMaterials ResearchChemical, Transport SystemsChemical, Transport SystemsAtmospheric SciencesAtmospheric SciencesAdvanced Scientific ComputingAdvanced Scientific ComputingEarth SciencesEarth Sciences
Biological and Critical SystemsBiological and Critical SystemsOcean SciencesOcean SciencesCross-Disciplinary ActivitiesCross-Disciplinary ActivitiesComputer and Computation ResearchComputer and Computation ResearchIntegrative Biology and NeuroscienceIntegrative Biology and NeuroscienceMechanical and Structural SystemsMechanical and Structural SystemsMathematical SciencesMathematical SciencesElectrical and Communication Systems, Design and Manufacturing Systems, Environmental Biology
Electrical and Communication Systems, Design and Manufacturing Systems, Environmental Biology
23%
23%
10%
21%
4%
6%
7%
%Usage
23%
23%
10%
21%
4%
6%
7%
%Usage
19%
17%
14%12%
10%
8%
7%
3%
%Allocation
19%
17%
14%12%
10%
8%
7%
3%
%Allocation
TeraGrid User Community
1000 projectsas of April 2006
Source: Catlett, 2006
Figure 1.2: e-Infrastructure applications by topic
Source: Vanneschi, 2005, p. 8.
M4 Final Report
3
By and large, in Europe and in the United States social scientists have yet to adopt and use e-Infrastructure. This is also documented in several reports undertaken on behalf of the National Centre for e-social science (NCeSS) in the UK2 and the National Science Foundation (NSF) in the United States3.
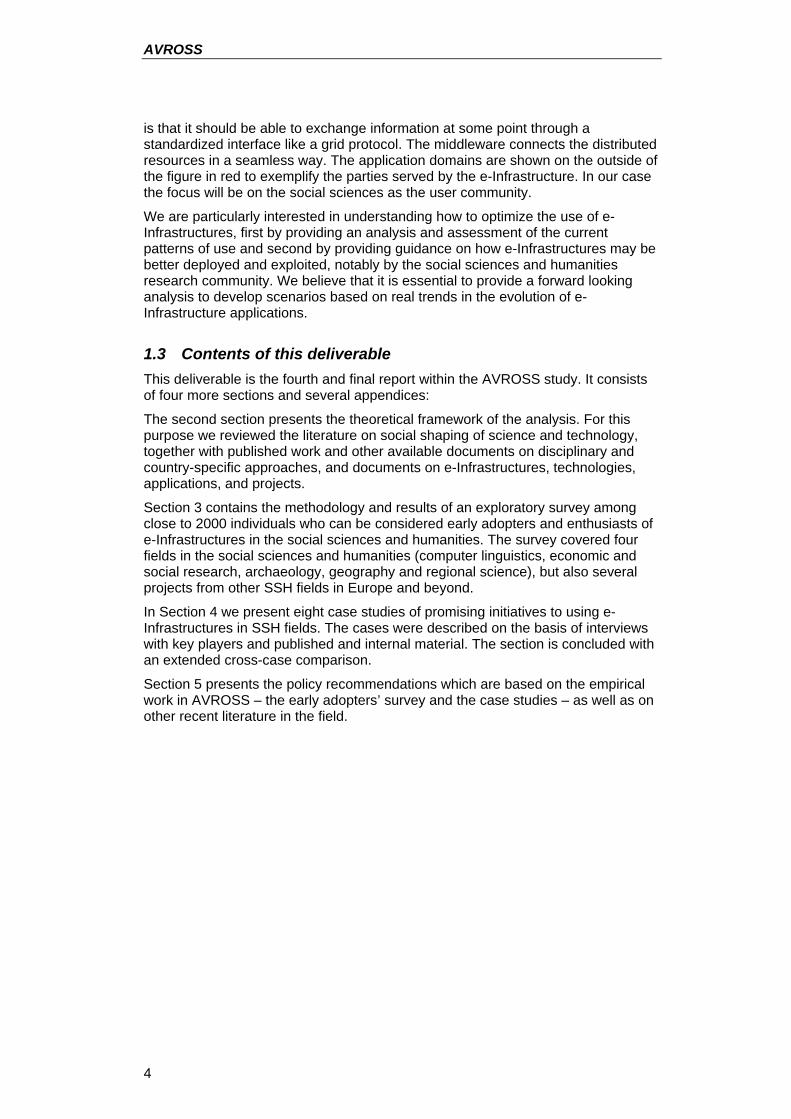
1.2 Definition of e-Infrastructures in this study The focus of our approach is to shed insight into the reasons behind the low level of adoption of the e-Infrastructure concept in the social sciences. For the purposes of this study we adopt the e-Infrastructure definition promoted by the e-Infrastructure Reflection Group (Leenaars, Heikkurinen, Louridas & Karayannis, 2005). They use a rather broad understanding of e-Infrastructures as “integrated ICT-based Research Infrastructure” (ibid., p. 9). It consists of networked, interoperable, scalable computational tools and services and various types of resources sensors, data and storage facilities. This definition includes “old” components like supercomputers, the World Wide Web, or e-mail, but also takes a new perspective and considers them as an integrated system (see Figure 1.3).
Figure 1.3: A schematic overview of e-Infrastructure components
Source: Leenaars et al., 2005, p. 10.
Networking infrastructures such as GEANT and the NRENs are at the centre of this system supporting scientific communication, collaboration and special uses (which include the grid and distributed supercomputing). The next layer is symbolized by the black triangle; it is the level of protocols which permit the sharing of information and tasks between the distributed resources. These resources cover everything that is of interest to science from computers, storage facilities, telescopes, or satellites to data collections, artificial intelligence agents and others – data and storage are listed as examples in Figure 1.3. The only requirement for any resource 2 E.g. the Economic and Social Research Council’s “e-science and the Social Sciences
Framework Document” (http://www.esrc.ac.uk/ESRCInfoCentre/Images/Escience%20 Background%20Information_tcm6-5783.pdf), the development of an “Awareness and Training Environment for e-social science in the UK” (http://www.jisc.ac.uk/whatwedo/programmes/ programme_eresearch/project_redress.aspx), JISC’s e-Infrastructure programme plan (www.jisc.ac.uk/capital_einf.html), and NCeSS’s successful e-Infrastructure for the Social Sciences proposal (http://www.ncess.ac.uk/research/hub/einfrastructure/).
3 E.g. Berman & Brady (2005), the workshops on cyberinfrastructure organized by NSF in the fall of 2004, the 2005 NCSA workshop on social networks and cyberinfrastructure, as well as the Atkins report (Atkins et al., 2003) and the NSF’s Cyberinfrastructure Council’s “Cyberinfra-structure Vision For 21st Century Discovery” (National Science Foundation [NSF], 2006).
AVROSS
4
is that it should be able to exchange information at some point through a standardized interface like a grid protocol. The middleware connects the distributed resources in a seamless way. The application domains are shown on the outside of the figure in red to exemplify the parties served by the e-Infrastructure. In our case the focus will be on the social sciences as the user community.
We are particularly interested in understanding how to optimize the use of e-Infrastructures, first by providing an analysis and assessment of the current patterns of use and second by providing guidance on how e-Infrastructures may be better deployed and exploited, notably by the social sciences and humanities research community. We believe that it is essential to provide a forward looking analysis to develop scenarios based on real trends in the evolution of e-Infrastructure applications.
1.3 Contents of this deliverable This deliverable is the fourth and final report within the AVROSS study. It consists of four more sections and several appendices:
The second section presents the theoretical framework of the analysis. For this purpose we reviewed the literature on social shaping of science and technology, together with published work and other available documents on disciplinary and country-specific approaches, and documents on e-Infrastructures, technologies, applications, and projects.
Section 3 contains the methodology and results of an exploratory survey among close to 2000 individuals who can be considered early adopters and enthusiasts of e-Infrastructures in the social sciences and humanities. The survey covered four fields in the social sciences and humanities (computer linguistics, economic and social research, archaeology, geography and regional science), but also several projects from other SSH fields in Europe and beyond.
In Section 4 we present eight case studies of promising initiatives to using e-Infrastructures in SSH fields. The cases were described on the basis of interviews with key players and published and internal material. The section is concluded with an extended cross-case comparison.
Section 5 presents the policy recommendations which are based on the empirical work in AVROSS – the early adopters’ survey and the case studies – as well as on other recent literature in the field.
M4 Final Report
5
2. Theoretical framework of the study
2.1 Different models of technological innovation The theoretical framework that we developed had to be broad enough to encompass the different influences on providers and users and structure the empirical work. Social studies of technology and science provide several starting points for such a model.
Deterministic models focus on the social changes caused by the introduction of a new technology. They have a dynamic perspective on society and consider technological innovation and organisational change as a process of adoption to environmental conditions (McLoughlin, 1999). In these models technology is seen as an exogenous variable that is not influenced by social actors. Consequently, technological determinism is frequently criticised for underestimating the complexity and malleability of technologies (Edge, 1995). The decisions of inventors, investors, or early users that invariably are observed to shape any new technology or application are largely ignored in deterministic approaches. This was in evidence, in particular, in respect of advanced information and communication technologies, like multimedia applications and broadband, in their early stages (Williams, 1997). Moreover, technological determinism is accused of oversimplifying the relationship between technology and users by overstating the transformative power of technologies (Edge, 1995; McLoughlin, 1999). Technology generation, introduction and diffusion are wrongly conceived as linear processes.
Opposing the deterministic conceptions of the relationship between technology and society and replacing the linear model by evolutionary perspectives, a set of alternative models has been developed that can be summarised under the notion of “social shaping of technology” (SST). The overriding strength of these approaches is that they ask how “technology” comes to be “technology”. Common characteristics are that they do not conceive of technology as exogenous, or fixed by “nature” alone, but shaped also by non-technical factors. Social shaping describes the developmental process of a technology as an alternation of variation and selection. The linear order of invention, innovation and diffusion is disrupted in social shaping studies. An innovation is not considered as a fixed product, process or organisational configuration that is diffused if it matches the requirements of the potential adopters as in diffusion studies (Rogers, 1995). Rather, SST highlights that a new technology will still be shaped and reconfigured during innovation and diffusion:
“A social shaping perspective, however, focuses on the ongoing dynamic between a technology and a community, as the technology is developed, used, shaped, reconfigured, and reconstituted within the community.” (Kling & McKim, 2000, p. 1311)
Thus, a major contribution of SST approaches to the analysis of technological innovation is that it brought the users back into the picture. The users are not seen anymore as mere adopters of a fixed product, but they are influential constituents (Molina, 1997) whose needs and requirements are incorporated into the technology (Fleck, 1994; Fleck, Webster & Williams, 1990). The importance of user-supplier interactions has been particularly demonstrated in IT innovations (Williams & Edge, 1996).
A very similar theory, namely the social construction of technology (SCOT) approach, also focuses on the social influences of technological innovation. It perceives the latter as the outcome of an ex-ante multidirectional process, from which a specific solution is selected through processes of negotiation and re-negotiation between the relevant social groups (Pinch & Bijker, 1987). The
AVROSS
6
members of these relevant social groups, institutions, organisations, organized or unorganized groups of individuals, share the same set of meanings in regard to the innovation. However, between the groups dominate different meanings and interpretations of the technology (“interpretative flexibility”) (R. Kline & Pinch, 1999). They perceive the strengths and problems differently which leads to conflicts about the right solution. For instance, in the early days of the bicycle there were different requirements in regard to speed and safety by young men and women (Pinch & Bijker, 1987). Some of these conflicts might be solved through new technical solutions, e.g., in the case of the bicycle the pneumatic tire that increased speed and safety at the same time, whereas others might lead to a differentiation of products. Then, the innovation becomes stabilized, at least as long as no new problems and conflicts appear on the scene.
However, the social constructivists have been criticized for social one-sidedness:
"...in explanations of technical change the social should not be privileged. … Other factors – natural, economic, or technical – may be more obdurate than the social and may resist the best efforts of the system builder to reshape them. Other factors may, therefore, explain better the shape of artifacts in question and, indeed, the social structure that results.” (Law, 1987, p. 113)
In actor-network theory (ANT), developed by scholars like Michel Callon (1986, 1991), John Law (1987) and Bruno Latour (Akrich & Latour, 1992), this prioritisation of the social is opposed and all components of a network – texts, technical objects, human beings, or money – are considered as potential actors. What makes an actor an actor is its capacity of transforming and creating network components: for instance, the Chernobyl nuclear power plant became an actor that transformed the lives of millions of people and animals all over Europe (Callon, 1991). As the Chernobyl example clearly shows, the transformation is often not in line with the components’ own “will” and it requires “heterogeneous engineering” (Law, 1987) to combine unhelpful components into self-sustaining networks.
From the perspective of actor-network theory, the invention, innovation and diffusion of a technology is the result of a co-evolution of the network, at times driven by human actors, at times by machines, written texts or other actors. The technology will be implemented and diffused if actors build a supporting network that is sufficiently strong to overcome all the barriers (Law & Callon, 1992). In the innovation process, the technology will be continuously shaped and adapted (Latour, 1986).
The next section will explain how these different models of technological innovation informed the current study on the adoption of e-Infrastructures in the social sciences and humanities.
2.2 The social shaping of e-Infrastructures SST theorists highlight the social determination of technological innovation using a broad conception of ‘social’:
“It is becoming increasingly clear that the answers to these shaping questions - the factors influencing the rate, directions and specific forms of technical change - are social as well as technical. The evidence for this is overwhelming: economic, cultural, political, and organisational factors - all of which we subsume in the term 'social' - have been shown to shape technological change." (Edge, 1995, p. 15)
Edge (1995) goes on to list in total eight types of social influence on technological change: geographic, environmental and resource factors; scientific advance; pre-existing technology; market processes; industrial relations concerns; other aspects
M4 Final Report
7
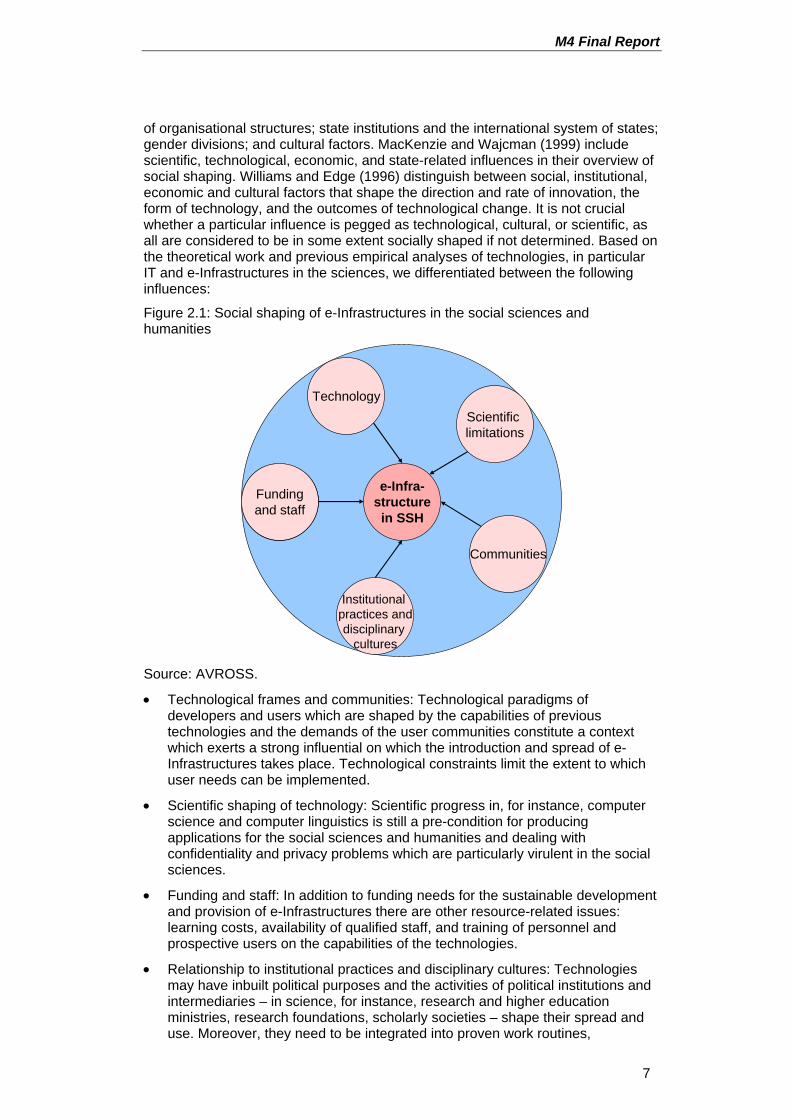
of organisational structures; state institutions and the international system of states; gender divisions; and cultural factors. MacKenzie and Wajcman (1999) include scientific, technological, economic, and state-related influences in their overview of social shaping. Williams and Edge (1996) distinguish between social, institutional, economic and cultural factors that shape the direction and rate of innovation, the form of technology, and the outcomes of technological change. It is not crucial whether a particular influence is pegged as technological, cultural, or scientific, as all are considered to be in some extent socially shaped if not determined. Based on the theoretical work and previous empirical analyses of technologies, in particular IT and e-Infrastructures in the sciences, we differentiated between the following influences:
Figure 2.1: Social shaping of e-Infrastructures in the social sciences and humanities
Scientific limitations
Technology
Communities
Obtainingveggiefood
Institutional practices and disciplinary
cultures
Fundingand staff
e-Infra-structurein SSH
Source: AVROSS.
• Technological frames and communities: Technological paradigms of developers and users which are shaped by the capabilities of previous technologies and the demands of the user communities constitute a context which exerts a strong influential on which the introduction and spread of e-Infrastructures takes place. Technological constraints limit the extent to which user needs can be implemented.
• Scientific shaping of technology: Scientific progress in, for instance, computer science and computer linguistics is still a pre-condition for producing applications for the social sciences and humanities and dealing with confidentiality and privacy problems which are particularly virulent in the social sciences.
• Funding and staff: In addition to funding needs for the sustainable development and provision of e-Infrastructures there are other resource-related issues: learning costs, availability of qualified staff, and training of personnel and prospective users on the capabilities of the technologies.
• Relationship to institutional practices and disciplinary cultures: Technologies may have inbuilt political purposes and the activities of political institutions and intermediaries – in science, for instance, research and higher education ministries, research foundations, scholarly societies – shape their spread and use. Moreover, they need to be integrated into proven work routines,
AVROSS
8
institutional practices and disciplinary cultures which requires functioning cross-disciplinary communication and collaboration between technologists and domain scientists.
Of course, any particular technology decision is likely to be driven by a combination of these factors. However, the classification does serve to reduce the complexity of the model to some extent. The following sections will discuss each of these factors in some more detail.
2.2.1 Technology and user communities One of the key arguments of SST is that a new technology is not a black box which has fallen from heaven into the hands of an expectant user community, but is shaped by the demands of the users and that relationships between social groups, material objects, and other components of the network are crucial in the innovation process. The idea that a new technology is typically a result of sudden inspiration and discovery is rejected by the social shaping theorists (MacKenzie & Wajcman, 1999). In their opinion, a gradual development takes place in which an existing technology is changed, improved, re-designed, adapted to new needs, etc. This development takes place, however, within the context of a “technological frame” or paradigm that determines what the involved social groups perceive.
“A technological frame is composed of, to start with, the concepts and techniques employed by a community in its problem solving. … Problem solving should be read as a broad concept, encompassing within it the recognition of what counts as a problem as well as the strategies available for solving the problem and the requirements a solution has to meet. This makes a technological frame into a combination of current theories, tacit knowledge, engineering practice (such as design methods and criteria), specialized testing procedures, goals, and handling and using practice.” (Bijker, 1987, p. 168)
In other words, the features that developers bestow on a new technology are influenced by what they perceive as feasible and desirable. This perception depends on the capacities of previous technologies which are used for the same or similar purposes, as technological development does not take place in a vacuum. The degree of innovativeness of a technology, whether it constitutes a radical or “just” an incremental innovation, will influence how much opposition it raises and whether and to what extent it is implemented (Molina, 1997).
Moreover, what a particular technology does also depends on its systemic character. Williams (Williams, 1997; Williams & Edge, 1996) distinguishes discrete and integrated applications in information technology: Discrete applications are subject to highly fluid and uncertain innovation processes and designed to fit existing work organisations and specific objectives for changing them. Integrated applications, such as computer-integrated manufacturing (CIM), are more complex configurations which consist of packaged systems that need to be customised to the situations into which they are introduced. Hence, for discrete and integrated applications the degree and point in time of user involvement during the development process differ.
This relates to another perspective on technological innovation for which Fleck has coined the term “innofusion”, the concurrent realization of innovation and diffusion (Fleck, 1988). Technologies resulting from innofusion are configurational technologies, complex arrays of technical and non-technical components which need user input to obtain working status (Fleck, 1994). Good examples in case are highly usable sharing environments such as mySpace or youtube, i.e., the emergence of "Web 2.0". They are clearly showing the power of social processes in shaping web products in the consumer segment. In our study environment,
M4 Final Report
9
research communities in the social sciences, rights and opportunities for sharing of content and the usability of shared tools are also playing a role in innofusion.
All these concepts have in common that the functional characteristics, the degree and the quality of task-fulfilment, of a new technology are judged not on technical grounds, but in relation to affected social groups, in particular among the developers and users, as well as in relation to other components in its socio-technical network, like the existing “old” technology and other elements of an integrated technological system. The key message here is that the best technical solution is not necessarily the appropriate solution of a problem. Second or third best technologies might be superior in the light of the surrounding conditions.
This is not to say that such factors have not been ignored altogether by developers of e-Infrastructures. Many of the prototype tools and services generated within e-Infrastructure programmes have benefited from the close involvement of committed groups of users. This has contributed enormously to understanding user requirements and to the evaluation of prototypes. However, the involvement of committed users is not, in itself, sufficient to ensure that these prototypes are ready for deployment more widely. First, requirements identified by these users may not be representative of the requirements of the wider user community. Ways of doing research may vary, not only between disciplines but even between groups of researchers working within the same discipline. Hence, prototype tools and services are likely to privilege the needs of those users who were involved in their development. Expecting other researchers to accept these as their own is unrealistic and likely to be an obstacle to wider adoption. Second, early adopters may be more tolerant of limitations in new tools and services, being prepared, for example, to work around ‘bugs’, or to cope with poor usability. This raises the question of how prototype tools and services can be ‘re-factored’ to meet the requirements of the wider user community. Where tools and services offer significant innovations over existing work practices, requirements are liable to evolve rapidly as users undergo a process of learning how best to exploit these opportunities. In some cases, new requirements may emerge as novel applications are found for tools and services. It is important also to examine, therefore, the social organisation of e-Infrastructure development. It might be of key importance whether this is managed so as to ensure the continued, close interaction between users and developers essential for effectively tracking and responding to changes.
2.2.2 Scientific shaping of technology The idea of a linear succession from basic research to the market, via applied research, technical development, production and marketing has since long been abandoned in the sociology of technology (Edge, 1995; MacKenzie & Wajcman, 1999) as well as in evolutionary economics (Kline & Rosenberg, 1986). Though some technological areas might be driven very much by science, e.g., for biotechnology (Owen-Smith, Riccaboni, Pammolli & Powell, 2002; Zucker, Darby & Brewer, 1998), the influence of science on technology is generally seen as limited. Science and technology are rather considered as interlinked activities (Kline & Rosenberg, 1986), where science might benefit from technology as much as the other way around (Brooks, 1994; MacKenzie & Wajcman, 1999).
However, the analysis of the (potential) use of e-Infrastructures in the social sciences should not be blind in regard to the influences of science – in particular computer science – on technology development. There are several issues here. The first issue is the question of whether the ‘state of the art’ in computer science limits how social scientists might benefit from the availability of e-Infrastructure. The straightforward answer to this question is ‘yes’. On a mundane level, the seamless access to resources promised by the e-Infrastructure vision has yet to materialise. This certainly has impacts on all potential users but, arguably, these are greater for those in the social sciences and humanities who are generally less technically
AVROSS
10
proficient at making good the ‘gaps’ in the realisation of the e-Infrastructure vision. The challenge to the achievement of seamless access is to be able to represent in some formal and machine processable form descriptions (i.e., the semantics) of e-Infrastructure services and resources so that they can be made discoverable and composable without users having to grapple with the complexities of their underlying implementations. The realisation of the so-called ‘Semantic Grid’ remains core computer science research, specifically in the development of tools (both conceptual and practical) for knowledge management (De Roure, Jennings & Shadbolt, 2001).
In relation to the research agendas within social sciences, while these are quite diverse, advances in computational linguistics will be fundamental to the development of more effective tools, such as text mining, for data analysis. Another major result of the advances in e-Infrastructure could be the expansion of the ability of social scientists to collect information from a wide variety of different sources, as well as measure human behaviour in very different ways. One of the reasons that social science research has produced “softer” results than research in physical sciences is that in the latter disciplines, molecules don’t have minds of their own and make decisions by themselves. The new capacity that e-science offers social scientists to measure human minds and human decision-making – to go beyond simply numerical representations to visual and textual information to describe human behaviour – is potentially transformational.
Thus, although data collection on individuals and organizations has historically consisted of either survey based or administrative data, e-Infrastructure advances might fundamentally change the way in which scientists are collecting information and modelling human behaviour. Indeed, a recent National Science Foundation solicitation, entitled “Next Generation Cybertools” noted that new ways have been developed to improve both domain-specific and general-purpose tools to analyze and visualize scientific data – such as improving processing power, enhanced interoperability of data from different sources, data mining, data integration, information indexing. And a calculation at the recent NSF supported workshop4 about how many terabytes of data would be necessary to capture an entire life on video found that if the life were recorded on low web video, at 50 kbits/sec, the total space required would be 15TB. Even with DVD quality recording, at 5Mbits/sec, the total storage would only be 1500TB. Clearly, an entire life can now be captured and stored on existing media. Indeed, academic social scientists could increasingly use these tools to combine data from a variety of sources – including text, video images, wireless network embedded devices and increasingly sophisticated phones, RFIDs5, sensor webs, smart dust and cognitive neuroimaging records.
The opportunity has been taken up in some cases – examples in the social science disciplines of successful archiving and data dissemination projects include:
• The Allele Frequence Database (ALFRED) (see http://alfred.med.yale.edu/alfred/index.asp);
• Matlab (see http://www.mathworks.com/products/matlab/);
4 SBE/CISE workshop, Match 15-16 2005, http://vis.sdsc.edu/sbe/About 5 Radio frequency identification, or RFID, is a generic term for technologies that use radio
waves to automatically identify people or objects. There are several methods of identification, but the most common is to store a serial number that identifies a person or object, and perhaps other information, on a microchip that is attached to an antenna (the chip and the antenna together are called an RFID transponder or an RFID tag). The antenna enables the chip to transmit the identification information to a reader. The reader converts the radio waves reflected back from the RFID tag into digital information that can then be passed on to computers that can make use of it (see http://www.rfidjournal.com/article/articleview/207).
M4 Final Report
11
• the Inter-University Consortium for Political and Social Research (ICPSR) (see http://www.icpsr.umich.edu/); and
• the Linguistic Data Consortium (see http://www.ldc.upenn.edu/).
Data curation and privacy & security issues are problems which are particularly critical when it comes to sharing data related to human beings, as is usually the case in the social sciences and humanities. In the US, Federal statistical agencies have devoted substantial resources to both statistical and technical ways to protect confidentiality (Doyle, Lane, Zayatz & Theeuwes, 2001); the Social and Behavioral Research Working Group recently drafted a report entitled “Achieving Effective Human Subjects Protection and Rigorous Social and Behavioral Research” (Unpublished working document) for the Human Subjects Research Subcommittee of the Committee on Science, National Science and Technology Council; PITAC recently issued a report on cybersecurity that addressed some confidentiality issues and there have been numerous studies undertaken by the National Academy of Sciences and the Committee on National Statistics (Bradburn & Mackie, 2000). Last but not least, there are huge challenges posed by the collection, indexing, archiving, curation, and preservation of the new types of data that can be collected. In other words, realizing the remarkable potential of data requires not only that they be preserved, but also that they be discoverable by others (using various search tools) and available in a usable format, including essential metadata describing the nature, quality, and history of the data.
2.2.3 Funding and staff The role of costs and benefits or future costs and future benefits (MacKenzie & Wajcman, 1999) certainly exerts an important influence on the shape and success of an innovation in market economies. Costs of development, market introduction, and production, return on investment, expected sales price compared to older technologies and competing solutions are all economic categories which influence the decision of the involved groups in an innovation project. For instance, Law and Callon (1992) describe nicely how the high – and over the project duration continuously increasing – expected total development and production costs of a new military aircraft, the TSR2, raised substantial opposition among different actors in British government. In the end, economic reasons like the high costs, failure of securing overseas markets, and the availability of a cheaper alternative contributed together with other arguments to the cancellation of the project.
The users of e-Infrastructures are often confronted with high learning and installation costs for new computer applications and unclear returns on making these investments; they have multiple needs in regard to computers and their use in their professional communication and cooperation and they have to deal with different communication situations; they work in different organisational settings and financial arrangements; they are subject to pressures and demands from peers (and students) on the channels to be used for communication, endorsed research practices and methods, acceptable data and information sources, etc. In addition, there is likely to be under-investment and under-valuation of the human capital aspects of investment in e-Infrastructure, both because not enough attention is paid to securing continuity of key personnel and because inadequate resources exist to fund the documentation of software and practices for their use that can be used to aid continuity. US and UK scientists have expressed substantial concern about sufficient numbers of trained individuals for the full exploitation and maintenance of e-social science investments.6 The e-IRG proposes to increase efforts in the training of scientists and computer support personnel on working with grid 6 Unpublished summary reports NSF/SBE cyberinfrastructure workshops Sept 18, 2004 and
Oct 22, 2004; survey results from ESRC review of NCeSS hub, 2005
AVROSS
12
environments (Leenaars, et al., 2005). Extensive thought needs to go into devising the most effective management for e-Infrastructure projects. A cadre of paraprofessionals may be needed to supplement Ph.D. researchers. It was noted that the actual learning of the new technologies is not time consuming; rather, it is their adaptation for specific uses in the laboratory that requires great amounts of (expensive) principal investigator time.
The producers of e-Infrastructures are particularly affected by standardisation and resulting network economies. There are several examples in the history of computing in which the development of an industry standard either in relation to hardware, e.g. personal computers, microprocessors, or software, e.g. operating systems, human computer interfaces, provided a decisive push in the diffusion (Williams, 1997). An industry standard triggers two attractive consequences for the technology producers: First, the existing users of a technology benefit from additional users because of network externalities and the customer base for this technology grows. Second, a large customer base creates economies of scale and makes mass production possible. Then products and ideas diffuse via social networks through a domino effect. Early adopters ease the adoption for less innovative second movers. This again helps others and the innovation spreads gradually. At a certain point the process tips and the innovation spreads explosively, turns into an “epidemic”. The introduction of mobile phones in the mid 90’s is a good example. More and more people needed to be reachable when away from a fixed line; it became fashionable to communicate through mobile phones; they became the standard communication device in certain contexts.
We examine the role of technology diffusion through social networks, arguing that these reduce learning costs, enhance usability and sustainability and create a social incentive structure. The role of economic incentives in technology adoption has been clear since Griliches’ (1957) analysis of the adoption of hybrid corn in developing countries. However, sociologists have long argued that social networks provide important ways in which technology is diffused, and in the hybrid corn debate, Griliches acknowledged the importance of such networks: “If one broadens my ‘profitability’ approach to allow for differences in the amount of information available to different individuals, differences in risk preferences, and similar variables, one can bring it as close to the ‘sociological’ approach as one would want to.” (Griliches, 1962, p. 330, cited in Skinner & Staiger, 2006).
Standardisation could also solve a major issue which hampers adoption of new technologies, namely the concern by (potential) users about the sustainability of new tools and the resulting interoperability. This is, of course, a fundamental issue in e-science more broadly. In order for social scientists to invest time and energy in e-social science, they need to be convinced that the tools that they are using will not become rapidly obsolete. For example, in the United Kingdom the very successful initial Pilot Demonstrator Project, SAMD (http://www.sve.man.ac.uk/ Research/AtoZ/SAMD), which has been used as a flagship example of the value added of e-social science, is built on a platform that has since become obsolete. The successor project has essentially had to start from scratch because the new platform is not compatible with the earlier one. A related issue, which has also been raised in the United States, is that the successful development of middleware requires a support infrastructure that is beyond that envisaged by initial grants. Of course, hardening and sustaining research products is difficult because products are heterogeneous, the process is costly, and researchers are trained to break new ground, rather than sustain existing projects.
2.2.4 Relationship to institutional practices and disciplinary cultures Another important group of factors that influence technology development and adoption stem from the routines and practices that have been established over the years in the institutional and field environments. New technologies need to connect
M4 Final Report
13
to institutional and field routines, practices, and cultures. They also have to bridge them whenever knowledge of different types needs to be combined and they need to create cross-disciplinary exchange and understanding.
Matching between technical capacities and surrounding conditions. In a recent study Wouters and Beaulieu (2006) argue that e-Infrastructures are not (yet) conceived in a way that permits their integration into the particular culture, habits, customs and organisational setting of fields in the social sciences and humanities. They speak of a “misalignment between the emerging e-science community and other scholarly communities” (ibid., p. 62) and exemplify this by comparing the research practices and social relations in a particular social science field (women’s studies) with the current offerings of e-science. They conclude that e-science initiatives are still too much driven by computational research and the production of infrastructures for large-scale data and computation, and that a different turn to e-science should be considered: starting at the analysis of different research fields, with particular research practices, communication and collaboration relations, and a specific social organisation to find out how their differing needs can be supported by new ICTs.
This work is in the tradition of earlier work that stresses the influence of the cultural particularities of a field on how the internet is used. The importance of differing work organizations and social structures as well as the external relations determine in Walsh and Bayma’s (1996) study how the internet is used by mathematicians, chemists, experimental biologists and physicists. Kling and McKim (2000) show that field-specific constructions of trust and of legitimate communication influence whether and in what particular way e-publishing has become part of the communicative forum: Whereas high-energy physicists quickly adopted the arxiv.org e-print server as a central communication channel, some fields in computer science have established pure electronic journals, and molecular biologists rely on digital databases and shared digital libraries (like PubMed Central). Taking the case of a humanity field, namely corpus-based linguistics, Fry (2004) has highlighted that cultural elements exert a strong influence on the uptake and use of ICTs.
Political considerations. Winner (1999) provides several examples for technical solutions that are not primarily shaped by a technological paradigm or efficiency considerations, but consciously by political goals or subconsciously by a lack of consideration or awareness: the low height of bridges in New York intended to keep public transport and thus poor people and minorities out of certain areas; inefficient moulding machines that had the only advantage that they could be run by unskilled labour were used to destroy the union influence in a firm; the 1970s movement of handicapped people made society aware of the design deficiencies of many technologies for handicapped people and the resulting social exclusions.7
Political shaping in this sense means that arrangements and considerations of authority and power influence the form that a technology takes. Concerning e-Infrastructures in particular political considerations of different players in science policy like universities, sponsors of research and research infrastructure (like science foundations, research ministries and the European Commission), publishers, scholarly societies and others should be taken into account. Past initiatives at national level on promoting e-Infrastructures in the social sciences and humanities in the US and the UK certainly contribute to the fact that both countries are currently at the forefront of the discussion on e-Infrastructures. Publicly sponsored actions, like the building of demonstrators and prototyping of ways of
7 However, Winner (1999) makes clear that technologies can also induce certain social
conditions; for instance, nuclear power plants require a hierarchical management and control system, due to their health and security risks.
AVROSS
14
making e-Infrastructures more usable and deployable contributes to their spread in the UK. Because the evaluation and maintenance of data tools and products are both costly and not a natural part of research culture, they are unlikely to happen without a coordinated strategy to develop a critical mass of resources and appropriate incentive systems. The principal near-term opportunity is to survey existing mechanisms of hardening and sustaining e-Infrastructure at various levels and test the most promising approaches. Possible examples of successful hardening might be found in the US Digital Government program (see Burton & Lane, 2005, http://www.nsf.gov/funding/pgm_summ.jsp?pims_id=5459).
Academic production function. In terms of the basic unit of analysis, we think of each individual academic as operating like a firm that tries to maximize individual academic profits. This is a classic constrained optimization problem in which output is a function of inputs such as time, labour resources, and computational resources, and the cost constraint is described by prices of each input. In this very oversimplified framework, academic ability is the capacity to convert these inputs into outputs, where again, in simplified terms, output is the standard academic currency: the quality of refereed academic publications (as measured by a variety of factors, including citations) and academic grants. However, the broader societal problem faced by the European Commission is that each individual researcher is operating within a local, but not a global, optimum. The new capacities of e-Infrastructure offer the potential to fundamentally advance academic knowledge by generating new knowledge by means of creating new data, and new methods to analyse data. The challenge for the European Commission is to identify the factors that are needed to catalyse the adoption and use of e-science, broadly defined, and to change, in some ways, the nature of the academic production function. In this framework, we particularly focus on identifying the benefits to individuals, narrowly defined, and society, broadly defined, associated with social scientists adopting and using e-Infrastructure.
Assigning scientific credit and ownership rights. In addition, an important social aspect is that there is inadequate scientific credit for dissemination of existing research datasets or code, and this results in disincentives to sharing both. Barriers to wide data sharing result from their character as research resource: the production of empirical databases is costly; ownership and access to databases constitutes an important resource and input to empirical research. Hence, scientists might be unwilling to share these resources as long as they haven’t drawn all the benefits from them. Or they might not want or be able to provide sufficient information for other scientists to use the available data with confidence. As Woolgar and Coopmans (2006) argue, the sharing of raw data might not be fully realised and hindered by practices that are not in line with the idealistic and mostly discarded Mertonian norm of communalism. Until issues of intellectual property rights are worked out, individual scientists and private firms may be reluctant to participate in shared developments. In other words, there is substantial misalignment both in assignment of ownership rights and in how academic credit is granted. Ownership rights in data generated in a collaborative project are difficult to assign, yet the data themselves may have substantial financial value. Likewise, some social science communities and departments do not have a tradition of granting academic credit to tool builders or researchers who share their data widely.
Cross-disciplinary communication and collaboration. A final issue relates to the problems of reaching an accommodation of research agendas where computer scientists and researchers from the user disciplines are collaborating in e-Infrastructure development projects. The problem seems to be that these agendas are difficult to reconcile: the computer scientists wish to push the state of the art in their field, whereas the researchers wish to see progress in delivering solutions (Lawrence, 2006). In the social sciences, models of collaborative basic research and publishing are less developed and there is little history of academic credit
M4 Final Report
15
accruing to developers of collaborative tools and disseminators of data; and compared to other sciences, there are no established protocols for allocating credit among, e.g., researchers in the social sciences and tool developers (perhaps from other disciplines) (Burton & Lane, 2005).
AVROSS
16
3. Stock-taking of e-Infrastructures in the social sciences and humanities
The work in this chapter responds to the first set of requirements from the tender specifications, namely:
1. To provide a stock-taking of e-social science initiatives in four fields in the social sciences and humanities in Europe and beyond
2. To provide a selected list of initiatives that support virtual research organisations and services for researchers as well as training opportunities for (post graduate) students in the social sciences and humanities
3. To produce a classification scheme for these initiatives
The approach taken by the team was to contact the ‘early adopters’ of e-Infrastructure in the social sciences and humanities. We administered an email survey (reproduced in the appendix) which asked these key informants to provide their insights with respect to these three key issues.
In what follows, we begin by describing the empirical approach. This is followed by a description of the characteristics of the sample and of the types of projects that are underway. We then describe the barriers and catalysts to e-Infrastructure adoption as identified by respondents to the survey, and their report on the lessons learned. The list of initiatives is provided separately.
3.1 Explanation of the empirical approach The team determined that the best way to do a stock-taking of the emerging field of e-Infrastructure was to directly survey the e-Infrastructure community. A major challenge with developing an empirical approach was determining the appropriate unit of analysis. One methodology would have used the research organization as the unit of analysis. This would involve identifying the major research institutions in Europe, UK, US, Oceania and Asia, identifying the key informants in each social science department, and surveying them. Although this approach had the advantage of potentially having a clearly defined frame, it was dismissed as impractical for a number of reasons. First, there is no list of major institutions in Europe and Asia. Second, there is no list of social science departments for each discipline, and hence identifying the key informant would be impossible. Finally, the time frame for the study precluded such a time and resource intensive approach.
The second methodology was to use the individual researcher as the unit of analysis. This had the disadvantage of the lack of a clearly defined population frame from which to draw a sample of key informants. This challenge is mitigated, however, by the fact that the very nature of the e-Infrastructure community requires that researchers be visible in some way – by attending conferences, publishing research, or having a well-known website. The second disadvantage is that multiple researchers could come from the same institution or project, which might mean that the outcomes of one heavily staffed project might disproportionately influence the results. There are several factors mitigating this disadvantage as well. First, since the very nature of the community is collaborative, multiple researchers work on multiple projects, and it is likely to be structurally impossible to create a one respondent/one project dichotomy. Second, since heavily staffed projects are likely to be the ones in which major investments have been made, it makes sense to have a greater weight on the experiences of such projects.
The second major challenge with developing the empirical approach was whether to survey a handful of key leaders in the field, or whether to cast a very wide net. As a result of much discussion, the team decided to go with a broad-ranging approach: namely contacting everyone who could be identified as even having
M4 Final Report
17
been tangentially involved with some aspect of e-Infrastructure. The basis for this decision was the focus of the study, which was to generate a stock-taking of different aspects of e-Infrastructure, rather than a scientific analysis of technology adoption. As a result, generating the maximum number of responses was judged to be much more important than maximizing response rates.
With this in mind, the team developed an initial list of email addresses from the following sources:
• A list of participants in NCeSS nodes and small grants as well as ESRC pilot demonstrator projects
• A list of participants in e-social science events, such as workshops and conferences at NCeSS, and recipients of NCeSS’ monthly newsletter
• A list of participants in the US National Science Foundations/SBE workshops as well as cyberinfrastructure awards made by NSF
• The participants in ESFR roadmap social sciences and humanities working group
• Internet searches on programme, project and conference pages
A total sample of more than 1900 mail addresses in 45 countries and 5 institutional TLD (.edu, .com, .org, .net, .gov) was obtained in the process and addressed in the survey.
The survey was developed by the team and had five main sections. The first section, Section A, gathered background information on the respondent, the respondent’s organization, and the respondent’s experience with e-Infrastructure. The second section, Section B, gathered additional information on the respondent’s current or most recent e-Infrastructure project. The third section, Section C, provided more background about the funding and results of the respondent’s e-Infrastructure project(s). The final two sections, D and E, asked the respondent to identify potential catalysts and barriers to the development and implementation of e-Infrastructure projects, as well as further e-Infrastructure projects and people which could provide interesting information for the study.
The draft questionnaire was first circulated within the team, then tested on a number of other researchers, including staff at the Oxford Internet Institute, NSF, and the European Commission. Their input was used to further refine the questionnaire. The initial email (reproduced in the appendix) was sent to the potential respondents on 20th February, with a reminder on 8th March, 2007. More than 560 responses were returned for a response rate of 27.6%. Of these responses 448 (23.4%) were valid and included in the subsequent analyses. The low response rate is an expected outcome of the sampling strategy described above: corroborating this view is the fact that many of the respondents who received the email sent responses back saying that they felt that they were out of scope for the survey. The distribution of the responses and the total sample can be seen in Table 3.1.8 Clearly, in the sample as well as among the responses the UK and the US (most of the responses from the TLDs .edu, .com, .org, and .gov) are the most important countries, each contributing about one third of the responses. Another country with notable share is Germany, other countries are only in the range of 0-2%.
8 Several countries with less than three responses (Belgium, Denmark, Japan, Philippines,
Czech Republic, Israel, India, Kyrgyzstan, Lebanon, Lithuania, Mexico, Poland, Russia) and countries with no response were excluded from this table.
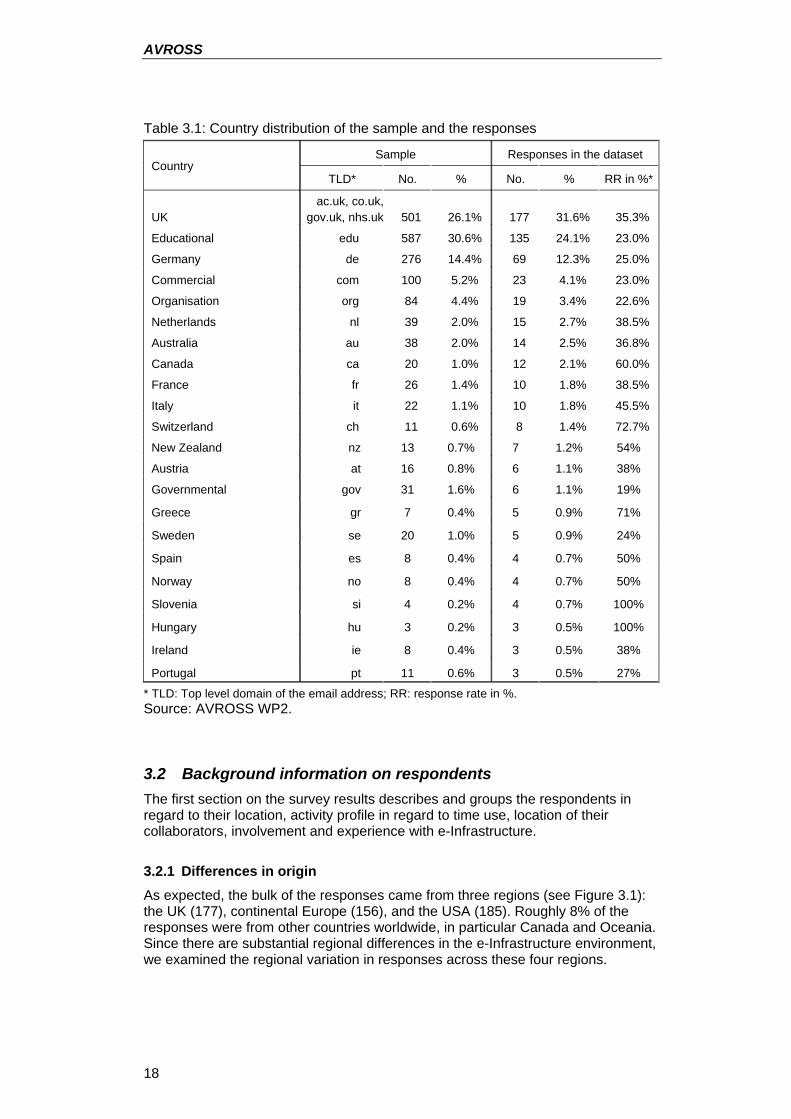
AVROSS
18
Table 3.1: Country distribution of the sample and the responses
Sample Responses in the dataset Country
TLD* No. % No. % RR in %*
UK ac.uk, co.uk,
gov.uk, nhs.uk 501 26.1% 177 31.6% 35.3%
Educational edu 587 30.6% 135 24.1% 23.0%
Germany de 276 14.4% 69 12.3% 25.0%
Commercial com 100 5.2% 23 4.1% 23.0%
Organisation org 84 4.4% 19 3.4% 22.6%
Netherlands nl 39 2.0% 15 2.7% 38.5%
Australia au 38 2.0% 14 2.5% 36.8%
Canada ca 20 1.0% 12 2.1% 60.0%
France fr 26 1.4% 10 1.8% 38.5%
Italy it 22 1.1% 10 1.8% 45.5%
Switzerland ch 11 0.6% 8 1.4% 72.7%
New Zealand nz 13 0.7% 7 1.2% 54%
Austria at 16 0.8% 6 1.1% 38%
Governmental gov 31 1.6% 6 1.1% 19%
Greece gr 7 0.4% 5 0.9% 71%
Sweden se 20 1.0% 5 0.9% 24%
Spain es 8 0.4% 4 0.7% 50%
Norway no 8 0.4% 4 0.7% 50%
Slovenia si 4 0.2% 4 0.7% 100%
Hungary hu 3 0.2% 3 0.5% 100%
Ireland ie 8 0.4% 3 0.5% 38%
Portugal pt 11 0.6% 3 0.5% 27%
* TLD: Top level domain of the email address; RR: response rate in %. Source: AVROSS WP2.
3.2 Background information on respondents The first section on the survey results describes and groups the respondents in regard to their location, activity profile in regard to time use, location of their collaborators, involvement and experience with e-Infrastructure.
3.2.1 Differences in origin As expected, the bulk of the responses came from three regions (see Figure 3.1): the UK (177), continental Europe (156), and the USA (185). Roughly 8% of the responses were from other countries worldwide, in particular Canada and Oceania. Since there are substantial regional differences in the e-Infrastructure environment, we examined the regional variation in responses across these four regions.
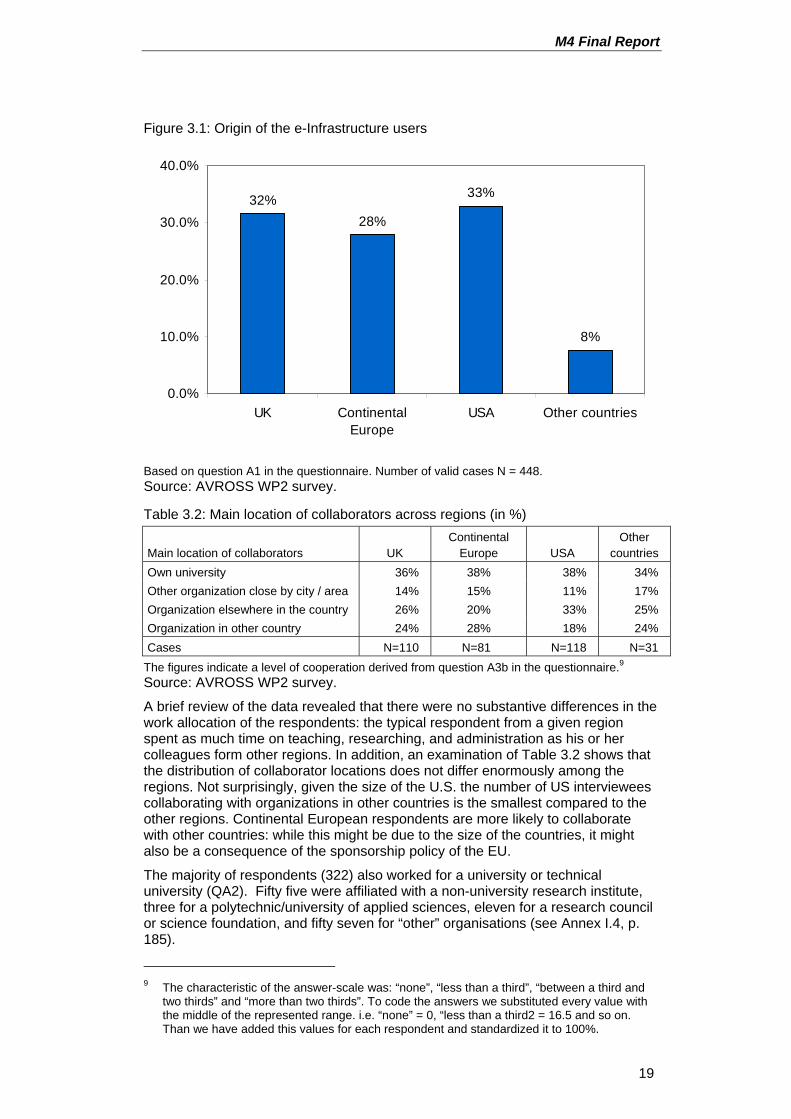
M4 Final Report
19
Figure 3.1: Origin of the e-Infrastructure users
32%28%
33%
8%
0.0%
10.0%
20.0%
30.0%
40.0%
UK ContinentalEurope
USA Other countries
Based on question A1 in the questionnaire. Number of valid cases N = 448. Source: AVROSS WP2 survey.
Table 3.2: Main location of collaborators across regions (in %)
Main location of collaborators UK Continental
Europe USA Other
countries Own university 36% 38% 38% 34% Other organization close by city / area 14% 15% 11% 17% Organization elsewhere in the country 26% 20% 33% 25% Organization in other country 24% 28% 18% 24% Cases N=110 N=81 N=118 N=31
The figures indicate a level of cooperation derived from question A3b in the questionnaire.9 Source: AVROSS WP2 survey.
A brief review of the data revealed that there were no substantive differences in the work allocation of the respondents: the typical respondent from a given region spent as much time on teaching, researching, and administration as his or her colleagues form other regions. In addition, an examination of Table 3.2 shows that the distribution of collaborator locations does not differ enormously among the regions. Not surprisingly, given the size of the U.S. the number of US interviewees collaborating with organizations in other countries is the smallest compared to the other regions. Continental European respondents are more likely to collaborate with other countries: while this might be due to the size of the countries, it might also be a consequence of the sponsorship policy of the EU.
The majority of respondents (322) also worked for a university or technical university (QA2). Fifty five were affiliated with a non-university research institute, three for a polytechnic/university of applied sciences, eleven for a research council or science foundation, and fifty seven for “other” organisations (see Annex I.4, p. 185).
9 The characteristic of the answer-scale was: “none”, “less than a third”, “between a third and
two thirds” and “more than two thirds”. To code the answers we substituted every value with the middle of the represented range. i.e. “none” = 0, “less than a third2 = 16.5 and so on. Than we have added this values for each respondent and standardized it to 100%.
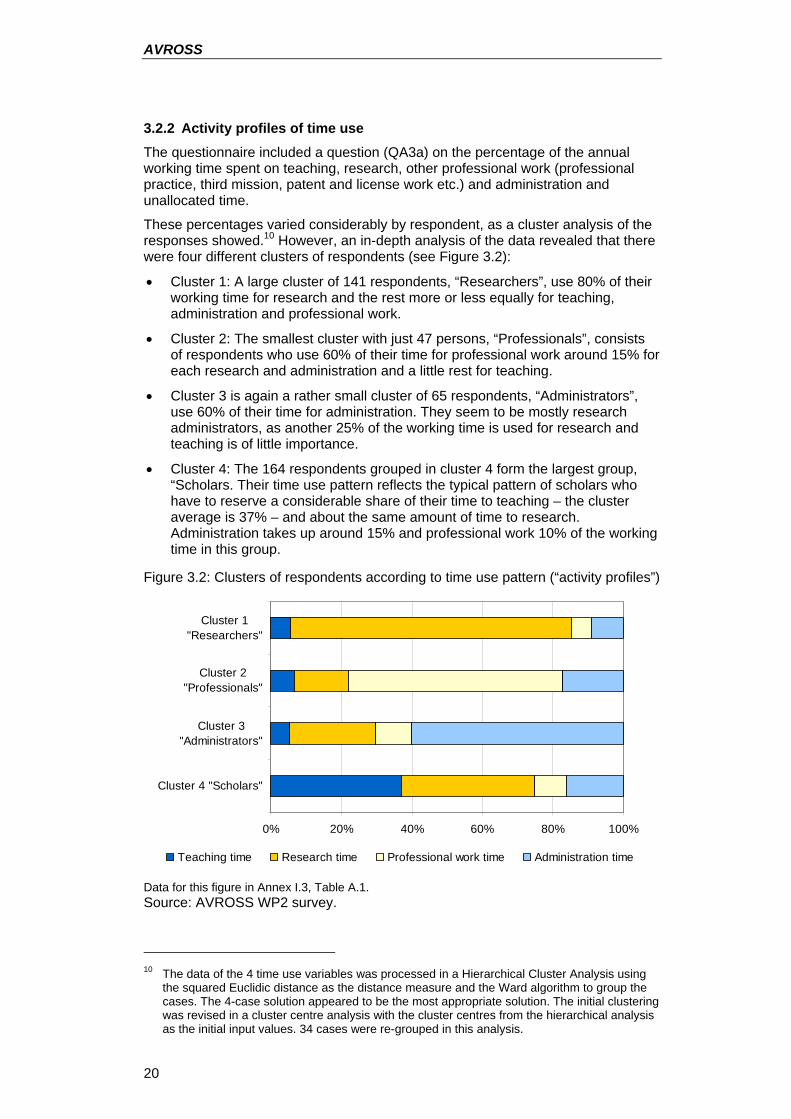
AVROSS
20
3.2.2 Activity profiles of time use The questionnaire included a question (QA3a) on the percentage of the annual working time spent on teaching, research, other professional work (professional practice, third mission, patent and license work etc.) and administration and unallocated time.
These percentages varied considerably by respondent, as a cluster analysis of the responses showed.10 However, an in-depth analysis of the data revealed that there were four different clusters of respondents (see Figure 3.2):
• Cluster 1: A large cluster of 141 respondents, “Researchers”, use 80% of their working time for research and the rest more or less equally for teaching, administration and professional work.
• Cluster 2: The smallest cluster with just 47 persons, “Professionals”, consists of respondents who use 60% of their time for professional work around 15% for each research and administration and a little rest for teaching.
• Cluster 3 is again a rather small cluster of 65 respondents, “Administrators”, use 60% of their time for administration. They seem to be mostly research administrators, as another 25% of the working time is used for research and teaching is of little importance.
• Cluster 4: The 164 respondents grouped in cluster 4 form the largest group, “Scholars. Their time use pattern reflects the typical pattern of scholars who have to reserve a considerable share of their time to teaching – the cluster average is 37% – and about the same amount of time to research. Administration takes up around 15% and professional work 10% of the working time in this group.
Figure 3.2: Clusters of respondents according to time use pattern (“activity profiles”)
0% 20% 40% 60% 80% 100%
Cluster 1"Researchers"
Cluster 2"Professionals"
Cluster 3"Administrators"
Cluster 4 "Scholars"
Teaching time Research time Professional work time Administration time
Data for this figure in Annex I.3, Table A.1. Source: AVROSS WP2 survey.
10 The data of the 4 time use variables was processed in a Hierarchical Cluster Analysis using
the squared Euclidic distance as the distance measure and the Ward algorithm to group the cases. The 4-case solution appeared to be the most appropriate solution. The initial clustering was revised in a cluster centre analysis with the cluster centres from the hierarchical analysis as the initial input values. 34 cases were re-grouped in this analysis.
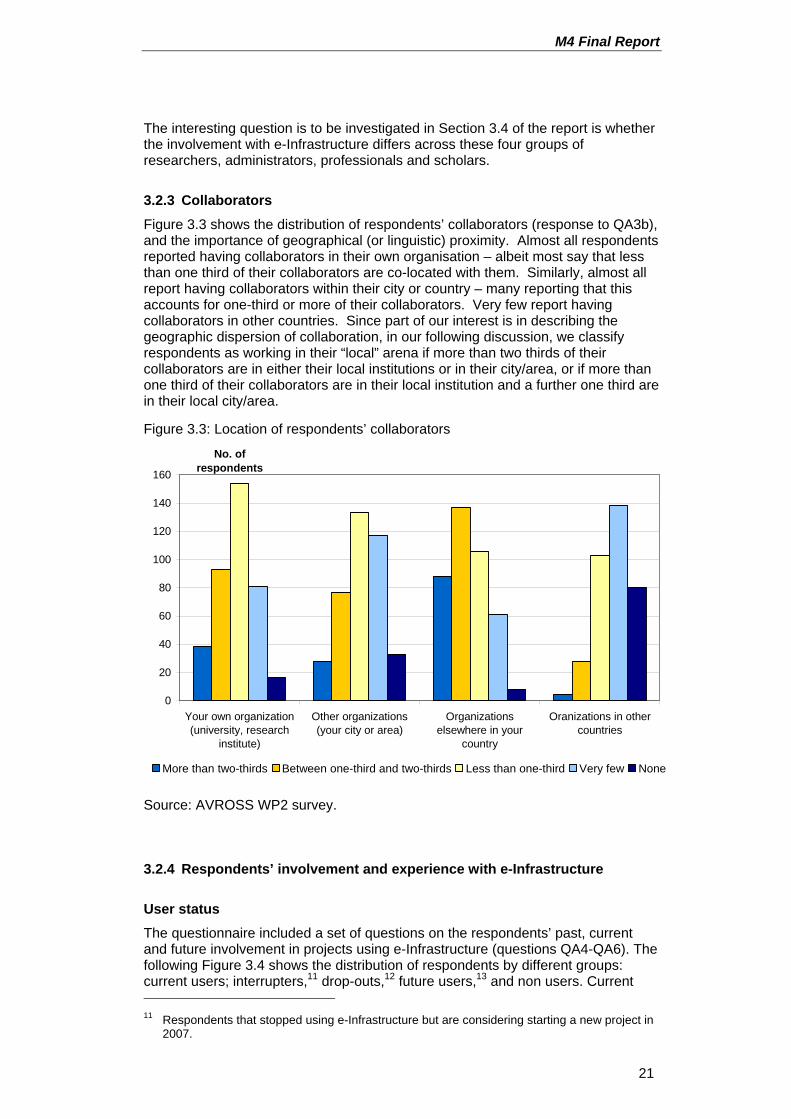
M4 Final Report
21
The interesting question is to be investigated in Section 3.4 of the report is whether the involvement with e-Infrastructure differs across these four groups of researchers, administrators, professionals and scholars.
3.2.3 Collaborators Figure 3.3 shows the distribution of respondents’ collaborators (response to QA3b), and the importance of geographical (or linguistic) proximity. Almost all respondents reported having collaborators in their own organisation – albeit most say that less than one third of their collaborators are co-located with them. Similarly, almost all report having collaborators within their city or country – many reporting that this accounts for one-third or more of their collaborators. Very few report having collaborators in other countries. Since part of our interest is in describing the geographic dispersion of collaboration, in our following discussion, we classify respondents as working in their “local” arena if more than two thirds of their collaborators are in either their local institutions or in their city/area, or if more than one third of their collaborators are in their local institution and a further one third are in their local city/area.
Figure 3.3: Location of respondents’ collaborators
0
20
40
60
80
100
120
140
160
Your own organization(university, research
institute)
Other organizations(your city or area)
Organizationselsewhere in your
country
Oranizations in othercountries
No. of respondents
More than two-thirds Between one-third and two-thirds Less than one-third Very few None
Source: AVROSS WP2 survey.
3.2.4 Respondents’ involvement and experience with e-Infrastructure
User status The questionnaire included a set of questions on the respondents’ past, current and future involvement in projects using e-Infrastructure (questions QA4-QA6). The following Figure 3.4 shows the distribution of respondents by different groups: current users; interrupters,11 drop-outs,12 future users,13 and non users. Current 11 Respondents that stopped using e-Infrastructure but are considering starting a new project in
2007.
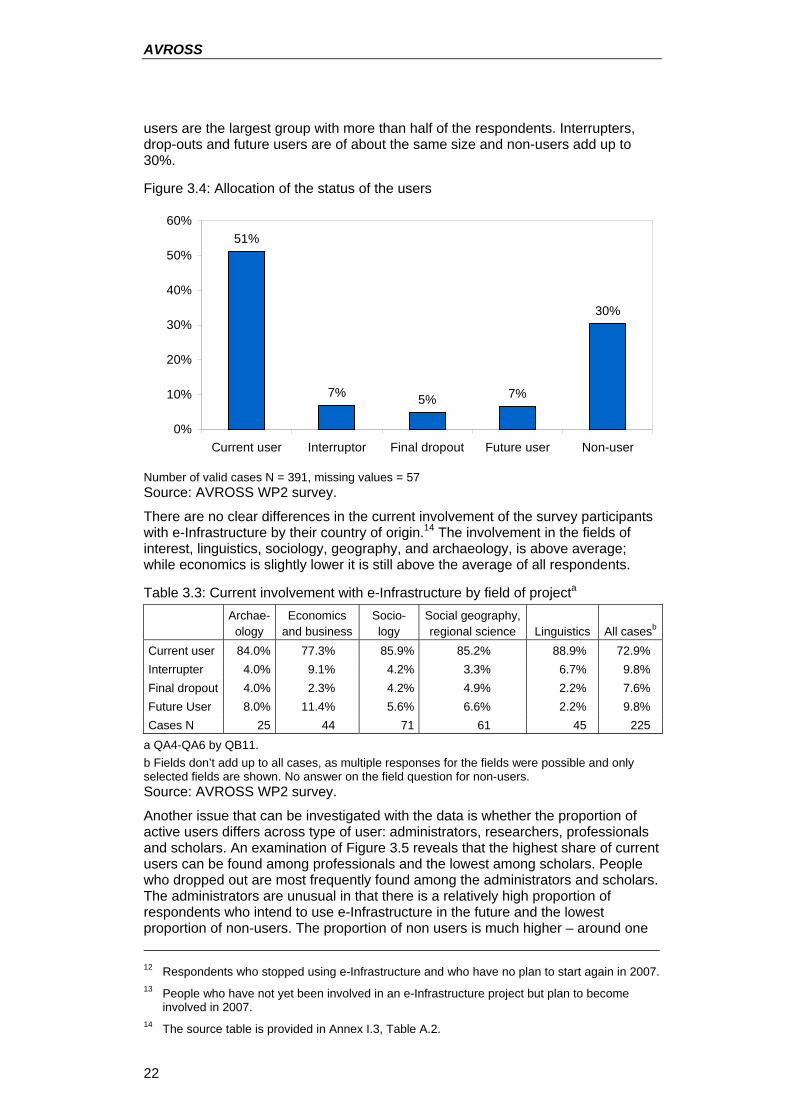
AVROSS
22
users are the largest group with more than half of the respondents. Interrupters, drop-outs and future users are of about the same size and non-users add up to 30%.
Figure 3.4: Allocation of the status of the users
51%
7% 5% 7%
30%
0%
10%
20%
30%
40%
50%
60%
Current user Interruptor Final dropout Future user Non-user
Number of valid cases N = 391, missing values = 57 Source: AVROSS WP2 survey.
There are no clear differences in the current involvement of the survey participants with e-Infrastructure by their country of origin.14 The involvement in the fields of interest, linguistics, sociology, geography, and archaeology, is above average; while economics is slightly lower it is still above the average of all respondents.
Table 3.3: Current involvement with e-Infrastructure by field of projecta
Archae-ology
Economics and business
Socio-logy
Social geography, regional science Linguistics All casesb
Current user 84.0% 77.3% 85.9% 85.2% 88.9% 72.9% Interrupter 4.0% 9.1% 4.2% 3.3% 6.7% 9.8% Final dropout 4.0% 2.3% 4.2% 4.9% 2.2% 7.6% Future User 8.0% 11.4% 5.6% 6.6% 2.2% 9.8% Cases N 25 44 71 61 45 225
a QA4-QA6 by QB11. b Fields don’t add up to all cases, as multiple responses for the fields were possible and only selected fields are shown. No answer on the field question for non-users. Source: AVROSS WP2 survey.
Another issue that can be investigated with the data is whether the proportion of active users differs across type of user: administrators, researchers, professionals and scholars. An examination of Figure 3.5 reveals that the highest share of current users can be found among professionals and the lowest among scholars. People who dropped out are most frequently found among the administrators and scholars. The administrators are unusual in that there is a relatively high proportion of respondents who intend to use e-Infrastructure in the future and the lowest proportion of non-users. The proportion of non users is much higher – around one 12 Respondents who stopped using e-Infrastructure and who have no plan to start again in 2007. 13 People who have not yet been involved in an e-Infrastructure project but plan to become
involved in 2007. 14 The source table is provided in Annex I.3, Table A.2.
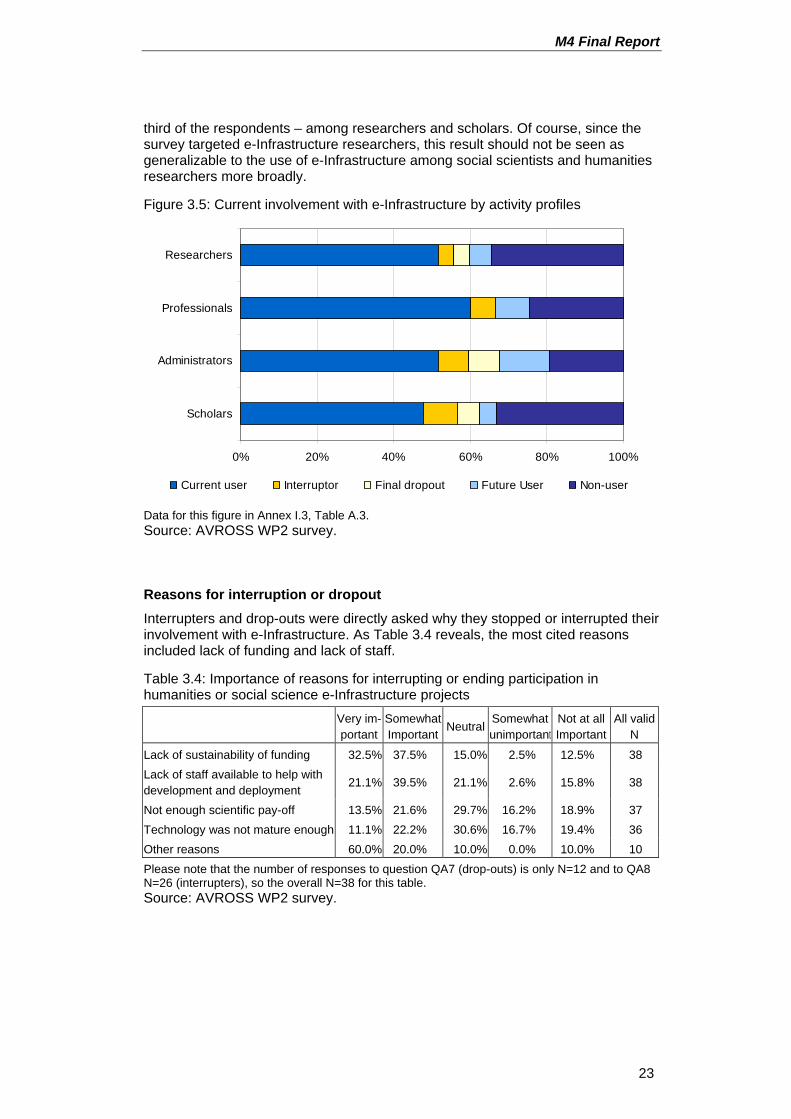
M4 Final Report
23
third of the respondents – among researchers and scholars. Of course, since the survey targeted e-Infrastructure researchers, this result should not be seen as generalizable to the use of e-Infrastructure among social scientists and humanities researchers more broadly.
Figure 3.5: Current involvement with e-Infrastructure by activity profiles
0% 20% 40% 60% 80% 100%
Researchers
Professionals
Administrators
Scholars
Current user Interruptor Final dropout Future User Non-user
Data for this figure in Annex I.3, Table A.3. Source: AVROSS WP2 survey.
Reasons for interruption or dropout Interrupters and drop-outs were directly asked why they stopped or interrupted their involvement with e-Infrastructure. As Table 3.4 reveals, the most cited reasons included lack of funding and lack of staff.
Table 3.4: Importance of reasons for interrupting or ending participation in humanities or social science e-Infrastructure projects
Very im-portant
Somewhat Important
NeutralSomewhat unimportant
Not at all Important
All valid N
Lack of sustainability of funding 32.5% 37.5% 15.0% 2.5% 12.5% 38 Lack of staff available to help with development and deployment
21.1% 39.5% 21.1% 2.6% 15.8% 38
Not enough scientific pay-off 13.5% 21.6% 29.7% 16.2% 18.9% 37 Technology was not mature enough 11.1% 22.2% 30.6% 16.7% 19.4% 36 Other reasons 60.0% 20.0% 10.0% 0.0% 10.0% 10 Please note that the number of responses to question QA7 (drop-outs) is only N=12 and to QA8 N=26 (interrupters), so the overall N=38 for this table. Source: AVROSS WP2 survey.
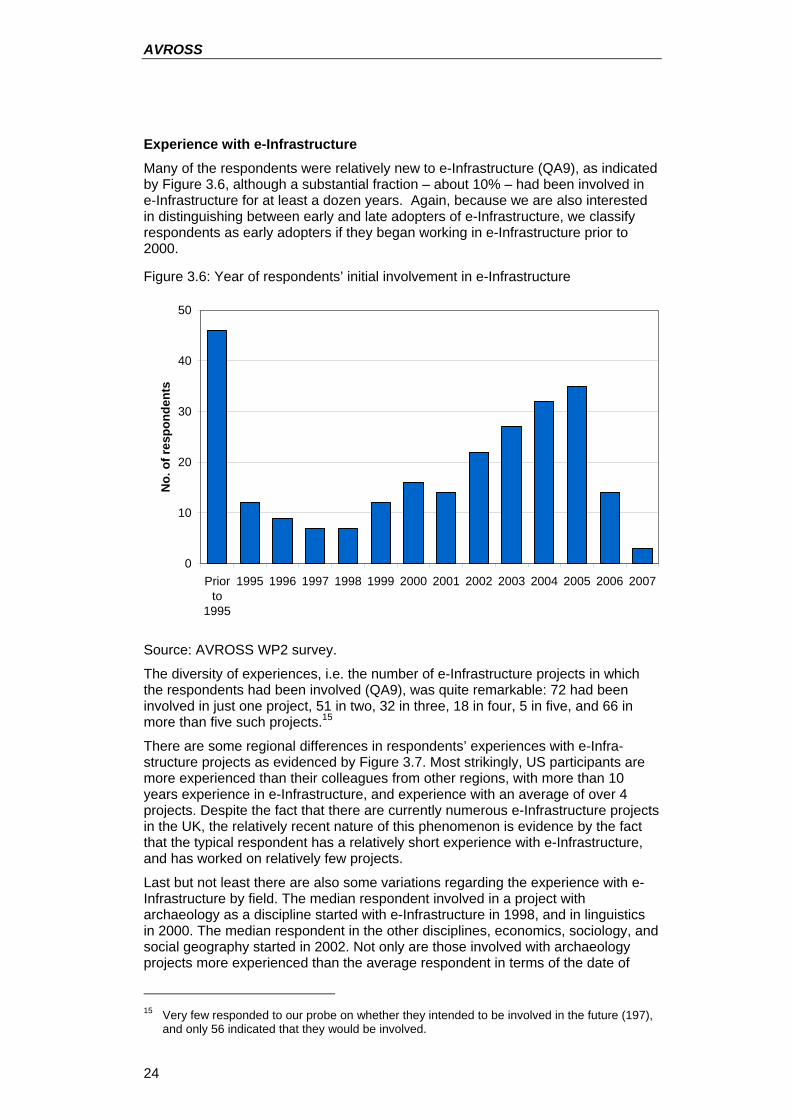
AVROSS
24
Experience with e-Infrastructure Many of the respondents were relatively new to e-Infrastructure (QA9), as indicated by Figure 3.6, although a substantial fraction – about 10% – had been involved in e-Infrastructure for at least a dozen years. Again, because we are also interested in distinguishing between early and late adopters of e-Infrastructure, we classify respondents as early adopters if they began working in e-Infrastructure prior to 2000.
Figure 3.6: Year of respondents’ initial involvement in e-Infrastructure
0
10
20
30
40
50
Priorto
1995
1995 1996 1997 1998 1999 2000 2001 2002 2003 2004 2005 2006 2007
No.
of r
espo
nden
ts
Source: AVROSS WP2 survey.
The diversity of experiences, i.e. the number of e-Infrastructure projects in which the respondents had been involved (QA9), was quite remarkable: 72 had been involved in just one project, 51 in two, 32 in three, 18 in four, 5 in five, and 66 in more than five such projects.15
There are some regional differences in respondents’ experiences with e-Infra-structure projects as evidenced by Figure 3.7. Most strikingly, US participants are more experienced than their colleagues from other regions, with more than 10 years experience in e-Infrastructure, and experience with an average of over 4 projects. Despite the fact that there are currently numerous e-Infrastructure projects in the UK, the relatively recent nature of this phenomenon is evidence by the fact that the typical respondent has a relatively short experience with e-Infrastructure, and has worked on relatively few projects.
Last but not least there are also some variations regarding the experience with e-Infrastructure by field. The median respondent involved in a project with archaeology as a discipline started with e-Infrastructure in 1998, and in linguistics in 2000. The median respondent in the other disciplines, economics, sociology, and social geography started in 2002. Not only are those involved with archaeology projects more experienced than the average respondent in terms of the date of
15 Very few responded to our probe on whether they intended to be involved in the future (197),
and only 56 indicated that they would be involved.
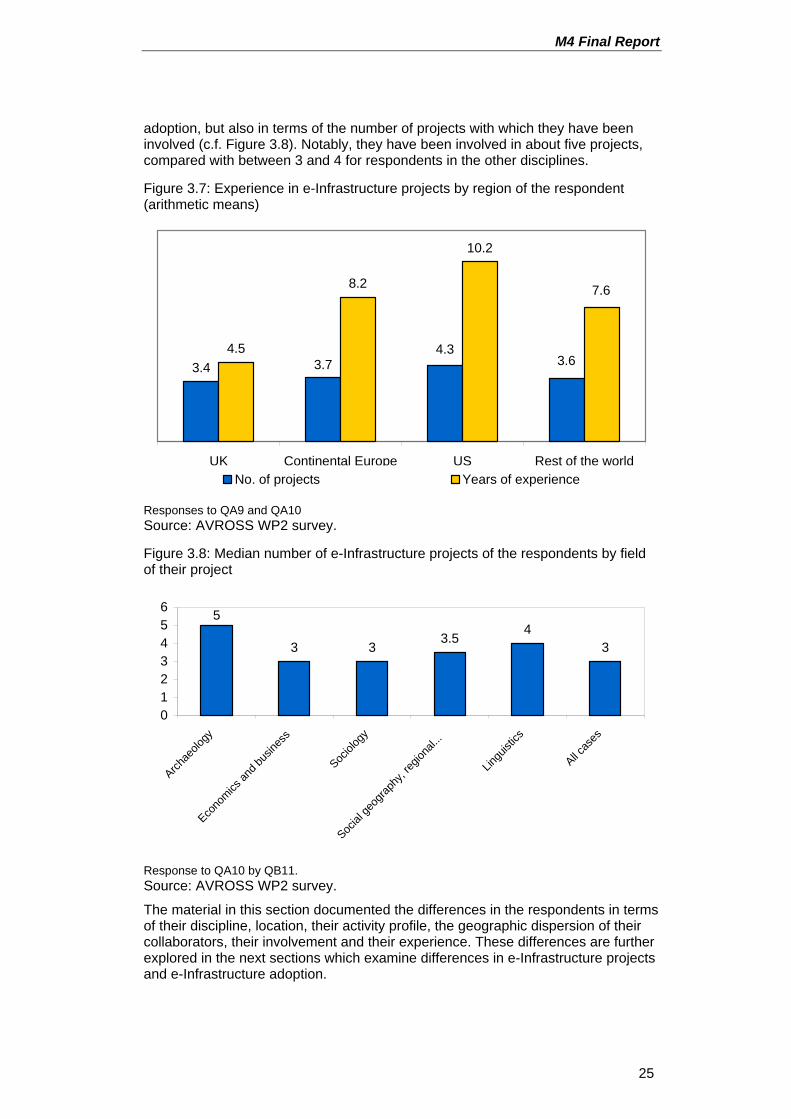
M4 Final Report
25
adoption, but also in terms of the number of projects with which they have been involved (c.f. Figure 3.8). Notably, they have been involved in about five projects, compared with between 3 and 4 for respondents in the other disciplines.
Figure 3.7: Experience in e-Infrastructure projects by region of the respondent (arithmetic means)
3.44.5
8.2
10.2
3.64.3
3.7
7.6
UK Continental Europe US Rest of the worldNo. of projects Years of experience
Responses to QA9 and QA10 Source: AVROSS WP2 survey.
Figure 3.8: Median number of e-Infrastructure projects of the respondents by field of their project
3 33.5
43
5
0123456
Archae
ology
Econo
mics an
d bus
iness
Sociol
ogy
Social
geog
raphy
, regio
nal...
Lingu
istics
All cas
es
Response to QA10 by QB11. Source: AVROSS WP2 survey.
The material in this section documented the differences in the respondents in terms of their discipline, location, their activity profile, the geographic dispersion of their collaborators, their involvement and their experience. These differences are further explored in the next sections which examine differences in e-Infrastructure projects and e-Infrastructure adoption.
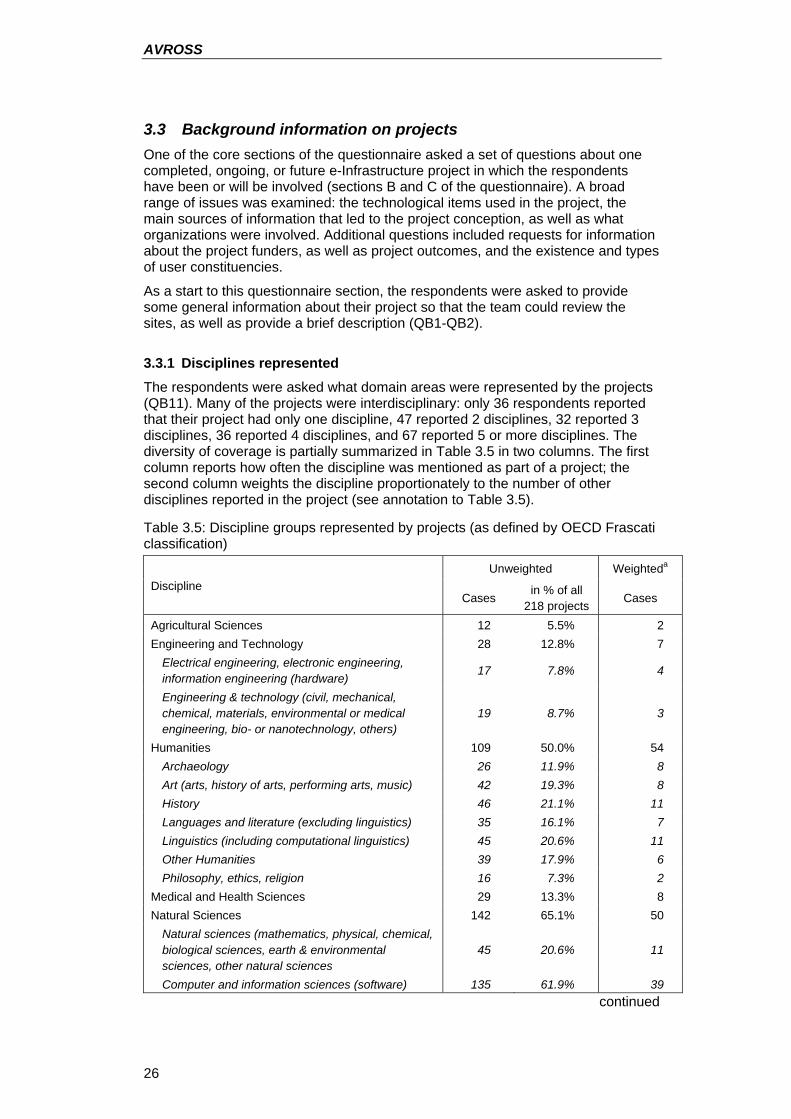
AVROSS
26
3.3 Background information on projects One of the core sections of the questionnaire asked a set of questions about one completed, ongoing, or future e-Infrastructure project in which the respondents have been or will be involved (sections B and C of the questionnaire). A broad range of issues was examined: the technological items used in the project, the main sources of information that led to the project conception, as well as what organizations were involved. Additional questions included requests for information about the project funders, as well as project outcomes, and the existence and types of user constituencies.
As a start to this questionnaire section, the respondents were asked to provide some general information about their project so that the team could review the sites, as well as provide a brief description (QB1-QB2).
3.3.1 Disciplines represented The respondents were asked what domain areas were represented by the projects (QB11). Many of the projects were interdisciplinary: only 36 respondents reported that their project had only one discipline, 47 reported 2 disciplines, 32 reported 3 disciplines, 36 reported 4 disciplines, and 67 reported 5 or more disciplines. The diversity of coverage is partially summarized in Table 3.5 in two columns. The first column reports how often the discipline was mentioned as part of a project; the second column weights the discipline proportionately to the number of other disciplines reported in the project (see annotation to Table 3.5).
Table 3.5: Discipline groups represented by projects (as defined by OECD Frascati classification)
Unweighted Weighteda Discipline
Cases in % of all
218 projects Cases
Agricultural Sciences 12 5.5% 2 Engineering and Technology 28 12.8% 7
Electrical engineering, electronic engineering, information engineering (hardware)
17 7.8% 4
Engineering & technology (civil, mechanical, chemical, materials, environmental or medical engineering, bio- or nanotechnology, others)
19 8.7% 3
Humanities 109 50.0% 54 Archaeology 26 11.9% 8 Art (arts, history of arts, performing arts, music) 42 19.3% 8 History 46 21.1% 11 Languages and literature (excluding linguistics) 35 16.1% 7 Linguistics (including computational linguistics) 45 20.6% 11 Other Humanities 39 17.9% 6 Philosophy, ethics, religion 16 7.3% 2
Medical and Health Sciences 29 13.3% 8 Natural Sciences 142 65.1% 50
Natural sciences (mathematics, physical, chemical, biological sciences, earth & environmental sciences, other natural sciences
45 20.6% 11
Computer and information sciences (software) 135 61.9% 39 continued
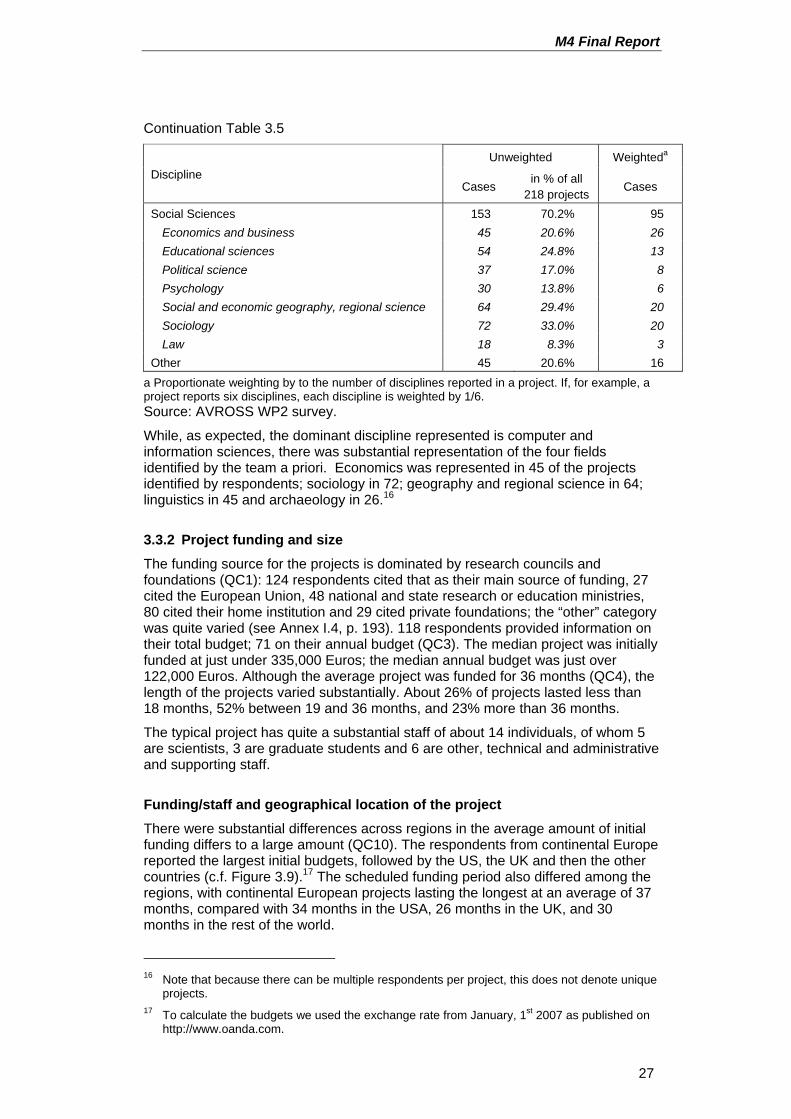
M4 Final Report
27
Continuation Table 3.5
Unweighted Weighteda Discipline
Cases in % of all
218 projects Cases
Social Sciences 153 70.2% 95 Economics and business 45 20.6% 26 Educational sciences 54 24.8% 13 Political science 37 17.0% 8 Psychology 30 13.8% 6 Social and economic geography, regional science 64 29.4% 20 Sociology 72 33.0% 20 Law 18 8.3% 3
Other 45 20.6% 16 a Proportionate weighting by to the number of disciplines reported in a project. If, for example, a project reports six disciplines, each discipline is weighted by 1/6. Source: AVROSS WP2 survey.
While, as expected, the dominant discipline represented is computer and information sciences, there was substantial representation of the four fields identified by the team a priori. Economics was represented in 45 of the projects identified by respondents; sociology in 72; geography and regional science in 64; linguistics in 45 and archaeology in 26.16
3.3.2 Project funding and size The funding source for the projects is dominated by research councils and foundations (QC1): 124 respondents cited that as their main source of funding, 27 cited the European Union, 48 national and state research or education ministries, 80 cited their home institution and 29 cited private foundations; the “other” category was quite varied (see Annex I.4, p. 193). 118 respondents provided information on their total budget; 71 on their annual budget (QC3). The median project was initially funded at just under 335,000 Euros; the median annual budget was just over 122,000 Euros. Although the average project was funded for 36 months (QC4), the length of the projects varied substantially. About 26% of projects lasted less than 18 months, 52% between 19 and 36 months, and 23% more than 36 months.
The typical project has quite a substantial staff of about 14 individuals, of whom 5 are scientists, 3 are graduate students and 6 are other, technical and administrative and supporting staff.
Funding/staff and geographical location of the project There were substantial differences across regions in the average amount of initial funding differs to a large amount (QC10). The respondents from continental Europe reported the largest initial budgets, followed by the US, the UK and then the other countries (c.f. Figure 3.9).17 The scheduled funding period also differed among the regions, with continental European projects lasting the longest at an average of 37 months, compared with 34 months in the USA, 26 months in the UK, and 30 months in the rest of the world.
16 Note that because there can be multiple respondents per project, this does not denote unique
projects. 17 To calculate the budgets we used the exchange rate from January, 1st 2007 as published on
http://www.oanda.com.
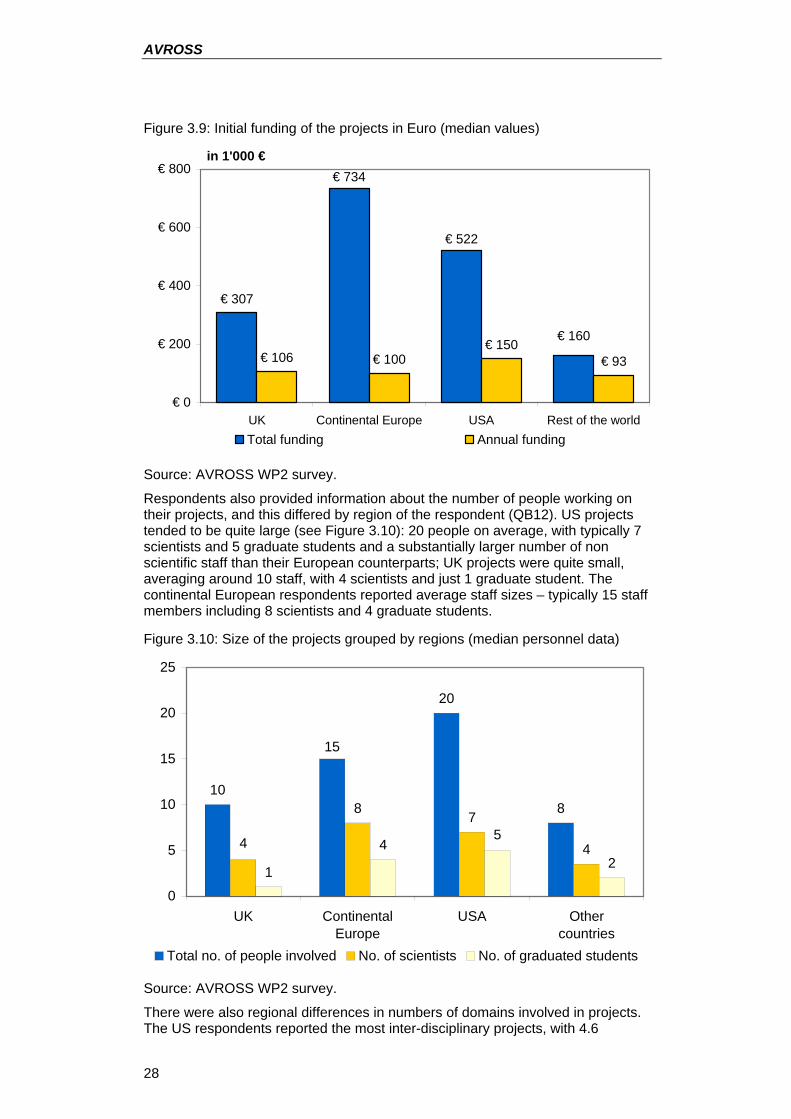
AVROSS
28
Figure 3.9: Initial funding of the projects in Euro (median values)
€ 307
€ 106 € 100€ 150
€ 93
€ 160
€ 522
€ 734
€ 0
€ 200
€ 400
€ 600
€ 800
UK Continental Europe USA Rest of the world
in 1'000 €
Total funding Annual funding
Source: AVROSS WP2 survey.
Respondents also provided information about the number of people working on their projects, and this differed by region of the respondent (QB12). US projects tended to be quite large (see Figure 3.10): 20 people on average, with typically 7 scientists and 5 graduate students and a substantially larger number of non scientific staff than their European counterparts; UK projects were quite small, averaging around 10 staff, with 4 scientists and just 1 graduate student. The continental European respondents reported average staff sizes – typically 15 staff members including 8 scientists and 4 graduate students.
Figure 3.10: Size of the projects grouped by regions (median personnel data)
10
20
88 7
41
42
15
4 5
0
5
10
15
20
25
UK ContinentalEurope
USA Othercountries
Total no. of people involved No. of scientists No. of graduated students
Source: AVROSS WP2 survey.
There were also regional differences in numbers of domains involved in projects. The US respondents reported the most inter-disciplinary projects, with 4.6
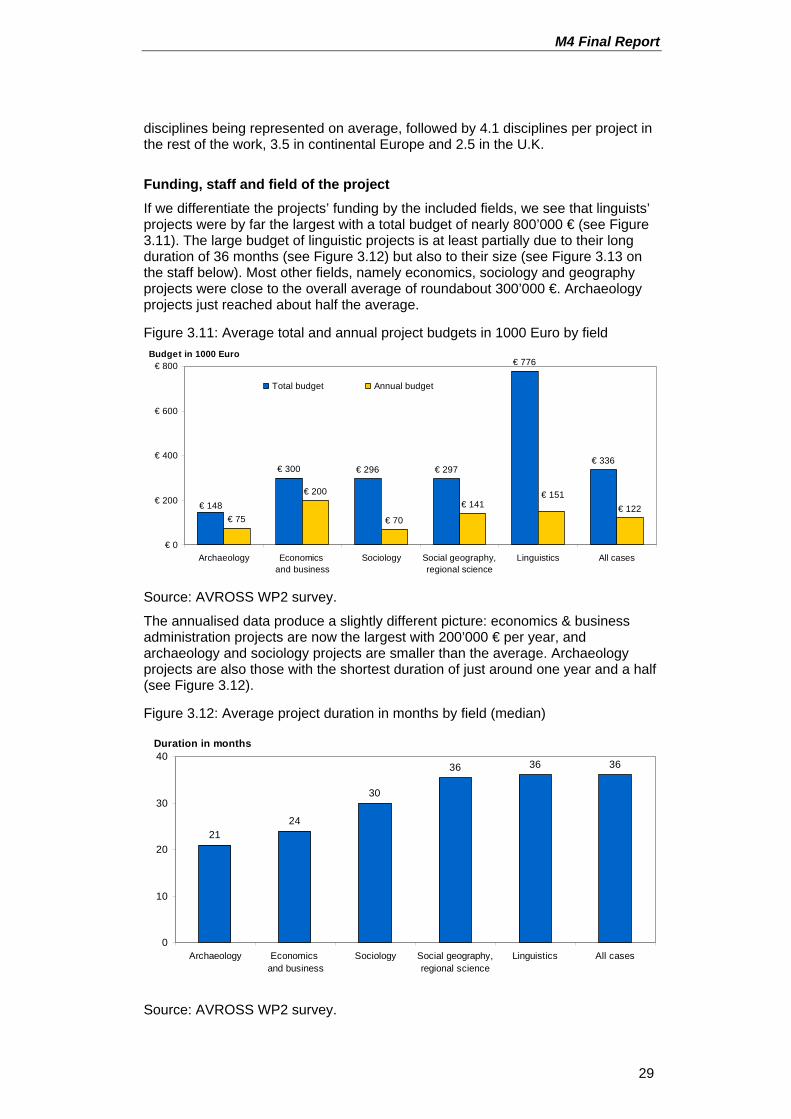
M4 Final Report
29
disciplines being represented on average, followed by 4.1 disciplines per project in the rest of the work, 3.5 in continental Europe and 2.5 in the U.K.
Funding, staff and field of the project If we differentiate the projects’ funding by the included fields, we see that linguists’ projects were by far the largest with a total budget of nearly 800’000 € (see Figure 3.11). The large budget of linguistic projects is at least partially due to their long duration of 36 months (see Figure 3.12) but also to their size (see Figure 3.13 on the staff below). Most other fields, namely economics, sociology and geography projects were close to the overall average of roundabout 300’000 €. Archaeology projects just reached about half the average.
Figure 3.11: Average total and annual project budgets in 1000 Euro by field
€ 300 € 296 € 297
€ 776
€ 336
€ 75
€ 200
€ 70
€ 141 € 122€ 148€ 151
€ 0
€ 200
€ 400
€ 600
€ 800
Archaeology Economics and business
Sociology Social geography,regional science
Linguistics All cases
Total budget Annual budget
Budget in 1000 Euro
Source: AVROSS WP2 survey.
The annualised data produce a slightly different picture: economics & business administration projects are now the largest with 200’000 € per year, and archaeology and sociology projects are smaller than the average. Archaeology projects are also those with the shortest duration of just around one year and a half (see Figure 3.12).
Figure 3.12: Average project duration in months by field (median)
2124
30
36 36 36
0
10
20
30
40
Archaeology Economics and business
Sociology Social geography,regional science
Linguistics All cases
Duration in months
Source: AVROSS WP2 survey.
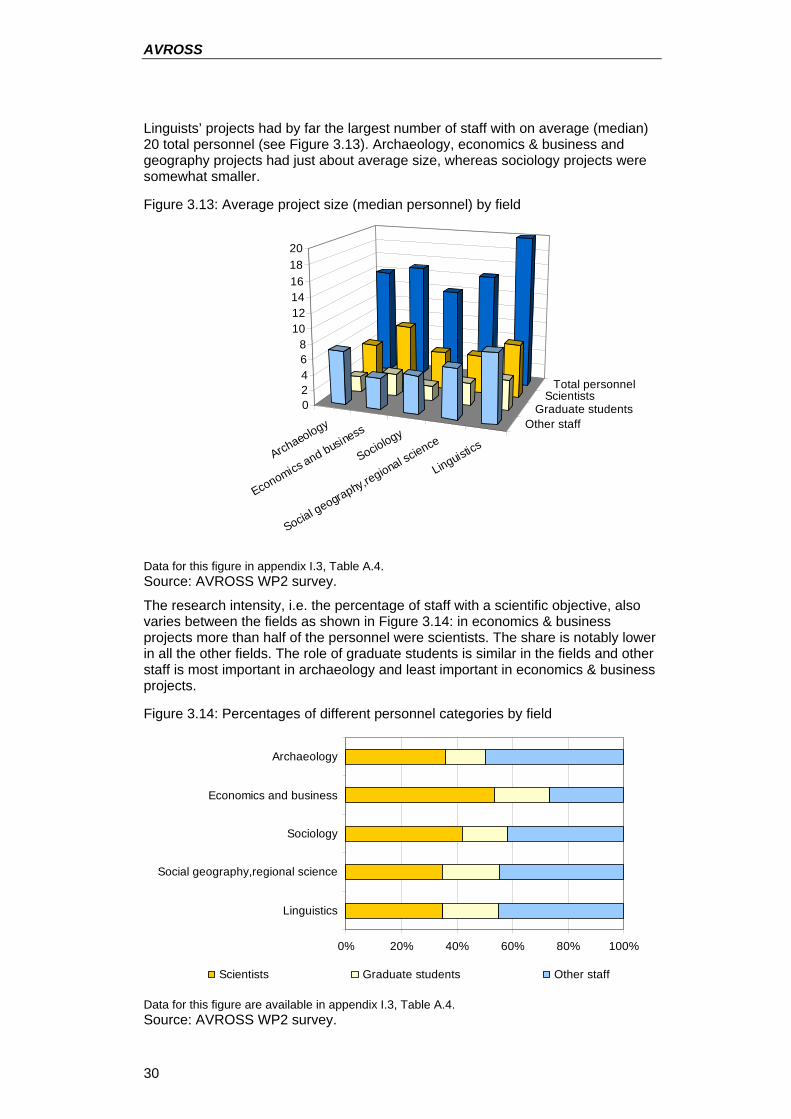
AVROSS
30
Linguists’ projects had by far the largest number of staff with on average (median) 20 total personnel (see Figure 3.13). Archaeology, economics & business and geography projects had just about average size, whereas sociology projects were somewhat smaller.
Figure 3.13: Average project size (median personnel) by field
Archaeology
Economics and business
Sociology
Social geography,regional science
Linguistics
Other staffGraduate students
ScientistsTotal personnel
02468
101214161820
Data for this figure in appendix I.3, Table A.4. Source: AVROSS WP2 survey.
The research intensity, i.e. the percentage of staff with a scientific objective, also varies between the fields as shown in Figure 3.14: in economics & business projects more than half of the personnel were scientists. The share is notably lower in all the other fields. The role of graduate students is similar in the fields and other staff is most important in archaeology and least important in economics & business projects.
Figure 3.14: Percentages of different personnel categories by field
0% 20% 40% 60% 80% 100%
Archaeology
Economics and business
Sociology
Social geography,regional science
Linguistics
Scientists Graduate students Other staff
Data for this figure are available in appendix I.3, Table A.4. Source: AVROSS WP2 survey.
M4 Final Report
31
Staff and activity profile of the respondents It is also interesting to examine how the type of respondent (results from the activity profile analysis, see Section 3.2.2 above) differed by type of project. Not surprisingly, administrators tended to be reporting on the largest projects (see Figure 3.15). The average size of such projects was about 30 people – twice as many as in projects which were described by the other three groups (researchers, professionals, and scholars).
Figure 3.15: Average project size (median personnel) by activity profiles
Researchers
Professionals
Administrators
Scholars
Other staffGraduate students
ScientistsTotal personnel
0
5
10
15
20
25
30
Data for this figure in appendix I.3, Table A.5. Source: AVROSS WP2 survey.
Figure 3.16: Percentages of different personnel categories by activity profiles
0% 20% 40% 60% 80% 100%
Researchers
Professionals
Administrators
Scholars
Scientists Graduate students Other staff
Data for this figure in appendix I.3, Table A.5. Source: AVROSS WP2 survey.
The research intensity in the different projects varies substantially: only one third of the people working on the project were classified as scientists in projects described by “administrator” respondents, whereas “researchers” and “scholars” reported that
AVROSS
32
scientists represented about half of the staff. In the same vein, graduate student involvement was proportionally larger in projects described by scholars than in projects described by researchers, administrators or professionals (see Figure 3.16).
Funding/staff and user status of the respondent Next, we contrasted the size of the projects by the user status, differentiating between current and former e-Infrastructure users. Projects of former users had more non-scientific staff than those of current users (see Figure 3.17). This might indicate that either the e-Infrastructure technology has become easier to use or the responding skills of the users have become better.
Figure 3.17: Average number of people involved in the project by user status of the respondent (median values)
15
12
56
34
0
5
10
15
20
Current users Former users
Total no. of people involved No. of scientists No. of graduated students
Current users N=136, former users N=25. Source: AVROSS WP2 survey.
Projects from former users were also larger in terms of the initial budget, at a median level of €470,000, compared with €373,000 for current users.18 Not surprisingly, larger budgets and larger staff are closely related.
3.3.3 Technological features of the projects
Technological features The respondents were also asked to provide a summary of the features used in their projects, and this summary is provided in Table 3.6. The results are again consistent with both the brief descriptions provided in the responses to QB2 and with the prior expectations of the team, based on their experience with both NSF and NCeSS. The most frequently cited features of the projects included communication and collaboration tools, as well as distributed data, and required high band width. The high performance computing, which is a feature of other sciences, was not as important, nor were the innovative data collection methods.
18 Note, however, that there were only 106 respondents to this question; 93 respondents were
current users and 13 were former users
M4 Final Report
33
Table 3.6: Technological features used in the project N (total 217) Percentage
High performance computing 77 35.5% High performance communication 101 46.5% High bandwidth 133 61.3% Distributed data, data repository 167 77.0% Collaboration tools/systems 173 79.7% Learning environments 84 38.7% Grid-enabled videoconferencing 64 29.5% Virtual/3D environments 34 15.7% Innovative data collection methods 55 25.4% Source: AVROSS WP2 survey.
The most widely used e-Infrastructure components are data repositories and collaboration tools. There is one set of items that was routinely reported as being used together, namely: high performance communication, high band width, data repository and collaboration tools. 52 of the 217 respondents responded that they use all four of them, and an additional 67 use at least three of the items.19
There were some interesting differences in the use of technology by project length. An examination of Table 3.7 suggests that short-term projects are more likely to be associated with distributed data and collaboration tools, but much less likely to use virtual environments, which only appear in one sixth of such projects. Medium-term projects also often deal with distributed data – in nine out of ten cases – and nearly as often with collaboration tools. High-performance computing and communication and high bandwidth are also comparatively more important than in the short-term projects. Last but not least, the long-term projects lasting for five years and more are very likely to use high bandwidth and high-performance communication. Learning environments are also particularly frequent among the longer projects.
Table 3.7: Use of e-Infrastructure components in projects of different length
Short-term projects
(0-18 months)
Medium-term projects
(19-36 months)
Long-term projects
(>36 months)
N In % N In % N In % High performance computing 10 27.0% 31 44.3% 14 46.7% High performance communication 13 38.2% 35 50.7% 23 71.9% High band width 19 50.0% 45 63.4% 23 76.7% Distributed data, data repository 28 75.7% 68 89.5% 24 77.4% Collaboration tools/systems 28 75.7% 69 86.3% 28 82.4% Learning environments 14 40.0% 29 40.8% 15 51.7% Grid-enabled videoconferencing 12 35.3% 24 35.8% 8 27.6% Virtual/3D environments 5 14.7% 12 19.0% 5 17.2% Innovative data collection methods 12 50.0% 27 55.1% 6 33.3% Source: AVROSS WP2 survey.
19 Of course, this may be due to an unclear discrimination between these items. For instance it
is conceivable that some respondents tick high performance communication, high bandwidth and collaboration tools by meaning simply one item.
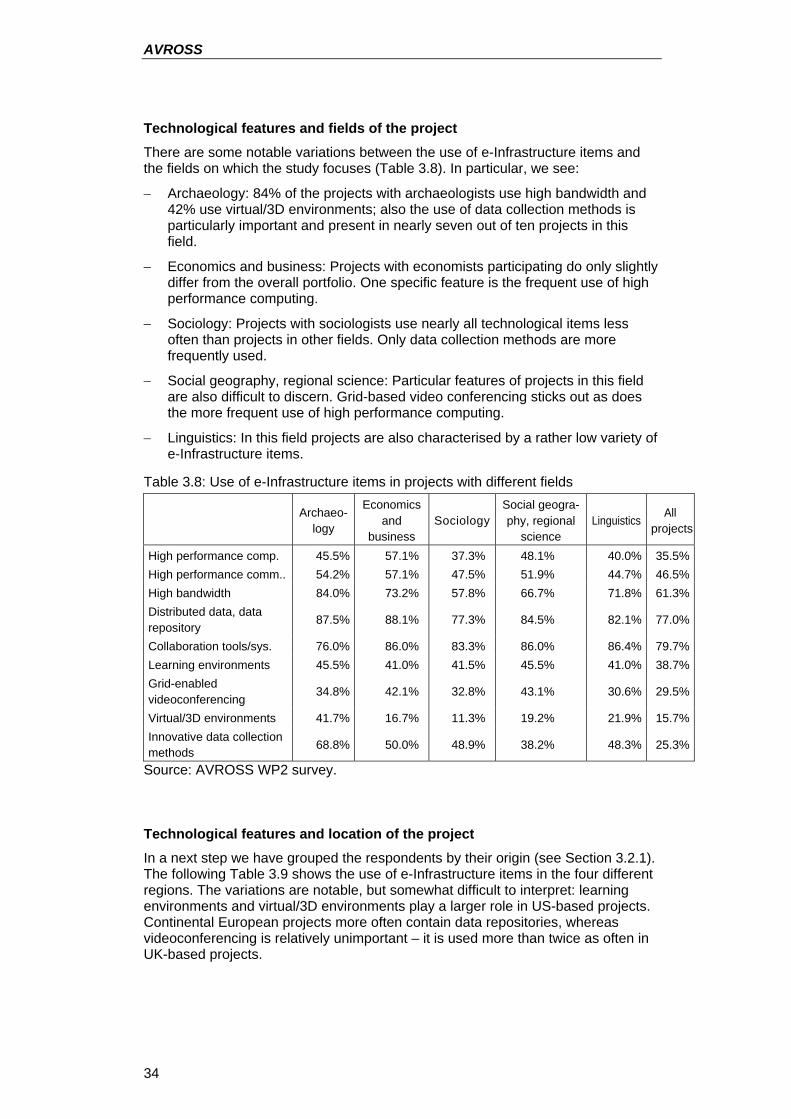
AVROSS
34
Technological features and fields of the project There are some notable variations between the use of e-Infrastructure items and the fields on which the study focuses (Table 3.8). In particular, we see:
− Archaeology: 84% of the projects with archaeologists use high bandwidth and 42% use virtual/3D environments; also the use of data collection methods is particularly important and present in nearly seven out of ten projects in this field.
− Economics and business: Projects with economists participating do only slightly differ from the overall portfolio. One specific feature is the frequent use of high performance computing.
− Sociology: Projects with sociologists use nearly all technological items less often than projects in other fields. Only data collection methods are more frequently used.
− Social geography, regional science: Particular features of projects in this field are also difficult to discern. Grid-based video conferencing sticks out as does the more frequent use of high performance computing.
− Linguistics: In this field projects are also characterised by a rather low variety of e-Infrastructure items.
Table 3.8: Use of e-Infrastructure items in projects with different fields
Archaeo-
logy
Economics and
business Sociology
Social geogra-phy, regional
science Linguistics
All projects
High performance comp. 45.5% 57.1% 37.3% 48.1% 40.0% 35.5%High performance comm.. 54.2% 57.1% 47.5% 51.9% 44.7% 46.5%High bandwidth 84.0% 73.2% 57.8% 66.7% 71.8% 61.3%Distributed data, data repository
87.5% 88.1% 77.3% 84.5% 82.1% 77.0%
Collaboration tools/sys. 76.0% 86.0% 83.3% 86.0% 86.4% 79.7%Learning environments 45.5% 41.0% 41.5% 45.5% 41.0% 38.7%Grid-enabled videoconferencing
34.8% 42.1% 32.8% 43.1% 30.6% 29.5%
Virtual/3D environments 41.7% 16.7% 11.3% 19.2% 21.9% 15.7%Innovative data collection methods 68.8% 50.0% 48.9% 38.2% 48.3% 25.3%
Source: AVROSS WP2 survey.
Technological features and location of the project In a next step we have grouped the respondents by their origin (see Section 3.2.1). The following Table 3.9 shows the use of e-Infrastructure items in the four different regions. The variations are notable, but somewhat difficult to interpret: learning environments and virtual/3D environments play a larger role in US-based projects. Continental European projects more often contain data repositories, whereas videoconferencing is relatively unimportant – it is used more than twice as often in UK-based projects.
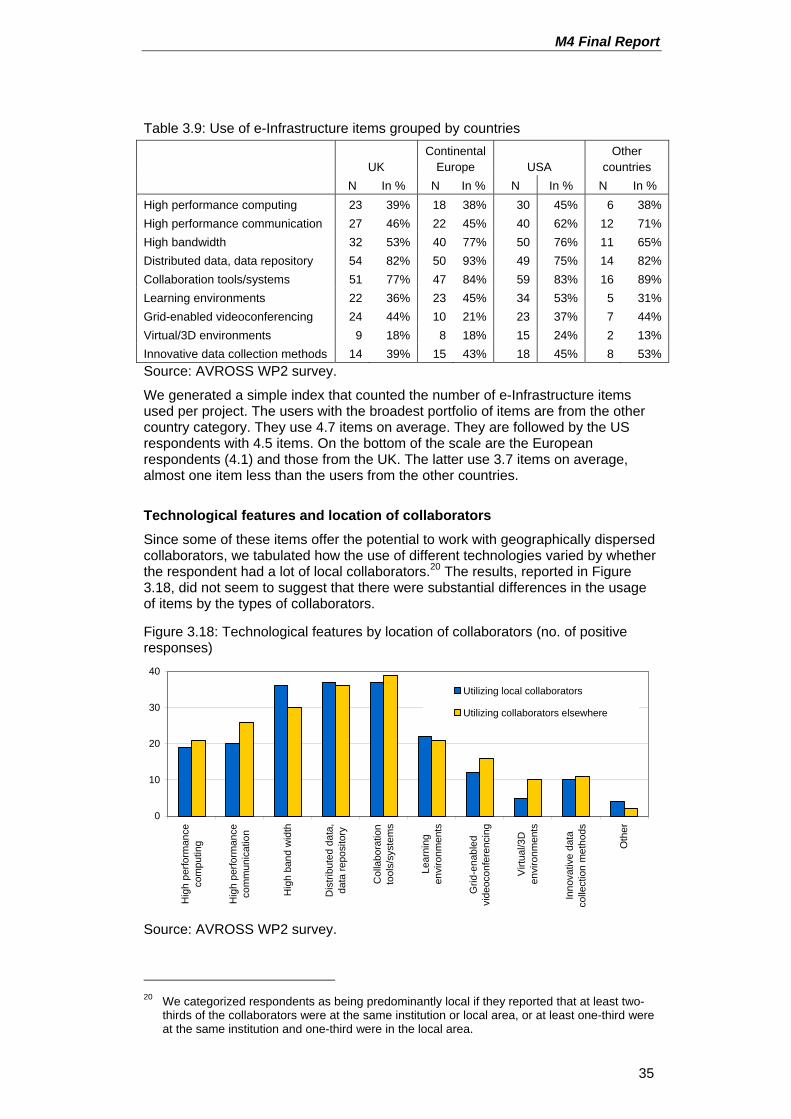
M4 Final Report
35
Table 3.9: Use of e-Infrastructure items grouped by countries
UK Continental
Europe USA Other
countries
N In % N In % N In % N In % High performance computing 23 39% 18 38% 30 45% 6 38% High performance communication 27 46% 22 45% 40 62% 12 71% High bandwidth 32 53% 40 77% 50 76% 11 65% Distributed data, data repository 54 82% 50 93% 49 75% 14 82% Collaboration tools/systems 51 77% 47 84% 59 83% 16 89% Learning environments 22 36% 23 45% 34 53% 5 31% Grid-enabled videoconferencing 24 44% 10 21% 23 37% 7 44% Virtual/3D environments 9 18% 8 18% 15 24% 2 13% Innovative data collection methods 14 39% 15 43% 18 45% 8 53% Source: AVROSS WP2 survey.
We generated a simple index that counted the number of e-Infrastructure items used per project. The users with the broadest portfolio of items are from the other country category. They use 4.7 items on average. They are followed by the US respondents with 4.5 items. On the bottom of the scale are the European respondents (4.1) and those from the UK. The latter use 3.7 items on average, almost one item less than the users from the other countries.
Technological features and location of collaborators Since some of these items offer the potential to work with geographically dispersed collaborators, we tabulated how the use of different technologies varied by whether the respondent had a lot of local collaborators.20 The results, reported in Figure 3.18, did not seem to suggest that there were substantial differences in the usage of items by the types of collaborators.
Figure 3.18: Technological features by location of collaborators (no. of positive responses)
0
10
20
30
40
Hig
h pe
rform
ance
com
putin
g
Hig
h pe
rform
ance
com
mun
icat
ion
Hig
h ba
nd w
idth
Dis
tribu
ted
data
,da
ta re
posi
tory
Col
labo
ratio
nto
ols/
syst
ems
Lear
ning
envi
ronm
ents
Grid
-ena
bled
vide
ocon
fere
ncin
g
Virt
ual/3
Den
viro
nmen
ts
Inno
vativ
e da
taco
llect
ion
met
hods
Oth
er
Utilizing local collaborators
Utilizing collaborators elsewhere
Source: AVROSS WP2 survey.
20 We categorized respondents as being predominantly local if they reported that at least two-
thirds of the collaborators were at the same institution or local area, or at least one-third were at the same institution and one-third were in the local area.
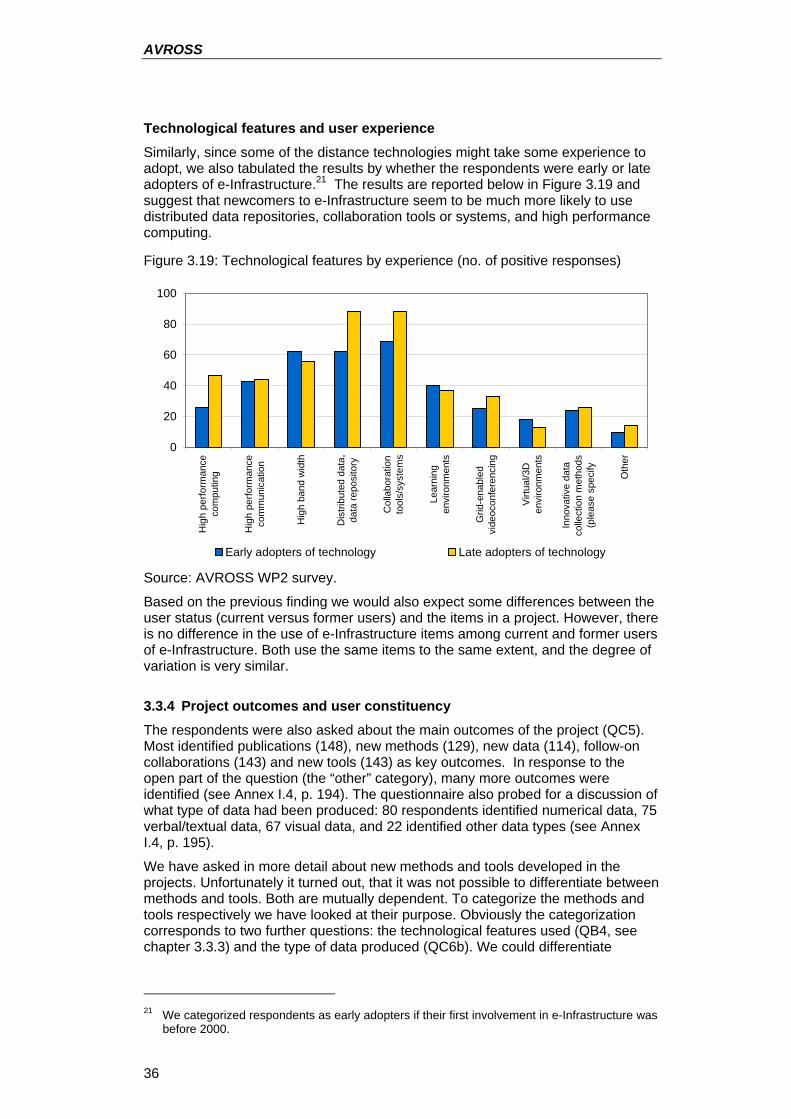
AVROSS
36
Technological features and user experience Similarly, since some of the distance technologies might take some experience to adopt, we also tabulated the results by whether the respondents were early or late adopters of e-Infrastructure.21 The results are reported below in Figure 3.19 and suggest that newcomers to e-Infrastructure seem to be much more likely to use distributed data repositories, collaboration tools or systems, and high performance computing.
Figure 3.19: Technological features by experience (no. of positive responses)
0
20
40
60
80
100
Hig
h pe
rform
ance
com
putin
g
Hig
h pe
rform
ance
com
mun
icat
ion
Hig
h ba
nd w
idth
Dis
tribu
ted
data
,da
ta re
posi
tory
Col
labo
ratio
nto
ols/
syst
ems
Lear
ning
envi
ronm
ents
Grid
-ena
bled
vide
ocon
fere
ncin
g
Virtu
al/3
Den
viro
nmen
ts
Inno
vativ
e da
taco
llect
ion
met
hods
(ple
ase
spec
ify
Oth
er
Early adopters of technology Late adopters of technology
Source: AVROSS WP2 survey.
Based on the previous finding we would also expect some differences between the user status (current versus former users) and the items in a project. However, there is no difference in the use of e-Infrastructure items among current and former users of e-Infrastructure. Both use the same items to the same extent, and the degree of variation is very similar.
3.3.4 Project outcomes and user constituency The respondents were also asked about the main outcomes of the project (QC5). Most identified publications (148), new methods (129), new data (114), follow-on collaborations (143) and new tools (143) as key outcomes. In response to the open part of the question (the “other” category), many more outcomes were identified (see Annex I.4, p. 194). The questionnaire also probed for a discussion of what type of data had been produced: 80 respondents identified numerical data, 75 verbal/textual data, 67 visual data, and 22 identified other data types (see Annex I.4, p. 195).
We have asked in more detail about new methods and tools developed in the projects. Unfortunately it turned out, that it was not possible to differentiate between methods and tools. Both are mutually dependent. To categorize the methods and tools respectively we have looked at their purpose. Obviously the categorization corresponds to two further questions: the technological features used (QB4, see chapter 3.3.3) and the type of data produced (QC6b). We could differentiate
21 We categorized respondents as early adopters if their first involvement in e-Infrastructure was
before 2000.
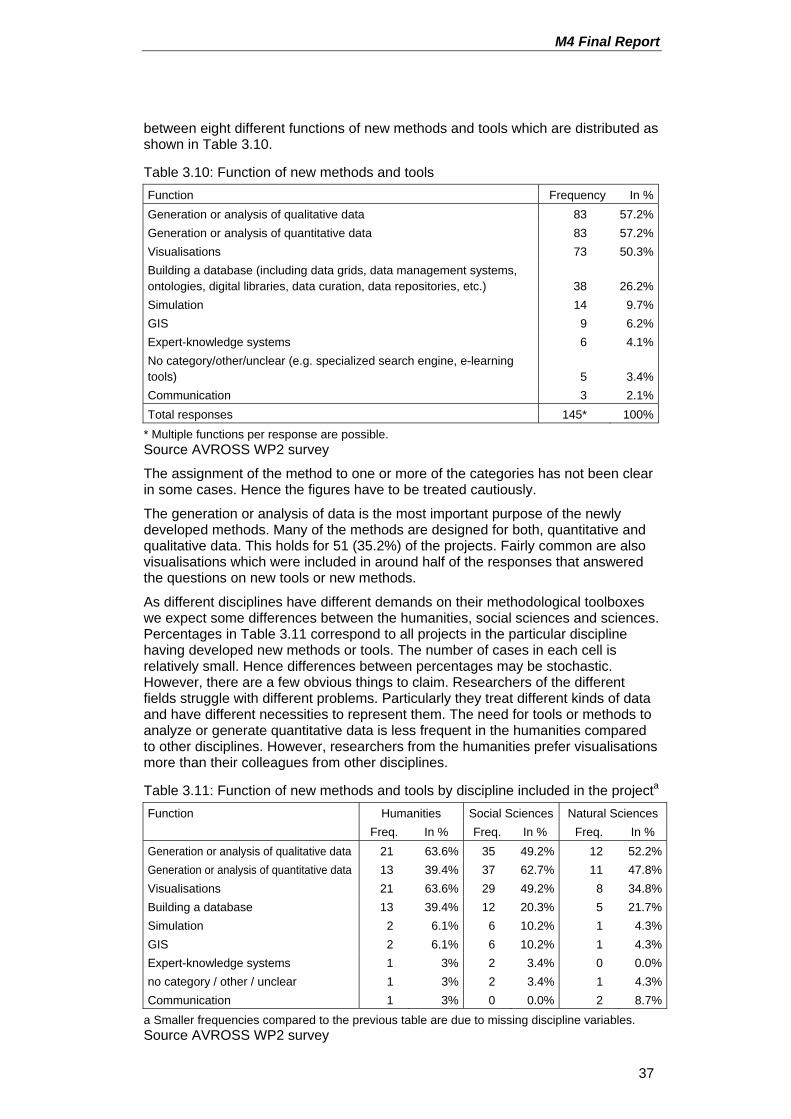
M4 Final Report
37
between eight different functions of new methods and tools which are distributed as shown in Table 3.10.
Table 3.10: Function of new methods and tools Function Frequency In % Generation or analysis of qualitative data 83 57.2% Generation or analysis of quantitative data 83 57.2% Visualisations 73 50.3% Building a database (including data grids, data management systems, ontologies, digital libraries, data curation, data repositories, etc.) 38 26.2% Simulation 14 9.7% GIS 9 6.2% Expert-knowledge systems 6 4.1% No category/other/unclear (e.g. specialized search engine, e-learning tools) 5 3.4% Communication 3 2.1% Total responses 145* 100%
* Multiple functions per response are possible. Source AVROSS WP2 survey
The assignment of the method to one or more of the categories has not been clear in some cases. Hence the figures have to be treated cautiously.
The generation or analysis of data is the most important purpose of the newly developed methods. Many of the methods are designed for both, quantitative and qualitative data. This holds for 51 (35.2%) of the projects. Fairly common are also visualisations which were included in around half of the responses that answered the questions on new tools or new methods.
As different disciplines have different demands on their methodological toolboxes we expect some differences between the humanities, social sciences and sciences. Percentages in Table 3.11 correspond to all projects in the particular discipline having developed new methods or tools. The number of cases in each cell is relatively small. Hence differences between percentages may be stochastic. However, there are a few obvious things to claim. Researchers of the different fields struggle with different problems. Particularly they treat different kinds of data and have different necessities to represent them. The need for tools or methods to analyze or generate quantitative data is less frequent in the humanities compared to other disciplines. However, researchers from the humanities prefer visualisations more than their colleagues from other disciplines.
Table 3.11: Function of new methods and tools by discipline included in the projecta Function Humanities Social Sciences Natural Sciences Freq. In % Freq. In % Freq. In % Generation or analysis of qualitative data 21 63.6% 35 49.2% 12 52.2%Generation or analysis of quantitative data 13 39.4% 37 62.7% 11 47.8%Visualisations 21 63.6% 29 49.2% 8 34.8%Building a database 13 39.4% 12 20.3% 5 21.7%Simulation 2 6.1% 6 10.2% 1 4.3%GIS 2 6.1% 6 10.2% 1 4.3%Expert-knowledge systems 1 3% 2 3.4% 0 0.0%no category / other / unclear 1 3% 2 3.4% 1 4.3%Communication 1 3% 0 0.0% 2 8.7%
a Smaller frequencies compared to the previous table are due to missing discipline variables. Source AVROSS WP2 survey
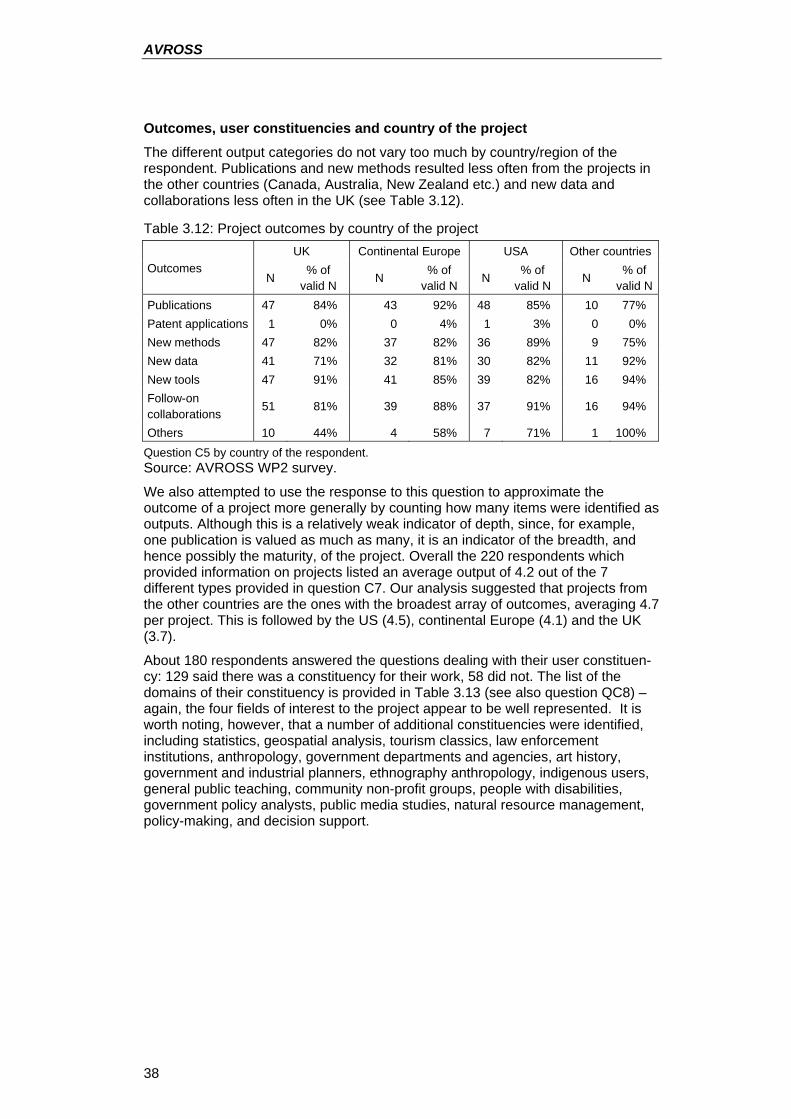
AVROSS
38
Outcomes, user constituencies and country of the project The different output categories do not vary too much by country/region of the respondent. Publications and new methods resulted less often from the projects in the other countries (Canada, Australia, New Zealand etc.) and new data and collaborations less often in the UK (see Table 3.12).
Table 3.12: Project outcomes by country of the project UK Continental Europe USA Other countries
Outcomes N
% of valid N N
% of valid N N
% of valid N N
% of valid N
Publications 47 84% 43 92% 48 85% 10 77% Patent applications 1 0% 0 4% 1 3% 0 0% New methods 47 82% 37 82% 36 89% 9 75% New data 41 71% 32 81% 30 82% 11 92% New tools 47 91% 41 85% 39 82% 16 94% Follow-on collaborations
51 81% 39 88% 37 91% 16 94%
Others 10 44% 4 58% 7 71% 1 100% Question C5 by country of the respondent. Source: AVROSS WP2 survey.
We also attempted to use the response to this question to approximate the outcome of a project more generally by counting how many items were identified as outputs. Although this is a relatively weak indicator of depth, since, for example, one publication is valued as much as many, it is an indicator of the breadth, and hence possibly the maturity, of the project. Overall the 220 respondents which provided information on projects listed an average output of 4.2 out of the 7 different types provided in question C7. Our analysis suggested that projects from the other countries are the ones with the broadest array of outcomes, averaging 4.7 per project. This is followed by the US (4.5), continental Europe (4.1) and the UK (3.7).
About 180 respondents answered the questions dealing with their user constituen-cy: 129 said there was a constituency for their work, 58 did not. The list of the domains of their constituency is provided in Table 3.13 (see also question QC8) – again, the four fields of interest to the project appear to be well represented. It is worth noting, however, that a number of additional constituencies were identified, including statistics, geospatial analysis, tourism classics, law enforcement institutions, anthropology, government departments and agencies, art history, government and industrial planners, ethnography anthropology, indigenous users, general public teaching, community non-profit groups, people with disabilities, government policy analysts, public media studies, natural resource management, policy-making, and decision support.
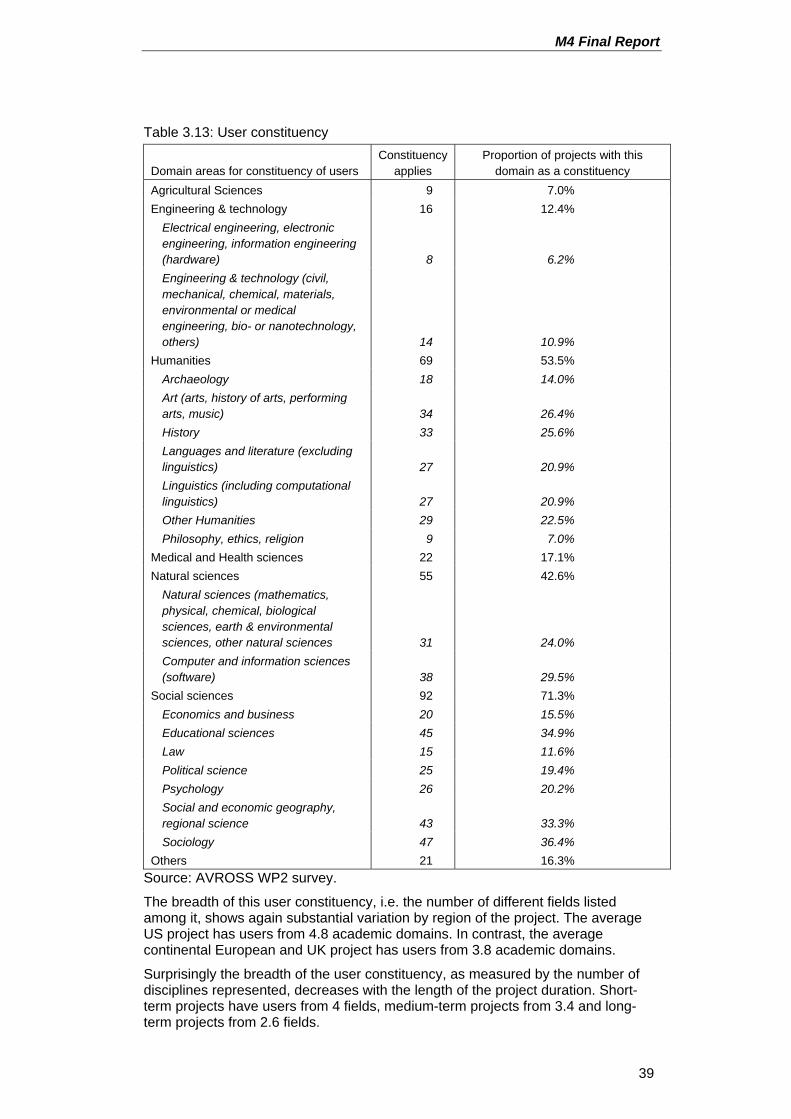
M4 Final Report
39
Table 3.13: User constituency
Domain areas for constituency of users Constituency
applies Proportion of projects with this
domain as a constituency Agricultural Sciences 9 7.0% Engineering & technology 16 12.4%
Electrical engineering, electronic engineering, information engineering (hardware) 8 6.2% Engineering & technology (civil, mechanical, chemical, materials, environmental or medical engineering, bio- or nanotechnology, others) 14 10.9%
Humanities 69 53.5% Archaeology 18 14.0% Art (arts, history of arts, performing arts, music) 34 26.4% History 33 25.6% Languages and literature (excluding linguistics) 27 20.9% Linguistics (including computational linguistics) 27 20.9% Other Humanities 29 22.5% Philosophy, ethics, religion 9 7.0%
Medical and Health sciences 22 17.1% Natural sciences 55 42.6%
Natural sciences (mathematics, physical, chemical, biological sciences, earth & environmental sciences, other natural sciences 31 24.0% Computer and information sciences (software) 38 29.5%
Social sciences 92 71.3% Economics and business 20 15.5% Educational sciences 45 34.9% Law 15 11.6% Political science 25 19.4% Psychology 26 20.2% Social and economic geography, regional science 43 33.3% Sociology 47 36.4%
Others 21 16.3% Source: AVROSS WP2 survey.
The breadth of this user constituency, i.e. the number of different fields listed among it, shows again substantial variation by region of the project. The average US project has users from 4.8 academic domains. In contrast, the average continental European and UK project has users from 3.8 academic domains.
Surprisingly the breadth of the user constituency, as measured by the number of disciplines represented, decreases with the length of the project duration. Short-term projects have users from 4 fields, medium-term projects from 3.4 and long-term projects from 2.6 fields.
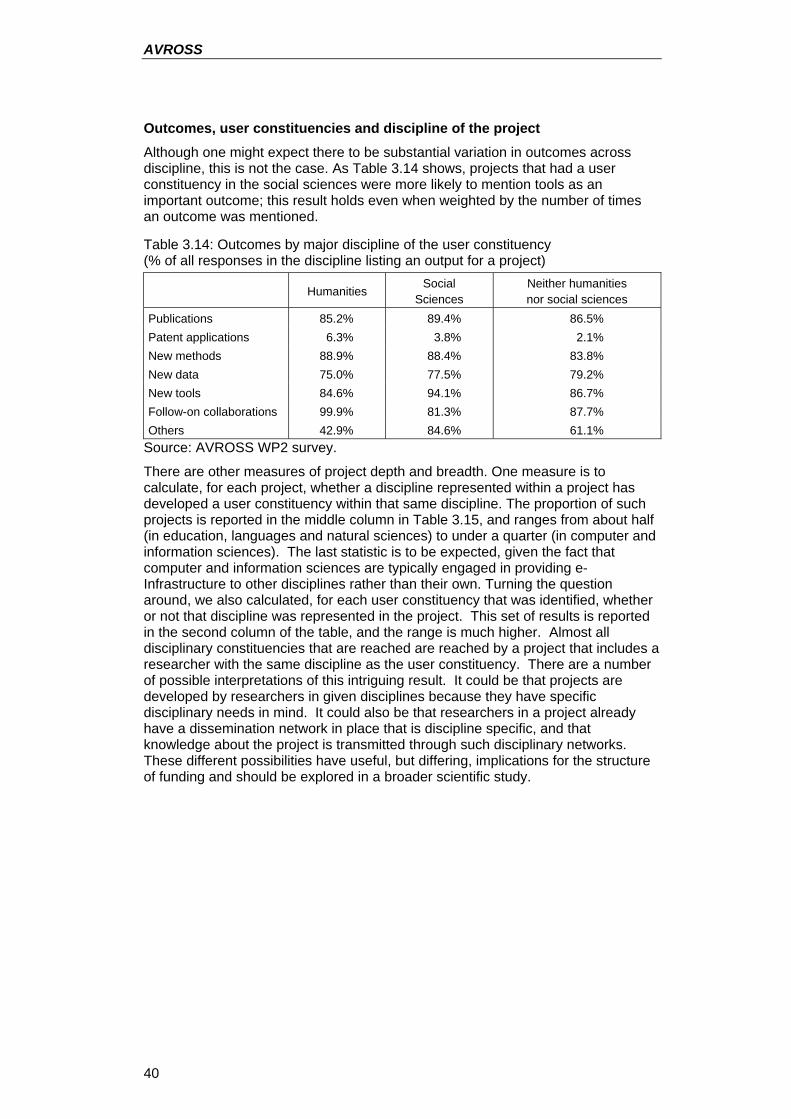
AVROSS
40
Outcomes, user constituencies and discipline of the project Although one might expect there to be substantial variation in outcomes across discipline, this is not the case. As Table 3.14 shows, projects that had a user constituency in the social sciences were more likely to mention tools as an important outcome; this result holds even when weighted by the number of times an outcome was mentioned.
Table 3.14: Outcomes by major discipline of the user constituency (% of all responses in the discipline listing an output for a project)
Humanities Social
Sciences Neither humanities nor social sciences
Publications 85.2% 89.4% 86.5% Patent applications 6.3% 3.8% 2.1% New methods 88.9% 88.4% 83.8% New data 75.0% 77.5% 79.2% New tools 84.6% 94.1% 86.7% Follow-on collaborations 99.9% 81.3% 87.7% Others 42.9% 84.6% 61.1%
Source: AVROSS WP2 survey.
There are other measures of project depth and breadth. One measure is to calculate, for each project, whether a discipline represented within a project has developed a user constituency within that same discipline. The proportion of such projects is reported in the middle column in Table 3.15, and ranges from about half (in education, languages and natural sciences) to under a quarter (in computer and information sciences). The last statistic is to be expected, given the fact that computer and information sciences are typically engaged in providing e-Infrastructure to other disciplines rather than their own. Turning the question around, we also calculated, for each user constituency that was identified, whether or not that discipline was represented in the project. This set of results is reported in the second column of the table, and the range is much higher. Almost all disciplinary constituencies that are reached are reached by a project that includes a researcher with the same discipline as the user constituency. There are a number of possible interpretations of this intriguing result. It could be that projects are developed by researchers in given disciplines because they have specific disciplinary needs in mind. It could also be that researchers in a project already have a dissemination network in place that is discipline specific, and that knowledge about the project is transmitted through such disciplinary networks. These different possibilities have useful, but differing, implications for the structure of funding and should be explored in a broader scientific study.
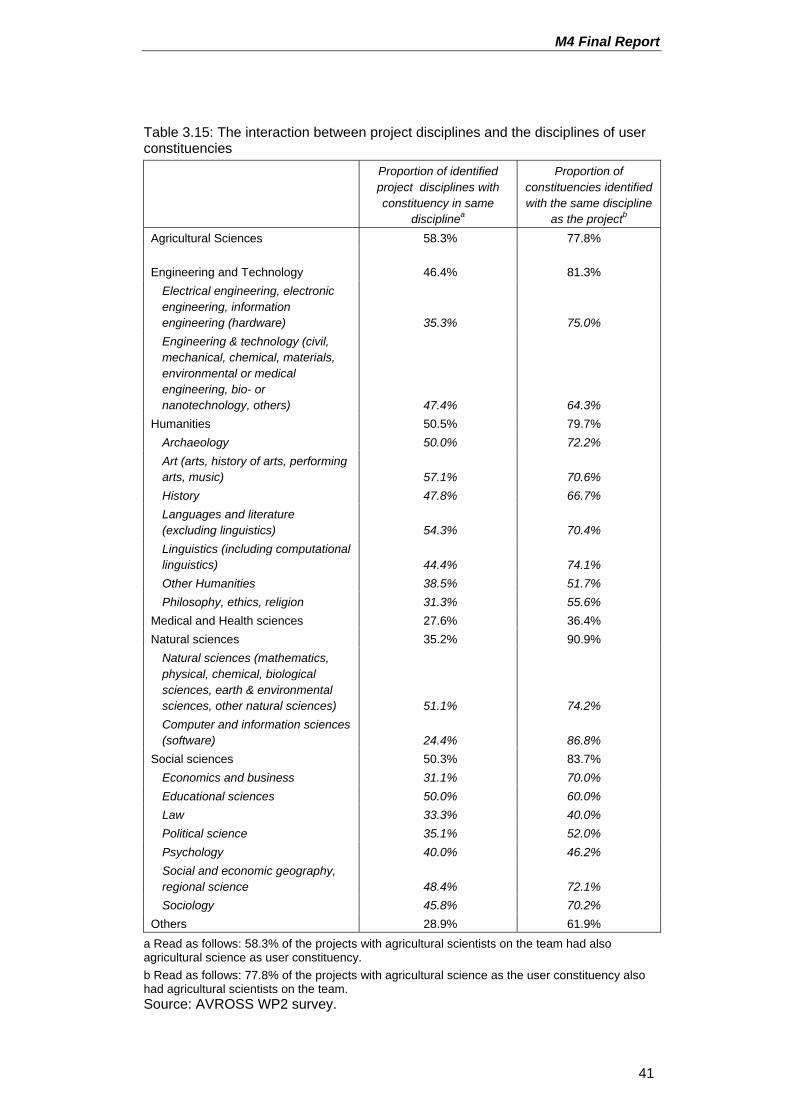
M4 Final Report
41
Table 3.15: The interaction between project disciplines and the disciplines of user constituencies
Proportion of identified project disciplines with constituency in same
disciplinea
Proportion of constituencies identified with the same discipline
as the projectb Agricultural Sciences 58.3% 77.8%
Engineering and Technology 46.4% 81.3% Electrical engineering, electronic engineering, information engineering (hardware) 35.3% 75.0% Engineering & technology (civil, mechanical, chemical, materials, environmental or medical engineering, bio- or nanotechnology, others) 47.4% 64.3%
Humanities 50.5% 79.7% Archaeology 50.0% 72.2% Art (arts, history of arts, performing arts, music) 57.1% 70.6% History 47.8% 66.7% Languages and literature (excluding linguistics) 54.3% 70.4% Linguistics (including computational linguistics) 44.4% 74.1% Other Humanities 38.5% 51.7% Philosophy, ethics, religion 31.3% 55.6%
Medical and Health sciences 27.6% 36.4% Natural sciences 35.2% 90.9%
Natural sciences (mathematics, physical, chemical, biological sciences, earth & environmental sciences, other natural sciences) 51.1% 74.2% Computer and information sciences (software) 24.4% 86.8%
Social sciences 50.3% 83.7% Economics and business 31.1% 70.0% Educational sciences 50.0% 60.0% Law 33.3% 40.0% Political science 35.1% 52.0% Psychology 40.0% 46.2% Social and economic geography, regional science 48.4% 72.1% Sociology 45.8% 70.2%
Others 28.9% 61.9% a Read as follows: 58.3% of the projects with agricultural scientists on the team had also agricultural science as user constituency. b Read as follows: 77.8% of the projects with agricultural science as the user constituency also had agricultural scientists on the team. Source: AVROSS WP2 survey.
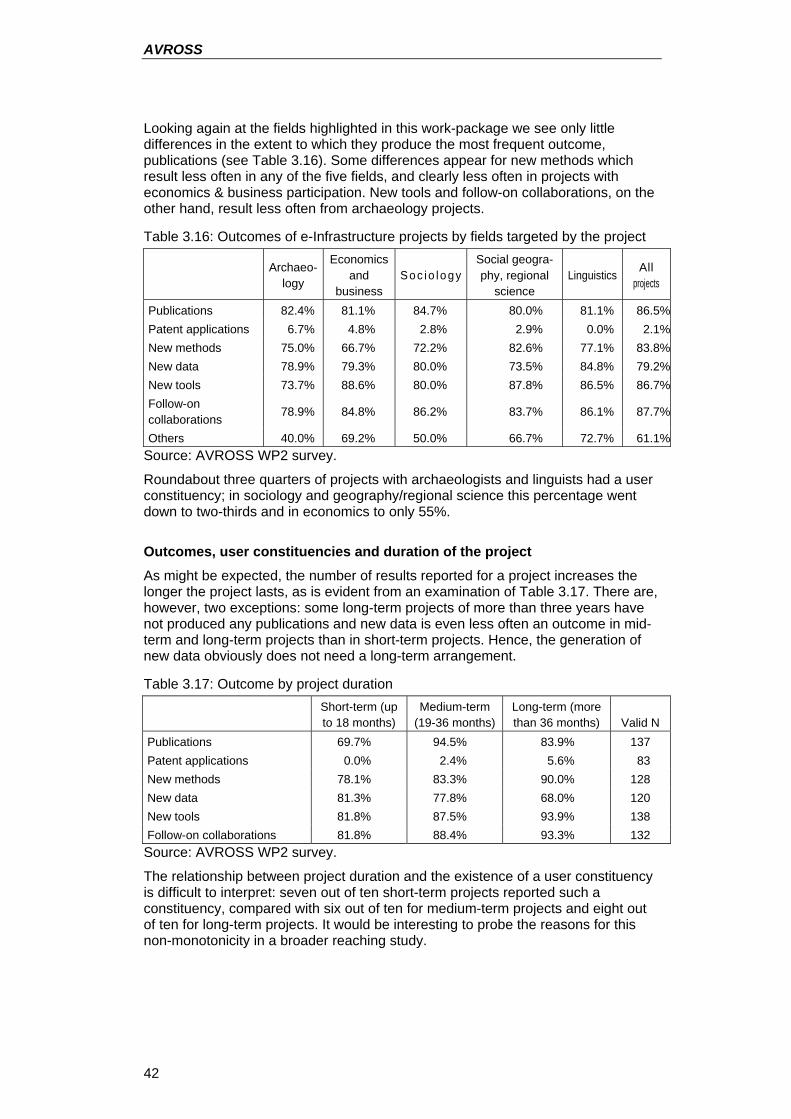
AVROSS
42
Looking again at the fields highlighted in this work-package we see only little differences in the extent to which they produce the most frequent outcome, publications (see Table 3.16). Some differences appear for new methods which result less often in any of the five fields, and clearly less often in projects with economics & business participation. New tools and follow-on collaborations, on the other hand, result less often from archaeology projects.
Table 3.16: Outcomes of e-Infrastructure projects by fields targeted by the project
Archaeo-
logy
Economics and
business S oc io lo gy
Social geogra-phy, regional
science Linguistics
All projects
Publications 82.4% 81.1% 84.7% 80.0% 81.1% 86.5%Patent applications 6.7% 4.8% 2.8% 2.9% 0.0% 2.1%New methods 75.0% 66.7% 72.2% 82.6% 77.1% 83.8%New data 78.9% 79.3% 80.0% 73.5% 84.8% 79.2%New tools 73.7% 88.6% 80.0% 87.8% 86.5% 86.7%Follow-on collaborations
78.9% 84.8% 86.2% 83.7% 86.1% 87.7%
Others 40.0% 69.2% 50.0% 66.7% 72.7% 61.1%Source: AVROSS WP2 survey.
Roundabout three quarters of projects with archaeologists and linguists had a user constituency; in sociology and geography/regional science this percentage went down to two-thirds and in economics to only 55%.
Outcomes, user constituencies and duration of the project As might be expected, the number of results reported for a project increases the longer the project lasts, as is evident from an examination of Table 3.17. There are, however, two exceptions: some long-term projects of more than three years have not produced any publications and new data is even less often an outcome in mid-term and long-term projects than in short-term projects. Hence, the generation of new data obviously does not need a long-term arrangement.
Table 3.17: Outcome by project duration
Short-term (up to 18 months)
Medium-term (19-36 months)
Long-term (more than 36 months) Valid N
Publications 69.7% 94.5% 83.9% 137 Patent applications 0.0% 2.4% 5.6% 83 New methods 78.1% 83.3% 90.0% 128 New data 81.3% 77.8% 68.0% 120 New tools 81.8% 87.5% 93.9% 138 Follow-on collaborations 81.8% 88.4% 93.3% 132 Source: AVROSS WP2 survey.
The relationship between project duration and the existence of a user constituency is difficult to interpret: seven out of ten short-term projects reported such a constituency, compared with six out of ten for medium-term projects and eight out of ten for long-term projects. It would be interesting to probe the reasons for this non-monotonicity in a broader reaching study.
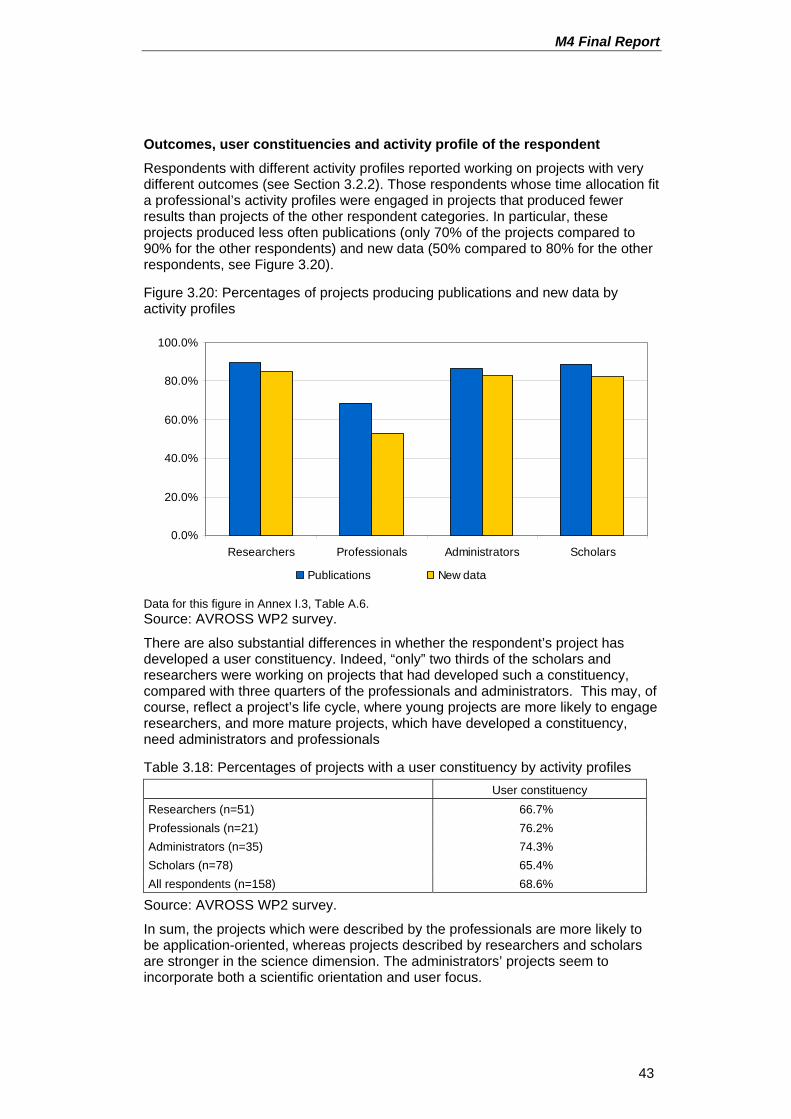
M4 Final Report
43
Outcomes, user constituencies and activity profile of the respondent Respondents with different activity profiles reported working on projects with very different outcomes (see Section 3.2.2). Those respondents whose time allocation fit a professional’s activity profiles were engaged in projects that produced fewer results than projects of the other respondent categories. In particular, these projects produced less often publications (only 70% of the projects compared to 90% for the other respondents) and new data (50% compared to 80% for the other respondents, see Figure 3.20).
Figure 3.20: Percentages of projects producing publications and new data by activity profiles
0.0%
20.0%
40.0%
60.0%
80.0%
100.0%
Researchers Professionals Administrators Scholars
Publications New data
Data for this figure in Annex I.3, Table A.6. Source: AVROSS WP2 survey.
There are also substantial differences in whether the respondent’s project has developed a user constituency. Indeed, “only” two thirds of the scholars and researchers were working on projects that had developed such a constituency, compared with three quarters of the professionals and administrators. This may, of course, reflect a project’s life cycle, where young projects are more likely to engage researchers, and more mature projects, which have developed a constituency, need administrators and professionals
Table 3.18: Percentages of projects with a user constituency by activity profiles User constituency Researchers (n=51) 66.7% Professionals (n=21) 76.2% Administrators (n=35) 74.3% Scholars (n=78) 65.4% All respondents (n=158) 68.6%
Source: AVROSS WP2 survey.
In sum, the projects which were described by the professionals are more likely to be application-oriented, whereas projects described by researchers and scholars are stronger in the science dimension. The administrators’ projects seem to incorporate both a scientific orientation and user focus.
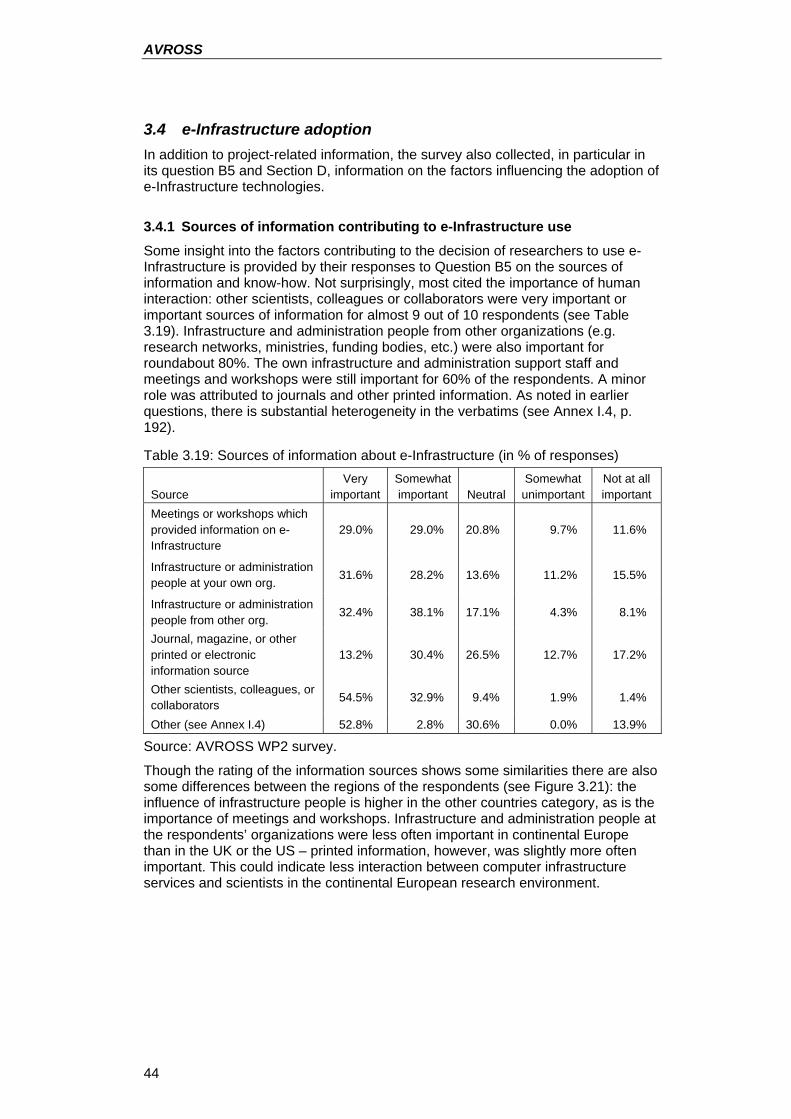
AVROSS
44
3.4 e-Infrastructure adoption In addition to project-related information, the survey also collected, in particular in its question B5 and Section D, information on the factors influencing the adoption of e-Infrastructure technologies.
3.4.1 Sources of information contributing to e-Infrastructure use Some insight into the factors contributing to the decision of researchers to use e-Infrastructure is provided by their responses to Question B5 on the sources of information and know-how. Not surprisingly, most cited the importance of human interaction: other scientists, colleagues or collaborators were very important or important sources of information for almost 9 out of 10 respondents (see Table 3.19). Infrastructure and administration people from other organizations (e.g. research networks, ministries, funding bodies, etc.) were also important for roundabout 80%. The own infrastructure and administration support staff and meetings and workshops were still important for 60% of the respondents. A minor role was attributed to journals and other printed information. As noted in earlier questions, there is substantial heterogeneity in the verbatims (see Annex I.4, p. 192).
Table 3.19: Sources of information about e-Infrastructure (in % of responses)
Source Very
important Somewhat important Neutral
Somewhat unimportant
Not at all important
Meetings or workshops which provided information on e-Infrastructure
29.0% 29.0% 20.8% 9.7% 11.6%
Infrastructure or administration people at your own org.
31.6% 28.2% 13.6% 11.2% 15.5%
Infrastructure or administration people from other org.
32.4% 38.1% 17.1% 4.3% 8.1%
Journal, magazine, or other printed or electronic information source
13.2% 30.4% 26.5% 12.7% 17.2%
Other scientists, colleagues, or collaborators 54.5% 32.9% 9.4% 1.9% 1.4%
Other (see Annex I.4) 52.8% 2.8% 30.6% 0.0% 13.9%
Source: AVROSS WP2 survey.
Though the rating of the information sources shows some similarities there are also some differences between the regions of the respondents (see Figure 3.21): the influence of infrastructure people is higher in the other countries category, as is the importance of meetings and workshops. Infrastructure and administration people at the respondents’ organizations were less often important in continental Europe than in the UK or the US – printed information, however, was slightly more often important. This could indicate less interaction between computer infrastructure services and scientists in the continental European research environment.
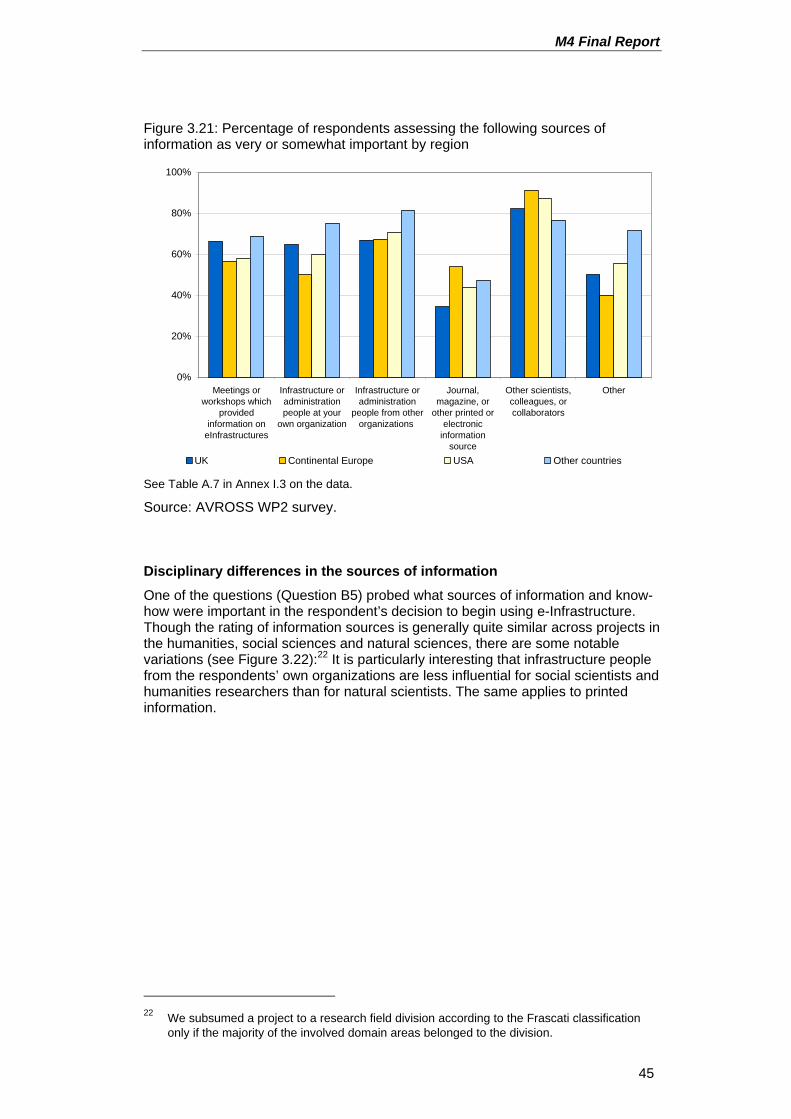
M4 Final Report
45
Figure 3.21: Percentage of respondents assessing the following sources of information as very or somewhat important by region
0%
20%
40%
60%
80%
100%
Meetings orworkshops which
providedinformation on
eInfrastructures
Infrastructure oradministrationpeople at your
own organization
Infrastructure oradministration
people from otherorganizations
Journal,magazine, or
other printed orelectronic
informationsource
Other scientists,colleagues, orcollaborators
Other
UK Continental Europe USA Other countries
See Table A.7 in Annex I.3 on the data.
Source: AVROSS WP2 survey.
Disciplinary differences in the sources of information One of the questions (Question B5) probed what sources of information and know-how were important in the respondent’s decision to begin using e-Infrastructure. Though the rating of information sources is generally quite similar across projects in the humanities, social sciences and natural sciences, there are some notable variations (see Figure 3.22):22 It is particularly interesting that infrastructure people from the respondents’ own organizations are less influential for social scientists and humanities researchers than for natural scientists. The same applies to printed information.
22 We subsumed a project to a research field division according to the Frascati classification
only if the majority of the involved domain areas belonged to the division.
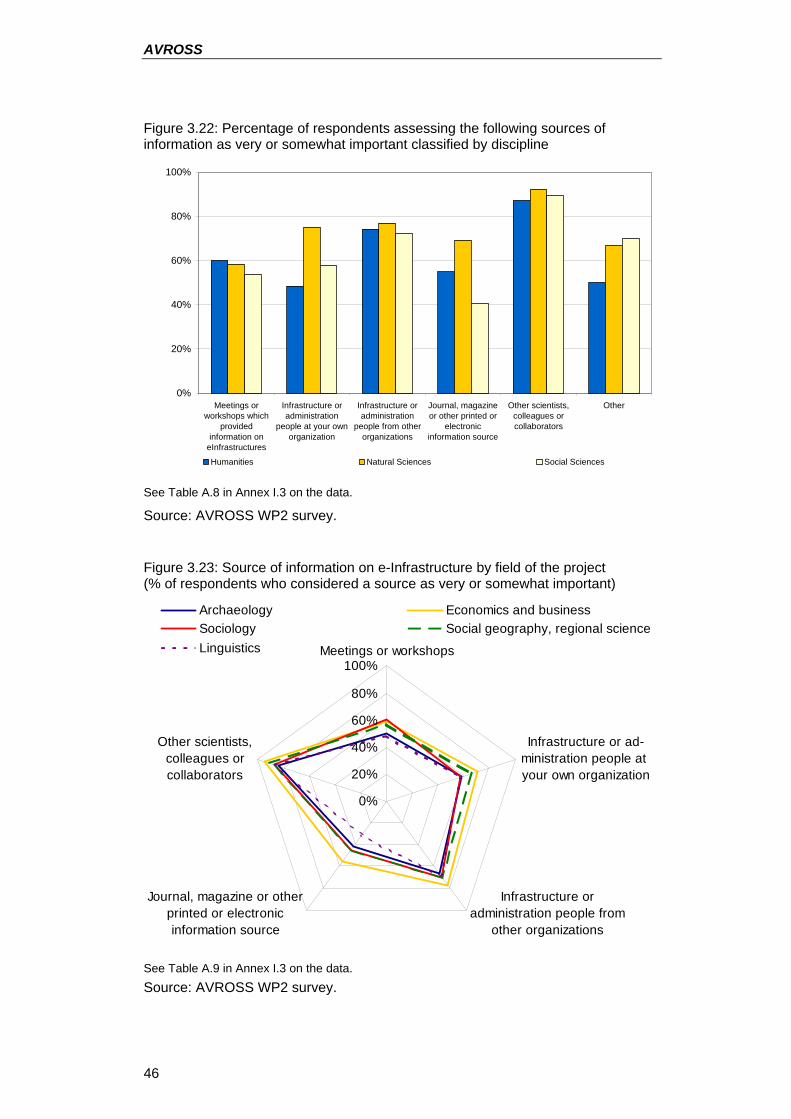
AVROSS
46
Figure 3.22: Percentage of respondents assessing the following sources of information as very or somewhat important classified by discipline
0%
20%
40%
60%
80%
100%
Meetings orworkshops which
providedinformation on
eInfrastructures
Infrastructure oradministration
people at your ownorganization
Infrastructure oradministration
people from otherorganizations
Journal, magazineor other printed or
electronicinformation source
Other scientists,colleagues orcollaborators
Other
Humanities Natural Sciences Social Sciences
See Table A.8 in Annex I.3 on the data.
Source: AVROSS WP2 survey.
Figure 3.23: Source of information on e-Infrastructure by field of the project (% of respondents who considered a source as very or somewhat important)
0%
20%
40%
60%
80%
100%Meetings or workshops
Infrastructure or ad-ministration people at your own organization
Infrastructure oradministration people from
other organizations
Journal, magazine or otherprinted or electronicinformation source
Other scientists,colleagues orcollaborators
Archaeology Economics and businessSociology Social geography, regional scienceLinguistics
See Table A.9 in Annex I.3 on the data. Source: AVROSS WP2 survey.
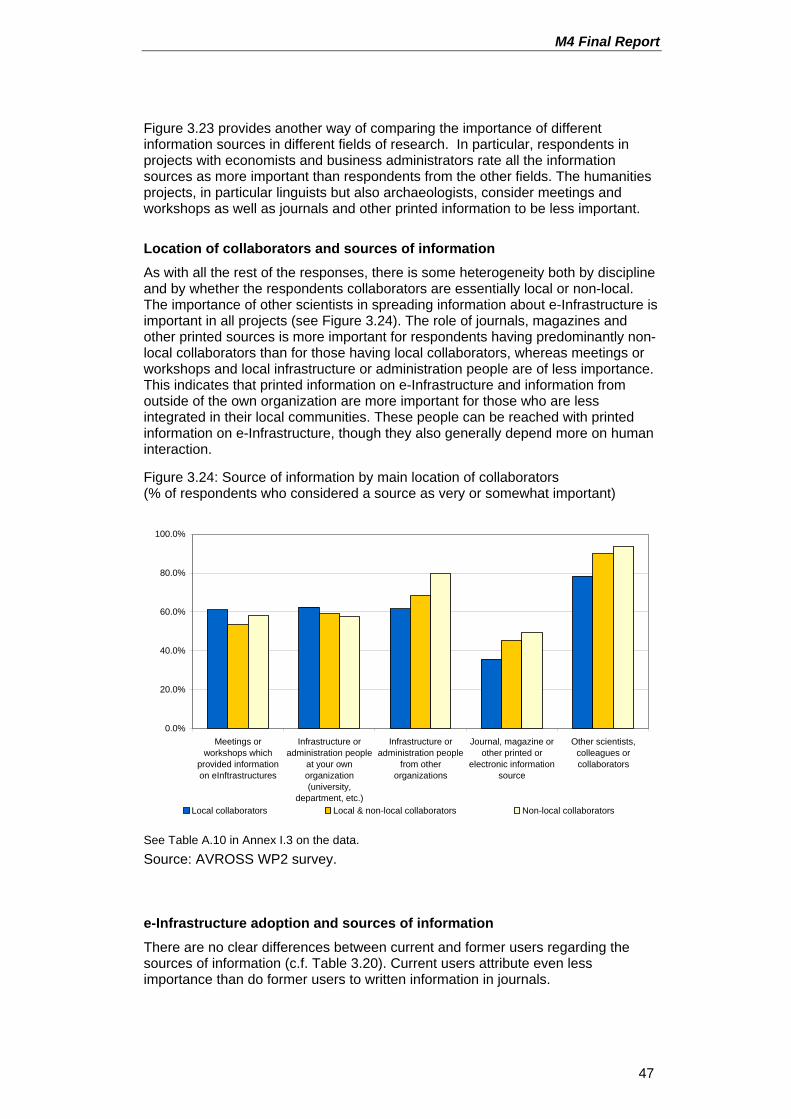
M4 Final Report
47
Figure 3.23 provides another way of comparing the importance of different information sources in different fields of research. In particular, respondents in projects with economists and business administrators rate all the information sources as more important than respondents from the other fields. The humanities projects, in particular linguists but also archaeologists, consider meetings and workshops as well as journals and other printed information to be less important.
Location of collaborators and sources of information As with all the rest of the responses, there is some heterogeneity both by discipline and by whether the respondents collaborators are essentially local or non-local. The importance of other scientists in spreading information about e-Infrastructure is important in all projects (see Figure 3.24). The role of journals, magazines and other printed sources is more important for respondents having predominantly non-local collaborators than for those having local collaborators, whereas meetings or workshops and local infrastructure or administration people are of less importance. This indicates that printed information on e-Infrastructure and information from outside of the own organization are more important for those who are less integrated in their local communities. These people can be reached with printed information on e-Infrastructure, though they also generally depend more on human interaction.
Figure 3.24: Source of information by main location of collaborators (% of respondents who considered a source as very or somewhat important)
0.0%
20.0%
40.0%
60.0%
80.0%
100.0%
Meetings orworkshops which
provided informationon eInftrastructures
Infrastructure oradministration people
at your ownorganization(university,
department, etc.)
Infrastructure oradministration people
from otherorganizations
Journal, magazine orother printed or
electronic informationsource
Other scientists,colleagues orcollaborators
Local collaborators Local & non-local collaborators Non-local collaborators
See Table A.10 in Annex I.3 on the data. Source: AVROSS WP2 survey.
e-Infrastructure adoption and sources of information There are no clear differences between current and former users regarding the sources of information (c.f. Table 3.20). Current users attribute even less importance than do former users to written information in journals.
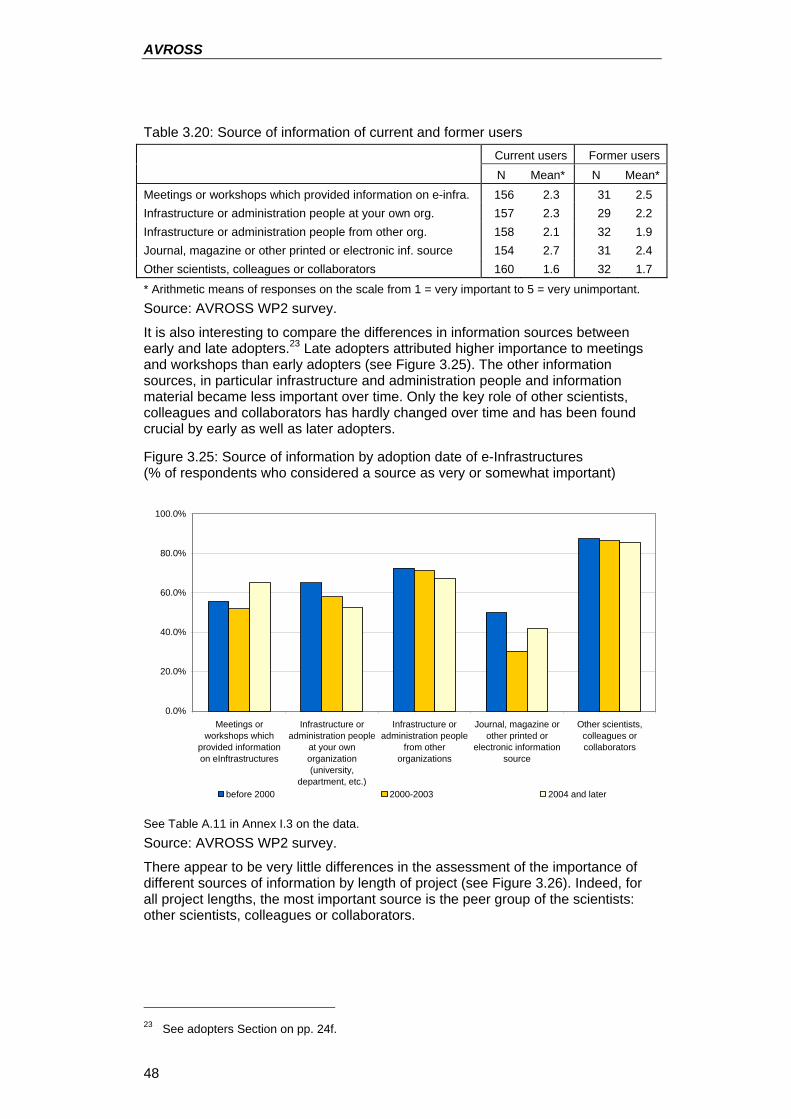
AVROSS
48
Table 3.20: Source of information of current and former users Current users Former users N Mean* N Mean*
Meetings or workshops which provided information on e-infra. 156 2.3 31 2.5 Infrastructure or administration people at your own org. 157 2.3 29 2.2 Infrastructure or administration people from other org. 158 2.1 32 1.9 Journal, magazine or other printed or electronic inf. source 154 2.7 31 2.4 Other scientists, colleagues or collaborators 160 1.6 32 1.7
* Arithmetic means of responses on the scale from 1 = very important to 5 = very unimportant. Source: AVROSS WP2 survey.
It is also interesting to compare the differences in information sources between early and late adopters.23 Late adopters attributed higher importance to meetings and workshops than early adopters (see Figure 3.25). The other information sources, in particular infrastructure and administration people and information material became less important over time. Only the key role of other scientists, colleagues and collaborators has hardly changed over time and has been found crucial by early as well as later adopters.
Figure 3.25: Source of information by adoption date of e-Infrastructures (% of respondents who considered a source as very or somewhat important)
0.0%
20.0%
40.0%
60.0%
80.0%
100.0%
Meetings orworkshops which
provided informationon eInftrastructures
Infrastructure oradministration people
at your ownorganization(university,
department, etc.)
Infrastructure oradministration people
from otherorganizations
Journal, magazine orother printed or
electronic informationsource
Other scientists,colleagues orcollaborators
before 2000 2000-2003 2004 and later
See Table A.11 in Annex I.3 on the data. Source: AVROSS WP2 survey.
There appear to be very little differences in the assessment of the importance of different sources of information by length of project (see Figure 3.26). Indeed, for all project lengths, the most important source is the peer group of the scientists: other scientists, colleagues or collaborators.
23 See adopters Section on pp. 24f.
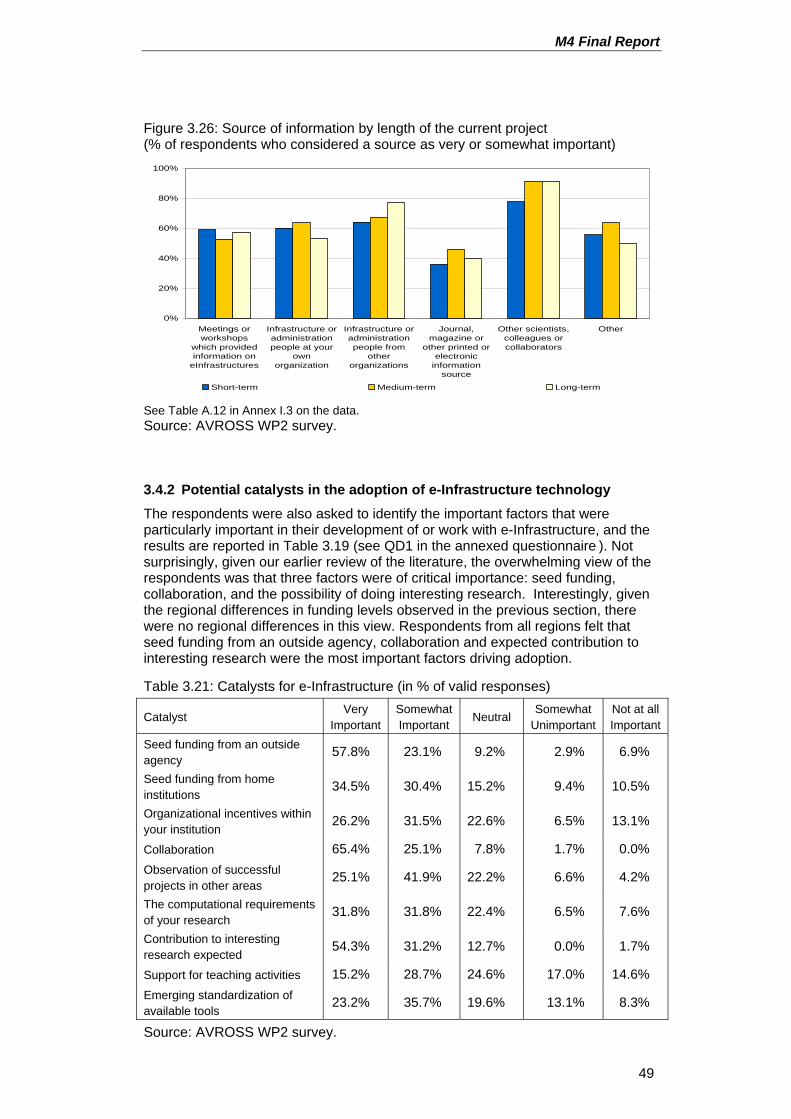
M4 Final Report
49
Figure 3.26: Source of information by length of the current project (% of respondents who considered a source as very or somewhat important)
0%
20%
40%
60%
80%
100%
Meetings orworkshops
which providedinformation on
eInfrastructures
Infrastructure oradministrationpeople at your
ownorganization
Infrastructure oradministrationpeople from
otherorganizations
Journal,magazine or
other printed orelectronic
informationsource
Other scientists,colleagues orcollaborators
Other
Short-term Medium-term Long-term See Table A.12 in Annex I.3 on the data. Source: AVROSS WP2 survey.
3.4.2 Potential catalysts in the adoption of e-Infrastructure technology The respondents were also asked to identify the important factors that were particularly important in their development of or work with e-Infrastructure, and the results are reported in Table 3.19 (see QD1 in the annexed questionnaire ). Not surprisingly, given our earlier review of the literature, the overwhelming view of the respondents was that three factors were of critical importance: seed funding, collaboration, and the possibility of doing interesting research. Interestingly, given the regional differences in funding levels observed in the previous section, there were no regional differences in this view. Respondents from all regions felt that seed funding from an outside agency, collaboration and expected contribution to interesting research were the most important factors driving adoption.
Table 3.21: Catalysts for e-Infrastructure (in % of valid responses)
Catalyst Very
Important Somewhat Important
Neutral Somewhat
Unimportant Not at all Important
Seed funding from an outside agency
57.8% 23.1% 9.2% 2.9% 6.9%
Seed funding from home institutions
34.5% 30.4% 15.2% 9.4% 10.5%
Organizational incentives within your institution
26.2% 31.5% 22.6% 6.5% 13.1%
Collaboration 65.4% 25.1% 7.8% 1.7% 0.0%
Observation of successful projects in other areas
25.1% 41.9% 22.2% 6.6% 4.2%
The computational requirements of your research
31.8% 31.8% 22.4% 6.5% 7.6%
Contribution to interesting research expected
54.3% 31.2% 12.7% 0.0% 1.7%
Support for teaching activities 15.2% 28.7% 24.6% 17.0% 14.6%
Emerging standardization of available tools
23.2% 35.7% 19.6% 13.1% 8.3%
Source: AVROSS WP2 survey.
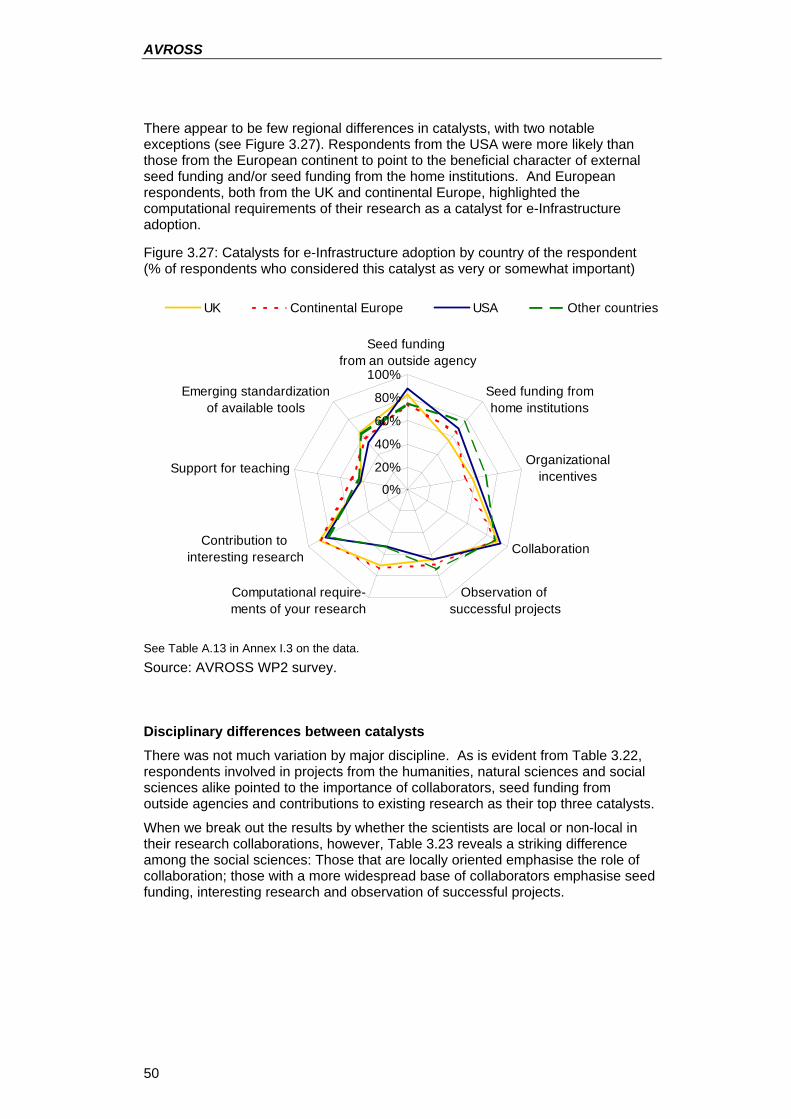
AVROSS
50
There appear to be few regional differences in catalysts, with two notable exceptions (see Figure 3.27). Respondents from the USA were more likely than those from the European continent to point to the beneficial character of external seed funding and/or seed funding from the home institutions. And European respondents, both from the UK and continental Europe, highlighted the computational requirements of their research as a catalyst for e-Infrastructure adoption.
Figure 3.27: Catalysts for e-Infrastructure adoption by country of the respondent (% of respondents who considered this catalyst as very or somewhat important)
0%
20%
40%
60%
80%
100%
Seed funding from an outside agency
Seed funding fromhome institutions
Organizationalincentives
Collaboration
Observation of successful projects
Computational require-ments of your research
Contribution to interesting research
Support for teaching
Emerging standardizationof available tools
UK Continental Europe USA Other countries
See Table A.13 in Annex I.3 on the data. Source: AVROSS WP2 survey.
Disciplinary differences between catalysts There was not much variation by major discipline. As is evident from Table 3.22, respondents involved in projects from the humanities, natural sciences and social sciences alike pointed to the importance of collaborators, seed funding from outside agencies and contributions to existing research as their top three catalysts.
When we break out the results by whether the scientists are local or non-local in their research collaborations, however, Table 3.23 reveals a striking difference among the social sciences: Those that are locally oriented emphasise the role of collaboration; those with a more widespread base of collaborators emphasise seed funding, interesting research and observation of successful projects.
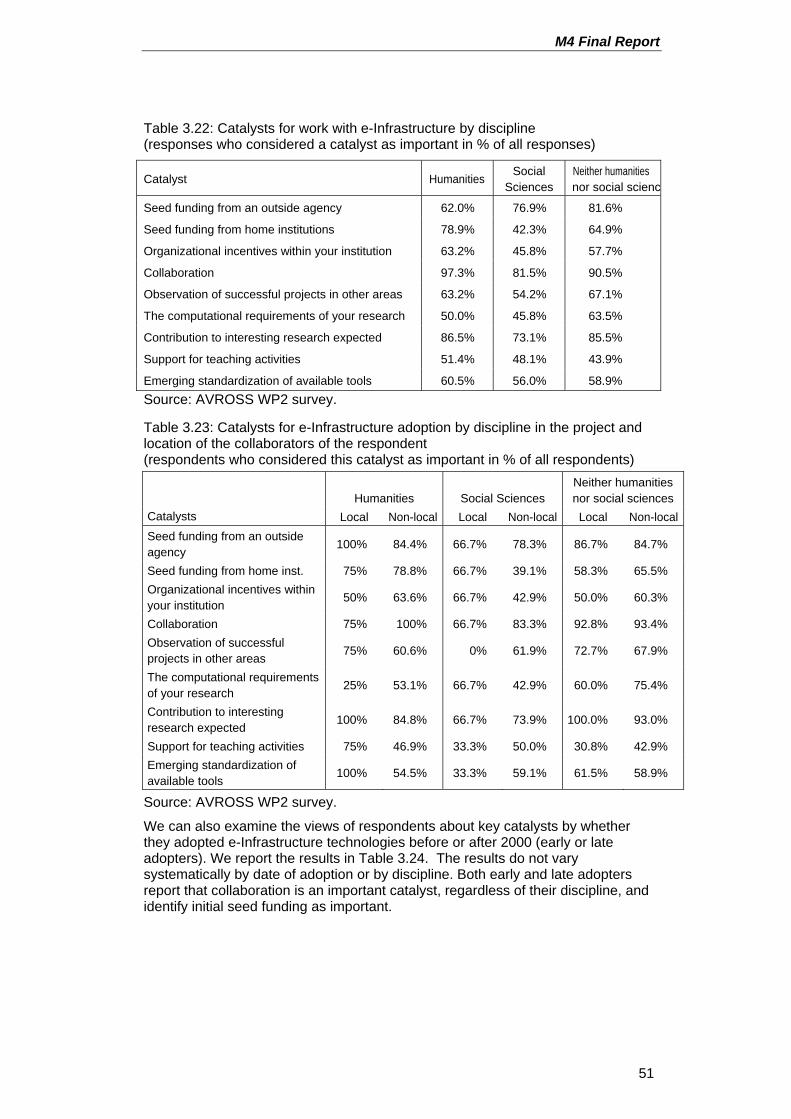
M4 Final Report
51
Table 3.22: Catalysts for work with e-Infrastructure by discipline (responses who considered a catalyst as important in % of all responses)
Catalyst Humanities Social
Sciences Neither humanities nor social scienc
Seed funding from an outside agency 62.0% 76.9% 81.6%
Seed funding from home institutions 78.9% 42.3% 64.9%
Organizational incentives within your institution 63.2% 45.8% 57.7%
Collaboration 97.3% 81.5% 90.5%
Observation of successful projects in other areas 63.2% 54.2% 67.1%
The computational requirements of your research 50.0% 45.8% 63.5%
Contribution to interesting research expected 86.5% 73.1% 85.5%
Support for teaching activities 51.4% 48.1% 43.9%
Emerging standardization of available tools 60.5% 56.0% 58.9% Source: AVROSS WP2 survey.
Table 3.23: Catalysts for e-Infrastructure adoption by discipline in the project and location of the collaborators of the respondent (respondents who considered this catalyst as important in % of all respondents)
Humanities Social Sciences Neither humanities nor social sciences
Catalysts Local Non-local Local Non-local Local Non-localSeed funding from an outside agency
100% 84.4% 66.7% 78.3% 86.7% 84.7%
Seed funding from home inst. 75% 78.8% 66.7% 39.1% 58.3% 65.5% Organizational incentives within your institution
50% 63.6% 66.7% 42.9% 50.0% 60.3%
Collaboration 75% 100% 66.7% 83.3% 92.8% 93.4% Observation of successful projects in other areas 75% 60.6% 0% 61.9% 72.7% 67.9%
The computational requirements of your research
25% 53.1% 66.7% 42.9% 60.0% 75.4%
Contribution to interesting research expected
100% 84.8% 66.7% 73.9% 100.0% 93.0%
Support for teaching activities 75% 46.9% 33.3% 50.0% 30.8% 42.9% Emerging standardization of available tools
100% 54.5% 33.3% 59.1% 61.5% 58.9%
Source: AVROSS WP2 survey.
We can also examine the views of respondents about key catalysts by whether they adopted e-Infrastructure technologies before or after 2000 (early or late adopters). We report the results in Table 3.24. The results do not vary systematically by date of adoption or by discipline. Both early and late adopters report that collaboration is an important catalyst, regardless of their discipline, and identify initial seed funding as important.
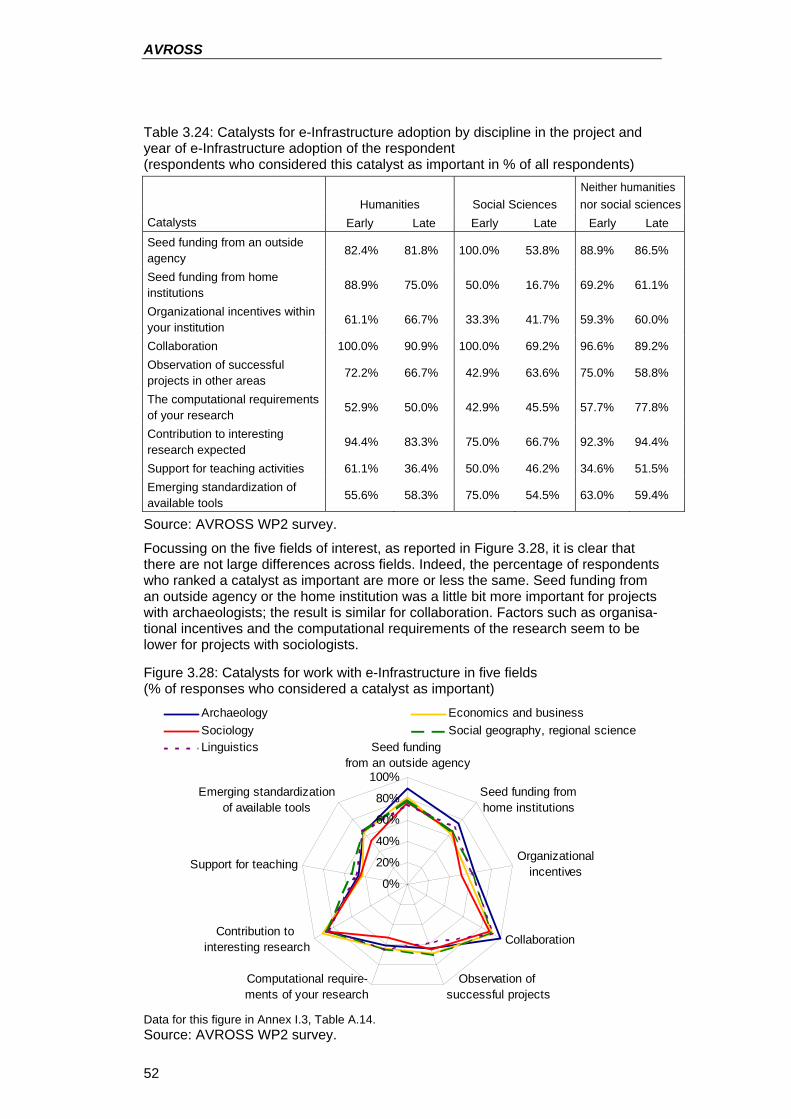
AVROSS
52
Table 3.24: Catalysts for e-Infrastructure adoption by discipline in the project and year of e-Infrastructure adoption of the respondent (respondents who considered this catalyst as important in % of all respondents)
Humanities Social Sciences Neither humanities nor social sciences
Catalysts Early Late Early Late Early Late Seed funding from an outside agency
82.4% 81.8% 100.0% 53.8% 88.9% 86.5%
Seed funding from home institutions 88.9% 75.0% 50.0% 16.7% 69.2% 61.1%
Organizational incentives within your institution
61.1% 66.7% 33.3% 41.7% 59.3% 60.0%
Collaboration 100.0% 90.9% 100.0% 69.2% 96.6% 89.2% Observation of successful projects in other areas 72.2% 66.7% 42.9% 63.6% 75.0% 58.8%
The computational requirements of your research
52.9% 50.0% 42.9% 45.5% 57.7% 77.8%
Contribution to interesting research expected
94.4% 83.3% 75.0% 66.7% 92.3% 94.4%
Support for teaching activities 61.1% 36.4% 50.0% 46.2% 34.6% 51.5% Emerging standardization of available tools
55.6% 58.3% 75.0% 54.5% 63.0% 59.4%
Source: AVROSS WP2 survey.
Focussing on the five fields of interest, as reported in Figure 3.28, it is clear that there are not large differences across fields. Indeed, the percentage of respondents who ranked a catalyst as important are more or less the same. Seed funding from an outside agency or the home institution was a little bit more important for projects with archaeologists; the result is similar for collaboration. Factors such as organisa-tional incentives and the computational requirements of the research seem to be lower for projects with sociologists.
Figure 3.28: Catalysts for work with e-Infrastructure in five fields (% of responses who considered a catalyst as important)
0%
20%
40%
60%
80%
100%
Seed funding from an outside agency
Seed funding fromhome institutions
Organizationalincentives
Collaboration
Observation of successful projects
Computational require-ments of your research
Contribution to interesting research
Support for teaching
Emerging standardizationof available tools
Archaeology Economics and businessSociology Social geography, regional scienceLinguistics
Data for this figure in Annex I.3, Table A.14. Source: AVROSS WP2 survey.
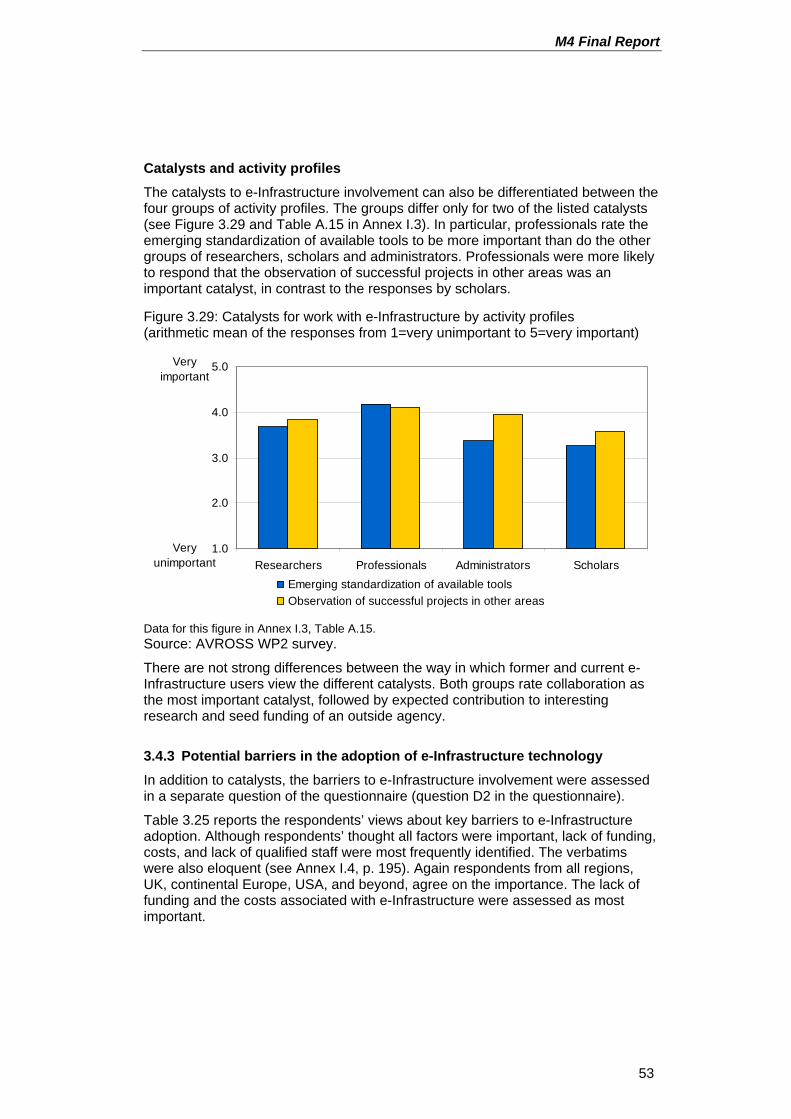
M4 Final Report
53
Catalysts and activity profiles The catalysts to e-Infrastructure involvement can also be differentiated between the four groups of activity profiles. The groups differ only for two of the listed catalysts (see Figure 3.29 and Table A.15 in Annex I.3). In particular, professionals rate the emerging standardization of available tools to be more important than do the other groups of researchers, scholars and administrators. Professionals were more likely to respond that the observation of successful projects in other areas was an important catalyst, in contrast to the responses by scholars.
Figure 3.29: Catalysts for work with e-Infrastructure by activity profiles (arithmetic mean of the responses from 1=very unimportant to 5=very important)
1.0
2.0
3.0
4.0
5.0
Researchers Professionals Administrators ScholarsEmerging standardization of available toolsObservation of successful projects in other areas
Very unimportant
Very important
Data for this figure in Annex I.3, Table A.15. Source: AVROSS WP2 survey.
There are not strong differences between the way in which former and current e-Infrastructure users view the different catalysts. Both groups rate collaboration as the most important catalyst, followed by expected contribution to interesting research and seed funding of an outside agency.
3.4.3 Potential barriers in the adoption of e-Infrastructure technology In addition to catalysts, the barriers to e-Infrastructure involvement were assessed in a separate question of the questionnaire (question D2 in the questionnaire).
Table 3.25 reports the respondents’ views about key barriers to e-Infrastructure adoption. Although respondents’ thought all factors were important, lack of funding, costs, and lack of qualified staff were most frequently identified. The verbatims were also eloquent (see Annex I.4, p. 195). Again respondents from all regions, UK, continental Europe, USA, and beyond, agree on the importance. The lack of funding and the costs associated with e-Infrastructure were assessed as most important.
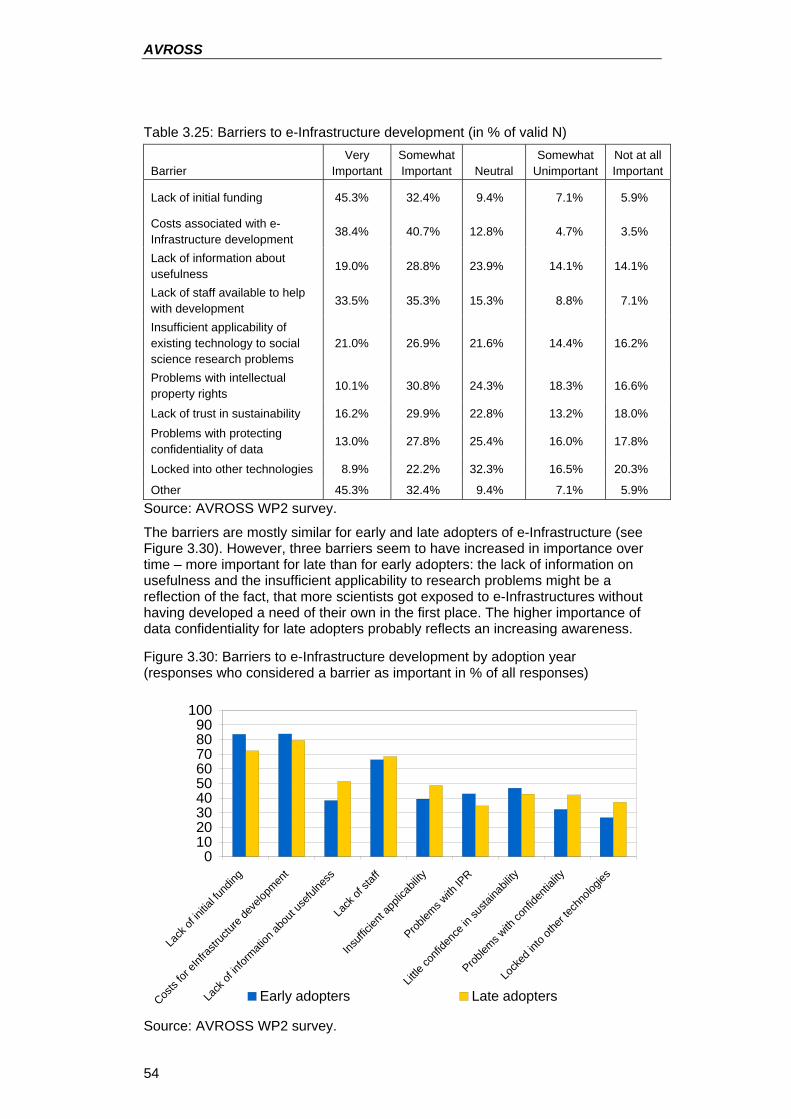
AVROSS
54
Table 3.25: Barriers to e-Infrastructure development (in % of valid N)
Barrier Very
Important Somewhat Important Neutral
Somewhat Unimportant
Not at all Important
Lack of initial funding 45.3% 32.4% 9.4% 7.1% 5.9%
Costs associated with e-Infrastructure development 38.4% 40.7% 12.8% 4.7% 3.5%
Lack of information about usefulness
19.0% 28.8% 23.9% 14.1% 14.1%
Lack of staff available to help with development
33.5% 35.3% 15.3% 8.8% 7.1%
Insufficient applicability of existing technology to social science research problems
21.0% 26.9% 21.6% 14.4% 16.2%
Problems with intellectual property rights
10.1% 30.8% 24.3% 18.3% 16.6%
Lack of trust in sustainability 16.2% 29.9% 22.8% 13.2% 18.0% Problems with protecting confidentiality of data
13.0% 27.8% 25.4% 16.0% 17.8%
Locked into other technologies 8.9% 22.2% 32.3% 16.5% 20.3%
Other 45.3% 32.4% 9.4% 7.1% 5.9% Source: AVROSS WP2 survey.
The barriers are mostly similar for early and late adopters of e-Infrastructure (see Figure 3.30). However, three barriers seem to have increased in importance over time – more important for late than for early adopters: the lack of information on usefulness and the insufficient applicability to research problems might be a reflection of the fact, that more scientists got exposed to e-Infrastructures without having developed a need of their own in the first place. The higher importance of data confidentiality for late adopters probably reflects an increasing awareness.
Figure 3.30: Barriers to e-Infrastructure development by adoption year (responses who considered a barrier as important in % of all responses)
0102030405060708090
100
Lack
of in
itial fu
nding
Costs
for eI
nfras
tructu
re de
velop
ment
Lack
of in
formati
on ab
out u
seful
ness
Lack
of st
aff
Insuff
icient
appli
cabil
ity
Problem
s with
IPR
Little
confi
denc
e in s
ustai
nabil
ity
Problem
s with
confi
denti
ality
Lock
ed in
to oth
er tec
hnolo
gies
Early adopters Late adopters
Source: AVROSS WP2 survey.
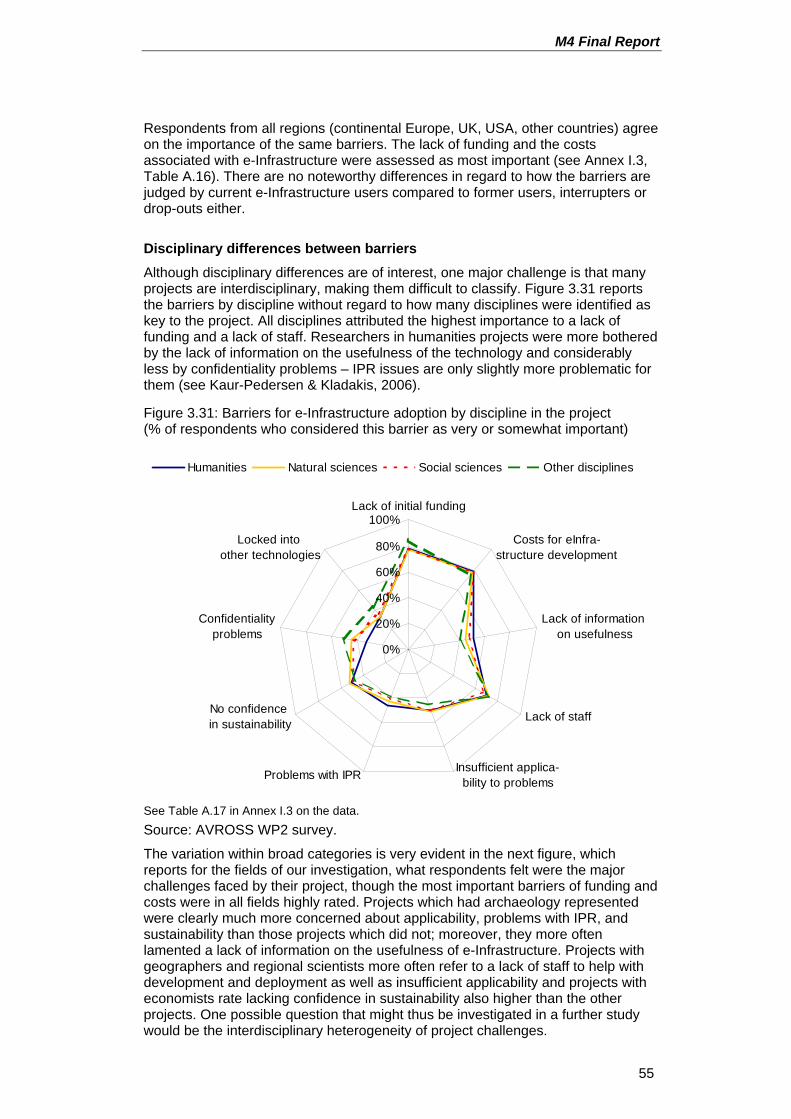
M4 Final Report
55
Respondents from all regions (continental Europe, UK, USA, other countries) agree on the importance of the same barriers. The lack of funding and the costs associated with e-Infrastructure were assessed as most important (see Annex I.3, Table A.16). There are no noteworthy differences in regard to how the barriers are judged by current e-Infrastructure users compared to former users, interrupters or drop-outs either.
Disciplinary differences between barriers Although disciplinary differences are of interest, one major challenge is that many projects are interdisciplinary, making them difficult to classify. Figure 3.31 reports the barriers by discipline without regard to how many disciplines were identified as key to the project. All disciplines attributed the highest importance to a lack of funding and a lack of staff. Researchers in humanities projects were more bothered by the lack of information on the usefulness of the technology and considerably less by confidentiality problems – IPR issues are only slightly more problematic for them (see Kaur-Pedersen & Kladakis, 2006).
Figure 3.31: Barriers for e-Infrastructure adoption by discipline in the project (% of respondents who considered this barrier as very or somewhat important)
0%
20%
40%
60%
80%
100%Lack of initial funding
Costs for eInfra-structure development
Lack of information on usefulness
Lack of staff
Insufficient applica-bility to problemsProblems with IPR
No confidence in sustainability
Confidentialityproblems
Locked into other technologies
Humanities Natural sciences Social sciences Other disciplines
See Table A.17 in Annex I.3 on the data. Source: AVROSS WP2 survey.
The variation within broad categories is very evident in the next figure, which reports for the fields of our investigation, what respondents felt were the major challenges faced by their project, though the most important barriers of funding and costs were in all fields highly rated. Projects which had archaeology represented were clearly much more concerned about applicability, problems with IPR, and sustainability than those projects which did not; moreover, they more often lamented a lack of information on the usefulness of e-Infrastructure. Projects with geographers and regional scientists more often refer to a lack of staff to help with development and deployment as well as insufficient applicability and projects with economists rate lacking confidence in sustainability also higher than the other projects. One possible question that might thus be investigated in a further study would be the interdisciplinary heterogeneity of project challenges.
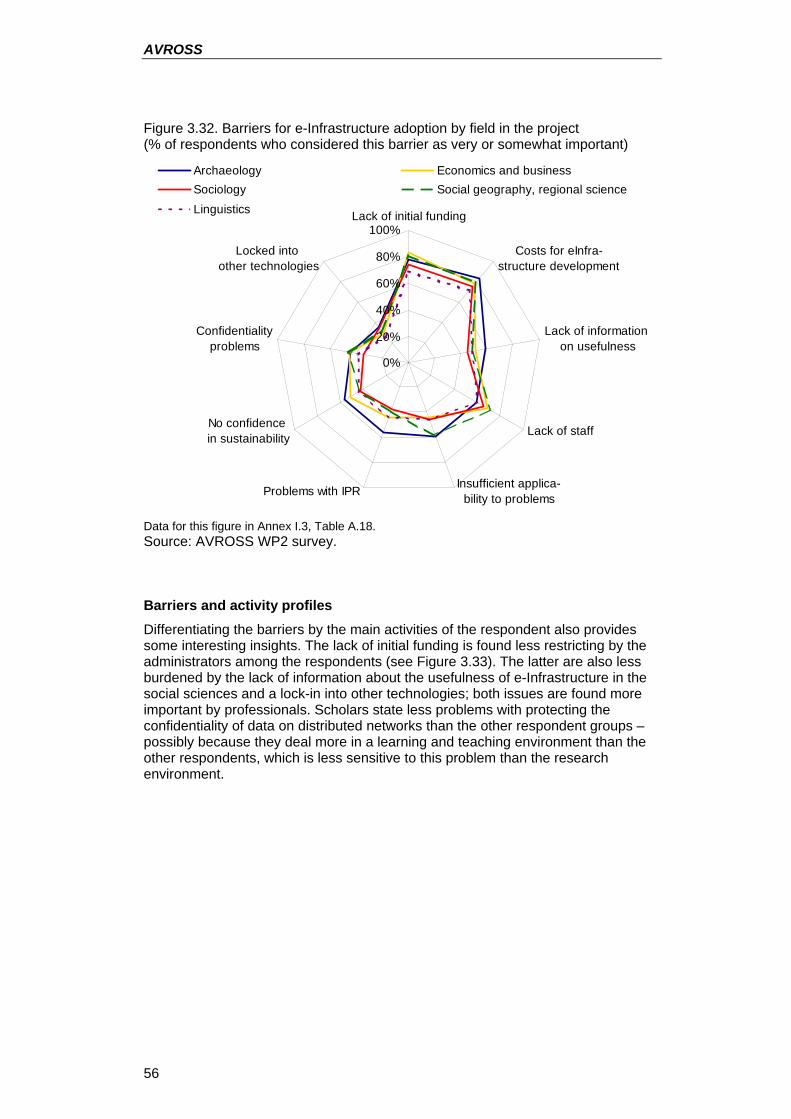
AVROSS
56
Figure 3.32. Barriers for e-Infrastructure adoption by field in the project (% of respondents who considered this barrier as very or somewhat important)
0%
20%
40%
60%
80%
100%Lack of initial funding
Costs for eInfra-structure development
Lack of information on usefulness
Lack of staff
Insufficient applica-bility to problemsProblems with IPR
No confidence in sustainability
Confidentialityproblems
Locked into other technologies
Archaeology Economics and businessSociology Social geography, regional scienceLinguistics
Data for this figure in Annex I.3, Table A.18. Source: AVROSS WP2 survey.
Barriers and activity profiles Differentiating the barriers by the main activities of the respondent also provides some interesting insights. The lack of initial funding is found less restricting by the administrators among the respondents (see Figure 3.33). The latter are also less burdened by the lack of information about the usefulness of e-Infrastructure in the social sciences and a lock-in into other technologies; both issues are found more important by professionals. Scholars state less problems with protecting the confidentiality of data on distributed networks than the other respondent groups – possibly because they deal more in a learning and teaching environment than the other respondents, which is less sensitive to this problem than the research environment.
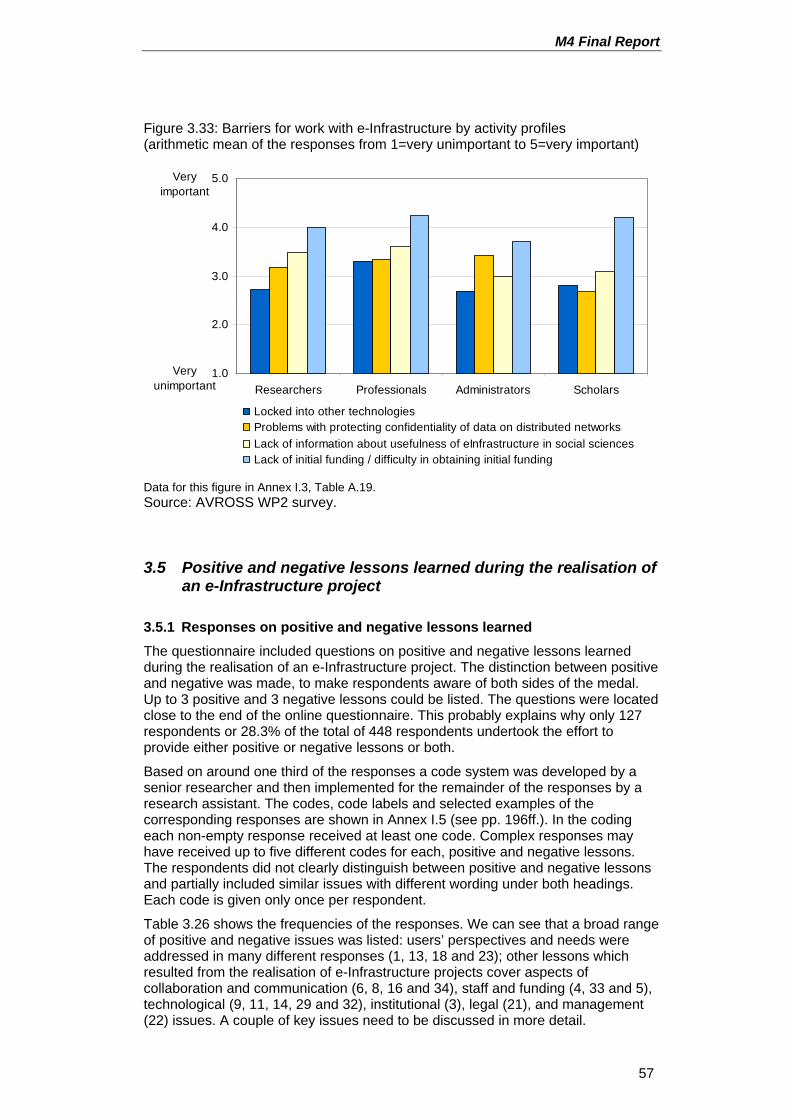
M4 Final Report
57
Figure 3.33: Barriers for work with e-Infrastructure by activity profiles (arithmetic mean of the responses from 1=very unimportant to 5=very important)
1.0
2.0
3.0
4.0
5.0
Researchers Professionals Administrators Scholars
Locked into other technologiesProblems with protecting confidentiality of data on distributed networksLack of information about usefulness of eInfrastructure in social sciencesLack of initial funding / difficulty in obtaining initial funding
Very unimportant
Very important
Data for this figure in Annex I.3, Table A.19. Source: AVROSS WP2 survey.
3.5 Positive and negative lessons learned during the realisation of an e-Infrastructure project
3.5.1 Responses on positive and negative lessons learned The questionnaire included questions on positive and negative lessons learned during the realisation of an e-Infrastructure project. The distinction between positive and negative was made, to make respondents aware of both sides of the medal. Up to 3 positive and 3 negative lessons could be listed. The questions were located close to the end of the online questionnaire. This probably explains why only 127 respondents or 28.3% of the total of 448 respondents undertook the effort to provide either positive or negative lessons or both.
Based on around one third of the responses a code system was developed by a senior researcher and then implemented for the remainder of the responses by a research assistant. The codes, code labels and selected examples of the corresponding responses are shown in Annex I.5 (see pp. 196ff.). In the coding each non-empty response received at least one code. Complex responses may have received up to five different codes for each, positive and negative lessons. The respondents did not clearly distinguish between positive and negative lessons and partially included similar issues with different wording under both headings. Each code is given only once per respondent.
Table 3.26 shows the frequencies of the responses. We can see that a broad range of positive and negative issues was listed: users’ perspectives and needs were addressed in many different responses (1, 13, 18 and 23); other lessons which resulted from the realisation of e-Infrastructure projects cover aspects of collaboration and communication (6, 8, 16 and 34), staff and funding (4, 33 and 5), technological (9, 11, 14, 29 and 32), institutional (3), legal (21), and management (22) issues. A couple of key issues need to be discussed in more detail.
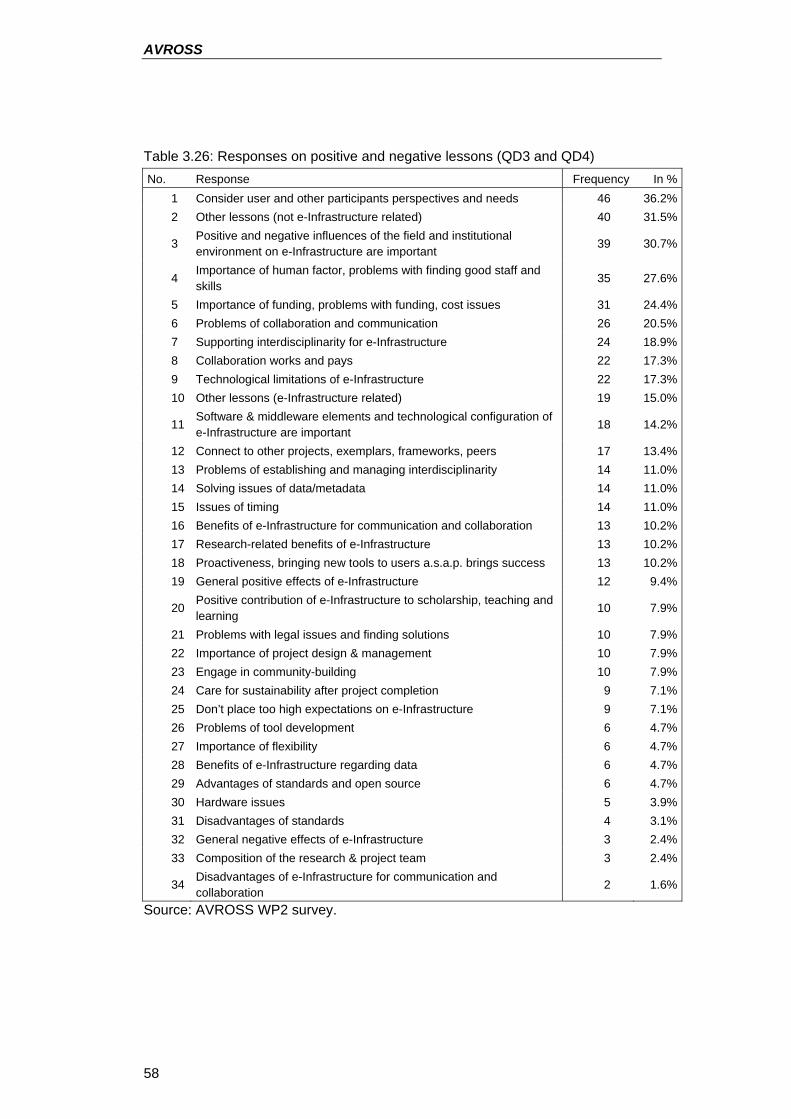
AVROSS
58
Table 3.26: Responses on positive and negative lessons (QD3 and QD4) No. Response Frequency In %
1 Consider user and other participants perspectives and needs 46 36.2%2 Other lessons (not e-Infrastructure related) 40 31.5%
3 Positive and negative influences of the field and institutional environment on e-Infrastructure are important 39 30.7%
4 Importance of human factor, problems with finding good staff and skills
35 27.6%
5 Importance of funding, problems with funding, cost issues 31 24.4%6 Problems of collaboration and communication 26 20.5%7 Supporting interdisciplinarity for e-Infrastructure 24 18.9%8 Collaboration works and pays 22 17.3%9 Technological limitations of e-Infrastructure 22 17.3%10 Other lessons (e-Infrastructure related) 19 15.0%
11 Software & middleware elements and technological configuration of e-Infrastructure are important
18 14.2%
12 Connect to other projects, exemplars, frameworks, peers 17 13.4%13 Problems of establishing and managing interdisciplinarity 14 11.0%14 Solving issues of data/metadata 14 11.0%15 Issues of timing 14 11.0%16 Benefits of e-Infrastructure for communication and collaboration 13 10.2%17 Research-related benefits of e-Infrastructure 13 10.2%18 Proactiveness, bringing new tools to users a.s.a.p. brings success 13 10.2%19 General positive effects of e-Infrastructure 12 9.4%
20 Positive contribution of e-Infrastructure to scholarship, teaching and learning
10 7.9%
21 Problems with legal issues and finding solutions 10 7.9%22 Importance of project design & management 10 7.9%23 Engage in community-building 10 7.9%24 Care for sustainability after project completion 9 7.1%25 Don’t place too high expectations on e-Infrastructure 9 7.1%26 Problems of tool development 6 4.7%27 Importance of flexibility 6 4.7%28 Benefits of e-Infrastructure regarding data 6 4.7%29 Advantages of standards and open source 6 4.7%30 Hardware issues 5 3.9%31 Disadvantages of standards 4 3.1%32 General negative effects of e-Infrastructure 3 2.4%33 Composition of the research & project team 3 2.4%
34 Disadvantages of e-Infrastructure for communication and collaboration
2 1.6%
Source: AVROSS WP2 survey.
M4 Final Report
59
1. Interaction with users and other stakeholders. Forty-six out of the 127 respondents mentioned the necessity and benefits of taking users’ and other stakeholders’ perspectives and needs into account. Adding the 14 responses that mention problems of interdisciplinarity (no. 13) (which frequently also evolve from the cooperation of computer scientists and lead users), those that stress the necessity of community building (no. 23) and early user feedback (no. 18), we obtain more than half of the respondents stressing the key role of the users in e-Infrastructure development and deployment. The following quotes from the responses illustrate this:
“Keep users involved in all stages and find 'champions' among domain scientists”
“Leadership must come from members of the domain community (e.g., a humanities or social science faculty member) -- and not from a computer or computational scientist. Relying on CI centers (e.g., NCSA or SDSC) only engenders "learned helplessness." It is better to adopt less ambitious technology that can be controlled/customized by humanities/social scientist users then to depend on the latest thing from the centers (which produces a state of dependency).”
“Keep it practical and applied. Developing a tool is applied work for the community, it is NOT your ticket to a long ride on the academic granting gravy train. People who use these programs to advance their academic career rather than produce robust tools in a timely manner are destroying some schemes. Equally, technologists who have little idea about what researchers need are responsible for many expensive projects which are never used.”
“Don't wait for the tool to be "perfect" - get using it for research as soon as possible because the development of the tool should obviously be in the context of particular research projects. The tool is useless if it isn't being used to generate research outcomes that are being published in respected social science journals.”
Second in frequency are responses who mention general positive or negative issues which are not e-Infrastructure-related (see Annex I.5 for examples).
2. Influences of the institutional and scientific environment. Around 30 percent of the respondents who answered the lessons questions highlighted the contribution of their environment to realising e-Infrastructure projects. This environment consists of the local institution and the services that it provides, but also of the research field that supports or discourages R&D on e-Infrastructure and funding agencies who accept or reject project proposals. Some quotes may again illustrate this issue:
“Tool development is not particularly well-regarded within the social sciences - embarking on tool development is a risky career move, but I expect (and hope) that it can payoff bigtime if the tools become widely used. But a safer career move for a social scientist who can code is probably to just use the code purely to support his/her own research activities and write papers. A further problem with tool development in the social sciences (if you are also pursuing an academic career) is that you can be pigeon-holed as a "technician" or technical support officer for your non-technical social science colleagues who are going to be using the tools. …”
“Senior leaders in most fields tend to look backward and value the modes of inquiry that shaped their own thinking while in graduate school.”
“Working in relative isolation on national scale. This technology is still perceived as "futuristic" and "putting new barriers (meta data) between
AVROSS
60
researchers and their data"- No joke- almost verbatim quote of leading decision makers is social science infrastructure questions.”
“Keep the work secret from local IT staff and institution administration, especially IP services. They will obstruct.”
“Lack of interest in developing humanities based digital projects on the part of administrators and colleagues at my home institution.”
3. Issues of staff and funding. These were also given high priority. One respondent, for instance, formulated an appeal for the funding of staff:
“Fund staff!! Applied projects which succeed best have paid committed staff. In Social Sciences, there are many social and methodological issues which are barriers to using even the current data networking technologies for research. We need recurrent funding for research assistants to engage with the research community and foster new ideas. We also need recurrent funding for archivists to help researchers use the technology. Equipment without the staff and expertise to run it is wasted.”
Others stressed the importance of leadership, of being able to bridge the differences between computer science and domain sciences through multidisciplinary individuals or teams, and the necessity of being patient to allow for training and capacity-building of scientists. Budgetary issues referred to problems of obtaining long-term funding, inflexibility in managing funds and larger development costs than expected among others.
4. Cross-disciplinary collaboration and communication. Around 20% of the respondents who answered the questions on lessons learned reported positive effects of an interdisciplinary approach (no. 7 in the table) and12% stated problems in this regard (no. 13). In most cases the statements refer to the collaboration and communication between computer scientists and domain scientists, exemplified by the following two quotes:
“Collaboration between social and computer scientists IS possible. Communication barriers can be overcome.”
“Communication barriers between social and computer scientists are very high. Significant amount of time is needed to get to a common understanding of the issues.”
In the same vein, problems of managing collaboration in general were mentioned by many of the respondents. A recent case study on a meteorological e-Infrastructure project in the US shows that divergent agendas, multiple needs, interinstitutional and interdisciplinary communication problems and tensions are not specific to collaborations between social scientists and computer scientists, but rather a general feature in e-Infrastructure development (Lawrence, 2006).
Some, however, stressed explicitly the potentials of e-Infrastructures to make collaborations work:
“Collaboration is enhanced by eInfrastructure and better collaboration produces better scholarship.”
“Data storage and repositories are given disproportionately high attention (e.g., the ACLS report) relative to collaboration tools and e-learning when talking about CI and the humanities/social sciences. The greatest success stories involve tools for communication and collaboration (e.g., email) - and efforts to improve and deploy collaboration tools should not be neglected.”
5. Technological limitations of e-Infrastructure. The latter were frequently cited among the negative lessons learned throughout working with e-Infrastructure. They
M4 Final Report
61
address the service models of computing services that are not in line with humanities’ and social sciences’ needs (see quote below) or the reliability and user-friendliness of the technology.
“The content disciplines (arts and humanities) have significant high-performance computing needs as we move the evidence we use online. The future is not in grand challenge computing but in content rich computing. Look at Flickr, YouTube, FaceBook ... they don't solve grand challenges, just as most researchers don't think in terms of Big Challenges that can be solved by the 1960s batch processing service model common in most supercomputing outfits. Content scientists work iteratively and need web accessible computing that is much closer to Web 2.0 types of services than the classic supercomputer model.”
Having this in mind, it is logically consistent that several respondents suggest large flexibility of the technical solutions (no. 27), openness to software revisions (no. 11) and that they stress the importance of information exchange across projects, monitoring of the results of pilot projects and information exchange in the peer community of e-Infrastructure (no. 12):
“Be open to major revisions in the development approach (e.g. types of software being used) - I shifted from a "proper" desktop environment built using Qt which had nice OpenGL visualisations etc to a web-based application environment (built using PhP etc) and I've never looked back because web-based tools are fantastic for supporting collaboration. It was a lot of work making the shift from Qt to PHP/javascript/AJAX, but worthwhile.”
“Use of robust software and standards with multiple implementations versus the latest research code, newly minted standards (while being aware of them...) is critical to avoiding lock-in to specific research projects.”
“Attend as many conferences/seminars as possible where tool development is the focus - several of the big developments in the … project came about from hearing about a new piece of software or approach.”
“Innovation is not always a completely new idea - it includes taking something from one area to another, or putting two things together in a new way.”
The latter statements reflect the results of a recent NSF workshop on e-Infrastructure. One of this workshop’s recommendations to policy makers centre on the comparison and information exchange across projects (and different scientific domains and countries) to enhance technology transfer and linkage of local projects into an interconnected network (Edwards et al., 2007, pp. 39-40).
6. General issues. Of interest from a policy perspective are also the responses on the general (no. 19) and research-related (no. 17) benefits of e-Infrastructure, as well as on the contribution of e-Infrastructure to scholarship, teaching and learning (no. 20):
“Research in this field "ICT for social science data service" has good impacts on further methodology developments. More research is needed.”
“The DBG can help scholars tap into the potential of networked, relational, and object-oriented processes for the generation of new genres of research and expression. Such scholarship has the potential to push the work of humanities beyond the current silos it tends to inhabit, offering up other models of what the scholar is or could be in
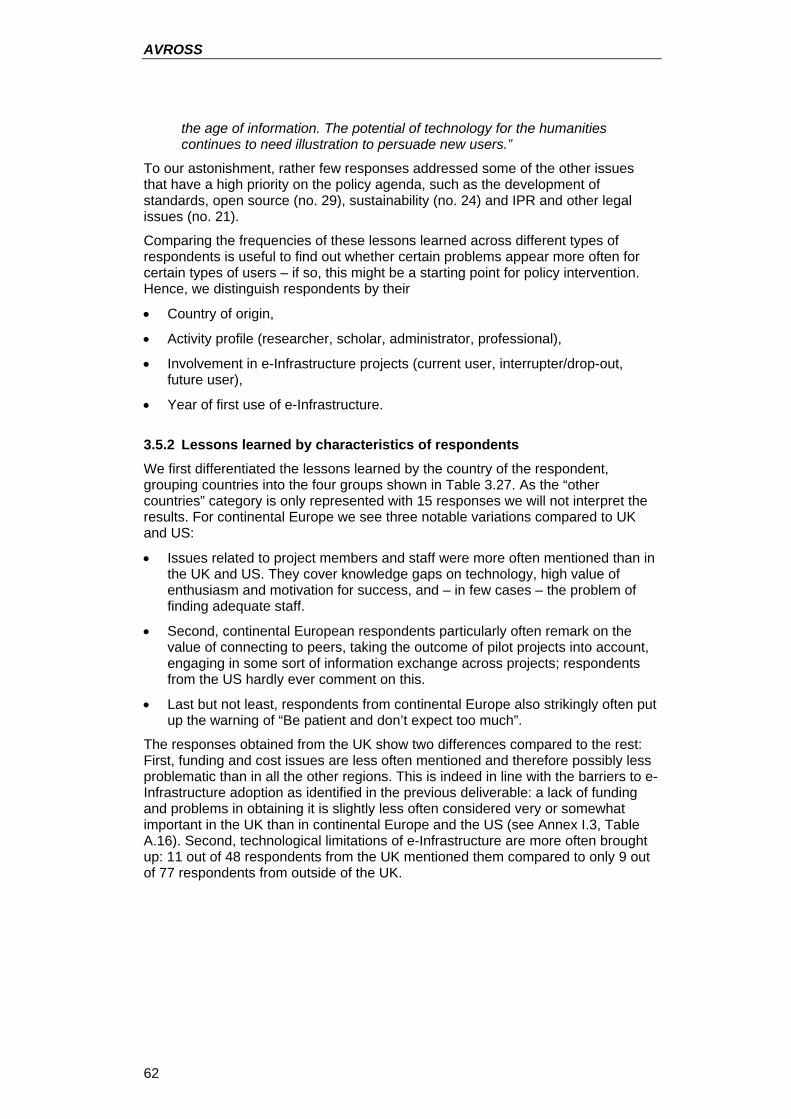
AVROSS
62
the age of information. The potential of technology for the humanities continues to need illustration to persuade new users.”
To our astonishment, rather few responses addressed some of the other issues that have a high priority on the policy agenda, such as the development of standards, open source (no. 29), sustainability (no. 24) and IPR and other legal issues (no. 21).
Comparing the frequencies of these lessons learned across different types of respondents is useful to find out whether certain problems appear more often for certain types of users – if so, this might be a starting point for policy intervention. Hence, we distinguish respondents by their
• Country of origin,
• Activity profile (researcher, scholar, administrator, professional),
• Involvement in e-Infrastructure projects (current user, interrupter/drop-out, future user),
• Year of first use of e-Infrastructure.
3.5.2 Lessons learned by characteristics of respondents We first differentiated the lessons learned by the country of the respondent, grouping countries into the four groups shown in Table 3.27. As the “other countries” category is only represented with 15 responses we will not interpret the results. For continental Europe we see three notable variations compared to UK and US:
• Issues related to project members and staff were more often mentioned than in the UK and US. They cover knowledge gaps on technology, high value of enthusiasm and motivation for success, and – in few cases – the problem of finding adequate staff.
• Second, continental European respondents particularly often remark on the value of connecting to peers, taking the outcome of pilot projects into account, engaging in some sort of information exchange across projects; respondents from the US hardly ever comment on this.
• Last but not least, respondents from continental Europe also strikingly often put up the warning of “Be patient and don’t expect too much”.
The responses obtained from the UK show two differences compared to the rest: First, funding and cost issues are less often mentioned and therefore possibly less problematic than in all the other regions. This is indeed in line with the barriers to e-Infrastructure adoption as identified in the previous deliverable: a lack of funding and problems in obtaining it is slightly less often considered very or somewhat important in the UK than in continental Europe and the US (see Annex I.3, Table A.16). Second, technological limitations of e-Infrastructure are more often brought up: 11 out of 48 respondents from the UK mentioned them compared to only 9 out of 77 respondents from outside of the UK.
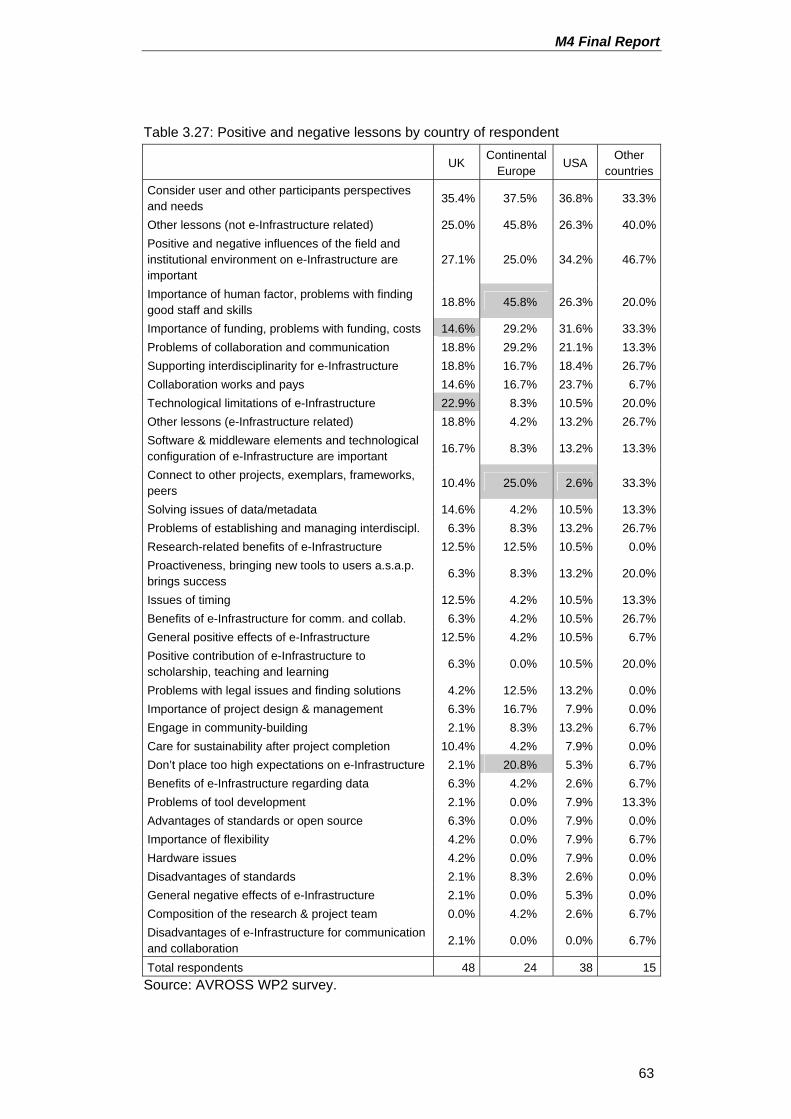
M4 Final Report
63
Table 3.27: Positive and negative lessons by country of respondent
UK Continental
Europe USA
Other countries
Consider user and other participants perspectives and needs 35.4% 37.5% 36.8% 33.3%
Other lessons (not e-Infrastructure related) 25.0% 45.8% 26.3% 40.0%Positive and negative influences of the field and institutional environment on e-Infrastructure are important
27.1% 25.0% 34.2% 46.7%
Importance of human factor, problems with finding good staff and skills
18.8% 45.8% 26.3% 20.0%
Importance of funding, problems with funding, costs 14.6% 29.2% 31.6% 33.3%Problems of collaboration and communication 18.8% 29.2% 21.1% 13.3%Supporting interdisciplinarity for e-Infrastructure 18.8% 16.7% 18.4% 26.7%Collaboration works and pays 14.6% 16.7% 23.7% 6.7%Technological limitations of e-Infrastructure 22.9% 8.3% 10.5% 20.0%Other lessons (e-Infrastructure related) 18.8% 4.2% 13.2% 26.7%Software & middleware elements and technological configuration of e-Infrastructure are important
16.7% 8.3% 13.2% 13.3%
Connect to other projects, exemplars, frameworks, peers 10.4% 25.0% 2.6% 33.3%
Solving issues of data/metadata 14.6% 4.2% 10.5% 13.3%Problems of establishing and managing interdiscipl. 6.3% 8.3% 13.2% 26.7%Research-related benefits of e-Infrastructure 12.5% 12.5% 10.5% 0.0%Proactiveness, bringing new tools to users a.s.a.p. brings success
6.3% 8.3% 13.2% 20.0%
Issues of timing 12.5% 4.2% 10.5% 13.3%Benefits of e-Infrastructure for comm. and collab. 6.3% 4.2% 10.5% 26.7%General positive effects of e-Infrastructure 12.5% 4.2% 10.5% 6.7%Positive contribution of e-Infrastructure to scholarship, teaching and learning
6.3% 0.0% 10.5% 20.0%
Problems with legal issues and finding solutions 4.2% 12.5% 13.2% 0.0%Importance of project design & management 6.3% 16.7% 7.9% 0.0%Engage in community-building 2.1% 8.3% 13.2% 6.7%Care for sustainability after project completion 10.4% 4.2% 7.9% 0.0%Don’t place too high expectations on e-Infrastructure 2.1% 20.8% 5.3% 6.7%Benefits of e-Infrastructure regarding data 6.3% 4.2% 2.6% 6.7%Problems of tool development 2.1% 0.0% 7.9% 13.3%Advantages of standards or open source 6.3% 0.0% 7.9% 0.0%Importance of flexibility 4.2% 0.0% 7.9% 6.7%Hardware issues 4.2% 0.0% 7.9% 0.0%Disadvantages of standards 2.1% 8.3% 2.6% 0.0%General negative effects of e-Infrastructure 2.1% 0.0% 5.3% 0.0%Composition of the research & project team 0.0% 4.2% 2.6% 6.7%Disadvantages of e-Infrastructure for communication and collaboration
2.1% 0.0% 0.0% 6.7%
Total respondents 48 24 38 15Source: AVROSS WP2 survey.
AVROSS
64
Another distinctive characteristic of the respondents is their activity profile, i.e. whether they are mainly doing research (“Researchers”), are engaged in professional work (“Professionals”), mainly administrate (“Administrators”) or are more or less to the same extent involved in research and teaching (“Scholars”). Again, we note some particularities for each group (except for professionals due to the small number of cases).
• Probably because of their position in the hierarchy researchers are less often affected by funding and staff issues and they mention rarely benefits of e-Infrastructure for communication and collaboration (see Table 3.28).
• Administrators on the other hand pointed more often to the latter benefits. They also mentioned more frequently the necessity and benefits of involving users and problems of solving issues of metadata and data. They less often wrote about the benefits or weaknesses of interdisciplinary work and they raise less often technical issues (technical limitations, software, standards, tool development etc.).
• Among the responses from scholars we see a smaller orientation towards the e-Infrastructure users (see also the low percentage of scholars’ projects with a user constituency in Table 3.18, p. 43). In contrast, scholars show more consideration for their research team and personnel.
The distribution of respondents on user groups is unfortunately not very even and we have only 15 interrupters/drop-outs and 10 future users of e-Infrastructure in the dataset who provided an answer on these questions on lessons learned (see Table 3.29). It is not intuitive to add up the data for these two user groups either, hence we will make cautious interpretations of the most striking differences only.
A large majority of the respondents are current users. Two differences to the other two groups appear:
• First, the benefits of collaborating and communicating are stressed, and interdisciplinary work with scientists in other fields is not considered as particularly problematic.
• Second, benefits of e-Infrastructure for collaboration are not stated very often.
One of the notable differences between current users and interrupters and drop-outs is that the latter mentioned less often problems of costs and funding, though a lack of sustainable funding was actually the most important reason for stopping the participation in humanities or social science e-Infrastructure projects (see Table 3.4, p. 23). However, as we had expected, drop-outs more often mentioned problems (e.g. technological limitations and of collaboration) and less often benefits of e-Infrastructure (e.g. for research and scholarship).
Future users should not have any experiences with e-Infrastructure and we presume that the 10 respondents of this category actually wrote about their expectations for the future rather than their past experiences. Hence, we see that they might underestimate the problems of collaboration and communication which are more often addressed by more experienced e-Infrastructure users. In addition, they see particular contributions to scholarship, teaching and learning.
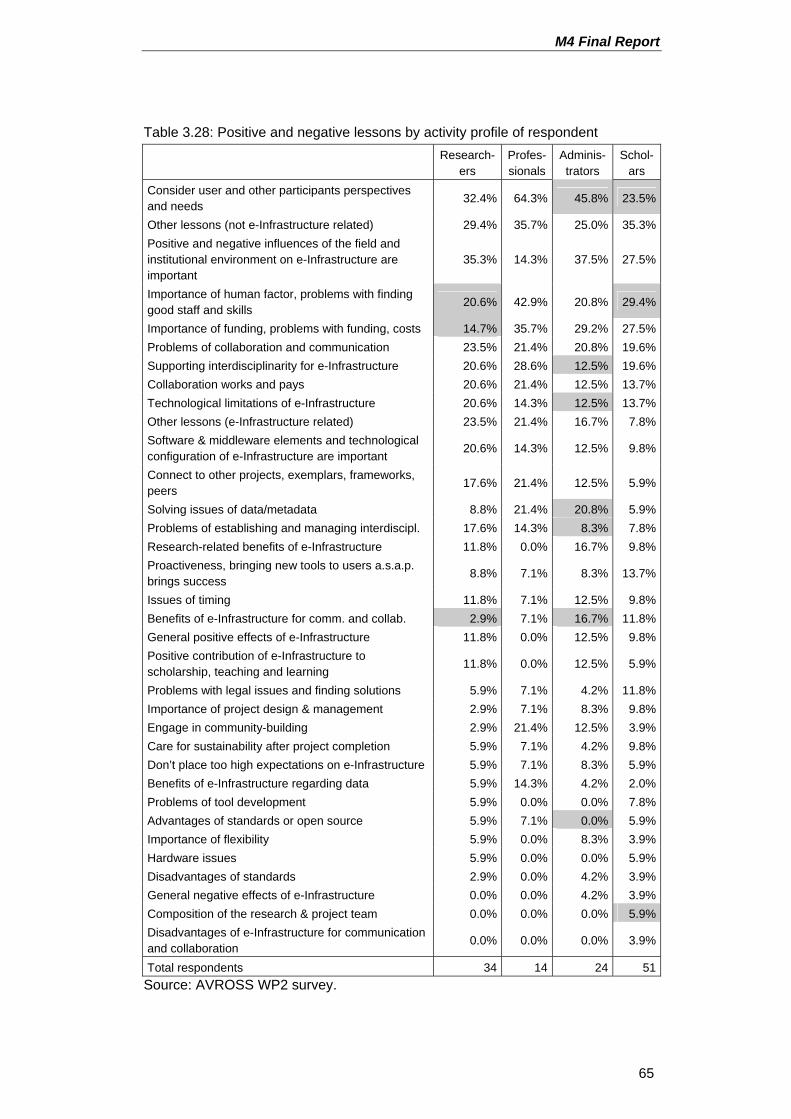
M4 Final Report
65
Table 3.28: Positive and negative lessons by activity profile of respondent
Research-
ers Profes-sionals
Adminis-trators
Schol-ars
Consider user and other participants perspectives and needs 32.4% 64.3% 45.8% 23.5%
Other lessons (not e-Infrastructure related) 29.4% 35.7% 25.0% 35.3%Positive and negative influences of the field and institutional environment on e-Infrastructure are important
35.3% 14.3% 37.5% 27.5%
Importance of human factor, problems with finding good staff and skills
20.6% 42.9% 20.8% 29.4%
Importance of funding, problems with funding, costs 14.7% 35.7% 29.2% 27.5%Problems of collaboration and communication 23.5% 21.4% 20.8% 19.6%Supporting interdisciplinarity for e-Infrastructure 20.6% 28.6% 12.5% 19.6%Collaboration works and pays 20.6% 21.4% 12.5% 13.7%Technological limitations of e-Infrastructure 20.6% 14.3% 12.5% 13.7%Other lessons (e-Infrastructure related) 23.5% 21.4% 16.7% 7.8%Software & middleware elements and technological configuration of e-Infrastructure are important
20.6% 14.3% 12.5% 9.8%
Connect to other projects, exemplars, frameworks, peers 17.6% 21.4% 12.5% 5.9%
Solving issues of data/metadata 8.8% 21.4% 20.8% 5.9%Problems of establishing and managing interdiscipl. 17.6% 14.3% 8.3% 7.8%Research-related benefits of e-Infrastructure 11.8% 0.0% 16.7% 9.8%Proactiveness, bringing new tools to users a.s.a.p. brings success
8.8% 7.1% 8.3% 13.7%
Issues of timing 11.8% 7.1% 12.5% 9.8%Benefits of e-Infrastructure for comm. and collab. 2.9% 7.1% 16.7% 11.8%General positive effects of e-Infrastructure 11.8% 0.0% 12.5% 9.8%Positive contribution of e-Infrastructure to scholarship, teaching and learning
11.8% 0.0% 12.5% 5.9%
Problems with legal issues and finding solutions 5.9% 7.1% 4.2% 11.8%Importance of project design & management 2.9% 7.1% 8.3% 9.8%Engage in community-building 2.9% 21.4% 12.5% 3.9%Care for sustainability after project completion 5.9% 7.1% 4.2% 9.8%Don’t place too high expectations on e-Infrastructure 5.9% 7.1% 8.3% 5.9%Benefits of e-Infrastructure regarding data 5.9% 14.3% 4.2% 2.0%Problems of tool development 5.9% 0.0% 0.0% 7.8%Advantages of standards or open source 5.9% 7.1% 0.0% 5.9%Importance of flexibility 5.9% 0.0% 8.3% 3.9%Hardware issues 5.9% 0.0% 0.0% 5.9%Disadvantages of standards 2.9% 0.0% 4.2% 3.9%General negative effects of e-Infrastructure 0.0% 0.0% 4.2% 3.9%Composition of the research & project team 0.0% 0.0% 0.0% 5.9%Disadvantages of e-Infrastructure for communication and collaboration
0.0% 0.0% 0.0% 3.9%
Total respondents 34 14 24 51Source: AVROSS WP2 survey.
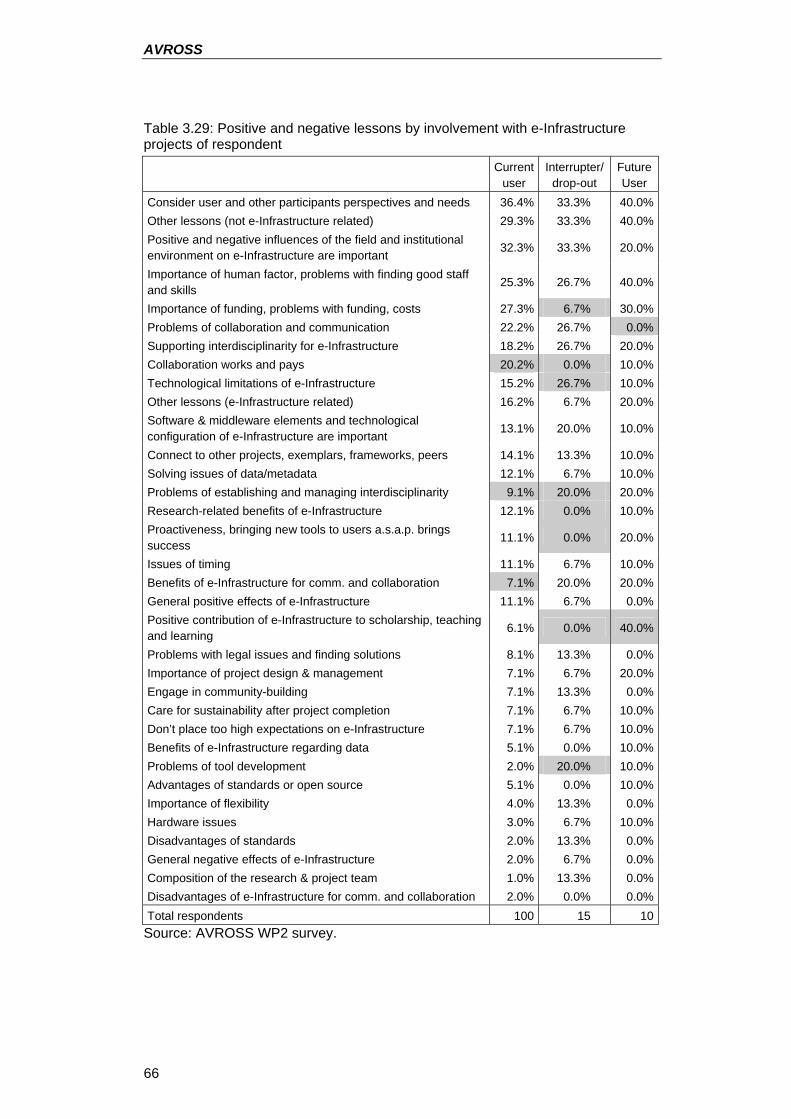
AVROSS
66
Table 3.29: Positive and negative lessons by involvement with e-Infrastructure projects of respondent
Current
user Interrupter/
drop-out Future User
Consider user and other participants perspectives and needs 36.4% 33.3% 40.0% Other lessons (not e-Infrastructure related) 29.3% 33.3% 40.0% Positive and negative influences of the field and institutional environment on e-Infrastructure are important 32.3% 33.3% 20.0%
Importance of human factor, problems with finding good staff and skills
25.3% 26.7% 40.0%
Importance of funding, problems with funding, costs 27.3% 6.7% 30.0% Problems of collaboration and communication 22.2% 26.7% 0.0% Supporting interdisciplinarity for e-Infrastructure 18.2% 26.7% 20.0% Collaboration works and pays 20.2% 0.0% 10.0% Technological limitations of e-Infrastructure 15.2% 26.7% 10.0% Other lessons (e-Infrastructure related) 16.2% 6.7% 20.0% Software & middleware elements and technological configuration of e-Infrastructure are important
13.1% 20.0% 10.0%
Connect to other projects, exemplars, frameworks, peers 14.1% 13.3% 10.0% Solving issues of data/metadata 12.1% 6.7% 10.0% Problems of establishing and managing interdisciplinarity 9.1% 20.0% 20.0% Research-related benefits of e-Infrastructure 12.1% 0.0% 10.0% Proactiveness, bringing new tools to users a.s.a.p. brings success
11.1% 0.0% 20.0%
Issues of timing 11.1% 6.7% 10.0% Benefits of e-Infrastructure for comm. and collaboration 7.1% 20.0% 20.0% General positive effects of e-Infrastructure 11.1% 6.7% 0.0% Positive contribution of e-Infrastructure to scholarship, teaching and learning
6.1% 0.0% 40.0%
Problems with legal issues and finding solutions 8.1% 13.3% 0.0% Importance of project design & management 7.1% 6.7% 20.0% Engage in community-building 7.1% 13.3% 0.0% Care for sustainability after project completion 7.1% 6.7% 10.0% Don’t place too high expectations on e-Infrastructure 7.1% 6.7% 10.0% Benefits of e-Infrastructure regarding data 5.1% 0.0% 10.0% Problems of tool development 2.0% 20.0% 10.0% Advantages of standards or open source 5.1% 0.0% 10.0% Importance of flexibility 4.0% 13.3% 0.0% Hardware issues 3.0% 6.7% 10.0% Disadvantages of standards 2.0% 13.3% 0.0% General negative effects of e-Infrastructure 2.0% 6.7% 0.0% Composition of the research & project team 1.0% 13.3% 0.0% Disadvantages of e-Infrastructure for comm. and collaboration 2.0% 0.0% 0.0% Total respondents 100 15 10 Source: AVROSS WP2 survey.
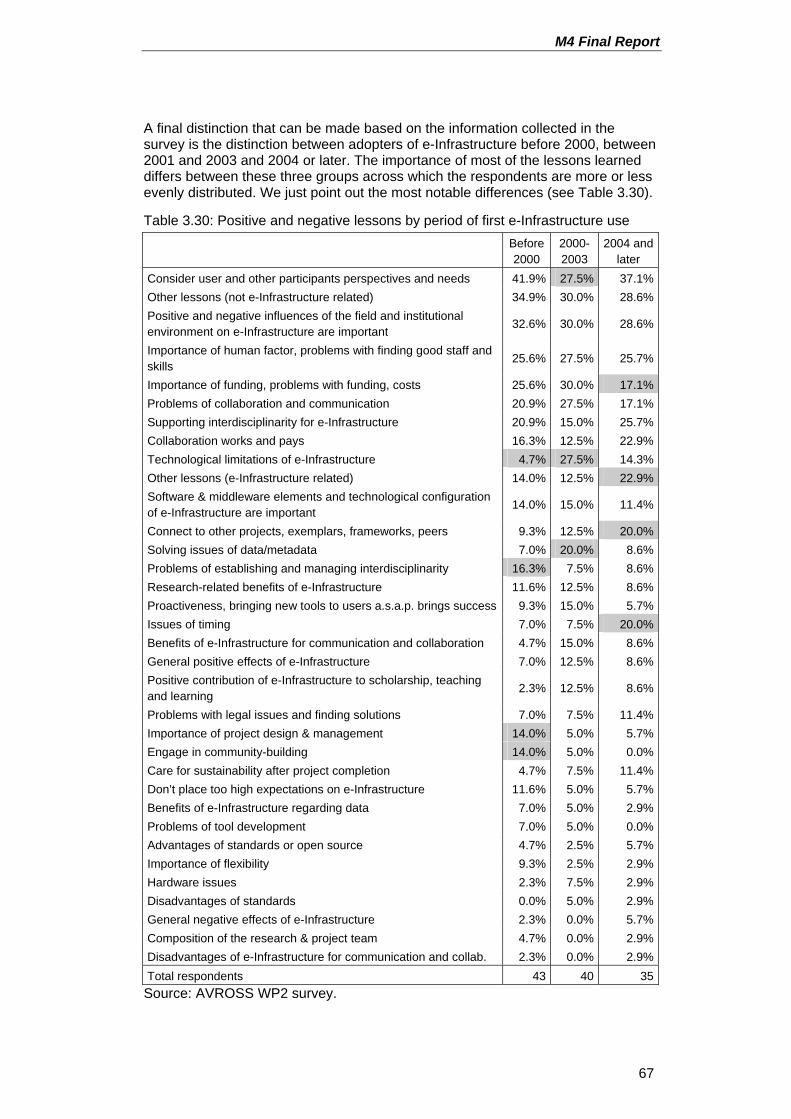
M4 Final Report
67
A final distinction that can be made based on the information collected in the survey is the distinction between adopters of e-Infrastructure before 2000, between 2001 and 2003 and 2004 or later. The importance of most of the lessons learned differs between these three groups across which the respondents are more or less evenly distributed. We just point out the most notable differences (see Table 3.30).
Table 3.30: Positive and negative lessons by period of first e-Infrastructure use
Before 2000
2000-2003
2004 and later
Consider user and other participants perspectives and needs 41.9% 27.5% 37.1% Other lessons (not e-Infrastructure related) 34.9% 30.0% 28.6% Positive and negative influences of the field and institutional environment on e-Infrastructure are important 32.6% 30.0% 28.6%
Importance of human factor, problems with finding good staff and skills
25.6% 27.5% 25.7%
Importance of funding, problems with funding, costs 25.6% 30.0% 17.1% Problems of collaboration and communication 20.9% 27.5% 17.1% Supporting interdisciplinarity for e-Infrastructure 20.9% 15.0% 25.7% Collaboration works and pays 16.3% 12.5% 22.9% Technological limitations of e-Infrastructure 4.7% 27.5% 14.3% Other lessons (e-Infrastructure related) 14.0% 12.5% 22.9% Software & middleware elements and technological configuration of e-Infrastructure are important
14.0% 15.0% 11.4%
Connect to other projects, exemplars, frameworks, peers 9.3% 12.5% 20.0% Solving issues of data/metadata 7.0% 20.0% 8.6% Problems of establishing and managing interdisciplinarity 16.3% 7.5% 8.6% Research-related benefits of e-Infrastructure 11.6% 12.5% 8.6% Proactiveness, bringing new tools to users a.s.a.p. brings success 9.3% 15.0% 5.7% Issues of timing 7.0% 7.5% 20.0% Benefits of e-Infrastructure for communication and collaboration 4.7% 15.0% 8.6% General positive effects of e-Infrastructure 7.0% 12.5% 8.6% Positive contribution of e-Infrastructure to scholarship, teaching and learning
2.3% 12.5% 8.6%
Problems with legal issues and finding solutions 7.0% 7.5% 11.4% Importance of project design & management 14.0% 5.0% 5.7% Engage in community-building 14.0% 5.0% 0.0% Care for sustainability after project completion 4.7% 7.5% 11.4% Don’t place too high expectations on e-Infrastructure 11.6% 5.0% 5.7% Benefits of e-Infrastructure regarding data 7.0% 5.0% 2.9% Problems of tool development 7.0% 5.0% 0.0% Advantages of standards or open source 4.7% 2.5% 5.7% Importance of flexibility 9.3% 2.5% 2.9% Hardware issues 2.3% 7.5% 2.9% Disadvantages of standards 0.0% 5.0% 2.9% General negative effects of e-Infrastructure 2.3% 0.0% 5.7% Composition of the research & project team 4.7% 0.0% 2.9% Disadvantages of e-Infrastructure for communication and collab. 2.3% 0.0% 2.9% Total respondents 43 40 35 Source: AVROSS WP2 survey.
AVROSS
68
Respondents who first started using e-Infrastructures in the middle period, 2000-2003, attribute somewhat less importance to the interaction with users. These respondents are more concerned of the technological limitations of e-Infrastructures and solving issues of data and metadata than the pre-2000 adopters. The latter are more concerned than the other respondents with interdisciplinarity, project design and management and community-building. Adopters from the last period 2004-2007 are less troubled by funding and cost issues, but they stress the connection to peers and other e-Infrastructure projects and more problems with development times.
“Need to build on existing exemplar work in community through awareness-raising, collaboration, training”
“Many technology solutions are already available. It is important to look for existing solutions before to redesign and implement what is needed to satisfy a specific requirement”
3.6 Summary The aim of this work-package was to provide a stocktaking of e-Infrastructure in the social sciences and humanities and in particular in the fields of archaeology, social and economic research, social geography and regional science and computational linguistics. We addressed this by surveying early adopters of e-Infrastructure and asking them to describe the types of projects that are currently in existence, in terms of a variety of factors: their size, composition, use of different e-Infrastructure features and outputs. We also asked them to identify what they considered to be barriers and catalysts to e-Infrastructure adoption.
In describing the results we summarized the core findings, and then examined the degree to which they differed by region, by discipline, by whether the respondents were primarily working with local collaborators (in these projects and beyond), by the activity profiles of the respondents, and whether the respondent was an early or late adopter of e-Infrastructure. We found substantial heterogeneity in all of these dimensions and there are several striking findings. First, although there is clearly heterogeneity across projects in terms of country of origin, size, discipline, project structure and staffing, and outcomes, there appears to be consensus about the key catalysts and key barriers to e-Infrastructure adoption. The key barriers are consistently identified as lack of funding, costs, and lack of qualified staff. The key catalysts are clearly seed funding, collaboration, and interesting research. Second, the ability of a project to connect to a user community appears to be easier when that discipline is also represented in a project. This is consistent with the focus by funding agencies on fostering interdisciplinary projects. Third, the respondents clearly identified the influence of other scientists as an information source – suggesting that getting highly visible scientists to adopt e-Infrastructure will be an important mechanism in generating widespread adoption.
Some further details on the e-Infrastructure projects, adoption in general and lessons learned are worth noting.
3.6.1 e-Infrastructure projects We found that research foundations and councils were the dominant source of funding across the board. The median project was initially funded at just over 335,000 Euros; the median annual budget was just over 122,000 Euros. The projects in continental Europe and the USA are larger than projects in the UK, both with respect to funding and staff. Scholars were more likely to be involved with small projects; these are also the ones with the proportionally highest scientific personnel input. Professionals appear to more involved with application-oriented projects, whereas projects described by researchers and scholars are stronger in
M4 Final Report
69
the science dimension. The administrators’ projects seem to integrate both, science orientation and user focus.
The most frequently used e-Infrastructure items included communication and collaboration tools, as well as distributed data, and required high band width. High performance computing, which is a feature of other sciences, was not as important, nor were the innovative data collection methods. Some level of variation was visible by country of the project: learning environments and virtual/3D environments play a larger role in US-based projects. Continental European projects more often contain data repositories, whereas videoconferencing is relatively unimportant – it is used more than twice as often in UK-based projects. The items varied also by project length: virtual/3D environments were of notably higher relevance in long-term projects, lasting for three years or longer. This is consistent with a view that the provision of interfaces for learning and practice becomes more important when the development phase is completed and the actual user involvement gets more and more critical.
Respondents reported a variety of outcomes from their projects, including publications, new methods, new data, follow-on collaborations, and new tools. They also reported a very broad user constituency ranging from 3.8 – 4.8 academic domains. Interestingly, almost all disciplinary constituencies that are reached are reached by a project that includes participants on the team with the same discipline as the user constituency. There are a number of possible interpretations of this intriguing result. It could be that projects are developed by researchers in given disciplines because they have specific disciplinary needs in mind. It could also be that researchers in a project already have a dissemination network in place that is discipline specific, and that knowledge about the project is transmitted through such disciplinary networks. These different possibilities have useful, but differing, implications for the structure of funding and should be explored in a broader scientific study.
With regard to the fields which were one of the specific focuses of the survey, archaeology, economics & business, sociology, social and economic geography/regional science, and linguistics, we find a couple of remarkable characteristics:
− Archaeology. Projects with archaeology participation are very small in terms of budget (150’000 €) and personnel (14 people) and with the shortest duration. They also need much non-scientific staff. However, they are still output oriented, with three quarters of the projects indicating the existence of a user constituency and the production of publications, new methods, new data, new tools, or follow-on collaborations. When it comes to their technological profile, archaeology projects show some very specific features: high bandwidth, frequent use of virtual/3D environments and innovative data collection methods distinguish these projects from the others.
− Economics and business. The high scientific component – nearly three quarters of the personnel involved are scientists or graduate students – contributes to an average project size of projects with economics and business participation, though the projects are of relatively short duration. Neither the technological profile nor the outcomes of these projects differ in any way remarkably from the overall dataset. However, the respondents stated notably less often that the project already had identified a user constituency.
− Sociology. Sociology projects have larger budgets than archaeology projects, but they also last longer and their annual budget is therefore just about as large as in the latter field. In regard to personnel they are the smallest ones (12 people on average). They use all technological items except for data collection methods less often than projects in other fields.
AVROSS
70
− Social & economic geography, regional science. Projects in this field are of average size and duration. Particular technological features are difficult to discern. Grid-based video conferencing sticks out as does the more frequent use of high performance computing.
− Linguistics. Projects in these fields are the largest in regard to budget and personnel among the fields considered. They are also the ones with the longest duration. These are their most remarkable features. Neither their technological portfolio nor the outcomes that they produce show any additional patterns. Only – like the considerably smaller archaeology projects – they also rather often said that they address a specified user constituency.
3.6.2 e-Infrastructure adoption Survey respondents identified a number of key sources of information about e-Infrastructure, notably the importance of other scientists in spreading information about e-Infrastructure. Printed information is of comparatively little importance. Only for scientists who are predominantly collaborating at the non-local, national and international, levels and – supposedly – less integrated in their local communities printed information on e-Infrastructure plays some role. It might substitute local meetings and workshops from which they less often benefit.
Infrastructure and administration people at the respondents’ organizations were less often rated as important in continental Europe than in the UK or the US. Moreover, these services were also less influential for social scientists and humanities researchers than for natural scientists. This could indicate less interaction between infrastructure and administration services and scientists in the continental European research environment and for humanities and social science researchers in general.
The respondents highlighted a number of factors as key catalysts: seed funding, collaboration, interesting research, and collaboration. Only few differences exist between different respondent and project categories. Seed funding is more important in the US and in other countries than in the UK, and least important in continental Europe. The computational requirements of the research, on the other hand, are more important in the latter regions.
Most notable is the difference between projects involving social scientists: those described by respondents with a local collaboration pattern in particular stress collaboration as a catalyst; those described by respondents with a non-local collaboration pattern (i.e. scientists who also collaborate, but not locally) give a much higher importance to seed funding, the observation of other projects and the prospects of interesting research. How can we interpret this? It seems that e-Infrastructure are more likely to support local than non-local collaboration needs. It is possible that the structure of collaboration differs by whether it is local or non-local: the latter might need a clearer division of labour, and the former might be much more integrated and thus in need of technological support. It is interesting that this particular pattern only manifests itself in projects including social sciences and hence more detailed analyses of the relationship between collaboration and technological support are necessary.
The respondents identified a number of key barriers to e-Infrastructure adoption. Almost uniformly most important, regardless of discipline, length of project, and date of adoption are three factors: lack of funding, costs, and lack of qualified staff. Lacking information on the usefulness of the technology was more often observed by the humanities and confidentiality problems less often.
M4 Final Report
71
3.6.3 Positive and negative lessons learned in e-Infrastructure projects The most important lessons learned that were listed by the early adopters are the following:
• It is necessary and beneficial to take the needs of users and other stakeholders into account in the development of e-Infrastructure for the social sciences and humanities. The early adopters frequently remarked that community-building is an important task in the realization of an e-Infrastructure project. In addition, user feedback should be sought early; actually some commented that tool development should be user-led to secure the uptake of the results.
• Supportive institutional and scientific environments are important assets: local IT staff and university administrations, deans and senior leaders in the home organization as well as in the broader domain environment need to be more responsive to the challenges and possibilities of e-Infrastructure development.
• Staff and funding issues are of key importance. Staff issues include the availability of qualified staff as well as the motivation and enthusiasm for the project. Budgetary issues referred to are for instance problems of obtaining long-term funding, inflexibility in managing funds and larger development costs than expected among others.
• Bridging disciplinary boundaries, above all between computer and domain scientists, is not always easy, but it is necessary and possible for advancing e-Infrastructure and beneficial for exploring new areas of knowledge.
• Technological limitations of e-Infrastructure tend to develop around deficient service models of computing services as well as the reliability and user-friendliness of the technology.
• Flexibility of the technical solutions, openness to software revisions and information exchange and mutual learning across e-Infrastructure projects are important.
• Rather few responses addressed some of the issues that have high priority on the policy agenda, such as the development of standards, open source, sustainability and IPR and other legal issues.
Taking a closer look at some of the respondents’ characteristics and their responses on these lessons learned may reveal whether some problems appear under specific circumstances or in a specific situation. The picture remains somewhat fuzzy and there are only few issues that seem to be robust:
• There is a notable difference between European and US American responses in regard to the value of connecting to peers, taking the outcome of pilot projects into account, and engaging in some sort of information exchange across projects. In this context it is important to recall, that US respondents have more experience both in years of involvement as in number of e-Infrastructure projects than continental European respondents (see p. 24). This gives room to a number of interpretations: continental Europeans might need some further support in the exchange across projects, as there are more barriers than for their US and UK colleagues, such as differing languages and fewer opportunities for information exchange because of fractionated, inward-oriented science systems. However, it might also be that Europeans are more aware of the work that has been done by previous projects because they are essentially latecomers in this business (and we see, that late adopters stressed this connection to peers and pilot projects more often than very early adopters).
• The responses obtained from the UK show two differences compared to the rest: First, funding and cost issues are less often mentioned and therefore
AVROSS
72
possibly less problematic than in all the other regions. Second, technological limitations of e-Infrastructure are more often brought up.
• Among the responses from scholars we see a smaller orientation towards the e-Infrastructure users (see also the low percentage of scholars’ projects with a user constituency, Table 3.18 on p. 43). In contrast, scholars show more consideration for their research team and personnel.
M4 Final Report
73
4. Promising approaches to using e-Infrastructures in the social sciences and humanities
The work in WP 3 responded to the first set of requirements from the tender specifications, namely:
1. To describe the challenges, opportunities and barriers for a large scale uptake of e-Infrastructures in the social sciences and humanities
2. To define the requirements and options for a large scale development, implementation and uptake of broadband technologies and applications supporting virtual R&D organisations in the social sciences and humanities
3. To analyse the challenges for Computer Supported Collaborative Learning (CSCL) environments with demanding visual interactions
The main measure in order to accomplish these requirements in WP3 was the “analysis of the 8 most promising approaches to using e-Infrastructures in terms of a comprehensive description of the challenges, opportunities but also barriers for a large scale uptake”, as stated in the second requirement B of the tender specifications. The identification of these eight approaches was based on:
− The list of projects from the WP2 stock-taking survey
− Additional desk research
− Interaction with e-science experts worldwide (see appendix II.3)
− Identifying indicators for a typology
− Creating a rating scheme based on this typology
This section of the report first presents in a methodological section how the eight approaches were selected. Then it documents the common framework that was created for conducting the case studies, i.e. methodology, interview guidelines and interview logistics which were applied by each AVROSS consortium member in order to obtain comparable case descriptions. A second section then reports on the results and provides a set of case descriptions which are compared in the final section.
4.1 Case study approach
4.1.1 Identification of the eight most promising approaches The identification of the eight most promising approaches started from a list of potential projects and initiatives provided by WP2, as well as the identified approaches from desk research and the interaction with e-science experts worldwide (see appendix II.3). This produced a total of 178 projects and initiatives from 18 different countries (Australia, Austria, Canada, Denmark, France, Germany, Greece, India, Italy, Lithuania, The Netherlands, New Zealand, Norway, Poland, Portugal, Spain, Switzerland, UK, USA).
The second step in the selection was the creation of a typology which was then converted into a standardised rating scheme. The scheme consisted of four groups of factors (see appendix II.1 on the rating scheme in detail):
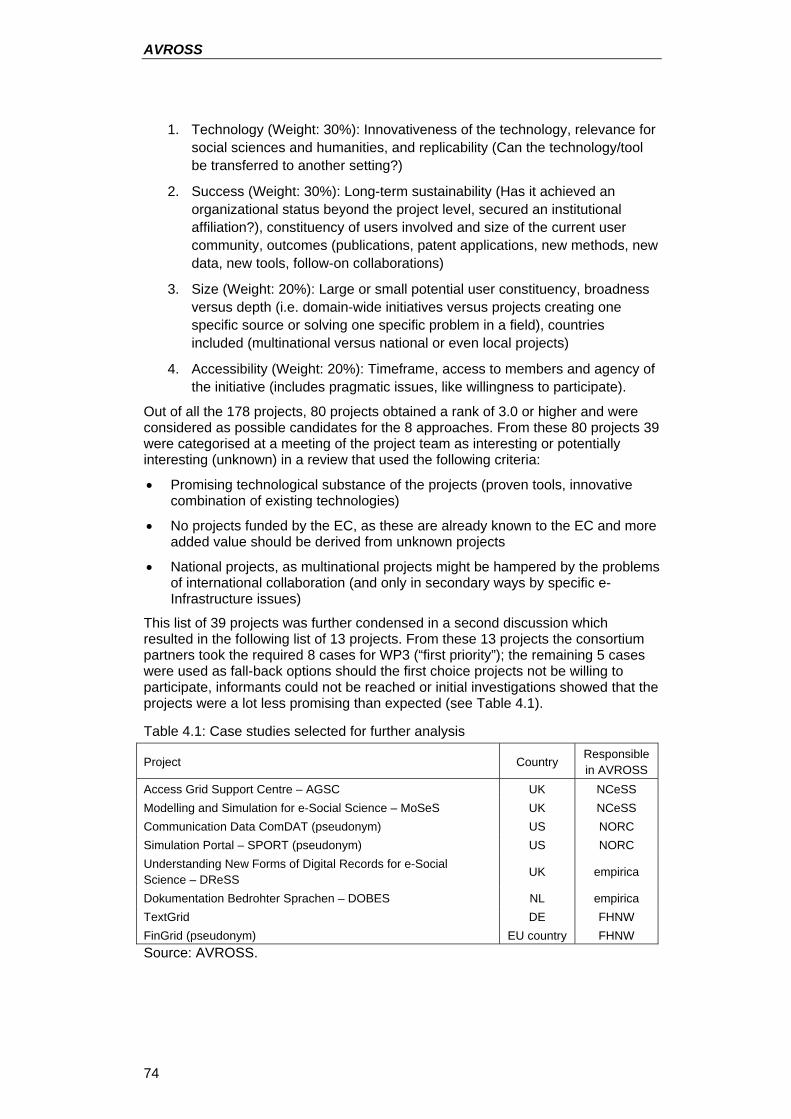
AVROSS
74
1. Technology (Weight: 30%): Innovativeness of the technology, relevance for social sciences and humanities, and replicability (Can the technology/tool be transferred to another setting?)
2. Success (Weight: 30%): Long-term sustainability (Has it achieved an organizational status beyond the project level, secured an institutional affiliation?), constituency of users involved and size of the current user community, outcomes (publications, patent applications, new methods, new data, new tools, follow-on collaborations)
3. Size (Weight: 20%): Large or small potential user constituency, broadness versus depth (i.e. domain-wide initiatives versus projects creating one specific source or solving one specific problem in a field), countries included (multinational versus national or even local projects)
4. Accessibility (Weight: 20%): Timeframe, access to members and agency of the initiative (includes pragmatic issues, like willingness to participate).
Out of all the 178 projects, 80 projects obtained a rank of 3.0 or higher and were considered as possible candidates for the 8 approaches. From these 80 projects 39 were categorised at a meeting of the project team as interesting or potentially interesting (unknown) in a review that used the following criteria:
• Promising technological substance of the projects (proven tools, innovative combination of existing technologies)
• No projects funded by the EC, as these are already known to the EC and more added value should be derived from unknown projects
• National projects, as multinational projects might be hampered by the problems of international collaboration (and only in secondary ways by specific e-Infrastructure issues)
This list of 39 projects was further condensed in a second discussion which resulted in the following list of 13 projects. From these 13 projects the consortium partners took the required 8 cases for WP3 (“first priority”); the remaining 5 cases were used as fall-back options should the first choice projects not be willing to participate, informants could not be reached or initial investigations showed that the projects were a lot less promising than expected (see Table 4.1).
Table 4.1: Case studies selected for further analysis
Project Country Responsible in AVROSS
Access Grid Support Centre – AGSC UK NCeSS Modelling and Simulation for e-Social Science – MoSeS UK NCeSS Communication Data ComDAT (pseudonym) US NORC Simulation Portal – SPORT (pseudonym) US NORC Understanding New Forms of Digital Records for e-Social Science – DReSS UK empirica
Dokumentation Bedrohter Sprachen – DOBES NL empirica TextGrid DE FHNW FinGrid (pseudonym) EU country FHNW Source: AVROSS.
M4 Final Report
75
4.1.2 Case study method and guidelines The analysis of the cases drew mainly on two different methods of data collection:
1. Semi-structured interviews
2. Archival research
Ad 1) Semi-structured interviews: After the identification of the case studies, each partner contacted the relevant PI(s) of the projects, according to the following procedure: For the selection of the interviewees, a snowball sampling was used aiming at the following groups: PI(s) [starting from here], researchers, developers, users and (if it made sense and was applicable) involved stakeholders like National Grid Service (UK), JISC, TeraGrid, D-Grid or similar related e-Infrastructure projects or service/technology groups. For each case study, several face-to-face or telephone interviews with the main initiators, providers and managers of the projects were deemed necessary. The time per interview was set to approximately one hour (see appendix II.2 on the interview partners).
Solicitation and introduction: At the beginning of the interview the interviewer introduced the investigators and explained the purpose of the study, methods (i.e. in depth interviews from eight case studies in the US and Europe), expected duration of the interview, potential contribution and benefits of the study – such as to the CI/e-Science community, and the direct benefit to the interviewee.
The interviews were conducted as semi-structured interviews in which a smaller body of open-ended questions was combined with questions which were based on probes, follow-ups, and case specific items. The semi-structured interview approach permits exploring the conceptual linkages among the four sources of influence on the shaping of technology, as well as potentially identifying new ones. The constructs can be used by the sponsors of AVROSS to understand how funding is related to mobilization, how e-Infrastructure shapes existing socio-technical practices, and the ways in which this framework has been shaped by existing socio-political institutions, for example.
Regarding influences on e-Infrastructure development, the interview guideline took Social Shaping of Technology perspectives into account, namely technological frames and user requirements, scientific shaping of technology, economic factors, and political influences (see Section 2 of this report for a more detailed description). Additionally, the following points had to be considered:
• Challenges and difficulties projects had to master in their different phases from the invention to the introduction and dissemination among the user community
• Modifications to the initial objectives, key current applications and benefits to the users and possible future developments which might further increase the usability and benefits
• Possibilities of, or experiences with, transferring the project from the initial work environment and community for which it was made to other environments
An initial interview guideline with 103 questions was subsequently slimmed and refined in a next step to make it usable for one hour in average of interview time (see appendix II.4 The interview guideline).
Ad 2) Archival research: Archival materials are another central data component of WP3 which complement interviews in order to enable a comprehensive analysis of the case studies. Ideally, the archival research on a specific case was completed prior to interviews with stakeholders associated with that project, as archival data may directly input to interviews. For instance, archival data was utilized for identifying interviewees or it guided an interviewer to revise or adding questions to an interview. Contingent on data quality, archival material also served as a unique
AVROSS
76
source for examining additional dimensions of the case studies, such as certain aspects of project impact and outreach.
For the purpose of archival research for WP3, archives were defined as sources of data that are either textual or can be converted to textual representations, and are publicly accessible. Among other sources these data include designated web sites for the selected cases, publications and presentations.
4.2 Case studies on e-Infrastructure initiatives The following sections present descriptions of the 8 cases studies analysed. The descriptions all follow as much as possible the framework outlined above. The descriptions are followed by a cross-case comparison which identifies common and divergent challenges and solutions.
4.2.1 Access Grid Support Centre – AGSC
Background The Access Grid Support Centre (AGSC, http://www.agsc.ja.net/) is part of the Research Computing Services at the University of Manchester. It is one of the services provided by JANET (http://www.ja.net/), an education and research network serving the UK higher education sector. The network currently serves over 18 million end users. JANET is funded by the Joint Information Systems Committee (JISC, http://www.jisc.ac.uk/aboutus/committees/sub_committees/jsr/ jcsrprogramme.aspx) The mission of the Joint Information Systems Committee (JISC) is to fund and manage research and development programmes to provide services, develop infrastructure and applications in terms of innovative use of Information and Communication Technology (ICT) in research and education.24
As stated on their website “the aim of the AGSC is to improve the user experience of Access Grid through enhanced quality and robust, resilient services”, in the whole UK. The Access Grid (AG) is a videoconference system devised particularly for group-to-group interaction and collaboration. Video cameras, audio equipment and large-format displays of two or more locations are interfaced via middleware and controlled by AG software.
The benefits of AG are described as improving the modes of interaction between participants by providing a more realistic meeting experience for groups of people in different locations. Important features of AG are the more natural sounding audio and the multiple viewpoints achieved by different cameras at one time; the big display with its multiple images enables a better overview of the remote sides, participants and presentations; and collaborative software supports the sharing and interacting with data.
After first coming into contact with the AG technology in the US in about 1999, members of the University of Manchester’s computer science department who were concerned with the research and evaluation of new ICT had the idea of trying out this technology. After a brief span of trying to get the funding (50000 GBP initial costs at that time) the first node in Manchester (and the UK) was established 2001 “to evaluate new technologies” in “the early days of e-science and Grid”. More nodes were set up subsequently and the problem of showing people how to use these and to foster the technology became apparent. The now head of the Access Grid Support Centre then wrote some reports, which for the first time promoted the 24 JISC (http://www.jisc.ac.uk/) works in partnership with Research Councils UK and is funded
by a number of high level departments and councils in the UK’s further and higher education area.
M4 Final Report
77
idea of such a centre, a bid was then submitted and it was funded. The first AGSC contract started April/May 2004 and lasted until the end of July 2007. Recently the second phase of funding (the second 3 year contract) began.
The AGSC started with three members, the head and two support officers, shortly thereafter adding a third support officer. Within the first two and a half years more support officers were appointed. Today six persons are working at the AGSC, four support officers, the operational manager and the head of service.
One of the interviewees first belonged to the core group of support officers, before moving on as a developer and researcher for AG, being “slightly detached from the AGSC now”. He still is working in the same open space office and still is considered to be a member of the AGSC team (informally), and through his experience he can contribute even better as a developer and contact person. Another interviewee is the operational manager of the AGSC and works half of his time managing the centre while researching AG technology in general for the rest of his time. A third person interviewed works as support officer, while the fourth interviewee possesses a double role as a long time AG user as well as a researcher in AG related projects from the viewpoint of computer graphics and visualisation. The final interviewee is the Director of the Research Computing Services at the University of Manchester, i.e., a person from the institutional environment of the AGSC. He played a leading role in establishing the first AG node in Manchester and supporting the AG technology and use subsequently. Also, he is the only one of the interviewees involved with AG before the founding of the AGSC in 2004. The operational manager and the support officer are the only other persons having been involved with e-Infrastructure in any way before their engagement with the AGSC, one in the area of network security and the other doing IT support.
The AGSC benefits strongly from AG related projects, especially those where members of the AG support centre are taking part besides their work for the support centre as such. The experiences, knowledge exchange and concrete developments are said to be invaluable for the proper support and further evolvement of the AGSC.
Technology In an AG videoconferencing session the images are projected against an empty wall on one side of the room, the so called AG node, the conferencing room at the points of use. The larger scale compared than other video conferencing technologies stood out very early (e.g., to remotely show historical pieces of handwriting which had to be displayed at the same time to compare them). The AG node is equipped with the necessary hardware, i.e., diverse video cameras, microphones, loudspeakers and projectors, including a computer to operate an AG session with the necessary software. Additionally, a so called virtual venue server is needed and the AGSC runs a number of such servers. The centre supports the commercial inSORS as well as the Open Source AG Tool Kit software, which applies for the server as well as for the client side. There are two ways of connecting between parties in an AG session, one is called multicast, which is more efficient and allows better quality video and audio connections, but also needs more network resources and a well adjusted system, the other is called unicast (less technically demanding, but also lower quality). Besides connecting a session between two or more AG nodes, i.e., different fully equipped real meeting rooms, the AG also allows two other modes of participation: 1) office nodes, which use multiple monitor displays and microphones and 2) desktop nodes called PIGs (personal interface to the Grid), running on a single computer with client software, webcam and headset.
Another software supported by the AGSC is the Virtual Room Videoconferencing System (VRVS, http://www.vrvs.org; next year, the next generation system called
AVROSS
78
EVO will be introduced), a type of desktop conferencing system, for example, used in the astrophysics community. This system can be connected also to the AG so that sessions in each system can be joined by the other. Therefore, both user communities are supported and are able to interact with each other. There are some similar technologies (e.g., Skype, standard video conferencing tools, MS ConferenceXP) which are not supported but watched carefully in terms of market share and competition but also in order to learn from them, or maybe also include them at some point. The original ideas of AG and, for example, Skype are completely different, but sometimes people use the AG just for standard video conferencing, although it has many other features such as enabling users to share and manipulate data. But a lot of people use AG for simple management meetings – “and for that you can use other technologies”.
Since inSORS as a commercial system it is not easy to develop additional functionality with it, therefore most of the development happens with the AG Tool Kit. The first thing to be developed was some way of sending the screen within AG (for others to see, e.g., a presentation). The Codecs for AG were not that good at the beginning for sending screens, so this was improved and Codecs have been developed generally as well. In the end, in the (now completed) Memetic project (http://www.memetic-vre.net/) this became the tool Screen Streamer and sessions could be recorded and later annotated with the Compendium tool. This software is now in use. In the succeeding Collaborative Research Events on the Web project (CREW, http://www.crew-vre.net/), these developments are being further improved. Another project called Portal Access Grid (PAG, http://www.rcs.manchester.ac.uk/research/PAG, http://www.portal.ac.uk/spp/) tries to make the AG easy usable via a web portal and additionally aims at bridging Access Grid and Skype and maybe even Access Grid and ConferenceXP in the future.
The technological basis of the AG is RAT (Robust Audio Tool) and VIC (VIdeo Conferencing tool), two widely used open source, standard tools. The commercial and the open source system are technically compatible, “otherwise it would be a big problem”.
Development done in JISC funded projects always is open source. Java is the preferred programming language and Flash is an important standardised tool. Within the open source community, communication mainly takes place via mailing lists. Regular meetings with inSORS take place to talk about issues such as problems, new software versions or new tools from the AGSC or from research projects.
A major innovation of AG is to being able to see all the participating sites together, projected to the wall, it makes it easier to orientate and see who is speaking etc. Also lot of small tools and measures being developed over the time make the whole better. For users, the most important improvement in AG is to being able to record sessions.
E-learning and training No special e-Learning tools are used, but Wikis are seen as a very good tool to communicate with the developers, “because I can just type in a load of stuff just off the top of my head” and at the same time it functions as a documentation tool. In programming there always is a lot of learning involved. The notion of learning in doing research is supported by all interviewees.
Training for the team members is considered as a problem, i.e. “our big problem is time and [personnel] resources”. In team meetings and talks in between learning happens through collaboration. New technology or releases are discussed and tested, “because at the end of the day we are the experts”. Also the AG support and development community regularly meets at the annual conferences AG
M4 Final Report
79
Retreat organised by Argonne Labs and the Workshop on Advanced Collaborative Environments – and also at other conferences which are of interest.
There are many means of supporting the users. General support happens via phone and email and in Manchester also directly to local users – but it was also stated that this local support basically could be considered as unfair towards other UK users, who do not have this opportunity. The AGSC website also is an important tool, providing help pages, online training with tutorials and flash movies, FAQ, links to the AG community and general documentation. Additionally there is an incident supporting form and the possibility to register as an AG user in order to use the AG booking service and the AGSC mailing list. Once a week open test sessions are offered over the AG for the whole community to test AG nodes and PIGs. Training workshops are conducted every 6 months. Furthermore, a Quality Assurance (QA) testing programme has been designed to “ensure a high quality of Access Grid facilities at participating sites to overcome problems of poor audio, camera placement, etc. that can detrimentally affect the user experience”.
Technological constraints One big problem has always been networking, i.e., the smooth interaction of different network protocols in using the AG connection (multicast connections). “In order to cope with multicast problems, what we do is we offer multicast to unicast bridges”, i.e., the AG system has a built-in function to overcome such problems. Wrong firewall settings are sometimes hard to overcome, as this is the responsibility of the general IT administration of each single institution.
The other problem is audio (audio echo), i.e., as AG is a collaboration system, bad audio at one site (at one node) will have a negative impact on the whole session. Audio is difficult to configure taking into account the hardware, background noise etc. One solution is to test of the equipment and settings through the QA tests offered. Most users see this quality assurance as something beneficial, but there are still some who do not take part in this, resulting in problems with their sessions.
There are a lot of users the AGSC does not know about because they are not registered (it is not required to register unless you use services of the AGSC), and so cannot be supported. This can lead to people or organisations dismissing the use of AG, where it actually could be properly supported.
Some smaller issues include:
• Until the actual AG Tool Kit version came out, there had not been a usable standard for the communication protocols, which made development difficult.
• It is at times difficult to ensure adequate support for both the commercial and the open source systems, as they are not fully compatible.
• Working with the video standard is not as easy as with the audio standard in general, on the other hand video does not cause too much problems.
• Sometimes the stability of the system is an issue, whereas it is also pointed out by one interviewee, that the system was very stable even in the early stage of AG use. Another interviewee stated: “from about 3 or 4 years ago it was an okay system”, it still needs to be more reliable compared to a “dare I say it, a Microsoft product”.
• In general AG is seen as probably a bit too “flaky” for business.
Overall no real technical barriers for development are seen. Sometimes a different programming language has to be used and not the preferred one, but it is emphasized that solving problems is part of this line of work.
AVROSS
80
Communication: Internal and with stakeholders Until about six months ago the six members of the AGSC worked in three different offices, which has been a communication barrier for everyday work. Now all members work in the same open space office, which has improved the overall awareness of what is going on. As an informal seventh team member also the interviewed developer sits in this office and participates in this collaboration. He is used to doing telephone support (besides email and sometimes personal support), i.e., working in a rather noisy environment, “there is always this constant feedback between all of the members of the group”. This also is understood as a notion of learning through collaboration, experiences and knowledge can be shared in a more direct and faster way. Team meetings still take place regularly for coordination and to discuss issues further. For the Director of the department there are regular meetings and less frequent strategic meetings with the head of the AGSC. In related projects, regular meetings take place, also often via the AG itself, and email is more important here. For collaborative software development appropriate tools are used to exchange code. Wikis are important to quickly exchange information and to document the work, also the BSCW is used.
The user pointed out that for him it would be just a three minute stroll to the AGSC office and additionally there is a lot of instant messaging and conversation over coffee. Also being on the AGSC mailing list it is easy to keep up-to-date with a few emails everyday.
The AGSC is one of JANET’s services, but usually the different services do not collaborate, other than having adopted some measures, strategies or tools in the past from other service groups. One example would be the long time support of the JANET video conferencing service, which experiences and tools have been beneficial for the AGSC and could be adopted, because of some similarities. The JANET AG booking service is basically built on the JANET video conferencing booking service and also a tool to check audio and video quality could be used for AG. This tool (AG check) will be released soon in a better version especially for testing the AG. In general, it is seen as very important to adapt the technology in a way it is useful for the AG user community, not vice versa – although sometimes this is not fully possible.
The AGSC is in regular communication with important players like the Argonne National Laboratories (“the guys that created the idea of the AG”) as well as with the inSORS people from Chicago. Collaborations with people doing AG research and development have taken place in the past, are ongoing and could be even expanded in the future. One example would be the SUMOVER project (http://www.cs.ucl.ac.uk/research/sumover/), which aims to improve the AG audio and video tools. The AGSC got involved because “first of all we have a lot of expertise we know a lot about our users and second of all because we may be able to influence decisions I mean at the end of the day we kind of lead that big community and we can be important players”. Getting involved with other communities (standard video conferencing etc.) is assessed as important to learn from each other and or even collaborate. It is stated that generally the AGSC probably should do more in terms of collaboration.
Community structure and mobilisation The AGSC supports AG users in the whole of the UK: researchers from different institutions and in different disciplines, including social sciences and humanities25. 25 Prominent examples would be the ‘Early Modern Texts & VRE in the History of Political Dis-
course’ project which at the same time is a MA programme (http://www.earlymoderntexts .org/) or the social science ‘Using Access Grid Nodes in Field Research and Training’ project & other activities of the sociologist Nigel Fielding (http://www.soc.surrey.ac.uk/staff/nfielding/)
M4 Final Report
81
Traditional Grid communities like physicists are said to be not the usual users of AG, as they probably have also a tradition in using other tools for videoconferencing. Most users are believed to be in some way connected to the e-science community through funded projects or collaborations in this area. No other specified communities are known to be really involved.
For users and developers in the AGSC environment, the collaborations take part mainly with other universities through projects like Memetic, CREW, PAG and others (see above). Another activity starting soon is an Arts & Humanities AHRC funded project.
In the US, inSORS have a commercial user base, including, for instance, an oil rig, government users and US Army medics, and it was used during the SARS outbreak. In the UK so far AG seems to be used exclusively by higher and further education institutions. Only one defence company is registered (as the only commercial user so far), “doing defence research for some universities”. The BBC seems to be interested, but so far do not use it.
The first AG node was installed in Manchester in 2001. Academics started to know about AG through show cases, conferences, workshops and contact between universities. With the start of the AGSC in 2004 it was planned to reach big audiences foremost via the website, but the main reason for the successful outreach is seen in the following: “I think it kind of spread because all the academics saw all the potential at conferences and talking to other academics and so on.” So if AG sessions work and users participate in successful sessions this can lead to a snowballing effect.
In the current three year funding period it is planned to revise the strategy for outreach (“we know that while the Access Grid Support Centre has been successful there is room for improvement”) and a strategy meeting has been initiated to meet this end. One main goal is to “sell the AGSC better”, because one hindrance is seen in people having had bad experiences with AG for different reasons and so not wanting to use it anymore. Making users aware of how the AGSC could help in such cases could lead to users seeing the value of the system and therefore to greater adoption of AG technology. It is pointed out that usually it is more difficult to be aware of the success stories than the failures, especially when it is the nature of the support centre to help in the latter cases. Part of the new communication strategy will be to show the advantages of using AG and as well the AGSC.
In 2006 and 2007 two user surveys (Daw, 2006; Gomez Alonso, 2007) have been conducted with the intention of reaching as many people as possible (over the website, mailing lists, snowballing). Overall, there had been 170 responses from 26 (31 in 2007) different UK institutions. The results corroborate the interview statements in part already described before: The quality of service was assessed as excellent and good, problems have been mostly encountered with network issues (multicast and firewall problems) and improvements requested mainly focused on more reliability, greater coverage of AG across organisations that do not currently have it and better quality of audio. The main benefit of the AG has been seen in alleviating the need to travel, whereas facilitating teaching was mentioned only in 6 % of the answers. The benefits of the AGSC have been seen in the general support and also to a lesser degree in training. The results have been published on the AGSC website. One problem, however, was that the results were not easily comparable because the surveys had been designed differently. In the next survey planned for 2008 it will be made sure that the questions are close enough to the one in 2007 and therefore make a comparison and further insights possible. Nevertheless, the surveys led to activities to “improve the AG experience within our community”, e.g., with the founding of the AGSC UK task force, where users of the AG, the management team of JANET, members of the JANET education and research network and the AGSC are involved and meet regularly.
AVROSS
82
The first issue the task force tackled collaboratively was the improvement of the multicast reliability (i.e., more stable network connections between AG nodes).
For more feedback, forms are circulated at the workshops taking place every six months. In general it is pointed out that the AGSC would be always open for all kinds of comments. The actual support is assessed by the interviewed user along the following lines:
“In principle getting things up and running has not been too bad because we’ve had the experience of lots of different area and coffee conversations. But how often do I phone the support centre, normally now they are quite proactive about, they realise that something is about to go wrong and they contact me which is quite nice”.
As a researcher in the computer graphics and visualisation community the interviewed user stated to have a lot of connections with other universities having an AG node, which would have developed over the years of using AG, e.g., by doing the lecture series.
Adoption Regarding numbers of registered users and AG nodes, currently there are about 120 room based AG nodes in the UK and over 300 registered users. When the AGSC started in 2004 there were about 20 AG nodes, growing since then to 40 in 2005 and 80 in 2006.
The number of official new AG nodes is expected to increase further, with the AGSC playing an important role in this development. The AGSC plans to put forward AG success stories to counter the negative voices which often seem to stand out from what can be heard of experiences with AG. Additionally, the AGSC may approach users with problems and who can be identified help them to sort them out. In general, the AGSC believes that people see the benefits of AG and as the AG spreads there are also more research projects with a lot of participants from different institutions using the AG, leading to a snowballing effect of AG use and interest. Not having an AG node then can be a disadvantage in working or even applying for a research project.
Additional beneficial factors to foster the use of AG and therefore the AGSC are seen in:
• More ease of use
• The advantages of less travel: it saves time and can also be seen as a green technology
• Open source, open standards and the AG Tool Kit are seen as a big advantage, because in this way new functionality can easily be added to the system and then work basically everywhere (also an advantage looking at commercial systems).
• It is said that when people experience a smoothly running session, they most likely will use AG again and like using it.
• In the early years of use, AG sessions had the advantage of incurring no connection costs, while conferencing and video conferencing by other means was expensive to do at that time.
• Two interviewees added a additional thought in indicating the importance of laying the focus also on a worldwide outreach, or at least on European bids, meaning, outreach to Europe could be enhanced more with this kind of projects and the help of the AGSC: “In Europe Access Grid is very early days and there are still problems.”
M4 Final Report
83
The issue of AG nodes where the need of proper set up, support and maintenance is not really understood by the local users or the institution is identified as the main obstacle of adoption. This then causes problems when connecting to such a node within a project etc. And this probably will continue to be the case for some time until the technology becomes more mature and more standard, so that it will be effectively supported everywhere.
AG can have an initial cost problem, because the hardware for a node is expensive – especially when this is not funded as in universities: this is especially a barrier for uptake in business and other areas, along with the low bandwidth outside university network. A bottleneck for business communities using AG could be the networks, which have still not the same bandwidth as the university network.
Although mentioned as a beneficial factor for use and uptake, ease of use is also pointed out to be still a problem. Open source can also mean that it is not 100% stable: “That’s the hardest part of it I think, getting people to take that on.” This user, furthermore, experienced problems with the usability of the interface, especially since two years ago as a lot of new features have been added.
Sometimes there is nobody taking responsibility for maintaining the nodes or trying to do QA tests (“we are currently trying to work out how to not punish them but enforce it on them”).
The AGSC does not know who really uses the AG: It is difficult to know
“a) which (..) nodes have registered and never been used, b) which ones are used and c) which ones have never registered and put in the system because they don’t feel that they need the service or they don’t know that we actually provide the service for them”.
Impact Compared to 2004, when it was a very new technology, there now is a better understanding of and more experience and expertise with the AG in general. Only one person at the time had had some experience with AG. Furthermore, the AGSC team now knows and collaborates with important players in the community, like the developers at Argonne and the people at inSORS. From the development side of things the introduction of the AG tool kit, especially from version 2 to 3 is seen as the most important change. Additionally, there are more servers and a better back-up solution in place. For the user, especially, the experience of less travel to meetings is seen as very beneficial.
The growing user base is seen as an important measure of success together with the fact that the number of reported problems has only grown in line with the larger number of users and nodes: “Which somehow reflects that if we have a lot more users but more or less the same sort of problems reported, then that reflects that we are doing our job properly.” The fact that the AGSC now consists of more team members than right at the start is explained by the increase in services now offered and not because they would have to deal with more problems or support inquiries.
Despite a lot of publications coming out of projects in the AGSC environment, publications are not seen as the right metric to assess success.
The impact of AG and the AGSC in the future is basically seen as depending on constantly improving the system and its use (usability, audio, video, portability, getting annotations to work better) and a constant and wider uptake und broader visibility. Similar commercial systems are seen as a possible threat, one interviewee, on the other hand, could image the AG itself going into the commercial sector. The developer expects, especially, a beneficial impact from the currently running CREW project.
AVROSS
84
Change Especially during the first three years of funding the AGSC has evolved in a positive way and today more and better services are offered. The whole package is assessed as being better now, due to discussing experiences in the team, using the feedback and also the ideas of the community (from users, developers and researchers). Compared with the start of the contract the services offered by the AGSC at the end of that contract are said to be completely different. This introduction of new services in the first phase of funding was not planned and came about mainly with the need to support not only inSORS but also AG Tool Kit users. Other small changes were introduced as it was seen that they were needed to support the users:
“But as we started doing it, we realised that we needed to change things we needed to offer more things for our community (..). And as an initial idea it was very good and then we needed to change, we needed to develop and come up with new services and change the ones that we were offering already and so.”
In this way the use of the main AG software packages also developed. In the beginning only the commercial software was supported (starting in the USA the need for support of inSORS grew due to the massively growing user base, which probably was not expected in that way so fast and also worldwide), but it was quickly found out that a lot of users used the open source software (AG Tool Kit) in the UK, so the initial plan was enhanced “to do something for that very big part of our community”. In this sense it is pointed out that constant evolution of its services is important for the AGSC, also because software changes constantly.
Teaching issues In Australia and the US the AG is being used as part of the teaching of research degrees, but at the AGSC and in the UK generally that is not the case. In using AG as a tool for teaching it is clearly seen as “one of the things that we had envisaged”, particularly to let famous scientists from all over the world give lectures to students. For about a year a scientific lecture series for the computer graphics community has been established, which is very successful and has lecturers from all over the world. Additionally, in summer 2007 master students used a Sony Aibo robot dog as a mobile web cam which can be connected to the AG. Overall it can be stated, that the AGSC itself does not have a formal connection between research or support and teaching, but on the other hand they take part in such activities going on in their immediate environment and benefit from them.
Resources JANET is funding the AGSC for three more years starting August 2007, with slightly more than 250000 GBP a year. Six months before the end of this contract there will be negotiations about extending the contract for two more years. Right now there are no considerations about a permanent funding, but the feeling is that these additional two years most likely can be accomplished, which would extend the time span to 2012. The main costs are salaries, equipment, travel and conferences. Users are trained in the workshops every six months, which is part of the contract – no service of the AGSC is chargeable for users. Otherwise, there is no explicit budget for internal training measures. The setting up of AG nodes is not the responsibility of the AGSC in terms of costs.
The research projects running alongside the AGSC are beneficial in terms of development and knowledge transfer, but do not add funds to the AGSC budget in any way. The other way round, to do more than the usual AG support, activities have to be funded from other sources. But, overall, the funding is seen as sufficient
M4 Final Report
85
right now. The only thing seen as slightly disappointing is that because of the fixed budget the AGSC has not been able to put money in for more research, development and innovation in the service, e.g., being able to do some experiments about new things and different ways of working beyond the research projects supported from other sources.
Policy input The successes are seen in the quality of the fundamental support provided by the AGSC. Also the current projects running alongside the AGSC and the general strategy are perceived as the right way to enhance the AG with new functionality which is needed, like better recording and annotating.
One challenge in general is seen in the AGSC being a support centre for something called a service which probably was devised more to be a research tool. People expect the service to be more mature than it really is right now. And even if the AGSC were able to do everything possible to make the system more mature it will take some time to accomplish that.
One the other hand, the interviewee from the institutional environment of the AGSC perceives the AG as a mature technology and generally as a good idea and that it “stimulated people to start thinking about it”. He also adds: “I think the biggest single failure is not being able to get one in research council headquarters, directly nothing to do with us.” Finally he added that he finds the commercial take up as disappointing and not as high as he would have had hoped.
The user still sees a barrier in administrative support in terms of networking (technically). Otherwise he states he is “really impressed” with the AGSC, because it helps people getting over the barrier of technology use.
Recommendations for policymaking are expressed by three of the five interviewees in different areas.
• Institutions have to understand that it is not sufficient to just buy equipment, e.g., for an AG node, but it is also necessary to “get someone to maintain that equipment and make sure it stays high quality and so on, and if everybody did that the experience would be so much better.”
• The funding cycle is seen as to short. Having secure funding for ten years would provide a much firmer foundation.
• It is “a European version of Access Grid Support Centre or even based on the E-Social Science Software and those areas which I think should be set up.”
4.2.2 Modelling and Simulation for e-Social Science – MoSeS
Background The project Modelling and Simulation for e-Social Science (MoSeS, http://www.ncess.ac.uk/research/geographic/moses/) at the University of Leeds is one of the seven research nodes currently funded by the ESRC National Centre for e-Social Science (NCeSS, http://www.ncess.ac.uk). NCeSS itself is an institution funded by the Economic and Social Research Council (ESRC, http://www.esrc.ac.uk/) within the UK e-Science programme and focuses especially on the social science research community. The main challenge for MoSeS is how to use the massive data resources and computational power of e-science to address important intellectual and applied problems through modelling and simulation.
AVROSS
86
The three year project started in September 2005. It focuses on creating a micro-simulation model in which the entire UK population with all individuals and households is represented (core component one) and at the same time a demographic model is added that ages the population over the next ca. 25 years (core component two). Together with this so called baseline model, several tools are being developed to address specific research and policy questions, including a dynamic modelling capability and a Grid-enabled portal for policy analysis. The underlying data used for the projections is the Sample of Anonymised Records (SARs, http://www.ccsr.ac.uk/sars/) from the UK 2001 Census of Population and Households. Different static and dynamic ageing models are used to project the synthetic population forward to the year 2031.
Previous work in the Hydra and Hydra II projects (http://www.ncess.ac.uk/research/pilot_projects/hydra/), two ESRC funded e-science pilot demonstrator projects, provided MoSeS with a spatial decision support system. These projects were also led by the PI of MoSeS. The Hydra demonstrator is a portal build upon a service-based Grid architecture, which provides secure access to a data service, modelling tools and collaborative services. For MoSeS this portal is being developed further with the use of portlets.
The project has application areas in three domains.
• Health care: In this field the objective of MoSeS lies in exploring the application of Grid technology to integrate data from a variety of sources like health and social care, in order to learn how these care services are used and hence how they can be improved. Additionally, the integration of social networks in this area is simulated to examine potential benefits for the individual and the formal care systems.
• Transport: The simulations in this area are looking at plans for expansion (especially in case of the Northern Way, a 20 year programme to transform the economy in Northern England) in combination with the reduction of congestion. The models additionally involve business activity and changing demographics, resulting in the challenge for MoSeS to devise economic forecasts and show so called “what if” changes to the local infrastructure.
• Business: Here the aim is to build a model in which financial scenarios are simulated to examine their potential impact over the next decade. This includes important issues like the pension “time bomb” and the increased use of Equity Release Products (e.g., deflation in house prices, rise in interest rates).
Currently, the simulations do not necessarily use the whole of the UK population in projections until 2031, but it is planned to implement this within the duration of the project and to increase this year by year. Furthermore, the methods for demographic forecasting and projection will be developed to be fully dynamic, i.e., more scalable to specific scenarios within each model. Demonstrator applications for a variety of scenarios will be built and the Grid-based portal will be improved over the time in terms of usability and functionality for use towards diverse policy-relevant questions.
Besides the MoSeS PI, none of the interviewees was involved in influential work previous to the project, but at least three of the Co-PIs also have been involved in writing the proposal. The others started with the initiation of MoSeS. One of the developers/researchers already worked at Leeds University but did not have any previous connection to the PI, another has worked in the context of e-Infrastructures for some years. The MoSeS project consists of the PI at the School of Geography at the University of Leeds, six Co-PIs bridging geography, computer science and the three application domains (business, transport and health care) and the three person research and development team. Two team members have a computer science background and do more code related development than third,
M4 Final Report
87
who is a trained geographer. The PI together with the three researchers/developers make up the MoSeS core project team.
Technology The technical MoSeS framework is essentially a Java platform based as much as possible on open source third party software, which itself is based on Java or supports it. One interviewee pointed to the extensive list of software used in MoSeS which can be found under the blog pages of a project member (http://www.geog.leeds.ac.uk/people/a.turner/projects/MoSeS/software/) and to which only Shibboleth, Permis and GridSphere would have to be added. This page also acts as the unofficial project’s software page.
The simulations to be done in MoSeS are computationally quite intensive, therefore a cluster of computers works parallel on the tasks, something which had to be accomplished at the start of the project. A lot of tools are used to automate and distribute processes over the cluster. Very useful for parallel and automated processes is providing a message environment through advanced Java objects and files using “MPJ Express”. The software was designed and is being further developed by a group now at the Centre for Advanced Computing and Emerging Technologies (ACET, http://acet.rdg.ac.uk/) at the University of Reading. This group also is involved in diverse UK e-Science activities therefore making it easy for MoSeS to become aware of the software in the first phase of the project. Through using MPJ Express an exchange of information between MoSeS and the software developers began which helped to make the software more usable. At the same time, MoSeS is listed as a user for the software on the ACET website, supposedly helping to make them better known in the community.
A tool used for geographical mapping is GeoTool, which was developed in the already mentioned Hydra projects, which helps in collaborating with the tool’s developers in case of problems or questions through the contacts of the PI. To get “Geo tools working with the portlet which no one’s done before as far as I am aware”, i.e., in an environment integrated with the Storage Resource Broker software (SRB, developed in San Diego, http://www.sdsc.edu/srb/index.php), is seen as an innovation for the Grid community. SRB is very important for the splitting and distribution of the huge data in the cluster, which otherwise is too big for one machine to handle. With the progress of the project also the amount of data increases and this technology becomes more and more essential.
For the development of the Grid portal and the use of Grid middleware GridSphere (a portlet engine running on top of Apache Tomcat as the servlet engine) is used because of its JSR168 compatibility, another important standard besides using Java. In the overall development work commercial software and systems are also used as working tools like Microsoft Visual Studio and iMacs. Concerning standards ,one interviewee put it the following way, which exemplifies the approach of MoSeS (OGC is the Open Geospatial Consortium, Oasis is the Organization for the Advancement of Structured Information Standards):
“(..) how we get that to work requires the adoption of standards as well and you know, having free and open source software for one thing, but also stuff that is implementing the right standards or de-facto standards, they are those standards to defining organisations and developing organisations (..). So in particular things like W3C, ISO and OGC and Oasis.”
The funding through ESRC via NCeSS also formally demands the development in open source as much as possible. Using standards together with open source is seen as an advantage because of the large community and therefore the potential help in case of problems. Also the possibility to choose from a variety of software is
AVROSS
88
very beneficial and it is said that in most cases the software is more reliable because of that.
E-learning and training In MoSeS there is no formal training or use of e-learning tools. If courses have been taken in terms of further academic training then, as one interviewee stated, “most of what we are doing is not anything that we have learnt in these courses”. The notion of learning in doing research, developing tools and exchanging knowledge in the group and with others is widely supported.
Technological constraints Security issues are generally very important and constraining because of the confidential nature of the data:
“And we still have got security problems that we can’t have them access the data and all of the different things like that, because it is mainly data issues.”
This is especially true for the storage on hardware external to the UK, meaning that, for example, in the project CoLaB between the University of Leeds and the University of Beihang in China (for more details see next section) no UK data may be sent, processed or stored there, which hinders the use of otherwise additional powerful computational resources.
Similar security restrictions mean that MoSeS cannot use the UK National Grid Service for all of its computational needs. Computational power is therefore limited (resources are simply not available or too expensive to buy in, i.e., latter is not intended as a model), especially thinking of what could be done in simulation with “unlimited resources”. So, the models have to be optimised so that they fit into the restricted resources, but this works only to a certain point. So, even with the very fast 32 node Beowulf cluster in Leeds one simulation run takes up to several weeks. Simulations for optimum results have to be repeated multiple times and for multiple years into the future, but, so far, in some cases just one run has to do – and it will take some times to solve this problem, as “it’s about five or ten years down the line easily”.
One barrier emerges when the team’s tele-worker has to use the computer at home which constrains the connection via AG and other network tools through router and firewall, making collaboration more complicated in some cases.
Another minor problem pointed out in dealing with cutting edge technology is that there often is no good documentation available.
Communication: Internal and with stakeholders Internally, the PI functions as a link between the other three core developers/researchers. Two of them normally have daily email and face-to-face contact, also during lunch or coffee times. They do not work in the same building, but on the same campus. One of the two works on the same floor as the PI, who, on the other hand is very busy in different activities. All developers/researchers have their own field of work and do not normally work on the same code base. The third developer/researcher is tele-working from another city (and comes in only once or twice a month), so it is important especially for the PI to be flexible in communication and coordination and provide tasks and information to everyone when necessary:
“B is expecting to get something from C but C’s not outputting something yet so the PI gives a dummy to B so B can carry on
M4 Final Report
89
imagining what he is going to get from C is something like what the PI has given him; while C still carries on doing something before that, it’s what still I haven’t yet produced, something in a format that C was expecting to use; while I am doing that the PI has quickly provided a dummy to C so that C can start using it and I have come up with something and it’s like: can we use this instead of that?”
The work in the team seems to get done well. But as distance definitely is a barrier this sometimes becomes apparent in the level of general awareness, which is lower with the tele-worker. The daily and very detailed blog of one of the team members is a big help for the team, even if it is not quite clear whether more than one other team member reads it regularly. Blogging is considered to be very important by him – e.g., in terms of “laying out the information trail” – and he would like all project members to use this as an information space like himself. The blog also is beneficial as a chronological project memory and for knowing what is going on in the project overall. The software page of the blog is the unofficial project page regarding the project software and de-facto standards, as mentioned before.
The regular mode of communication is email, face-to-face meetings and telephone. Two forms of project meetings have been established: a management meeting, which also includes the Co-PIs and a technical meeting with only the core team expected to attend. These had been regular meetings, but after three or four times things fell back to being irregular again. As one team member put it, they seem to only have them “at times when it has been crucial to get some stuff done”. It is the overall impression that normally everyone knows what to do or, if not so, can ask the PI or get information in the blog and from the other project members.
The users, i.e., at least three of the Co-PIs, are experts in their application domain and have given important input towards the development of the basic models for each domain. On a computer technical level they use the application and currently mainly provide feedback on the user interface, which so far is a more informal process. In later stages, the feedback is expected to be even more important and to be provided more regularly, because the applications will get more and more complex and mature. Still the leading role in how to incorporate all feedback lies with the core team of the PI and the three developers/researchers. Usually only the PI collaborates directly with the Co-PIs. One developer/researcher stated that it maybe could have been beneficial at some points in the past to have gotten feedback on the portal interface in a more direct and structured way from the users: “They haven’t complained but I don’t know if they like it or not”, but in the end “it seems to be working alright”.
The project CoLaB (Collaboration of Leeds and Beihang, http://colab.crown.org.cn/) between the Universities of Leeds and Beihang in China is developing a Grid middleware called Crown-C (focused on high assurance dependable systems). Because of the large resources in manpower, one of the interviewees assesses the software already better than Globus Tool Kit 4, as “in China they can put 80 or 100 [persons] on the same thing, so in a very quick period of time it grows phenomenally fast”.
Important collaborations with stakeholders include the OGC community, especially within the Geolinking Interoperability Experiment (http://www.geog.leeds.ac.uk/ people/a.turner/organisations/OGC/GeoLinkingIE/), in which researchers from Agriculture Canada (http://www.agr.gc.ca/) are also involved. Edina (the JISC national academic data centre based at the University of Edinburgh, http://edina.ac.uk/) is a regular partner, as is the University of Reading (MPJ Express software team, for details see description of technology above) and an especially strong relationship with GeoVue (another NCeSS funded node, http://www.ncess.ac.uk/research/geographic/geovue/) for map display tools to make maps better and maybe more Google style. As for other standards
AVROSS
90
organisations there is only collaboration if needed; standards used become the de-facto standards in the project:
“But most of the sort of liaison of the standard bodies is done by others we just wait for it to trickle through and then we will develop on that. So we are not working with the most recently in development standards that aren’t yet the recommendations that aren’t fully published.”
Grid data services in the UK used by MoSeS are mainly the National Grid Service (NGS, http://www.Grid-support.ac.uk/) and the White Rose Grid (http://www.wrgrid.org.uk/), a collaboration between the Sheffield, York and Leeds universities and commercial IT partners. Also the OGSA-DAI Project (http://www.ogsadai.org.uk/) helps sometimes within its mission of Grid middleware development to support data access and integration from separate sources.
NCeSS as the programme hub and administrative body of MoSeS functions as a contact point and coordinator. There also is an exchange of knowledge between MoSeS and the e-Infrastructure for the Social Sciences project (NCeSS e-Infrastructure for the Social Sciences project, http://www.ncess.ac.uk/services/). This is not seen as a formal collaboration, but as the PI and another member from MoSeS work in both projects there is a benefit coming from this exchange, as the e-Infrastructure project is looking at broader development of Grid software and services. One developer stated that maybe in the future there will be a stronger collaboration “within the core middleware type Globus Tool Kit” towards security, as this will be an even more important issue as MoSeS progresses. Looser contacts are established with PolicyGrid (again an NCeSS node, http://www.ncess.ac.uk/ research/semantic_web/policyGrid/) on “some interesting issues”, and the e-science and e-social science community overall. The PI, furthermore, has a strong connection to the San Diego Super Computer Centre (SDSC, http://www.sdsc.edu/) because he has been a visiting fellow there.
Community structure and mobilisation As described before there are three application domains in MoSeS, demographic simulation for health care planning, transportation research and the house market related business area. As the business area currently plays a smaller role in the project, the other two fields are represented by at least one Co-PI working at respective institutes in Leeds. The Co-PIs, as scientific users are the interface between the projects core team to the other users from these domains. The modelling and simulation and therefore the collaboration with the application domains currently focuses only on the Leeds area. In the health care domain, for example, the Leeds primary care trust is involved through the Co-PI, with the main question of how best to organise service for the population over the coming years. At the same time, the developed models evoke attention from other primary care trusts:
“Since we have been putting the information online about what it is that we have been doing, we are getting direct queries from these large organisations now saying, we have seen what you are doing and we are interested.”
The same is true for the transportation research area, where models are developed for Leeds which are correlate where people are living and working in the next 20 years and to where they move and how demographic, traffic and transport factors might change as a result. And these models also can be adapted to a larger scale or to another region.
The business application domain currently is the least developed one in terms of the application itself. So far this means mainly looking at house price modelling.
M4 Final Report
91
Adoption The MoSeS project currently is in the first phase of development of a mature programme, which means that there is nothing to officially use right now, except prototype demonstrators and the early versions for the applications domains. But as described in the last section, the content on the web suggests significant prospects and interest from potential users and organisations for future use. One interviewee described the current state of the software as follows:
“It works, it’s not great, it’s very flaky software I would say, it would work fine if you use it properly but it just assumes you will use it properly, if you start doing some things you shouldn’t do it will just crash or something, it’s not production quality yet”, but it speaks for itself that there is “appropriate web content that leads people to saying: give us it!”
A concrete, practical improvement therefore is seen as devising a friendly user interface, providing all functionality through a Grid portal.
The main obstacles are perceived not to lie on the technical site but in the computational power available over the Grid and in data licensing and data security concerns. Taking this into account it could be likely that in terms of a product or service ready for rollout it could be too early for a wide adoption and uptake at the end of the project. But there are no doubts that the concept and development have to be considered very successful. It has been shown to Leeds City Council who are interested in producing specific reports on certain aspects and is one of the tasks the MoSeS team is concentrating on and hoping to achieve useful outputs in the next couple of months.
For the future, it is common ground in the project team that the next year will be a very crucial one in terms of meeting the expectations and that “with the follow up project Genesis [if it is funded], we’re in a pretty good position for uptake” (see section on resources for more details on Genesis).
Impact The content on the internet (website & blogs) is considered to have been responsible for the main impact of the project so far, even if the software is still under development and there are not very many documents to download. Together with presentations and pilot demonstrators in the application domains, as well as press releases, in general a huge interest in the MoSeS project has been generated and, although it aims at a very limited community, a lot of outside interest has been stimulated (also see the interest of care trusts in models and, in the general, adaptability of the developed models to other regions or other scales mentioned in previous sections). Comparisons with SimCity (a popular simulation computer game, http://simcity.ea.com/), especially in the science and academic related specialised press in different international publications like Highlights from the UK e-Science Programme (Issue 2/2007) or the US based International Science Grid this week (iSGTW, 01/08/2007, http://www.isgtw.org/?pid=1000537) raised awareness of the project dramatically. The connection between SimCity and MoSeS first was made by “the University of Leeds put[ting] out a press release about Moses calling it SimCity for real and that’s what did it.“ The team members are not necessarily happy with this label, because people could “misunderstand what Moses is trying to do”. But they have to admit, that it has been an outstanding promotion. And one interviewee even sees more potential in using the internet: “It will sort of explode if we get some good use cases flashed out with these particular groups that those three interface with.”
Furthermore, the promotion as an NCeSS node, scientific publications, conferences and presentations gave the MoSeS project a strong standing within
AVROSS
92
the respective communities. So far, only few papers have been published but the ones which have been done were very successful. One paper won the second best paper award prize at the All Hands Meeting 2007 in Nottingham and will be published in a Journal next year (“Malcolm Atkinson who’s the UK science envoy, he gave us 25 out of 25, said it’s like a perfect example of an e-science project”). And while attending the Supercomputing 2006 conference in Tampa, USA MoSeS did a live interview with a radio station, “live from America about Moses” and was mentioned in many newspapers and the New Scientist as well. Overall the team is confident: “We have helped fix some problems and engage with the e-Science community. Maybe in five to ten years it will be powerful enough to do some more interesting work.”
Change At the start of the project the MoSeS team had to cooperate with four different organisations in the health care domain, which was difficult to coordinate. Because of a reorganisation in the national health care sector the Leeds primary care trust was installed as the sole organization making the collaboration between developers and users much easier. As the trusts got bigger, they also had to think and plan on a larger regional or even national scale, which boosted the already existing need for modelling and simulation in their field.
One project member stated, that, so far, there has been no need for formal change management measures, although in the initial work plan of the project "details were not specified and this has given some freedom to adopt and utilise new technology and approaches as they have become available“.
In the first six months of the project the current tele-worker had been working also in Leeds, but this seemed not to result in a huge difference for the specific work, but sometimes for knowing what exactly goes on in the project in other areas.
Teaching issues One of the developers/researchers teaches a Master level course in the school of computing and next year it is planned to have him involved in an undergraduate course. For both courses MoSeS is used as an example study, which seems to work fine looking at it from the computer science perspective. Additionally, a Master student currently is working on security issues around MoSeS for his thesis and in this way contributes to the project. In the School of Geography the PI has worked with several Master students on different issues contributing to the project. An upcoming idea is to find further students interested in doing a PhD through a MoSeS PhD studentship.
“I can’t imagine us running a course on Moses, now there is no need for it” stated another interviewee who is situated in the School of Geography. Additionally, the impression is that if it would work, it will be difficult to run a course within a three year project anyway, because such things would have to be set up right from the beginning to be successful. Furthermore, after three years project time it is not sure if this then could be continued.
Something currently being explored is the use of MoSeS models in a teaching application within the University for geography students, but right now it is not sure, if this can be achieved in a “little project”.
Resources The project is funded with £574K over three years, with the main costs being for staff. Additional funding is not seen as an absolute necessity, but nevertheless it is
M4 Final Report
93
considered to be important to find funding sources to finance one student doing a PhD in MoSeS in addition to the studentship in the computing department.
An interviewee has applied for a Google research grant on Moses, which financially would be only a minor asset of £5000 – more important in this context would be the exchange of knowledge and data. In this way MoSeS would be able to make use of Google’s approaches to data modelling, also feeding in Google data as well as Google could have a look at MoSeS, so that both sides would benefit: “It’s not just financial resources (..), sometimes we are after other resources that a company can offer.” Not directly connected to MoSeS, but with the same benefits and being a sign for the general expertise and further outreach activities of the MoSeS team in the area of e-social science, is the participation in the NCeSS e-Infrastructure for the Social Sciences project.
In terms of planning for the time after MoSeS, a proposal was handed in for funding of a new NCeSS Node (in the second funding round of nodes currently under way) combining the strengths of GeoVUE and continuing MoSeS to focus on urban modelling within the context of “Generative e-Social Science” (the so called Genesis project).
Policy input The success of MoSeS foremost can be seen in the innovative concept, i.e., the combination of social science modelling and simulation with Grid software to address issues of high relevance for present and future developments in society and policy making. One of the scientific users pointed out, that so far no system exists in England, which can predict developments on base of a functioning model – and the underlying model itself for him is the key technology. So, while being still in the development phase the potential of the software and its underlying models already have a huge impact in the respective communities, with the press and maybe most importantly for institutions like health trusts, city councils and governmental bodies. Furthermore, the scale of the application domains can be enlarged in the future (i.e., national or even worldwide). For one interviewee also the exchange between social science and computer science through concrete work is seen as a huge benefit. Another project member sees this more critically and also points to barriers in understanding each other in a multi-disciplinary project, which have to be bridged. At the same time, technology itself can be a barrier, which has to be addressed. These are not severe problems, but an effort has to be made to handle them every time. Looking at the larger whole of research and impact an interviewee emphasised:
“I think our experience will be very beneficial to certainly other people in the social science system, the arts and humanities, because we’ve looked at some social science problems and we’ve looked at the e-Infrastructure that’s available and figured out what works best and stuff like that so that’s probably the best you can say in terms of innovations for e-Infrastructure for MoSeS.”
The challenges for MoSeS lie primarily in two areas, the lack of computational power for processing the simulations on the one hand and the confidential data and resulting security issues on the other.
As for the computational power it is the opinion of the team members that it would need more resources which can be allocated to projects like MoSeS within the UK National Grid Service – in addition to the 32 Beowulf cluster nodes already in use at Leeds: “our simulation requirements to do our underlying virtual population creation in an hour would take 10,000 cpu’s maybe 20,000, I was promised the best I could do when I enquired about this was 100 cpu’s for 4 days”. The prognosis of the interviewees is that it would take further five to ten years to fulfil such demands. The general aim of having fewer barriers within the Grid for access
AVROSS
94
to various services and data sets easier and more usable – i.e., “the Grid enabling of data” – is hoped to be realized in better ways in about two years.
The second major challenge, the security issues due to the nature of the data have to be addressed not only by the project itself but also through the constant improvement of the whole e-Infrastructure framework. MoSeS can implement and use Shibboleth as an underlying authentication and authorisation framework, but the data services and providers still have to support this also over the Grid. Even more difficult to solve are the legal issues connected with confidentially handling census data under national law (most notable the UK Data Protection Act), which have to be solved before a seamless access – or access at all – is possible. This is observed as the hugest constraint for the project “more than anything”, thinking of e-Infrastructure not only as of computer power and users, but also of the legal framework as “something to be addressed”. The ‘data deluge’ is mentioned as a special challenge, with questions on which data to choose and how to aggregate it having to be answered.
All in all, it will probably take some time to be able to use MoSeS to its full capacity:
“If you think about the grander thing about what MoSeS is about, it’s about modelling and simulation for e -social science. The grander vision for MoSeS is for a global look and see what's going on, and by that stage we might be living on the moon but I don’t think five or ten years it is not in that horizon but 50 years maybe.”
Recommendations for policymaking are expressed by three of the five interviewees in different areas.
• For one interviewee the most important action would lie in the funding of one or many projects with a focus on researching how the handling of confidential social science data can be technically secured (as the legal framework seems to be not changeable enough in that area). The aim should be to enable using such data in collaborations and virtual organisations more efficiently and with fewer constraints, so that even the Chinese resources could be used with a secure and developed technology.
• Another team member points to funding concepts in general: “(..) the way that we are trying to influence those kind of policy makers is through demonstrators, just through trying to demonstrate what we can do, the importance of the things that you can do with this technology in the hope that someone somewhere will see that and say yes that is interesting, important, useful, we want to invest in that, there is merit in applying some kind of serious resources to that, but I am not even convinced that government or ever European Union government is the organisation that needs to be doing that, it is kind of bigger than that.”
• One of the scientific users would like to see funded programmes being more understandable for the public, i.e., the future users, because if people “don’t understand what it is, they won’t understand what it can do”. The use of new tools and of research has to be communicated in the right way, so that in the case of MoSeS the people working at the policy end get to know that there could be means to make their life easier.
4.2.3 Communication Data – ComDAT (pseudonym) This report concludes a detailed study on ComDAT (Communication Data, a pseudonym); a pilot project for the development of a web portal that provides a rich assembly of tools with the ambitious goal of bridging research gaps by proposing a new method, ultimately leading to important expected breakthroughs in the study of human communication. Based on data from an inclusive review of publicly
M4 Final Report
95
available written materials including web sites, publications, and multi-media clips, and six detailed interviews averaging about fifty minutes with six members of the studied group, we find that the study faces a number of obstacles, especially difficulties in communicating across disciplinary boundaries, data sharing and confidentiality, and resource availability--challenges that have already limited the scope of the ComDAT technology. Lessons learned from this study are also are expected to apply more broadly to similar e-Infrastructure projects.
Background The ComDAT study describes a small group of social scientists from three laboratories in large US universities. Participating scientists are considered central in their research communities, and, among others include members that focus on computational linguistics, and more traditional social and biological scientists who study human communication. The group is collaborating with software engineers and computer scientists—all of whom are Grid computing experts—to develop ComDAT (a pseudonym), which is a pilot application of a web portal for storing, sharing, and analyzing biological, behavioural, and social data over an e-Infrastructure. This web portal will address an important methodological shortcoming in social and behavioural sciences, namely the lack of consideration of multiple simultaneous measures over time, and is expected to lead to advances in both method and theory.
The vision is supported by large scale funding provided by a large granting agency – sizeable support in the US social science community. According to our informants almost all of these resources are allocated to development of the pilot technology, primarily for funding programmers. But all of our interviewees suggested that the vision that guides the project is probably more ambitious than the funding frame permits.
Current quantitative research on human communication is based on one, two, perhaps even three domain-specific measures. For instance, some scholars consider physical gestures. Others examine biological indicators. Still some researchers only investigate lexical selection. Yet, since social interaction consists of multiple biological, symbolic, and behavioural signals, the theories and models derived from specialized sub-fields are incomplete. Although the importance of simultaneous collection and analysis of multiple measures has been recognized since the 1950s, as one researcher noted “people did try to address these issues, but they ran in horror.” According to this respondent, as well as others, the reason was the lack of available tools, resulting in the modern balkanization of the related scientific domains. With the development of Grid computing and other e-Infrastructure related technologis ComDAT’s principal investigators suggested that “now we really do have the tools that can make these [measures] cohere.”
Technology The project provides a web-based data repository for the requisite tools, notably the collection and storage of various time series data, analytical tools, and advanced query capabilities. It is the belief of the project’s principal investigators that there are two ways in which these tools can contribute to a radical scientific shift. The first is to restructure the organization of science, as the resulting theory may “literally create a new discipline.” The second is to fill information gaps, since by “using these tools they [social scientists] are about ready to putting that whole puzzle together and saying, here we can have all these data and we can try to see how all these things fit together.” These scientists see three factors as key to building their vision: brokering research and building a community; building a community and community practices; and bringing social scientists back to the forefront of computation.
AVROSS
96
1. Brokering research and building a community. Although some of the tools related to e-Infrastructure have been developed for over a decade, ComDAT planners recognize that they are technologically too complex for a vast majority of the targeted community. Hence one role that ComDAT can play is that of a research broker between technology and social sciences. Brokering the technology involves not only developing tools but also interacting with Grid experts, learning new tools, and negotiating access with large e-Infrastructure providers for the whole community. A major challenge in building a community is getting social scientists to adopt it; the ComDAT model attempts to minimize barriers by requiring minimal learning from the users and making the service free or close to free of charge. In addition, a simple to use web services based portal should further reduce potential usability barriers. The principal investigators have devoted much thought to developing a user interface that can serve as “a YouTube for social science research.”
2. Building a community and community practices. A major focus of ComDAT is to develop more efficient research practices, as well as supporting common desktop software, such as statistical packages, mathematical modeling software, and annotation tools, that can be utilized on the portal. It is primarily intended to enhance collaboration within the social science community in at least three ways. First, domain specialists can examine different types of data from a certain experiment in traditional fashion, which should enable a smoother transition to the new research model. Second, scientists may share their data with the wider community so that others can conveniently access additional data to examine their models. Finally, the project provides data provenance tools to allow scientists not only to digitally trace back every change and manipulation done over the course of analysis, but also to allow collaborators and peer reviewers to scrutinize each of these steps and validate the results. Of course, ComDAT may also be used by individual researchers after the pilot project ends.
3. Bringing social scientists back to the forefront of computation. Because ComDAT enables access to a large Grid infrastructure shared by scientists from a variety of disciplines it provides almost unlimited compute and data movement resources on a scale that far exceeds the typical resources currently available for social science research. Yet, as some of our interviewees recalled, a generation ago social scientists utilized mainframes more than others by running complex computations on census and other types of social data. Although the personal computer paradigm has pushed social science research to the isolated desktop environment some respondents believe that “increasingly social scientists are crossing the threshold of being able to use parallel computing, because as soon as you are doing a lot of stuff parallel computing helps a lot.” Taking advantage of e-Infrastructure tools already developed for other research communities, in particular physical and life sciences, substantially reduces the time and cost associated with this transition.
Community structure and mobilisation ComDAT has a dispersed intra-organizational and intra-disciplinary network structure. Three research labs in different universities are involved. Developers are from two of these universities. They collaborate as a typical distributed team—through telephone conferences, email lists, and once in a while using face-to-face meetings. Core developers are linked to computer scientists, some of whom also participate in Grid infrastructure efforts. In addition, some of the domain specialists were trained as computer scientists, thus providing a common interface to the two disciplines. Social scientists also have direct ties to at least one or two of the Grid experts from previous collaborations—this was their channel for learning about e-Infrastructure and the potential for their research. From the perspective of the computer scientists this was “a great opportunity to provide another community with
M4 Final Report
97
some of the resources that their [e-Infrastructure tools] could provide.” This response also explains the voluntary contributions made by a number of prominent computer scientists to ComDAT; efforts which seem to have shaped the direction taken by ComDAT insofar as relying on open source e-Infrastructure solutions .
Although the project is a test bed, rather than a fully functioning production facility for a large community, the principal investigators have identified their target community, since “ComDAT is an infrastructure that needs to support a community of users.” The social scientists involved in the project are well linked with scholars in other related fields, which could potentially serve as a basis to solicit user participation and community building. These related fields go beyond social and economic research, extending to such domains as communication, or even legal studies. Although personal contacts are important, the overarching connection is technology, since “aren’t these all [fields] from a technological point of view the same? And the fact is they are. Certainly the substance matter varies and the details, but a lot of the technology of looking at these things is the same.”
The principal investigators noted that it took many years of research and deliberation for the vision to crystallize and that it was made feasible both because of developments in e-Infrastructure and funding availability. The mobilisation of the community still is hampered by the following challenges:
1. Adaptation of technologies. A number of computer scientists we spoke to suggested that from their perspective there is no real difference between physical sciences, life sciences, and the social sciences. As one expert who has worked with these communities argued “there is no apparent variation in considering data that arrives from a telescope or from EEG sensor – it is all time series data.” Social scientists we interviewed disagreed. One of them claimed, for example, that “they [computer scientists] can build bigger and faster computers but they don’t have a clue on how to use this technology to deal with human behaviour. And that’s the real question that has to be worked out.”
More specifically, domain users pointed to a unique feature of social science data, namely that much of it is interpretive and contextual. Even basic physiological data that is considered by some as an important measure for understanding interaction requires some level of human interpretation to distinguish noise from actual data. As an example a senior scientist we spoke to referred us to one of common data types not only in human communication but in social sciences in general: interview data. In these conversations, claimed our respondent, there are a lot of nuances that need to be interpreted, a small hand gesture that is perhaps meaningless as opposed to pointing a finger to the speaker—a meaningful act when considering the context of the discussion. Activities that relate to the former category should not be coded as events, and the later type of activities should be considered events and subsequently analyzed. In contrast, each activity is considered an event in a time series data in other domains of science.
Without the ability to distinguish “real” data from “artefact,” it is difficult to synchronize different types of data, and computer based analysis is limited. “It is not about faster and bigger, it is not like other types of research—it is not converting analogue signals to digital. It is much more complex and interpretative” summarized one of our interviewees. Thus, what seem to be missing are the basic algorithms to handle these fundamental problems. Without these capabilities the social scientists are unable to accomplish the primary goal of enabling a new method leading to breakthroughs in the study of human communication. Computer scientists “don’t have the time or funding to address the more particular problems [of the social sciences]. They want to proselytize big computers, and are not interested in developing algorithms for social scientists.” According to this respondent, the problem is that large funding bodies and especially NSF do not find the latter appealing compared to the former.
AVROSS
98
2. Communication. Social scientists claimed that they have expressed these concerns to computer scientists from the start, but their requirements were not fully addressed. On a more profound level this discrepancy indicates a communication problem among representatives from the two disciplines; a gap that cannot be easily bridged and has impacted development attempts, even though developers are a part of the same institutions as the users. Those users involved in discussions with developers felt that “the development is sometimes a bit opaque to the end user. Sometimes it takes a huge number of iterations before it could be really accessible.” What they needed was “patience, a willingness to cooperate, and to understand that it is going to take a fairly long time for the two groups to learn how to work together.”
All the computer scientists we spoke to have had formal training in engineering or physical sciences, leading to certain accepted practices, understanding, and even use of a specialized language. All of these seem to impede communicative attempts across the two groups. The following passage from an interview we conducted with a core user, a social scientist nicely captures these differences:
“Their languages are different. Their work styles are different. And it has taken myself and some of my colleagues the better part of five years now to learn how to coordinating what we want to provide the end user with the technology that the developers have. We still have a long way to go—I think the interface between the developers and users at the level of developing the ComDAT is really one that has a lot of obstacles and challenges inherited in it.”
These reservations were backed by multiple examples, including:
“At the most mundane level what people mean by coding or analysis will be very different and for social and behavioural scientists coding may be some form of annotation the variety of different coding schemes both qualitative and quantitative coding analysis conforms to statistical analysis. Coding for developers may have more to do with tagging of the data, creating ontologies etc.”
3. Translation. Time may reduce communication difficulties. But although these teams have worked together for a few years and they regularly communicate with each other, they still experience significant communication barriers. Translators – individuals trained in both fields, who understand the language, problems and work styles of each group may aid in establishing a better flow of research and development. These individuals are hard to identify, do not necessarily have in depth knowledge of each domain, and may not have the incentive to serve this role. Two members of the ComDAT community were formally trained in both fields—one is a user, the other, among other things, a translator. Inquiring about the experience working with the user a computer scientist commented that his training “is great for us, because he kind of understands the technology we are developing and we can discuss that with him on a computer science level.” Others have pointed out the crucial bridging role played by their “translator.”
Adoption The implementation of the vision faced multiple barriers even at the initial development stages of the pilot project: the road to accomplishing the vision is bumpy at best.
The scope of the problems addressed, the required expertise to address them, and especially the high cost of experimental equipment have pushed certain disciplines, especially in the physical and life sciences to large scale collaborations. High energy physics, for instance, perhaps the most significant early adopter of e-Infrastructure, is organized around experiments with hundreds, and in some cases
M4 Final Report
99
thousands of collaborating scientists. Yet, in the social sciences, where research tools are less costly than in the physical sciences and most problems may be addressed by an individual or a small group of investigators, collaboration is less apparent. Our interviewees have thus raised a concern that while ComDAT is geared toward enhancing collaboration among domain specialists within the social sciences, for example by providing a collaborative environment for annotation, “we are dealing with communities that have not been historically interested in collaborating and developing larger projects. So they don’t necessarily have to motivation to spend the time for doing this.”
For all of our interviewees it was clear that incentives are critical to encourage user participation in ComDAT incentives. But the types of incentives may not be sufficiently compelling to the wider community. For the computer scientists involved “the primary motivation [driving scientists to adopt these tools] is ease of specification and above all speed, in other words, the ability to take a workflow that is time consuming and parallelize that across a parallel computer.” Yet it is unclear that there is such a requirement for processing speed from the domain scientists—either those studying human communication, or most social scientists in general. Our respondents concurred and further stipulated that the technology would be rewarding only for those researchers who “can ask a question faster than the computer can provide the answer.” At least to one senior social scientist we interviewed it was not clear that this benefit is meaningful to much more than a few individuals.
Although the other potential users are not experiencing computational bottlenecks, some computer scientists believe that the technology underpinning ComDAT provides sufficient motivation as it makes research better organized, such that a scientist will not need to be “limited by his own diligence.” While this may be the case, users still need to gain awareness about these tools, learn them, and ultimately deeming this process worthy for changing their habits.
• Gaining awareness. Publicity to the work is done through common channels: a publicly accessible web site, published materials, presentations in academic conferences, and utilizing existing social networks. Despite these efforts our interviewees were concerned that they need to get much more exposure to encourage participation. In fact, in response to the question “suppose you had twice as much funding, how would you allocate it?” one of our informants suggested he would use these additional funds exclusively for organizing workshops and reaching out to users. The goal would be to engage “people who are highly visible in their field, who are willing to take the time to learn these tools and then provide demonstrations of the added value of doing research with these tools.”
• Learning the technology. Future production versions of ComDAT are meant to be made simple to use. Even if this vision is to be accomplished, ComDAT, as many other e-Infrastructure projects, relies on a set of common technological solutions used by physical and biological scientists. These solutions do not include a model for handling commercial products, which are the primary analytical tools to many in the targeted communities. The main problems, as noted by a software engineer we interviewed, include licensing and porting. In a distributed environment as e-Infrastructure there are currently no accepted pricing schemes or licensing controls. And in some cases closed proprietary code may not be manipulated to transition from the stand-alone desktop environment to be used by hundreds of dispersed machines. Both of these technological constraints push developers and users to further rely on open source solutions and require potential users to learn a new set of analytical tools, perhaps even novel approaches, which may or may not better serve their research needs. Learning these new tools, many of which are not as user friendly and demand additional specialized knowledge bears a high cost to the
AVROSS
100
potential user. The problem, we were informed, is not as acute in the physical sciences where there is less reliance on commercial tools, and there is much more experience in using open source, barebones solutions. The problem is more acute if we consider the following remark made by a social scientists who is well aware of the field, “it comes down to how much people are comfortable with technology. As an example some of my colleagues do work with transcription of speech, observational coding of video, [but] they are still doing it in a fairly outmoded fashion where they have people do the codes and put everything in an excel spreadsheet. Actually, they first put it on a legal paper and then in an excel spreadsheet.” For these individuals the learning curve may be too steep.
Our interviewees have suggested that using the common resources of the e-Infrastructure poses at least three additional challenges.
• Data sharing. If the aims are building a community and altering scientific practices then even the most sophisticated and powerful web portal will not amount to much without high quality research data. ComDAT’s model assumes that scientists will share their data on the Grid and opening up opportunities for ad-hoc dynamic collaborative environment across virtual organizations. Yet, sharing data is not common in the targeted community. “I think that data sharing is the biggest problem. The technology is already there” argued one respondent who for many years has been advocating data sharing within his discipline. No incentives exist for sharing data. There are scientists who wish to contribute to the community by offering their data to be analyzed by others. However, these scientists have to consider additional costs, such as conforming to certain standards—which typically translates to re-formatting the data, and taking the time to learn the system. One solution, advocated by this interviewee was to institute a quasi-coercive system in which funding agencies would require scientist to share data that results from funded work. While some Federal agencies have made important strides in following this idea, others have not. According to our respondent’s analysis of the e-Science initiative “The Europeans have been particularly bad about this.”
• Confidentiality. As mentioned previously, there are distinct characteristics to social science data. One of these features is the need to protect the privacy of subjects. One of the social scientists we interviewed was not concerned with this difficulty since he did not deem the data contained in ComDAT harmful to subjects’ privacy, so long as appropriate releases were obtained, because “there are no medical records, we don’t have data on income, there are no addresses. The main violation is if a friend of yours was to see you and you were to do something embarrassing, then you would be embarrassed.” Another social scientist we interviewed, however, suggested that “confidentiality and privacy are very big issues because we are using audio and video data. It may become more of an issue with archival data where we don’t necessarily have permission to have data shared and that’s going to limit how much that data can be disseminated.” Moreover, there is no apparent computational technique for automatically masking the identity of subjects—such as by blurring their faces for example. One way to resolve this difference in opinion is that the former scientist was thinking about a particular type of data, whereas the other was considering a wider community with broader research objectives. The more conservative view, as presented by the second interviewee may be held by others consequently further limiting the willingness to share data.
Asking computer scientists about data confidentiality in ComDAT also resulted in mixed views. One respondent who is working with other scientific communities suggested that these concerns are shared by the physical scientists as well; their concern being right of first discovery. For this purpose they use data over an e-Infrastructure with “a very well defined protocol for who
M4 Final Report
101
can access when. Those experiments have a definite notion of membership in the collaboration and of access rights to the data based on your membership.” Another interviewee, however, suggested that while similar access procedures may be useful for the social scientists, there is another difference. When using a common infrastructure computer system administrators have full access to all data. Including these individuals in IRB may be cumbersome and altering the compute support model is problematic as well. It is clear, however, the following this model increases dependency on computer scientists. For a system administrator we interviewed the issue was clear “the users [social scientists] have to trust us.” But trust may be difficult to establish in light of communication barriers, as previously discussed.
• Red tape. While the bureaucratic hurdles are supposed to be ameliorated by the approach taken by ComDAT, primarily that it serves as a gateway to the e-Infrastructure, and the procedures are expected to improve over time, some of the users have experienced substantial delays in starting using the e-Infrastructure of one of the large US Grid facilities. These experiences were described by one respondent as “horror stories.” The distributed project structure does help insofar as developers are better linked to e-Infrastructure operators and have the knowledge and experience for pushing these requests forward. On the other hand, this model does lead to increasing dependency of social scientists on computer scientists, which may discourage adoption.
4.2.4 Simulation Portal – SPORT (pseudonym) This case description summarizes the results of a comprehensive investigation of SPORT (Simulation Portal, a pseudonym); an e-Infrastructure technology for supporting large simulations with a social scientific focus, and the perceived barriers for its adoption. For assembling our data we reviewed publicly available written outputs and conducted ten detailed interviews averaging over fifty minutes with ten members of the studies group. Our respondents included a diverse set of scientists from disciplines such as mathematics, social science, computer science, and physical science, in addition to software engineers. Legitimacy constraints in scaling domain expertise to traditional social sciences, lack of an institutionalized structure for resource sharing and utilization, technological complexity, and funding limitations were found to be among the most challenging barriers in getting the technology broadly adopted by social scientists.
Background SPORT describes a group of a multidisciplinary scientists organized as middle sized laboratory (LaboS) in a large US research university. A common research focus unifies this community: they specialize in generating and analyzing large scale simulations of synthetic data based on different types of raw data, and honing basic computational and analytical approaches to diverse problems, including some that pertain to the social sciences.
As all the studies in the lab require intensive computation and integration of multiple data sets core lab researchers have utilized a stand alone high performance computational environment starting in early phases on their research. Advances in Grid computing and the articulation of e-Science and cyberinfrastructure manifestos caught the attention of senior members at LaboS, as these developments meshed with their research vision. Consequently, with minimal outside assistance, LaboS computer personnel have started porting code to a Grid environment, running tests on a large e-Infrastructure, and designing an innovative application. Their aim was to base existing research entirely on the newly available cyberinfrastructure and by so doing extend the potential for research, collaboration, and even the research process itself.
AVROSS
102
This vision, however, is far from having materialized, primarily due to a lack of dedicated funding. The interviewees from LaboS identified a series of barriers to extending their computational approach to the social sciences more broadly.
Developing the vision was a challenge, since no funding was directly allocated to LaboS for e-Infrastructure development. The project, SPORT, was gradually designed and developed by piecing together institutional seed money and indirect provisions from a number of related projects. As a result, the project is far from completion. Indeed, our interviewees indicated that they have not yet determined the particular technologies planned for the project, such as the user interface, the programming language, and the middleware stack. As a senior scientists summarized, “SPORT is in a rudimentary development stage.” The underlying vision, however, appears to be much more developed.
Technology Throughout the interviews SPORT was described as a tool for enabling the research conducted in LaboS to extend in a number of dimensions currently not feasible with existing technologies. Several important advantages mentioned by interviewees include:
1. Scaling up simulation capacity. With increased computational resources research capacity at LaboS is continuously growing. A few years ago they were only able to run simulations to model the behaviour of a small municipality. Today, using a 100+ CPU Linux cluster, they are able to simulate a large city, potentially even a geographic region of the US. Financial and technical constraints do not allow continual growth in institutionally available compute resources. But the problems facing some of the largest supporters of LaboS’s research—funding agencies and policy makers—require larger scale simulations. For example, it is difficult to model wireless Internet infrastructure without considering population dynamics and Internet use patterns on a country-wide, perhaps even a global scale. Using SPORT over high capacity Grid infrastructure members of LaboS envision running massive parallel compute jobs, permitting both the simulation of large amounts of synthetic data and the modelling of individual behaviour at the most granular level—of every individual in this meta social system.
2. Expanding supported data. The research approach is comprehensive, “whenever data are available we use it,” suggested one of the core scientists. Multiple data sets, such as census data, income data, social surveys, and geographic information are used for constructing models. These data are hard to obtain and maintain even for a single geographic entity, and they are ever changing—an important difference from physical science simulations. Transformation in the environment, such as in population density, demographic characteristics, or physical infrastructure have to be reflected in constantly refined simulation models.
Despite the search efforts there are “holes” in the data that limit the research quality. Using SPORT, LaboS scientists plan addressing these constraints by enabling the use of disparate data sets across institutional and geographic boundaries. Municipalities can update data that pertain to their location; data can be obtained from sensors from various locations; scientists may upload germane survey data; still others may include synthetic data generated by their own research. In short, the data element of SPORT is to serve, as indicated by an informant, as a
“… platform for integrating all [available] simulations of different kinds of systems… Embedding discrete datasets that were generated for different technological or social populations… so when a user starts utilizing synthetic data such as on the City of Chicago, he always uses the most up to date data.”
M4 Final Report
103
3. Enabling a synchronous research process. To borrow a term from computer science, the research process in LaboS is synchronous. During the research process LaboS staff members interact and receive input form policy makers and experts within funding organizations—for example, in validating the quality of the simulated data. After receiving feedback the scientists build and refine data and models, and present results to funders. The research process often continues as clients ask for information on how an added parameter, such as additional costs constraints, affects model outcomes. One of the main objectives of SPORT is to synchronize this research cycle. According to this design users—scientists, experts, and policy makers—would use a web portal and would be, according to one informant, “completely oblivious to the fact that there is an [e-Infrastructure] underlying. [It would] allow the user to play with different simulations without knowledge to what he gets access to,” receiving results within a relatively short time, even instantaneously.
The very same synchronous research model could enable users to collaborate by contributing data, models, and expert knowledge, regardless of geographic location, institutional affiliation. Some of our respondents have described this goal as a “trans-disciplinary science; a way for people with different types of expertise to contribute to a model where all the assumptions are readily visible and no one has to have an arcane knowledge of its properties.”
Computer scientists participating in this synchronous model may also benefit. Focusing on new questions—driven by central problems of the social sciences, rather than being occupied with those pursued by the physical science and engineering—has a potential of advancing developments in their own field. One of our respondents, a computer scientist, was excited about this possibility “addressing social science questions can take computing to a completely different way. You might start designing new machines, new algorithms…. I think this conversion is going to lead to a new kind of science as much as enriching the traditional [domain] sciences themselves.”
Community structure Members of the lab collaborate with one another in identifying, generating, and analyzing data. There is a fairly clear internal division of scientific labour, with some expertise overlap. Computer scientists generate algorithms and develop tools, statisticians check the suitability of the simulated data, domain specialists bring their expertise to determine model parameters, and mathematicians apply or adjust theory. A number of graduate students from these disciplines provide additional labour and often a fresh perspective. When expertise does not exist, or requires additional bolstering, the lab collaborates with others, often from other institutions. But typically research is carried out within the lab. Over time this research production has led to an efficient tight organic structure, which supports understanding among staff scientists, including mutual comprehension of theoretical foundations, tools, and terminology. It reduces communication barriers and allows addressing a broad spectrum of problems ranging from biology, to technology, to urban planning with minimal internal adjustments.
One of the key domains of study at LaboS is social science, particularly the analysis of social structure and research on collective action. However, since there is little formal expertise in the social sciences, this is one of the areas in which the lab sometime collaborates with external experts. These experts, however, seem to specialize in computer modelling of social behaviour and are not leading social scientists in some of the more popular branches of research within these disciplines.
In contrast, LaboS maintains relations to prominent computer scientists, including collaborations with Grid experts within their own institution, as well as with senior e-
AVROSS
104
Infrastructure architects. These links provide lab members with social resources that translate into refreshing knowledge and understanding of development in the field of Grid computing and e-Infrastructure, providing direct input to the testing of SPORT, and even enabling access to compute resources on a large Grid infrastructure project with level which potentially would not have been available otherwise.
Challenges to adoption The target user community for SPORT include “social scientists with a computational bent”; in particular, those who are familiar and comfortable with computer simulation and experimental design. Although the tool itself is not in production, interviewees provided, based on their experience in promoting similar types of work, useful insights regarding the expected barriers to adoption:
1) High walls of legitimacy
2) Maintaining confidentiality
3) Sharing resources
4) Technical complexity
Ad 1) High walls of legitimacy. Social scientific problems, especially questions that relate to collective behaviour, are deemed central to the research activity at LaboS, and yet, aside from minor exceptions, core staff does not include trained social scientists. Although training alone does not necessarily determine disciplinary orientation, it appears that most of the scientists at the lab neither are familiar with major work in the social sciences that pertain to their research, nor do they regularly follow the core journals in these fields. Instead, a senior responded clarified, “as far as we know we’ve been doing social sciences essentially—from a computing stand point… developing a computational social science. By that I mean trying to understand the modelling of social phenomena.”
Computational scientists have the option to remain within the comfort of their own scientific domain and innovate in ways which may impact the social sciences without directly confronting social scientists. “Throwing your research over the wall and see if anybody picked it up” was the selected metaphor for this strategy by one of our interviewees. However, scientists at LaboS recognize that they have to climb over these high walls themselves in order to have their approach adopted because those currently interested in their research are not necessarily on the “other side”, that of the social scientists.
Like other fields of sciences, such as bioinformatics, or computational linguistics, attempting to connect one domain of science with computer science is not new. But for many scientists, even those sub fields that are computationally endowed, such as experimental economists these attempts to combine the two fields are not trivial, leading to legitimacy concerns, lack of trust, and even rejection of research. Interviewees noted that when they present their work to these audiences they are often confronted with challenges to basic research assumptions. LaboS scientists interpret this reaction as an expected response to challenging existing disciplinary practices. As one scientists keenly commented
“I don’t think it has to do with social sciences at all. The same kind of pushback would be felt if social scientists were to start doing physics. Every area has a set way of doing things: accepted norms, and standards, and accepted leaders in that fields. My feel is that when you do something that is not in line with this taught process—people question you, and they question you hard.”
M4 Final Report
105
More particularly, the misalignment with existing social scientific practices is experienced in communicating the scale of research, as nicely articulated by one of our interviewees:
“People in the social sciences seem to be very comfortable with small systems because they feel that they can collect data on it and understand it very well... They find our project ambitious so they are intrigued by it but it seems they don’t think this is doable. So there is an inherent sense of doubt in their minds. Even though we’ve done it for over a decade and it is very clear that you can build models of this size.”
Scaling up research questions and data also leads to question of validation, since conventional methods such as model fitting to data are not necessarily most adequate, or in the words of a LaboS member “we feel that data fitting for instance is not the right approach for systems of this sort…. dose it [fitted data] means anything to me? almost nothing.”
Ad 2) Maintaining confidentiality. Unlike in the physical sciences where e-Infrastructure has been widely adopted, observational, or survey data, are typically confidential. Elaborate regulations have been enacted over the years in many countries around the world, and particularly in the US, for protecting the privacy of subjects. Institutional review boards ensure procedural compliance, including, for example, restrictions to data access to authorized investigators, which constrain the potential for research collaboration.
One advantage that SPORT offers in this arena is that the data analyzed by its scientists are synthetic, meaning that they do not represent real subjects, but rather simulated ones. E-infrastructure hence serves as a mediating layer between raw data on individuals which are protected by rules of confidentiality, by producing synthetic data that can be used for analysis. However, the interviewees recognized the potential for re-identification of individuals if simulated data were combined with additional private data sets and analyzed using a high performance computing techniques.26 Here lies a paradox in e-Infrastructure: the same resources that enable access to confidential study resources in some ways eliminating confidentiality concerns, may also lead to new concerns regarding privacy on a much greater scale. As noted by one of our interviewees “you can go to a company and buy data on specific population, at specific addresses – they put together an amazing amount of stuff—which actually makes me kind of nervous about my privacy.”
Ad 3) Sharing resources. Two types of resources have been mentioned in this context: models and compute resources.
• Models. Once models are established they may be used by other investigators to refine their own, or to be incorporated in subsequent studies. Seamlessly sharing these models among SPORT users could enhance the overall accuracy used by modellers on a much wider scale than at LaboS. Yet, our informants have indicated that it is not common practice among scientists who follow the experimental/modelling paradigm to share their models. An attempt to develop a workshop for investigating a new domain previously not explored by LaboS resulted in the following observation:
“It has occurred to me that I am essentially inviting people to get peer-reviewed again, for no benefit for them – I don’t have any money to give them. The only thing that can happen from their view point is that
26 For this reason, Public Use Microdata Samples used by US Census are not offered in high
degree of granularity, and certain Federal agencies deem simulated data confidential.
AVROSS
106
they are going to tell me about their models and I am going to use this information to my competitive advantage.”
This instance demonstrates that in a scientific competitive environment there is no apparent incentive structure for sharing data and models on e-Infrastructure; a problem which may be further exacerbated in certain fields of the social science where collaboration and sharing are not apparent. As noted by a senior staff member at Labos, while some junior social science faculty members within his university have shown interest in the work done at the lab, their willingness to collaborate was limited because their departments did not count publications with more than two authors in their tenure considerations; an institutional practice that substantively differs from comparable procedures in the physical sciences.
• Compute resources. When conducting a test on a large Grid infrastructure – much more powerful than the one used in their lab – LaboS scientists discovered that the computational duration exceeded that they could achieve using their private resources. For the common resources they were competing with other scientific groups that had higher priority. Shifting from a proprietary infrastructure to a collective one leads to a number of difficulties. At least in one case when a user needed to receive results quickly the procedure they followed was an informal one, facilitating their external associations – calling up the administrators at the Grid facility and asking them to advance their position in the compute queue. This example not only demonstrates the technological difficulties presently found with this Grid provider, it also suggests that scaling research beyond the research lab – sourcing out parts of the work currently done within the boundaries of the laboratory – creates a stronger dependency on external compute providers. Current providers may also not be at a level where they can offer a viable collective infrastructure to replace a private one. We were told by a computer scientist working with Labos that “although the resources exist, the effort it takes to bring these resources to solve a problem quickly has not been figured out by the system.” These efforts include, according to this respondent “certain policies [that need to be] put in place,” policies that adequately shift the mindset from supporting small groups of scientists to a large portion of the entire scientific community. In addition to the logistical difficulties there are also technological barriers. While Labos’s scientists have been eager to port their source code to run in a Grid environment, a computer expert we interviewed has reported that e-Infrastructure in its present state may not be suitable for certain types of computation that require “a much closer coupling of the machines.” Thus, although SPORT is a technology that represents most of the research activities at Labos, only specific parts of the research is envisioned to shift to the collective e-Infrastructure.
Ad 4) Technical complexity. The intended user population – those scientists with a “computational bent” – still need to learn much about the system in order to utilize it. As one scientist suggested, in order to use the technology one has to know “an awful lot…. you would need to learn what it is capable of, understand whether you can apply these capabilities to your question, and if you decide you could then you really just have to talk to us – and we then have to tell you whether we can help you figure this out with our methods.”
Our respondents, both scientists and software engineers, recognized that they need to simplify the interface as much as they can to enable wide adoption. One interviewee who was not a computer scientist further suggested that “if you have cool tools, very user friendly tools, then no matter where they are located people are going to find a way and try to get to them…. But it has to be in a real product form, not in a research form as it is right now. It has to be like a commercial product: user friendly and with good documentation.”

M4 Final Report
107
4.2.5 Understanding New Forms of Digital Records for e-Social Science (Digital Records) – DReSS
Introduction The project “Understanding New Forms of Digital Records for e-Social Science (Digital Records)”, short DReSS (http://www.ncess.ac.uk/research/nodes/DigitalRecord), is based at the University of Nottingham and funded by the UK’s Economic and Social Research Council (ESRC). The project started in April 2005 and lasts until April 2008.
The overall aim is to develop technologies to record, represent and replay new forms of digital data for the social sciences. Its activities are structured around the exploration of three core themes:
- Record, which focuses on the development of technologies to support the recording of events that take place in physical and digital environments, and combines them to produce new forms of records for social science analysis.
- Representation and Re-representation, which focuses on the move from the raw data collected as part of the recording process to the production of diverse and variously structured datasets to support different kinds of social science analysis.
- Replay, which focuses on marrying multiple data sources together and replaying them simultaneously to support both co-located and distributed analysis in the 'here and now', and to permit the recovery of social science phenomena for analysis in the future.
The themes are being explored by three Driver Projects, which seek to shape design through substantive social science research in particular domains of inquiry (Ethnography, Corpus Linguistics, and Learning Science). The Driver Projects combine to inform the development of e-Social Science tools of general utility that span the qualitative and quantitative divide and enable transformations between the two. These three Driver Projects are:
- Grid-based Assembly of Qualitative Records. This project will develop support for social scientists undertaking social studies of technology. The primary focus will be on the assembly of qualitative records that marry conventional data sources with emerging digital resources to better understand the social shaping of technology in interaction.
- Grid-based Structuring of Assembled Records. This project will develop support for social scientists undertaking corpus-based studies of natural language use. Its primary focus will be on structuring a Grid-enabled multi-modal corpus that combines conventional text-based representations with visual media.
- Grid-based Coupling of Qualitative and Quantitative Analysis will be driven by social scientists undertaking studies of learning to develop techniques that allow researchers to generate, manage, and track transitions between qualitative and quantitative representations of online teaching episodes and learning outcomes.
Background and involvement of the respondent In order to obtain information on the NCeSS research node DReSS, an interview was conducted with Dr. Andrew Crabtree, ethnographer, co-director of the DReSS project and lead investigator in Driver Project 1. The information and viewpoints provided in this document are based on the opinions of Dr. Crabtree.
In his understanding of e-Infrastructure, Dr. Crabtree asserts that it is a vision (rather than a reality) which is, as such, open to negotiation. Thus it is not solely about high performance computing, virtual organisation, distributed Grid
AVROSS
108
infrastructure, and workflow models but about the possibilities that computing opens up for social science research and the development of services and tools that actually respond to the needs of social scientists. From his point of view, e-Infrastructure is less about grand visions and radical new futures and more about developing services and tools that respond to current research practice and bring about change by offering new possibilities to further develop current practice. As co-director he is responsible for driving the development of tools and services that support qualitative research in the digital society and quantitative views on qualitative data. He was motivated to get involved with CI through the e-Science programme and by attending a workshop in Edinburgh which was held about 3 years ago.
When asked about the background of the project and how the project was established, Dr. Crabtree replied that it was set up “in the usual ways”: Finding a number of interested parties, writing a research proposal that is of mutual interest etc.
Technology used Within the DReSS project a software tool called ‘Digital Replay System’ (DRS) is being developed. It enables replay and annotation of (time-based) social science data sets and allows the simultaneous synchronized replay of multiple data sources, including videos, system log files, spatial data. The current development includes:
− adding support for structured analysis (coding);
− creating a rich meta-data store to allow flexible annotations and project and media meta-data; and
− managing multiple, distributed users.
The inherent data capture facilities focus on generating system logs of online interaction and combining these with video recordings and data derived from mobile and ubiquitous devices in the real world. The data analysis facilities focus on enabling social scientists to structure data and produce a coherent record from multiple sources of data. Lastly, the data sharing facilities allow scientists to search and retrieve data from persistent data archives and to collaborate in analyzing the data even if they are remote from each other.
Community structure and mobilization The user and / or developer communities involved in the three DReSS driver projects consist of social scientists who are interested in a particular research problem. Examples of such problems are: Ethnographic studies of technology in use, multi-modal language corpora, and teaching and learning outcomes in e-Learning environments. These social scientists act both as developers and as users of the DReSS Digital Replay System (DRS). In addition, DRS is increasingly used to analyse research projects in the Mixed Reality Laboratory (MRL) at the University of Nottingham (http://www.mrl.nott.ac.uk/). Members of the Real Life Methods Node (http://www.reallifemethods.ac.uk/) are using DRS in their research, and DReSS is currently engaged in discussions with Greater Manchester Police (GMP) with regards to the use of DRS. Currently, all of the users of DRS stem from academia and are located at the University of Nottingham and the University of Manchester. There is no general recruitment process for new members in the currently established communities. In fact, social scientists in the driver projects act as co-investigators in DReSS and the MRL use is fostered by the co-investigators, who are located in the MRL. Broader academic and non-academic use is encouraged through public events. All of these relationships are new and even more far-reaching links have been established through NCeSS outreach activities such as the NCeSS Showcase and invited talks.
M4 Final Report
109
Interaction between the project’s participants takes place through quarterly meetings to account for work done and to plan future work. These meetings are expanded upon with informal monthly workshops between designers and social science researchers to further develop DRS. External users receive support by DRS developers who provide training and customize DRS to meet their particular needs.
The efforts procured for the project are led by the users. It takes time and development tasks have to be prioritised, which occasionally can be frustrating for users as resources are limited. This work is currently not regulated through formal contracts. However, if the GMP decides to adopt DRS, formal contracts will be necessary.
Learning has proved to be a very important part of the research process – social scientists need to learn what is computationally possible and computer scientists need to learn how social scientists work so that appropriate tools and services can be developed that resonate with established practice.
The DReSS project also has developed ties to the US cyberinfrastructure project “SID Grid”, initiated through an NCeSS liaison programme. So far this connection hasn’t influenced the work done on the project but affiliations such as these open up the possibility for collaboration in the future (as long as enough funding can be secured).
Adoption The DRS software has been adopted by a number of members of different research facilities and the GMP is considering using the software in the future. According to the project’s co-director, a major catalyst to foster the adoption of the developed CI could be dissemination by demonstration. Nevertheless there exist obstacles that could hinder adoption by the wider scientific community. A great many social scientists are sceptical about e-Social Science and would thus have to be convinced of its benefits through first-hand demonstrations. In addition, a large part of social science research is overly theoretical and is not sufficiently motivated by methodological and empirical considerations. Thus a shift in how social science research is conducted is needed, with a greater emphasis on methodology and empirically gathered evidence. Furthermore, while UK funding councils have placed greater emphasis on e-Social Science over the last years the increased funding has not yet had as significant an impact as expected.
Impact According to Dr. Crabtree, the use of DRS has completely changed the way he works. When asked: "When you arrive to the office today, how is your work different than it was prior to the project?”, he reported that the DRS system represented a significant step forward in terms of current work practice. Ethnographers such as Dr. Crabtree study future and emerging technologies and have to work with a wide range of different resources on a daily basis: Audio and video recordings, photographs, field notes, transcripts and, ever increasingly, system logs and recordings of interaction within digital environments. Dr. Crabtree explained that the system allows him to combine all these resources and play them back side-by-side. This functionality would provide him with a "richer, more comprehensive picture of interaction" in future and emerging technological environments - which is his topic of study. The ability to combine heterogeneous resources with system logs allows researchers to gain a better understanding of interaction in the digital society and, says Dr. Crabtree, is one of the main innovations of the project.
Major milestones of success for the DReSS project are the development and usage of DRS by social science researchers within DReSS, the MRL, and Real Life Methods.
AVROSS
110
When asked about new problems, questions or theories addressed by the DReSS project, Dr. Crabtree maintained that through DRS interaction in the digital society could now finally be understood. According to him the project offers a new, alternative paradigm for his field of work when compared to the much poorer tools and resources ethnographers currently have at their disposal.
To date it is still too early to ascertain the impact of the project. However, it is certainly meeting its aims and objectives as laid out in the funded proposal and a second round of funding seeks to move beyond the driver projects and involve the broader social science community in the use and continued development of DRS.
Some people have not yet picked up on the approach presented by and the tools developed in the project. This can however be partly explained by the fact that the first public version of DRS has only been available since August 2007.
At this stage, any long-term impact cannot be estimated as it very much depends on the resources and further funding that will be dedicated to the field. A lack of funding for this kind of work by research councils, the aforementioned scepticism towards electronic solutions and the reluctance within the scientific community to become more empirically oriented are all hurdles that will have to be overcome in the future if this project is to succeed.
Personnel and resources At present, there exists no connection between research and teaching although one will be established in due course. The DReSS projected is currently focused on the initial development of tools and services. As these become more stable and uptake increases, e-Infrastructures will inevitably become a topic of university lectures. The project already has PhD students employed as researchers. These students have majored either in computer science or social science, many of them specifically in the social sciences field of applied linguistics.
The main sponsor of the DReSS project is the Economic and Social Research Council. The project’s budget amounts to €956,720 out of which all employed staff are paid. Therefore staff costs account for the largest expenses procured by the project. Training and consulting activities are also paid from the budget. The project leaders are seeking to extend the core research towards new approaches in the next phase of funding. Dr. Crabtree claims that if the project were to receive twice as much funding as it has so far, the money could be used to foster and promote broader social science involvement. On the other hand he acknowledges that a decline in funding for research related to CI would not have an immediate impact on the current DReSS project phase. However it will most likely negatively affect future project phases.
Policy input The main success of the DReSS research project so far has been the development and use of the DRS system by social science researchers within the project, the Mixed Reality Laboratory and the Real Life Methods Node. Furthermore, no failures have been reported as of yet and – Dr. Crabtree remarks – neither he nor any of the other members responsible for the project would have done things differently if given the chance.
The only recommendation towards policymakers that Dr. Crabtree would suggest is to increase funding for this kind of research in order to stimulate its acceptance and rapid adaptation within the social science community. This can be achieved by specifically funding projects which apply e-Social Science tools and services to substantial research problems.
M4 Final Report
111
4.2.6 Dokumentation Bedrohter Sprachen [Documentation of Endangered Languages] - DoBeS
Introduction to the project The DoBeS (http://www.mpi.nl/DOBES; http://www.mpi.nl/lat) programme focuses on the documentation of languages which are in danger of becoming extinct. There are currently 39 documentation projects which document one ore more endangered languages in various locations worldwide. Part of the DoBeS programme is the creation of a central archive for all collected resources (audio, video, images, text). The Max Planck Institute (MPI) in Nijmegen, Netherlands is responsible for this task. However, the archiving framework developed at MPI is not solely developed for and used by DoBeS. It is part of various other national and international projects which all contribute to the development of the overall archiving framework.
Background and involvement of the respondent The respondent is one of the archive managers at MPI. He interacts with users of the archive and is responsible for the archive’s content in a technical sense. He is not a developer himself but instead interacts with software developers about requirements and functionality of the archiving framework. The respondent provided no further information about his involvement in and his understanding of e-Infrastructures.
Technology used When the project started at the end of the 1990s there were no ready-made solutions for multimedia archiving. Therefore it mostly developed its framework from scratch. The technology used by the project includes Java server side technology, Java client applications and XML. DoBeS has taken part in the development of several standards such as the IMDI metadata standard.
With regard to the support of learning, training and documentation processes, the respondent stated that the DoBeS project is primarily concerned with the documentation of languages and that all their resources are made accessible via the web and can then be used for e-learning applications. However, no specific framework is provided by the project itself to support that. DoBeS project members regularly give training courses on the use of the archiving software.
A relationship exists between the DoBeS project and other CI technology stakeholders: While the project is single-handedly setting up a Grid of language archive servers, it also takes part in various projects and organisations working on interoperability between different types of archives. One example of this is the CLARIN (http://www.clarin.eu/) project, a large EU project on research infrastructures which for a large part was initiated by DoBeS members.
No technological constraints were reported.
Community structure and mobilization The user and developer communities involved in the project include the academic community, the language communities of the languages that are being documented, the general public and journalists. The recruitment of such communities takes place automatically. In addition, there is a lot of public interest in the archival technology developed by DoBeS and its possibilities since DoBeS has one of the largest and most advanced archives in the field.
Participants in the project interact with users and use their feedback to improve the software and adapt it to the users’ needs. Furthermore there is an annual meeting
AVROSS
112
where findings from the different parts of the DoBeS project are shared and new developments regarding the archive are presented. This is deemed to be sufficient in terms of interaction as the various DoBeS documentation projects mostly work individually.
The DoBeS project is connected with other projects in the US, the UK and several other European countries: DoBeS is part of the European DAM-LR (http://www.mpi.nl/dam-lr) project, the DELAMAN (http://www.delaman.org) network, the European CLARIN project and has been part of various other international projects in the past. DoBeS also takes active part in the development of several ISO standards related to language archiving technology.
On the other hand the project itself is influenced by other projects. As the respondent mentioned, DoBeS members are always on the lookout for what their colleagues are doing, especially those in the US and Australia. Collaboration between related projects has led to mutual agreements on the type of technology being used and to the development of common standards.
Adoption The e-Infrastructures developed within the project are already in use today. The project has established a number of instances of its archiving framework in different locations and will continue to do so in the near future. Some of the locations include IIAP (Iquitos, Peru), Museo do Indio (Rio, Brazil), CAICYT (Buenos Aires, Argentina), SOAS (London, UK) and Kiel University (Kiel, Germany). According to the respondent, the project is a pioneer in the area of language archiving and only few different solutions with the same set of functionalities are available. Still, national and/or institutional interests might be an obstacle to having the framework adopted by people in the wider scientific community. For example, when an institute is related to a project working on a similar solution, it is more likely that that solution will be chosen.
Impact That the work maybe different prior to the DoBeS project was not reported by the respondent. The following major milestones of success were mentioned: The establishment of a large archive and a widely adopted archiving framework, the development of various widely used tools, both web-based and client-side, and the creation of awareness for the necessity of properly archiving resources. The main innovation that has emerged from DoBeS is their solid, advanced language archiving framework. The future focus of the project will be to achieve interoperability with other archives and to support the creation of customized user interfaces.
Alternative paradigms in the field of the DoBeS project were not mentioned by the respondent. Quite contrary, the respondent maintained that while people may choose different backend frameworks and different technological solutions, the basic principle always remains and should remain the same. According to the respondent another indication of the impact the project has had is that many DoBeS tools are widely used by the linguistic community today, most of all the annotation tool ELAN (http://www.lat-mpi.eu/tools/elan/).
The future impact of e-Infrastructures in the field that DoBeS works in will likely be big. Having access to archived resources is going to be increasingly important in linguistics. It will facilitate many studies which previously were very difficult to perform, e.g. searching for similar phenomena in different languages.
M4 Final Report
113
Personnel and resources The DoBeS documentation projects involve PhDs as well as students. Thus it can be maintained that within DoBeS there is a connection between research and teaching. However, the students are not involved in the development of the archiving framework. With regard to project funding it was mentioned that DoBeS is a project that is funded by the German Volkswagen Stiftung (http://www.volkswagenstiftung.de/index.php?id=3&L=1). There is currently no information on the budget available. The main expenses associated with the archive infrastructure project are costs for the personnel developing the software architectures. Since the MPI for Psycholinguistics is involved in several other projects, it receives additional funding from a number of different sources for the development of various parts of the archiving solution. The general trend towards a decline in funding for research related to e-Infrastructures seems to not have had an impact on the DoBeS project. The archive manager could not identify such a trend in the field DoBeS is involved in at all since the MPI for Psycholinguistics has been rather successful in obtaining funding from the European Union.
Changes Since the DoBeS project has been developing the framework for ca. eight years now, many changes have taken place from the original planning over the course of the project. The respondent was not able to list specific changes that have occurred but had no doubts that the goals and the focus have changed throughout the course of the project.
Policy input The respondent did not mention anything concerning the successes or failures of the DoBeS project or what could have been done differently - if they would have the opportunity to.
In terms of recommendations towards fostering the uptake of e-Science in the social sciences and humanities, it was his opinion that although the EU has clearly expressed an interest in supporting the development of e-Infrastructures through the granting of the CLARIN project, it would be helpful if this support could be sustained over a longer period of time.
4.2.7 TextGrid
Background TextGrid (http://www.textgrid.de) engages in the development of a virtual research library that aims to satisfy the specific needs of text-oriented scientific domains. It develops a toolset to help scholars to process, analyse, annotate, edit and publish text data. Basically TextGrid allows tapping text corpora, labelling them and connecting them to metadata. For instance, researchers may search for autographs and compare different editions of a text. TextGrid helps to embed text in certain contexts through linking it with background information like the history of its reception.
Key user communities of TextGrid will be researchers in philology, linguistics and related fields. Based on a Grid-enabled workbench its design is modular to ease
AVROSS
114
future implementations of new tasks. All modules are integrated in one user interface. Examples for such modules are:27
• Text processing tools like an XML editor, a metadata annotations tool, a dictionary, a streaming-editor, a tokenizer, a sorting tool, etc.,
• Text retrieval tools like a query interface,
• Link editors like such for pictures and texts, text and text etc.,
• Administrative devices like editors for the technical workflow and editors for the administrative workflow.
Eight partners work to establish the TextGrid. Project Coordinator is the Goettingen State and University Library. The further partners are:
Five higher education institutions
• Technical University Darmstadt
• Institute for the German Language
• University of Trier
• University of Applied Sciences Worms
• University of Würzburg
plus two companies
• DAASI International GmbH
• Saphor GmbH
TextGrid is the only non natural science project in the German D-Grid initiative. This initiative funds projects to facilitate a sustainable development of Grid technology and e-Science methods in Germany.
Technology and standards TextGrid does both, it uses existing technology and standards and develops new ones. It is an open-source project using open-source programs and open standards.
The project started with an analysis of the needs of the potential community. It turned out that some of the planned tools already existed isolated as e.g. intranet or desktop applications. They had been developed independently by different researchers in different ways and computer languages. A very open generic infrastructure was needed to integrate those tools in TextGrid. Specifications could only be set in a very carefully and diffident way to become accepted in the community. Hence, it has been designed as open workbench for a potentially large number of different tools always being ready to integrate new tools.
All tools are integrated horizontally in the TextGrid workbench (see Figure 4.1). The workbench is subdivided into four vertical layers:
1. The user environment. Users may use different, user-defined environments to fulfil their specific needs, for instance an offline version etc.
2. The service layer encapsulates specific complex functions via web services based on standards like SOAP, WSDL etc. which may be recombined in any needed way to integrate them in different user environments. External
27 Most of the tools exist in a beta version only up to now. One of the few in alpha version is e.g.
the XML editor.
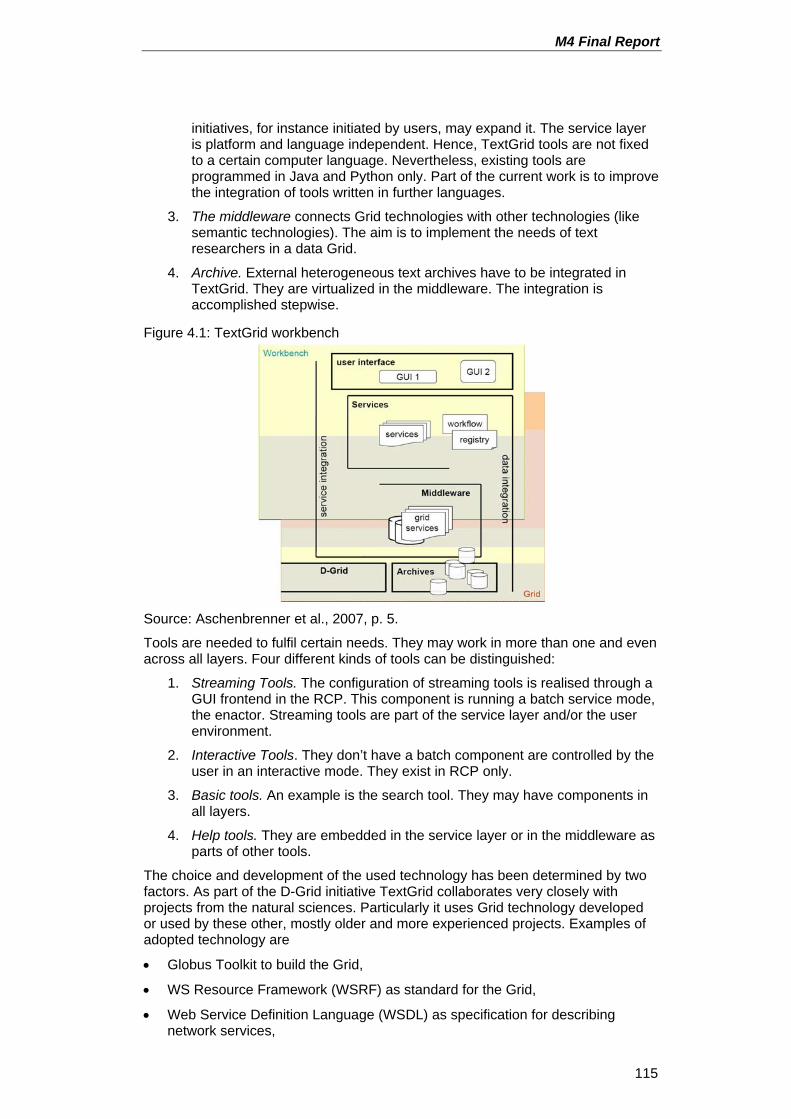
M4 Final Report
115
initiatives, for instance initiated by users, may expand it. The service layer is platform and language independent. Hence, TextGrid tools are not fixed to a certain computer language. Nevertheless, existing tools are programmed in Java and Python only. Part of the current work is to improve the integration of tools written in further languages.
3. The middleware connects Grid technologies with other technologies (like semantic technologies). The aim is to implement the needs of text researchers in a data Grid.
4. Archive. External heterogeneous text archives have to be integrated in TextGrid. They are virtualized in the middleware. The integration is accomplished stepwise.
Figure 4.1: TextGrid workbench
Source: Aschenbrenner et al., 2007, p. 5.
Tools are needed to fulfil certain needs. They may work in more than one and even across all layers. Four different kinds of tools can be distinguished:
1. Streaming Tools. The configuration of streaming tools is realised through a GUI frontend in the RCP. This component is running a batch service mode, the enactor. Streaming tools are part of the service layer and/or the user environment.
2. Interactive Tools. They don’t have a batch component are controlled by the user in an interactive mode. They exist in RCP only.
3. Basic tools. An example is the search tool. They may have components in all layers.
4. Help tools. They are embedded in the service layer or in the middleware as parts of other tools.
The choice and development of the used technology has been determined by two factors. As part of the D-Grid initiative TextGrid collaborates very closely with projects from the natural sciences. Particularly it uses Grid technology developed or used by these other, mostly older and more experienced projects. Examples of adopted technology are
• Globus Toolkit to build the Grid,
• WS Resource Framework (WSRF) as standard for the Grid,
• Web Service Definition Language (WSDL) as specification for describing network services,
AVROSS
116
• Service Oriented Architecture Protocol (SOAP) to provide a basic messaging framework on which layers can build.
A second determining factor is the integration of projects from the humanities. Before TextGrid there were several projects trying to do what TextGrid does and one aim is to integrate all these projects into one single framework. Therefore some of the technology and standards like TEI-XML encoding scheme have been adopted.
TEI is one example for a technology that has been significantly enhanced by TextGrid. All interview partners agreed that the process to develop such new technology has been very hard and drastic. It was not easy to find even a common language among researchers from the humanities and computer sciences like Grid specialists. The definition of common requirements and cross-disciplinary communication was a long process and even more problematic than the technical realisation of TextGrid itself. One interviewee called the process a “ping-pong process”: A technician making a suggestion that the humanities researchers didn’t understand, responding consequently in a way that the technicians didn’t understand. The communication problem was solved through putting team members with different backgrounds into one “basket”. In a first step one technician and one researcher from the humanities developed together a plan thus learning from each other. This plan was the common basis to integrate more researchers into the team.
There have been few training events up to now. The development of an e-learning concept and a related platform are key elements of a future work package.
Community structure and mobilisation Since TextGrid is still under construction the community is relatively small and consists currently of few prototype users only. The existing community members are all from academia, highly motivated and fully embedded in the development process. The main two tasks of the current work are to improve the developed standards and to enhance the technology. Both require the collaboration with the community but the ongoing development process does not allow a large user community.
Like training the mobilisation of users and promotion of TextGrid is part of a future working package. Despite that the future community is not clearly defined yet. However, there are a lot of requests from all over Europe to open TextGrid for current projects. Especially surprising for the team members is, that these requests come from very different research fields and not just from the linguistics and text, language and literature sciences as targeted originally. Some are from the social sciences or related fields like dramatics etc.
A plan how to contact potential community members does not exist so far. Despite the many requests to use TextGrid, e-Infrastructure is not yet widely accepted in the humanities. It is considered a challenge to make TextGrid a living member of the humanities community. Only via new projects will it be possible to finance the continuation of TextGrid and for this purpose an active user community will be essential.
Personnel and Resources TextGrid is divided into six work packages. Every work package is led by another organization or company. The team of coordinators at Goettingen library consists of two scientists plus a student assistant. Both scientists work almost exclusively for TextGrid but are involved in tuition at the university. Overall are 30 scientists engaged in the project. Twenty-three of them are graduate students. Most of the scientists have a humanities background. People with a background in
M4 Final Report
117
management or the like are not included which is considered a weakness among the team members.
TextGrid has been evaluated by the German Federal Ministry of Education and Research (BMBF) receiving governmental funding since February 2006 with a budget of 1.6m Euro and a term of 3 years. During the life of the project it has been necessary to increase the budget to about 2m Euro. It turned out that the primarily planned storage space has been underestimated. Thus new technology had to be bought.
Impact Since TextGrid runs in beta version only it has not caused any significant impact as yet. Among humanities researchers the level of prejudice against computer technology is quite high. However, those who are open to new technologies and approaches appreciate TextGrid and are euphoric. New fields of research have been reported inspired by the new technological possibilities. But the diffusion to the potential user community is still at the beginning and only the small beta user group is currently involved in the project. A very first step to raising acceptance is the integration of TextGrid into educational programmes at Goettingen University.
It is very likely that TextGrid will have a follow-on project. The Federal Ministry of Education and Research has already signalized that the link between Grid technology and repositories will remain an important area for building tools for the humanities. Thus stability and continuity are very likely.
Barriers and recommendations The interviewees complain that the German funding policy usually does not cover a full-time project manager. However, a project manager for documenting all steps and tasks of the project is considered to be crucial for its success. Since communication is the most important problem to solve a clear communication is essential. In the funding scheme project management is not considered as a separate task that should be done by specialists. Therefore, it has to be done by more or less all team members in parallel to their other project tasks as specialists in non-management fields. Hence management and especially documentation become second class tasks in every day work constraining the success of the project in the long run.
It is still hard to make a proposal for researchers from the humanities especially in such a technical field like Grid technology. The “style” and culture of humanities and the natural sciences are very different and the former are not always taken seriously.
The sponsoring policy in German Grid technology postulates a financial involvement of all participating users constituting a barrier against trying out a new technology. The interviewees propose that free access to Grid technology would raise the demand dynamically. Thus the sponsoring policy should rather include universities than individual projects as financing partners.
4.2.8 FinGrid (pseudonym)
Background The FinGrid project was conceived upon a call from the national Ministry of Research for projects that addressed the modelling of complex systems. It was evaluated positively and funded from November 2003 to November 2006 with a six months extension till April 2007.
AVROSS
118
Its original aim was to use the Grid paradigm for research on complex systems in economics and finance. The development intended to produce a national facility for economic and financial data based on Grid technology, and supply the user community with a basic set of user-friendly data management commands for uploading/downloading data to/from the Grid, for removing and browsing the data, and for all the usual file manipulation operations. This should enable researchers to study problems that could otherwise not be addressed given the computing resources locally at their disposal.
FinGrid was the first project in which the technical developers developed and applied Grid technology for a professional purpose. They started to work on Grid applications out of professional interest for a topic that had become very en vogue in computational physics around 2000-2001. The Large Hadron Collider (LHC) Grid (http://lcg.web.cern.ch/LCG/) was being built by the High-Energy Physics (HEP) community and the topic was pushed very strongly. However, their institution was not involved in HEP and it was somehow left outside of these developments in computational physics. It had, however, a community of statistical physicists who happened to be very interested in financial problems. Moreover, their approaches always have been very computer-intensive and they considered the Grid as a way to get computational power. The application of Grid technology to finance thus became a logical consequence of the collaboration of statistical physicists with economists and finance researchers which were interested in finding out how relevant grids were for their field.
Technology The contract with the project sponsor required that existing Grid middleware was used and thus the collaboration with the key national player of HEP and related Grid developments and contracting partner in the Enabling Grids for e-Science (EGEE) project was established. The relationship to EGEE intensified throughout FinGrid in technological regard: FinGrid implemented and used the LCG (LHC Computing Grid) middleware and subsequently the gLite middleware in order to satisfy the requests from their finance user community.
The first release of FinGrid took place in October 2004. It consisted then of a two-tiered topology: peripheral sites with low bandwidth providing Grid services only to local users, central sites with high bandwidth providing services to the whole community.
As the close link to existing middleware and EGEE had been established in the project contract, so it was not possible to change it, though the interviewed FinGrid developers presumed that it would have been simpler to redo many things without using what was available at that time from EGEE. The LCG/gLite was described as problematic for use by the FinGrid user community in several regards: limited usability of the software from the end user point of view, complex installation and maintenance of a gLite Grid site, poor documentation and no controlled access to files in Grid storage.
The last point was critical, as FinGrid was subject to a particular legal constraint: the disclosure regulations of the stock exchanges demanded that special attention was paid to privacy and data security issues, i.e. that not all users within the FinGrid user community had indiscriminate access to all stored data. For example, some researchers may have an exclusive contract with the London Stock Exchange, while others may have an agreement with the New York Stock Exchange for information pertaining only to specific companies. FinGrid implemented technological solutions to regulate data access which were then also considered useful by other communities on the EGEE infrastructure (see below). A former FinGrid user reported a different type of solution to this problem: at his current (non-Italian) organization access to the entire Grid including its data
M4 Final Report
119
resources is possible; access is managed at the organizational level and organizations included in the network have access to the Grid-based resources.
Several problems led to a second, new release of FinGrid in June 2006:
• One large computing site was insufficient to demonstrate the Grid potential for distributed resource allocation.
• The two-tiered topology was problematic, as the local users lacked the necessary skills for installing and maintaining the peripheral sites and the FinGrid team itself had not enough manpower for this. Hence, the topology was dropped by giving up on peripheral sites altogether.
• Lacking support for security and privacy of stored data on the middleware; the resulting workaround was complex and had scalability limits;
• Only a small part of the community adopted the command line tools and the user interface distributed through the Live-CD technology; “although users had been spared the need to reinstall their workstations, they complained the usage was awkward and that it was interfering with their way of working. A web portal, then, promised to be a very good tool to address these issues.” (FinGrid technical developer)
Another key technological constraint couldn’t be solved in a satisfactory way: to integrate into the regular Windows computing environments of the wider user community. It would have been an order of magnitude too complex for the available resources and beyond the project’s timeframe. Even confining the project to the Linux environment, it was not trivial in the end, because of the necessary glitches and required system support. Higher reliability of the technology and an interface with little entry costs for the users would have been essential for gaining a larger user community.
Different approaches were tried for training and teaching the users: a testbed was always available on which researchers could log-on and learn how to use the Grid; the Live-CD technology was used to install a Grid where a training session took place without having to reinstall local machines; later in the project a virtualised Grid that was self configurable in 15-20 minutes was used. In addition events were organized where end users would bring along an application they used for their research, which would then be Grid-enabled and launched on the Grid during the training event. Documentation was handled through a Content Management System, accessible through a website.
Over the entire duration of the project, FinGrid developed three tools:
1) Data management tool for guaranteeing privacy and security of the high-frequency data coming from stock exchanges which were subject to very strict access policies;
2) Web portal: for facilitating Grid use the FinGrid portal was built on technology from Hungary;
3) A live-CD which contained all the LCG middleware at that time was developed to help users with setting up the Grid: through booting a Linux computer from the CD they were able to set up a node in the computational Grid. Soon it was realised that this live CD was a nice learning tool.
Community structure and mobilization Developer community – EGEE: Though FinGrid was tightly linked to EGEE and its large developer community, the collaboration was described in the interviews as rather problematic. The main problem consisted in the small size of the finance and econo-physics community behind FinGrid, which had rather little weight compared
AVROSS
120
to other communities within EGEE. Hence, the requests and contributions put forth by FinGrid were not readily accepted. Moreover, EGEE was described as an attempt to convert a tool conceived for HEP into a tool that was of interest to science in general. However, the core technology and the developer community were high-energy physicists and it took a lot of time before needs that were extraneous to HEP became just listened to:
“We had some needs that were specific to our community, for instance, just to mention the biggest, the problem of security. That was not specific to our community in the sense that no other community could be interested, but certainly HEP would not be interested. It was an important topic for medical sciences, another, much bigger community. EGEE was a physics project that was trying to expand but didn’t have a lot of resources to become general purpose.” (Interview FinGrid site coordinator)
In the early days of EGEE it was also often unclear who assumed responsibility for particular issues, for instance data security. These problems translated into problems inside the FinGrid developer team, as team members didn’t get answers to their questions and became frustrated with their work. This situation improved and became more motivating again, as the FinGrid people got to know the EGEE community better.
Upon the second attempt FinGrid became an unfunded Virtual Organization (VO) within EGEE-II with its own portal. Other collaborations with groups working on related issues could not be established: in one case it was due to the different middleware that was used; in another case, the European project BEINGRID, it didn’t advance beyond initial contacts.
User community – public science: The FinGrid infrastructure is available, but it is only used to a small extent by the original user community right now. Requests from users are satisfied when possible and not requiring large-scale adjustments or support, as the FinGrid funding has ended.
The core user community who used the infrastructure intensively consisted of very few people, in the order of ten, all from national universities and public research institutions. They mainly belonged to academic groups in finance, statistical physics, econo-physics and economics. They were linked to the FinGrid team through the community of statistical physicists at their local institutions with whom they had collaborated in the past or they had been requested by the funding body to implement their analyses on FinGrid. The number of involved institutions remained constant throughout the project, however, some new users from affiliated groups joined as the project developed.
Interaction between users and developers was realised through several meetings every year. These meetings were targeted towards end users (finance researchers) to teach the use of the infrastructure, and system administrators who had to install and maintain a Grid site. Global meetings of all involved institutions were related to releases of the environment, when some substantial improvements could be presented. In the first year some trips to the different institutions were added as well as visits to Trieste from individual sites.
Users contributed in several manners: First, all the data in FinGrid belonged to users. Moreover, they explained their requirements regarding the processing of the data: for instance, a lot of discussion was related to how the data could and should be filtered. Providing their applications to the developers the latter ported and integrated them into the FinGrid infrastructure. They provided the computational power and the infrastructure and the idea how to use it. This exchange between users and developers needed continuous interaction. Interaction between different users was less pronounced and it was explained by one of the users with the fact
M4 Final Report
121
that there were only few users with different backgrounds (mathematics, physics, economics, and statistics) and approaches.
The dissemination of the technology to a wider user community was not pushed very hard; as the first tests with users demonstrated that they were finding it difficult to use the tools. So the developers concentrated on improving the experience of the existing users instead of expanding the user community, which looked like the more productive approach. Only towards the end there was a call for proposals to bring in some new users from the affiliated institutions which produced some responses. Only lately after the original project had been terminated, appeared a new user from a foreign university.
The FinGrid developers also have come to the conclusion that the public user community did not have a strong motivation of using the Grid. This was explained with the structure and content of the current European Grid which is just providing large computational resources, but not much content that can be used by wider user communities (see below). In addition, the domain researchers who wanted to use FinGrid were confronted with learning efforts and time to bring their applications to the Grid (see below).
User community – private finance research: The project received some attention from the private finance community, too. In particular software and IT consulting firms with clients in the financial sector showed interest. The FinGrid team managed to engage an enterprise software firm that is very active in financial services in a follow-up research proposal to FinGrid that, however, did not pass the evaluation. The firm committed itself to sharing 2000 software licenses for the EGEE infrastructure to facilitate a mixing of the tools provided by the public EGEE infrastructure and their tools, the private Grid technology applied to finance. This shows that the public developments were actually of interest for private applications. As the research proposal didn’t get funded the current interaction with the private finance community is just limited to knowledge exchange.
It is not the infrastructure, but mainly the technology that captures the attention of players from the private sector. Private finance institutions resemble public research organizations in regard to the compartmentalisation between different departments and the need to share resources and protect the data. So, the Grid is an important technology to share resources in a controlled way.
The finance sector and its IT consultants hence pursue several own developments in this area which are, however, usually not made public. According to the perception of the FinGrid interviewees it is a lot more advanced than the academic sector.
Personnel and Resources The developer team in Trieste consisted of a maximum of 5 people of which two dedicated their efforts to porting applications on the infrastructure. The people were mathematicians, engineers and physicists, all with a background in the IT sector – more precisely from the Linux community – hired specifically to work on FinGrid. People with a background in finance were not included, as the developers mainly had to provide the technology and take care of the infrastructure, but not engage in any type of analysis with the data. It was not an easy undertaking to find the developers as the needed skills were not readily available at that time (and neither they are right now). Students were not involved, because the principal developing organization is not a university and doesn’t have any students.
The development of the web portal was done in collaboration with another team from Hungary, as their technology was used and modified for the portal.
The total project budget consisted of 900,000 Euros of which two thirds were allocated to the main developers for developing the infrastructure. FinGrid was
AVROSS
122
funded by the national Ministry for Research; other sponsors were not involved. The main costs were personnel costs. The project developers did not perceive any funding problems or shortages throughout the project. If significantly more money had been available they would have invested in programmers located at their users’ organizations to deal with problems of software instability and support. This has been voiced as one of they key barriers to adoption: as finance researchers themselves – like many other user communities even in technical and science fields, according to the opinion of our interview partners – lack computing skills to use the Grid themselves, they fall back on existing tools and applications. To avoid this, the interdisciplinary collaboration with computer scientists/engineers and domain scientists needs to be intensified in whichever way possible (see below).
Relationship to established practices and policies The main advantage of doing financial calculations on the Grid lies in its larger computational power and the ability to do calculations quicker as well as use computing resources more efficiently. This advantage cannot be denied, but for several reasons, both specific to the FinGrid project and community as well as generally applying to the European Grid infrastructure, it has not been realised. Mainly the following reasons were mentioned by the FinGrid interviewees:
1) The current European Grid uses an approach that is not in line with the needs of the finance community,
2) Communication problems between the academic finance community and the technical developers,
3) Technology and content need to be provided to facilitate state-of-the-art research.
4) Changing research practices as the Grid becomes more common
Ad 1) The current European Grid uses an approach that is not in line with the needs of the finance community. The European Grid is not a good place to run computations of the scale that is usually requested by the academic research community in finance.28 The Grid is good at providing thousand CPUs and doing very large computations quickly – however, the academic community does their computation with little time pressure. Moreover, most of the computations can be done by using a small cluster and in case of specific (and very rare) large scale needs there are still supercomputer sites that can be visited. The European Grid is not a place where you would go to in order to obtain two hours of computing, it functions at a different scale, a scale that is however rarely needed by academic finance research.
In addition, the approach to computing was described as different: The EGEE environment is not interactive, and researchers can’t simply do calculations and get back the results immediately, as finance researchers would expect according to their work practices. “Batch mode”, submitting a list of jobs and getting back the results the next day or later, is something that is not common in this community and therefore clashes with the day-to-day work practice.
FinGrid interview partners suggested either to strengthen the roles of other communities outside of HEP in the development of a European Grid Infrastructure in order to improve the matching between the working mode (and flexibility) of the infrastructure and the needs of the varied user communities; or, using a different approach, to keep Grid for HEP and other user communities separate, if the needs of different communities are better served this way and by providing different tools. This was also to some extent confirmed by a former FinGrid user who finds his
28 It might be different for private finance research, but, as mentioned elsewhere, private firms
would not use a public infrastructure for reasons of data security and secrecy.
M4 Final Report
123
needs better served by a proprietary Grid engine provided by a software firm, though he also mentions some disadvantages of not having an open Grid standard.
Ad 2) Communication problems between the academic finance community and the technical developers. Cross-disciplinary communication proved cumbersome and wasted resources in several instances in FinGrid. Misunderstandings took place frequently and after presumed problems had been solved by the developers, it turned out that the actual problems had been somewhere else:
“If I had to summarise the relationship to the users, “I didn’t mean that” would be the most concise explanation.” (Interview FinGrid site coordinator)
Another issue is the flexibility of the tools and computations: academic finance research does not rely on standard, frequently used tools. They instead develop many small tools which are tried and used for short periods of time to do specific tasks. This created problems in the development of the FinGrid infrastructure which were perceived as being due to a non-formalised and unstructured way of research in finance:
“So, it was difficult for us, because their tools where ever changing. So it was difficult to sit down and identify the needs that they have. We can bring the code on board which costs us a couple of months, and then they need it just for one month. There is very much non-structured research going on in this community which makes it difficult to find the right way to work.” (Interview FinGrid technical manager)
A FinGrid user confirmed this view at least partially by conceding that “we were not clear on what we needed and what the Grid could do.” A developer proposed a concentrated effort to find or develop applications that are standard tools of analysis for the field to deal with these different work practices.
The problem of different languages of provider and users was crucial and not simple to solve. “Translators”, interface figures, were proposed as one possible solution to avoid these misunderstandings and bridge the language barriers. They would stand between the technical developer and the user communities, be familiar with the working practice of the users as well as with the European Grid Infrastructure. They would need to translate from one side to the other, in disciplinary terms and in terms of the vision that each side has, what it is offering, and what it wants to see on the other side. They would act as mediators, look into the needs of the research community, formalise these needs and have an impact on the developers, as they can express themselves in a language understood by them. These translators would also need to be easily available, ideally sitting next door to the users. Long distance telephone calls and emails don’t provide the necessary communication richness and people would not use them but try other workarounds.
In order to spread the Grid among SSH a different approach would also need to be found in training and dissemination events. The language with which a scientific community is addressed, that has identified its needs of computational power quite clearly, needs to be different from the language used for a community with fewer computing skills and less structured and formalised problems.
Ad 3) Technology and content need to be provided to facilitate state-of-the-art research. The provision of computational power is important, but not the only aspect for doing successful research in finance with high-frequency data from stock exchanges. At least as important is the possibility to access, store and use the proprietary data in an efficient way.
The first stepping stone in this process is the purchase of the data from stock exchanges, banks or other sources which demands special contracts, if consortia of researchers from several organisations want to use them. The writing of such
AVROSS
124
contracts needs legal expertise which the users, finance researchers, don’t have. Moreover, as the data is not for free, funding regulations need to include this type of costs.
After the data is purchased, it needs to be processed before any type of calculation can be done. This processing is labour-intensive and costly and one of the possible gains that might result from a shared data infrastructure.
Data access can then be granted to all people that have the right to access and work with it which means that clear data access regulations and their enforcement need to be established on the infrastructure. Essentially what is needed to do research in finance is an information infrastructure and not only technology and computational power:
“I have the impression that from the point of view of the EU infrastructure is something which is of course focused on the infrastructure itself, the hardware and software, but which is not related to the information inside, at least for us in the field of social science. I think it will be extremely important that the infrastructure must not just be a computer infrastructure but also an information infrastructure.” (Interview FinGrid user)
FinGrid advanced in the direction of creating such an information infrastructure for finance in some important aspects, in particular in regard to data management and enhancing usability. However, the problems listed here affect usability and demand solutions at other levels.
Ad 4) Changing research practices as the Grid becomes more common. The interviews also showed that technology developers’ possibilities to training their users are limited: they do not fully understand what the users actually want to do and find it hard to translate what they can offer into a language understood by the users. One FinGrid user suggested that research practices change over time and the next generation of finance researchers will need to be able to work with grids in order to do their research. Datasets in finance are becoming too big to be used on individual computers. The change is yet an evolutionary and not a revolutionary one. One Grid user in finance described his practice as follows: he uses the Grid to carry out statistical analyses with data series of different stocks; the analyses are first programmed and tested with one data series on a local Linux machine and then, if the test is successful, ported to the Grid where the same software applications are installed; then they are run on the Grid with the larger amount of data. So, essentially the Grid contributes to reducing computing time in this case.
However, in order to achieve this inclusion of the Grid in finance research several preconditions need to be fulfilled: 1) hardware and grids need to work in a reliable way, 2) software tools need to be available on the grids, and 3) computing knowledge and coding skills as well as the awareness of how to use it for research need to grow in the finance community. The latter issue entails that innovative finance researchers need to pass on their experiences to graduate students and the next generation of researchers. One of the first examples where this is being practiced should be the Stern School of Business at New York University (see http://www.youtube.com/watch?v=e5zsMTf9YpQ).
Impact As described in a project presentation, FinGrid had a strong commitment for training and the dissemination of Grid technology applied to finance. This would need to be measured at first level by the size of the user community; at second level the actual impact, such as the amount of published work done by the user community would need to be measured. The FinGrid key technical developers concede that the project was not very successful at either level.
M4 Final Report
125
However, the FinGrid project nevertheless managed to make some impact above all in the community of Grid developers: gLite is perceived as more user friendly, the documentation has improved and the EGEE developer community has been sensitised for the issue of data security and access management. This impact was mainly realised through having tools that were developed in and for FinGrid accepted as parts of other e-Infrastructures, so far in particular in the EGEE environment:
− Part of the live-CD, the training tool in FinGrid, has been adopted for dissemination activities in EGEE.
− The data management tool is implemented in a storage management infrastructure that was developed together for EGEE. It is a stable tool that is very well interoperable with other tools and one of the competitors for the data management solution in EGEE.
− The portal is still confined within FinGrid, as offers to share it could not be realised because the necessary support can not be provided.
The involvement of the industrial world could be considered as another success of the project (see above).
The success of FinGrid is thus visible in other communities than the originally addressed reference community; whereas the failure mainly consists in not establishing an active user community. The FinGrid technical developers suggest that in e-Infrastructure development projects the roles of users and providers should be clearly defined in the manner of “masters and slaves” to avoid this reason for failure: the users should be the masters of the project telling the Grid providers, the slaves, what they actually need and what should be achieved. This model should also rule over the research interests of the involved computer engineers. Although the borders between technical development and research are fluid, it should be clear from the beginning that the main focus of an e-Infrastructure project is to produce running e-Infrastructure.
4.3 Synthesis of the investigated cases This section compares the eight analysed cases and synthesises the findings. An overview is provided in the following tables and the most important issues are discussed in the text below.
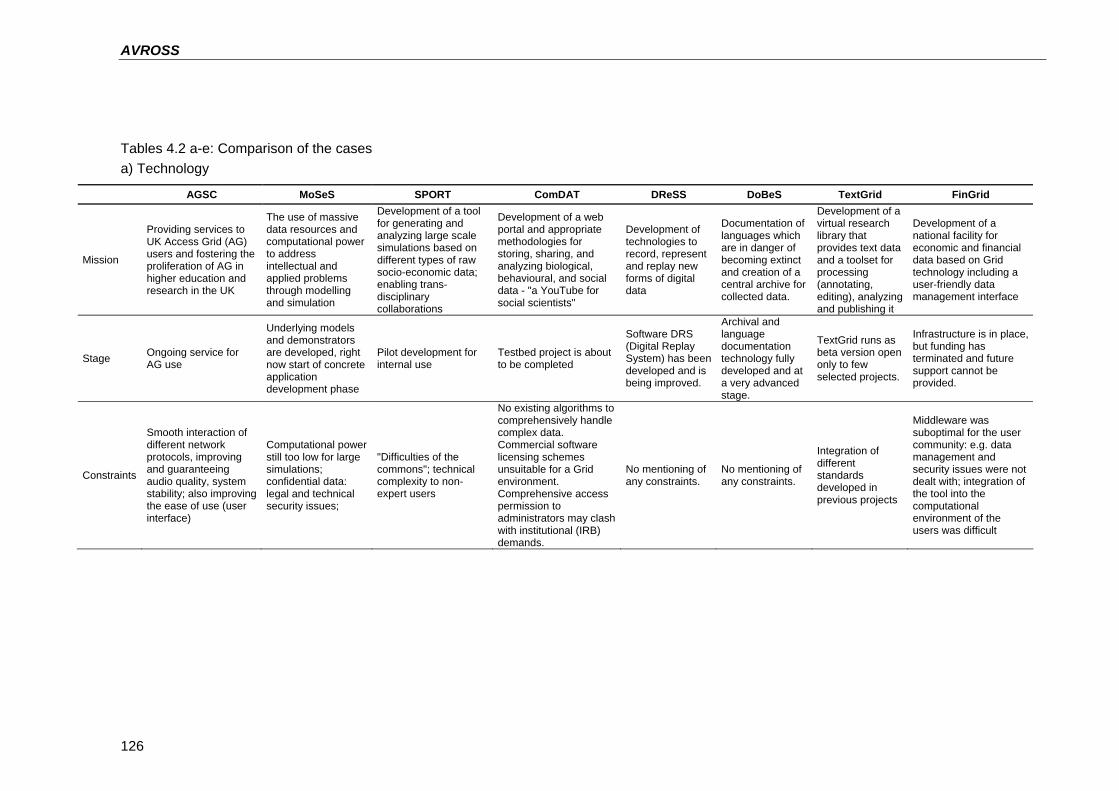
AVROSS
126
Tables 4.2 a-e: Comparison of the cases a) Technology
AGSC MoSeS SPORT ComDAT DReSS DoBeS TextGrid FinGrid
Mission
Providing services to UK Access Grid (AG) users and fostering the proliferation of AG in higher education and research in the UK
The use of massive data resources and computational power to address intellectual and applied problems through modelling and simulation
Development of a tool for generating and analyzing large scale simulations based on different types of raw socio-economic data; enabling trans-disciplinary collaborations
Development of a web portal and appropriate methodologies for storing, sharing, and analyzing biological, behavioural, and social data - "a YouTube for social scientists"
Development of technologies to record, represent and replay new forms of digital data
Documentation of languages which are in danger of becoming extinct and creation of a central archive for collected data.
Development of a virtual research library that provides text data and a toolset for processing (annotating, editing), analyzing and publishing it
Development of a national facility for economic and financial data based on Grid technology including a user-friendly data management interface
Stage Ongoing service for AG use
Underlying models and demonstrators are developed, right now start of concrete application development phase
Pilot development for internal use
Testbed project is about to be completed
Software DRS (Digital Replay System) has been developed and is being improved.
Archival and language documentation technology fully developed and at a very advanced stage.
TextGrid runs as beta version open only to few selected projects.
Infrastructure is in place, but funding has terminated and future support cannot be provided.
Constraints
Smooth interaction of different network protocols, improving and guaranteeing audio quality, system stability; also improving the ease of use (user interface)
Computational power still too low for large simulations; confidential data: legal and technical security issues;
"Difficulties of the commons"; technical complexity to non-expert users
No existing algorithms to comprehensively handle complex data. Commercial software licensing schemes unsuitable for a Grid environment. Comprehensive access permission to administrators may clash with institutional (IRB) demands.
No mentioning of any constraints.
No mentioning of any constraints.
Integration of different standards developed in previous projects
Middleware was suboptimal for the user community: e.g. data management and security issues were not dealt with; integration of the tool into the computational environment of the users was difficult
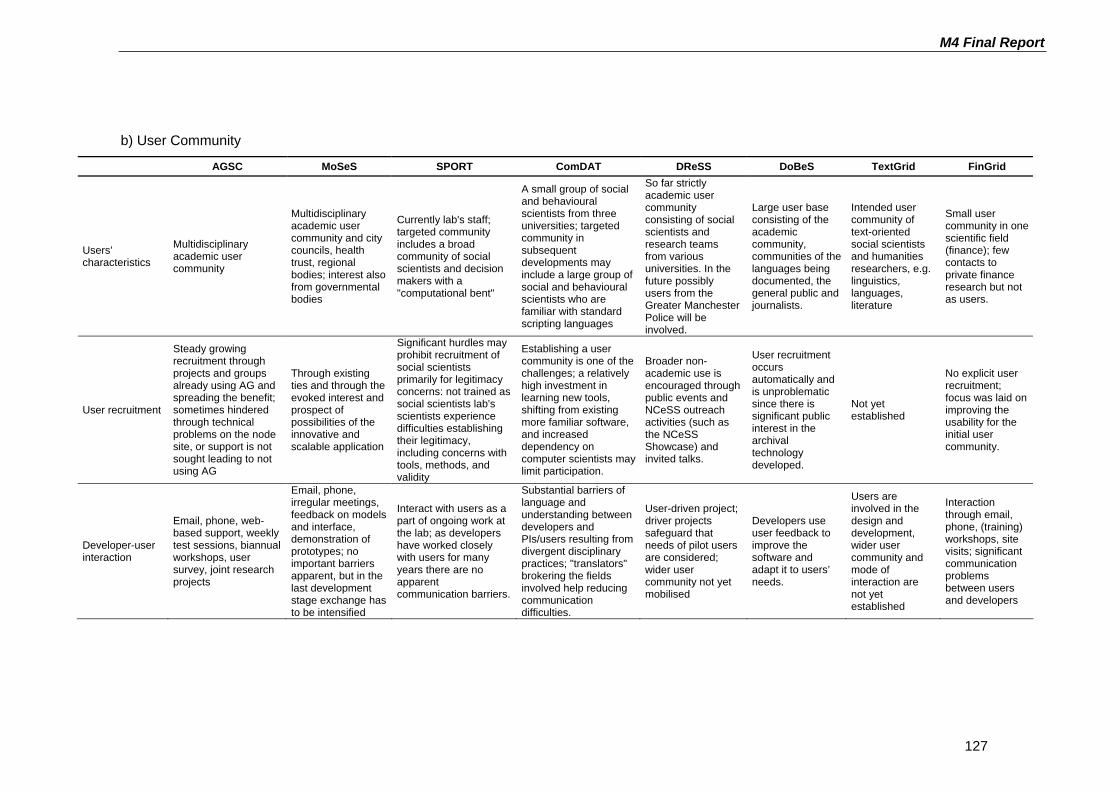
M4 Final Report
127
b) User Community
AGSC MoSeS SPORT ComDAT DReSS DoBeS TextGrid FinGrid
Users’ characteristics
Multidisciplinary academic user community
Multidisciplinary academic user community and city councils, health trust, regional bodies; interest also from governmental bodies
Currently lab's staff; targeted community includes a broad community of social scientists and decision makers with a "computational bent"
A small group of social and behavioural scientists from three universities; targeted community in subsequent developments may include a large group of social and behavioural scientists who are familiar with standard scripting languages
So far strictly academic user community consisting of social scientists and research teams from various universities. In the future possibly users from the Greater Manchester Police will be involved.
Large user base consisting of the academic community, communities of the languages being documented, the general public and journalists.
Intended user community of text-oriented social scientists and humanities researchers, e.g. linguistics, languages, literature
Small user community in one scientific field (finance); few contacts to private finance research but not as users.
User recruitment
Steady growing recruitment through projects and groups already using AG and spreading the benefit; sometimes hindered through technical problems on the node site, or support is not sought leading to not using AG
Through existing ties and through the evoked interest and prospect of possibilities of the innovative and scalable application
Significant hurdles may prohibit recruitment of social scientists primarily for legitimacy concerns: not trained as social scientists lab's scientists experience difficulties establishing their legitimacy, including concerns with tools, methods, and validity
Establishing a user community is one of the challenges; a relatively high investment in learning new tools, shifting from existing more familiar software, and increased dependency on computer scientists may limit participation.
Broader non-academic use is encouraged through public events and NCeSS outreach activities (such as the NCeSS Showcase) and invited talks.
User recruitment occurs automatically and is unproblematic since there is significant public interest in the archival technology developed.
Not yet established
No explicit user recruitment; focus was laid on improving the usability for the initial user community.
Developer-user interaction
Email, phone, web-based support, weekly test sessions, biannual workshops, user survey, joint research projects
Email, phone, irregular meetings, feedback on models and interface, demonstration of prototypes; no important barriers apparent, but in the last development stage exchange has to be intensified
Interact with users as a part of ongoing work at the lab; as developers have worked closely with users for many years there are no apparent communication barriers.
Substantial barriers of language and understanding between developers and PIs/users resulting from divergent disciplinary practices; "translators" brokering the fields involved help reducing communication difficulties.
User-driven project; driver projects safeguard that needs of pilot users are considered; wider user community not yet mobilised
Developers use user feedback to improve the software and adapt it to users’ needs.
Users are involved in the design and development, wider user community and mode of interaction are not yet established
Interaction through email, phone, (training) workshops, site visits; significant communication problems between users and developers
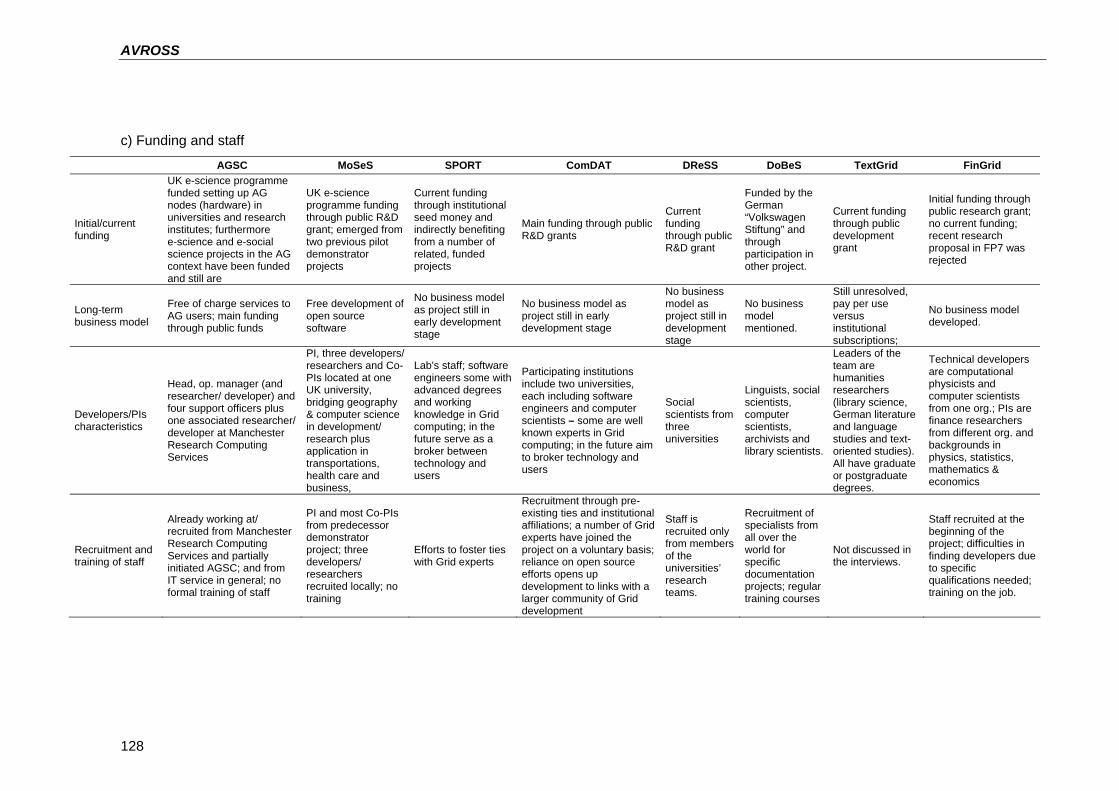
AVROSS
128
c) Funding and staff
AGSC MoSeS SPORT ComDAT DReSS DoBeS TextGrid FinGrid
Initial/current funding
UK e-science programme funded setting up AG nodes (hardware) in universities and research institutes; furthermore e-science and e-social science projects in the AG context have been funded and still are
UK e-science programme funding through public R&D grant; emerged from two previous pilot demonstrator projects
Current funding through institutional seed money and indirectly benefiting from a number of related, funded projects
Main funding through public R&D grants
Current funding through public R&D grant
Funded by the German “Volkswagen Stiftung” and through participation in other project.
Current funding through public development grant
Initial funding through public research grant; no current funding; recent research proposal in FP7 was rejected
Long-term business model
Free of charge services to AG users; main funding through public funds
Free development of open source software
No business model as project still in early development stage
No business model as project still in early development stage
No business model as project still in development stage
No business model mentioned.
Still unresolved, pay per use versus institutional subscriptions;
No business model developed.
Developers/PIs characteristics
Head, op. manager (and researcher/ developer) and four support officers plus one associated researcher/ developer at Manchester Research Computing Services
PI, three developers/ researchers and Co-PIs located at one UK university, bridging geography & computer science in development/ research plus application in transportations, health care and business,
Lab's staff; software engineers some with advanced degrees and working knowledge in Grid computing; in the future serve as a broker between technology and users
Participating institutions include two universities, each including software engineers and computer scientists – some are well known experts in Grid computing; in the future aim to broker technology and users
Social scientists from three universities
Linguists, social scientists, computer scientists, archivists and library scientists.
Leaders of the team are humanities researchers (library science, German literature and language studies and text-oriented studies). All have graduate or postgraduate degrees.
Technical developers are computational physicists and computer scientists from one org.; PIs are finance researchers from different org. and backgrounds in physics, statistics, mathematics & economics
Recruitment and training of staff
Already working at/ recruited from Manchester Research Computing Services and partially initiated AGSC; and from IT service in general; no formal training of staff
PI and most Co-PIs from predecessor demonstrator project; three developers/ researchers recruited locally; no training
Efforts to foster ties with Grid experts
Recruitment through pre-existing ties and institutional affiliations; a number of Grid experts have joined the project on a voluntary basis; reliance on open source efforts opens up development to links with a larger community of Grid development
Staff is recruited only from members of the universities’ research teams.
Recruitment of specialists from all over the world for specific documentation projects; regular training courses
Not discussed in the interviews.
Staff recruited at the beginning of the project; difficulties in finding developers due to specific qualifications needed; training on the job.

M4 Final Report
129
d) Relationship to established practices and policies
AGSC MoSeS SPORT ComDAT DReSS DoBeS TextGrid FinGrid
Disciplinary ownership and sharing
No issue for AGSC Not mentioned
Sharing simulation models is not an accepted practice; confidentiality may be a concern when data is used inappropriately.
Data sharing is not acceptable in the field, especially because it requires high involvement of contributors including: appropriately designing data collection, learning the tools, and adjusting data to accommodate supported standards
No mention regarding sharing policies.
Very open towards sharing, connected to a multitude of related projects in Europe, USA and Australia sharing experiences and agreeing on standards.
TextGrid is defined as frame for projects in the field. Openness for new projects and easy access to existing projects is part of the concept.
Sharing data is only possible under the (restrictive) regulations of the data providers, however, it is essential for the success of the infrastructure
Academic rewards
Not relevant; AG is external technology provided as a service commercially (inSORS) and as open source
Despite no emphasis on scientific publications 2nd best paper at UK All Hands Meeting 2007; addressing issues in a new way for social science through modelling and simulation; finding solutions for de-velopment problems
Does not concern staff members, but participation may not offer much rewards to potential social scientist collaborators for institutional authorship considerations
Easy access to data and computationally intensive analysis tools could speed up research process; acknowledging use of investigators' data may reward those who collected data; computer scientists benefit from adoption of their technologies.
New ways of working with and analyzing data can provide new insights for social science research.
e-Infrastructure facilitates certain forms of linguistic research enormously; developed archiving framework can be applied to other fields.
Since TextGrid runs in beta status there are no rewards yet.
Rewards for technical developers are not an issue; usual rewards for scientific contributions.
Cross-disciplinary collab. & comm.
No issue for AGSC
Functioning multidisciplinary collaboration in the project itself and with the application domains
Functioning interdisciplinary collaboration within the project team; significant challenges in linking back to the core social science fields
Differing agendas of domain and computer scientists; communication problems; involvement of “translators” who are formally trained in both fields
Interdisciplinary collaboration between project teams is not mentioned as problematic; problems in linking back to the core social science fields and demonstrating the benefits of the tool
No issue, cross-disciplinary communication is working very well and the archiving framework developed is being considered for use in other disciplines.
Considerable problems of communication and mutual acceptance between domain and computer scientists, eased through intensified efforts and building of interdisciplinary micro-teams
Communication and language barriers between developers and users were significant and produced waste of resources.
Institutional environment
Embedded in Manchester Research Computing Services,
Different departments/ schools at the university; successful collaboration between computer science,
Group of multidisciplinary scientists organized as a middle sized laboratory in a US
Previous projects relating to e-Infrastructure in the participating institutions reduce the cost for project engagement thus
DReSS has connections with the US Cyberinfrastructure project SID Grid.
DoBeS is part of various other international projects. It also takes part in the
TextGrid is part of the German D-Grid initiative. D-Grid involves 17 projects from the natural
High interest in the technology by the developers’ institution; institutionalised collaboration with
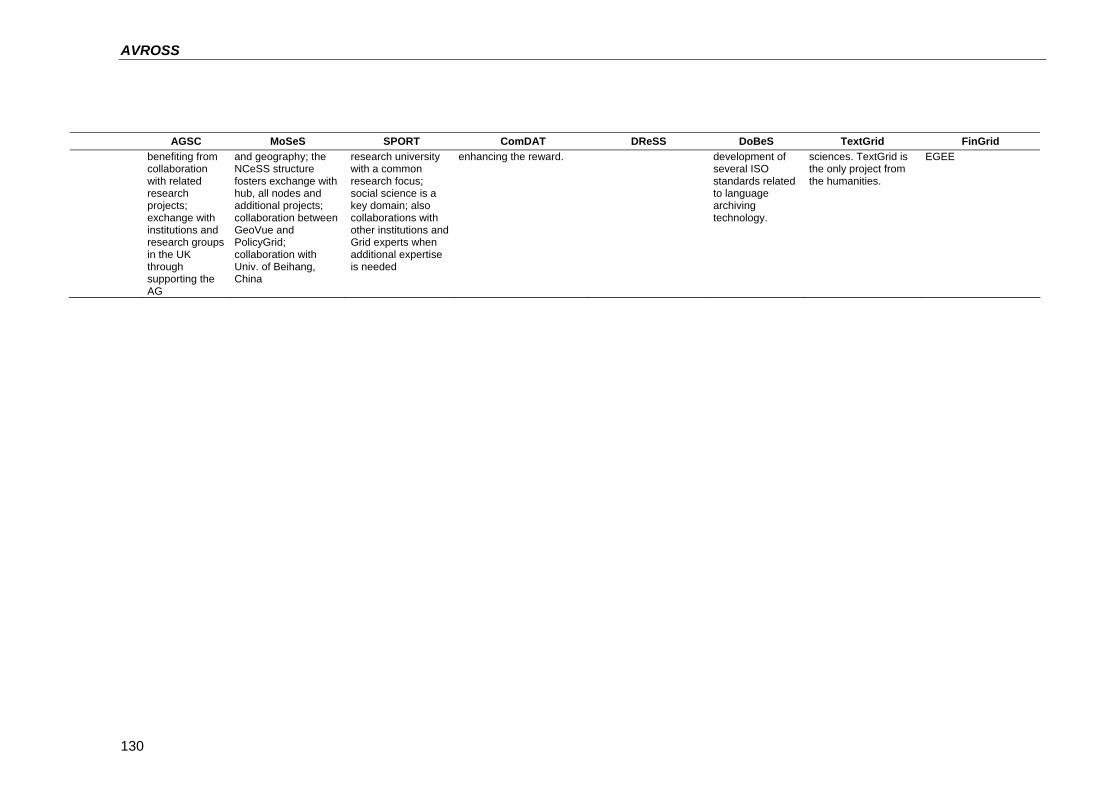
AVROSS
130
AGSC MoSeS SPORT ComDAT DReSS DoBeS TextGrid FinGrid benefiting from collaboration with related research projects; exchange with institutions and research groups in the UK through supporting the AG
and geography; the NCeSS structure fosters exchange with hub, all nodes and additional projects; collaboration between GeoVue and PolicyGrid; collaboration with Univ. of Beihang, China
research university with a common research focus; social science is a key domain; also collaborations with other institutions and Grid experts when additional expertise is needed
enhancing the reward. development of several ISO standards related to language archiving technology.
sciences. TextGrid is the only project from the humanities.
EGEE
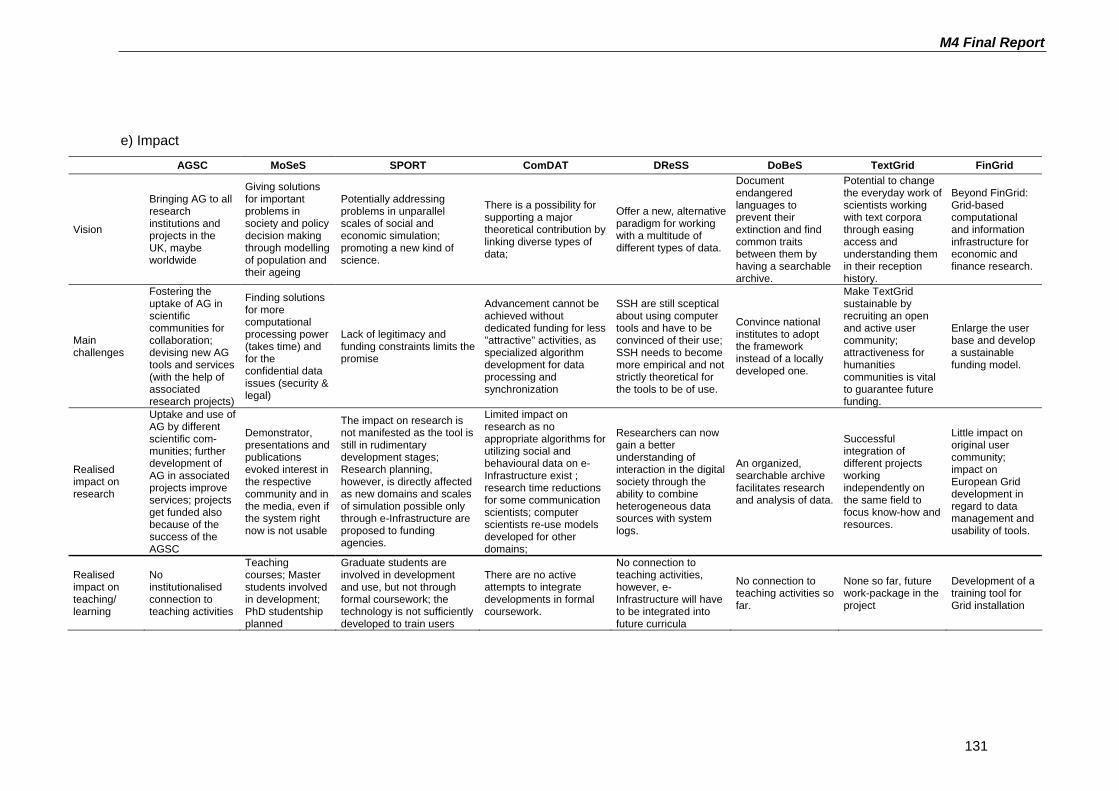
M4 Final Report
131
e) Impact
AGSC MoSeS SPORT ComDAT DReSS DoBeS TextGrid FinGrid
Vision
Bringing AG to all research institutions and projects in the UK, maybe worldwide
Giving solutions for important problems in society and policy decision making through modelling of population and their ageing
Potentially addressing problems in unparallel scales of social and economic simulation; promoting a new kind of science.
There is a possibility for supporting a major theoretical contribution by linking diverse types of data;
Offer a new, alternative paradigm for working with a multitude of different types of data.
Document endangered languages to prevent their extinction and find common traits between them by having a searchable archive.
Potential to change the everyday work of scientists working with text corpora through easing access and understanding them in their reception history.
Beyond FinGrid: Grid-based computational and information infrastructure for economic and finance research.
Main challenges
Fostering the uptake of AG in scientific communities for collaboration; devising new AG tools and services (with the help of associated research projects)
Finding solutions for more computational processing power (takes time) and for the confidential data issues (security & legal)
Lack of legitimacy and funding constraints limits the promise
Advancement cannot be achieved without dedicated funding for less "attractive" activities, as specialized algorithm development for data processing and synchronization
SSH are still sceptical about using computer tools and have to be convinced of their use; SSH needs to become more empirical and not strictly theoretical for the tools to be of use.
Convince national institutes to adopt the framework instead of a locally developed one.
Make TextGrid sustainable by recruiting an open and active user community; attractiveness for humanities communities is vital to guarantee future funding.
Enlarge the user base and develop a sustainable funding model.
Realised impact on research
Uptake and use of AG by different scientific com-munities; further development of AG in associated projects improve services; projects get funded also because of the success of the AGSC
Demonstrator, presentations and publications evoked interest in the respective community and in the media, even if the system right now is not usable
The impact on research is not manifested as the tool is still in rudimentary development stages; Research planning, however, is directly affected as new domains and scales of simulation possible only through e-Infrastructure are proposed to funding agencies.
Limited impact on research as no appropriate algorithms for utilizing social and behavioural data on e-Infrastructure exist ; research time reductions for some communication scientists; computer scientists re-use models developed for other domains;
Researchers can now gain a better understanding of interaction in the digital society through the ability to combine heterogeneous data sources with system logs.
An organized, searchable archive facilitates research and analysis of data.
Successful integration of different projects working independently on the same field to focus know-how and resources.
Little impact on original user community; impact on European Grid development in regard to data management and usability of tools.
Realised impact on teaching/ learning
No institutionalised connection to teaching activities
Teaching courses; Master students involved in development; PhD studentship planned
Graduate students are involved in development and use, but not through formal coursework; the technology is not sufficiently developed to train users
There are no active attempts to integrate developments in formal coursework.
No connection to teaching activities, however, e-Infrastructure will have to be integrated into future curricula
No connection to teaching activities so far.
None so far, future work-package in the project
Development of a training tool for Grid installation
AVROSS
132
4.3.1 Technology Among the investigated cases five have a focus on the generation of data repositories including tools and applications for regulating access as well as managing and processing the data (ComDAT, DReSS, DoBeS, TextGrid, and FinGrid). Of these five cases four are still in the development phase and only one (FinGrid) has been terminated so far. The terminated project has not yet been able to acquire the necessary funding to keep the infrastructure running; a proposal within FP7 for a European follow-up project has not been selected for funding. Two further projects (SPORT and MoSeS) use data for modelling and simulating socio-economic events and processes. The eighth project, the AGSC, is a support service for users who use a conferencing and collaboration application.
Data protection. Several of the projects encountered as a major challenge the issue of data protection, an issue that has usually not been covered in the existing Grid middleware at their time of conception. The necessity to protect the data may for instance originate in legally binding constraints of the data providers (FinGrid), from institutional regulations on how to treat data on human beings or organizations (ComDAT) or from national law in case of census data, which has to be handled under strict regulations (MoSeS). The projects had to solve this issue by developing tools and applications that implemented data rights and access management – respectively in MoSeS a seamless connection of Grid and legal framework still has to be established in a feasible way. These technological solutions were possible when it came to regular numerical or textual data, though they might have required devising new applications that were not (yet) common in the broader technological environment, such as the EGEE environment of FinGrid. However, when it comes to new types of data, like audio or video recordings in ComDAT, technological solutions for masking the identity of the recorded individuals without invalidating the recordings are less straightforward and not yet established.
Reliability and usability of the applications. Another technological constraint that was mentioned in several cases relates to the often negative experiences of the (pilot) users when using the applications (see AGSC, SPORT, TextGrid, and FinGrid). These negative experiences resulted for instance from complex user interfaces (UI), low stability of the applications, and difficulties in integrating existing applications and standards into the new environment.
Solutions to these problems were also often sought in the technical sphere, e.g. re-designing UI, adding and re-launching applications, quality testing programmes (AGSC) etc. In several cases (AGSC, DReSS, DoBeS, and FinGrid) the developers and providers also engaged in training events with the users. In FinGrid they conceded however, that the training of SSH users needs to implement a particular approach that takes account of their lower computing skills and less structured and formalised problems.
Computational power. A lack of computational power was only mentioned in one of the eight cases (MoSeS) as a restriction, though the need for more computational power was a driver in some of the other projects, too (e.g. SPORT, ComDAT, DReSS, and FinGrid). More computational power does not imply, however, that the approach to computing is of the same scale and mode as in the fields that currently drive grid developments in Europe, in particular high-energy physics (HEP). On the contrary, interviewees from the case studies remarked that it is nearly impossible to align the different approaches to computing followed by social scientists and HEP (see the FinGrid case). These approaches are engrained in field-specific cultures and practices and SSH rather discontinue to use the grid and set up new or use existing small-scale clusters that serve their computational needs very well than adjust their practices in order to use the grid.
Other technological issues and constraints. In ComDAT, one issue was mentioned that seems to be specific to some social sciences dealing with human interaction, like psychology and communication studies: the interpretive nature of some types of data,
M4 Final Report
133
e.g. video recordings, makes it difficult to capture the signal, distinguish it from the noise, code it accordingly and then subject it to automated analyses.
4.3.2 User communities and involvement The investigated case studies either address a broad user community from several SSH fields and beyond (AGSC) or focus on one specific field for which the applications are being or have been developed.
Establishing a sufficiently broad user community in the field. Projects in early stages (SPORT, ComDAT, MoSeS, DReSS, and TextGrid) rely on pilot users which work with prototypes and testbeds. Only two of the eight projects have large user communities at the moment: AGSC is to some extent a special case offering free services to users of a proprietary technology and DoBeS has a large user community among the language researchers of the languages included in the project. For the other projects the establishment of a user community is still an open and critical issue for success. MoSeS already at this early stage evokes a huge interest from potential user communities (up to the governmental level) who see the benefit in the project’s simulation and modelling capabilities on a large scale – but the future still has to prove its success.
The strategies for recruiting users are rather weak and little developed (except for the AGSC, which as a service is continuously developing strategies to increase the uptake of AG): projects tend to rely on what is offered by their funding or institutional environment, e.g. DReSS relying on the NCeSS activities. In some cases the developers and PIs expect that the application speaks for itself and that word-of-mouth advertising at conferences or other events will do the trick. However, the FinGrid project, that has been discontinued not the least for failing to attract a user community, shows that this is not enough. The strategies and measures of finding, involving, and preparing users need to be more sophisticated.
Few measures to support user-user interaction. One of the weaknesses seems to be that interaction on a project is mainly thought of in the lines of user-developer interaction using the traditional means of communication, phone, email, and face-to-face meetings at workshops, seminars or site visits. This communication between users and developers is without doubt extremely important for designing and improving the infrastructure and itself fraught with problems of differing languages and communication barriers (see p. 135). However, it is not suitable for making the merits of an infrastructure visible to potential users. In addition to user-developer interaction, more user-user interaction would be required, for instance pilot users presenting showcases to potential users or PIs disseminating their results in the user domains.
Involving leading domain scientists in the diffusion of an e-Infrastructure and building of a user community might be a good strategy – peers and scientists in the field are the main information source on e-Infrastructure, as we learned in the early adopter survey (see p. 44). This should be a worthwhile but not necessarily easy undertaking: First, it should not be neglected that it still takes considerable time, as interviewees from ComDAT and SPORT point out themselves, to learn and master new e-Infrastructure technologies. The necessary effort depends on both, the development status of the technology as well as the technological level of the learner. And time is a scarce resource, especially the time of eminent scientists. Second, it should not be underestimated that in particular the established scientists also may owe their position in part to the current infrastructural arrangements, e.g. their access to particular resources or technology (Edwards et al., 2007, pp. 26-27). Hence, they might not be willing to put their position at stake through supporting the diffusion of a new technology.
AVROSS
134
4.3.3 Funding and staff Six projects have been funded through public R&D grants in different research programmes. The SPORT project has been funded through institutional seed money and DoBeS through a non-profit foundation, both projects also benefit from related projects. Naturally funding enables research and development projects to come into existence in the first place. However, this usually also means, that projects can only be established for a limited span of time. In this context especially the development of services and tools pose the question of sustainability. On one end of the scale the AGSC will probably be funded for at least eight years fostering the sustainable use of AG, whereas, on the other end, there is currently no more funding for the FinGrid project leaving a developed e-Infrastructure unsupported. In-between e.g. the MoSeS project emerged from two pilot demonstrator projects giving the previous work some continuity. Therefore two approaches seem feasible: either such projects would need a longer funding period or an appropriate business model could secure sustainable provision and successful outreach.
Service-oriented business models. It is an incomplete and misleading conception that e-Infrastructure in the social sciences and humanities is only or even primarily about technology. Though technological constraints without doubt still have considerable influence on user satisfaction and project success, social scientists and humanities researchers mainly demand advanced computing and support services as the AGSC and ComDAT studies show.
The success story of the AGSC, a duplication of room-based AG nodes every year since 2004, confirms the value of “robust, resilient services” to academia, in particular when it comes to supporting collaboration. An ingredient to this success seems to be that the service is offered free or close to free of charge for the users, as we also see in the ComDAT example. The TextGrid interviews also point in this direction, as the interviewees consider the requirement of charging individual projects and users for the service to be a major barrier of adoption in the future.
Of course, if the users themselves do not pay, alternative funding schemes need to be found that ideally provide long-term funding to secure the continuity and improvement of the service and make sure that users’ investments into a technology don’t get lost. The investigated cases do not provide any guidance on possible solutions as they are still mainly funded through public research (and development) grants. As historical studies of other infrastructures such as road, rail, water, energy and telecommunication networks have shown, it was often public investment or funding arrangements that coupled private investment with public regulation that led to the establishment of a network (Edwards et al., 2007, p. 29).
At the same time, users will have to commit themselves to long-term solutions and accept the service idea that comes with the technology. They will have to provide funds that cover more than the initial set-up of a technology or tool and include support and maintenance. In a networked application it affects the service level of all participants if maintenance and quality standards of one networked user are unsatisfactory and the AGSC desire of coercing AG users to conduct quality tests is hence understandable.
All projects to some extend develop applications or tools (as already described above), but with the exception of FinGrid are all still in a rather early stage. Therefore procedures for a larger rollout of the software have not been mentioned – as for FinGrid the infrastructure is in place but with no further funding future support cannot be provided. Only MoSeS explicitly refers to using open source and free software whenever possible and also developing as open source as this is also a requirement from the funding side. Similar to the free provision of services also the free use of software under an open license could be a model to foster sustainable use – if models for the necessary further support can be found and established.
Recruitment and training of staff. In recruiting its personnel, FinGrid seems to be the sole project with difficulties in finding staff (developers), and together with DoBeS both are
M4 Final Report
135
said to be the only projects to have engaged in looking for people from outside their own department, university, existing collaborations, projects or other ties. In addition to the regular staff SPORT is looking to foster ties especially with Grid experts. Remarkably DoBeS is the only project with reported regular training courses for staff, while three other projects (AGSC, MoSeS, FinGrid) at least mention training to take place more informally on the job, as otherwise it would be too time consuming or at all ineffective. None of the interviewees seemed to miss training in important areas. The lack of training seems to be a general characteristic of e-Infrastructures in SSH, as the recent HERA survey obtained the same result (see Kaur-Pedersen & Kladakis, 2006).
4.3.4 Relationship to established practices All projects are well established and connected to other (current or previous) projects, institutions, networks and/or researchers within their respective domain areas but also in the fields of e-Infrastructure, e-Science and e-Social Science. Most of the projects also have international networks in this context.
Data sharing is unproblematic in humanities and difficult in social sciences. In three of the projects (AGSC, MoSeS, DReSS) there is no mentioning of data ownership or sharing. This is especially understandable for the AGSC, as this simply is not an issue for a supporting service. For two projects (SPORT, ComDAT) interviewees stated, that due to the mainly confidential nature of the data and because of the disciplinary practices sharing is not accepted in the field. FinGrid, another social science project, had to find ways between existing restrictive policies of data providers and the essential need for sharing data. The situation is somewhat different in the projects mainly led by the humanities: In aiming at building libraries/archives for languages and text data both DoBeS and TextGrid naturally tend to support data sharing in order to benefit from such a practice.
Academic rewards. For most of the projects and their project members the usual way of academic rewards in form of contributions in renowned scientific publications is not happening in the same extent, especially in social science and humanities disciplines. These disciplines are still more traditional in that regard, which makes it difficult to succeed coming from a multidisciplinary environment. Only FinGrid states clearly to have the “usual rewards for scientific contributions”. The publications coming out of the e-Infrastructure related projects therefore often are placed in e-science or related communities – but here with huge success, as the “2nd paper award” of MoSeS at the “UK e-science All Hands meeting” conference shows. At the same time one of the interviewed authors points out, that the number of publications would be lower for an innovative e-Social Science project. In this context it is also more likely to have contributions with a technical focus, but still rewards for technical developers are often “not an issue” (FinGrid).
The biggest success and therefore reward is generally seen in addressing issues in a new way beneficial for research questions, methods and data in social science and humanities. Here this is said to be especially true for simulation and modelling (MoSeS, SPORT), replaying and analysing new forms of digital data (DReSS) and linguistics (DoBeS).
Cross-disciplinary communication and collaboration. Several of the presented cases have struggled with communication barriers between social scientists or humanities researchers and computer scientists. These barriers place a burden on project development: specialized languages, “ping-pong” communication and differing work styles translate into differing expectations on what a project can and should achieve.
This lack of interaction and mutual understanding of domain and computer scientists goes on beyond the development phase, as SPORT interviewees highlight: a “Throwing your research over the wall and see if anybody picked it up” attitude usually results in nobody picking it up. Field-specific practices, conventions and standards have developed over decades and scientists tend to be sceptical and unwilling if somebody tells them that
AVROSS
136
they have to change, in particular if that somebody is considered to be an outsider without expert knowledge in the field. These differences are still often ignored by computer scientists and developers for whom there is little difference between processing astronomical or socio-economic data with their tools (see e.g. the ComDAT case). They only see the possibility of making them available to yet another community. It is also striking that nearly all of the discussed projects stressed their close ties and involvement with the global Grid community, but not their contribution to the development of their social science or humanities “home base”.
Some proposals and examples on how to deal with these communication barriers also surfaced in the cases:
• TextGrid successfully reduced the communication barriers by involving both, domain and computer scientists, early on in the projects, letting them closely discuss the critical issues and establish a joint basis for further work.
• In DReSS the user-developer collaboration is institutionalised in the structure of the project. So-called “driver projects” intend to make sure that developments are triggered by and linked-back to user needs.
• Another solution, implemented to some extent in ComDAT, may be to engage “translators”, individuals trained in both fields, who understand the language, problems and work styles of each group and can bridge communication between the involved domains.
• In MoSeS the collaboration between computer scientists and geographers works well, as both parties have a hand in developing and the work on the same university campus helps the daily exchange of information. Users are represented by the three co-PIs (one in each application domain), who successfully collaborate with the developers to transfer user requirements and other important information.
4.3.5 Impact on research and learning Each of the projects follows the vision to address and solve existing problems in a new and ambitious way through the combination of using and building e-Infrastructure tools and/or frameworks in and for their application domains.
• MoSeS and SPORT use the potential of simulation and modelling to engage social, political and economic issues on an unparalleled scale.
• ComDAT, DReSS, DoBeS and TextGrid all offer new ways of linking, archiving and working with various types of data within diverse disciplines.
• The AGSC is a service supporting the use and fostering the uptake of AG in the UK and maybe beyond.
• FinGrid had the aim to develop a national information and computing e-Infrastructure for economic and financial data.
The challenges in achieving the project’s goals are particularly seen in making the use as well as the funding sustainable and enlarge the user base (AGSC, ComDAT, DoBeS, TextGrid, FinGrid), followed by solving confidential and security data issues (MoSeS, SPORT) and still bridging the gap between creating new prototypes for the social sciences and humanities and having an application which at one point is considered to be helpful in research and will de facto be used (DReSS).
Impact on research. There a different categories of impact which have been identified.
• The AGSC can state the uptake and real use of AG and its own support services by various scientific communities. In the last years projects connected to the AGSC are funded and improve AG and related services through testing of tools and new developments.
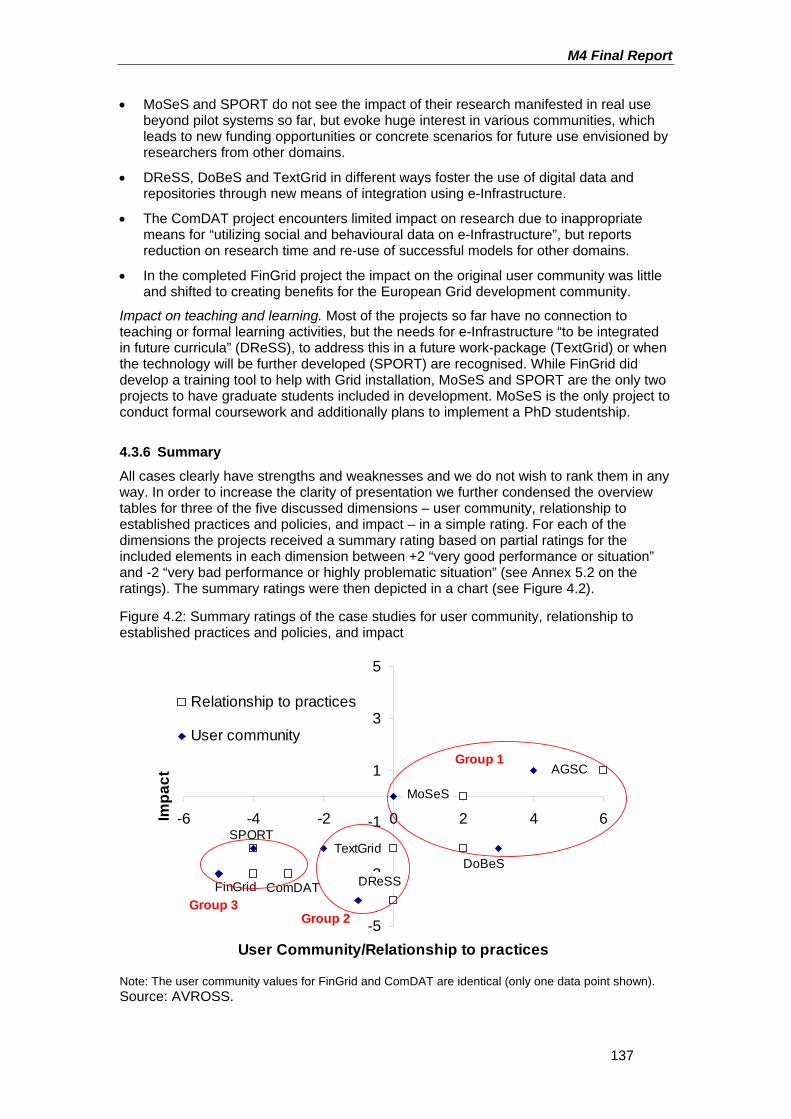
M4 Final Report
137
• MoSeS and SPORT do not see the impact of their research manifested in real use beyond pilot systems so far, but evoke huge interest in various communities, which leads to new funding opportunities or concrete scenarios for future use envisioned by researchers from other domains.
• DReSS, DoBeS and TextGrid in different ways foster the use of digital data and repositories through new means of integration using e-Infrastructure.
• The ComDAT project encounters limited impact on research due to inappropriate means for “utilizing social and behavioural data on e-Infrastructure”, but reports reduction on research time and re-use of successful models for other domains.
• In the completed FinGrid project the impact on the original user community was little and shifted to creating benefits for the European Grid development community.
Impact on teaching and learning. Most of the projects so far have no connection to teaching or formal learning activities, but the needs for e-Infrastructure “to be integrated in future curricula” (DReSS), to address this in a future work-package (TextGrid) or when the technology will be further developed (SPORT) are recognised. While FinGrid did develop a training tool to help with Grid installation, MoSeS and SPORT are the only two projects to have graduate students included in development. MoSeS is the only project to conduct formal coursework and additionally plans to implement a PhD studentship.
4.3.6 Summary All cases clearly have strengths and weaknesses and we do not wish to rank them in any way. In order to increase the clarity of presentation we further condensed the overview tables for three of the five discussed dimensions – user community, relationship to established practices and policies, and impact – in a simple rating. For each of the dimensions the projects received a summary rating based on partial ratings for the included elements in each dimension between +2 “very good performance or situation” and -2 “very bad performance or highly problematic situation” (see Annex 5.2 on the ratings). The summary ratings were then depicted in a chart (see Figure 4.2).
Figure 4.2: Summary ratings of the case studies for user community, relationship to established practices and policies, and impact
-5
-3
-1
1
3
5
-6 -4 -2 0 2 4 6
User Community/Relationship to practices
Impa
ct
Relationship to practices
User community
AGSC
MoSeS
SPORT
ComDATFinGrid DReSSDoBeS
TextGrid
Group 1
Group 3Group 2
Note: The user community values for FinGrid and ComDAT are identical (only one data point shown). Source: AVROSS.
AVROSS
138
Figure 4.2 shows on the x-axis the rating for relationship to established practices and policies and user community and on the y-axis the impact rating. The impact is rather low in all investigated projects, as most still have significant challenges to solve and an impact on teaching is nearly absent. Relating this to the other two dimensions, three groups of projects can be distinguished:
• AGSC, DoBeS, and MoSeS are projects that fit rather neatly into the established practices in the fields in which they are integrated. They also have a (growing) user community and functioning user-developer interaction. This either has already shown that they can have an impact (AGSC) or puts them in a good position to make an impact as they develop.
• TextGrid and DReSS are weaker in regard to this integration into the field and its practices and they have not yet advanced as far in regard to users as projects in the previous group. They also have not yet achieved an impact and they are in a weaker position in regard to achieving this in the future.
• The last group of projects, FinGrid, SPORT, and ComDAT, are in an even worse position when it comes to user communities and relationships to established practices: They have user communities restricted to the people involved in the project, no discernible strategies for acquiring more users and significant problems in linking up with the potential user communities. Sharing resources seems to be also rather problematic for them. The projects are weak, too, when it comes to the realised impact on research or teaching.
Of course, this is a very much ad hoc rating of the cases that does not take into account the different development stages of the projects. Therefore, the results should not be considered as conclusive, i.e. projects like SPORT and ComDAT might link up to their users and become accepted in the fields, and others might still fail, though the current conditions seem to be very promising. However, we think that the overview is a satisfactory representation of the projects that might help to focus the activities and further development on key preconditions for success.
M4 Final Report
139
5. Policy recommendations
5.1 Introduction Our task in this study was to provide recommendations for realising more rapid roll out of virtual research organisations and novel services for students in the social sciences and humanities (SSH). Before we present these recommendations in more detail, a general remark is appropriate on the advantages of locating e-Infrastructure policy at European level rather than at the level of member states.
• In some SSH fields, research approaches differ on a national basis and have a national flavour, for example using specific resources in a particular language or located in a particular (national) culture. More exchange and collaboration at European level, facilitated through joint e-Infrastructures, would enable disparate and dispersed source materials to be used more widely and across borders, facilitate transfer of competence across countries (and fields) and promote faster adoption of best practice. Also, creativity is generally believed to be boosted when scientists with diverse backgrounds are linked (Simonton, 2004).
• In other SSH fields (e.g. branches of macroeconomics such as Nationalökonomie), research is essentially international, involving comparison of nation states. Where research content and scholarly communication are already strongly international, national e-Infrastructures policies would require considerable coordination to avoid interoperability barriers and duplication of tools and content – problems and costs that might be reduced by choosing a European approach from the outset.
• Many e-Infrastructure elements exhibit quite significant economies of scale which can only be reaped by providing them to a large user community. Building and maintaining text corpora for historical or minority languages may only be affordable if researchers from several countries join forces to build and use them. The joint knowledge mobilised and the “transactive memory” systems (Wegner, 1987) created both benefit from network effects.
• When for the same reason global collaboration is needed, then the EC is in a better position than any of the individual member states to negotiate and fund such initiatives with other regions of the globe. Services by Google, Yahoo and Amazon such as Google Scholar, Google digitisation or Flickr are examples of new opportunities global collaboration could provide for research communities, enabling them to create, share, and use information, to communicate and collaborate.
• Common European standards, tools and resource repositories will reduce barriers to mobility in the research environment. Learning costs can be reduced if scholars can remain in familiar technological space while moving in geographical space.
Our recommendations are informed not only by the survey and case studies undertaken for this project but also by our other work (Procter, 2007; Voss et al., 2007) and the related literature. They are intended to complement previous proposals, such as in particular:
1) The ESFRI Roadmap report (2006) sets out to describe the scientific needs for Research Infrastructures of pan-European interest for the next 10-20 years, taking into account input from relevant inter-governmental research organisations as well as the industrial community. ESFRI’s agenda is necessarily concerned with the formulation of strategic, policy-level recommendations and contrasts with the focus of the AVROSS project which has been to identify how e-Infrastructure development and adoption are perceived at the ‘grass roots’. Nevertheless, we find several examples of where the two connect. The ESFRI Roadmap identifies three long-term strategic goals for SSH research infrastructures (comparative data and modelling, data integration and language tools, coordination and enabling) and a number of individual, pan-European infrastructural
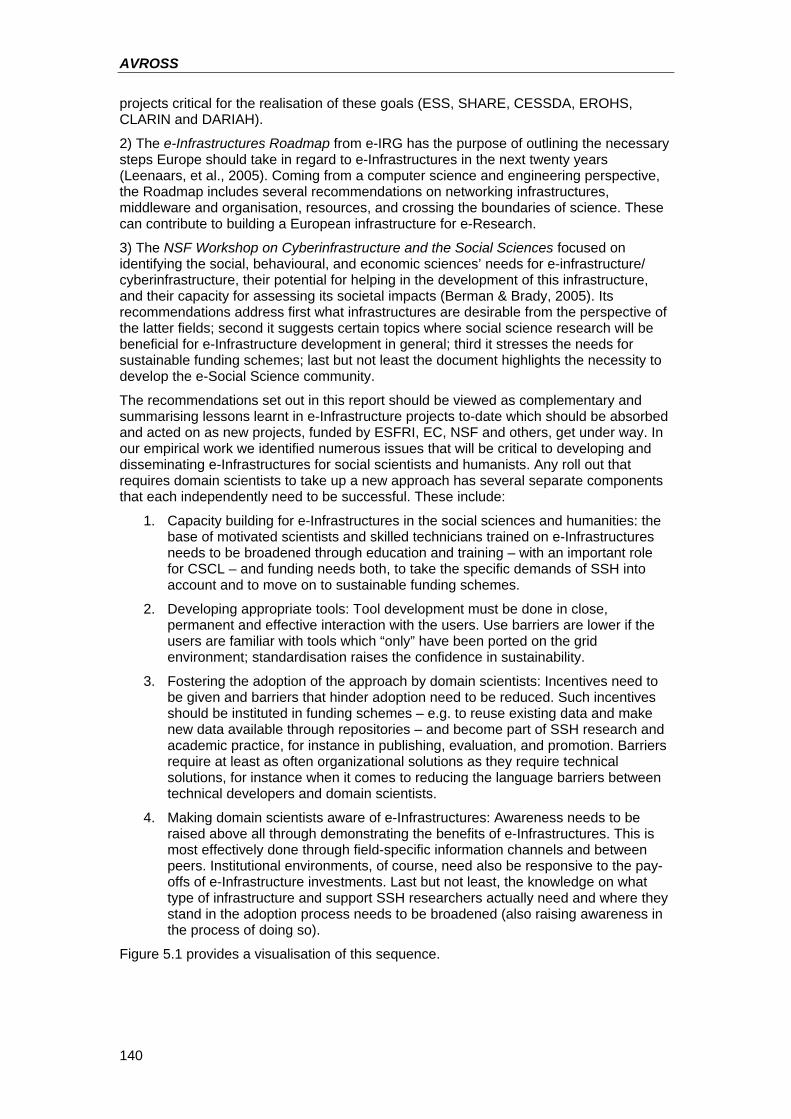
AVROSS
140
projects critical for the realisation of these goals (ESS, SHARE, CESSDA, EROHS, CLARIN and DARIAH).
2) The e-Infrastructures Roadmap from e-IRG has the purpose of outlining the necessary steps Europe should take in regard to e-Infrastructures in the next twenty years (Leenaars, et al., 2005). Coming from a computer science and engineering perspective, the Roadmap includes several recommendations on networking infrastructures, middleware and organisation, resources, and crossing the boundaries of science. These can contribute to building a European infrastructure for e-Research.
3) The NSF Workshop on Cyberinfrastructure and the Social Sciences focused on identifying the social, behavioural, and economic sciences’ needs for e-infrastructure/ cyberinfrastructure, their potential for helping in the development of this infrastructure, and their capacity for assessing its societal impacts (Berman & Brady, 2005). Its recommendations address first what infrastructures are desirable from the perspective of the latter fields; second it suggests certain topics where social science research will be beneficial for e-Infrastructure development in general; third it stresses the needs for sustainable funding schemes; last but not least the document highlights the necessity to develop the e-Social Science community.
The recommendations set out in this report should be viewed as complementary and summarising lessons learnt in e-Infrastructure projects to-date which should be absorbed and acted on as new projects, funded by ESFRI, EC, NSF and others, get under way. In our empirical work we identified numerous issues that will be critical to developing and disseminating e-Infrastructures for social scientists and humanists. Any roll out that requires domain scientists to take up a new approach has several separate components that each independently need to be successful. These include:
1. Capacity building for e-Infrastructures in the social sciences and humanities: the base of motivated scientists and skilled technicians trained on e-Infrastructures needs to be broadened through education and training – with an important role for CSCL – and funding needs both, to take the specific demands of SSH into account and to move on to sustainable funding schemes.
2. Developing appropriate tools: Tool development must be done in close, permanent and effective interaction with the users. Use barriers are lower if the users are familiar with tools which “only” have been ported on the grid environment; standardisation raises the confidence in sustainability.
3. Fostering the adoption of the approach by domain scientists: Incentives need to be given and barriers that hinder adoption need to be reduced. Such incentives should be instituted in funding schemes – e.g. to reuse existing data and make new data available through repositories – and become part of SSH research and academic practice, for instance in publishing, evaluation, and promotion. Barriers require at least as often organizational solutions as they require technical solutions, for instance when it comes to reducing the language barriers between technical developers and domain scientists.
4. Making domain scientists aware of e-Infrastructures: Awareness needs to be raised above all through demonstrating the benefits of e-Infrastructures. This is most effectively done through field-specific information channels and between peers. Institutional environments, of course, need also be responsive to the pay-offs of e-Infrastructure investments. Last but not least, the knowledge on what type of infrastructure and support SSH researchers actually need and where they stand in the adoption process needs to be broadened (also raising awareness in the process of doing so).
Figure 5.1 provides a visualisation of this sequence.
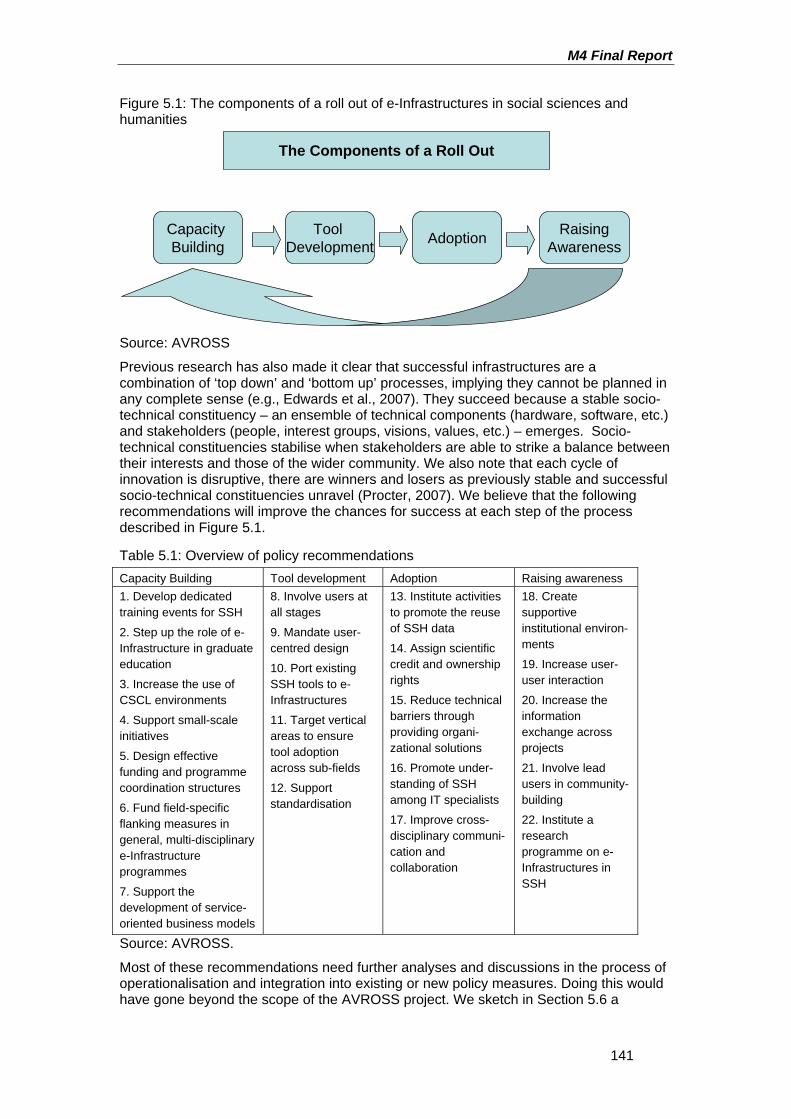
M4 Final Report
141
Figure 5.1: The components of a roll out of e-Infrastructures in social sciences and humanities
RaisingAwareness
Capacity Building
Tool Development Adoption
The Components of a Roll Out
Source: AVROSS
Previous research has also made it clear that successful infrastructures are a combination of ‘top down’ and ‘bottom up’ processes, implying they cannot be planned in any complete sense (e.g., Edwards et al., 2007). They succeed because a stable socio-technical constituency – an ensemble of technical components (hardware, software, etc.) and stakeholders (people, interest groups, visions, values, etc.) – emerges. Socio-technical constituencies stabilise when stakeholders are able to strike a balance between their interests and those of the wider community. We also note that each cycle of innovation is disruptive, there are winners and losers as previously stable and successful socio-technical constituencies unravel (Procter, 2007). We believe that the following recommendations will improve the chances for success at each step of the process described in Figure 5.1.
Table 5.1: Overview of policy recommendations Capacity Building Tool development Adoption Raising awareness 1. Develop dedicated training events for SSH
2. Step up the role of e-Infrastructure in graduate education
3. Increase the use of CSCL environments
4. Support small-scale initiatives
5. Design effective funding and programme coordination structures
6. Fund field-specific flanking measures in general, multi-disciplinary e-Infrastructure programmes
7. Support the development of service-oriented business models
8. Involve users at all stages
9. Mandate user-centred design
10. Port existing SSH tools to e-Infrastructures
11. Target vertical areas to ensure tool adoption across sub-fields
12. Support standardisation
13. Institute activities to promote the reuse of SSH data
14. Assign scientific credit and ownership rights
15. Reduce technical barriers through providing organi-zational solutions
16. Promote under-standing of SSH among IT specialists
17. Improve cross-disciplinary communi-cation and collaboration
18. Create supportive institutional environ-ments
19. Increase user-user interaction
20. Increase the information exchange across projects
21. Involve lead users in community-building
22. Institute a research programme on e-Infrastructures in SSH
Source: AVROSS.
Most of these recommendations need further analyses and discussions in the process of operationalisation and integration into existing or new policy measures. Doing this would have gone beyond the scope of the AVROSS project. We sketch in Section 5.6 a
AVROSS
142
research programme on e-Infrastructure in SSH and point out several issues which need to be addressed by future research.
5.2 Capacity building
5.2.1 Broaden the base of researchers and technicians trained on e-Infrastructures
The typical e-Social Science project has a staff of about 14 individuals, of whom 5 are researchers or scientists, 3 are graduate students and 6 are other, technical, administrative and supporting staff (see Section 3.3.2). Projects need not be large, but they need a dedicated and motivated staff with a range of competencies. The importance of leadership, of being able to bridge the differences between computer science and domain sciences through multidisciplinary individuals or teams, and the necessity of being patient to allow for training and capacity-building of researchers were stressed by the case studies. It is also shown in our survey and case studies that teams carrying out such projects must have deep understanding of SSH research issues and methods, i.e. teams must involve qualified researchers from these disciplines (see p. 41). All in all, these results point to the key role of capacity-building for working successfully with e-Infrastructures.
This is not an entirely new issue and it reaches beyond SSH. Two years ago the e-IRG proposed to increase efforts in the training of scientists and computer support personnel on working with grid environments (Leenaars, et al., 2005) and set up an Education and Training Task Force (http://www.e-irg.org/about/ETTF/). The Open Grid Forum also instituted an Education and Training working group (ET-WG) which postulates:
“Education must change, so that graduates of our educational systems are well equipped with fundamentals to understand how and when to take advantage of the new methods enabled by grid computing whatever their own academic discipline.” (http://www.ogf.org/gf/group_info/view.php? group=et-cg)
Another recent activity is “The International Collaboration to Extend and Advance Grid Education” (ICEAGE) that formulates as its main objectives:
“Good education in rapidly advancing scientific domains is particularly labour intensive. It must draw on the expertise of a small community of pioneers. A major objective of ICEAGE is to provide an effective mechanism for distilling their knowledge and rapidly propagating it across Europe. ICEAGE aims to catalyse the necessary infrastructure and skills by establishing a worldwide initiative to inspire innovative and effective Grid Education. Grid Education implies the use of education in the Grid, but also the use of the Grid in education. We use the term "Grid" in a broad sense to include computing and communications technology, working practices and policies that underpin e-Infrastructure.” (http://www.iceage-eu.org/v2/ index.cfm)
This is in line with US and UK scientists’ substantial concern about sufficient numbers of trained individuals for the full exploitation and maintenance of e-Social Science investments.29 However, these initiatives still have to produce results and obviously more needs to be done.
29 Unpublished summary reports NSF/SBE cyberinfrastructure workshops Sept 18, 2004 and Oct 22,
2004; survey results from ESRC review of NCeSS hub, 2005.
M4 Final Report
143
Recommendation 1: Develop dedicated training events for SSH. Dedicated training events like seminars, courses, summer schools and others certainly should be supported. The wide variations in awareness, experience and comfort with advanced technologies in the humanities and social sciences make it difficult to establish generalized education, outreach and training programs, or adapt the programmes used in other, more technical, fields. Language, content and style need to be targeted at the SSH communities. This means that in addition to computer scientists and infrastructure developers, innovative domain researchers and users need to be involved in the training.
Recommendation 2: Step up the role of e-Infrastructure in graduate education. The role and contribution of graduate students and young researchers need to be strengthened in SSH e-Infrastructure projects. Training on the use of e-Infrastructure needs to be provided during graduate education and on the job/during post-doc periods, to show how the infrastructure can be used to produce interesting research and integrate the formation of computing/e-Infrastructure skills with the formation of research skills.30 Developers and PIs in new projects might be committed to include such training measures, e.g., in the form of summer schools or as parts of regular graduate programmes in their fields. For example, the recent e-Social Science conference in Michigan featured a very successful doctoral colloquium. Proposals for such training events might be summoned through new calls within FP7.
The need to link back grid and e-Infrastructures to education has been stressed in the US too. The Computing Research Association, for instance, proposed in 2005 an initiative to develop the Cyberinfrastructure for Education and Learning for the Future, or CELF (see Computing Research Association [CRA], 2005). We would like to point to the recommendations made in this initiative.
Recommendation 3: Increase the use of CSCL environments. As the community is still small and widely diffused it would be advisable to increase training measures which make use of CSCL. A first goal would be to make sure that researchers and students have access to CSCL environments at each university location. We have seen that such environments are somewhat more common in US American than in European e-Infrastructure projects (see p. 35). The reasons for this are unclear. More efforts are necessary to make SSH scholars aware of their potential. For instance, an annual prize for innovative CSCL and learning environment projects might be initiated, backed up by a wide dissemination of the prize winners’ and runners’-up approaches.
5.2.2 Provide resources for e-Infrastructure development. There appears to be wide consensus about the key catalysts and key barriers to e-Infrastructure adoption: adequate seed funding, development of costs, and qualified staff are high up on the priority scale (see sections 3.4.2 and 3.4.3).
Recommendation 4: Support small-scale initiatives. The current structure of e-Infrastructure involvement in the social sciences and humanities differs between continental Europe, the UK and the US. US researchers have the longest experience with e-Infrastructure and have some of the largest projects in terms of funding volume and team size (see p. 24). Continental Europe appears to be catching up with the scale of US projects and the UK e-Social Science programme currently encompasses small to medium scale projects. The UK policy seems to be more 30 In order to achieve this, education goals and content will probably first need to be de-coupled: an
education to collaborate with a specific focus on e-research would need to be separated from increasing computer literacy (we owe this remark to Andrea Scharnhorst, VKS Amsterdam).
AVROSS
144
in line with the finding that social scientists and humanities researchers may be more likely to seek involvement in small projects deploying practical tools which are easy to master, along with arrangements to support established work routines, than in large-scale projects demanding entirely new ways of doing research. e-Infrastructure projects are often not large in scale: the median project in the AVROSS survey was initially funded at just over 335,000 Euros; the median annual budget was just over 122,000 Euros (see p. 27). The implication for funding schemes would be to enable a wide range of new ideas to be tested in pilot projects. This grass-roots innovation would then provide cases of success to carry forward into development and diffusion. However, we do not want to conceal that it is difficult to be sure at this stage whether small-scale or large-scale strategies for promoting e-Infrastructure uptake in the social sciences and humanities will prove the more successful. In either case, what is vital is that the means are found to support the wider adoption and sustain successful projects.
Recommendation 5: Design effective funding and programme coordination structures. In terms of funding strategies, whether a ‘top-down’ model (which is executed through a managed programme with well-defined objectives) or a ‘bottom-up’ model (which is relies on the research community at large to set programme objectives) is more appropriate depends on the thrust of the overall programme. It seems likely that the latter model will be more appropriate for a strategy of new methods discovery, whereas the former model would be more effective in facilitating the maturing, selection and uptake of methods and tools already under development.
The funding of research infrastructures and their development is mainly provided within national or institutional boundaries in Europe. Few cross-national and inter-institutional sources exist which are compatible with the demands of distributed virtual organizations (Procter, 2007). The situation is even more difficult in the social sciences and humanities where no such organizations as ESO, EMBL, or CERN exist and when we leave Europe and take a global perspective. Clearly, it is not an easy undertaking to change established funding structures, but in particular when benefits from network effects and large user communities are possible funding organizations should be open to pilot projects that transcend the usual geographical limitations.
Recommendation 6: Fund field-specific flanking measures in general, multi-disciplinary e-Infrastructure programmes. Given the greater distance of SSH researchers from e-Infrastructure use, additional incentives are needed to ensure SSH research profits proportionately. Moreover, funding regulations need to be sufficiently flexible to take the specific and differing needs of individual fields into account. Our research has shown, for instance, that archaeologists realise different projects than economists or computer linguists (see pp. 29f.): the projects differ in regard to size, technologies and outcomes. This needs to be accounted for as – as previous research in the field has also convincingly shown (Fry, 2004; Kling & McKim, 2000; Walsh & Bayma, 1996; Wouters & Beaulieu, 2006) – a “one size fits all” approach is doomed to failure. Part of the funds in multi-disciplinary programmes might have to be earmarked for SSH projects and requirements relating to project size and technological sophistication might have to be adapted to increase SSH participation in the programmes.
Recommendation 7: Support the development of service-oriented business models. Social scientists and humanities researchers mainly demand support services in the areas of information and data, advanced computing and collaboration/communication, when they speak about e-Infrastructures. As the case studies have shown these services may be genuinely public infrastructure (without access and use restrictions) or extensions to proprietary technologies. They need not use open source software, though the transparency of the latter might create advantages in regard to reliability, security,
M4 Final Report
145
interoperability and more rapidly evolving functionality through the harnessing of community efforts. The core issue is that the integration of applications into the work routines of SSH researchers is accompanied by sufficient support measures. These are costly, and it would be a false conclusion to expect that e-Infrastructure resulting from public research can be provided without any costs when the development has been terminated.
An ingredient for success seems to be that the service is offered free or close to free of charge for the users. If the users themselves don’t pay, alternative funding schemes need to be found – an issue on which the cases studies don’t provide any guidance as they are still mainly funded through public research (and development) grants. Historical studies of other infrastructures such as road, rail, water, energy and telecommunication networks have shown that it was often public investment or funding arrangements that coupled private investment with public regulation that led to the establishment of a sustainable network (Edwards, et al., 2007).
As the ongoing debate on the sustainability of e-Infrastructures shows, this issue is of wider importance and not specific to SSH.31 Studies are needed to identify best practice across different domains and types of e-Infrastructures and develop to viable business models capable of aligning the requirements of user communities with the offerings of service providers.
5.3 Tool development A critical component to adoption is the development of tools that domain researchers will use. Other work has also stressed this crucial role; in particular, we would like to endorse the recommendation of a clearinghouse for informing, evaluating and possibly even educating scholars on new digital tools that was made by the Summit on Digital Tools for the Humanities (see Frischer, B., Unsworth, J., Dwyer, A., Jones, A., Lancaster, L., Rockwell, G. et al. 2006, p. 15).
Respondents to the AVROSS survey as well as case study informants unanimously stressed the importance of involving users of e-Infrastructures as soon as possible and having the tools used in research practice (see sections 3.5.1 and 4.3.2). That leads to the following set of recommendations.
Recommendation 8: Involve users at all stages: conceptualization, design and development, diffusion. One of the key lessons learned by the early adopters of e-Infrastructure in the social sciences and humanities is the substantial benefit of involving a broad base of users and other stakeholders in the development of e-Infrastructure. Though many of the prototype tools and services generated within e-Infrastructure programmes have benefited from the involvement of committed groups of users this, in itself, is not sufficient to ensure broad-based deployment. This is true for several reasons: first, requirements identified by these users may not be representative of the requirements of the wider user community; second, early adopters may be more tolerant of limitations in new tools and services, being prepared, for example, to work around ‘bugs’ or to cope with poor usability; third, new users of e-Infrastructures are often confronted with high learning and installation costs and unclear returns on these investments.
Our research provides some pointers on what could be done to ensure that technology development with a “throw it over the wall” approach is avoided.
31 See for instance the Report of the e-IRG Task Force on Sustainable e-Infrastructures (SeI) (2006)
and the April 2007 e-IRG workshop in Heidelberg (http://www.e-irg.org/meetings/2007-DE/workshop.html).
AVROSS
146
Recommendation 9: Mandate user-centred design. Project sponsors should require that the principles of user-centred design be applied. This could be done in two ways: either through the direct involvement of domain researchers in the project, or through a requirement that the design method includes extensive periods of use in SSH teams with appropriate feedback into the development process. In software and technology development, common methods of assessing user needs are workshops, focus groups or user-developer seminars (Harrison & Zappen, 2003; Miettinen & Hasu, 2002). In e-Infrastructure development these are costly and difficult to implement, as projects are typically characterised by spatially distributed developers and users. It remains an open question as to how user requirements for projects with these characteristics be generated. In the field of requirements gathering itself, a recent position paper on this subject (Zimmerman and Nardi, 2006) went as far as to state that:
“We know of no scalable methods of requirements analysis that document the needs of vastly different user populations, continue to document changing needs over time, coordinate investigation at multiple sites of use, design for large distributed entities, and absorb transformative changes in practice.”
Project proposals submitted for public R&D funding should be required to include adequate measures and processes to obtain user feedback throughout all stages of a new project. Moreover, one of the metrics of the success of development projects should be the uptake by social science and humanities researchers.
Recommendation 10: Port existing SSH tools to e-Infrastructures Enable researchers to gain benefit without requiring change. In order to do so, port existing analytical tools such as SPSS, SAS, STATA, Matlab to the e-Infrastructure, and provide them ideally free of charge for a limited period. This would have the benefit of increasing awareness of e-Infrastructure, and ensure a wide, relatively fast adoption – albeit with a limited utilization of e-Infrastructure capacity. The associated challenge is the need to work out licensing schemes with vendors possibly based on a per-usage model – of course, this is a highly complex challenge that needs to be unbundled and investigated in more detail, as it relates to the business models of tool providers.
In the case of software that is in the scientific domain and created through publicly funded research, the challenge is of a different type: namely providing sufficient funds for the building, maintaining and consolidating of this work (Leenaars et al., 2005).
Recommendation 11: Target vertical areas – by method, not by problem area – to ensure tool adoption across sub-fields. This recommendation proposes the support of what others have called “application-neutral” and “multi-disciplinary” tools (e-Infrastructure Reflection Group [e-IRG] Task Force on Sustainable e-Infrastructures [SeI], 2006) which can be used by more than one field and are superior to field-specific tools. Methodical domains for such tools need to be identified. Possible domains in SSH include: text analysis/mining tools, data mining and natural language processing of textual data, algorithms for automatic audio transcription, optical character recognition engines, large scale simulation/network tools, detection equipment for recording neurobehavioral events separately from “noise.” Brokers that have knowledge and experience in both domain sciences and in e-Infrastructure should be used in this process to forward and implement specific requirements. Resultant products or services should be linked to open source solutions that may eventually replace comparable commercial tools.
There are several benefits of such a measure: New tools directly aid researchers in their supporting current research models. Utilizing these technologies on e-Infrastructure will also lead to facilitation of higher performance capacity currently not required by most
M4 Final Report
147
social scientists. Additionally, as researchers will have a strong incentive to adopt new tools designed for their research, by learning the new, open source environments, they would shift away from the desktop commercial approach currently more prevalent in the social sciences. However, the main challenge is to selectively choose areas for development based on cost, development time, and vertical reach dimensions.
Recommendation 12: Support standardisation. The benefits of standardisation have not received particular attention among our survey respondents in the e-Social Science and e-Humanities communities. However, as others before us and in e-Science more broadly we are convinced that standardisation is a key issue in the long term (e-IRG SeI, 2006). Standardisation could help solve a major concern which hampers adoption of new technologies, namely the concern by (potential) users about the sustainability of new tools and the resulting interoperability. In order for social scientists to invest time and energy in e-Social Science, they need to be convinced that the tools that they are using will not become rapidly obsolete. There are several examples in the history of computing in which the development of an industry standard provided a decisive push to successful adoption (Williams, 1997).
Standardisation can be supported through requesting that new projects and tools link up to existing infrastructures instead of producing new solutions. This might cause some additional efforts and frictions, as our research has shown (see, e.g., p. 118), but resulting adjustments and improvements of the existing infrastructure are beneficial and supporting wider use. Multi-disciplinary use as suggested above also works towards standardisation.
5.4 Facilitating adoption The adoption of e-Infrastructures is often limited by the complexity, reliability and user-friendliness of the technology; further problems lie in the integration of older code and the handling of complex problems, such as granting access to personal data without infringing regulations on privacy and data protection (see Section 4.3.1). Though some of these issues without doubt need technological solutions and advances, which then should be tailored to users’ needs as much as possible (see above), we are convinced that in several instances organizational measures might also reduce technological problems.
Recommendation 13: Institute activities to promote the reuse of SSH data. The large bodies of data which have been used to date in SSH, e.g., data from questionnaires put to large populations of individuals, are much more complex to describe and difficult to share or reuse than data in the physical sciences and engineering, much of which consists of machine readings and images from standardised laboratory-based experiments. According to our case studies, data sharing seems to be rather unproblematic in humanities fields, but more problematic in the social sciences (see Section 4.3.4). The large importance of databases in the humanities also points in this direction (see Kaur-Pedersen & Kladakis, 2006). However, the storage and controlled reuse of data could produce different types of benefits: New data is often expensively captured where existing data that could not be accessed would have sufficed. The possibility of replicating analyses reduces the risk of fraud and increases the robustness of previous findings if they can be confirmed after methodological advances have become available.
In improving opportunities for replication, storage and re-use of data must be widened. More needs to be done to make data sharing and reuse part of the daily research practice in SSH and to make repositories and archives of SSH data more usable by multiple researchers. The recent eSciDR study (http://www.e-scidr.eu/) has investigated the situation of data repositories in more detail (see Lord, 2007) and we can support
AVROSS
148
some of their conclusions: Public research funding has to play first violin in this concert and increase the requirements of tagging and sharing primary data generated with public funds.32 Of course, if data must be made available the technological and organizational preconditions have to be met, for instance, meta-data standards and regulations for anonymisation and data protection need to be defined and communicated to the researcher community. As previous research has shown (Wouters, 2002), national regulations and policies influence the behaviour of institutions and contribute to more data sharing activities at organisational level.
International collaboration should lower the barriers to accessing data from other countries which are an essential asset for international comparison and scientific research of global relevance. Countries should proceed in a coordinated way to make research data accessible to researchers – the recent OECD Guidelines (OECD, 2007) provide a framework for this. The Commission could follow the active role of the OECD in this area and implement the recommendations for research funded through its programmes. In addition, national data archives and international initiatives such as DRIVER (http://www.driver-repository.eu) and CESSDA (http://extweb3.nsd.uib.no/opencms7final/ opencms/cessda/home.html) play very important roles in this regard and should be supported in their work. Support for digital repositories as planned in the EC Com 56 is certainly another important step in the right direction and should be extended beyond 2008 (see EC, 2007). The vision should be to ensure that every social scientist and humanities scholar who works with data consults one multilingual and international source where she gets a quick, correct, concise, and intelligible response on whether data she needs for her work is available. If the data is available, ideally for a substantial percentage of the requests, she should have immediate access to the data itself as well as a fully-fledged documentation on how it was generated. If the data is not available and she needs to collect new data herself, there should be strong incentives for her to process and submit it after the completion of the project.
Recommendation 14: Assign scientific credit and ownership rights. The incentives to sharing knowledge are missing in the SSH community. There is no adequate scientific credit given for dissemination of existing research datasets (or tools, software code and other methods), and this results in disincentives to sharing. Further barriers to wide data sharing result from their character as research resource (see e.g., Arzberger et al., 2004 and the articles in Wouters & Schröder, 2003): the production of empirical databases is costly; ownership and access to databases constitutes an important resource and input to empirical research. Hence, researchers might be unwilling to share these resources as long as they haven’t drawn all the benefits from them. Or they might not want or be able to provide sufficient information for other researchers to use the available data with confidence. As Woolgar and Coopmans (2006) argue, the sharing of raw data might not be fully realised and hindered by practices that are not in line with the idealistic and mostly discarded Mertonian norm of communalism. In other words, there is substantial misalignment both in assignment of ownership rights and in how academic credit is granted. Ownership rights of data generated in a collaborative project are difficult to assign, yet the data themselves may have substantial financial value. Likewise, most social science communities and departments do not have a tradition of granting academic credit to tool builders or researchers who share their data
32 The AVROSS workshop has produced several comments on preservation, storage and access of
research data which do not, however, invalidate its key role for e-Infrastructures. We do not deny that a difference between primary data generated by public research and licensed data needs to be made and different issues need to be resolved. Clearly, activities of data processing and refinement also need to be intensified which will increase archiving costs. Data without sufficient metadata will be meaningless in the long run. Researchers can learn a lot from statistical offices in this area. Last but not least, data is just one element – but doubtless a crucial one – on a list of resources that needs to be provided for modern research.
M4 Final Report
149
widely.
The EC and member states research policy should consider promoting the few available publication paths for e-Social Science. Authors of papers on empirical research in these disciplines might be encouraged to cite their sources of methods, tools and data in a similar way to the publications whose content they may have used, enabling traditional, citation-based assessment of the success of methods innovation. Encouragement of this citation practice will require researchers on journal scientific committees to take these principles into account and journals to include this in their review and author guidelines. University boards and tenure committees should be encouraged to revise their promotion guidelines to better take the creation of digital data and other results of “technical” work into account (see also Frischer et al., 2006, p. 18).
Recommendation 15: Reduce technical barriers through providing organizational solutions. The Access Grid Support Centre (see Section 4.2.1) is one example of how the usability of a technology can be enhanced considerably and adoption can be supported through providing dedicated user support and assistance. This element can easily be stressed in new projects by adding a requirement in the call texts; service modules would need to be added to ongoing projects in case they haven’t been foreseen in the beginning.
A related issue, which has also been raised in the United States, is that the successful development of middleware requires a support infrastructure that is beyond that envisaged by initial grants. Of course, hardening and sustaining research products is difficult because products are heterogeneous, the process is costly, and researchers are trained to break new ground, rather than sustain existing projects.
Recommendation 16: Promote understanding of SSH among IT specialists. Understanding of SSH research methods is as yet very thinly spread among computer scientists and engineers, leaving a communication gap in mixed-disciplinary teams attempting innovation in SSH methods. As a result, SSH researchers have often felt it necessary to develop their methods and tools themselves. Given their lack of specialised IT knowledge, this has not always been as productive as it might have been. A policy direction might be to promote specifically understanding of SSH research needs, approaches, practices and conventions among computer scientists working in or being educated for e-Infrastructure development for instance through summer schools, workshops or other opportunities for meeting and information exchange reaching beyond disciplinary communities.
Examples for initiatives which successfully promote interdisciplinary understanding and support interaction between computer scientists and social scientists or humanities researchers exist:33
− The Dutch Continuous Access To Cultural Heritage CATCH program (Netherlands Organisation for Scientific Research, 2005) funds the development of tools, new methods and techniques for research on Dutch cultural heritage. It employs a particular setting for its research projects: computer scientists are located physically in cultural heritage institutions and work jointly with domain researchers on the project.
− Another example is the Telota initiative of the German Berlin-Brandenburg Academy (see http://www.bbaw.de/initiativen/telota/index.html) that includes a “task force” travelling around between different projects and developing project-specific tools.
33 We owe the first two examples to Andrea Scharnhorst, Virtual Knowledge Studio for the Humanities
and Social Sciences of the Royal Netherlands Academy of Arts and Sciences.
AVROSS
150
− The UK National Centre for e-Social Science has funding from the Economic and Social Research Council (ESRC) until 2012 to investigate how e-Infrastructure benefit the social science research community.
− The UK Arts and Humanities Research Council initiated in 2007 a three year e-Science research programme consisting of seven projects.
Recommendation 17: Improve cross-disciplinary communication and collaboration. Communication barriers between social scientists or humanities researchers and computer scientists are a general feature of e-Infrastructure development in the social sciences and humanities. These place a burden on project development: specialized languages, “ping-pong” communication and differing work styles translate into differing expectations on what a project can and should achieve (see Section 4.3.4; Ribes and Finholt, 2007). The lack of interaction and mutual understanding between domain and computer scientists also burdens deployment. Some proposals and examples on how to deal with these communication barriers appeared in the AVROSS case studies: for instance, establishing micro-teams of domain and computer scientists, institutionalising user-developer collaboration through the project set-up, engaging “translators” which are educated in both fields.
5.5 Raising awareness
Recommendation 18: Create supportive institutional environments. Local IT staff and university administrations, deans and senior leaders in the home organization need to be more responsive to the challenges and possibilities of e-Infrastructure development. The responses to the AVROSS early adopters’ survey point to barriers to a more widespread use of e-Infrastructures which originate within scientific organizations: IT staff with other priorities and agendas, decision-makers who are unaware or overtly sceptical to the possible gains of investing in e-Infrastructure, or lacking support personnel which might assist with the installation and maintenance of the technology (see Sections 3.4.3 and 3.5.1).
Elsewhere it has been suggested to involve in e-Infrastructure projects the heads of university IT departments and other decision makers on computing infrastructure at higher education and research organizations (Mackie, 2007). This should help to increase IT departments’ support and raise the chances that new e-Infrastructures will later be integrated into the existing IT infrastructures. It might create tensions between people who want to develop new resources and applications and people who concentrate on providing and maintaining existing resources, as we also saw in some of the answers to the survey. However, the sooner these tensions become explicit and solutions are developed, the better the chances of making e-Infrastructures sustainable.
We have seen examples where internal scepticism or lack of resources has been circumvented through providing external support to researchers willing to invest time and effort into e-Infrastructures, such as the AGSC or the Dutch CATCH programme. Such positive examples should be promoted and communicated to the wider social science and humanities communities. An additional measure could be a general awareness-raising campaign for the latter disciplines, for instance through issuing a prize or medal for particularly innovative institutions. Flagship projects could be another measure of raising awareness by promoting the expansion and medium to large scale piloting of successful e-Infrastructure applications in SSH. Large scale is seen as a useful attribute to help improve outreach and impact.
M4 Final Report
151
Recommendation 19: Increase user-user interaction. Interaction in e-Infrastructure projects is mainly thought of along the lines of user-developer interaction (see Section 4.3.2). Our findings suggest that in addition to user-developer interaction, more user-user interaction would be beneficial, for example, as a mechanism for awareness raising and for disseminating lessons learnt. Possible avenues for this would include pilot users presenting showcases to potential users or PIs disseminating their results in the user domains. Although some interaction already takes place at the methodological sessions of conferences and workshops, more formal opportunities should be established in order that key SSH domain researchers become aware of e-Social Science. For instance, dedicated funding could be provided for organising conference panels on e-Infrastructures in key conferences across SSH.
Recommendation 20: Increase the information exchange across projects. Several of the early adopters commented that the exchange of information across different e-Infrastructure projects and domains opened up new avenues and produced interesting solutions to existing problems (see Section 3.5.1). Since the development of e-Infrastructures has been going on for some years, there is a risk that if information is not exchanged, new comers to the field will reinvent the wheel unless there are mechanisms in place to capture and disseminate best practice and lessons learnt.
It should be one of the objectives of the European Commission to ensure that information is not only exchanged across ongoing projects but also between completed and new projects. Moreover, projects at national level in the EU Member States should be included and links to the United States and other countries should be established and cultivated.34 Clearly, the information exchange should not be restricted to technological issues and address computer scientists only, but it should cover the domain sciences as well. Measures that facilitate networking such as conferences and seminars but also project repositories are important elements that lead to more information exchange. Others such as the organisation of interaction between projects and knowledge transfer between these through dedicated organisations such as the National Centre for e-Social Science (NCeSS) in the UK have also proven their value.
Recommendation 21: Involve lead users in community-building. Involving leading domain researchers in the diffusion of an e-Infrastructure and building of a user community might be a good strategy, as peers and researchers in the field are the main information source on e-Infrastructure and can publicize advances in their domain (see p. 44). There are some caveats associated with this approach, however. In particular, mastering a new tool takes considerable time and the effort is the higher the lower the technological level of the learner. In addition, established researchers may owe their position in part to the current infrastructural arrangements, e.g. their access to particular resources or technology (Edwards et al., 2007), which they might not be willing to put at risk.
5.6 A research programme on e-Infrastructure in the social sciences and humanities
This study has provided much valuable data on adoption patterns of e-Infrastructure within SSH. However, our findings must be understood as being provisional and bounded. This is for two main reasons: 1) the limited time and resources available have constrained the scope and depth of the data collection and our analysis; 2) the adoption of e-Infrastructure within SSH is a fast changing and dynamic picture as new user
34 Indeed, a recent NSF workshop on e-Infrastructure itself stressed the necessity of such an
undertaking (Edwards et al, 2007).
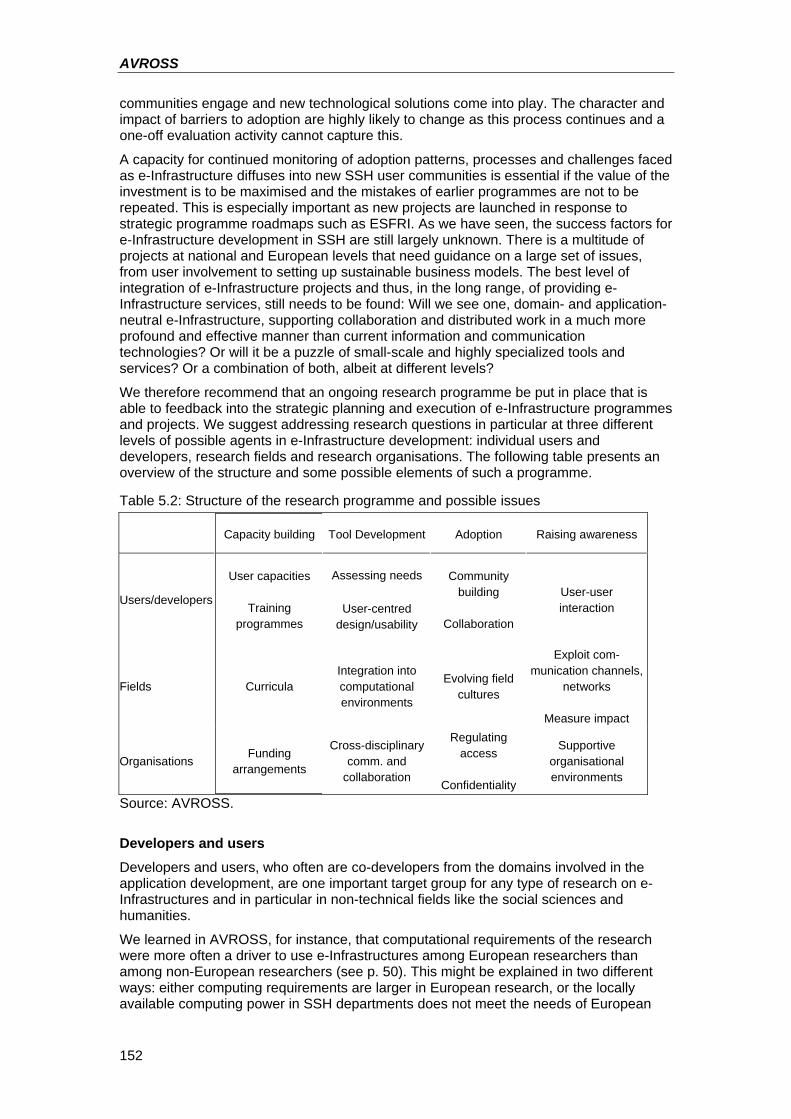
AVROSS
152
communities engage and new technological solutions come into play. The character and impact of barriers to adoption are highly likely to change as this process continues and a one-off evaluation activity cannot capture this.
A capacity for continued monitoring of adoption patterns, processes and challenges faced as e-Infrastructure diffuses into new SSH user communities is essential if the value of the investment is to be maximised and the mistakes of earlier programmes are not to be repeated. This is especially important as new projects are launched in response to strategic programme roadmaps such as ESFRI. As we have seen, the success factors for e-Infrastructure development in SSH are still largely unknown. There is a multitude of projects at national and European levels that need guidance on a large set of issues, from user involvement to setting up sustainable business models. The best level of integration of e-Infrastructure projects and thus, in the long range, of providing e-Infrastructure services, still needs to be found: Will we see one, domain- and application-neutral e-Infrastructure, supporting collaboration and distributed work in a much more profound and effective manner than current information and communication technologies? Or will it be a puzzle of small-scale and highly specialized tools and services? Or a combination of both, albeit at different levels?
We therefore recommend that an ongoing research programme be put in place that is able to feedback into the strategic planning and execution of e-Infrastructure programmes and projects. We suggest addressing research questions in particular at three different levels of possible agents in e-Infrastructure development: individual users and developers, research fields and research organisations. The following table presents an overview of the structure and some possible elements of such a programme.
Table 5.2: Structure of the research programme and possible issues
Capacity building Tool Development Adoption Raising awareness
Users/developers
User capacities
Training programmes
Assessing needs
User-centred design/usability
Community building
Collaboration
User-user interaction
Fields Curricula Integration into computational environments
Evolving field cultures
Exploit com-munication channels,
networks
Measure impact
Organisations Funding
arrangements
Cross-disciplinary comm. and
collaboration
Regulating access
Confidentiality
Supportive organisational environments
Source: AVROSS.
Developers and users Developers and users, who often are co-developers from the domains involved in the application development, are one important target group for any type of research on e-Infrastructures and in particular in non-technical fields like the social sciences and humanities.
We learned in AVROSS, for instance, that computational requirements of the research were more often a driver to use e-Infrastructures among European researchers than among non-European researchers (see p. 50). This might be explained in two different ways: either computing requirements are larger in European research, or the locally available computing power in SSH departments does not meet the needs of European
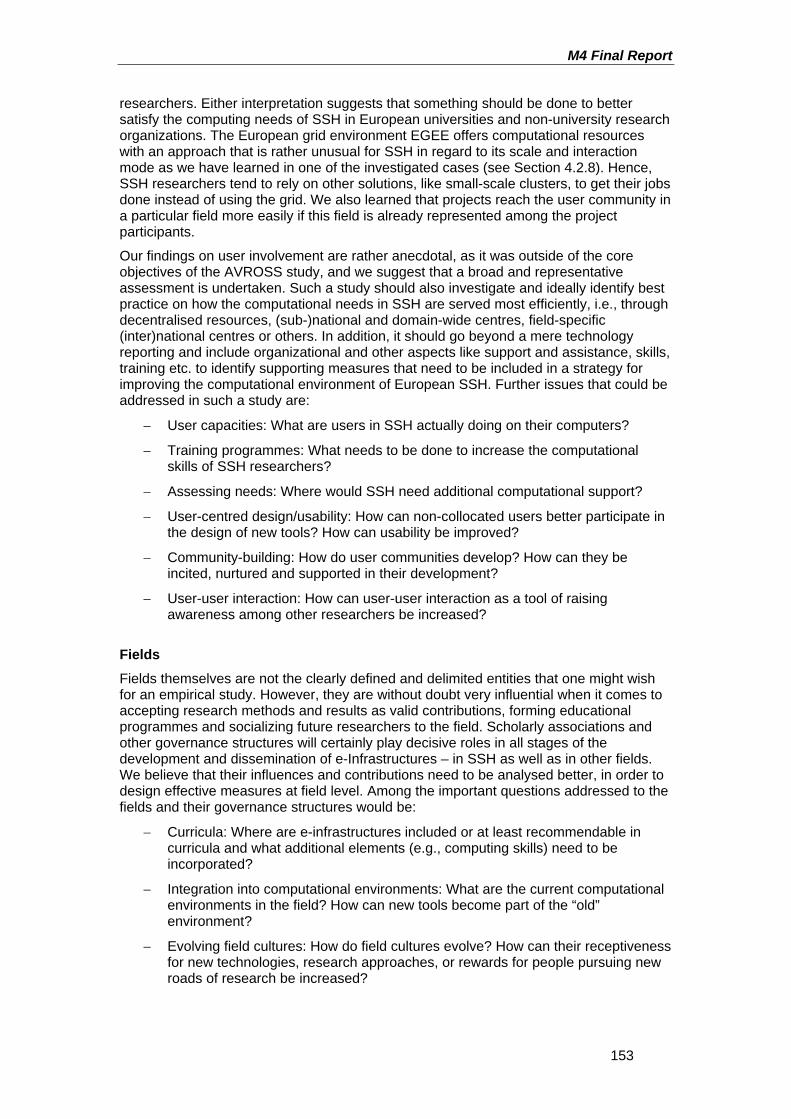
M4 Final Report
153
researchers. Either interpretation suggests that something should be done to better satisfy the computing needs of SSH in European universities and non-university research organizations. The European grid environment EGEE offers computational resources with an approach that is rather unusual for SSH in regard to its scale and interaction mode as we have learned in one of the investigated cases (see Section 4.2.8). Hence, SSH researchers tend to rely on other solutions, like small-scale clusters, to get their jobs done instead of using the grid. We also learned that projects reach the user community in a particular field more easily if this field is already represented among the project participants.
Our findings on user involvement are rather anecdotal, as it was outside of the core objectives of the AVROSS study, and we suggest that a broad and representative assessment is undertaken. Such a study should also investigate and ideally identify best practice on how the computational needs in SSH are served most efficiently, i.e., through decentralised resources, (sub-)national and domain-wide centres, field-specific (inter)national centres or others. In addition, it should go beyond a mere technology reporting and include organizational and other aspects like support and assistance, skills, training etc. to identify supporting measures that need to be included in a strategy for improving the computational environment of European SSH. Further issues that could be addressed in such a study are:
− User capacities: What are users in SSH actually doing on their computers?
− Training programmes: What needs to be done to increase the computational skills of SSH researchers?
− Assessing needs: Where would SSH need additional computational support?
− User-centred design/usability: How can non-collocated users better participate in the design of new tools? How can usability be improved?
− Community-building: How do user communities develop? How can they be incited, nurtured and supported in their development?
− User-user interaction: How can user-user interaction as a tool of raising awareness among other researchers be increased?
Fields Fields themselves are not the clearly defined and delimited entities that one might wish for an empirical study. However, they are without doubt very influential when it comes to accepting research methods and results as valid contributions, forming educational programmes and socializing future researchers to the field. Scholarly associations and other governance structures will certainly play decisive roles in all stages of the development and dissemination of e-Infrastructures – in SSH as well as in other fields. We believe that their influences and contributions need to be analysed better, in order to design effective measures at field level. Among the important questions addressed to the fields and their governance structures would be:
− Curricula: Where are e-infrastructures included or at least recommendable in curricula and what additional elements (e.g., computing skills) need to be incorporated?
− Integration into computational environments: What are the current computational environments in the field? How can new tools become part of the “old” environment?
− Evolving field cultures: How do field cultures evolve? How can their receptiveness for new technologies, research approaches, or rewards for people pursuing new roads of research be increased?
AVROSS
154
− Exploit communication channels, networks: How can existing communication channels and networks be used for raising awareness on e-Infrastructures?
Organisations Another part would deal with research organisations, universities and non-university research organisations. Traditionally research organisations are important pillars in the provision of infrastructure to academics in SSH: they maintain libraries, archives and repositories, computing resources and more. They often also manage to integrate different disciplines and fields. Much more needs to be done to insert e-Infrastructure development into their infrastructure policies and, in particular, new funding models need to be investigated:
− Funding arrangements: How can e-infrastructure funding through organisations budgets become established?
− Cross-disciplinary communication and collaboration: Can boundaries to cross-disciplinary communication and collaboration be overcome more easily within organisations?
− Regulating access: How can e-infrastructure access at the organisational level be facilitated?
− Confidentiality: What can organisations contribute to solving confidentiality problems?
− Supportive organisational environments: How can organisations become more supportive in general?
M4 Final Report
155
References Akrich, M., & Latour, B. (1992). A summary of a convenient vocabulary for the semiotics
of human and nonhuman assemblies. In W. E. Bijker & J. Law (Eds.), Shaping technology - building society studies in sociotechnical change (1 ed., pp. 259-264). Cambridge, MA; London: MIT Press.
Arzberger, P., Schroeder, P., Beaulieu, A., Bowker, G., Casey, K., Laaksonen, L., et al. (2004). Promoting Access to Public Research Data for Scientific, Economic, and Social Development. Data Science Journal (CODATA), 3, 135-152.
Aschenbrenner, A., Gietz, P. Haase, M., Knoll, F., Ludwig, C., Pempe, W., Sosto, M., & Vitt, T. (2006). Die TextGrid Architektur. Version Jan. 2007. Retrieved September 5, 2007, from: http://www.textgrid.de/fileadmin/ TextGrid/reports/TextGrid_Report_3_2.pdf.
Atkins, D. E., Droegemeier, K. K., Feldman, S. I., Garcia-Molina, H., Klein, M. L., Messerschmitt, D. G., et al. (2003). Revolutionizing Science and Engineering Through Cyberinfrastructure: Report of the National Science Foundation Blue-Ribbon Advisory Panel on Cyberinfrastructure. Washington, D.C.: National Science Foundation.
Berman, F., & Brady, H. (2005). Final Report: NSF SBE-CISE Workshop on Cyberinfrastructure and the Social Sciences. Retrieved October 3, 2006, from: http://vis.sdsc.edu/sbe/reports/SBE-CISE-FINAL.pdf.
Bijker, W. E. (1987). The social construction of bakelite: toward a theory of invention. In W. E. Bijker, T. P. Hughes & T. J. Pinch (Eds.), The social construction of technological systems (1 ed., pp. 159-187). Cambridge, Mass.; London: MIT Press.
Bradburn, N., & Mackie, C. (2000). Improving Access to and Confidentiality of Research Data: Report of a Workshop. Washington D.C.: National Academy Press.
Brooks, H. (1994). The relationship between science and technology. Research Policy, 23, 477-486.
Burton, L., & Lane J. (2005). e-science Investments in the Social and Behavioral Sciences at the National Science Foundation: An Overview of Projects, Programs, and Policy Issues. In Proceedings of First International Conference on e-social science. Manchester. Retrieved October 3, 2006, from http://www.ncess.ac.uk/events/conference/2005/papers/ ncess2005_paper_Burton.pdf.
Callon, M. (1986). The sociology of an actor-network: the case of the electric vehicle. In M. Callon, J. Law & A. Rip (Eds.), Mapping the dynamics of science and technology (1 ed., pp. 19-34). London: Macmillan.
Callon, M. (1991). Techno-economic networks and irreversibility. In J. Law (Ed.), A sociology of monsters: essays on power, technology and domination (1 ed., pp. 132-161). London; New York: Routledge.
Catlett, C. (2006). The State of TeraGrid - A National Production Cyberinfrastructure Facility. Retrieved 29 September, 2006, from http://www.teragrid.org/about/docs/StateOfTeraGrid-June2006.pdf.
Computing Research Association (CRA) (2005). Cyberinfrastructure for Education and Learning for the Future: a Vision and Research Agenda. Retrieved 20. De-cember, 2006 from: http://www.cra.org/reports/cyberinfrastructure.pdf.
Daw, M. (2006). Survey of UK Access Grid users. Retrieved August 28, 2007, from: http://www.agsc.ja.net/survey/2006/AccessGridSurveyResultsJan2006.pdf.
AVROSS
156
De Roure, D., Jennings, N., & Shadbolt, N. (2001). Research Agenda for the Semantic Grid: A Future e-science Infrastructure. Report commissioned for EPSRC/DTI Core e-science Programme. Retrieved 12. November, 2006, from http://www.semanticgrid.org/v1.9/semgrid.pdf.
Doyle, P., Lane, J., Zayatz, L., & Theeuwes, J. (2001). Confidentiality, Disclosure and Data Access: Theory and Practical Applications for Statistical Agencies. Amsterdam; London: North Holland.
Edge, D. (1995). The social shaping of technology. In N. Heap, R. Thomas, G. Einon, R. Mason & H. Mackay (Eds.), Information technology and society: a reader (1 ed., pp. 14-32). London, Thousand Oaks, New Delhi: Sage.
Edwards, P. N., Jackson, S. J., Bowker, G., & Knobel, C. P. (2007). Understanding infrastructure: Dynamics, tensions, and design. Report of a workshop on ‘History & theory of infrastructure: Lessons for new scientific cyberinfrastructure’. Retrieved July 29, 2007, from: http://www.si.umich.edu/ InfrastructureWorkshop/documents/UnderstandingInfrastructure2007.pdf.
e-Infrastructure Reflection Group (e-IRG) Task Force on Sustainable e-Infrastructures (SeI) (2006). Report e-IRG Task Force on Sustainable e-Infrastructures. Retrieved October 26, 2007, from: http://www.e-irg.org/publ/2006-Report_e-IRG_TF-SEI.pdf
Ellis, C. A., Gibbs, S. J., & Rein, G. L. (1991). Groupware: Some issues and experiences. Communications of the ACM, 34(1), 38-58.
European Commission (2007). Communication from the Commission to the European Parliament, the Council, and the European Economic and Social Committee on scientific information in the digital age: access, dissemination and preservation. COM(2007) 56 final. Retrieved November 2, 2007, from: http://ec.europa.eu/research/science-society/document_library/pdf_06/ communication-022007_en.pdf
European Strategy Forum on Research Infrastructures (2006). European Roadmap for Research Infrastructures. Retrieved October 26, 2007, from: ftp://ftp.cordis.europa.eu/pub/esfri/docs/esfri-roadmap-report-26092006_en.pdf.
Fleck, J. (1988). Innofusion or Diffusation? The nature of technological development in robotics. Edinburgh PICT Working Paper No. 7, Edinburgh University.
Fleck, J. (1994). Learning by trying: the implementation of configurational technology. Research Policy, 23(6), 637-652.
Fleck, J., Webster, J., & Williams, R. (1990). Dynamics of information technology implementation : A reassessment of paradigms and trajectories of development. Futures, 22(6), 618-640.
Frischer, B., Unsworth, J., Dwyer, A., Jones, A., Lancaster, L., Rockwell, G., et al. (2006). Summit on digital tools for the humanities: Report on summit accomplishments. Retrieved 29. July, 2007, from http://www.iath.virginia.edu/dtsummit/SummitText.pdf.
Fry, J. (2004). The Cultural Shaping of ICTs within Academic Fields: Corpus-based Linguistics as a Case Study. Literary and Linguistic Computing, 19(3), 303-319.
Gomez Alonso, J. (2007). Survey of UK Access Grid users. Retrieved August 28, 2007, from: http://www.agsc.ja.net/survey/2007/AccessGridSurvey Results 2007.pdf.
Griliches, Z. (1957). Hybrid Corn: An Exploration in the Economics of Technological Change. Econometrica 25 (October), 501-522.
M4 Final Report
157
Griliches, Z. (1962). Profitability Versus Interaction: Another False Dichotomy. Rural Sociology 27, 325-330.
Harrison, T. M., & Zappen, J. P. (2003). Methodological and Theoretical Frameworks for the Design of Community Information Systems. Journal of Computer-Mediated Communication, 8(3).
Kaur-Pedersen, S., & Kladakis, G. (2006). The HERA Survey on Infrastructural Research Facilities and Practices fort he Humanities in Europe. Retrieved April 4, 2007, from: http://www.heranet.info/Admin/Public/DWSDownload.aspx?File=Files% 2fFiler%2fFinal+deliverables%2fD7.1.2_HERA_Report_from_workshop_on_infrastructures.pdf.
Kline, R., & Pinch, T. (1999). The social construction of technology. In D. MacKenzie & J. Wajcman (Eds.), The social shaping of technology (2 ed., pp. 113-115). Buckingham, Philadelphia: Open University Press.
Kline, S. J., & Rosenberg, N. (1986). An overview of innovation. In R. Landau & N. Rosenberg (Eds.), The positive sum strategy (1 ed., pp. 275-305). Washington D.C.: National Academy Press.
Kling, R., & McKim, G. (2000). Not just a matter of time: Field differences and the Shaping of Electronic Media in Supporting Scientific Communication. Journal of the American Society for Information Science, 51(14), 1306-1320.
Latour, B. (1986). ‘The Powers of Association’. Power, Action and Belief. A new sociology of knowledge? In Law, J. (Ed). Sociological Review monograph 32 (pp. 264-280). London: Routledge & Kegan Paul.
Law, J. (1987). Technology and heterogeneous engineering: the case of Portuguese expansion. In W. E. Bijker, T. P. Hughes & T. J. Pinch (Eds.), The social construction of technological systems (1 ed., pp. 111-134). Cambridge, Mass., London: MIT Press.
Law, J., & Callon, M. (1992). The life and death of an aircraft: a network analysis of technical change. In W. E. Bijker & J. Law (Eds.), Shaping technology - building society studies in sociotechnical change (1 ed., pp. 21-52). Cambridge, MA, London: MIT Press.
Lawrence, K. (2006). Walking the Tightrope: The Balancing Acts of a Large e-Research Project. Computer Supported Cooperative Work (CSCW), 15(4), 385-411.
Leenaars, M., Heikkurinen, M., Louridas, P., Karayannis, F. (2005). e-Infrastructures Roadmap. Retrieved 23 November, 2006, from http://www.e-irg.org/roadmap/eIRG-roadmap.pdf.
Lord, P. (2007). SciDR - Towards an European Infrastructure for Digital Repositories. Paper presented at the Open Workshop on e-Infrastructures (e-IRG Workshop), Lisbon, Portugal, October 11, 2007. Retrieved October 18, 2007, from: http://www.e-irg.org/meetings/2007-PT/4-e_IRG_Pres_Oct07_v3.pdf
Mackie, C. J. (2007). Cyberinfrastructure, institutions, and sustainability. First Monday, 12(6). Retrieved 16 July, 2007, from: http://www.firstmonday.org/issues/issue12_6/mackie/.
MacKenzie, D., & Wajcman, J. (1999). Introductory essay: the social shaping of technology. In D. MacKenzie & J. Wajcman (Eds.), The social shaping of technology (2 ed., pp. 3-27). Buckingham, Philadelphia: Open University Press.
McLoughlin, I. (1999). Creative technological change. The shaping of technology and organisations (1 ed.). London; New York: Routledge.
AVROSS
158
Miettinen, R., & Hasu, M. (2002). Articulating User Needs in Collaborative Design: Towards an Activity-Theoretical Approach. Computer Supported Cooperative Work (CSCW), 11(1), 129-151.
Molina, A. H. (1997). Insights into the nature of technology diffusion and implementation: the perspective of sociotechnical alignment. Technovation, 17(11-12), 601-626.
National Science Foundation [NSF] (2006). Next Generation Cybertools. Retrieved October 4, 2006, from http://www.nsf.gov/funding/pgm_summ.jsp? pims_id=13553&org=CISE&from=fund.
National Science Foundation [NSF] Cyberinfrastructure Council (2006). NSF’s Cyberinfrastructure Vision For 21st Century Discovery. Retrieved 29 September, 2006, from http://www.nsf.gov/od/oci/ci_v5.pdf.
OECD (2007). OECD Principles and Guidelines for Access to Research Data from Public Funding. Paris: OECD. Retrieved October, 18, 2007, from: http://www.oecd.org/dataoecd/9/61/38500813.pdf.
Owen-Smith, J., Riccaboni, M., Pammolli, F., & Powell, W. W. (2002). A comparison of US and European university-industry relations in the life sciences. Management Science, 48(1), 24-43.
Pinch, T. J., & Bijker, W. E. (1987). The social construction of facts and artifacts: or how the sociology of science and the sociology of technology might benefit each other. In W. E. Bijker, T. P. Hughes & T. J. Pinch (Eds.), The social construction of technological systems (1 ed., pp. 17-50). Cambridge, Mass., London: MIT Press.
Procter, R. (2007). Challenges for sustainability: perspectives and experiences from e-Social Science. Paper presented at the Open Workshop on e-Infrastructures (e-IRG Workshop), Heidelberg, Germany, April 19-20, 2007. Retrieved October 17, 2007, from: http://www.e-irg.org/ meetings/2007-DE/RobProcter.pdf
Ribes, D., & Finholt, T. A. (2007): Tensions Across the Scales: Planning Infrastructure for the Long-Term. In Proceedings of the International ACM SIGGROUP Conference on Supporting Group Work (GROUP ’07). New York, NY: ACM Press.
Rodden, T. et al. (no year). The DReSS research node. Unpublished Manuscript.
Rogers, E. M. (1995). Diffusion of innovations (4 ed.). New York et al.: Free Press.
Simonton, D. K. (2004). Creativity in science: chance, logic, genius, and Zeitgeist. Cambridge, UK: Cambridge University Press.
Skinner, J., & Staiger, D. (2005, March). Technology Adoption from Hybrid Corn to Beta Blockers. National Bureau of Economic Research [NBER] Working Paper W11251. Washington: NBER.
The Netherlands Organisation for Scientific Research (2005). Continuous Access To Cultural Heritage – a computer science research programme. The Hague: The Netherlands Organisation for Scientific Research, Councils for Physical Sciences and Humanities. Retrieved September 25, 2007 from: http://www.nwo.nl/nwohome.nsf/pages/NWOA_6MME42/$file/ NWO008_WTK_CATCH_BOEKJE.pdf.
Vanneschi, M. (2005). Survey of Activities in Universities and Research Labs. Deliverable D.3.1.2 of GridCoord. Retrieved 2 Oktober, 2006 from: http://www.gridcoord.org/grid/portal/information/public/D.3.1.2_V.1.2_181105.doc.
M4 Final Report
159
Voss, A., Mascord, M., Fraser, M., Jirotka, M., Procter, R., Halfpenny, P., Fergusson, D., Atkinson, M., Dunn, S., Blanke, T., Hughes, L., & Anderson, S. (2007). e-Research Infrastructure Development and Community Engagement. Paper presented at the UK e-Science 2007 All Hands Meeting. Retrieved October 31, 2007, from http://www.allhands.org.uk/2007/proceedings/papers/866.pdf
Walsh, J. P., & Bayma, T. (1996). Computer networks and scientific work. Social Studies of Science, 26, 661-703.
Wegner, D. (1987). Transactive memory: a contemporary analysis of the group mind. In B. Mullen & G. Goethals (Eds.), Theories of group behaviour (1 ed., pp. 185-208). New York: Springer.
Williams, R. (1997). The social shaping of information and communication technologies. In H. Kubicek, W. H. Dutton & R. Williams (Eds.), The social shaping of information superhighways European and American roads to the information society (1 ed., pp. 299-338). Frankfurt am Main: Campus.
Williams, R., & Edge, D. (1996). The social shaping of technology. Research Policy, 25(6), 865-899.
Williams, R., Stewart, J. and Slack, R. (2005). Social Learning in Technological Innovation: Experimenting with Information and Communication Technologies. Cheltenham: Edward Elgar.
Winner, L. (1999). Do artifacts have politics? In D. MacKenzie & J. Wajcman (Eds.), The social shaping of technology (2 ed., pp. 28-40). Buckingham, Philadelphia: Open University Press.
Woolgar, S., & Coopmans, C. (2006). Virtual Witnessing in a VirtuaI Age: A Prospectus for Social Studies of E-Science In C. Hine (Ed.), New Infrastructure for Knowledge Production: Understanding E-Science (pp. 1-25). Hershey: Idea Group.
Wouters, P. (2002). Policies on Digital Research Data – An International Survey. Amsterdam: NIWI-KNAW.
Wouters, P., & Beaulieu, A. (2006). Imagining e-science beyond computation. In C. Hine (Ed.), New Infrastructure for Knowledge Production: Understanding E-Science. Hershey: Idea Group.
Wouters, P., & Schröder, P. (Eds.). (2003). Promise and Practice in Data Sharing. Amsterdam: NIWI-KNAW.
Zimmerman, A. and Nardi, B. (2006). Whither or Whether HCI: Requirements Analysis for Multi-Sited, Multi-User Cyberinfrastructures. Position paper, Workshop on Usability Research Challenges for Cyberinfrastructure and Tools, ACM CHI Conference.
Zucker, L. G., Darby, M. R., & Brewer, M. B. (1998). Intellectual Human Capital and the Birth of U.S. Biotechnology Enterprises. American Economic Review, 88(1), 291-316.
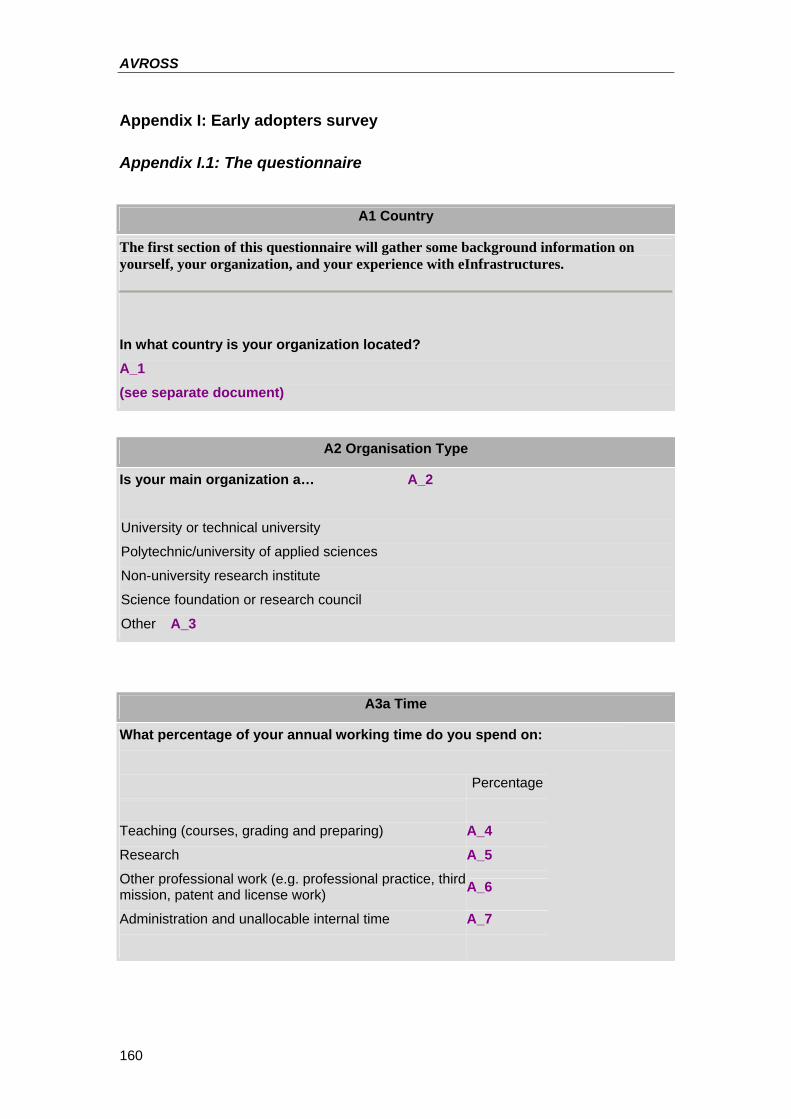
AVROSS
160
Appendix I: Early adopters survey
Appendix I.1: The questionnaire
A1 Country
The first section of this questionnaire will gather some background information on yourself, your organization, and your experience with eInfrastructures.
In what country is your organization located? A_1 (see separate document)
A2 Organisation Type
Is your main organization a… A_2
University or technical university Polytechnic/university of applied sciences Non-university research institute Science foundation or research council
Other A_3
A3a Time
What percentage of your annual working time do you spend on:
Percentage
Teaching (courses, grading and preparing) A_4
Research A_5
Other professional work (e.g. professional practice, third mission, patent and license work) A_6
Administration and unallocable internal time A_7
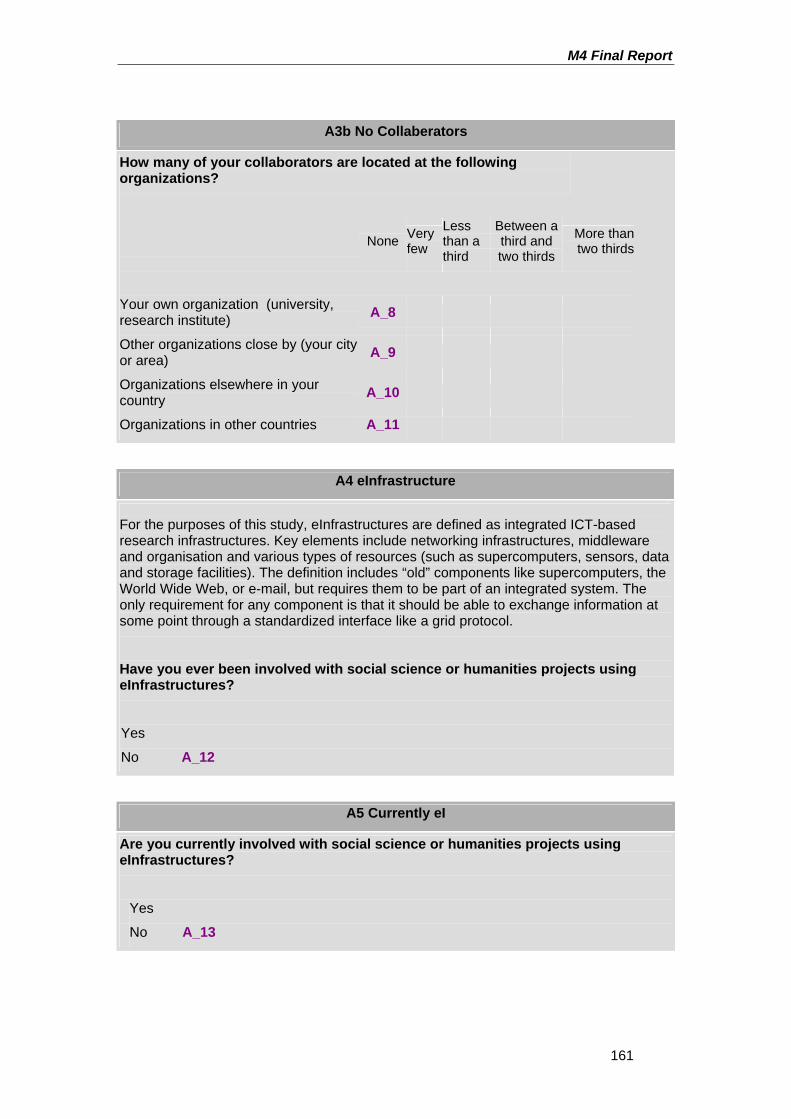
M4 Final Report
161
A3b No Collaberators
How many of your collaborators are located at the following organizations?
None Very few
Less than a third
Between a third and two thirds
More than two thirds
Your own organization (university, research institute) A_8
Other organizations close by (your city or area) A_9
Organizations elsewhere in your country A_10
Organizations in other countries A_11
A4 eInfrastructure
For the purposes of this study, eInfrastructures are defined as integrated ICT-based research infrastructures. Key elements include networking infrastructures, middleware and organisation and various types of resources (such as supercomputers, sensors, data and storage facilities). The definition includes “old” components like supercomputers, the World Wide Web, or e-mail, but requires them to be part of an integrated system. The only requirement for any component is that it should be able to exchange information at some point through a standardized interface like a grid protocol.
Have you ever been involved with social science or humanities projects using eInfrastructures?
Yes
No A_12
A5 Currently eI
Are you currently involved with social science or humanities projects using eInfrastructures?
Yes
No A_13
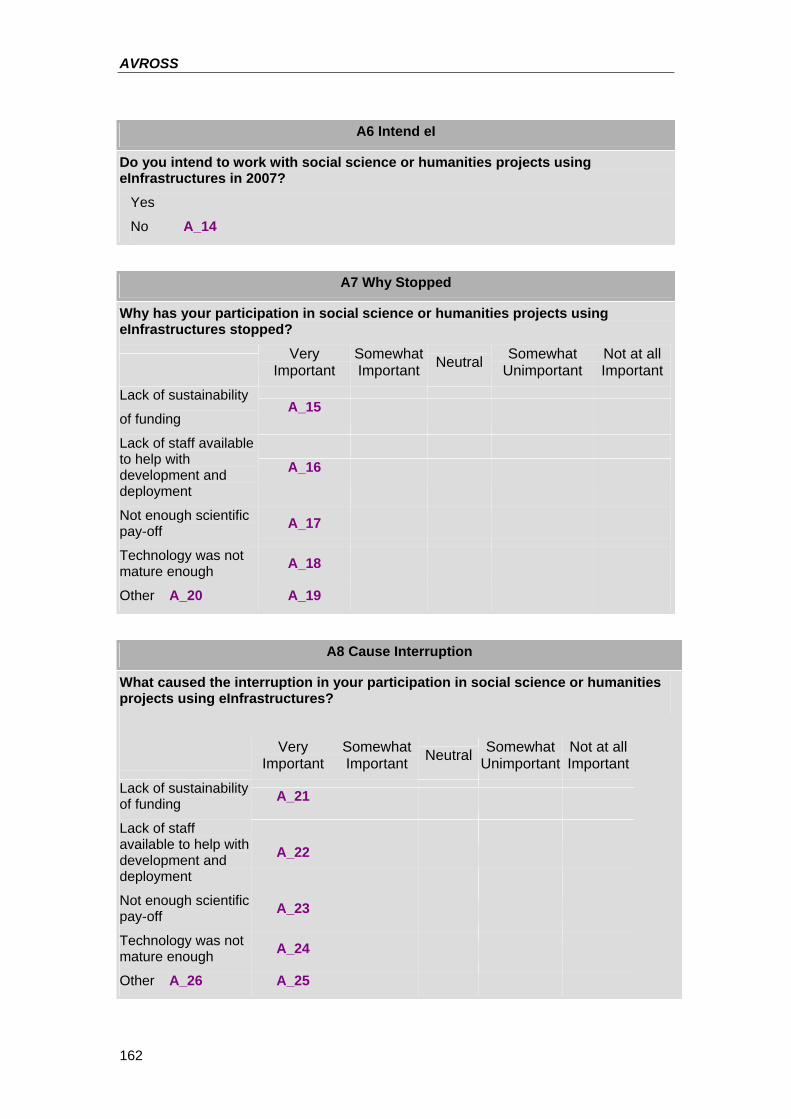
AVROSS
162
A6 Intend eI
Do you intend to work with social science or humanities projects using eInfrastructures in 2007?
Yes
No A_14
A7 Why Stopped
Why has your participation in social science or humanities projects using eInfrastructures stopped?
Very
Important Somewhat Important Neutral Somewhat
Unimportant Not at all Important
Lack of sustainability
of funding A_15
Lack of staff available to help with development and deployment
A_16
Not enough scientific pay-off A_17
Technology was not mature enough A_18
Other A_20 A_19
A8 Cause Interruption
What caused the interruption in your participation in social science or humanities projects using eInfrastructures?
Very
Important Somewhat Important Neutral Somewhat
Unimportant Not at all Important
Lack of sustainability of funding A_21
Lack of staff available to help with development and deployment
A_22
Not enough scientific pay-off A_23
Technology was not mature enough A_24
Other A_26 A_25
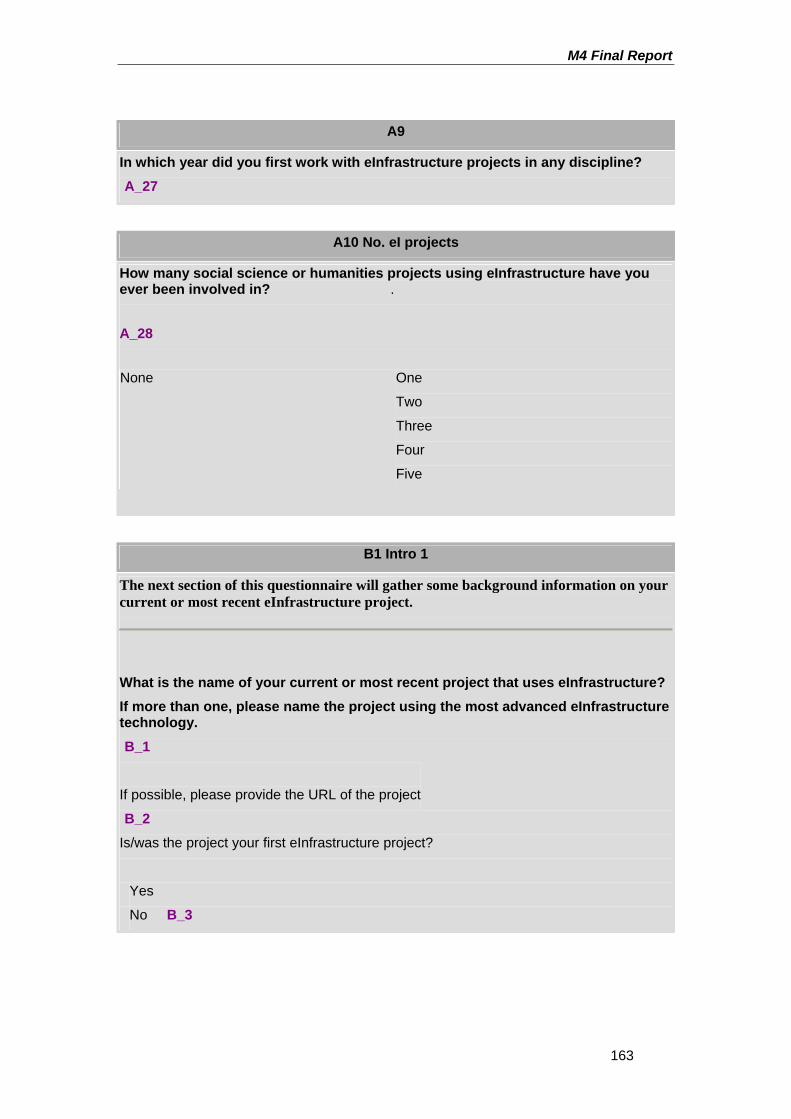
M4 Final Report
163
A9
In which year did you first work with eInfrastructure projects in any discipline? A_27
A10 No. eI projects
How many social science or humanities projects using eInfrastructure have you ever been involved in? .
A_28
None One
Two
Three
Four
Five
B1 Intro 1
The next section of this questionnaire will gather some background information on your current or most recent eInfrastructure project.
What is the name of your current or most recent project that uses eInfrastructure? If more than one, please name the project using the most advanced eInfrastructure technology. B_1
If possible, please provide the URL of the project
B_2
Is/was the project your first eInfrastructure project?
Yes
No B_3
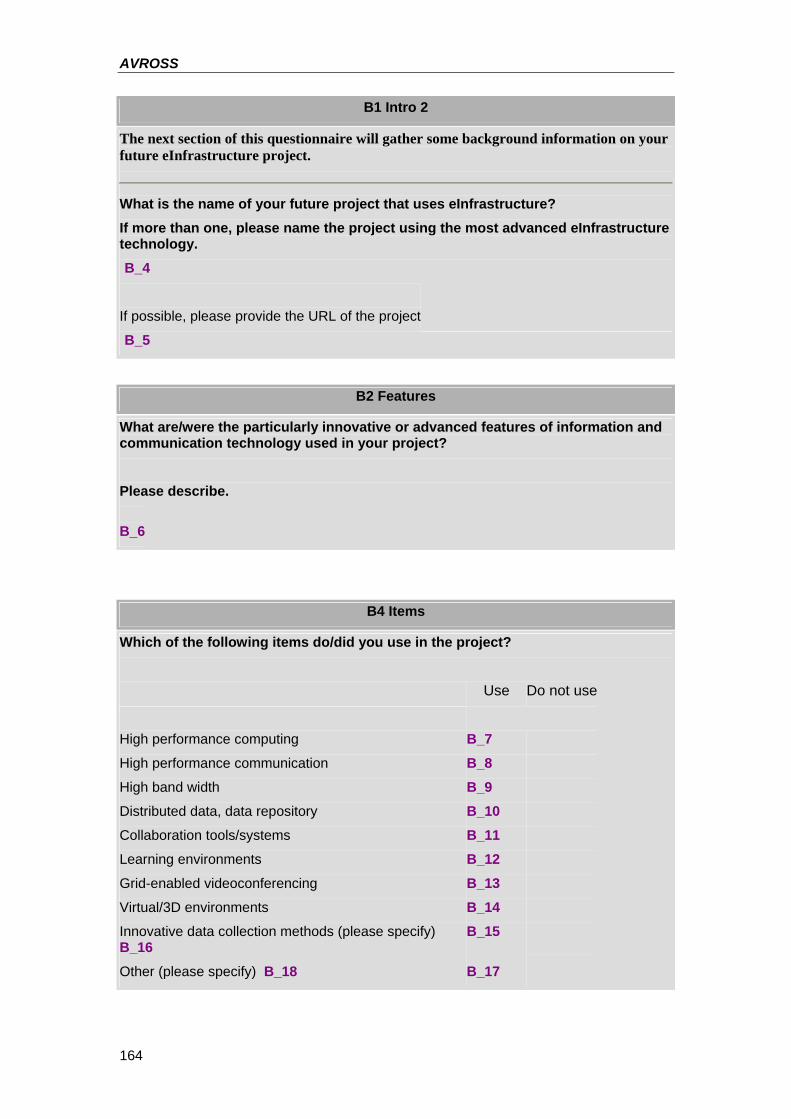
AVROSS
164
B1 Intro 2
The next section of this questionnaire will gather some background information on your future eInfrastructure project.
What is the name of your future project that uses eInfrastructure? If more than one, please name the project using the most advanced eInfrastructure technology. B_4
If possible, please provide the URL of the project
B_5
B2 Features
What are/were the particularly innovative or advanced features of information and communication technology used in your project? Please describe.
B_6
B4 Items
Which of the following items do/did you use in the project?
Use Do not use
High performance computing B_7
High performance communication B_8
High band width B_9
Distributed data, data repository B_10
Collaboration tools/systems B_11
Learning environments B_12
Grid-enabled videoconferencing B_13
Virtual/3D environments B_14
Innovative data collection methods (please specify) B_16
B_15
Other (please specify) B_18 B_17
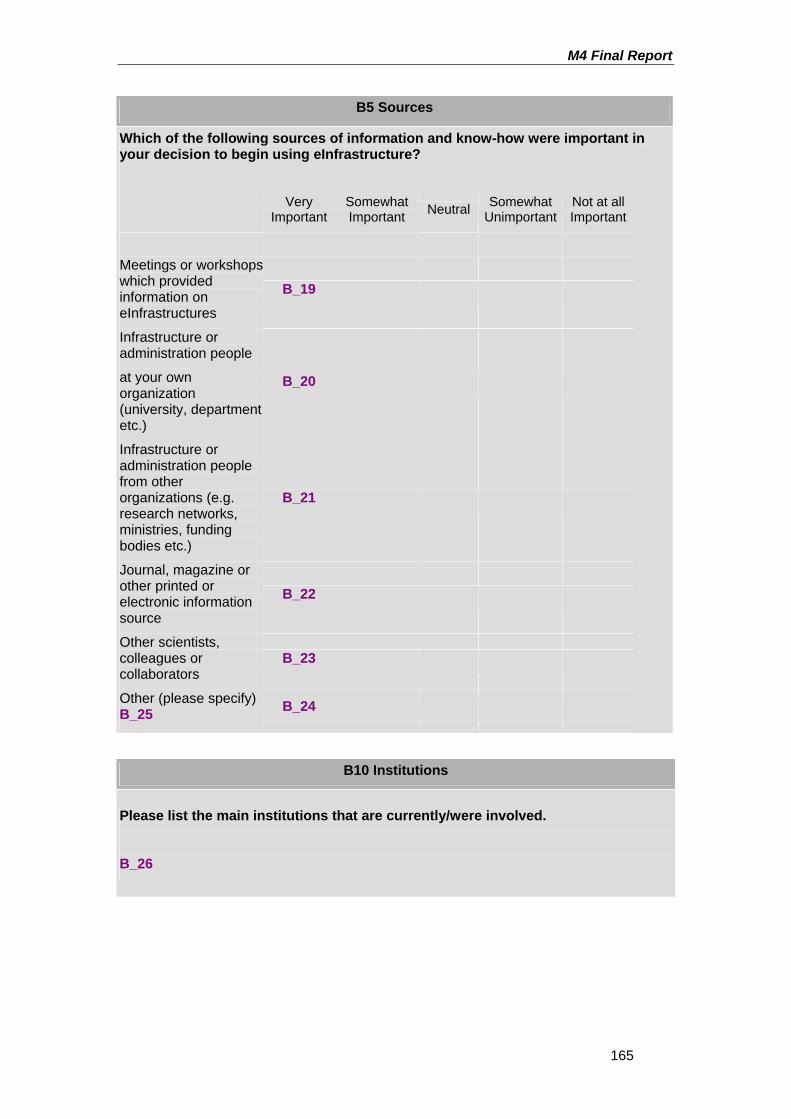
M4 Final Report
165
B5 Sources
Which of the following sources of information and know-how were important in your decision to begin using eInfrastructure?
Very
Important Somewhat Important Neutral Somewhat
UnimportantNot at all Important
Meetings or workshops which provided information on eInfrastructures
B_19
Infrastructure or administration people
at your own organization (university, department etc.)
B_20
Infrastructure or administration people from other organizations (e.g. research networks, ministries, funding bodies etc.)
B_21
Journal, magazine or other printed or electronic information source
B_22
Other scientists, colleagues or collaborators
B_23
Other (please specify) B_25 B_24
B10 Institutions
Please list the main institutions that are currently/were involved.
B_26
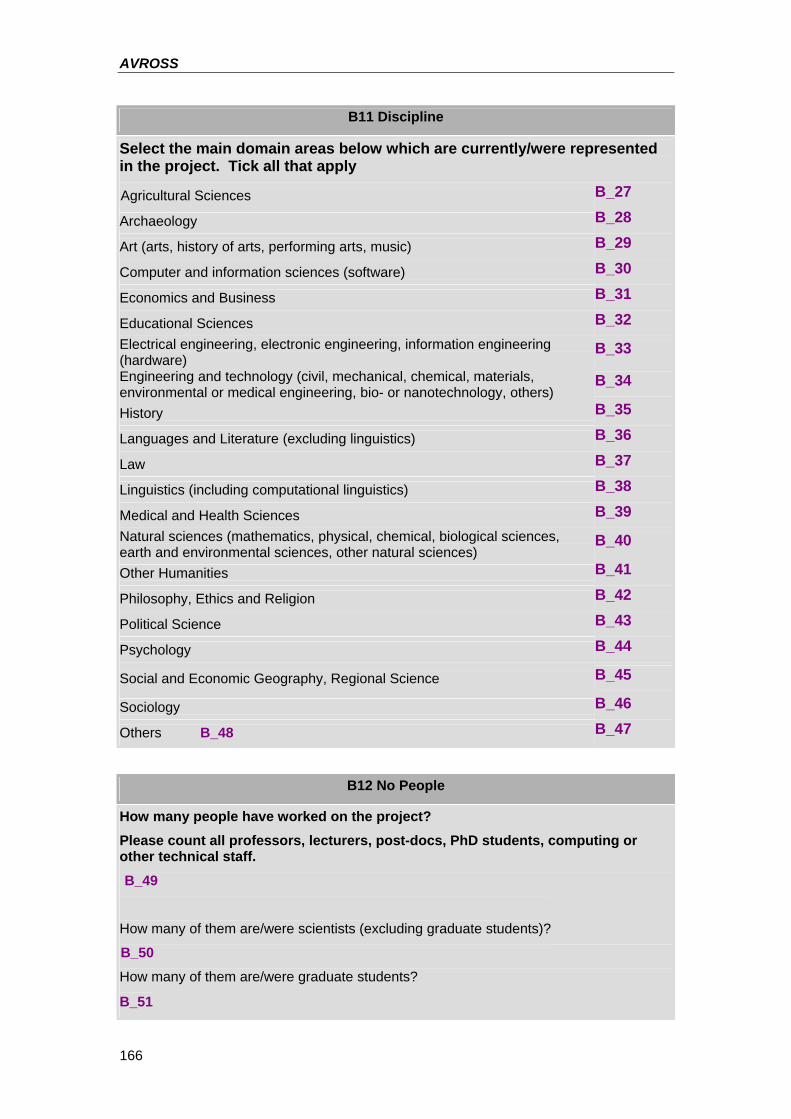
AVROSS
166
B11 Discipline
Select the main domain areas below which are currently/were represented in the project. Tick all that apply
Agricultural Sciences B_27
Archaeology B_28
Art (arts, history of arts, performing arts, music) B_29
Computer and information sciences (software) B_30
Economics and Business B_31
Educational Sciences B_32 Electrical engineering, electronic engineering, information engineering (hardware)
B_33
Engineering and technology (civil, mechanical, chemical, materials, environmental or medical engineering, bio- or nanotechnology, others)
B_34
History B_35
Languages and Literature (excluding linguistics) B_36
Law B_37
Linguistics (including computational linguistics) B_38
Medical and Health Sciences B_39 Natural sciences (mathematics, physical, chemical, biological sciences, earth and environmental sciences, other natural sciences)
B_40
Other Humanities B_41
Philosophy, Ethics and Religion B_42
Political Science B_43
Psychology B_44
Social and Economic Geography, Regional Science B_45
Sociology B_46
Others B_48 B_47
B12 No People
How many people have worked on the project? Please count all professors, lecturers, post-docs, PhD students, computing or other technical staff. B_49
How many of them are/were scientists (excluding graduate students)?
B_50
How many of them are/were graduate students?
B_51
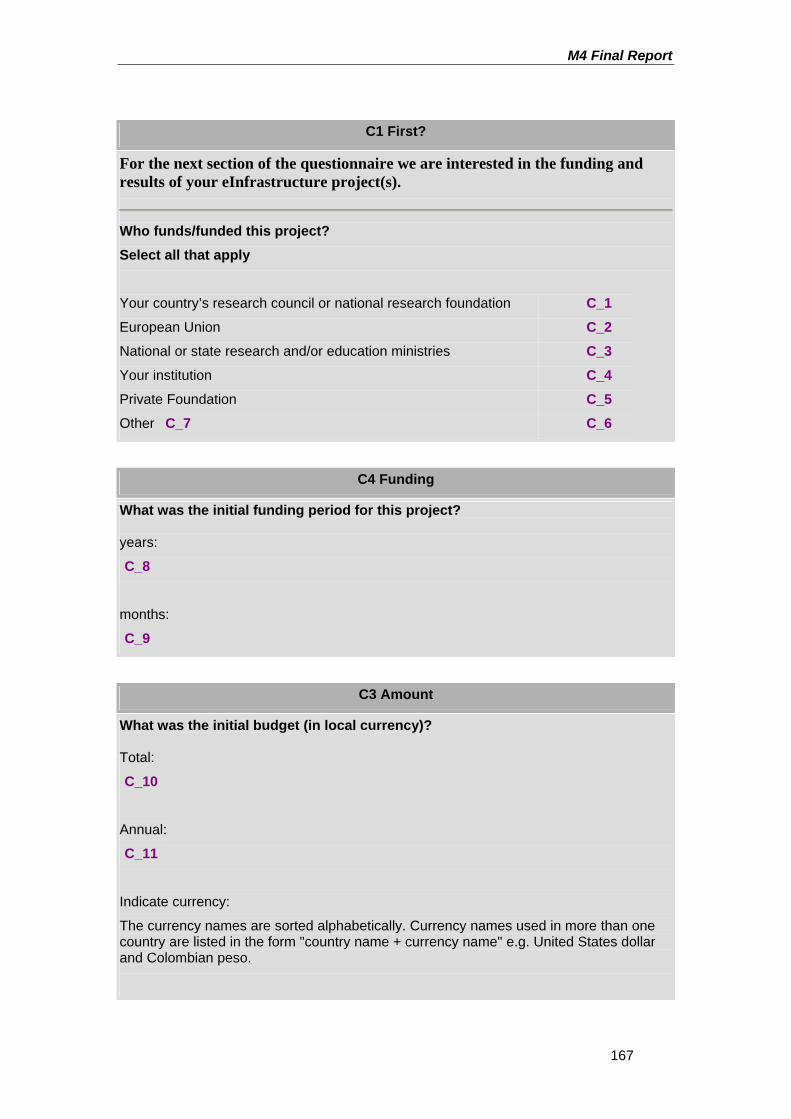
M4 Final Report
167
C1 First?
For the next section of the questionnaire we are interested in the funding and results of your eInfrastructure project(s).
Who funds/funded this project? Select all that apply
Your country’s research council or national research foundation C_1
European Union C_2
National or state research and/or education ministries C_3
Your institution C_4
Private Foundation C_5
Other C_7 C_6
C4 Funding
What was the initial funding period for this project? years:
C_8
months:
C_9
C3 Amount
What was the initial budget (in local currency)? Total:
C_10
Annual:
C_11
Indicate currency:
The currency names are sorted alphabetically. Currency names used in more than one country are listed in the form "country name + currency name" e.g. United States dollar and Colombian peso.
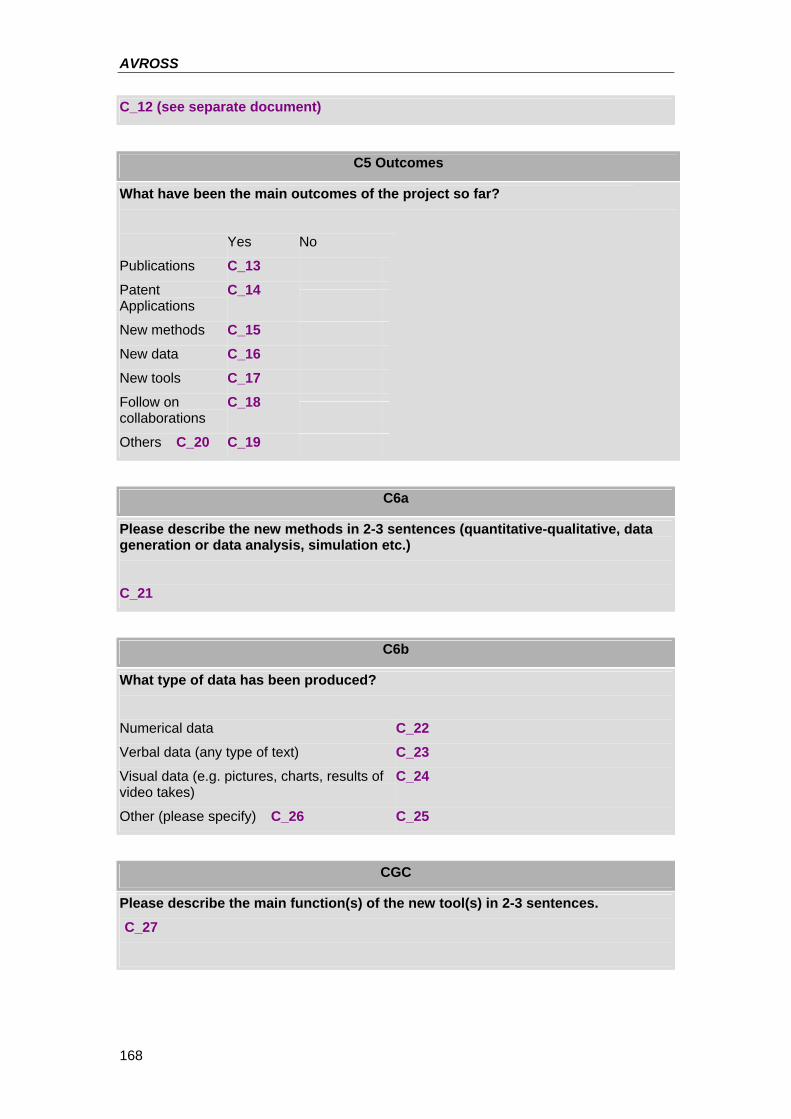
AVROSS
168
C_12 (see separate document)
C5 Outcomes
What have been the main outcomes of the project so far?
Yes No
Publications C_13
Patent Applications
C_14
New methods C_15
New data C_16
New tools C_17
Follow on collaborations
C_18
Others C_20 C_19
C6a
Please describe the new methods in 2-3 sentences (quantitative-qualitative, data generation or data analysis, simulation etc.)
C_21
C6b
What type of data has been produced?
Numerical data C_22
Verbal data (any type of text) C_23
Visual data (e.g. pictures, charts, results of video takes)
C_24
Other (please specify) C_26 C_25
CGC
Please describe the main function(s) of the new tool(s) in 2-3 sentences. C_27
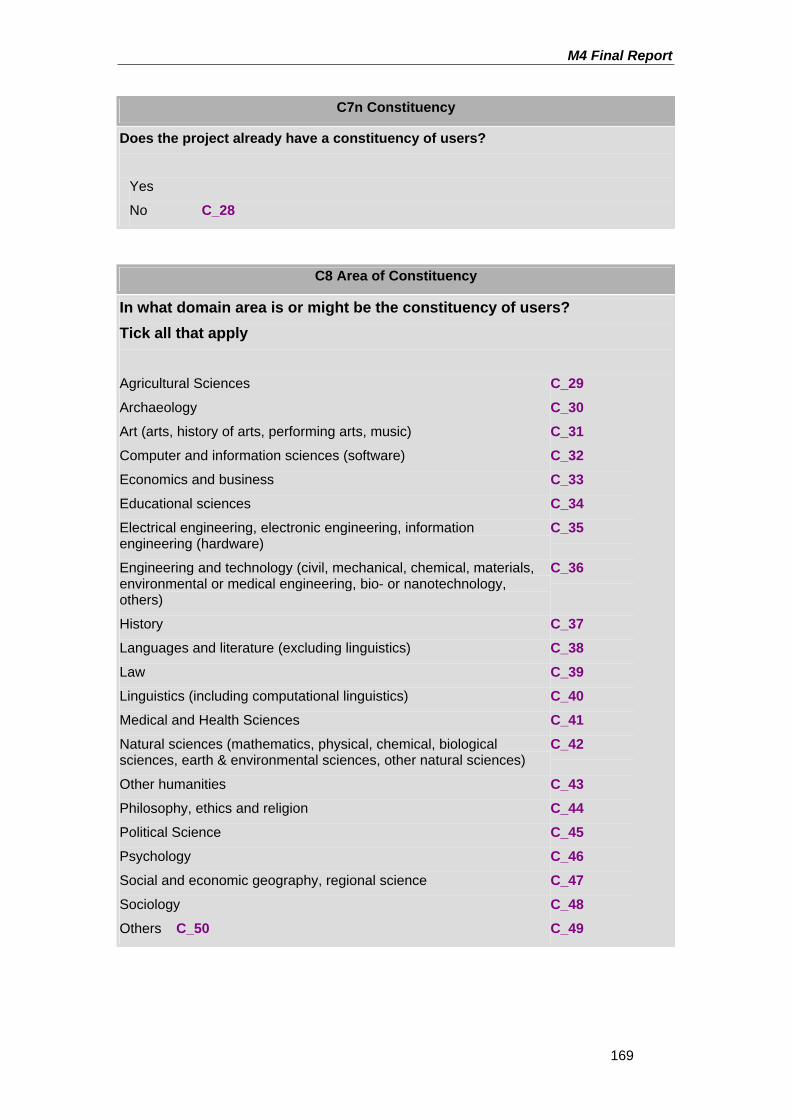
M4 Final Report
169
C7n Constituency
Does the project already have a constituency of users?
Yes
No C_28
C8 Area of Constituency
In what domain area is or might be the constituency of users? Tick all that apply
Agricultural Sciences C_29
Archaeology C_30
Art (arts, history of arts, performing arts, music) C_31
Computer and information sciences (software) C_32
Economics and business C_33
Educational sciences C_34
Electrical engineering, electronic engineering, information engineering (hardware)
C_35
Engineering and technology (civil, mechanical, chemical, materials, environmental or medical engineering, bio- or nanotechnology, others)
C_36
History C_37
Languages and literature (excluding linguistics) C_38
Law C_39
Linguistics (including computational linguistics) C_40
Medical and Health Sciences C_41
Natural sciences (mathematics, physical, chemical, biological sciences, earth & environmental sciences, other natural sciences)
C_42
Other humanities C_43
Philosophy, ethics and religion C_44
Political Science C_45
Psychology C_46
Social and economic geography, regional science C_47
Sociology C_48
Others C_50 C_49
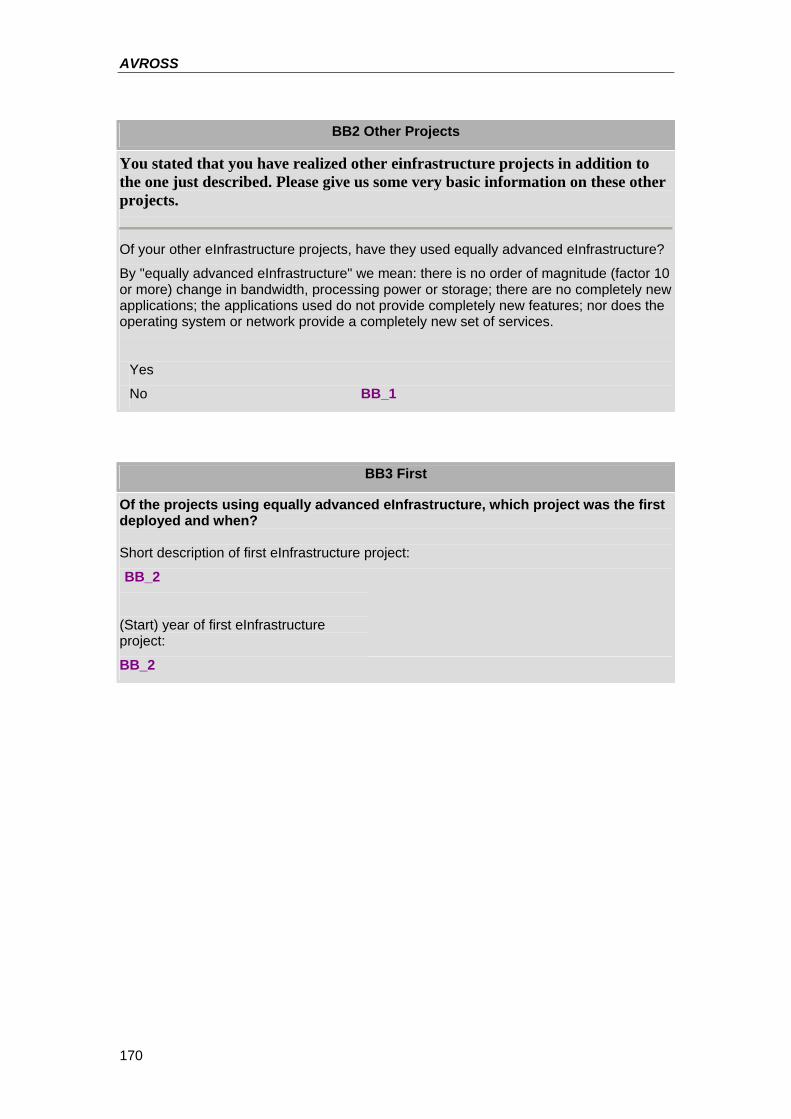
AVROSS
170
BB2 Other Projects
You stated that you have realized other einfrastructure projects in addition to the one just described. Please give us some very basic information on these other projects.
Of your other eInfrastructure projects, have they used equally advanced eInfrastructure?
By "equally advanced eInfrastructure" we mean: there is no order of magnitude (factor 10 or more) change in bandwidth, processing power or storage; there are no completely new applications; the applications used do not provide completely new features; nor does the operating system or network provide a completely new set of services.
Yes
No BB_1
BB3 First
Of the projects using equally advanced eInfrastructure, which project was the first deployed and when? Short description of first eInfrastructure project:
BB_2
(Start) year of first eInfrastructure project:
BB_2
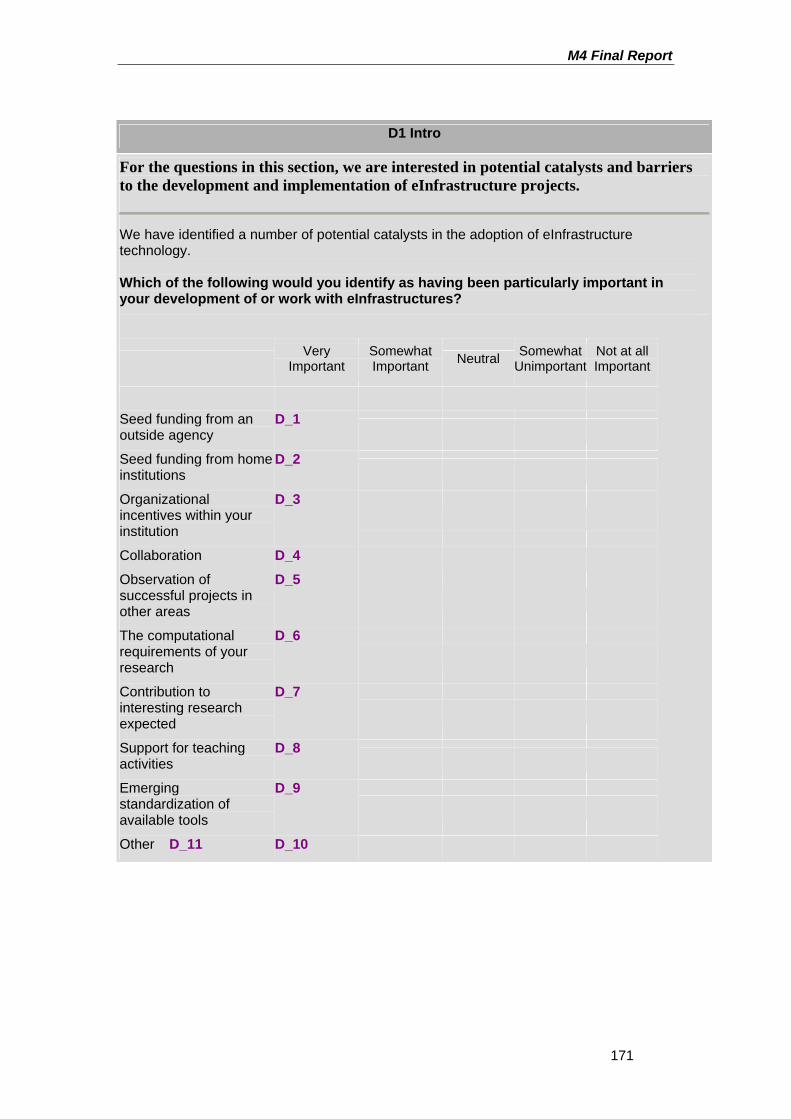
M4 Final Report
171
D1 Intro
For the questions in this section, we are interested in potential catalysts and barriers to the development and implementation of eInfrastructure projects.
We have identified a number of potential catalysts in the adoption of eInfrastructure technology. Which of the following would you identify as having been particularly important in your development of or work with eInfrastructures?
Very
Important Somewhat Important Neutral Somewhat
UnimportantNot at all Important
Seed funding from an outside agency
D_1
Seed funding from home institutions
D_2
Organizational incentives within your institution
D_3
Collaboration D_4
Observation of successful projects in other areas
D_5
The computational requirements of your research
D_6
Contribution to interesting research expected
D_7
Support for teaching activities
D_8
Emerging standardization of available tools
D_9
Other D_11 D_10
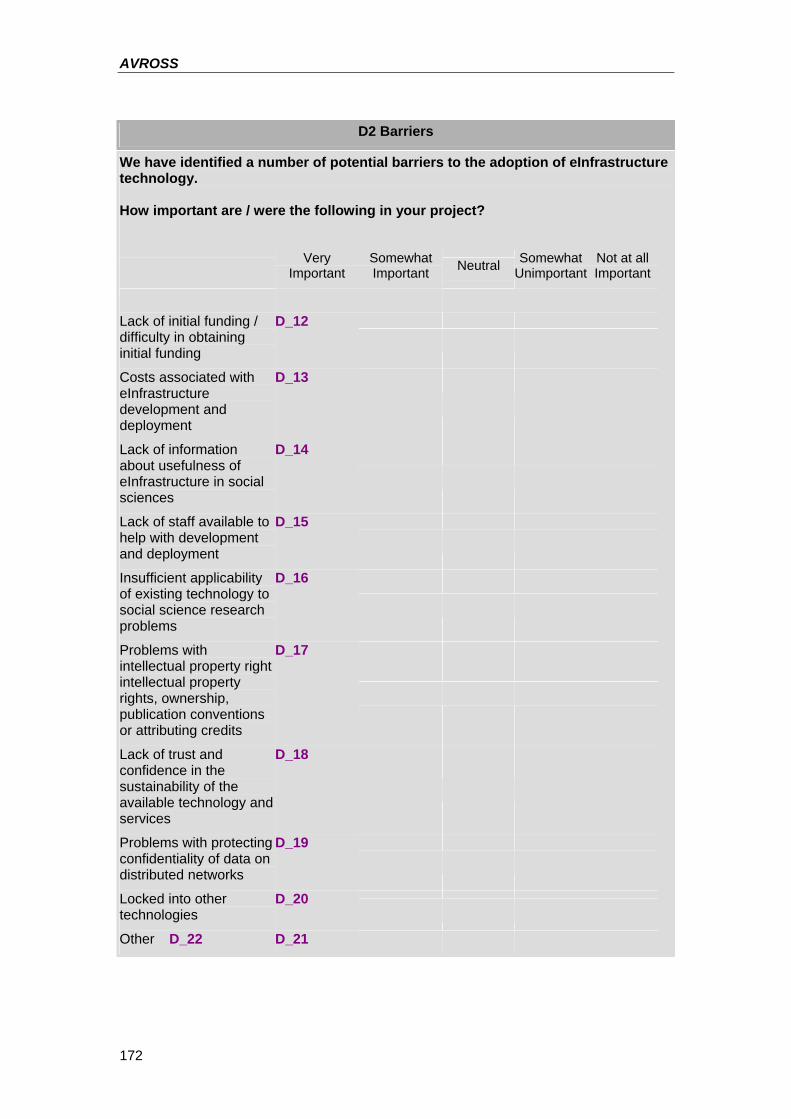
AVROSS
172
D2 Barriers
We have identified a number of potential barriers to the adoption of eInfrastructure technology. How important are / were the following in your project?
Very
Important Somewhat Important Neutral Somewhat
UnimportantNot at all Important
Lack of initial funding / difficulty in obtaining initial funding
D_12
Costs associated with eInfrastructure development and deployment
D_13
Lack of information about usefulness of eInfrastructure in social sciences
D_14
Lack of staff available to help with development and deployment
D_15
Insufficient applicability of existing technology to social science research problems
D_16
Problems with intellectual property right intellectual property rights, ownership, publication conventions or attributing credits
D_17
Lack of trust and confidence in the sustainability of the available technology and services
D_18
Problems with protecting confidentiality of data on distributed networks
D_19
Locked into other technologies
D_20
Other D_22 D_21
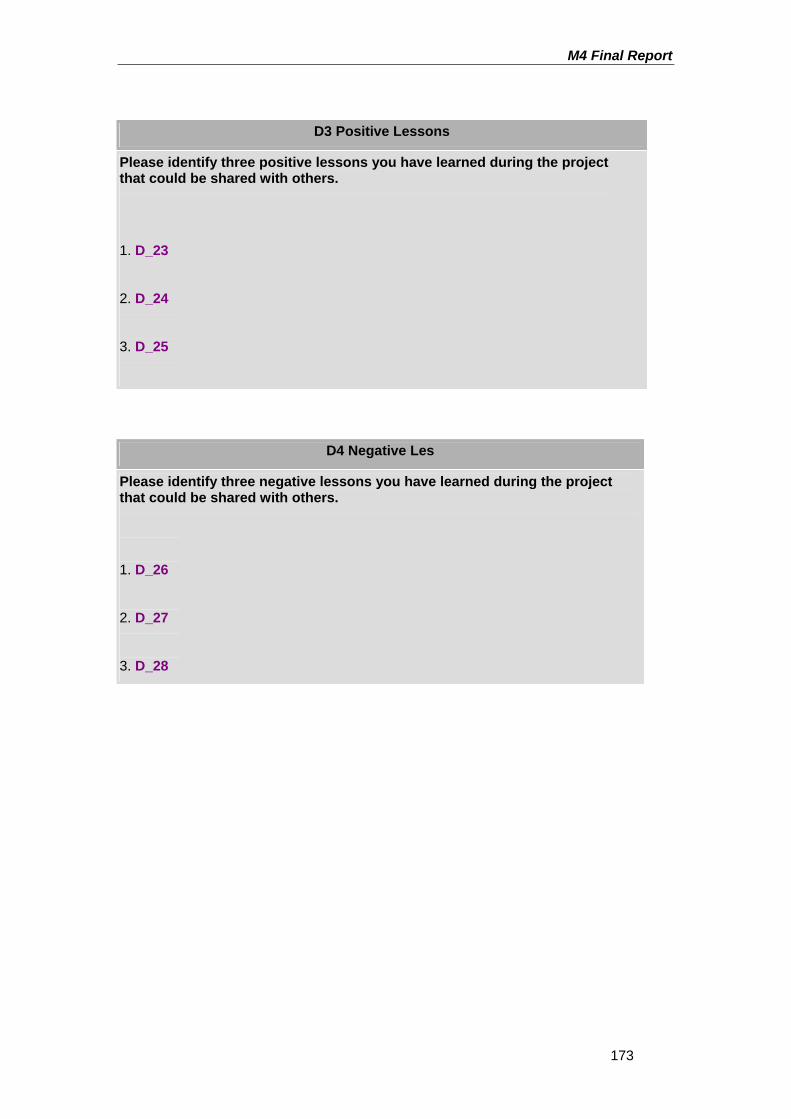
M4 Final Report
173
D3 Positive Lessons
Please identify three positive lessons you have learned during the project that could be shared with others.
1. D_23
2. D_24
3. D_25
D4 Negative Les
Please identify three negative lessons you have learned during the project that could be shared with others.
1. D_26
2. D_27
3. D_28
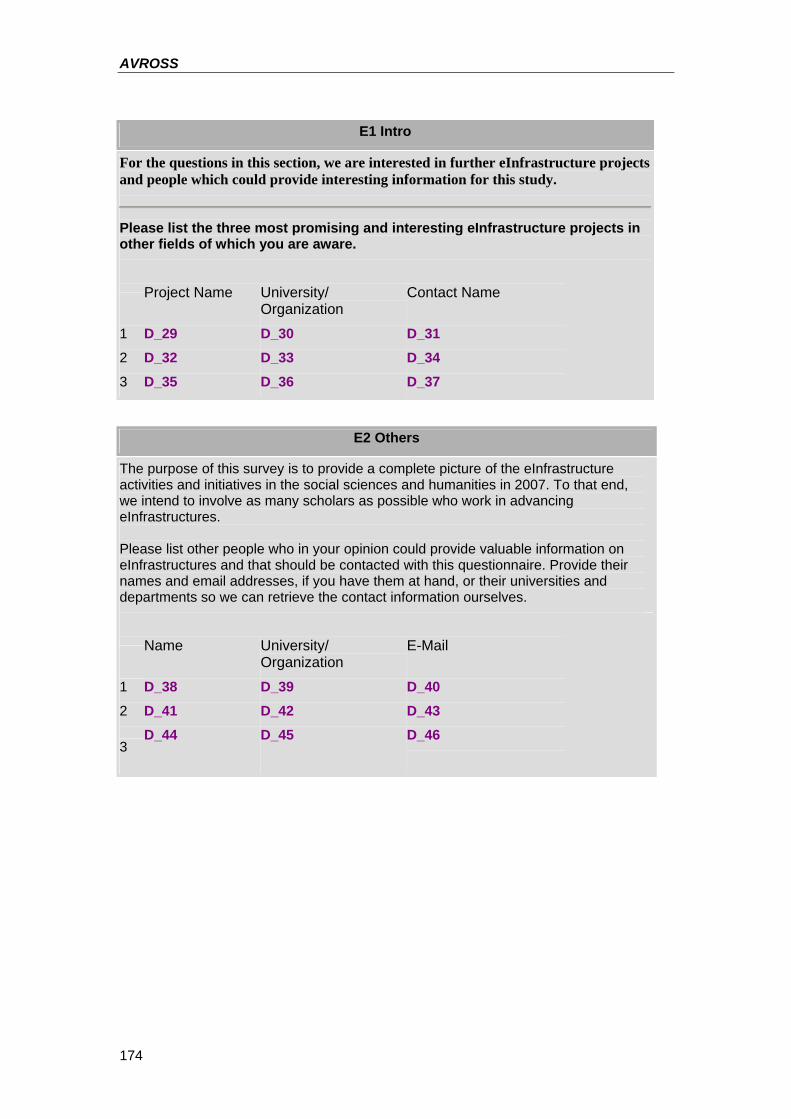
AVROSS
174
E1 Intro
For the questions in this section, we are interested in further eInfrastructure projects and people which could provide interesting information for this study.
Please list the three most promising and interesting eInfrastructure projects in other fields of which you are aware.
Project Name University/ Organization
Contact Name
1 D_29 D_30 D_31
2 D_32 D_33 D_34
3 D_35 D_36 D_37
E2 Others
The purpose of this survey is to provide a complete picture of the eInfrastructure activities and initiatives in the social sciences and humanities in 2007. To that end, we intend to involve as many scholars as possible who work in advancing eInfrastructures. Please list other people who in your opinion could provide valuable information on eInfrastructures and that should be contacted with this questionnaire. Provide their names and email addresses, if you have them at hand, or their universities and departments so we can retrieve the contact information ourselves.
Name University/ Organization
1 D_38 D_39 D_40
2 D_41 D_42 D_43
3 D_44 D_45 D_46
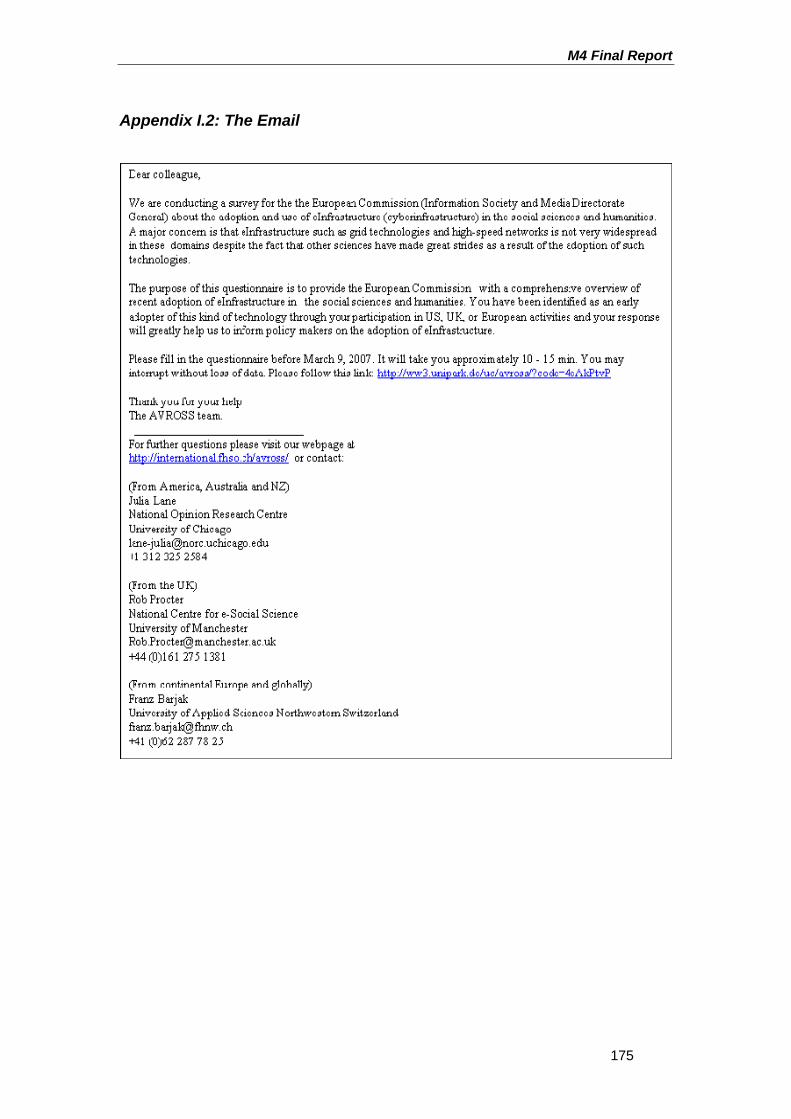
M4 Final Report
175
Appendix I.2: The Email
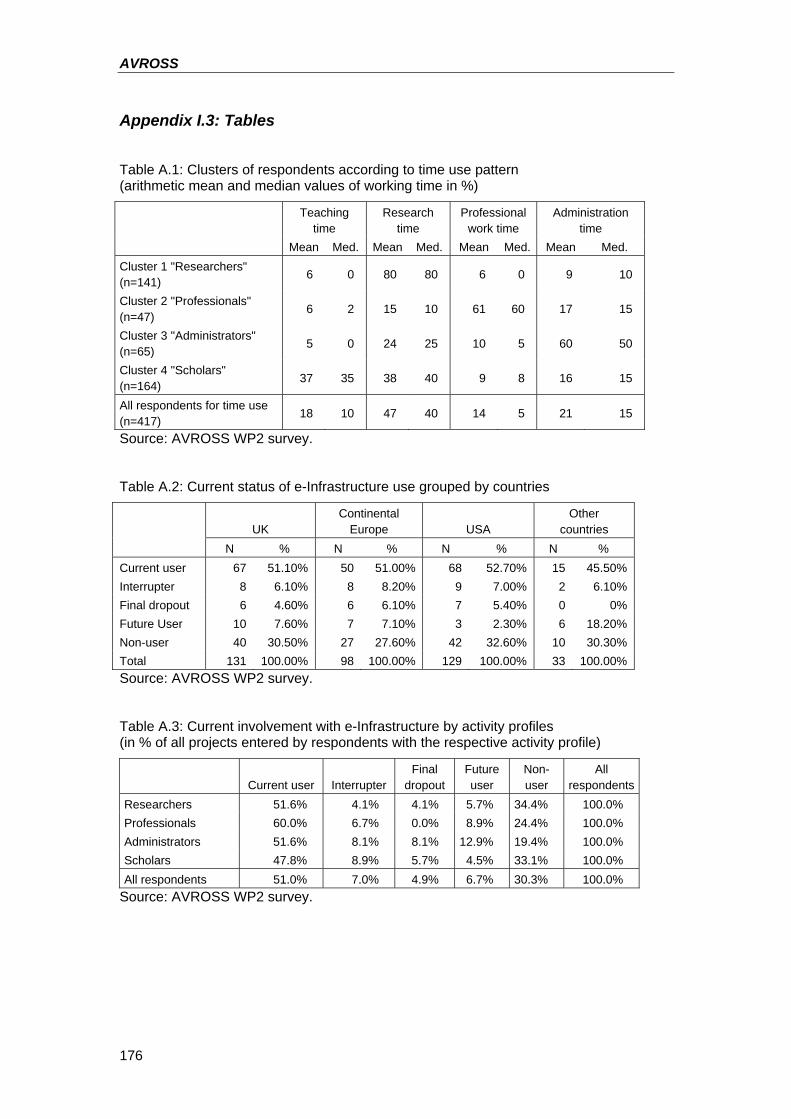
AVROSS
176
Appendix I.3: Tables
Table A.1: Clusters of respondents according to time use pattern (arithmetic mean and median values of working time in %)
Teaching
time Research
time Professional
work time Administration
time Mean Med. Mean Med. Mean Med. Mean Med.
Cluster 1 "Researchers" (n=141) 6 0 80 80 6 0 9 10
Cluster 2 "Professionals" (n=47)
6 2 15 10 61 60 17 15
Cluster 3 "Administrators" (n=65) 5 0 24 25 10 5 60 50
Cluster 4 "Scholars" (n=164)
37 35 38 40 9 8 16 15
All respondents for time use (n=417)
18 10 47 40 14 5 21 15
Source: AVROSS WP2 survey.
Table A.2: Current status of e-Infrastructure use grouped by countries
UK Continental
Europe USA Other
countries
N % N % N % N % Current user 67 51.10% 50 51.00% 68 52.70% 15 45.50% Interrupter 8 6.10% 8 8.20% 9 7.00% 2 6.10% Final dropout 6 4.60% 6 6.10% 7 5.40% 0 0% Future User 10 7.60% 7 7.10% 3 2.30% 6 18.20% Non-user 40 30.50% 27 27.60% 42 32.60% 10 30.30% Total 131 100.00% 98 100.00% 129 100.00% 33 100.00% Source: AVROSS WP2 survey.
Table A.3: Current involvement with e-Infrastructure by activity profiles (in % of all projects entered by respondents with the respective activity profile)
Current user Interrupter Final
dropout Future user
Non-user
All respondents
Researchers 51.6% 4.1% 4.1% 5.7% 34.4% 100.0% Professionals 60.0% 6.7% 0.0% 8.9% 24.4% 100.0% Administrators 51.6% 8.1% 8.1% 12.9% 19.4% 100.0% Scholars 47.8% 8.9% 5.7% 4.5% 33.1% 100.0% All respondents 51.0% 7.0% 4.9% 6.7% 30.3% 100.0%
Source: AVROSS WP2 survey.
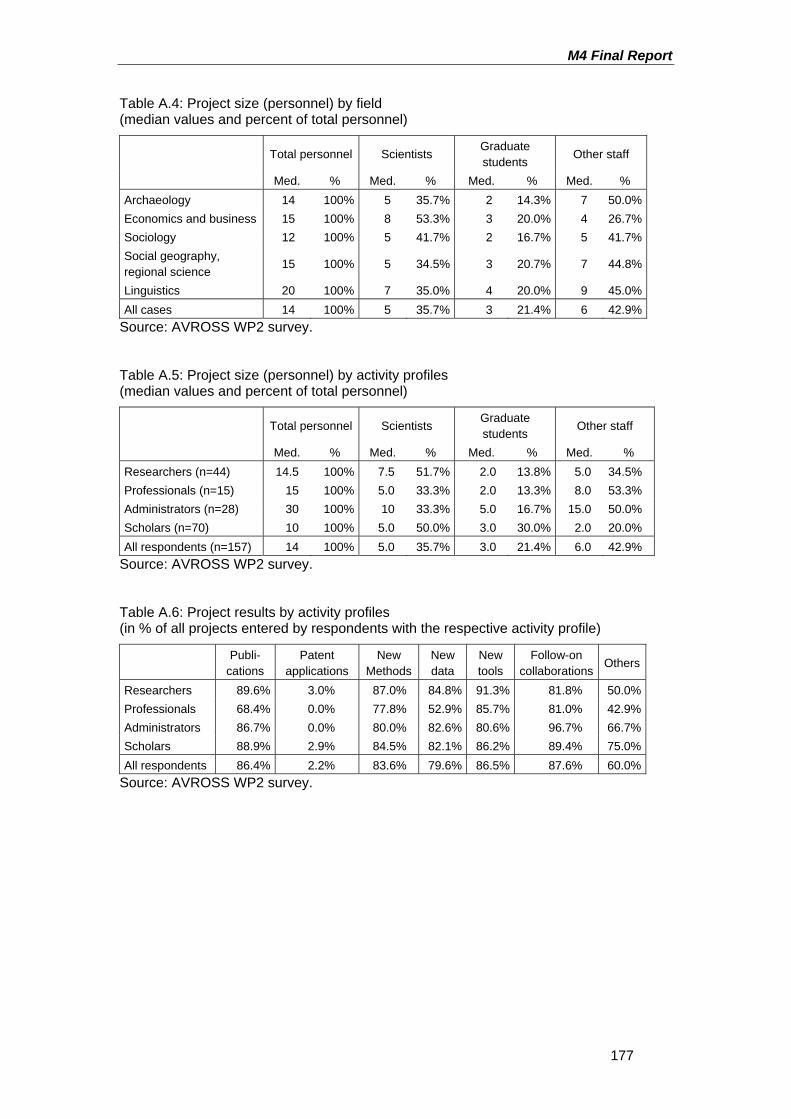
M4 Final Report
177
Table A.4: Project size (personnel) by field (median values and percent of total personnel)
Total personnel Scientists Graduate students
Other staff
Med. % Med. % Med. % Med. % Archaeology 14 100% 5 35.7% 2 14.3% 7 50.0% Economics and business 15 100% 8 53.3% 3 20.0% 4 26.7% Sociology 12 100% 5 41.7% 2 16.7% 5 41.7% Social geography, regional science 15 100% 5 34.5% 3 20.7% 7 44.8%
Linguistics 20 100% 7 35.0% 4 20.0% 9 45.0% All cases 14 100% 5 35.7% 3 21.4% 6 42.9%
Source: AVROSS WP2 survey.
Table A.5: Project size (personnel) by activity profiles (median values and percent of total personnel)
Total personnel Scientists Graduate students
Other staff
Med. % Med. % Med. % Med. % Researchers (n=44) 14.5 100% 7.5 51.7% 2.0 13.8% 5.0 34.5% Professionals (n=15) 15 100% 5.0 33.3% 2.0 13.3% 8.0 53.3% Administrators (n=28) 30 100% 10 33.3% 5.0 16.7% 15.0 50.0% Scholars (n=70) 10 100% 5.0 50.0% 3.0 30.0% 2.0 20.0% All respondents (n=157) 14 100% 5.0 35.7% 3.0 21.4% 6.0 42.9%
Source: AVROSS WP2 survey.
Table A.6: Project results by activity profiles (in % of all projects entered by respondents with the respective activity profile)
Publi-
cations Patent
applications New
Methods New data
New tools
Follow-on collaborations
Others
Researchers 89.6% 3.0% 87.0% 84.8% 91.3% 81.8% 50.0% Professionals 68.4% 0.0% 77.8% 52.9% 85.7% 81.0% 42.9% Administrators 86.7% 0.0% 80.0% 82.6% 80.6% 96.7% 66.7% Scholars 88.9% 2.9% 84.5% 82.1% 86.2% 89.4% 75.0% All respondents 86.4% 2.2% 83.6% 79.6% 86.5% 87.6% 60.0%
Source: AVROSS WP2 survey.
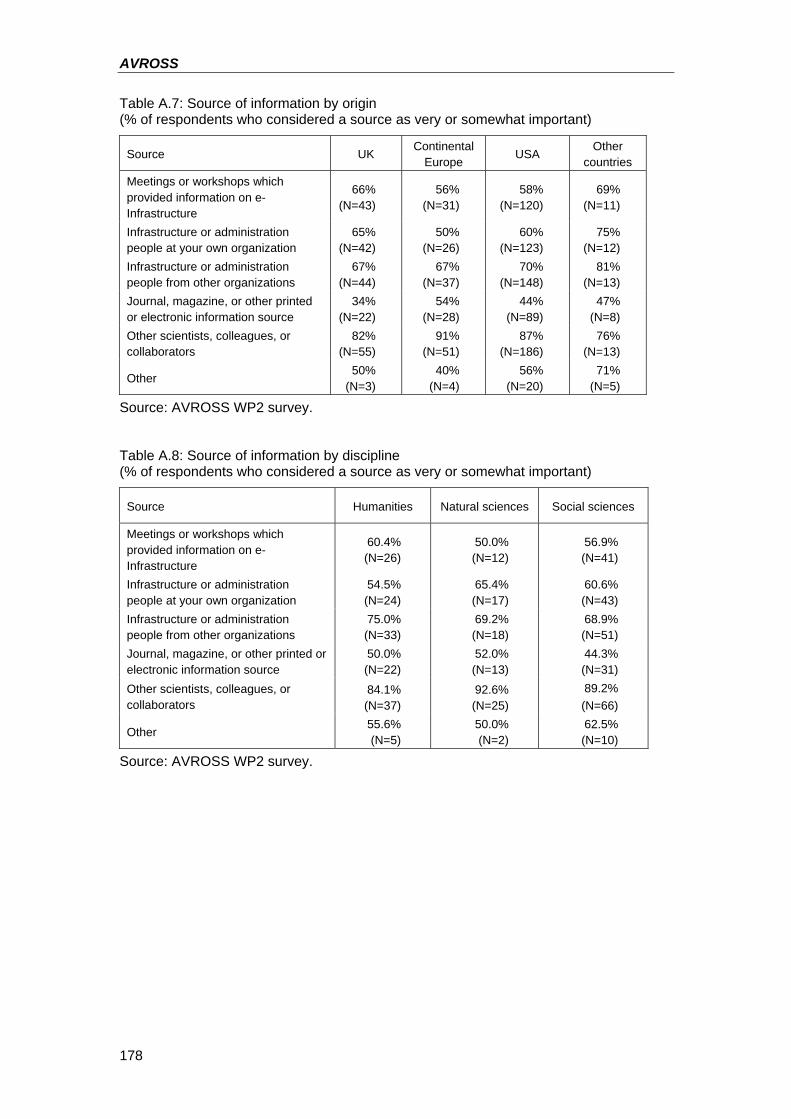
AVROSS
178
Table A.7: Source of information by origin (% of respondents who considered a source as very or somewhat important)
Source UK Continental
Europe USA
Other countries
Meetings or workshops which provided information on e-Infrastructure
66% (N=43)
56% (N=31)
58% (N=120)
69% (N=11)
Infrastructure or administration people at your own organization
65% (N=42)
50% (N=26)
60% (N=123)
75% (N=12)
Infrastructure or administration people from other organizations
67% (N=44)
67% (N=37)
70% (N=148)
81% (N=13)
Journal, magazine, or other printed or electronic information source
34% (N=22)
54% (N=28)
44% (N=89)
47% (N=8)
Other scientists, colleagues, or collaborators
82% (N=55)
91% (N=51)
87% (N=186)
76% (N=13)
Other 50%
(N=3) 40%
(N=4) 56%
(N=20) 71%
(N=5)
Source: AVROSS WP2 survey.
Table A.8: Source of information by discipline (% of respondents who considered a source as very or somewhat important)
Source Humanities Natural sciences Social sciences
Meetings or workshops which provided information on e-Infrastructure
60.4% (N=26)
50.0% (N=12)
56.9% (N=41)
Infrastructure or administration people at your own organization
54.5% (N=24)
65.4% (N=17)
60.6% (N=43)
Infrastructure or administration people from other organizations
75.0% (N=33)
69.2% (N=18)
68.9% (N=51)
Journal, magazine, or other printed or electronic information source
50.0% (N=22)
52.0% (N=13)
44.3% (N=31)
Other scientists, colleagues, or collaborators
84.1% (N=37)
92.6% (N=25)
89.2% (N=66)
Other 55.6% (N=5)
50.0% (N=2)
62.5% (N=10)
Source: AVROSS WP2 survey.
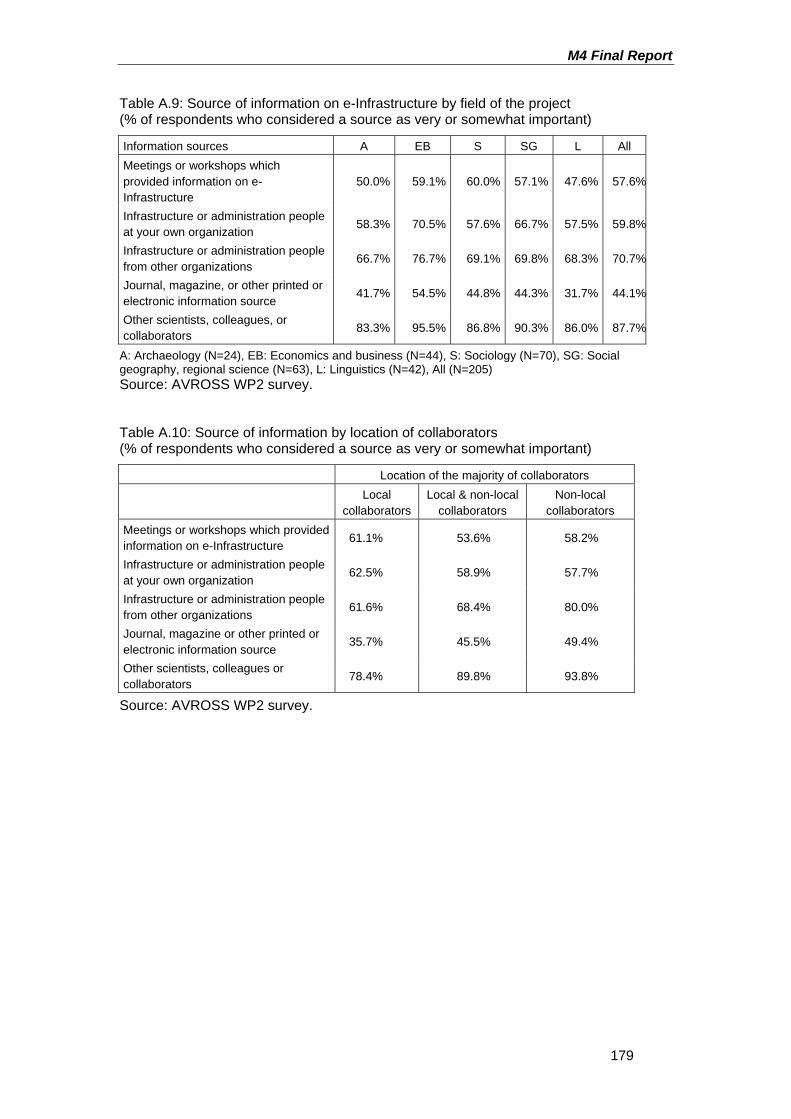
M4 Final Report
179
Table A.9: Source of information on e-Infrastructure by field of the project (% of respondents who considered a source as very or somewhat important)
Information sources A EB S SG L All Meetings or workshops which provided information on e-Infrastructure
50.0% 59.1% 60.0% 57.1% 47.6% 57.6%
Infrastructure or administration people at your own organization 58.3% 70.5% 57.6% 66.7% 57.5% 59.8%
Infrastructure or administration people from other organizations
66.7% 76.7% 69.1% 69.8% 68.3% 70.7%
Journal, magazine, or other printed or electronic information source
41.7% 54.5% 44.8% 44.3% 31.7% 44.1%
Other scientists, colleagues, or collaborators 83.3% 95.5% 86.8% 90.3% 86.0% 87.7%
A: Archaeology (N=24), EB: Economics and business (N=44), S: Sociology (N=70), SG: Social geography, regional science (N=63), L: Linguistics (N=42), All (N=205) Source: AVROSS WP2 survey.
Table A.10: Source of information by location of collaborators (% of respondents who considered a source as very or somewhat important)
Location of the majority of collaborators
Local
collaborators Local & non-local
collaborators Non-local
collaborators Meetings or workshops which provided information on e-Infrastructure 61.1% 53.6% 58.2%
Infrastructure or administration people at your own organization
62.5% 58.9% 57.7%
Infrastructure or administration people from other organizations 61.6% 68.4% 80.0%
Journal, magazine or other printed or electronic information source
35.7% 45.5% 49.4%
Other scientists, colleagues or collaborators
78.4% 89.8% 93.8%
Source: AVROSS WP2 survey.
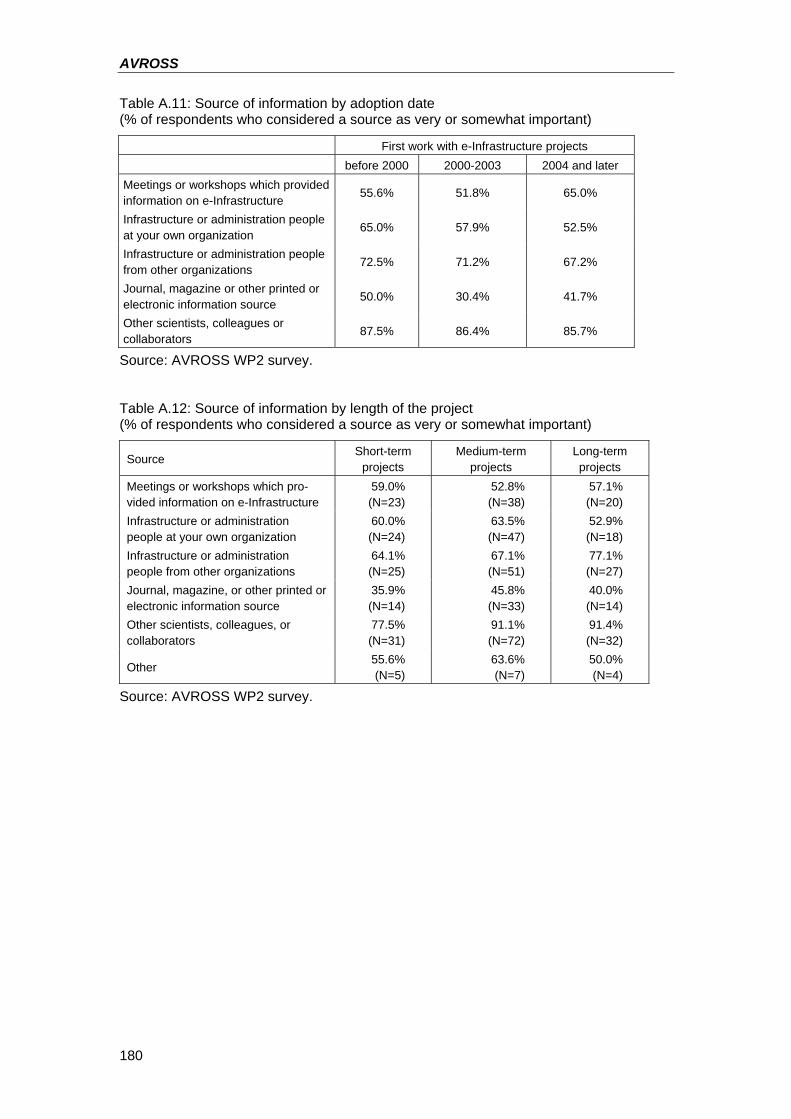
AVROSS
180
Table A.11: Source of information by adoption date (% of respondents who considered a source as very or somewhat important)
First work with e-Infrastructure projects before 2000 2000-2003 2004 and later Meetings or workshops which provided information on e-Infrastructure 55.6% 51.8% 65.0%
Infrastructure or administration people at your own organization
65.0% 57.9% 52.5%
Infrastructure or administration people from other organizations 72.5% 71.2% 67.2%
Journal, magazine or other printed or electronic information source
50.0% 30.4% 41.7%
Other scientists, colleagues or collaborators
87.5% 86.4% 85.7%
Source: AVROSS WP2 survey.
Table A.12: Source of information by length of the project (% of respondents who considered a source as very or somewhat important)
Source Short-term
projects Medium-term
projects Long-term projects
Meetings or workshops which pro-vided information on e-Infrastructure
59.0% (N=23)
52.8% (N=38)
57.1% (N=20)
Infrastructure or administration people at your own organization
60.0% (N=24)
63.5% (N=47)
52.9% (N=18)
Infrastructure or administration people from other organizations
64.1% (N=25)
67.1% (N=51)
77.1% (N=27)
Journal, magazine, or other printed or electronic information source
35.9% (N=14)
45.8% (N=33)
40.0% (N=14)
Other scientists, colleagues, or collaborators
77.5% (N=31)
91.1% (N=72)
91.4% (N=32)
Other 55.6% (N=5)
63.6% (N=7)
50.0% (N=4)
Source: AVROSS WP2 survey.
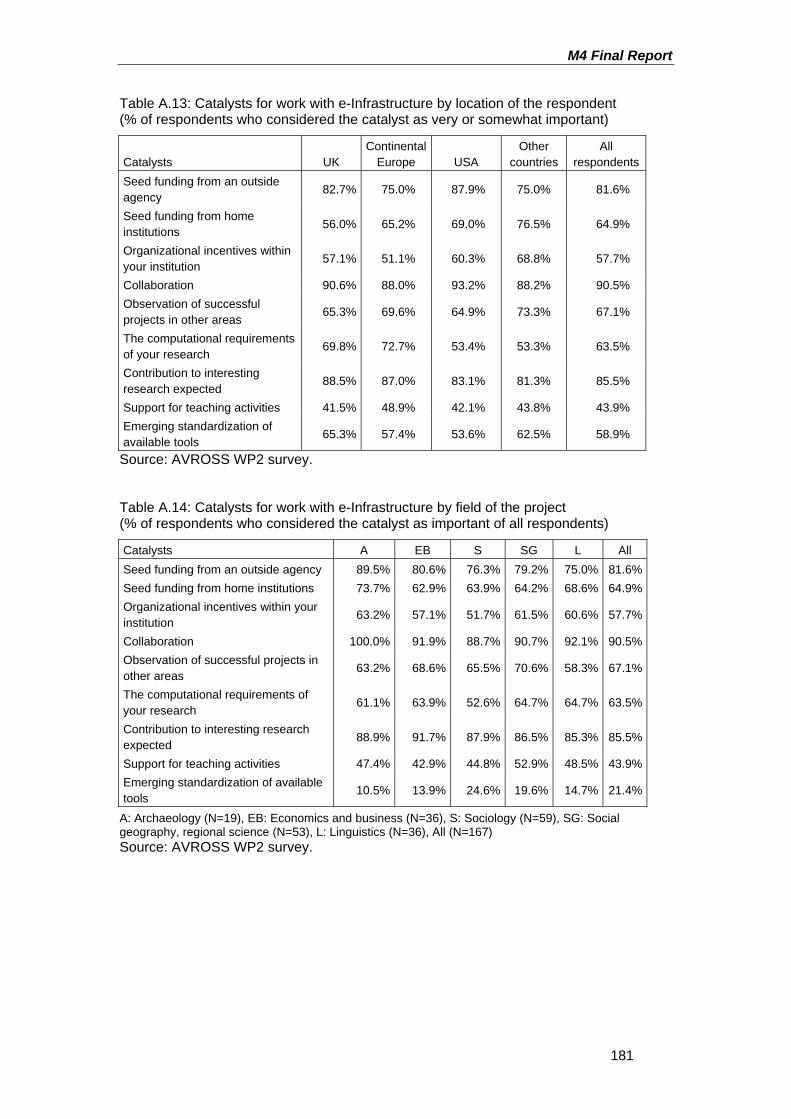
M4 Final Report
181
Table A.13: Catalysts for work with e-Infrastructure by location of the respondent (% of respondents who considered the catalyst as very or somewhat important)
Catalysts UK Continental
Europe USA Other
countries All
respondents Seed funding from an outside agency
82.7% 75.0% 87.9% 75.0% 81.6%
Seed funding from home institutions 56.0% 65.2% 69.0% 76.5% 64.9%
Organizational incentives within your institution
57.1% 51.1% 60.3% 68.8% 57.7%
Collaboration 90.6% 88.0% 93.2% 88.2% 90.5% Observation of successful projects in other areas 65.3% 69.6% 64.9% 73.3% 67.1%
The computational requirements of your research
69.8% 72.7% 53.4% 53.3% 63.5%
Contribution to interesting research expected
88.5% 87.0% 83.1% 81.3% 85.5%
Support for teaching activities 41.5% 48.9% 42.1% 43.8% 43.9% Emerging standardization of available tools
65.3% 57.4% 53.6% 62.5% 58.9%
Source: AVROSS WP2 survey.
Table A.14: Catalysts for work with e-Infrastructure by field of the project (% of respondents who considered the catalyst as important of all respondents)
Catalysts A EB S SG L All Seed funding from an outside agency 89.5% 80.6% 76.3% 79.2% 75.0% 81.6% Seed funding from home institutions 73.7% 62.9% 63.9% 64.2% 68.6% 64.9% Organizational incentives within your institution
63.2% 57.1% 51.7% 61.5% 60.6% 57.7%
Collaboration 100.0% 91.9% 88.7% 90.7% 92.1% 90.5% Observation of successful projects in other areas
63.2% 68.6% 65.5% 70.6% 58.3% 67.1%
The computational requirements of your research
61.1% 63.9% 52.6% 64.7% 64.7% 63.5%
Contribution to interesting research expected 88.9% 91.7% 87.9% 86.5% 85.3% 85.5%
Support for teaching activities 47.4% 42.9% 44.8% 52.9% 48.5% 43.9% Emerging standardization of available tools
10.5% 13.9% 24.6% 19.6% 14.7% 21.4%
A: Archaeology (N=19), EB: Economics and business (N=36), S: Sociology (N=59), SG: Social geography, regional science (N=53), L: Linguistics (N=36), All (N=167) Source: AVROSS WP2 survey.
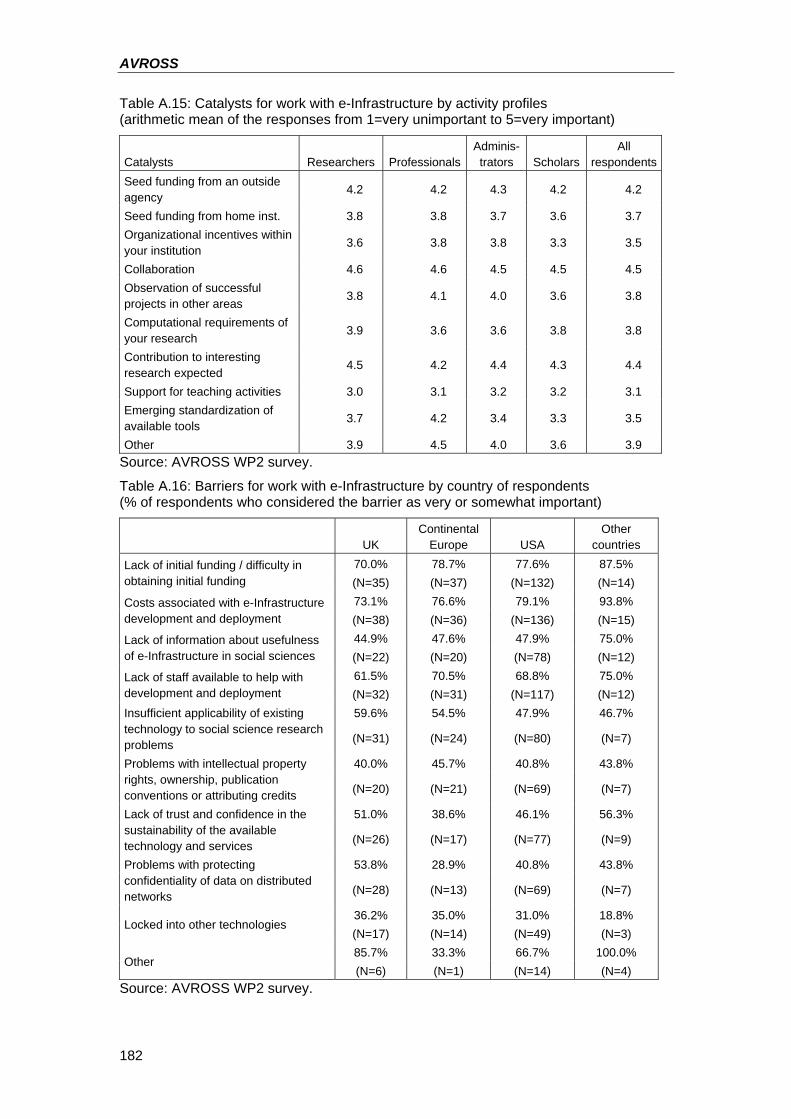
AVROSS
182
Table A.15: Catalysts for work with e-Infrastructure by activity profiles (arithmetic mean of the responses from 1=very unimportant to 5=very important)
Catalysts Researchers ProfessionalsAdminis-trators Scholars
All respondents
Seed funding from an outside agency
4.2 4.2 4.3 4.2 4.2
Seed funding from home inst. 3.8 3.8 3.7 3.6 3.7 Organizational incentives within your institution
3.6 3.8 3.8 3.3 3.5
Collaboration 4.6 4.6 4.5 4.5 4.5 Observation of successful projects in other areas 3.8 4.1 4.0 3.6 3.8
Computational requirements of your research
3.9 3.6 3.6 3.8 3.8
Contribution to interesting research expected
4.5 4.2 4.4 4.3 4.4
Support for teaching activities 3.0 3.1 3.2 3.2 3.1 Emerging standardization of available tools
3.7 4.2 3.4 3.3 3.5
Other 3.9 4.5 4.0 3.6 3.9 Source: AVROSS WP2 survey.
Table A.16: Barriers for work with e-Infrastructure by country of respondents (% of respondents who considered the barrier as very or somewhat important)
UK Continental
Europe USA Other
countries 70.0% 78.7% 77.6% 87.5% Lack of initial funding / difficulty in
obtaining initial funding (N=35) (N=37) (N=132) (N=14) 73.1% 76.6% 79.1% 93.8% Costs associated with e-Infrastructure
development and deployment (N=38) (N=36) (N=136) (N=15) 44.9% 47.6% 47.9% 75.0% Lack of information about usefulness
of e-Infrastructure in social sciences (N=22) (N=20) (N=78) (N=12) 61.5% 70.5% 68.8% 75.0% Lack of staff available to help with
development and deployment (N=32) (N=31) (N=117) (N=12) 59.6% 54.5% 47.9% 46.7% Insufficient applicability of existing
technology to social science research problems (N=31) (N=24) (N=80) (N=7)
40.0% 45.7% 40.8% 43.8% Problems with intellectual property rights, ownership, publication conventions or attributing credits (N=20) (N=21) (N=69) (N=7)
51.0% 38.6% 46.1% 56.3% Lack of trust and confidence in the sustainability of the available technology and services (N=26) (N=17) (N=77) (N=9)
53.8% 28.9% 40.8% 43.8% Problems with protecting confidentiality of data on distributed networks (N=28) (N=13) (N=69) (N=7)
36.2% 35.0% 31.0% 18.8% Locked into other technologies
(N=17) (N=14) (N=49) (N=3) 85.7% 33.3% 66.7% 100.0%
Other (N=6) (N=1) (N=14) (N=4)
Source: AVROSS WP2 survey.
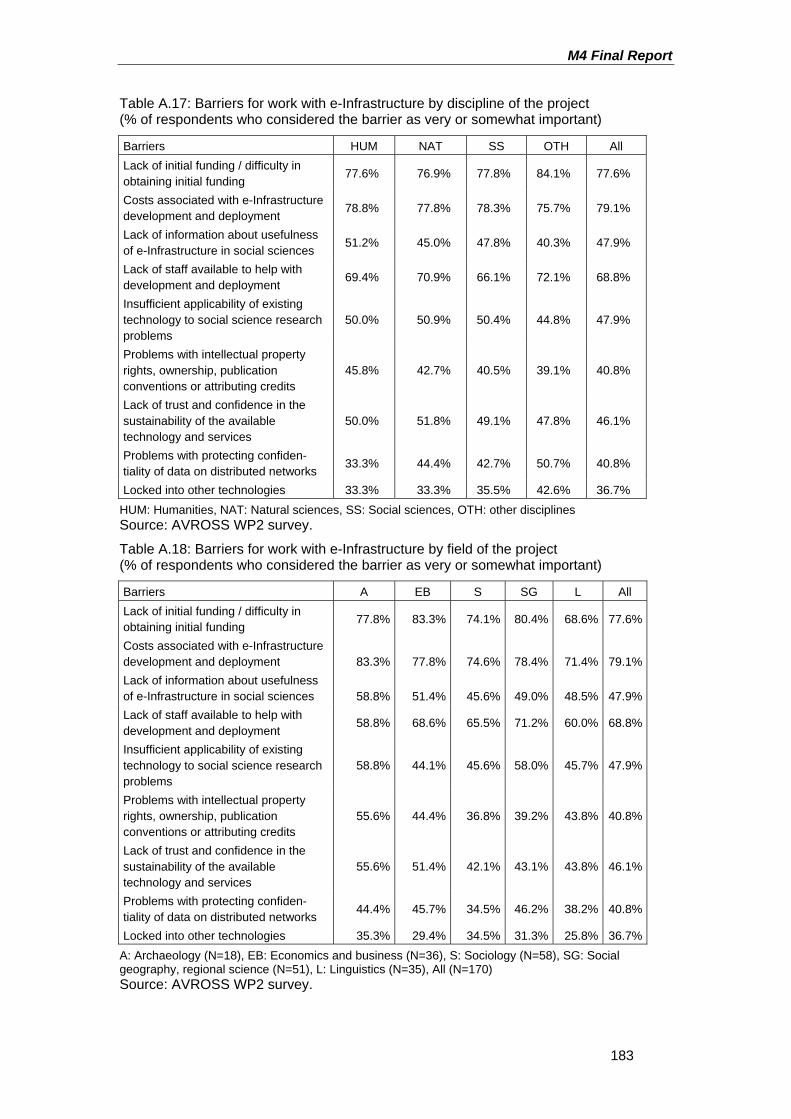
M4 Final Report
183
Table A.17: Barriers for work with e-Infrastructure by discipline of the project (% of respondents who considered the barrier as very or somewhat important)
Barriers HUM NAT SS OTH All Lack of initial funding / difficulty in obtaining initial funding
77.6% 76.9% 77.8% 84.1% 77.6%
Costs associated with e-Infrastructure development and deployment 78.8% 77.8% 78.3% 75.7% 79.1%
Lack of information about usefulness of e-Infrastructure in social sciences
51.2% 45.0% 47.8% 40.3% 47.9%
Lack of staff available to help with development and deployment
69.4% 70.9% 66.1% 72.1% 68.8%
Insufficient applicability of existing technology to social science research problems
50.0% 50.9% 50.4% 44.8% 47.9%
Problems with intellectual property rights, ownership, publication conventions or attributing credits
45.8% 42.7% 40.5% 39.1% 40.8%
Lack of trust and confidence in the sustainability of the available technology and services
50.0% 51.8% 49.1% 47.8% 46.1%
Problems with protecting confiden-tiality of data on distributed networks 33.3% 44.4% 42.7% 50.7% 40.8%
Locked into other technologies 33.3% 33.3% 35.5% 42.6% 36.7% HUM: Humanities, NAT: Natural sciences, SS: Social sciences, OTH: other disciplines Source: AVROSS WP2 survey.
Table A.18: Barriers for work with e-Infrastructure by field of the project (% of respondents who considered the barrier as very or somewhat important)
Barriers A EB S SG L All Lack of initial funding / difficulty in obtaining initial funding 77.8% 83.3% 74.1% 80.4% 68.6% 77.6%
Costs associated with e-Infrastructure development and deployment 83.3% 77.8% 74.6% 78.4% 71.4% 79.1% Lack of information about usefulness of e-Infrastructure in social sciences 58.8% 51.4% 45.6% 49.0% 48.5% 47.9% Lack of staff available to help with development and deployment
58.8% 68.6% 65.5% 71.2% 60.0% 68.8%
Insufficient applicability of existing technology to social science research problems
58.8% 44.1% 45.6% 58.0% 45.7% 47.9%
Problems with intellectual property rights, ownership, publication conventions or attributing credits
55.6% 44.4% 36.8% 39.2% 43.8% 40.8%
Lack of trust and confidence in the sustainability of the available technology and services
55.6% 51.4% 42.1% 43.1% 43.8% 46.1%
Problems with protecting confiden-tiality of data on distributed networks
44.4% 45.7% 34.5% 46.2% 38.2% 40.8%
Locked into other technologies 35.3% 29.4% 34.5% 31.3% 25.8% 36.7% A: Archaeology (N=18), EB: Economics and business (N=36), S: Sociology (N=58), SG: Social geography, regional science (N=51), L: Linguistics (N=35), All (N=170) Source: AVROSS WP2 survey.
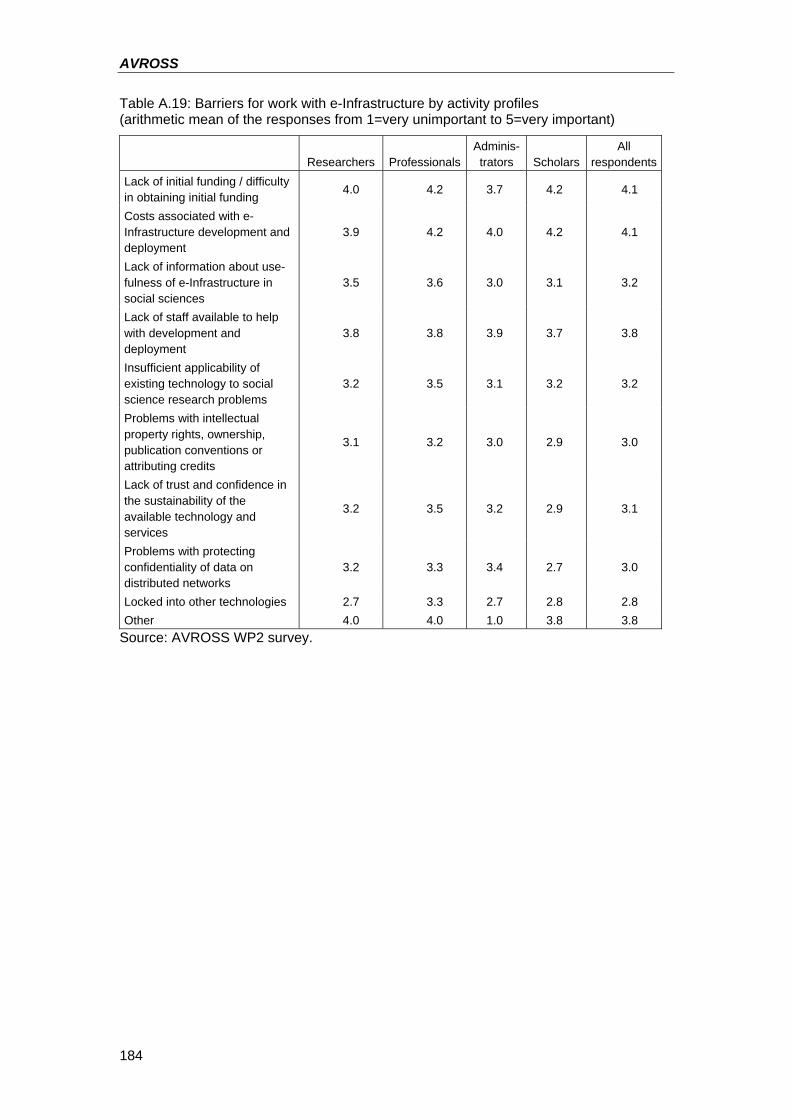
AVROSS
184
Table A.19: Barriers for work with e-Infrastructure by activity profiles (arithmetic mean of the responses from 1=very unimportant to 5=very important)
Researchers ProfessionalsAdminis-trators Scholars
All respondents
Lack of initial funding / difficulty in obtaining initial funding
4.0 4.2 3.7 4.2 4.1
Costs associated with e-Infrastructure development and deployment
3.9 4.2 4.0 4.2 4.1
Lack of information about use-fulness of e-Infrastructure in social sciences
3.5 3.6 3.0 3.1 3.2
Lack of staff available to help with development and deployment
3.8 3.8 3.9 3.7 3.8
Insufficient applicability of existing technology to social science research problems
3.2 3.5 3.1 3.2 3.2
Problems with intellectual property rights, ownership, publication conventions or attributing credits
3.1 3.2 3.0 2.9 3.0
Lack of trust and confidence in the sustainability of the available technology and services
3.2 3.5 3.2 2.9 3.1
Problems with protecting confidentiality of data on distributed networks
3.2 3.3 3.4 2.7 3.0
Locked into other technologies 2.7 3.3 2.7 2.8 2.8 Other 4.0 4.0 1.0 3.8 3.8
Source: AVROSS WP2 survey.
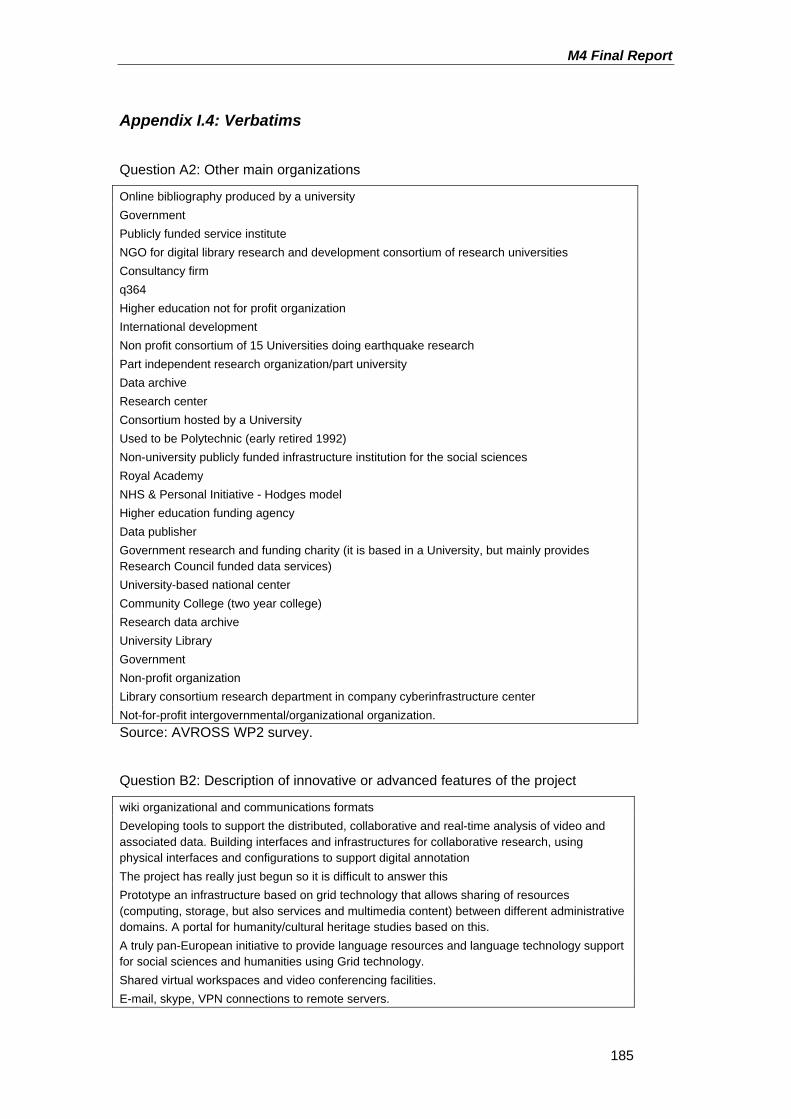
M4 Final Report
185
Appendix I.4: Verbatims
Question A2: Other main organizations
Online bibliography produced by a university Government Publicly funded service institute NGO for digital library research and development consortium of research universities Consultancy firm q364 Higher education not for profit organization International development Non profit consortium of 15 Universities doing earthquake research Part independent research organization/part university Data archive Research center Consortium hosted by a University Used to be Polytechnic (early retired 1992) Non-university publicly funded infrastructure institution for the social sciences Royal Academy NHS & Personal Initiative - Hodges model Higher education funding agency Data publisher Government research and funding charity (it is based in a University, but mainly provides Research Council funded data services) University-based national center Community College (two year college) Research data archive University Library Government Non-profit organization Library consortium research department in company cyberinfrastructure center Not-for-profit intergovernmental/organizational organization. Source: AVROSS WP2 survey.
Question B2: Description of innovative or advanced features of the project
wiki organizational and communications formats Developing tools to support the distributed, collaborative and real-time analysis of video and associated data. Building interfaces and infrastructures for collaborative research, using physical interfaces and configurations to support digital annotation The project has really just begun so it is difficult to answer this Prototype an infrastructure based on grid technology that allows sharing of resources (computing, storage, but also services and multimedia content) between different administrative domains. A portal for humanity/cultural heritage studies based on this. A truly pan-European initiative to provide language resources and language technology support for social sciences and humanities using Grid technology. Shared virtual workspaces and video conferencing facilities. E-mail, skype, VPN connections to remote servers.
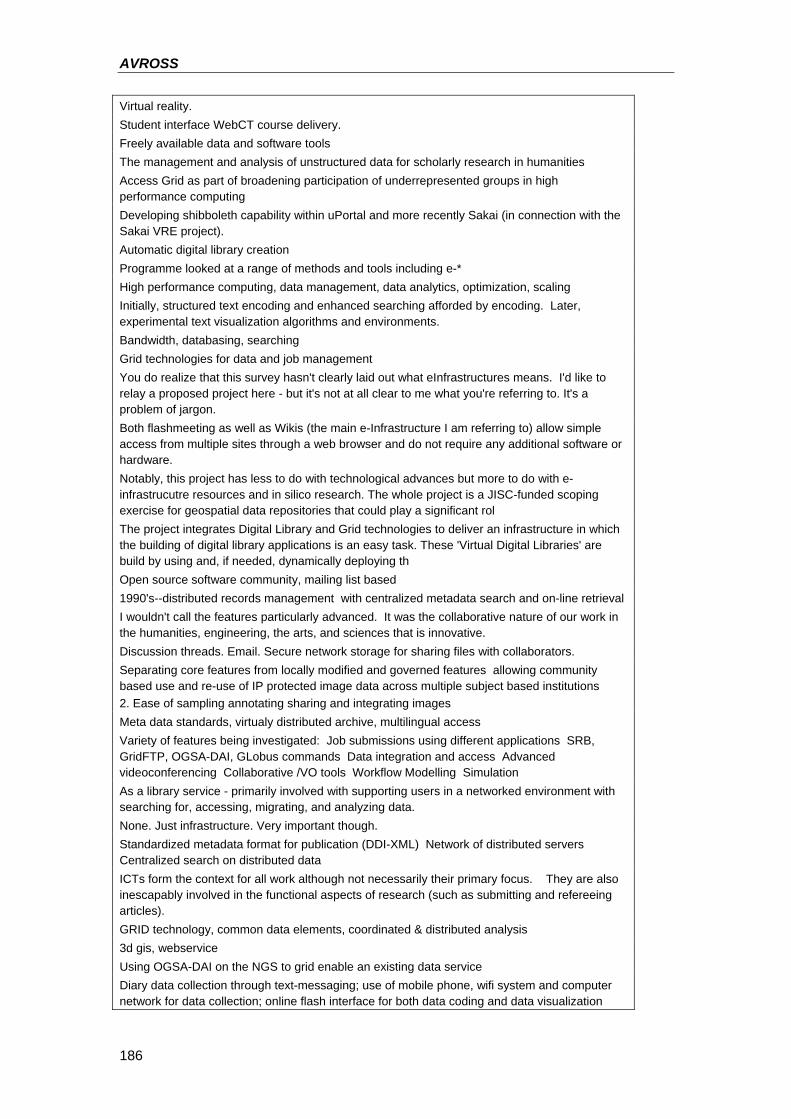
AVROSS
186
Virtual reality. Student interface WebCT course delivery. Freely available data and software tools The management and analysis of unstructured data for scholarly research in humanities Access Grid as part of broadening participation of underrepresented groups in high performance computing Developing shibboleth capability within uPortal and more recently Sakai (in connection with the Sakai VRE project). Automatic digital library creation Programme looked at a range of methods and tools including e-* High performance computing, data management, data analytics, optimization, scaling Initially, structured text encoding and enhanced searching afforded by encoding. Later, experimental text visualization algorithms and environments. Bandwidth, databasing, searching Grid technologies for data and job management You do realize that this survey hasn't clearly laid out what eInfrastructures means. I'd like to relay a proposed project here - but it's not at all clear to me what you're referring to. It's a problem of jargon. Both flashmeeting as well as Wikis (the main e-Infrastructure I am referring to) allow simple access from multiple sites through a web browser and do not require any additional software or hardware. Notably, this project has less to do with technological advances but more to do with e-infrastrucutre resources and in silico research. The whole project is a JISC-funded scoping exercise for geospatial data repositories that could play a significant rol The project integrates Digital Library and Grid technologies to deliver an infrastructure in which the building of digital library applications is an easy task. These 'Virtual Digital Libraries' are build by using and, if needed, dynamically deploying th Open source software community, mailing list based 1990's--distributed records management with centralized metadata search and on-line retrieval I wouldn't call the features particularly advanced. It was the collaborative nature of our work in the humanities, engineering, the arts, and sciences that is innovative. Discussion threads. Email. Secure network storage for sharing files with collaborators. Separating core features from locally modified and governed features allowing community based use and re-use of IP protected image data across multiple subject based institutions 2. Ease of sampling annotating sharing and integrating images Meta data standards, virtualy distributed archive, multilingual access Variety of features being investigated: Job submissions using different applications SRB, GridFTP, OGSA-DAI, GLobus commands Data integration and access Advanced videoconferencing Collaborative /VO tools Workflow Modelling Simulation As a library service - primarily involved with supporting users in a networked environment with searching for, accessing, migrating, and analyzing data. None. Just infrastructure. Very important though. Standardized metadata format for publication (DDI-XML) Network of distributed servers Centralized search on distributed data ICTs form the context for all work although not necessarily their primary focus. They are also inescapably involved in the functional aspects of research (such as submitting and refereeing articles). GRID technology, common data elements, coordinated & distributed analysis 3d gis, webservice Using OGSA-DAI on the NGS to grid enable an existing data service Diary data collection through text-messaging; use of mobile phone, wifi system and computer network for data collection; online flash interface for both data coding and data visualization
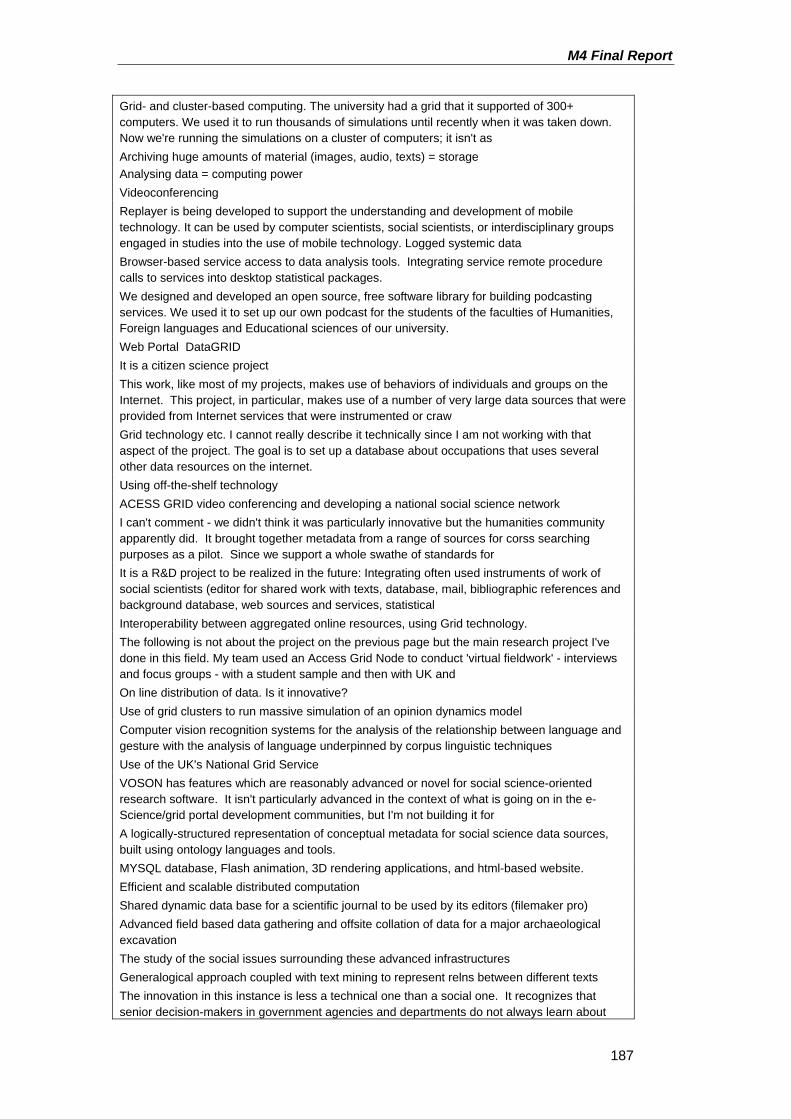
M4 Final Report
187
Grid- and cluster-based computing. The university had a grid that it supported of 300+ computers. We used it to run thousands of simulations until recently when it was taken down. Now we're running the simulations on a cluster of computers; it isn't as Archiving huge amounts of material (images, audio, texts) = storage Analysing data = computing power Videoconferencing Replayer is being developed to support the understanding and development of mobile technology. It can be used by computer scientists, social scientists, or interdisciplinary groups engaged in studies into the use of mobile technology. Logged systemic data Browser-based service access to data analysis tools. Integrating service remote procedure calls to services into desktop statistical packages. We designed and developed an open source, free software library for building podcasting services. We used it to set up our own podcast for the students of the faculties of Humanities, Foreign languages and Educational sciences of our university. Web Portal DataGRID It is a citizen science project This work, like most of my projects, makes use of behaviors of individuals and groups on the Internet. This project, in particular, makes use of a number of very large data sources that were provided from Internet services that were instrumented or craw Grid technology etc. I cannot really describe it technically since I am not working with that aspect of the project. The goal is to set up a database about occupations that uses several other data resources on the internet. Using off-the-shelf technology ACESS GRID video conferencing and developing a national social science network I can't comment - we didn't think it was particularly innovative but the humanities community apparently did. It brought together metadata from a range of sources for corss searching purposes as a pilot. Since we support a whole swathe of standards for It is a R&D project to be realized in the future: Integrating often used instruments of work of social scientists (editor for shared work with texts, database, mail, bibliographic references and background database, web sources and services, statistical Interoperability between aggregated online resources, using Grid technology. The following is not about the project on the previous page but the main research project I've done in this field. My team used an Access Grid Node to conduct 'virtual fieldwork' - interviews and focus groups - with a student sample and then with UK and On line distribution of data. Is it innovative? Use of grid clusters to run massive simulation of an opinion dynamics model Computer vision recognition systems for the analysis of the relationship between language and gesture with the analysis of language underpinned by corpus linguistic techniques Use of the UK's National Grid Service VOSON has features which are reasonably advanced or novel for social science-oriented research software. It isn't particularly advanced in the context of what is going on in the e-Science/grid portal development communities, but I'm not building it for A logically-structured representation of conceptual metadata for social science data sources, built using ontology languages and tools. MYSQL database, Flash animation, 3D rendering applications, and html-based website. Efficient and scalable distributed computation Shared dynamic data base for a scientific journal to be used by its editors (filemaker pro) Advanced field based data gathering and offsite collation of data for a major archaeological excavation The study of the social issues surrounding these advanced infrastructures Generalogical approach coupled with text mining to represent relns between different texts The innovation in this instance is less a technical one than a social one. It recognizes that senior decision-makers in government agencies and departments do not always learn about
AVROSS
188
emerging evidence by reading text. This project is testing learning ou The Innovative Teacher project (I*Teach) develops such practical methodology, approaches and tools targeted at day-to-day utilization by the teacher trainers and teachers of these enhanced ICT skills in their work. The deliverables comprise a suite of open source, open standards based, interoperable, RDF Web services with a graphical user interface including an embedded annotation tool that exploits fuzzy logic techniques to indicate associations between previously User requirements gathering and piloting of demonstrators specifically for humanities (simply being an einfrastructure project in the humanities is innovative) A method for automatic _conceptual_ analysis, retrieval, and browsing of natural language data. GRID and interactive visualization. The projects we are involved in use the grid for video seminars, meetings etc, enabling York to talk with Penn State University, Southampton, Manchester etc We have a funded proposal that involves using the NZ GRID as a means of providing a data service for social scientists (exchanging and analysing information in particular) Virtual reality on the web Developing a professional reading interface for large databases of information required us to investigate web interface technologies, as well as techniques of professional reading. The test database was a PostGreSQL installation, with a wide variety of Exchange of large data bases JSR-168 compliant portlets Storage Resource Broker Apache Tomcat Grid technologies for the qualitative analysis of digital video across the network for social science researchers wikis videoconferencing Docushare (collaborative document editing) nVivo (qualitative data analysis) The infrastructure is primarily used for secure data exchange. Global grid connecting Edinburgh, Perth and Beijing, applied to the analysis of business data for customer relationship management Integration of a data indexing service for specialist data resources, with a facility to allow access to those data resources and the merging of them with other data files, by non specialists. Gray literature search engine, automated image analysis. The project is to develop middleware to facilitate field research in conditions which lack the usual assumptions of pervasive or HP computing. That is, to enable field researchers to be able to tap into the cyberinfrastructure capacity asynchronously fro Early adoption of XTF (http://xtf.sourceforge.net/), an open source digital library platform, based on Saxon and Lucene. Early adoption of advanced JavaScript/CSS rich internet application features. Experimental use of topic maps and other semantic web Access Grid and related distributed services WIKI None are terrible innovative, but we are making use of cvs/sourceforge as the depository of code and results; we are using a local shared memory machine for computing purposes, which could benefit from grid type approaches Used email to communicate and advanced editing features to develop survey instruments. Web services, interface tracking systems using ultrasound, Anoto, various video streaming technologies Support for real-time, collaborative and remote video analysis. The project I was involved in in 2002, SAMD, was a pilot project the grid enabled a web based social science database. It was one of the first projects to do so. The project website is at:http://www.sve.man.ac.uk/Research/AtoZ/SAMD Database, computing and web communication Wiki, web pages, internet, web server, portal, Java, access grid, email Use of Semantic Web, Grid & Web 2.0 technologies to faciliate mixed-method techniques for
M4 Final Report
189
policy appraisal. GRID enabled individual based, dynamic demographic mirco-simulation for the whole UK which integrate datasets from different sources. The eMasters programmes are wholy online and are delivered using a virtual learning environment. A key feature of the pedagogy is the use of asynchronous tutor-led discussion groups to support an international community of public service practitioners. Collaborative databases for the whole project, data sharing, Collaboratory Semantic aspects using ontologies / thesauri differentiation between disciplines Collaboration and development of Grid for spatial analysis Semantic grid Semantic annotation for live and retrospective video analysis Event history analysis Mulitmedia data collection A fundamental aspect of our project was the ability to engage with the nonscientific community in the use ofe-Science. We took this principle to extremes by involving one of the most marginalised groups imaginable: the Makushi Amerindian tribe situated i Moodle vle compendium mapping participatory gis Argos is a flexible data query and analysis system based on the web services paradigm. As an application domain we will examine several goods movement planning problems and their effects on spatial urban structure. Many scientific problems can be mode We are using geostatistical tools and advanzed visualization techniques for investigating archaeological data. Because archaeological data come from our own fieldwork in Patagonia (South America), we need advanced systems for data exchange and analysis Collaborations across 3 continents VoIP, web-surveying, web-based research and analysis, web-based simulation Semantic Grid techniques Nothing new, we use e-mail and internal documentation This will be an empirical data archive for SSH in Lithuania with possibilities to analize data online The g-Eclipse project builds an integrated workbench for e-Infrastructure end users, e-Infrastructure resource providers and e-Infrastructure application developers based on the industry compliant eco system of the Eclipse foundation. The g-Eclipse frame In creating the Network Workbench Cyberinfrastructure, we drew upon our previous cyberinfrastructure work in the InfoVis Cyberinfrastructure (http://iv.slis.indiana.edu). We have developed some middleware for us to rapidly create CIs that is different fr Integrating data and metadata across servers, with multi-lingual discovery tools. Building an eScience network of researchers working with interlinked picture details. This comprises an editor, e repository, a wsdl interface and a publication environment for web based publication- Coupling of scientific modeling with decision support capabilities looking at human costs, economic impacts, etc. of disasters (i.e. earthquakes), collaborative data and model scenario sharing, integrated provenance linking scenario with research literature A low cost, computational cluster, that can be transported as checked baggage with no extra charges, and sets up quickly 3d telepresence The software system supports the SRB federated storage system developed by the San Diego Supercomputer Center. It can also use the Video Pipeline compression and transcoding system developed by the Condor Project parallel computing project. See http://www.ncess.ac.uk/research/nodes/DigitalRecord/ GIS mapping data mining placename extraction The resource has developed over ten years, using a range of evolving technologies and standards, including DC metadata, on-line map-based interfaces, Z39.50 & OAI interoperability, facetted classification, web services, portal technologies, data mining,
AVROSS
190
Automatic acquiring and indexing of academic documents base on automated metadata extraction and indexing of metadata such as citation, author, title, acknowledgement and affiliations. Cocitation and active bibliography groupings are also listed. Repositories technology for Social Science datasets produced as part of academic research. This technology will help dealing with storage, preservation and access issues. Cross-university nationally exchange of materials and data, to support collaborative research. International incentives for the same. We are using Sakai Virtual Research Environment as a collaboration space for research teams, but we also foster several teams that use the platform for other collaborative activities and, then research them. This is not a good survey. You have not defined eInfrastructure and so I can't answer these questions correctly. Use of integrated tabular and geopspatial data infrastructures Meta-scheduling, interoperability, system integration, data and information management, data federation and replication Real-time interaction at multiple sites Many cameras, video projections, internet We 'scraped' content from search results in legal databases, then mined each of those texts for external references (e.g., citations to other texts), which was used both to identify other relevant texts, and ultimately, to 'map' the network of links. To Publication and citation of scientific data using persistent identifiers. Integration of literature and data. Architecture for continuous digital workflows in the geological sciences. Geospatial presentation of cultural, social, linguistic, musicological information; effective archival of complex objects; linkage with Shibboleth is in design. Collaboration spaces. Shared web-based information (not data) repository Grid-based communication Web email We've custom-built the Collex tool (http://www.patacriticism.org/collex) to support federated archives, faceted browsing, search, collection, tagging, annotation, syndication, etc. in NINES. Cooperative editing of medieval charters based on multilingual markp up tools. A world congress about cibersociety multilinguial and ONLINE Easy provides access to a large number of datasets in the humanities and the social sciences*. You can download most datasets directly, along with the accompanying documentation. For some datasets, however, you need special permission. As a researcher o A computer based simulaton of a working economy in which students can buiild, populate and operate working online digital ebusinesses. Standardised WS-based export/import facility from local databases (such as Filemaker) to repositoryt software (DSpace/Fedora) and import/export between repsoitories. Linguistic data-based representation models using onm-thr-fly vector diagrams to navi Online virtual lab for languag acquisition research Network of computers in Census/NSF RDC system We are working to do query dependent, on-the-fly data integration and to incorporate use of incomplete and inconsistent ontologies in an interactive, concept oriented interface. The development of metadata tools to generate and analyze the metadata describing variaous stages of the research life cycle. In particular, we are working to generate metadata that would replicate the analytic or working datasets used to produce the re Develop database of images and 3D models of archaeological artifacts for search and retrieval Past project - VICODI. - Ontology Grid technologies, web services, semantic technologies, building a virtual research environment Collaborative authoring and semantics based operations Secure confidential remote access to patient records Seamless synchronous/asynchronous collaborative editing of drawing, text, database, etc. We were using current communication technology (MSN IM and conference phone calls) in new situations - introducing secondary level 11-16 year old science students to new situations of
M4 Final Report
191
learning through communicating with science experts and remote scienti Datagrid and Service Oriented Architecture for Textprocessing and linguistic analysis. Based on Globus Toolkit 4, Web Services, LDAP, PKI and Shibboleth . Collaboratory and expert referral system Multi country analysis, communication, data gathering, using web, webbrowsers, spiders, neural networks, grid computing Web portal (w/wiki, blog, and etc.) plus multipoint videoconferencing In process: Mindquarry, Wiki, Digital Book (co-authored), Weblog, Digital Memory Bank etc. This project, in particular, was a meta-level project examining how the social sciences and history, especially the STS field, can inform and be informed by the growing cyberinfrastructure agenda. The discussion heavily involved innovation and advanced i Web services for providing synthetic social science data Cross-searchable metadata from four existing web services, each with multiple online databases eventually, vision of integrated data access and tools across services The workshop organizers set up a blog for participants that was active throughout the meeting. ERIC is an internet-based digital library of education research and information sponsored by the Institute of Education Sciences (IES) of the U.S. Department of Education. It provides access to bibliographic records (citations, abstracts, and other perti Access Grid for video and teleconferences. OGSA and Globus infrastructure modules. Deep storage Metadata. The project is available at www.earthsystemgrid.org. It provides all operations related to climate science data. The data itself is produced b Ontologically-based data integration web portal for access to tools and workflows The purpose of the project is to build a cyberinfrastructure for the humanities, arts, and social sciences that facilitates advanced research in these disciplines. Laser scanning; 3D modeling of any entire ancient city We began production of the Dynamic Backend Generator tool in the summer 2005 and have since successfully tested and refined it on over twelve of Vectors database-driven web sites. The DBG is a dynamically-generated middleware interface to a database Communication in a virtual classroom/lecture room audio. video Grid-based middleware, gLite, WSRF Multiple attempts to make Virtual Organisation technologies work for us Solving different problems by consulting different personalities of the worlds. Sending application without any cost. Involving in many discussion forums and participating in development of programme and policies. Involving in virtual learning environment. Asset Action Packages Asset action packages are well labeled, actionable URLs that enable digital objects from various sources to be presented in a consistent manner to the content consumer. Asset action packages allow a functional view of a unit of c The DILIGENT project is creating an advanced test-bed that will allow virtual e-Science communities to share knowledge and collaborate in a secure, coordinated, dynamic and cost-effective way. The DILIGENT test-bed will be built by integrating Grid a Storage Resource Broker, Grid Computing, 3D digital artifacts, Datamining Using GRID based infrastructures in clinical routine (not just research) Integrating different aspects of work via a communal classification system of occupations, past and present, world wide; a coding module I'm not sure of what you mean here. We are creating Distance Learning Courses, an internet tool for storing and analyzing language data, digital videos, etc. One-of-a-kind middleware system for deploying simulation service across the internet Web services as text analysis tools. Users of the portal define texts that are then processed by remote web services brokered by the portal through a common interface. It also has some social network features to allow sharing of documents, news, and tool Development of user-targeted Grid technologies at Scale. Distributed development and user services team. Planning stage for RECON. Need to organize an application for sharing verbatim data, and
AVROSS
192
other types of unstructured data types among researchers in the network (audio, video, pictures, etc) Innovations in information storage, middleware, high performance computing and applications. Particularly, innovative database technology has been introduced for use in medical, biological, environment, maintenance, remote learning to name a few. There is a web portal for participating countries to upload all of their data etc collected during each round of the ESS All major areas of distributed computing Collaborative database building We seem to be one of the few organizations doing 3D work Source: AVROSS WP2 survey.
Question B5: Sources of information and know-how important in the decision to begin using e-Infrastructure
Gut feeling Immediate practical benefits My research centre is, in part, developed to undertake this type of research feedback from users / also ideas from other contexts and sectors Own research and developments for data service e-Science Core Programme OSI Report on e-Infrastructure, eIRG White Paper Other online information environments Own efforts in metadata and data management Available graduate student for assistance International network WWW - I couldn't have built or conceived of my project without Google as a source of information. The open-source development community and movement was also integral to the vision project Student work and research Industrial applications for data collection application of science to practical social science research Research Funding I was a computer scientists for HPC manufacturers for 30 years Our project is on e-Infrastructure Personal knowledge Prior experience in natural resource sciences Personal interest in e-Infrastructure Mailing lists My own responsibilities (self-created) are to provide e-Infrastructure Use was required by the project leaders Our organization, acts & events is entirely online The use of e-Infrastructure is required for the goals of the project Opportunity to bid for a major grant Ideas We develop and do research on cyber infrastructure. The Center I lead is called cyber center My organization was instantiated as an e-Infrastructure. Source: AVROSS WP2 survey.
M4 Final Report
193
Question C1: Other funding sources of the e-Infrastructure project(s)
Project's partners Private donors JISC funding (UK HE IT) No funding for project All voluntary, just the most central virtual place for developing statistical data analysis software It is predominantly funded by our own institutions JISC Higher Education Funding Council for England & Wales Microsoft Tertiary Education Commission BRCSS Network Project subscribers/publisher WUN, Internal Affairs Ministry, Annenberg School at USC Industry International partners SuperComputing (a la SC07-09) JISC Private companies It is being reviewed for funding federal line agency SBC (telecom company) Numerous countries -national funding bodies Funding ended in 2005 NSF US Department of Energy Participant institutions Corporations Foreign institutions of our partners Industry The governments of 26 countries Source: AVROSS WP2 survey.
AVROSS
194
Question C5: Other main outcomes of the project
New summer program Teaching historical demography methods Growing scientific communities Raising of consciousness about the importance of the digital humanities A European Data Portal New collaborations & engagements with early adopters New disciplines of e-Infrastructure, and service providers New data access methods Innovations in teaching Presentations Public domain software we hope - the project hasn't started yet Outputs to be produced This project hasn’t yet started The Australian Qualitative Data Archive (AQuA) pilot Contributed to the establishment of a e-social science centre at Manchester Postgraduate programmes New research questions Official Eclipse project (www.eclipse.org/geclipse) Part of platform for developments described in ESFRI roadmap reuse of architecture and components Change in how computational science is taught (learning curve meant data had to be reproduced multiple times) Publications currently pending Follow on projects Build research networks across Europe & America We are just getting started The exploration of international collaboration was an important starting point Contribution to standard development led to new, follow-on research proposal being accepted Hopefully new social policy Improved search function and full-text access Shared repository New discoveries New schema capacity building Establishing a community or e-social scientists Infrastructure Old data now digitised. Source: AVROSS WP2 survey.
M4 Final Report
195
Question C6b: Other type of data produced
Geospatial Implementations and software GIS data Community based VREs, VLEs hyperlink network data Audio, Biological data Talks and presentations to the social science community Sensory data from computer logs GIS data Picture metadata interactive scenarios (3-D, GIS-based with add on reports, tables, filters, etc) that can be interrogated/explored map-based data VR models Geospatial cultural GIS-data CAD-data Spoken material Dictionaries, bibliographies, metadata etc 3D spss recode jobs Application results Classified thematic fragments, thesauri structures Scientific. Source: AVROSS WP2 survey.
Question D2: Other potential barriers to the adoption of e-Infrastructure technology
The Old Guard who still control many funding streams and research directions who do not believe in e-Infrastructure as a catalyst for scholarship Special case of all the 'usual' problems of sharing geospatial data Had to be self-sufficient on technology, software, etc., hence open source Lack of appropriate support mechanisms/services (e.g. training) Locked into old conceptions of data publication Pushback from mainstream social science publishers Lack of understanding in the discipline of the project's contributions The main problem is the university's firewall. It has sold its firewall to an outside company and we have to get it opened every time we use AG. Despite this being an engineering university there was low awareness of grid technology but this is improving Two big problems for a social scientist doing e-research: getting e-scientists interested in your work (and collaborating) Getting the respect of your discipline (e.g. economics/politics/sociology) where not much value is placed on tool development Methodological warfare Lack of standardised metadata in social science databases Ethics and governance, cost People's capacity to engage with the new technologies Communication social - computer scientists Pressure to produce flash rather than operational capabilities Lack of community coordination (it's early) Lack of technology and ICT support resources in schools (real context of use) Not being taken seriously when coming from the humanities.
Source: AVROSS WP2 survey.
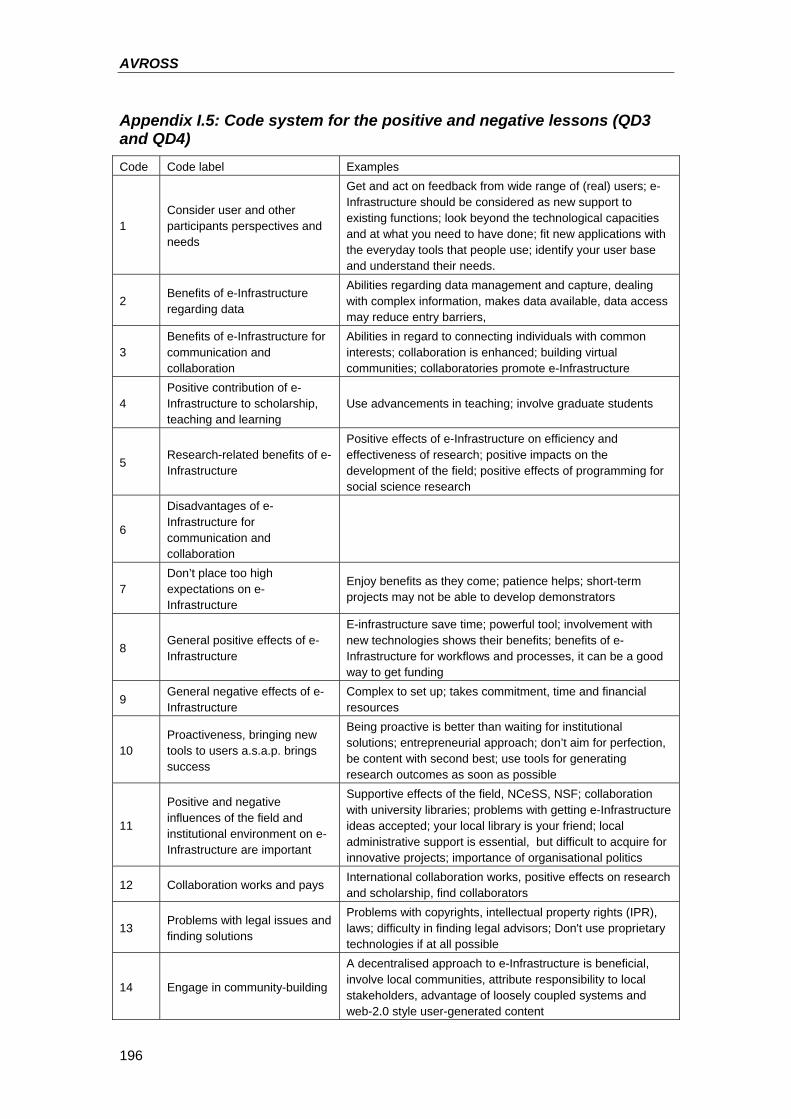
AVROSS
196
Appendix I.5: Code system for the positive and negative lessons (QD3 and QD4) Code Code label Examples
1 Consider user and other participants perspectives and needs
Get and act on feedback from wide range of (real) users; e-Infrastructure should be considered as new support to existing functions; look beyond the technological capacities and at what you need to have done; fit new applications with the everyday tools that people use; identify your user base and understand their needs.
2 Benefits of e-Infrastructure regarding data
Abilities regarding data management and capture, dealing with complex information, makes data available, data access may reduce entry barriers,
3 Benefits of e-Infrastructure for communication and collaboration
Abilities in regard to connecting individuals with common interests; collaboration is enhanced; building virtual communities; collaboratories promote e-Infrastructure
4 Positive contribution of e-Infrastructure to scholarship, teaching and learning
Use advancements in teaching; involve graduate students
5 Research-related benefits of e-Infrastructure
Positive effects of e-Infrastructure on efficiency and effectiveness of research; positive impacts on the development of the field; positive effects of programming for social science research
6
Disadvantages of e-Infrastructure for communication and collaboration
7 Don’t place too high expectations on e-Infrastructure
Enjoy benefits as they come; patience helps; short-term projects may not be able to develop demonstrators
8 General positive effects of e-Infrastructure
E-infrastructure save time; powerful tool; involvement with new technologies shows their benefits; benefits of e-Infrastructure for workflows and processes, it can be a good way to get funding
9 General negative effects of e-Infrastructure
Complex to set up; takes commitment, time and financial resources
10 Proactiveness, bringing new tools to users a.s.a.p. brings success
Being proactive is better than waiting for institutional solutions; entrepreneurial approach; don’t aim for perfection, be content with second best; use tools for generating research outcomes as soon as possible
11
Positive and negative influences of the field and institutional environment on e-Infrastructure are important
Supportive effects of the field, NCeSS, NSF; collaboration with university libraries; problems with getting e-Infrastructure ideas accepted; your local library is your friend; local administrative support is essential, but difficult to acquire for innovative projects; importance of organisational politics
12 Collaboration works and pays International collaboration works, positive effects on research and scholarship, find collaborators
13 Problems with legal issues and finding solutions
Problems with copyrights, intellectual property rights (IPR), laws; difficulty in finding legal advisors; Don't use proprietary technologies if at all possible
14 Engage in community-building
A decentralised approach to e-Infrastructure is beneficial, involve local communities, attribute responsibility to local stakeholders, advantage of loosely coupled systems and web-2.0 style user-generated content
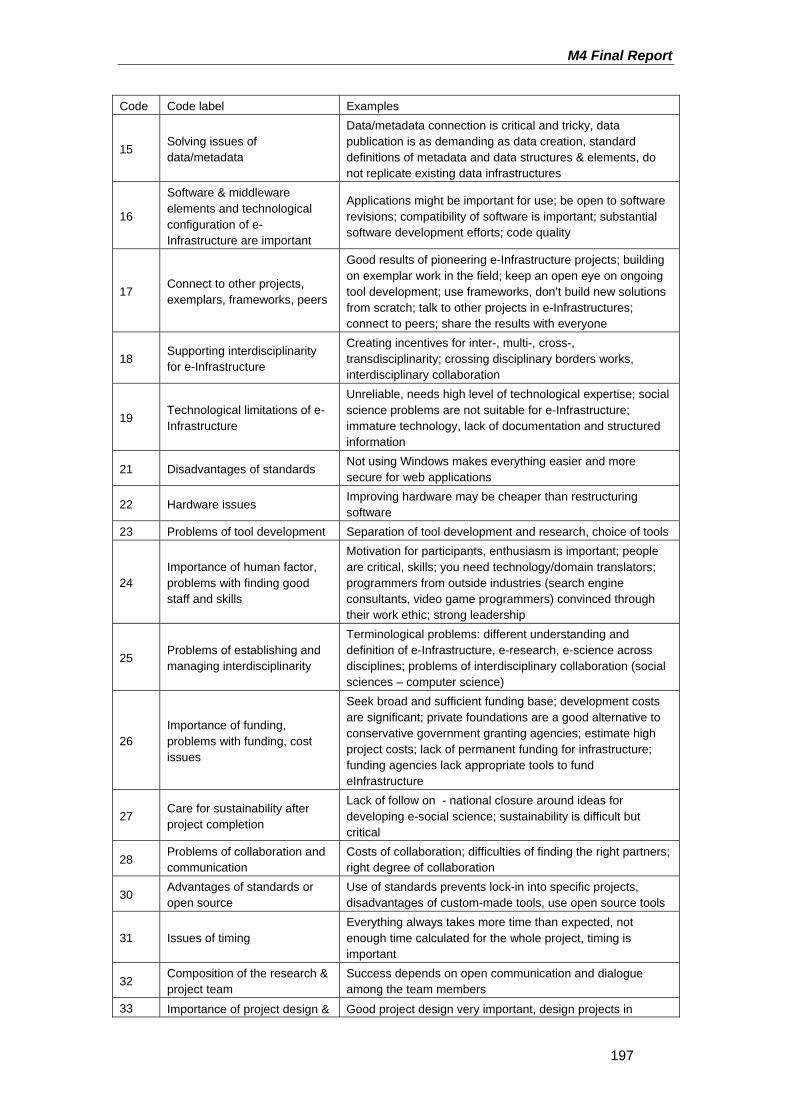
M4 Final Report
197
Code Code label Examples
15 Solving issues of data/metadata
Data/metadata connection is critical and tricky, data publication is as demanding as data creation, standard definitions of metadata and data structures & elements, do not replicate existing data infrastructures
16
Software & middleware elements and technological configuration of e-Infrastructure are important
Applications might be important for use; be open to software revisions; compatibility of software is important; substantial software development efforts; code quality
17 Connect to other projects, exemplars, frameworks, peers
Good results of pioneering e-Infrastructure projects; building on exemplar work in the field; keep an open eye on ongoing tool development; use frameworks, don’t build new solutions from scratch; talk to other projects in e-Infrastructures; connect to peers; share the results with everyone
18 Supporting interdisciplinarity for e-Infrastructure
Creating incentives for inter-, multi-, cross-, transdisciplinarity; crossing disciplinary borders works, interdisciplinary collaboration
19 Technological limitations of e-Infrastructure
Unreliable, needs high level of technological expertise; social science problems are not suitable for e-Infrastructure; immature technology, lack of documentation and structured information
21 Disadvantages of standards Not using Windows makes everything easier and more secure for web applications
22 Hardware issues Improving hardware may be cheaper than restructuring software
23 Problems of tool development Separation of tool development and research, choice of tools
24 Importance of human factor, problems with finding good staff and skills
Motivation for participants, enthusiasm is important; people are critical, skills; you need technology/domain translators; programmers from outside industries (search engine consultants, video game programmers) convinced through their work ethic; strong leadership
25 Problems of establishing and managing interdisciplinarity
Terminological problems: different understanding and definition of e-Infrastructure, e-research, e-science across disciplines; problems of interdisciplinary collaboration (social sciences – computer science)
26 Importance of funding, problems with funding, cost issues
Seek broad and sufficient funding base; development costs are significant; private foundations are a good alternative to conservative government granting agencies; estimate high project costs; lack of permanent funding for infrastructure; funding agencies lack appropriate tools to fund eInfrastructure
27 Care for sustainability after project completion
Lack of follow on - national closure around ideas for developing e-social science; sustainability is difficult but critical
28 Problems of collaboration and communication
Costs of collaboration; difficulties of finding the right partners; right degree of collaboration
30 Advantages of standards or open source
Use of standards prevents lock-in into specific projects, disadvantages of custom-made tools, use open source tools
31 Issues of timing Everything always takes more time than expected, not enough time calculated for the whole project, timing is important
32 Composition of the research & project team
Success depends on open communication and dialogue among the team members
33 Importance of project design & Good project design very important, design projects in
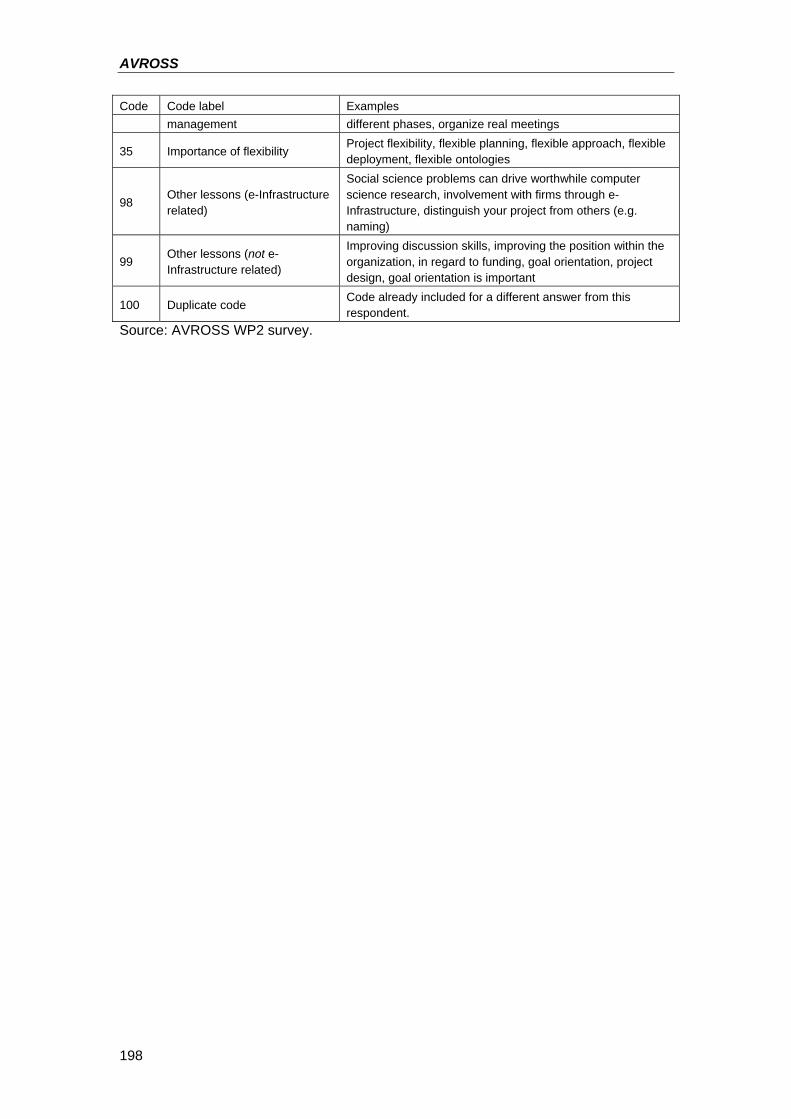
AVROSS
198
Code Code label Examples management different phases, organize real meetings
35 Importance of flexibility Project flexibility, flexible planning, flexible approach, flexible deployment, flexible ontologies
98 Other lessons (e-Infrastructure related)
Social science problems can drive worthwhile computer science research, involvement with firms through e-Infrastructure, distinguish your project from others (e.g. naming)
99 Other lessons (not e-Infrastructure related)
Improving discussion skills, improving the position within the organization, in regard to funding, goal orientation, project design, goal orientation is important
100 Duplicate code Code already included for a different answer from this respondent.
Source: AVROSS WP2 survey.
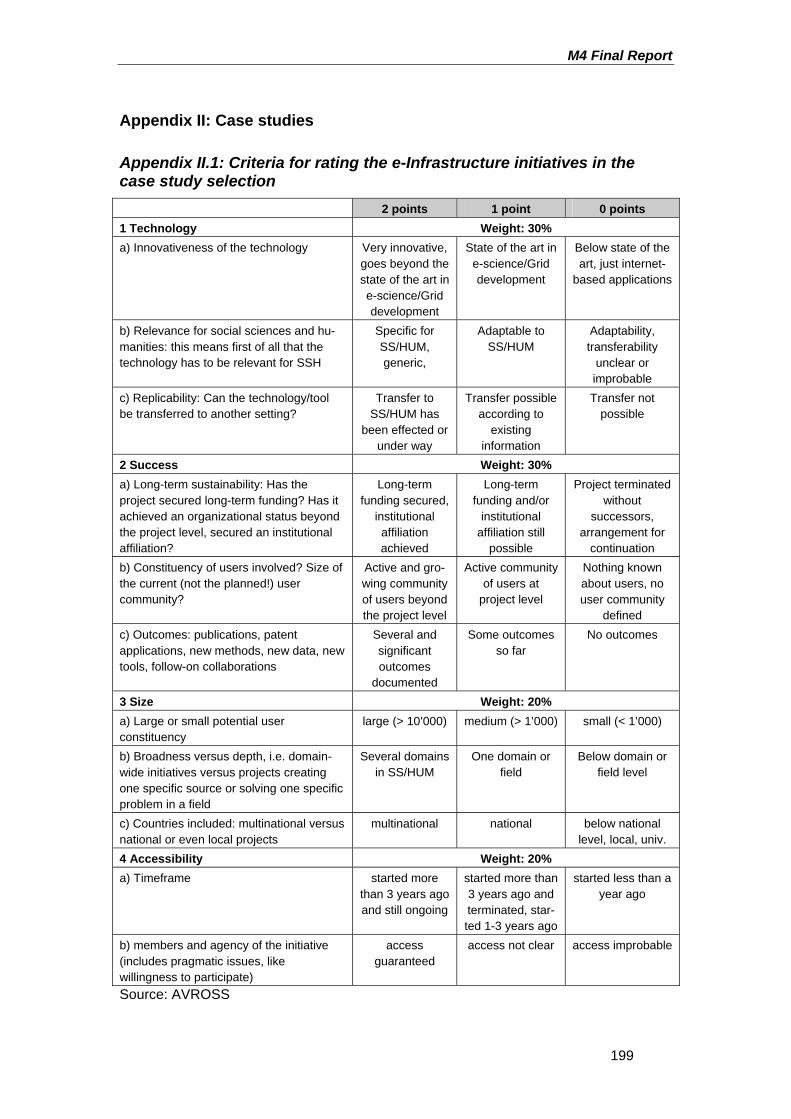
M4 Final Report
199
Appendix II: Case studies
Appendix II.1: Criteria for rating the e-Infrastructure initiatives in the case study selection 2 points 1 point 0 points 1 Technology Weight: 30% a) Innovativeness of the technology Very innovative,
goes beyond the state of the art in e-science/Grid development
State of the art in e-science/Grid development
Below state of the art, just internet-
based applications
b) Relevance for social sciences and hu-manities: this means first of all that the technology has to be relevant for SSH
Specific for SS/HUM, generic,
Adaptable to SS/HUM
Adaptability, transferability
unclear or improbable
c) Replicability: Can the technology/tool be transferred to another setting?
Transfer to SS/HUM has
been effected or under way
Transfer possible according to
existing information
Transfer not possible
2 Success Weight: 30% a) Long-term sustainability: Has the project secured long-term funding? Has it achieved an organizational status beyond the project level, secured an institutional affiliation?
Long-term funding secured,
institutional affiliation achieved
Long-term funding and/or
institutional affiliation still
possible
Project terminated without
successors, arrangement for
continuation b) Constituency of users involved? Size of the current (not the planned!) user community?
Active and gro-wing community of users beyond the project level
Active community of users at
project level
Nothing known about users, no user community
defined c) Outcomes: publications, patent applications, new methods, new data, new tools, follow-on collaborations
Several and significant outcomes
documented
Some outcomes so far
No outcomes
3 Size Weight: 20% a) Large or small potential user constituency
large (> 10’000) medium (> 1’000) small (< 1’000)
b) Broadness versus depth, i.e. domain-wide initiatives versus projects creating one specific source or solving one specific problem in a field
Several domains in SS/HUM
One domain or field
Below domain or field level
c) Countries included: multinational versus national or even local projects
multinational national below national level, local, univ.
4 Accessibility Weight: 20% a) Timeframe started more
than 3 years ago and still ongoing
started more than 3 years ago and terminated, star-ted 1-3 years ago
started less than a year ago
b) members and agency of the initiative (includes pragmatic issues, like willingness to participate)
access guaranteed
access not clear access improbable
Source: AVROSS
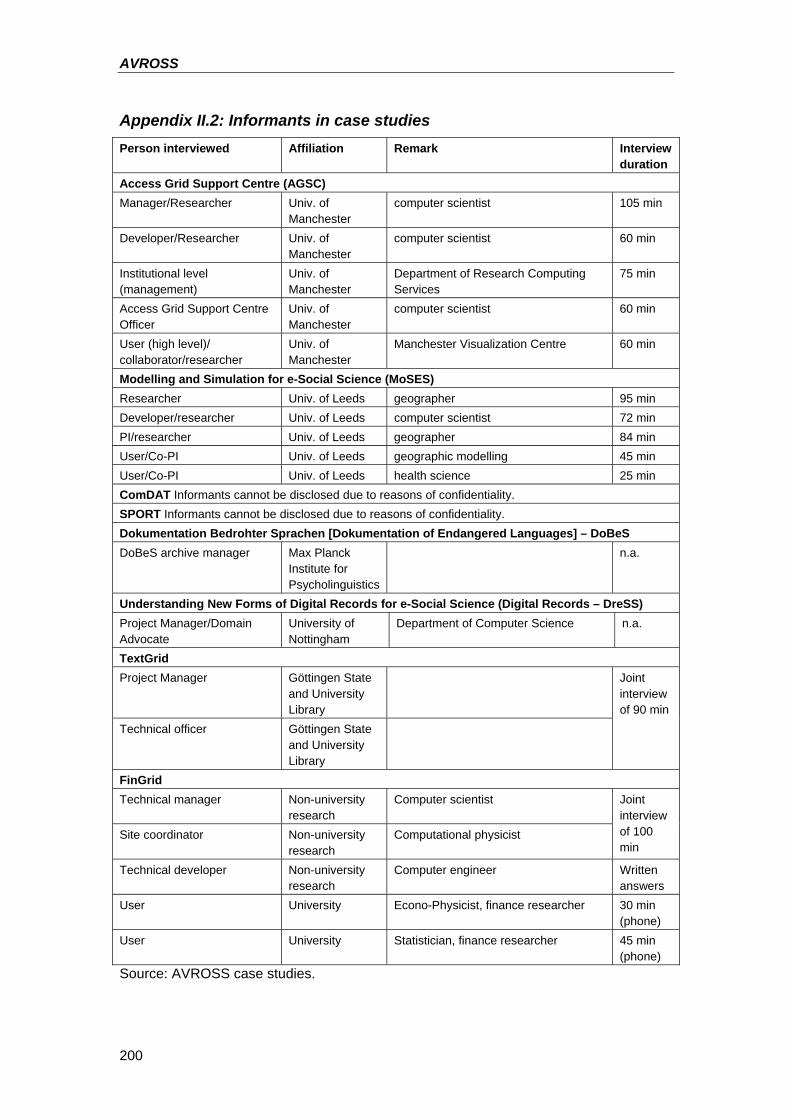
AVROSS
200
Appendix II.2: Informants in case studies Person interviewed Affiliation Remark Interview
duration Access Grid Support Centre (AGSC) Manager/Researcher Univ. of
Manchester computer scientist 105 min
Developer/Researcher Univ. of Manchester
computer scientist 60 min
Institutional level (management)
Univ. of Manchester
Department of Research Computing Services
75 min
Access Grid Support Centre Officer
Univ. of Manchester
computer scientist 60 min
User (high level)/ collaborator/researcher
Univ. of Manchester
Manchester Visualization Centre 60 min
Modelling and Simulation for e-Social Science (MoSES) Researcher Univ. of Leeds geographer 95 min Developer/researcher Univ. of Leeds computer scientist 72 min PI/researcher Univ. of Leeds geographer 84 min User/Co-PI Univ. of Leeds geographic modelling 45 min User/Co-PI Univ. of Leeds health science 25 min ComDAT Informants cannot be disclosed due to reasons of confidentiality. SPORT Informants cannot be disclosed due to reasons of confidentiality. Dokumentation Bedrohter Sprachen [Dokumentation of Endangered Languages] – DoBeS DoBeS archive manager Max Planck
Institute for Psycholinguistics
n.a.
Understanding New Forms of Digital Records for e-Social Science (Digital Records – DreSS) Project Manager/Domain Advocate
University of Nottingham
Department of Computer Science n.a.
TextGrid Project Manager Göttingen State
and University Library
Technical officer Göttingen State and University Library
Joint interview of 90 min
FinGrid Technical manager Non-university
research Computer scientist
Site coordinator Non-university research
Computational physicist
Joint interview of 100 min
Technical developer Non-university research
Computer engineer Written answers
User University Econo-Physicist, finance researcher 30 min (phone)
User University Statistician, finance researcher 45 min (phone)
Source: AVROSS case studies.
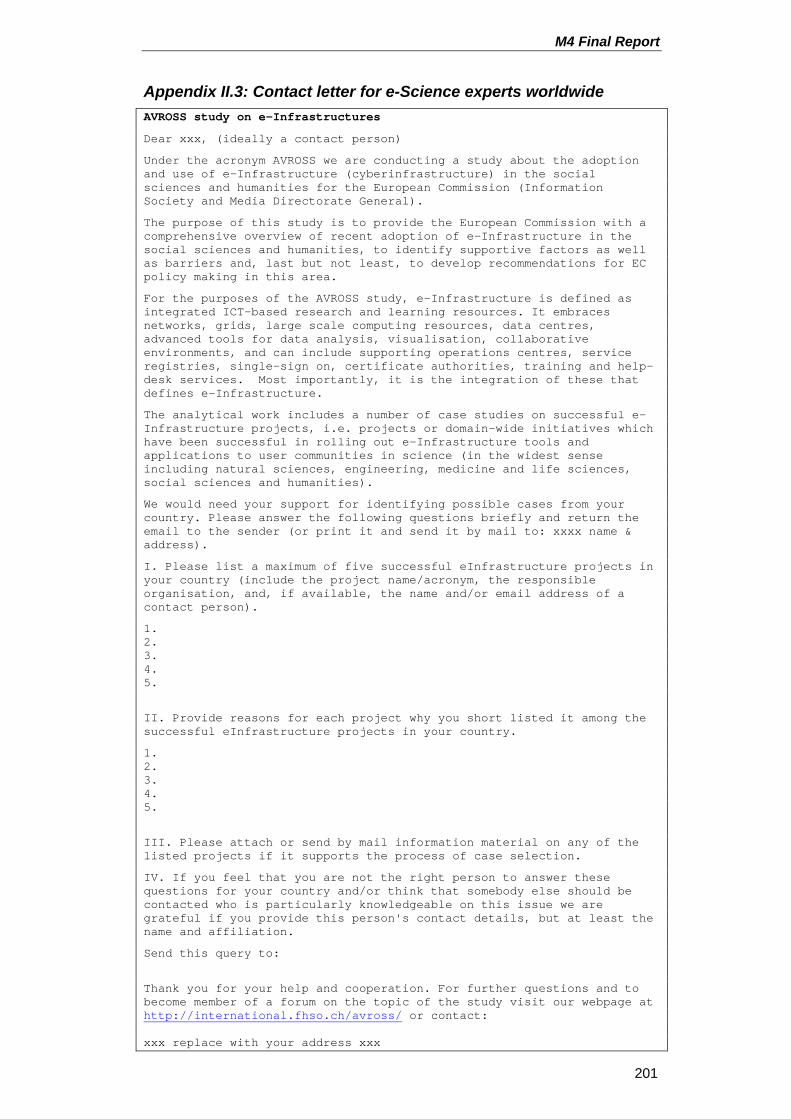
M4 Final Report
201
Appendix II.3: Contact letter for e-Science experts worldwide AVROSS study on e-Infrastructures
Dear xxx, (ideally a contact person)
Under the acronym AVROSS we are conducting a study about the adoption and use of e-Infrastructure (cyberinfrastructure) in the social sciences and humanities for the European Commission (Information Society and Media Directorate General).
The purpose of this study is to provide the European Commission with a comprehensive overview of recent adoption of e-Infrastructure in the social sciences and humanities, to identify supportive factors as well as barriers and, last but not least, to develop recommendations for EC policy making in this area.
For the purposes of the AVROSS study, e-Infrastructure is defined as integrated ICT-based research and learning resources. It embraces networks, grids, large scale computing resources, data centres, advanced tools for data analysis, visualisation, collaborative environments, and can include supporting operations centres, service registries, single-sign on, certificate authorities, training and help-desk services. Most importantly, it is the integration of these that defines e-Infrastructure.
The analytical work includes a number of case studies on successful e-Infrastructure projects, i.e. projects or domain-wide initiatives which have been successful in rolling out e-Infrastructure tools and applications to user communities in science (in the widest sense including natural sciences, engineering, medicine and life sciences, social sciences and humanities).
We would need your support for identifying possible cases from your country. Please answer the following questions briefly and return the email to the sender (or print it and send it by mail to: xxxx name & address).
I. Please list a maximum of five successful eInfrastructure projects in your country (include the project name/acronym, the responsible organisation, and, if available, the name and/or email address of a contact person).
1. 2. 3. 4. 5.
II. Provide reasons for each project why you short listed it among the successful eInfrastructure projects in your country.
1. 2. 3. 4. 5.
III. Please attach or send by mail information material on any of the listed projects if it supports the process of case selection.
IV. If you feel that you are not the right person to answer these questions for your country and/or think that somebody else should be contacted who is particularly knowledgeable on this issue we are grateful if you provide this person's contact details, but at least the name and affiliation.
Send this query to:
Thank you for your help and cooperation. For further questions and to become member of a forum on the topic of the study visit our webpage at http://international.fhso.ch/avross/ or contact: xxx replace with your address xxx

AVROSS
202
Appendix II.4: Interview Guideline
AVROSS Interview Guideline
Core Questions
1. Background and Involvement with CI/e-Infrastructure35 1.1. Please tell me about your (academic) background and/or role in the project 1.2. CI has been understood in various ways, could you describe your
understanding of the CI framework? 1.3. Please describe your involvement with CI
Probe: How did you initially learn about CI? What motivated your participation?
1.4. Background of the project: How was your project established? 2. Technology
2.1. Many technologies have been associated with CI over the years. What technologies are used and/or developed by your project? Probe: Why have you selected those and not the others? (technological maturity, standards) What prompted the decision to develop and not use existing tools?
2.2. Do you in any way support learning, training or documentation processes in your project? Probe: Do you use e-learning tools and which? Do you use the project CI in ways for learning, training or documentation (within the project)?
2.3. What is the relationship between the project and CI technology stakeholders, such as infrastructure or middleware projects (i.e. Teragrid, Globus)?
2.4. What were the technological constraints you have encountered during the project?
3. Community Structure and Mobilization 3.1. What user and/or developer communities are involved in your project?
Probe: Public research, business, governmental org.; geographical distribution?
3.2. How are members of these communities recruited and how are they organized? Probe: To what extent are these preexisting ties (i.e. past collaborations), or new links? (If new links, how were these established—e.g. through outreach efforts, training)
3.3. How do participants interact, and how do these interactions feed back to the work process? Probe: Were any of the efforts led by users? Did you encounter problems with user participation? Have these interactions been formalized: for example, as contracts or as institutionalized meetings? If applicable: Are any such interactions made public?
3.4. How do project team members learn what happens elsewhere in the project? Probe: More generally, how is collaboration organised within the project? What would you say towards a notion of learning as part of the research process?
35 CI = Cyberinfrastructure in the US, e-Infrastructure in Europe
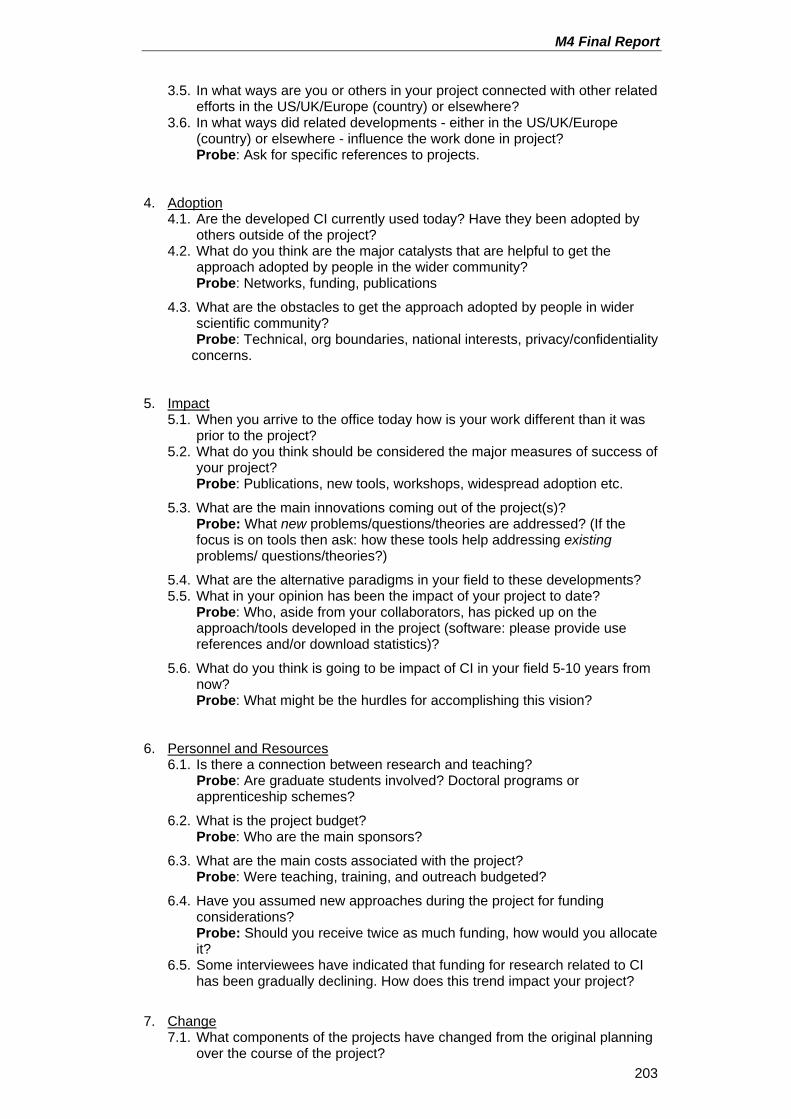
M4 Final Report
203
3.5. In what ways are you or others in your project connected with other related efforts in the US/UK/Europe (country) or elsewhere?
3.6. In what ways did related developments - either in the US/UK/Europe (country) or elsewhere - influence the work done in project? Probe: Ask for specific references to projects.
4. Adoption 4.1. Are the developed CI currently used today? Have they been adopted by
others outside of the project? 4.2. What do you think are the major catalysts that are helpful to get the
approach adopted by people in the wider community? Probe: Networks, funding, publications
4.3. What are the obstacles to get the approach adopted by people in wider scientific community? Probe: Technical, org boundaries, national interests, privacy/confidentiality
concerns.
5. Impact 5.1. When you arrive to the office today how is your work different than it was
prior to the project? 5.2. What do you think should be considered the major measures of success of
your project? Probe: Publications, new tools, workshops, widespread adoption etc.
5.3. What are the main innovations coming out of the project(s)? Probe: What new problems/questions/theories are addressed? (If the focus is on tools then ask: how these tools help addressing existing problems/ questions/theories?)
5.4. What are the alternative paradigms in your field to these developments? 5.5. What in your opinion has been the impact of your project to date?
Probe: Who, aside from your collaborators, has picked up on the approach/tools developed in the project (software: please provide use references and/or download statistics)?
5.6. What do you think is going to be impact of CI in your field 5-10 years from now? Probe: What might be the hurdles for accomplishing this vision?
6. Personnel and Resources 6.1. Is there a connection between research and teaching?
Probe: Are graduate students involved? Doctoral programs or apprenticeship schemes?
6.2. What is the project budget? Probe: Who are the main sponsors?
6.3. What are the main costs associated with the project? Probe: Were teaching, training, and outreach budgeted?
6.4. Have you assumed new approaches during the project for funding considerations? Probe: Should you receive twice as much funding, how would you allocate it?
6.5. Some interviewees have indicated that funding for research related to CI has been gradually declining. How does this trend impact your project?
7. Change 7.1. What components of the projects have changed from the original planning
over the course of the project?
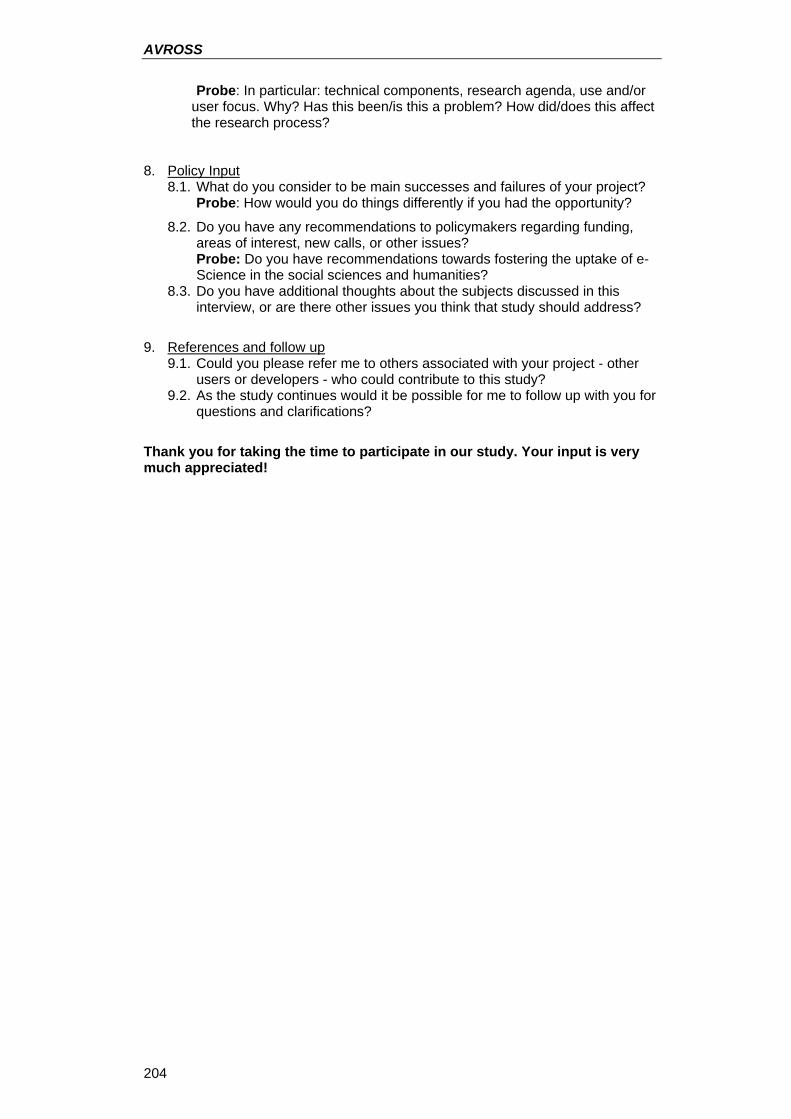
AVROSS
204
Probe: In particular: technical components, research agenda, use and/or user focus. Why? Has this been/is this a problem? How did/does this affect the research process?
8. Policy Input 8.1. What do you consider to be main successes and failures of your project?
Probe: How would you do things differently if you had the opportunity?
8.2. Do you have any recommendations to policymakers regarding funding, areas of interest, new calls, or other issues? Probe: Do you have recommendations towards fostering the uptake of e-Science in the social sciences and humanities?
8.3. Do you have additional thoughts about the subjects discussed in this interview, or are there other issues you think that study should address?
9. References and follow up 9.1. Could you please refer me to others associated with your project - other
users or developers - who could contribute to this study? 9.2. As the study continues would it be possible for me to follow up with you for
questions and clarifications?
Thank you for taking the time to participate in our study. Your input is very much appreciated!
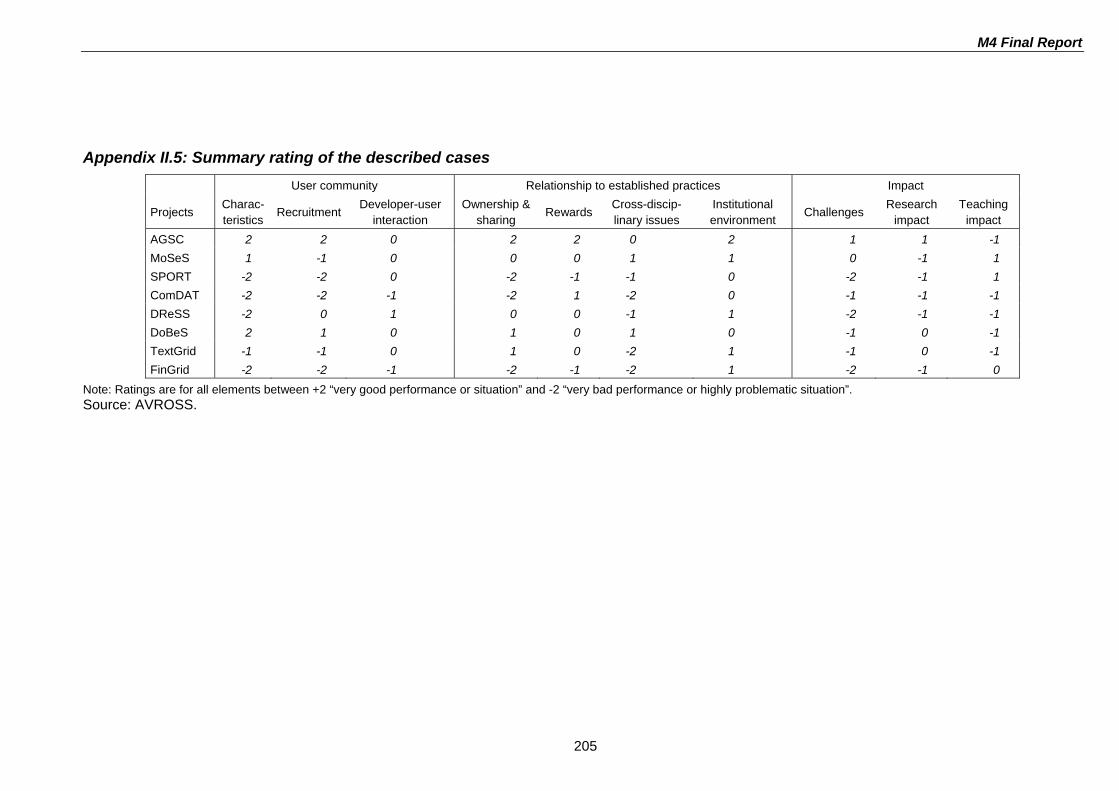
M4 Final Report
205
Appendix II.5: Summary rating of the described cases User community Relationship to established practices Impact
Projects Charac-teristics Recruitment
Developer-user interaction
Ownership & sharing Rewards
Cross-discip-linary issues
Institutional environment Challenges
Research impact
Teaching impact
AGSC 2 2 0 2 2 0 2 1 1 -1 MoSeS 1 -1 0 0 0 1 1 0 -1 1 SPORT -2 -2 0 -2 -1 -1 0 -2 -1 1 ComDAT -2 -2 -1 -2 1 -2 0 -1 -1 -1 DReSS -2 0 1 0 0 -1 1 -2 -1 -1 DoBeS 2 1 0 1 0 1 0 -1 0 -1 TextGrid -1 -1 0 1 0 -2 1 -1 0 -1 FinGrid -2 -2 -1 -2 -1 -2 1 -2 -1 0
Note: Ratings are for all elements between +2 “very good performance or situation” and -2 “very bad performance or highly problematic situation”. Source: AVROSS.