Embed Size (px)
DESCRIPTION
Accelerating Growth and Development: The Contribution of an Integrated Manufacturing Strategy:. ACCOMPANYING DATA. Slow growth since 1994. Source: SARB QB. Increased integration into the global economy: General trend of lowering of tariffs. - PowerPoint PPT Presentation
Citation preview

Accelerating Growth and Development:
The Contribution of an Integrated
Manufacturing Strategy:
ACCOMPANYING DATA


0
100,000
200,000
300,000
400,000
500,000
600,000
700,000
1980 1981 1982 1983 1984 1985 1986 1987 1988 1989 1990 1991 1992 1993 1994 1995 1996 1997 1998 1999 2000
Con
stan
t 199
5 R
mill
ions
Slow growth since 1994
Source: SARB QB
Increased integration into the global economy:General trend of lowering of tariffs
Average import tariff 1994 to 2000
0
5
10
15
94 95 96 97 98 99 2000
%
Source: IDC

Increased export orientation: significant export growth
60
80
100
120
140
160
180
200
19
90
=1
00
91 92 93 94 95 96 97 98 99 00 01
Total Excluding Metals & Minerals
Metals & Minerals
EXPORTS : Adjusted for nominaleffective exchange rate of the Rand

Increased share of manufacturing in export basket
Exports by stage of manufacturing, as % of total exports

Source: IDC

Exports Sectors, Jan - Sep 2001, R'000
0
500000
1000000
1500000
2000000
2500000
3000000
3500000
Jan2001 Feb2001 Mar2001 Apr2001 May2001 Jun2001 Jul2001 Aug2001 Sep2001
R'00
0
Agro-Processing Clothing Automotives Furniture

Reduced vulnerability through diversification of export markets

Despite export growth, declining share in world trade
Source: WTO

0
20
40
60
80
100
120
1981 1982 1983 1984 1985 1986 1987 1988 1989 1990 1991 1992 1993 1994 1995 1996 1997 1998 1999 2000
Inde
x 19
95=1
00
Falling Formal Sector Employment
Source: SARB QB

Increasing importance of informal sector
Formal (non-agricultural) and informal employment, '000
-
1,000
2,000
3,000
4,000
5,000
6,000
7,000
8,000
February 2000 September 2000 February 2001
Formal sector (excluding agriculture) Informal Sector
Source: Statistics South Africa
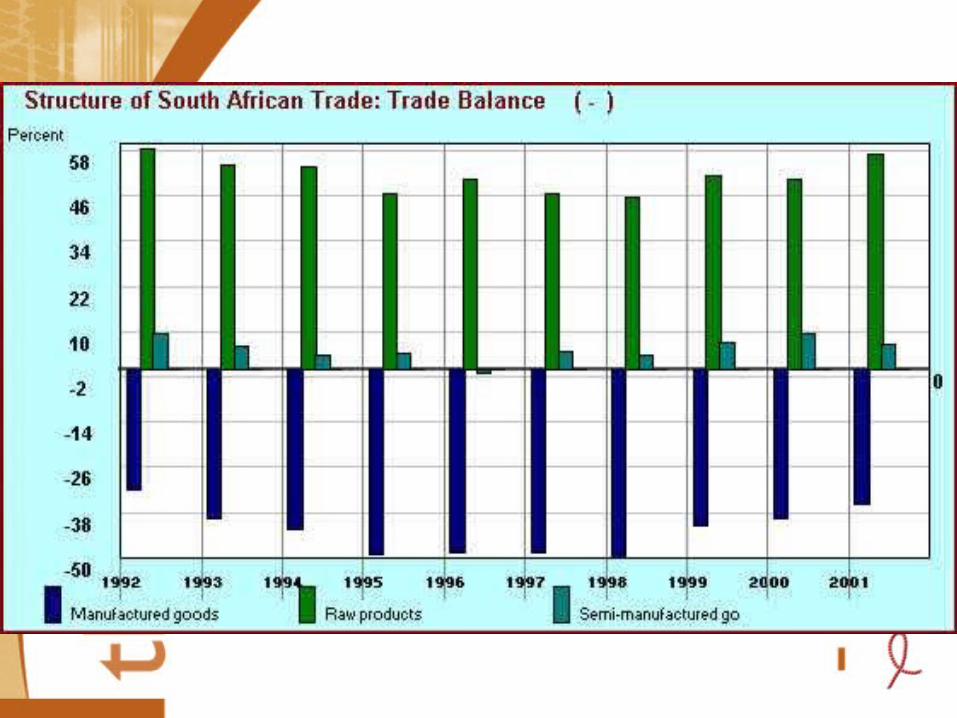
Mismatch of skills supply and demand
-150
100
350
600
850
1100
1350
1600
1850
2100
2350
%
14 -30 50
350
2050
TOTAL PRIMARY EDUCATION
SECONDARY EDUCATIONMATRIC
TERTIARY EDUCATION
SKILLS SHORTAGE : EMPLOYMENT GROWTH(1970-1995) : BY LEVEL OF EDUCATION
Source: Econometrix

Insufficient productive investment
0
10,000
20,000
30,000
40,000
50,000
60,000
70,000
80,000
1993 1994 1995 1996 1997 1998 1999 2000
General Government Public CorporationsPrivate Business Enterprises
Gross Fixed Capital FormationAt constant 1995 prices

Insufficient productive investment:
Portfolio inflows dominate long term capital inflows
Source: SARB QB
-40,000
-20,000
0
20,000
40,000
60,000
80,000
100,000
1987 1988 1989 1990 1991 1992 1993 1994 1995 1996 1997 1998 1999 2000
Direct Investment Portfolio Investment Other Investment
Foreign Capital Inflows Annual Figures

Insufficient Investment in R&D
R&D Intensity
00.5
11.5
22.5
3
Australia South Africa Malaysia Korea
Inte
nsity
Source: DACST

Source: World Bank
0
10
20
30
40
50
60
% participation in SMME sector
African Asian Coloured White
Sample from Greater Johannesburg Metro
Small enterprise development still racially unequal

0%
5%
10%
15%
20%
25%
30%
35%
40%
45%
50%
African:42.9%
Coloured:30.3%
Indian:22.5%
White:10.1%
Total:37.0%
Female Male
Percentage Unemployment by Race and Gender
Source: Stats SA Labour Force Survey Feb 2001
Continued racial inequalities in labour market
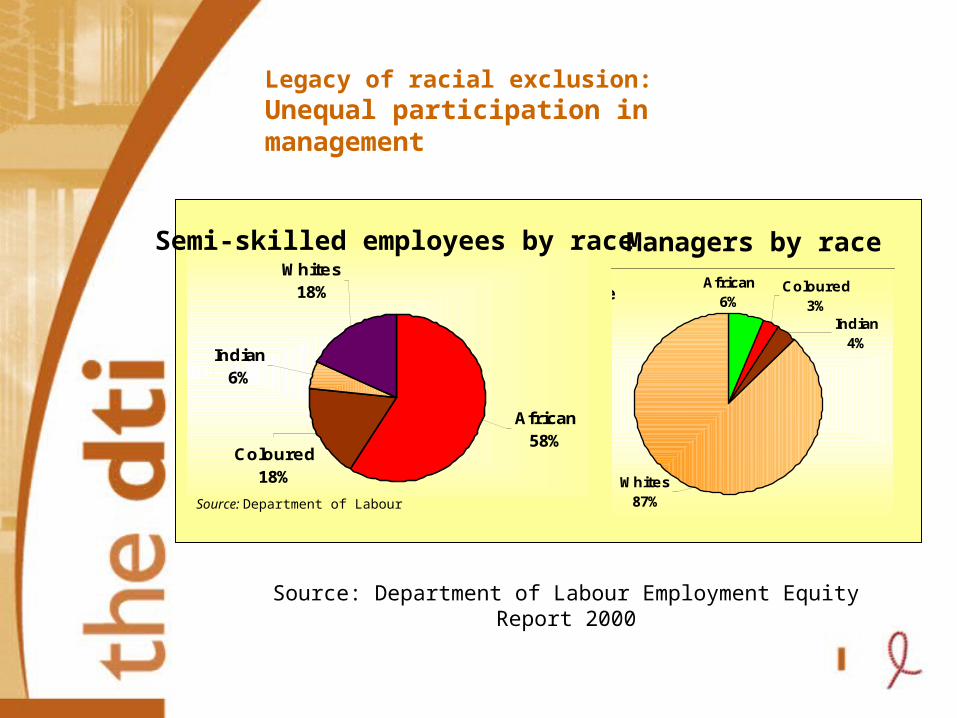
Legacy of racial exclusion:Unequal participation in management
Indian6%
Whites18%
Coloured18%
African58%
Semi-skilled employees by race Managers by race
Top Management Profile by Race Coloured3%
African6%
Indian4%
Whites87%Source: Department of Labour
Source: Department of Labour Employment Equity Report 2000

Insufficient improvement in quality of life
GDP Per Capita
12,000
12,500
13,000
13,500
14,000
14,500
15,000
15,500
16,000
16,500
17,000
1980 1982 1984 1986 1988 1990 1992 1994 1996 1998 2000
Con
stan
t 199
5 R
mill
ions

Percentage of Households Living In Poverty, 1996
0%
10%
20%
30%
40%
50%
60%
Large regional disparities & high absolute poverty
Source: Statistics South Africa

Logistics costs: internationally uncompetitive
Total Waterfront Charges
0
200
400
600
800
1000
1200
1400
1600R
an
ds p
er
TE
U
Terminal Ancillary Port Authority
Source: Portnet, International Benchmarking - Waterfront 1995

Underdeveloped telecommunications infrastructure
Telephone mainlines (per 1,000 people), 1998
- 100.00 200.00 300.00 400.00 500.00 600.00
Egypt, Arab Rep.
Brazil
South Africa
Malaysia
Chile
Poland
Turkey
Czech Republic
Korea, Rep.
Australia
Source: World Development Indicators

Personal computers (per 1,000 people)
- 50 100 150 200 250 300 350 400 450
Egypt, Arab Rep.
Turkey
Brazil
Chile
Poland
South Africa
Malaysia
Czech Republic
Korea, Rep.
Australia
Investment in PC’s Slackening SA falling behind due to inequalities

Insufficient Science and Technology Skills
Tertiary Science Enrolment
0
10
20
30
Australia SouthAfrica
Malaysia Korea
Pe
rce
nta
ge
Source: DACST